Brunswick, NC Map & Demographics
Brunswick Map
Brunswick Overview
$8,641
PER CAPITA INCOME
$16,260
AVG FAMILY INCOME
$16,643
AVG HOUSEHOLD INCOME
26.9%
WAGE / INCOME GAP [ % ]
73.1¢/ $1
WAGE / INCOME GAP [ $ ]
0.42
INEQUALITY / GINI INDEX
1,233
TOTAL POPULATION
884
MALE POPULATION
349
FEMALE POPULATION
253.30
MALES / 100 FEMALES
39.48
FEMALES / 100 MALES
33.0
MEDIAN AGE
2.6
AVG FAMILY SIZE
2.2
AVG HOUSEHOLD SIZE
230
LABOR FORCE [ PEOPLE ]
21.8%
PERCENT IN LABOR FORCE
6.1%
UNEMPLOYMENT RATE
Brunswick Zip Codes
Brunswick Area Codes
Income in Brunswick
Income Overview in Brunswick
Per Capita Income in Brunswick is $8,641, while median incomes of families and households are $16,260 and $16,643 respectively.
| Characteristic | Number | Measure |
| Per Capita Income | 1,233 | $8,641 |
| Median Family Income | 182 | $16,260 |
| Mean Family Income | 182 | $24,148 |
| Median Household Income | 249 | $16,643 |
| Mean Household Income | 249 | $26,341 |
| Income Deficit | 182 | $0 |
| Wage / Income Gap (%) | 1,233 | 26.90% |
| Wage / Income Gap ($) | 1,233 | 73.10¢ per $1 |
| Gini / Inequality Index | 1,233 | 0.42 |
Earnings by Sex in Brunswick
Average Earnings in Brunswick are $16,198, $12,083 for men and $16,529 for women, a difference of 26.9%.
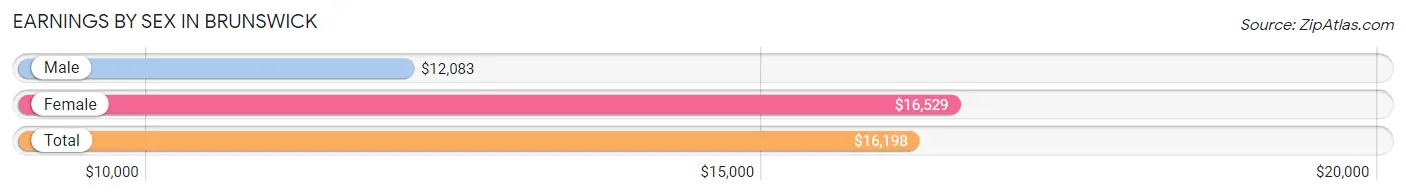
| Sex | Number | Average Earnings |
| Male | 290 (61.3%) | $12,083 |
| Female | 183 (38.7%) | $16,529 |
| Total | 473 (100.0%) | $16,198 |
Earnings by Sex by Income Bracket in Brunswick
The most common earnings brackets in Brunswick are $2,499 or less for men (64 | 22.1%) and $15,000 to $17,499 for women (130 | 71.0%).
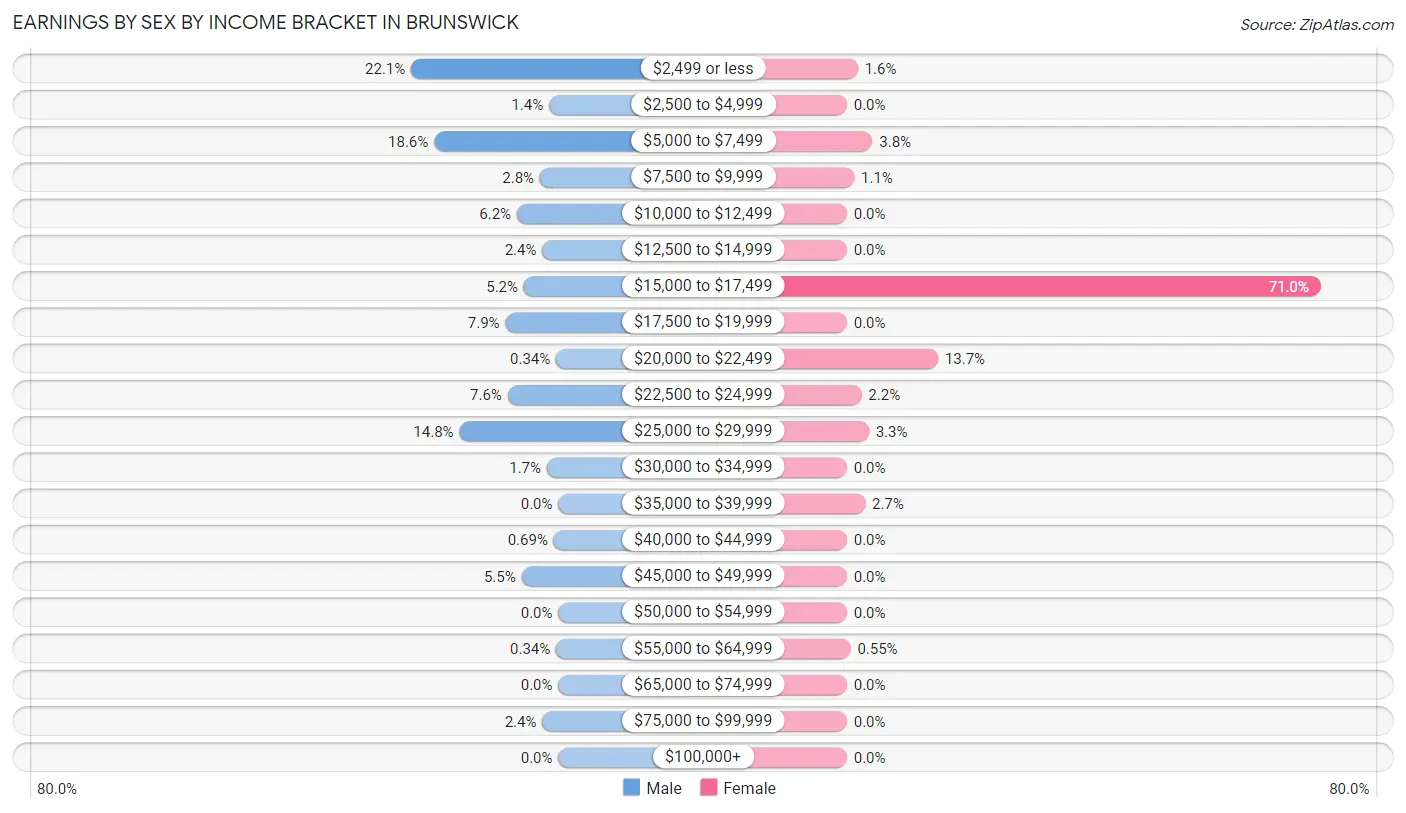
| Income | Male | Female |
| $2,499 or less | 64 (22.1%) | 3 (1.6%) |
| $2,500 to $4,999 | 4 (1.4%) | 0 (0.0%) |
| $5,000 to $7,499 | 54 (18.6%) | 7 (3.8%) |
| $7,500 to $9,999 | 8 (2.8%) | 2 (1.1%) |
| $10,000 to $12,499 | 18 (6.2%) | 0 (0.0%) |
| $12,500 to $14,999 | 7 (2.4%) | 0 (0.0%) |
| $15,000 to $17,499 | 15 (5.2%) | 130 (71.0%) |
| $17,500 to $19,999 | 23 (7.9%) | 0 (0.0%) |
| $20,000 to $22,499 | 1 (0.3%) | 25 (13.7%) |
| $22,500 to $24,999 | 22 (7.6%) | 4 (2.2%) |
| $25,000 to $29,999 | 43 (14.8%) | 6 (3.3%) |
| $30,000 to $34,999 | 5 (1.7%) | 0 (0.0%) |
| $35,000 to $39,999 | 0 (0.0%) | 5 (2.7%) |
| $40,000 to $44,999 | 2 (0.7%) | 0 (0.0%) |
| $45,000 to $49,999 | 16 (5.5%) | 0 (0.0%) |
| $50,000 to $54,999 | 0 (0.0%) | 0 (0.0%) |
| $55,000 to $64,999 | 1 (0.3%) | 1 (0.5%) |
| $65,000 to $74,999 | 0 (0.0%) | 0 (0.0%) |
| $75,000 to $99,999 | 7 (2.4%) | 0 (0.0%) |
| $100,000+ | 0 (0.0%) | 0 (0.0%) |
| Total | 290 (100.0%) | 183 (100.0%) |
Earnings by Sex by Educational Attainment in Brunswick
Average earnings in Brunswick are $11,319 for men and $16,520 for women, a difference of 31.5%. Men with an educational attainment of high school diploma enjoy the highest average annual earnings of $9,107, while those with high school diploma education earn the least with $9,107. Women with an educational attainment of college or associate's degree earn the most with the average annual earnings of $24,063, while those with high school diploma education have the smallest earnings of $16,208.
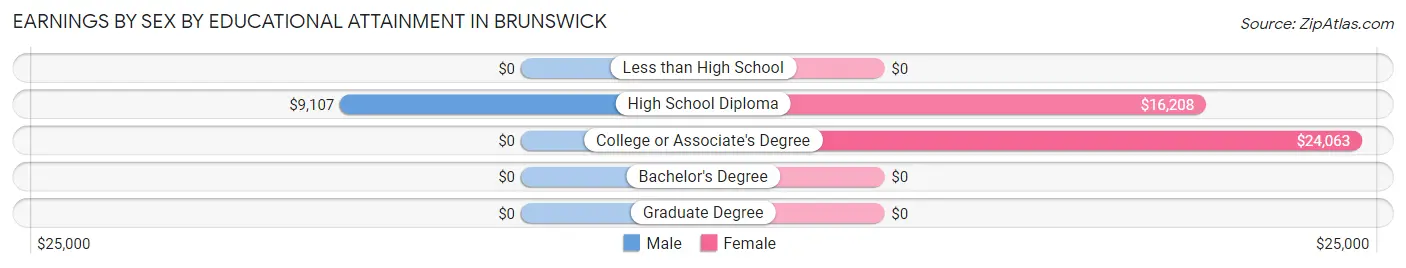
| Educational Attainment | Male Income | Female Income |
| Less than High School | - | - |
| High School Diploma | $9,107 | $16,208 |
| College or Associate's Degree | - | - |
| Bachelor's Degree | - | - |
| Graduate Degree | - | - |
| Total | $11,319 | $16,520 |
Family Income in Brunswick
Family Income Brackets in Brunswick
According to the Brunswick family income data, there are 126 families falling into the $15,000 to $24,999 income range, which is the most common income bracket and makes up 69.2% of all families.
| Income Bracket | # Families | % Families |
| Less than $10,000 | 24 | 13.2% |
| $10,000 to $14,999 | 5 | 2.7% |
| $15,000 to $24,999 | 126 | 69.2% |
| $25,000 to $34,999 | 1 | 0.5% |
| $35,000 to $49,999 | 9 | 4.9% |
| $50,000 to $74,999 | 10 | 5.5% |
| $75,000 to $99,999 | 0 | 0.0% |
| $100,000 to $149,999 | 7 | 3.8% |
| $150,000 to $199,999 | 0 | 0.0% |
| $200,000+ | 0 | 0.0% |
Family Income by Famaliy Size in Brunswick
2-person families (130 | 71.4%) account for the highest median family income in Brunswick with $16,346 per family, while 2-person families (130 | 71.4%) have the highest median income of $8,173 per family member.
| Income Bracket | # Families | Median Income |
| 2-Person Families | 130 (71.4%) | $16,346 |
| 3-Person Families | 27 (14.8%) | $2,499 |
| 4-Person Families | 9 (5.0%) | $0 |
| 5-Person Families | 15 (8.2%) | $0 |
| 6-Person Families | 0 (0.0%) | $0 |
| 7+ Person Families | 1 (0.5%) | $0 |
| Total | 182 (100.0%) | $16,260 |
Family Income by Number of Earners in Brunswick
| Number of Earners | # Families | Median Income |
| No Earners | 32 (17.6%) | $2,499 |
| 1 Earner | 129 (70.9%) | $16,250 |
| 2 Earners | 12 (6.6%) | $71,250 |
| 3+ Earners | 9 (5.0%) | $0 |
| Total | 182 (100.0%) | $16,260 |
Household Income in Brunswick
Household Income Brackets in Brunswick
With 132 households falling in the category, the $15,000 to $24,999 income range is the most frequent in Brunswick, accounting for 53.0% of all households.
| Income Bracket | # Households | % Households |
| Less than $10,000 | 32 | 12.9% |
| $10,000 to $14,999 | 11 | 4.4% |
| $15,000 to $24,999 | 132 | 53.0% |
| $25,000 to $34,999 | 18 | 7.2% |
| $35,000 to $49,999 | 31 | 12.4% |
| $50,000 to $74,999 | 17 | 6.8% |
| $75,000 to $99,999 | 0 | 0.0% |
| $100,000 to $149,999 | 8 | 3.2% |
| $150,000 to $199,999 | 0 | 0.0% |
| $200,000+ | 0 | 0.0% |
Household Income by Householder Age in Brunswick
The median household income in Brunswick is $16,643, with the highest median household income of $40,556 found in the 65+ years age bracket for the primary householder. A total of 46 households (18.5%) fall into this category. Meanwhile, the 15 to 24 years age bracket for the primary householder has the lowest median household income of $0, with 2 households (0.8%) in this group.
| Income Bracket | # Households | Median Income |
| 15 to 24 Years | 2 (0.8%) | $0 |
| 25 to 44 Years | 157 (63.0%) | $16,047 |
| 45 to 64 Years | 44 (17.7%) | $38,500 |
| 65+ Years | 46 (18.5%) | $40,556 |
| Total | 249 (100.0%) | $16,643 |
Poverty in Brunswick
Income Below Poverty by Sex and Age in Brunswick
With 63.9% poverty level for males and 64.5% for females among the residents of Brunswick, 6 to 11 year old males and 5 year old females are the most vulnerable to poverty, with 89 males (100.0%) and 11 females (100.0%) in their respective age groups living below the poverty level.
| Age Bracket | Male | Female |
| Under 5 Years | 0 (0.0%) | 17 (54.8%) |
| 5 Years | 0 (0.0%) | 11 (100.0%) |
| 6 to 11 Years | 89 (100.0%) | 16 (94.1%) |
| 12 to 14 Years | 8 (100.0%) | 9 (90.0%) |
| 15 Years | 0 (0.0%) | 0 (0.0%) |
| 16 and 17 Years | 9 (69.2%) | 0 (0.0%) |
| 18 to 24 Years | 0 (0.0%) | 5 (29.4%) |
| 25 to 34 Years | 15 (93.8%) | 141 (95.3%) |
| 35 to 44 Years | 0 (0.0%) | 11 (30.6%) |
| 45 to 54 Years | 2 (15.4%) | 0 (0.0%) |
| 55 to 64 Years | 2 (10.5%) | 6 (42.9%) |
| 65 to 74 Years | 0 (0.0%) | 2 (28.6%) |
| 75 Years and over | 4 (15.4%) | 7 (19.4%) |
| Total | 129 (63.9%) | 225 (64.5%) |
Income Above Poverty by Sex and Age in Brunswick
According to the poverty statistics in Brunswick, males aged under 5 years and females aged 45 to 54 years are the age groups that are most secure financially, with 100.0% of males and 100.0% of females in these age groups living above the poverty line.
| Age Bracket | Male | Female |
| Under 5 Years | 10 (100.0%) | 14 (45.2%) |
| 5 Years | 0 (0.0%) | 0 (0.0%) |
| 6 to 11 Years | 0 (0.0%) | 1 (5.9%) |
| 12 to 14 Years | 0 (0.0%) | 1 (10.0%) |
| 15 Years | 0 (0.0%) | 0 (0.0%) |
| 16 and 17 Years | 4 (30.8%) | 0 (0.0%) |
| 18 to 24 Years | 6 (100.0%) | 12 (70.6%) |
| 25 to 34 Years | 1 (6.2%) | 7 (4.7%) |
| 35 to 44 Years | 0 (0.0%) | 25 (69.4%) |
| 45 to 54 Years | 11 (84.6%) | 22 (100.0%) |
| 55 to 64 Years | 17 (89.5%) | 8 (57.1%) |
| 65 to 74 Years | 2 (100.0%) | 5 (71.4%) |
| 75 Years and over | 22 (84.6%) | 29 (80.6%) |
| Total | 73 (36.1%) | 124 (35.5%) |
Income Below Poverty Among Married-Couple Families in Brunswick
The poverty statistics for married-couple families in Brunswick show that 12.5% or 2 of the total 16 families live below the poverty line. Families with no children have the highest poverty rate of 22.2%, comprising of 2 families. On the other hand, families with 1 or 2 children have the lowest poverty rate of 0.0%, which includes 0 families.
| Children | Above Poverty | Below Poverty |
| No Children | 7 (77.8%) | 2 (22.2%) |
| 1 or 2 Children | 6 (100.0%) | 0 (0.0%) |
| 3 or 4 Children | 1 (100.0%) | 0 (0.0%) |
| 5 or more Children | 0 (0.0%) | 0 (0.0%) |
| Total | 14 (87.5%) | 2 (12.5%) |
Income Below Poverty Among Single-Parent Households in Brunswick
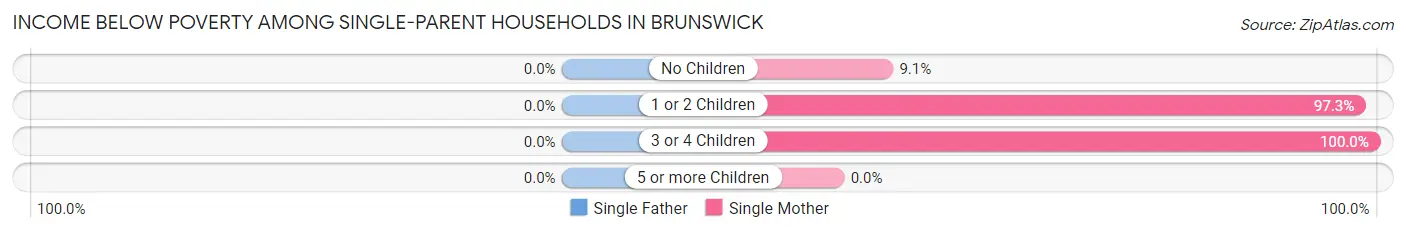
| Children | Single Father | Single Mother |
| No Children | 0 (0.0%) | 1 (9.1%) |
| 1 or 2 Children | 0 (0.0%) | 144 (97.3%) |
| 3 or 4 Children | 0 (0.0%) | 6 (100.0%) |
| 5 or more Children | 0 (0.0%) | 0 (0.0%) |
| Total | 0 (0.0%) | 151 (91.5%) |
Income Below Poverty Among Married-Couple vs Single-Parent Households in Brunswick
The poverty data for Brunswick shows that 2 of the married-couple family households (12.5%) and 151 of the single-parent households (91.0%) are living below the poverty level. Within the married-couple family households, those with no children have the highest poverty rate, with 2 households (22.2%) falling below the poverty line. Among the single-parent households, those with 3 or 4 children have the highest poverty rate, with 6 household (100.0%) living below poverty.
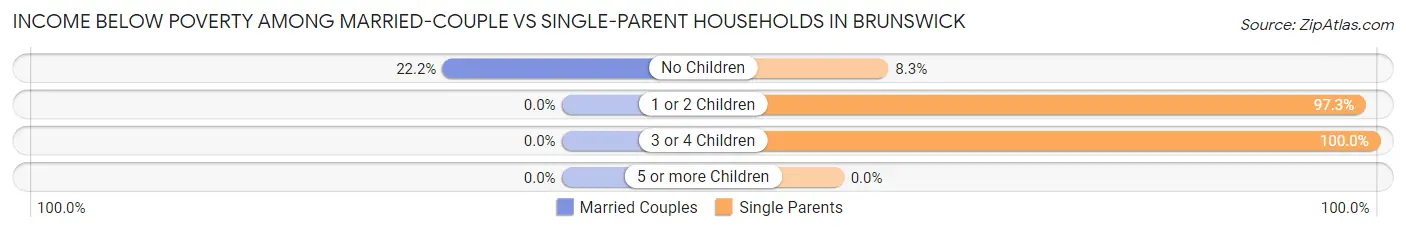
| Children | Married-Couple Families | Single-Parent Households |
| No Children | 2 (22.2%) | 1 (8.3%) |
| 1 or 2 Children | 0 (0.0%) | 144 (97.3%) |
| 3 or 4 Children | 0 (0.0%) | 6 (100.0%) |
| 5 or more Children | 0 (0.0%) | 0 (0.0%) |
| Total | 2 (12.5%) | 151 (91.0%) |
Race in Brunswick
The most populous races in Brunswick are Black / African American (859 | 69.7%), White / Caucasian (262 | 21.2%), and Two or more Races (46 | 3.7%).
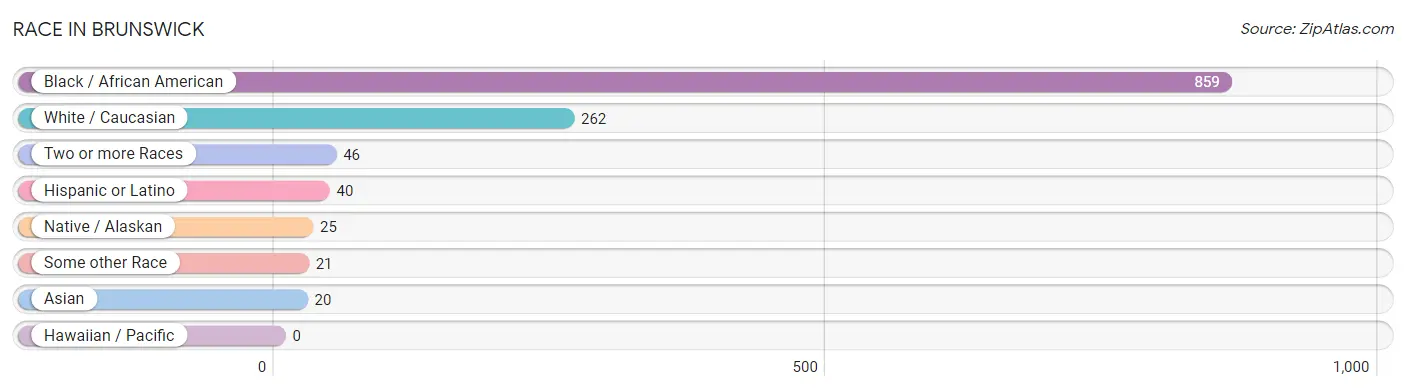
| Race | # Population | % Population |
| Asian | 20 | 1.6% |
| Black / African American | 859 | 69.7% |
| Hawaiian / Pacific | 0 | 0.0% |
| Hispanic or Latino | 40 | 3.2% |
| Native / Alaskan | 25 | 2.0% |
| White / Caucasian | 262 | 21.2% |
| Two or more Races | 46 | 3.7% |
| Some other Race | 21 | 1.7% |
| Total | 1,233 | 100.0% |
Ancestry in Brunswick
The most populous ancestries reported in Brunswick are American (123 | 10.0%), Mexican (40 | 3.2%), Subsaharan African (40 | 3.2%), Irish (34 | 2.8%), and African (27 | 2.2%), together accounting for 21.4% of all Brunswick residents.
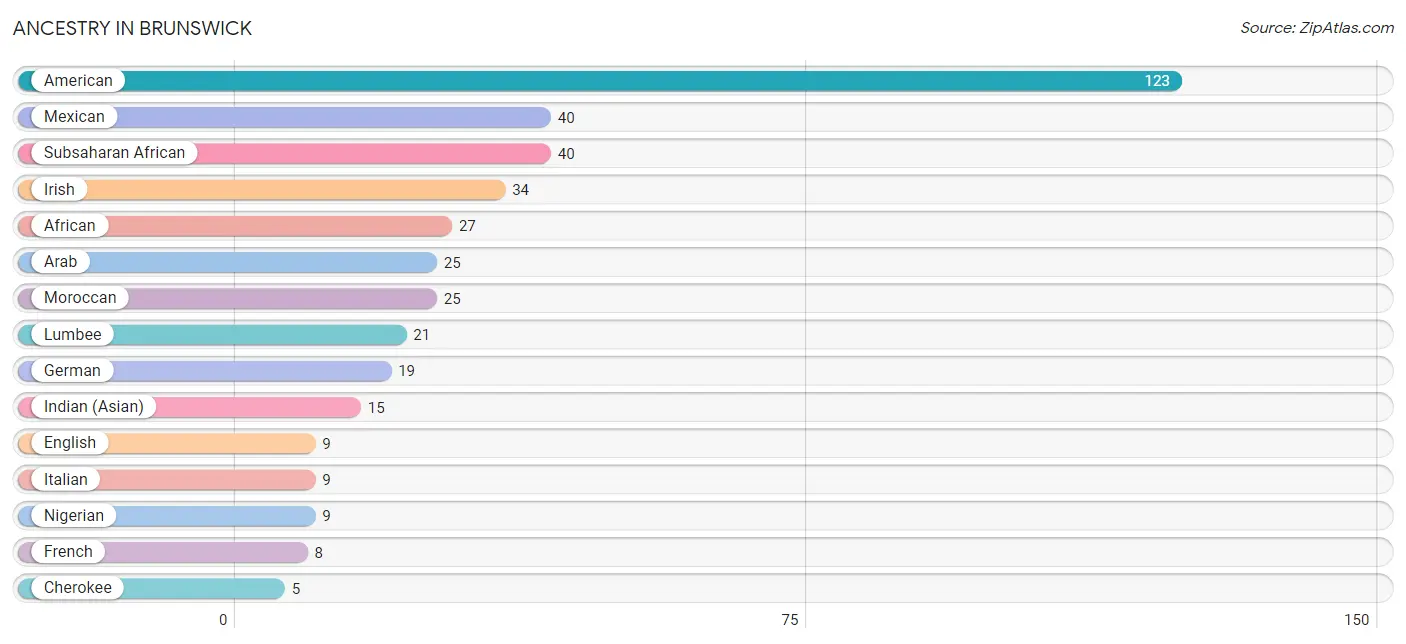
| Ancestry | # Population | % Population |
| African | 27 | 2.2% |
| American | 123 | 10.0% |
| Arab | 25 | 2.0% |
| Cherokee | 5 | 0.4% |
| English | 9 | 0.7% |
| European | 1 | 0.1% |
| French | 8 | 0.6% |
| German | 19 | 1.5% |
| Indian (Asian) | 15 | 1.2% |
| Irish | 34 | 2.8% |
| Italian | 9 | 0.7% |
| Korean | 1 | 0.1% |
| Lumbee | 21 | 1.7% |
| Mexican | 40 | 3.2% |
| Moroccan | 25 | 2.0% |
| Nigerian | 9 | 0.7% |
| Scandinavian | 5 | 0.4% |
| Scotch-Irish | 1 | 0.1% |
| Subsaharan African | 40 | 3.2% | View All 19 Rows |
Immigrants in Brunswick
The most numerous immigrant groups reported in Brunswick came from Central America (21 | 1.7%), Latin America (21 | 1.7%), Asia (15 | 1.2%), South Eastern Asia (15 | 1.2%), and Thailand (15 | 1.2%), together accounting for 7.1% of all Brunswick residents.
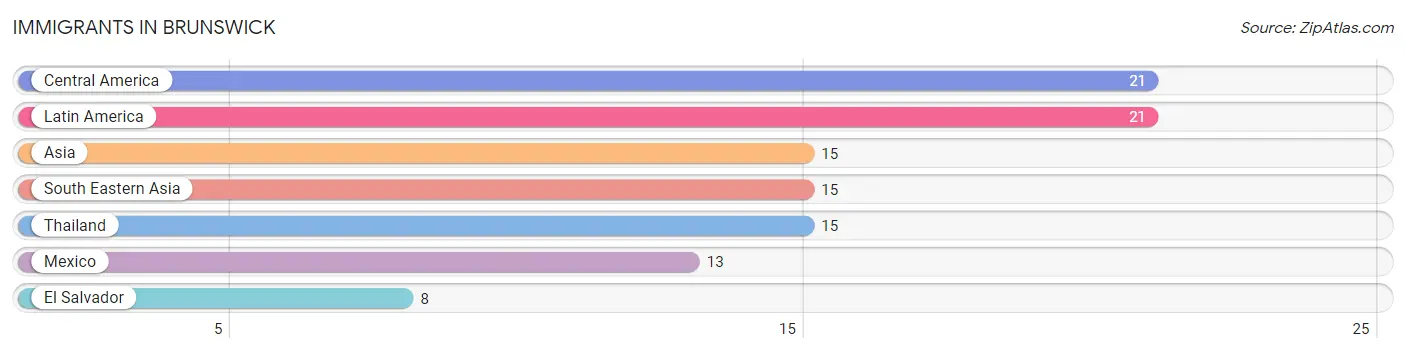
| Immigration Origin | # Population | % Population |
| Asia | 15 | 1.2% |
| Central America | 21 | 1.7% |
| El Salvador | 8 | 0.6% |
| Latin America | 21 | 1.7% |
| Mexico | 13 | 1.1% |
| South Eastern Asia | 15 | 1.2% |
| Thailand | 15 | 1.2% | View All 7 Rows |
Sex and Age in Brunswick
Sex and Age in Brunswick
The most populous age groups in Brunswick are 30 to 34 Years (144 | 16.3%) for men and 30 to 34 Years (138 | 39.5%) for women.
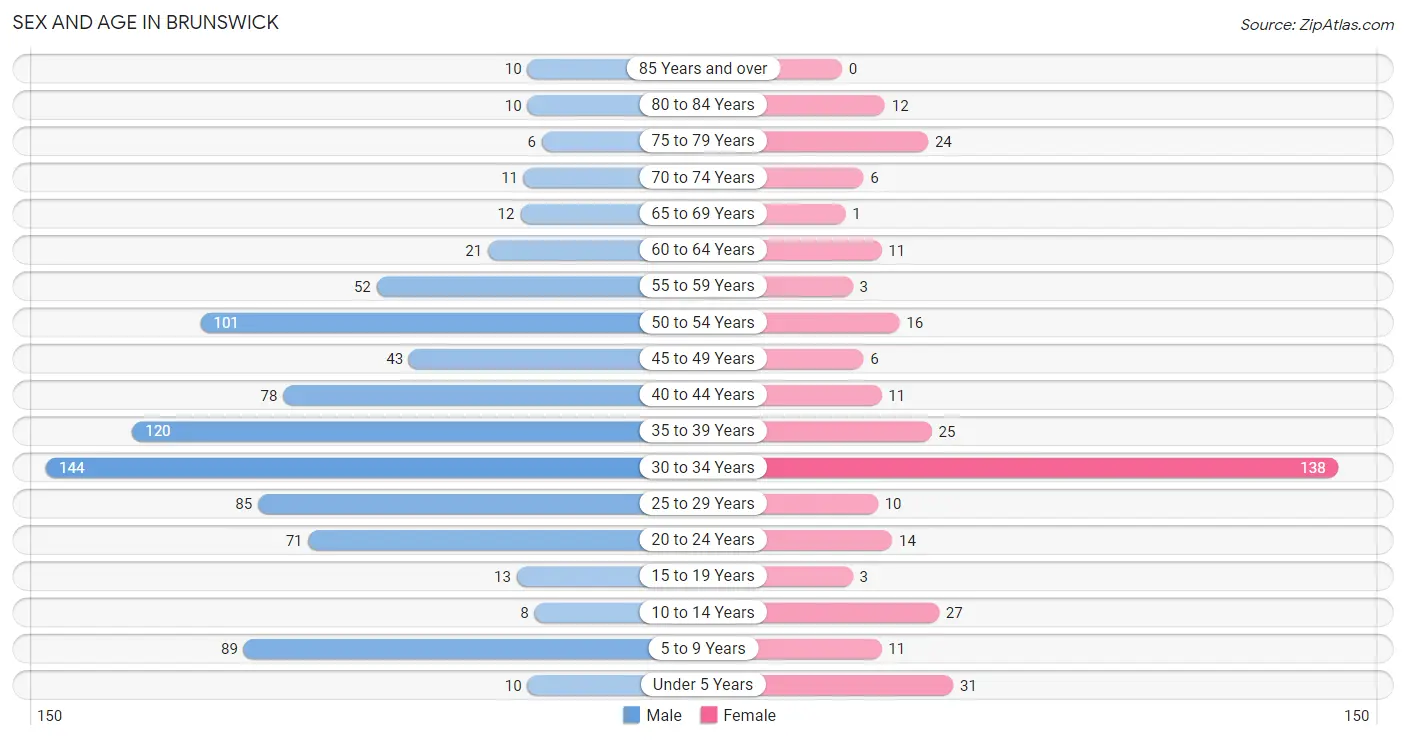
| Age Bracket | Male | Female |
| Under 5 Years | 10 (1.1%) | 31 (8.9%) |
| 5 to 9 Years | 89 (10.1%) | 11 (3.2%) |
| 10 to 14 Years | 8 (0.9%) | 27 (7.7%) |
| 15 to 19 Years | 13 (1.5%) | 3 (0.9%) |
| 20 to 24 Years | 71 (8.0%) | 14 (4.0%) |
| 25 to 29 Years | 85 (9.6%) | 10 (2.9%) |
| 30 to 34 Years | 144 (16.3%) | 138 (39.5%) |
| 35 to 39 Years | 120 (13.6%) | 25 (7.2%) |
| 40 to 44 Years | 78 (8.8%) | 11 (3.2%) |
| 45 to 49 Years | 43 (4.9%) | 6 (1.7%) |
| 50 to 54 Years | 101 (11.4%) | 16 (4.6%) |
| 55 to 59 Years | 52 (5.9%) | 3 (0.9%) |
| 60 to 64 Years | 21 (2.4%) | 11 (3.2%) |
| 65 to 69 Years | 12 (1.4%) | 1 (0.3%) |
| 70 to 74 Years | 11 (1.2%) | 6 (1.7%) |
| 75 to 79 Years | 6 (0.7%) | 24 (6.9%) |
| 80 to 84 Years | 10 (1.1%) | 12 (3.4%) |
| 85 Years and over | 10 (1.1%) | 0 (0.0%) |
| Total | 884 (100.0%) | 349 (100.0%) |
Families and Households in Brunswick
Median Family Size in Brunswick
The median family size in Brunswick is 2.58 persons per family, with married-couple families (16 | 8.8%) accounting for the largest median family size of 5.13 persons per family. On the other hand, single female/mother families (165 | 90.7%) represent the smallest median family size with 2.32 persons per family.
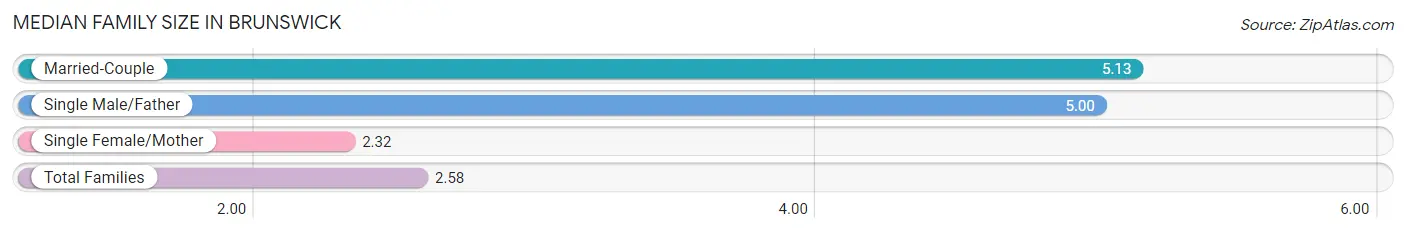
| Family Type | # Families | Family Size |
| Married-Couple | 16 (8.8%) | 5.13 |
| Single Male/Father | 1 (0.5%) | 5.00 |
| Single Female/Mother | 165 (90.7%) | 2.32 |
| Total Families | 182 (100.0%) | 2.58 |
Median Household Size in Brunswick
The median household size in Brunswick is 2.21 persons per household, with married-couple households (16 | 6.4%) accounting for the largest median household size of 5.63 persons per household. non-family households (67 | 26.9%) represent the smallest median household size with 1.06 persons per household.
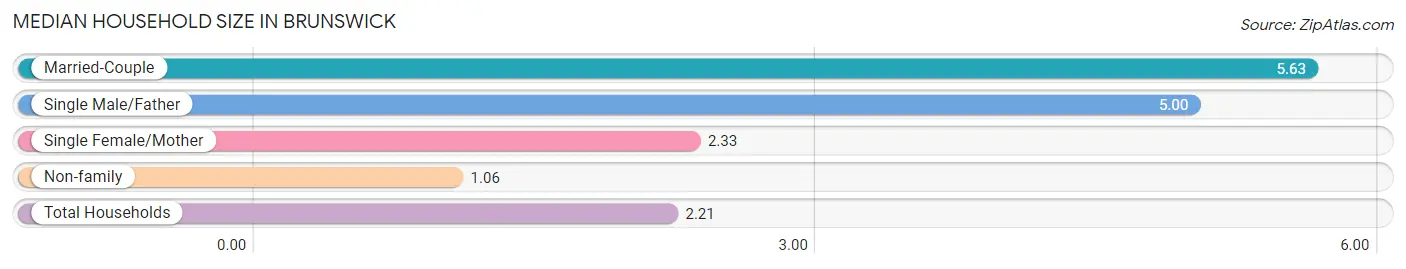
| Household Type | # Households | Household Size |
| Married-Couple | 16 (6.4%) | 5.63 |
| Single Male/Father | 1 (0.4%) | 5.00 |
| Single Female/Mother | 165 (66.3%) | 2.33 |
| Non-family | 67 (26.9%) | 1.06 |
| Total Households | 249 (100.0%) | 2.21 |
Household Size by Marriage Status in Brunswick
Out of a total of 249 households in Brunswick, 182 (73.1%) are family households, while 67 (26.9%) are nonfamily households. The most numerous type of family households are 2-person households, comprising 130, and the most common type of nonfamily households are 1-person households, comprising 65.
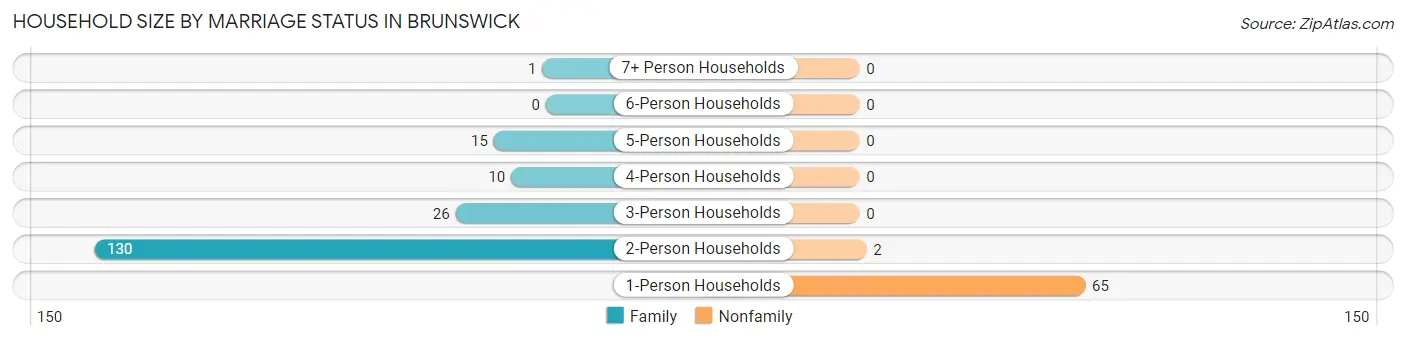
| Household Size | Family Households | Nonfamily Households |
| 1-Person Households | - | 65 (26.1%) |
| 2-Person Households | 130 (52.2%) | 2 (0.8%) |
| 3-Person Households | 26 (10.4%) | 0 (0.0%) |
| 4-Person Households | 10 (4.0%) | 0 (0.0%) |
| 5-Person Households | 15 (6.0%) | 0 (0.0%) |
| 6-Person Households | 0 (0.0%) | 0 (0.0%) |
| 7+ Person Households | 1 (0.4%) | 0 (0.0%) |
| Total | 182 (73.1%) | 67 (26.9%) |
Female Fertility in Brunswick
Fertility by Age in Brunswick
Average fertility rate in Brunswick is 14.0 births per 1,000 women. Women in the age bracket of 20 to 34 years have the highest fertility rate with 19.0 births per 1,000 women. Women in the age bracket of 20 to 34 years acount for 100.0% of all women with births.
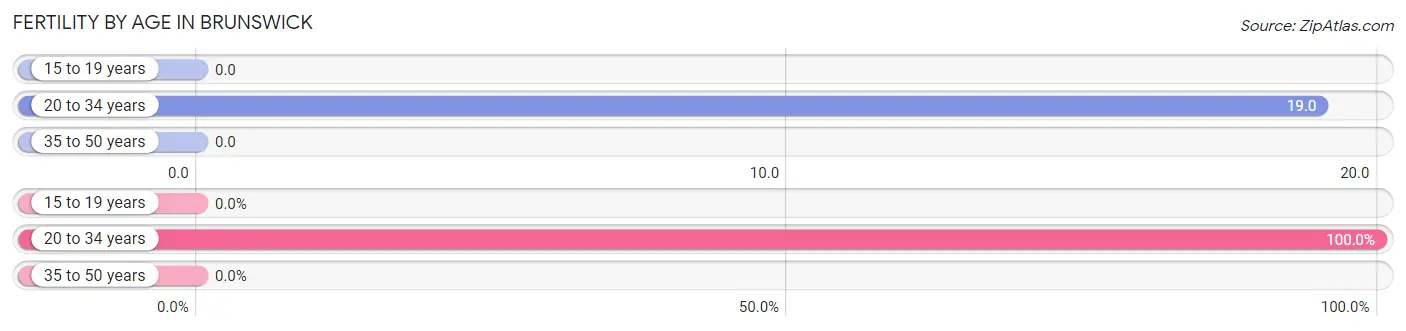
| Age Bracket | Women with Births | Births / 1,000 Women |
| 15 to 19 years | 0 (0.0%) | 0.0 |
| 20 to 34 years | 3 (100.0%) | 19.0 |
| 35 to 50 years | 0 (0.0%) | 0.0 |
| Total | 3 (100.0%) | 14.0 |
Fertility by Age by Marriage Status in Brunswick
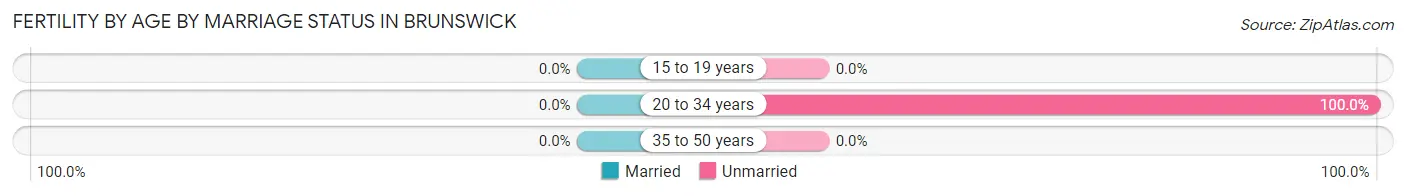
| Age Bracket | Married | Unmarried |
| 15 to 19 years | 0 (0.0%) | 0 (0.0%) |
| 20 to 34 years | 0 (0.0%) | 3 (100.0%) |
| 35 to 50 years | 0 (0.0%) | 0 (0.0%) |
| Total | 0 (0.0%) | 3 (100.0%) |
Fertility by Education in Brunswick
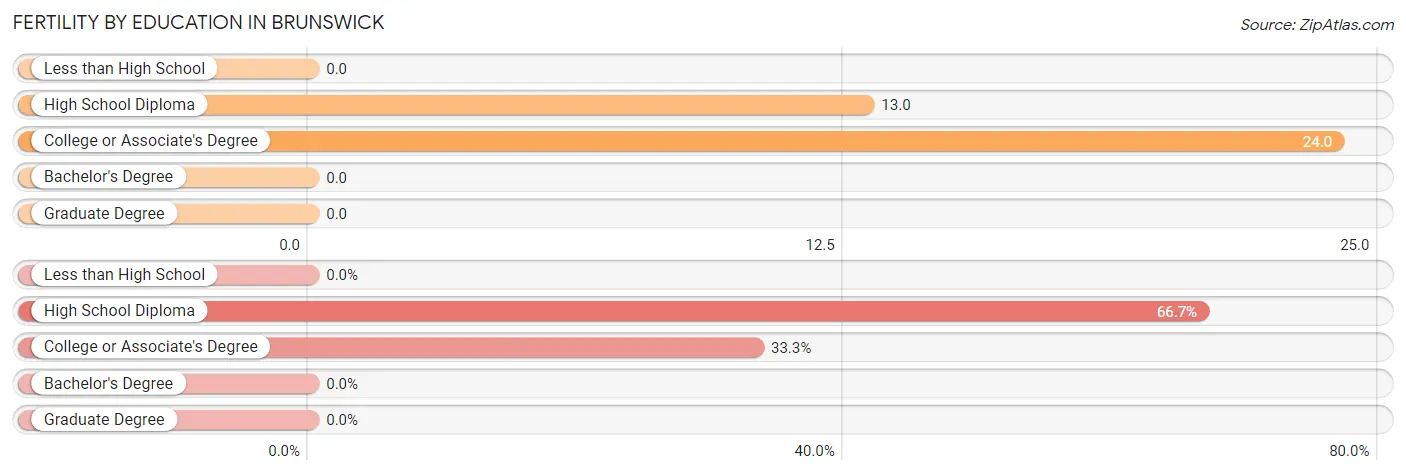
| Educational Attainment | Women with Births | Births / 1,000 Women |
| Less than High School | 0 (0.0%) | 0.0 |
| High School Diploma | 2 (66.7%) | 13.0 |
| College or Associate's Degree | 1 (33.3%) | 24.0 |
| Bachelor's Degree | 0 (0.0%) | 0.0 |
| Graduate Degree | 0 (0.0%) | 0.0 |
| Total | 3 (100.0%) | 14.0 |
Fertility by Education by Marriage Status in Brunswick
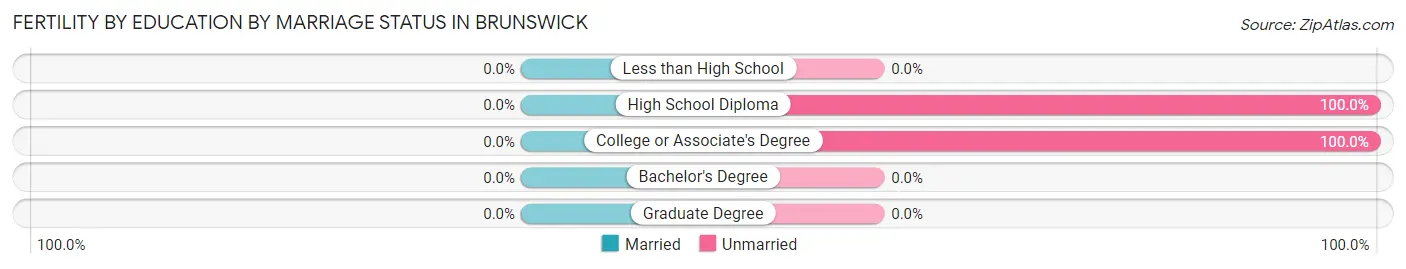
| Educational Attainment | Married | Unmarried |
| Less than High School | 0 (0.0%) | 0 (0.0%) |
| High School Diploma | 0 (0.0%) | 2 (100.0%) |
| College or Associate's Degree | 0 (0.0%) | 1 (100.0%) |
| Bachelor's Degree | 0 (0.0%) | 0 (0.0%) |
| Graduate Degree | 0 (0.0%) | 0 (0.0%) |
| Total | 0 (0.0%) | 3 (100.0%) |
Employment Characteristics in Brunswick
Employment by Class of Employer in Brunswick
Among the 216 employed individuals in Brunswick, private company employees (192 | 88.9%), self-employed (not incorporated) (8 | 3.7%), and state government employees (8 | 3.7%) make up the most common classes of employment.
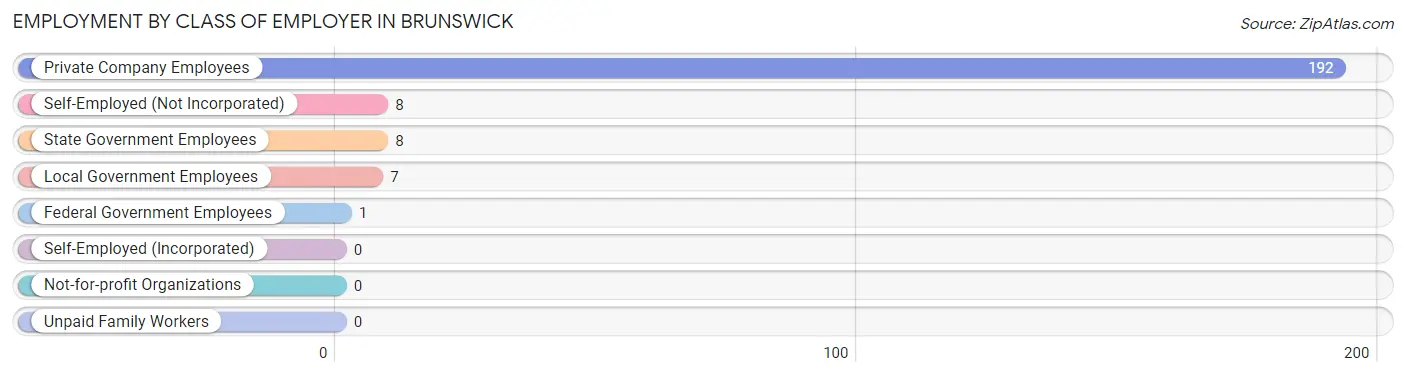
| Employer Class | # Employees | % Employees |
| Private Company Employees | 192 | 88.9% |
| Self-Employed (Incorporated) | 0 | 0.0% |
| Self-Employed (Not Incorporated) | 8 | 3.7% |
| Not-for-profit Organizations | 0 | 0.0% |
| Local Government Employees | 7 | 3.2% |
| State Government Employees | 8 | 3.7% |
| Federal Government Employees | 1 | 0.5% |
| Unpaid Family Workers | 0 | 0.0% |
| Total | 216 | 100.0% |
Employment Status by Age in Brunswick
According to the labor force statistics for Brunswick, out of the total population over 16 years of age (1,057), 21.8% or 230 individuals are in the labor force, with 6.1% or 14 of them unemployed. The age group with the highest labor force participation rate is 16 to 19 years, with 43.8% or 7 individuals in the labor force. Within the labor force, the 16 to 19 years age range has the highest percentage of unemployed individuals, with 57.1% or 4 of them being unemployed.
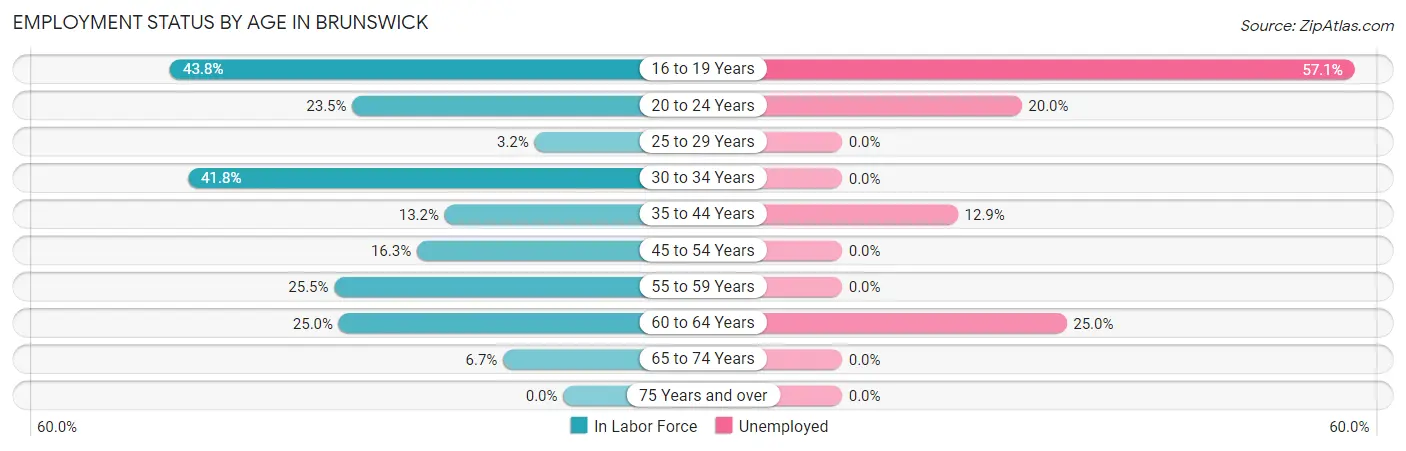
| Age Bracket | In Labor Force | Unemployed |
| 16 to 19 Years | 7 (43.8%) | 4 (57.1%) |
| 20 to 24 Years | 20 (23.5%) | 4 (20.0%) |
| 25 to 29 Years | 3 (3.2%) | 0 (0.0%) |
| 30 to 34 Years | 118 (41.8%) | 0 (0.0%) |
| 35 to 44 Years | 31 (13.2%) | 4 (12.9%) |
| 45 to 54 Years | 27 (16.3%) | 0 (0.0%) |
| 55 to 59 Years | 14 (25.5%) | 0 (0.0%) |
| 60 to 64 Years | 8 (25.0%) | 2 (25.0%) |
| 65 to 74 Years | 2 (6.7%) | 0 (0.0%) |
| 75 Years and over | 0 (0.0%) | 0 (0.0%) |
| Total | 230 (21.8%) | 14 (6.1%) |
Employment Status by Educational Attainment in Brunswick
According to labor force statistics for Brunswick, 23.3% of individuals (201) out of the total population between 25 and 64 years of age (864) are in the labor force, with 3.0% or 6 of them being unemployed. The group with the highest labor force participation rate are those with the educational attainment of bachelor's degree or higher, with 40.0% or 12 individuals in the labor force. Within the labor force, individuals with less than high school education have the highest percentage of unemployment, with 100.0% or 4 of them being unemployed.
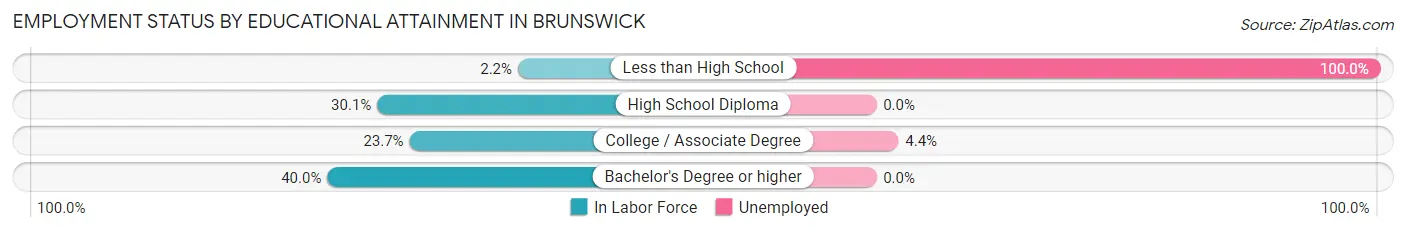
| Educational Attainment | In Labor Force | Unemployed |
| Less than High School | 4 (2.2%) | 179 (100.0%) |
| High School Diploma | 140 (30.1%) | 0 (0.0%) |
| College / Associate Degree | 45 (23.7%) | 8 (4.4%) |
| Bachelor's Degree or higher | 12 (40.0%) | 0 (0.0%) |
| Total | 201 (23.3%) | 26 (3.0%) |
Employment Occupations by Sex in Brunswick
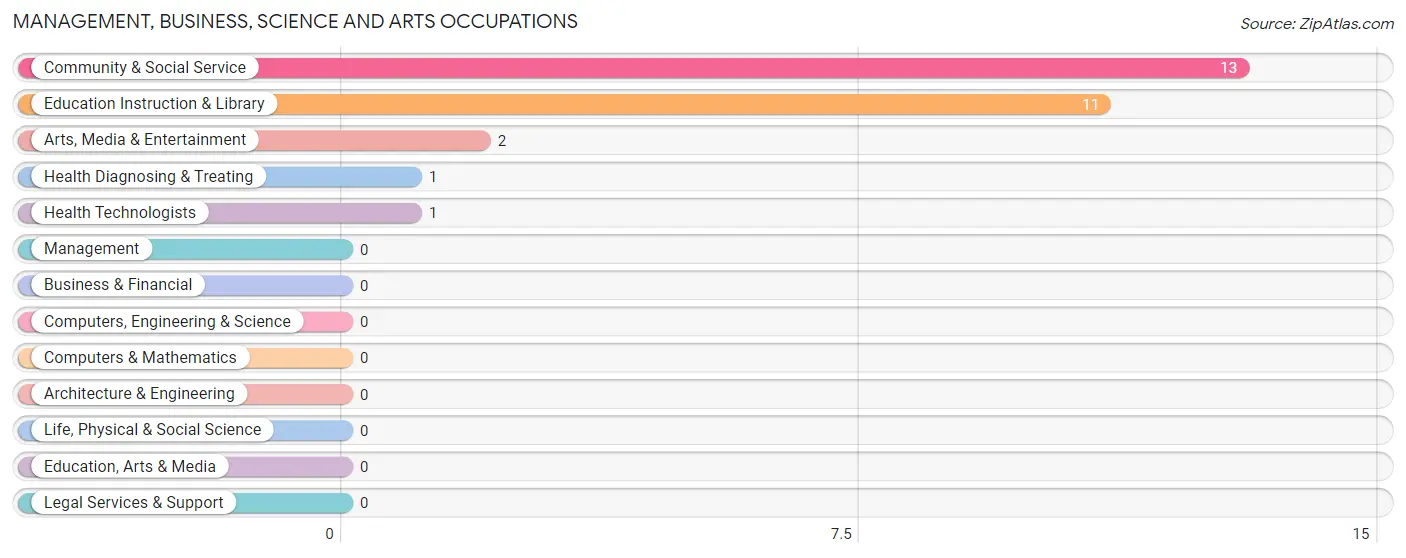
Management, Business, Science and Arts Occupations
The most common Management, Business, Science and Arts occupations in Brunswick are Community & Social Service (13 | 6.0%), Education Instruction & Library (11 | 5.1%), Arts, Media & Entertainment (2 | 0.9%), Health Diagnosing & Treating (1 | 0.5%), and Health Technologists (1 | 0.5%).
Management, Business, Science and Arts Occupations by Sex
Within the Management, Business, Science and Arts occupations in Brunswick, the most male-oriented occupations are Arts, Media & Entertainment (100.0%), Health Diagnosing & Treating (100.0%), and Health Technologists (100.0%), while the most female-oriented occupations are Education Instruction & Library (100.0%), and Community & Social Service (84.6%).
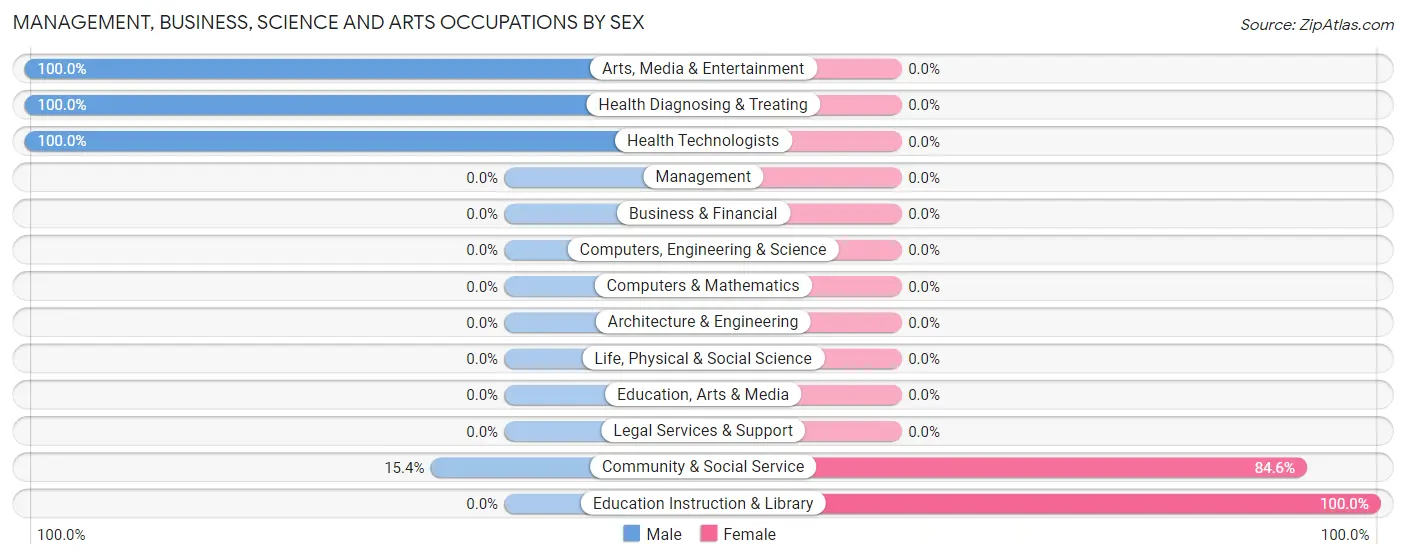
| Occupation | Male | Female |
| Management | 0 (0.0%) | 0 (0.0%) |
| Business & Financial | 0 (0.0%) | 0 (0.0%) |
| Computers, Engineering & Science | 0 (0.0%) | 0 (0.0%) |
| Computers & Mathematics | 0 (0.0%) | 0 (0.0%) |
| Architecture & Engineering | 0 (0.0%) | 0 (0.0%) |
| Life, Physical & Social Science | 0 (0.0%) | 0 (0.0%) |
| Community & Social Service | 2 (15.4%) | 11 (84.6%) |
| Education, Arts & Media | 0 (0.0%) | 0 (0.0%) |
| Legal Services & Support | 0 (0.0%) | 0 (0.0%) |
| Education Instruction & Library | 0 (0.0%) | 11 (100.0%) |
| Arts, Media & Entertainment | 2 (100.0%) | 0 (0.0%) |
| Health Diagnosing & Treating | 1 (100.0%) | 0 (0.0%) |
| Health Technologists | 1 (100.0%) | 0 (0.0%) |
| Total (Category) | 3 (21.4%) | 11 (78.6%) |
| Total (Overall) | 33 (15.3%) | 183 (84.7%) |
Services Occupations
The most common Services occupations in Brunswick are Food Preparation & Serving (19 | 8.8%), Healthcare Support (9 | 4.2%), Cleaning & Maintenance (9 | 4.2%), Security & Protection (4 | 1.8%), and Firefighting & Prevention (4 | 1.8%).
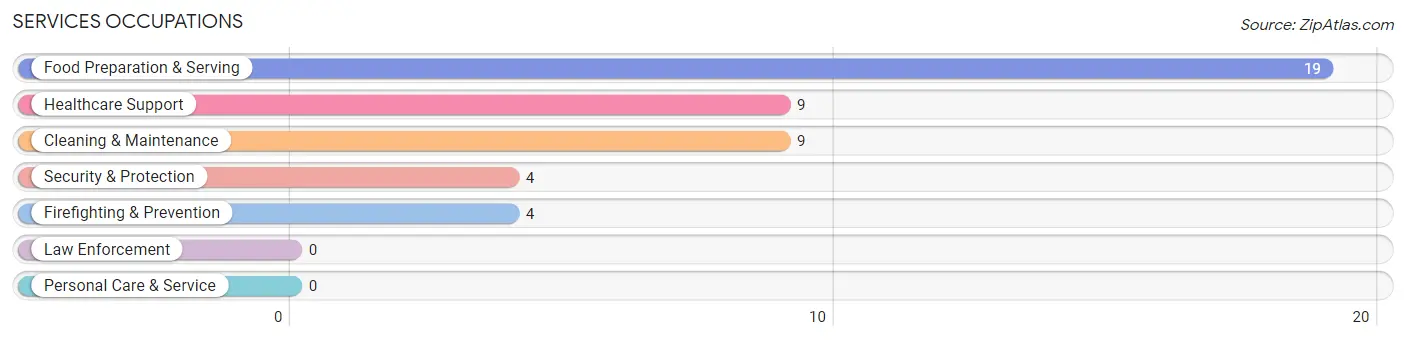
Services Occupations by Sex
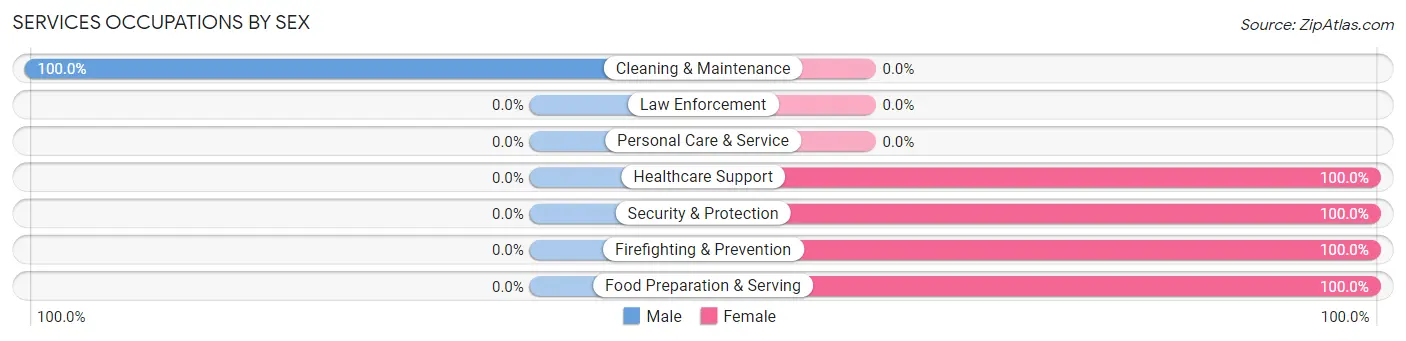
| Occupation | Male | Female |
| Healthcare Support | 0 (0.0%) | 9 (100.0%) |
| Security & Protection | 0 (0.0%) | 4 (100.0%) |
| Firefighting & Prevention | 0 (0.0%) | 4 (100.0%) |
| Law Enforcement | 0 (0.0%) | 0 (0.0%) |
| Food Preparation & Serving | 0 (0.0%) | 19 (100.0%) |
| Cleaning & Maintenance | 9 (100.0%) | 0 (0.0%) |
| Personal Care & Service | 0 (0.0%) | 0 (0.0%) |
| Total (Category) | 9 (22.0%) | 32 (78.0%) |
| Total (Overall) | 33 (15.3%) | 183 (84.7%) |
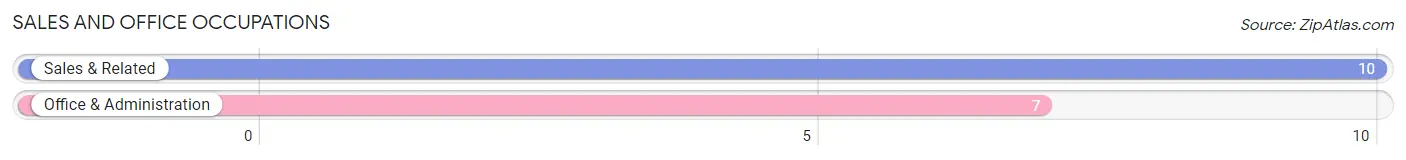
Sales and Office Occupations
The most common Sales and Office occupations in Brunswick are Sales & Related (10 | 4.6%), and Office & Administration (7 | 3.2%).
Sales and Office Occupations by Sex
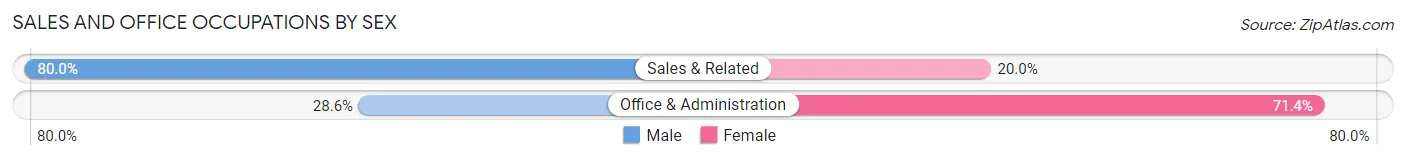
| Occupation | Male | Female |
| Sales & Related | 8 (80.0%) | 2 (20.0%) |
| Office & Administration | 2 (28.6%) | 5 (71.4%) |
| Total (Category) | 10 (58.8%) | 7 (41.2%) |
| Total (Overall) | 33 (15.3%) | 183 (84.7%) |
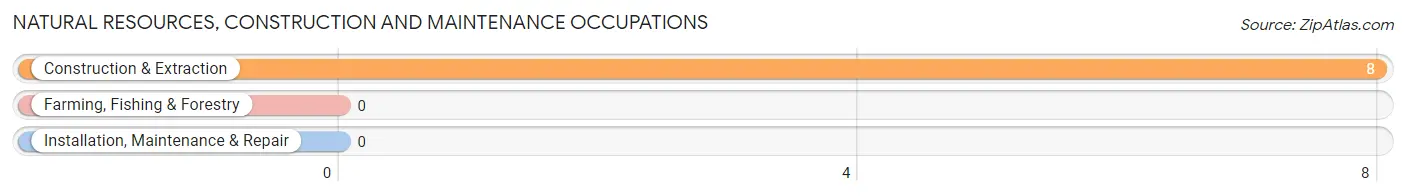
Natural Resources, Construction and Maintenance Occupations
The most common Natural Resources, Construction and Maintenance occupations in Brunswick are , and Construction & Extraction (8 | 3.7%).
Natural Resources, Construction and Maintenance Occupations by Sex
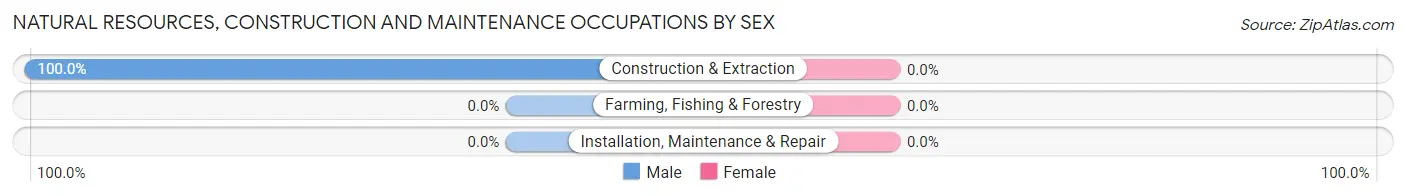
| Occupation | Male | Female |
| Farming, Fishing & Forestry | 0 (0.0%) | 0 (0.0%) |
| Construction & Extraction | 8 (100.0%) | 0 (0.0%) |
| Installation, Maintenance & Repair | 0 (0.0%) | 0 (0.0%) |
| Total (Category) | 8 (100.0%) | 0 (0.0%) |
| Total (Overall) | 33 (15.3%) | 183 (84.7%) |
Production, Transportation and Moving Occupations
The most common Production, Transportation and Moving occupations in Brunswick are Production (135 | 62.5%), and Transportation (1 | 0.5%).
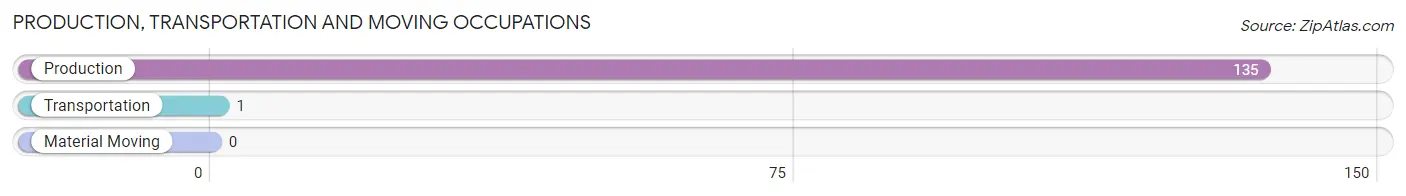
Production, Transportation and Moving Occupations by Sex

| Occupation | Male | Female |
| Production | 2 (1.5%) | 133 (98.5%) |
| Transportation | 1 (100.0%) | 0 (0.0%) |
| Material Moving | 0 (0.0%) | 0 (0.0%) |
| Total (Category) | 3 (2.2%) | 133 (97.8%) |
| Total (Overall) | 33 (15.3%) | 183 (84.7%) |
Employment Industries by Sex in Brunswick
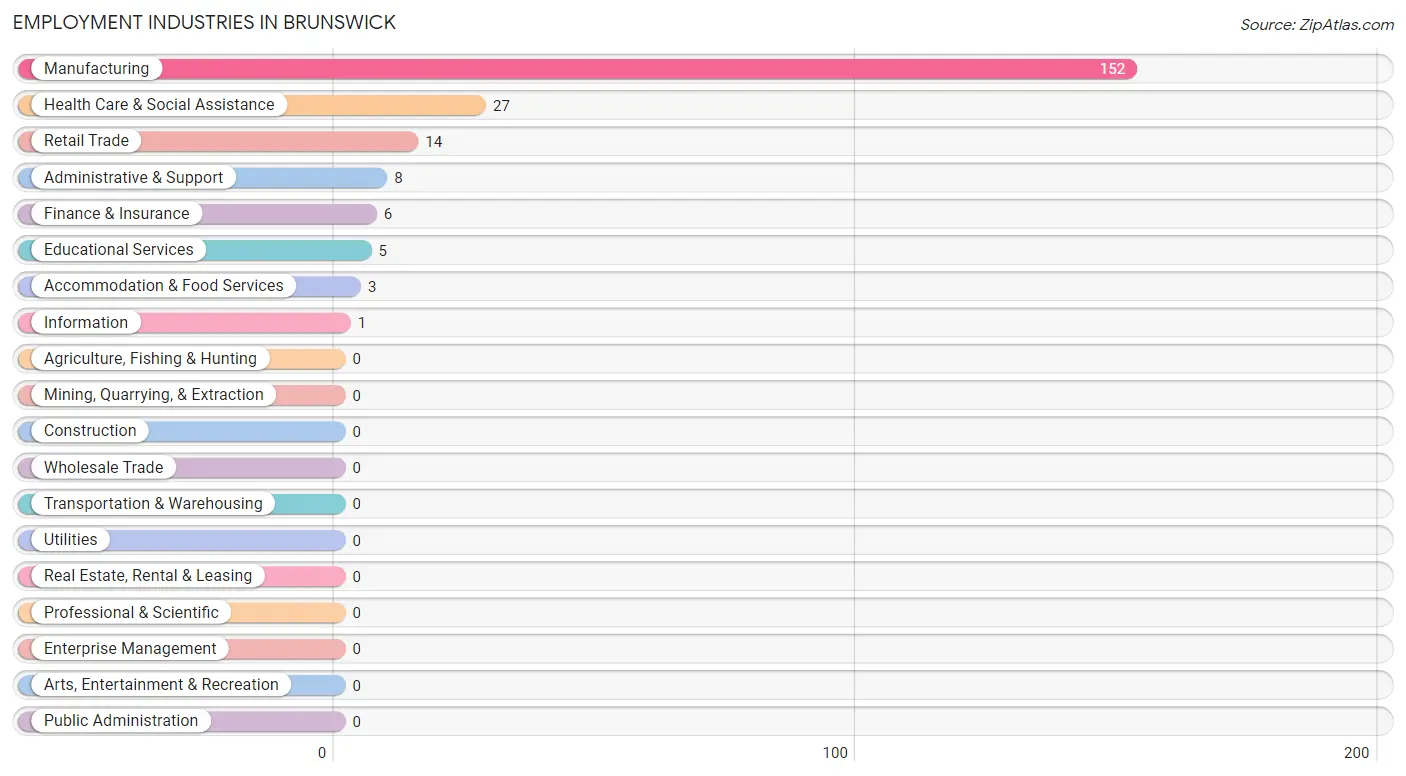
Employment Industries in Brunswick
The major employment industries in Brunswick include Manufacturing (152 | 70.4%), Health Care & Social Assistance (27 | 12.5%), Retail Trade (14 | 6.5%), Administrative & Support (8 | 3.7%), and Finance & Insurance (6 | 2.8%).
Employment Industries by Sex in Brunswick
The Brunswick industries that see more men than women are Finance & Insurance (100.0%), Administrative & Support (100.0%), and Retail Trade (42.9%), whereas the industries that tend to have a higher number of women are Information (100.0%), Accommodation & Food Services (100.0%), and Manufacturing (94.1%).
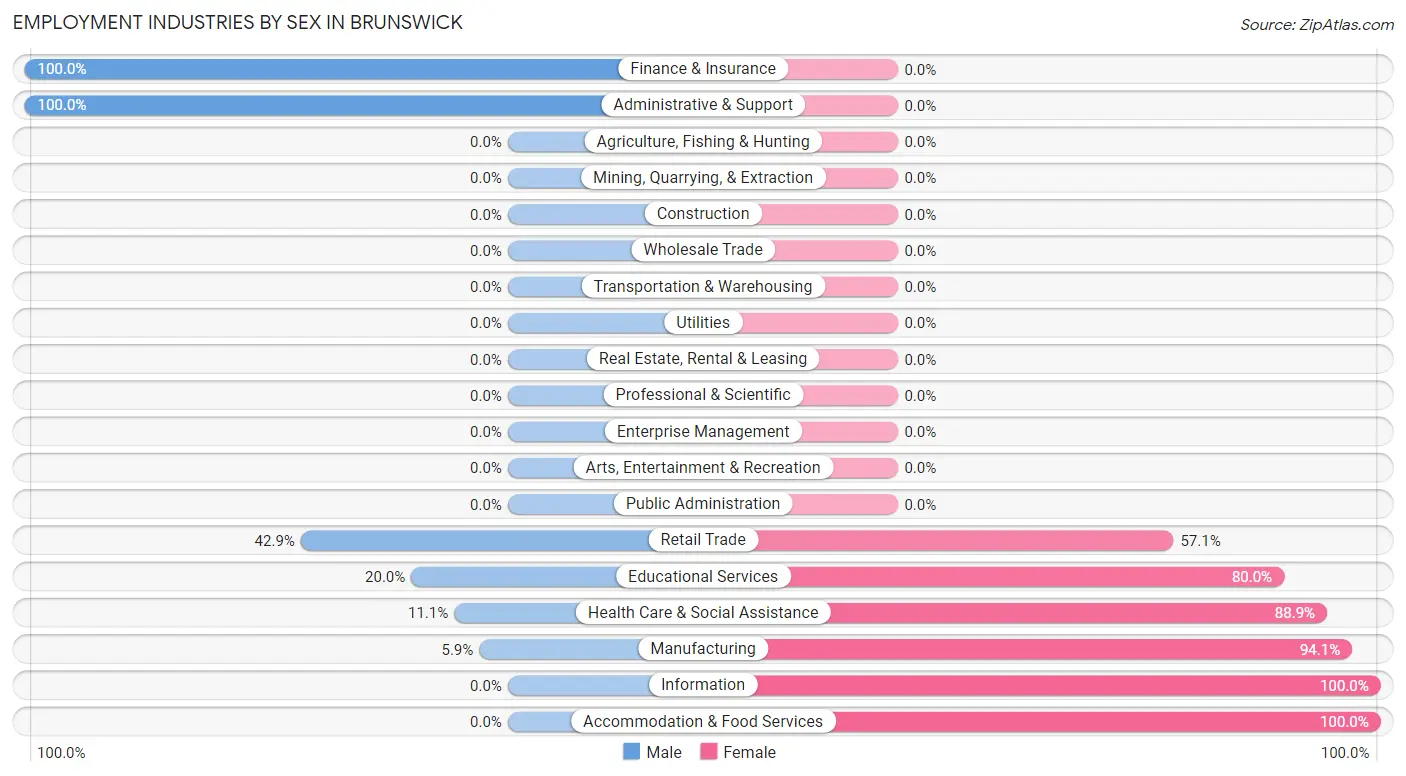
| Industry | Male | Female |
| Agriculture, Fishing & Hunting | 0 (0.0%) | 0 (0.0%) |
| Mining, Quarrying, & Extraction | 0 (0.0%) | 0 (0.0%) |
| Construction | 0 (0.0%) | 0 (0.0%) |
| Manufacturing | 9 (5.9%) | 143 (94.1%) |
| Wholesale Trade | 0 (0.0%) | 0 (0.0%) |
| Retail Trade | 6 (42.9%) | 8 (57.1%) |
| Transportation & Warehousing | 0 (0.0%) | 0 (0.0%) |
| Utilities | 0 (0.0%) | 0 (0.0%) |
| Information | 0 (0.0%) | 1 (100.0%) |
| Finance & Insurance | 6 (100.0%) | 0 (0.0%) |
| Real Estate, Rental & Leasing | 0 (0.0%) | 0 (0.0%) |
| Professional & Scientific | 0 (0.0%) | 0 (0.0%) |
| Enterprise Management | 0 (0.0%) | 0 (0.0%) |
| Administrative & Support | 8 (100.0%) | 0 (0.0%) |
| Educational Services | 1 (20.0%) | 4 (80.0%) |
| Health Care & Social Assistance | 3 (11.1%) | 24 (88.9%) |
| Arts, Entertainment & Recreation | 0 (0.0%) | 0 (0.0%) |
| Accommodation & Food Services | 0 (0.0%) | 3 (100.0%) |
| Public Administration | 0 (0.0%) | 0 (0.0%) |
| Total | 33 (15.3%) | 183 (84.7%) |
Education in Brunswick
School Enrollment in Brunswick
The most common levels of schooling among the 237 students in Brunswick are elementary school (100 | 42.2%), college / undergraduate (48 | 20.3%), and high school (40 | 16.9%).
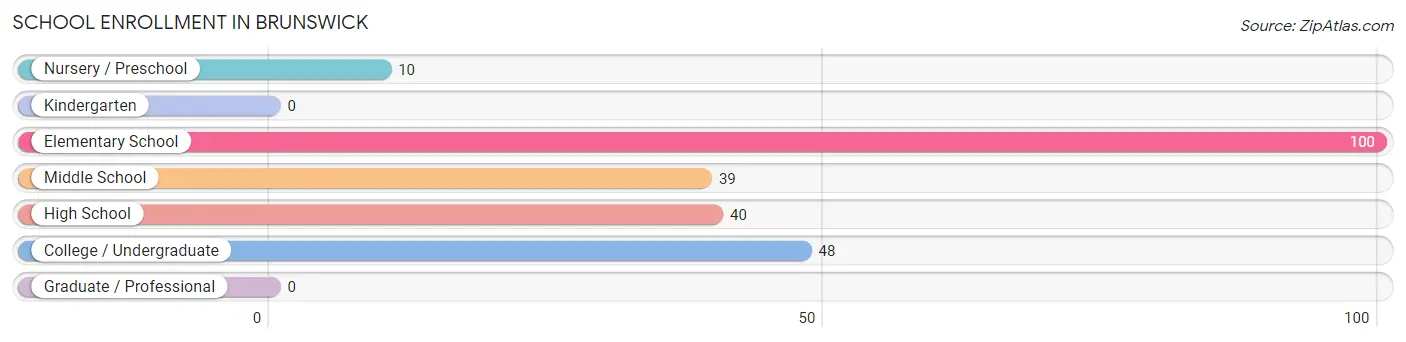
| School Level | # Students | % Students |
| Nursery / Preschool | 10 | 4.2% |
| Kindergarten | 0 | 0.0% |
| Elementary School | 100 | 42.2% |
| Middle School | 39 | 16.5% |
| High School | 40 | 16.9% |
| College / Undergraduate | 48 | 20.3% |
| Graduate / Professional | 0 | 0.0% |
| Total | 237 | 100.0% |
School Enrollment by Age by Funding Source in Brunswick
Out of a total of 237 students who are enrolled in schools in Brunswick, 6 (2.5%) attend a private institution, while the remaining 231 (97.5%) are enrolled in public schools. The age group of 25 to 34 year olds has the highest likelihood of being enrolled in private schools, with 6 (40.0% in the age bracket) enrolled. Conversely, the age group of 3 to 4 year olds has the lowest likelihood of being enrolled in a private school, with 10 (100.0% in the age bracket) attending a public institution.
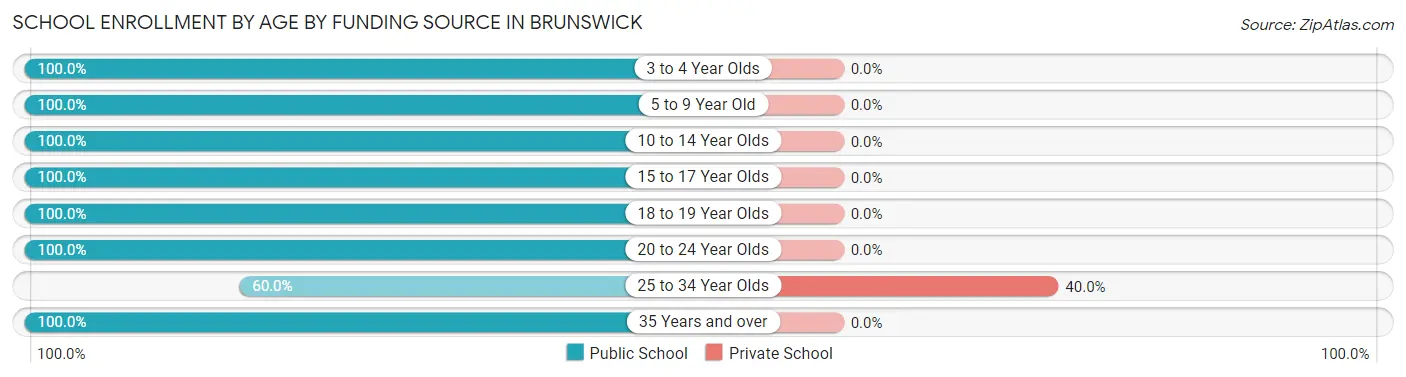
| Age Bracket | Public School | Private School |
| 3 to 4 Year Olds | 10 (100.0%) | 0 (0.0%) |
| 5 to 9 Year Old | 89 (100.0%) | 0 (0.0%) |
| 10 to 14 Year Olds | 35 (100.0%) | 0 (0.0%) |
| 15 to 17 Year Olds | 13 (100.0%) | 0 (0.0%) |
| 18 to 19 Year Olds | 3 (100.0%) | 0 (0.0%) |
| 20 to 24 Year Olds | 28 (100.0%) | 0 (0.0%) |
| 25 to 34 Year Olds | 9 (60.0%) | 6 (40.0%) |
| 35 Years and over | 44 (100.0%) | 0 (0.0%) |
| Total | 231 (97.5%) | 6 (2.5%) |
Educational Attainment by Field of Study in Brunswick
Business (16 | 40.0%), education (12 | 30.0%), science & technology (5 | 12.5%), arts & humanities (3 | 7.5%), and social sciences (2 | 5.0%) are the most common fields of study among 40 individuals in Brunswick who have obtained a bachelor's degree or higher.
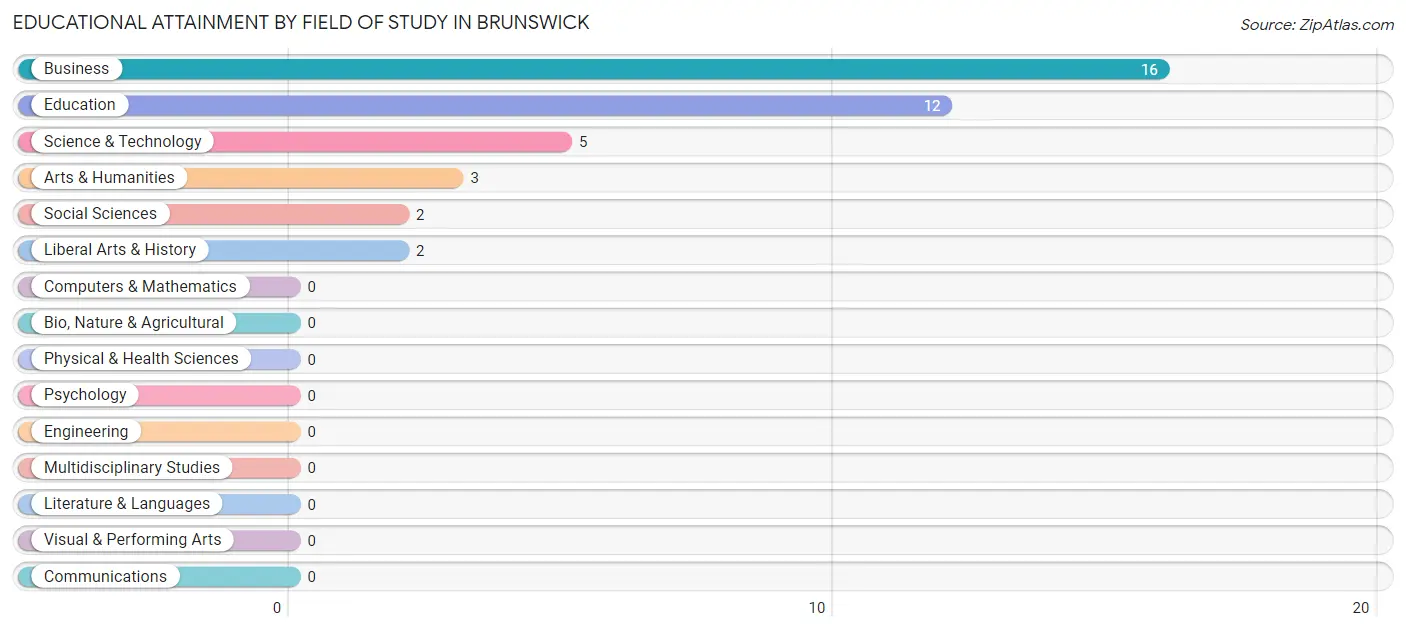
| Field of Study | # Graduates | % Graduates |
| Computers & Mathematics | 0 | 0.0% |
| Bio, Nature & Agricultural | 0 | 0.0% |
| Physical & Health Sciences | 0 | 0.0% |
| Psychology | 0 | 0.0% |
| Social Sciences | 2 | 5.0% |
| Engineering | 0 | 0.0% |
| Multidisciplinary Studies | 0 | 0.0% |
| Science & Technology | 5 | 12.5% |
| Business | 16 | 40.0% |
| Education | 12 | 30.0% |
| Literature & Languages | 0 | 0.0% |
| Liberal Arts & History | 2 | 5.0% |
| Visual & Performing Arts | 0 | 0.0% |
| Communications | 0 | 0.0% |
| Arts & Humanities | 3 | 7.5% |
| Total | 40 | 100.0% |
Transportation & Commute in Brunswick
Vehicle Availability by Sex in Brunswick
The most prevalent vehicle ownership categories in Brunswick are males with 1 vehicle (13, accounting for 39.4%) and females with 1 vehicle (140, making up 7.1%).
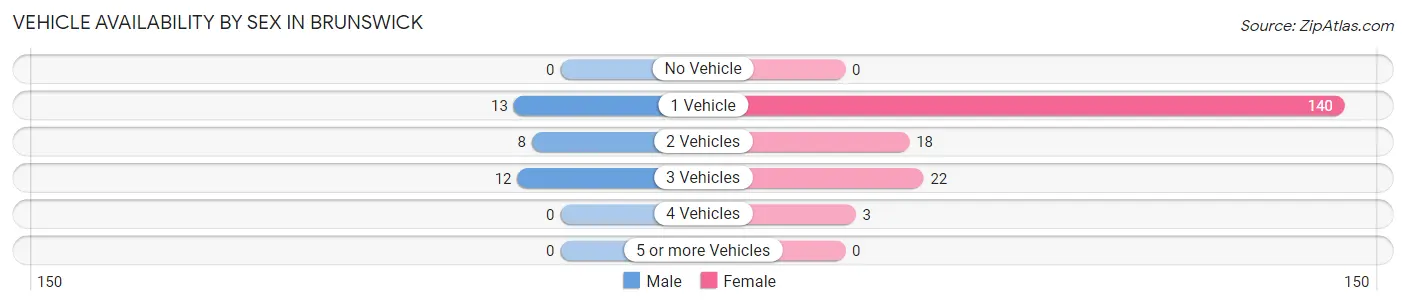
| Vehicles Available | Male | Female |
| No Vehicle | 0 (0.0%) | 0 (0.0%) |
| 1 Vehicle | 13 (39.4%) | 140 (76.5%) |
| 2 Vehicles | 8 (24.2%) | 18 (9.8%) |
| 3 Vehicles | 12 (36.4%) | 22 (12.0%) |
| 4 Vehicles | 0 (0.0%) | 3 (1.6%) |
| 5 or more Vehicles | 0 (0.0%) | 0 (0.0%) |
| Total | 33 (100.0%) | 183 (100.0%) |
Commute Time in Brunswick
The most frequently occuring commute durations in Brunswick are 10 to 14 minutes (146 commuters, 67.6%), 5 to 9 minutes (14 commuters, 6.5%), and less than 5 minutes (10 commuters, 4.6%).
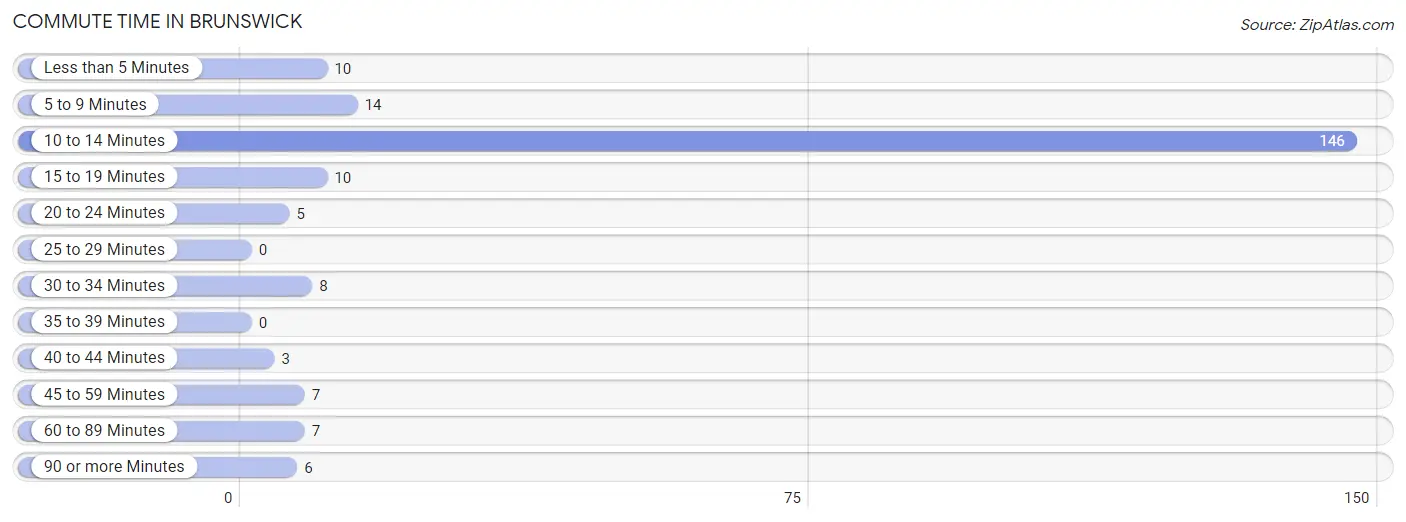
| Commute Time | # Commuters | % Commuters |
| Less than 5 Minutes | 10 | 4.6% |
| 5 to 9 Minutes | 14 | 6.5% |
| 10 to 14 Minutes | 146 | 67.6% |
| 15 to 19 Minutes | 10 | 4.6% |
| 20 to 24 Minutes | 5 | 2.3% |
| 25 to 29 Minutes | 0 | 0.0% |
| 30 to 34 Minutes | 8 | 3.7% |
| 35 to 39 Minutes | 0 | 0.0% |
| 40 to 44 Minutes | 3 | 1.4% |
| 45 to 59 Minutes | 7 | 3.2% |
| 60 to 89 Minutes | 7 | 3.2% |
| 90 or more Minutes | 6 | 2.8% |
Commute Time by Sex in Brunswick
The most common commute times in Brunswick are 10 to 14 minutes (13 commuters, 39.4%) for males and 10 to 14 minutes (133 commuters, 72.7%) for females.
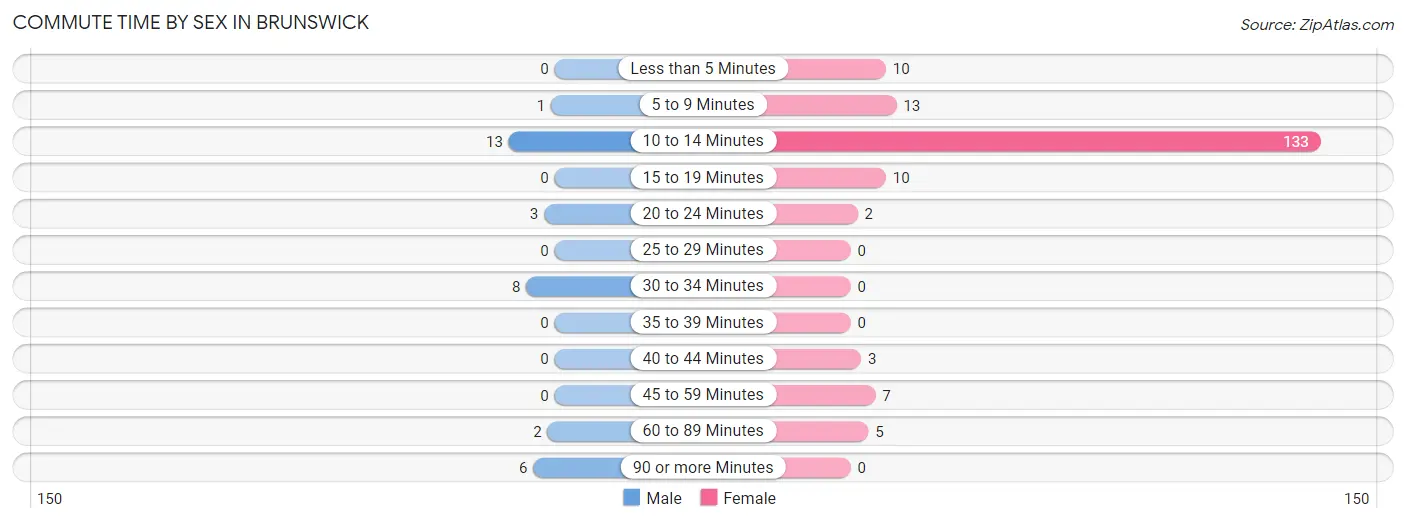
| Commute Time | Male | Female |
| Less than 5 Minutes | 0 (0.0%) | 10 (5.5%) |
| 5 to 9 Minutes | 1 (3.0%) | 13 (7.1%) |
| 10 to 14 Minutes | 13 (39.4%) | 133 (72.7%) |
| 15 to 19 Minutes | 0 (0.0%) | 10 (5.5%) |
| 20 to 24 Minutes | 3 (9.1%) | 2 (1.1%) |
| 25 to 29 Minutes | 0 (0.0%) | 0 (0.0%) |
| 30 to 34 Minutes | 8 (24.2%) | 0 (0.0%) |
| 35 to 39 Minutes | 0 (0.0%) | 0 (0.0%) |
| 40 to 44 Minutes | 0 (0.0%) | 3 (1.6%) |
| 45 to 59 Minutes | 0 (0.0%) | 7 (3.8%) |
| 60 to 89 Minutes | 2 (6.1%) | 5 (2.7%) |
| 90 or more Minutes | 6 (18.2%) | 0 (0.0%) |
Time of Departure to Work by Sex in Brunswick
The most frequent times of departure to work in Brunswick are 8:00 AM to 8:29 AM (14, 42.4%) for males and 12:00 PM to 3:59 PM (125, 68.3%) for females.
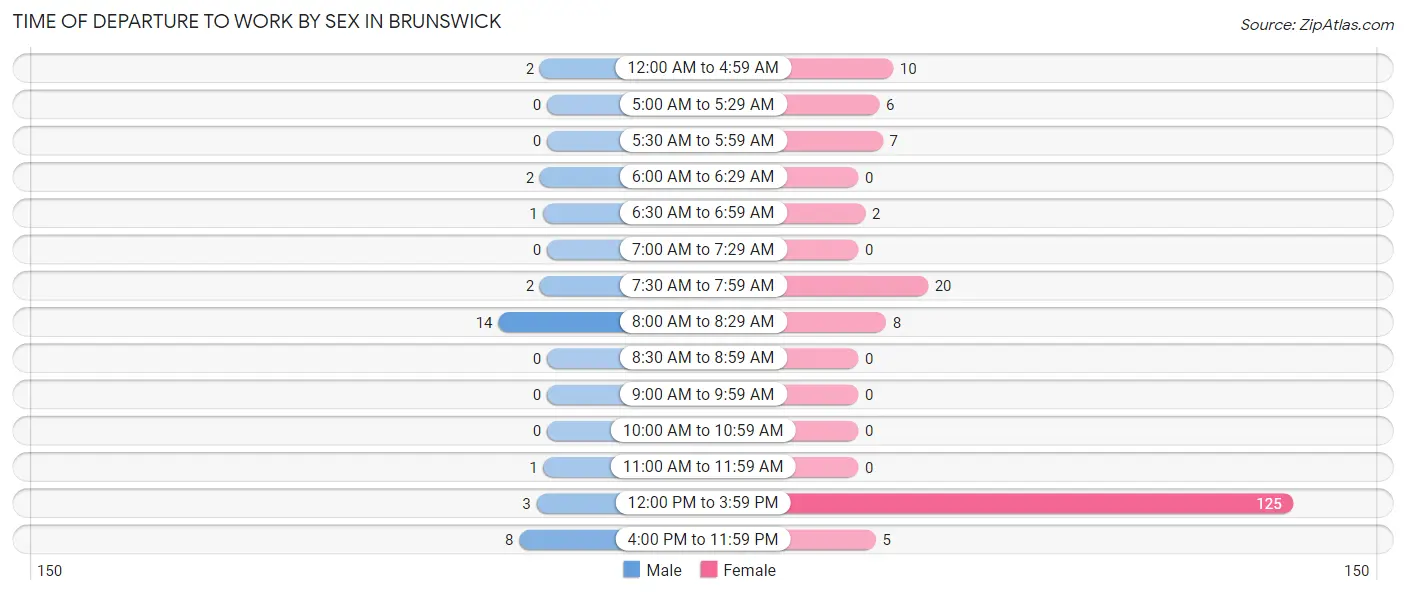
| Time of Departure | Male | Female |
| 12:00 AM to 4:59 AM | 2 (6.1%) | 10 (5.5%) |
| 5:00 AM to 5:29 AM | 0 (0.0%) | 6 (3.3%) |
| 5:30 AM to 5:59 AM | 0 (0.0%) | 7 (3.8%) |
| 6:00 AM to 6:29 AM | 2 (6.1%) | 0 (0.0%) |
| 6:30 AM to 6:59 AM | 1 (3.0%) | 2 (1.1%) |
| 7:00 AM to 7:29 AM | 0 (0.0%) | 0 (0.0%) |
| 7:30 AM to 7:59 AM | 2 (6.1%) | 20 (10.9%) |
| 8:00 AM to 8:29 AM | 14 (42.4%) | 8 (4.4%) |
| 8:30 AM to 8:59 AM | 0 (0.0%) | 0 (0.0%) |
| 9:00 AM to 9:59 AM | 0 (0.0%) | 0 (0.0%) |
| 10:00 AM to 10:59 AM | 0 (0.0%) | 0 (0.0%) |
| 11:00 AM to 11:59 AM | 1 (3.0%) | 0 (0.0%) |
| 12:00 PM to 3:59 PM | 3 (9.1%) | 125 (68.3%) |
| 4:00 PM to 11:59 PM | 8 (24.2%) | 5 (2.7%) |
| Total | 33 (100.0%) | 183 (100.0%) |
Housing Occupancy in Brunswick
Occupancy by Ownership in Brunswick
Of the total 249 dwellings in Brunswick, owner-occupied units account for 69 (27.7%), while renter-occupied units make up 180 (72.3%).
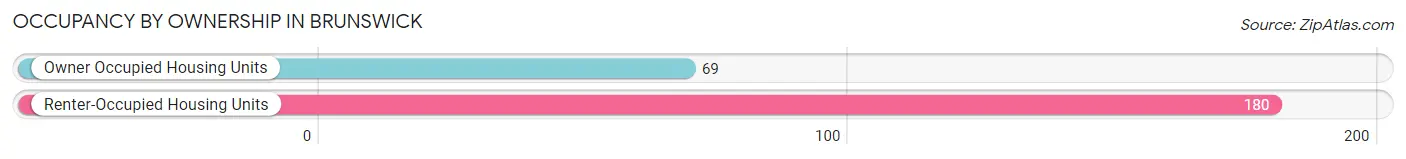
| Occupancy | # Housing Units | % Housing Units |
| Owner Occupied Housing Units | 69 | 27.7% |
| Renter-Occupied Housing Units | 180 | 72.3% |
| Total Occupied Housing Units | 249 | 100.0% |
Occupancy by Household Size in Brunswick
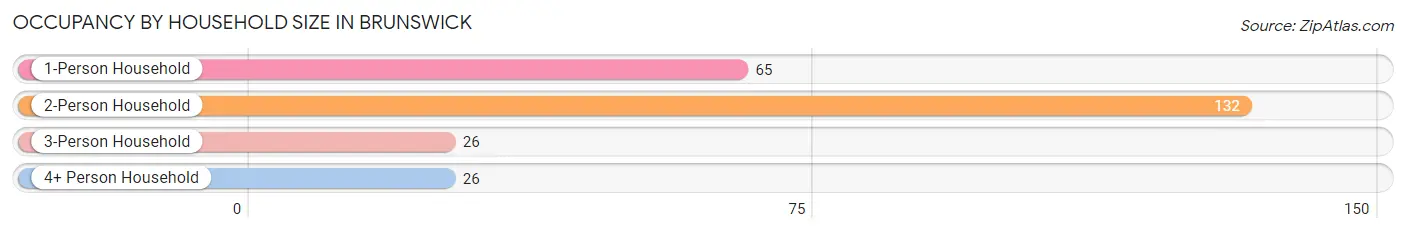
| Household Size | # Housing Units | % Housing Units |
| 1-Person Household | 65 | 26.1% |
| 2-Person Household | 132 | 53.0% |
| 3-Person Household | 26 | 10.4% |
| 4+ Person Household | 26 | 10.4% |
| Total Housing Units | 249 | 100.0% |
Occupancy by Ownership by Household Size in Brunswick
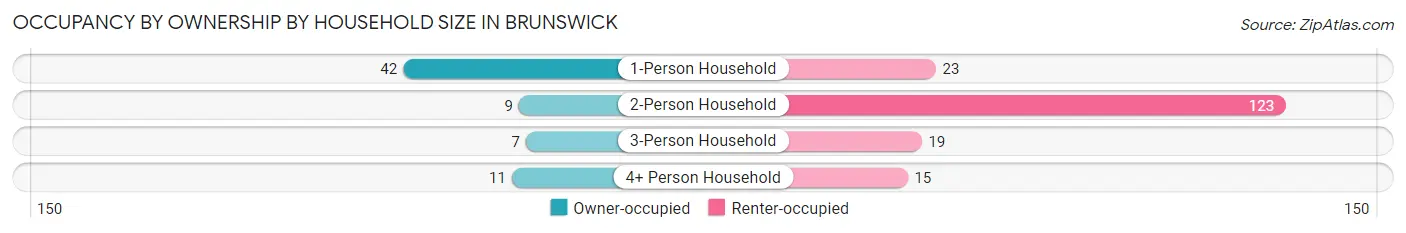
| Household Size | Owner-occupied | Renter-occupied |
| 1-Person Household | 42 (64.6%) | 23 (35.4%) |
| 2-Person Household | 9 (6.8%) | 123 (93.2%) |
| 3-Person Household | 7 (26.9%) | 19 (73.1%) |
| 4+ Person Household | 11 (42.3%) | 15 (57.7%) |
| Total Housing Units | 69 (27.7%) | 180 (72.3%) |
Occupancy by Educational Attainment in Brunswick
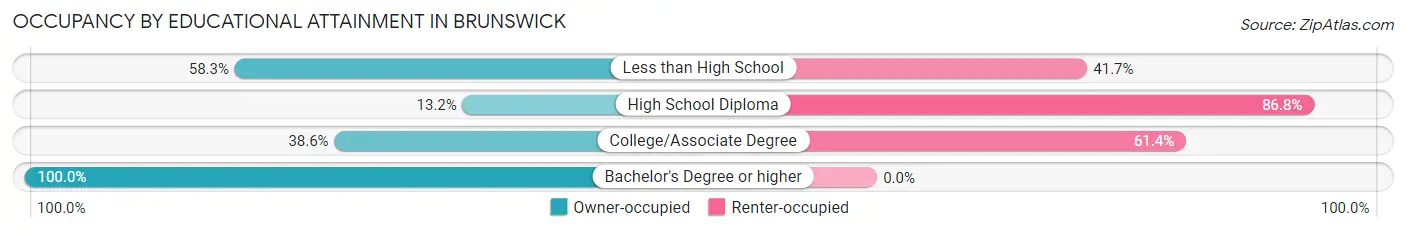
| Household Size | Owner-occupied | Renter-occupied |
| Less than High School | 7 (58.3%) | 5 (41.7%) |
| High School Diploma | 20 (13.2%) | 132 (86.8%) |
| College/Associate Degree | 27 (38.6%) | 43 (61.4%) |
| Bachelor's Degree or higher | 15 (100.0%) | 0 (0.0%) |
Occupancy by Age of Householder in Brunswick
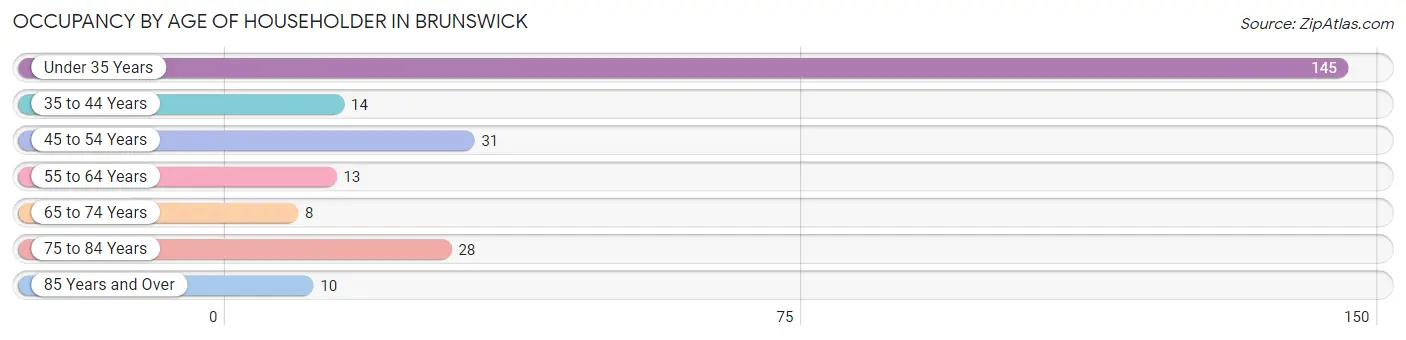
| Age Bracket | # Households | % Households |
| Under 35 Years | 145 | 58.2% |
| 35 to 44 Years | 14 | 5.6% |
| 45 to 54 Years | 31 | 12.4% |
| 55 to 64 Years | 13 | 5.2% |
| 65 to 74 Years | 8 | 3.2% |
| 75 to 84 Years | 28 | 11.2% |
| 85 Years and Over | 10 | 4.0% |
| Total | 249 | 100.0% |
Housing Finances in Brunswick
Median Income by Occupancy in Brunswick
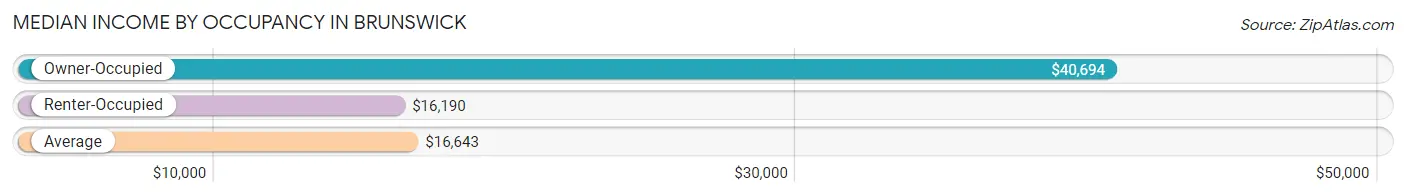
| Occupancy Type | # Households | Median Income |
| Owner-Occupied | 69 (27.7%) | $40,694 |
| Renter-Occupied | 180 (72.3%) | $16,190 |
| Average | 249 (100.0%) | $16,643 |
Occupancy by Householder Income Bracket in Brunswick
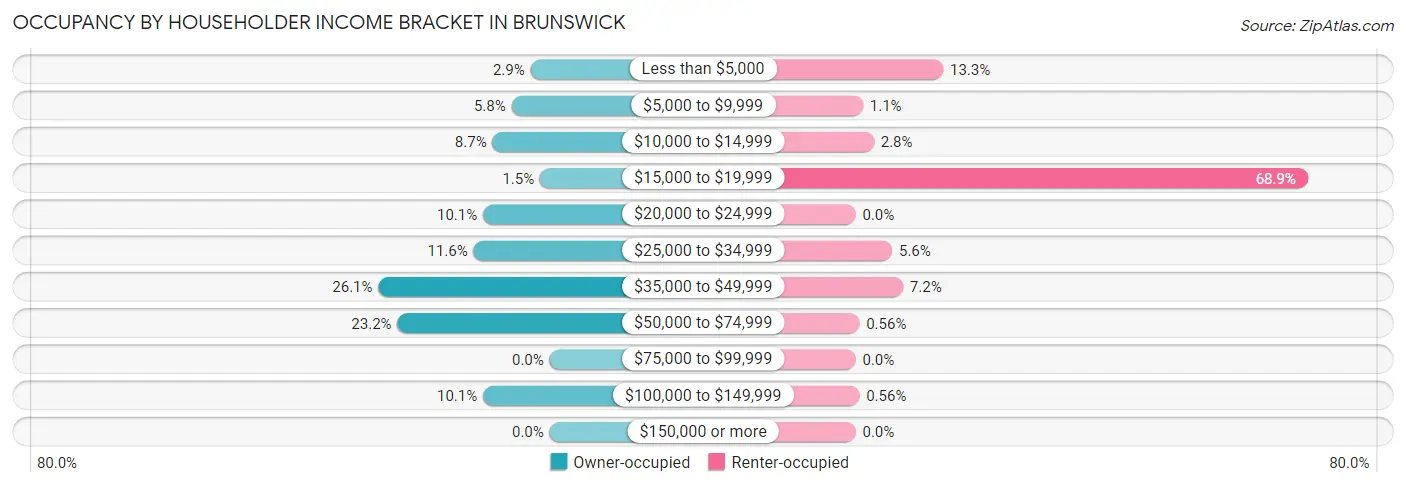
| Income Bracket | Owner-occupied | Renter-occupied |
| Less than $5,000 | 2 (2.9%) | 24 (13.3%) |
| $5,000 to $9,999 | 4 (5.8%) | 2 (1.1%) |
| $10,000 to $14,999 | 6 (8.7%) | 5 (2.8%) |
| $15,000 to $19,999 | 1 (1.5%) | 124 (68.9%) |
| $20,000 to $24,999 | 7 (10.1%) | 0 (0.0%) |
| $25,000 to $34,999 | 8 (11.6%) | 10 (5.6%) |
| $35,000 to $49,999 | 18 (26.1%) | 13 (7.2%) |
| $50,000 to $74,999 | 16 (23.2%) | 1 (0.6%) |
| $75,000 to $99,999 | 0 (0.0%) | 0 (0.0%) |
| $100,000 to $149,999 | 7 (10.1%) | 1 (0.6%) |
| $150,000 or more | 0 (0.0%) | 0 (0.0%) |
| Total | 69 (100.0%) | 180 (100.0%) |
Monthly Housing Cost Tiers in Brunswick
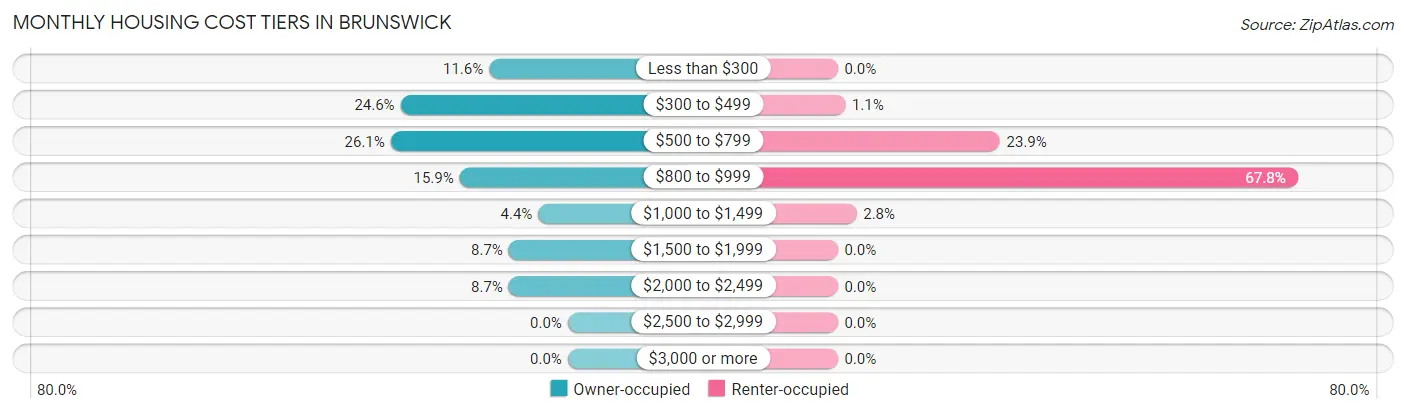
| Monthly Cost | Owner-occupied | Renter-occupied |
| Less than $300 | 8 (11.6%) | 0 (0.0%) |
| $300 to $499 | 17 (24.6%) | 2 (1.1%) |
| $500 to $799 | 18 (26.1%) | 43 (23.9%) |
| $800 to $999 | 11 (15.9%) | 122 (67.8%) |
| $1,000 to $1,499 | 3 (4.3%) | 5 (2.8%) |
| $1,500 to $1,999 | 6 (8.7%) | 0 (0.0%) |
| $2,000 to $2,499 | 6 (8.7%) | 0 (0.0%) |
| $2,500 to $2,999 | 0 (0.0%) | 0 (0.0%) |
| $3,000 or more | 0 (0.0%) | 0 (0.0%) |
| Total | 69 (100.0%) | 180 (100.0%) |
Physical Housing Characteristics in Brunswick
Housing Structures in Brunswick
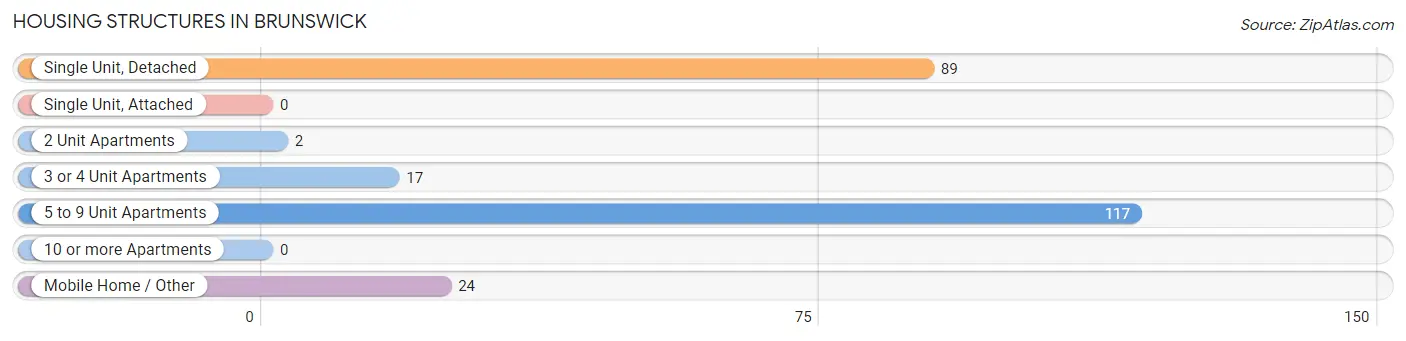
| Structure Type | # Housing Units | % Housing Units |
| Single Unit, Detached | 89 | 35.7% |
| Single Unit, Attached | 0 | 0.0% |
| 2 Unit Apartments | 2 | 0.8% |
| 3 or 4 Unit Apartments | 17 | 6.8% |
| 5 to 9 Unit Apartments | 117 | 47.0% |
| 10 or more Apartments | 0 | 0.0% |
| Mobile Home / Other | 24 | 9.6% |
| Total | 249 | 100.0% |
Housing Structures by Occupancy in Brunswick
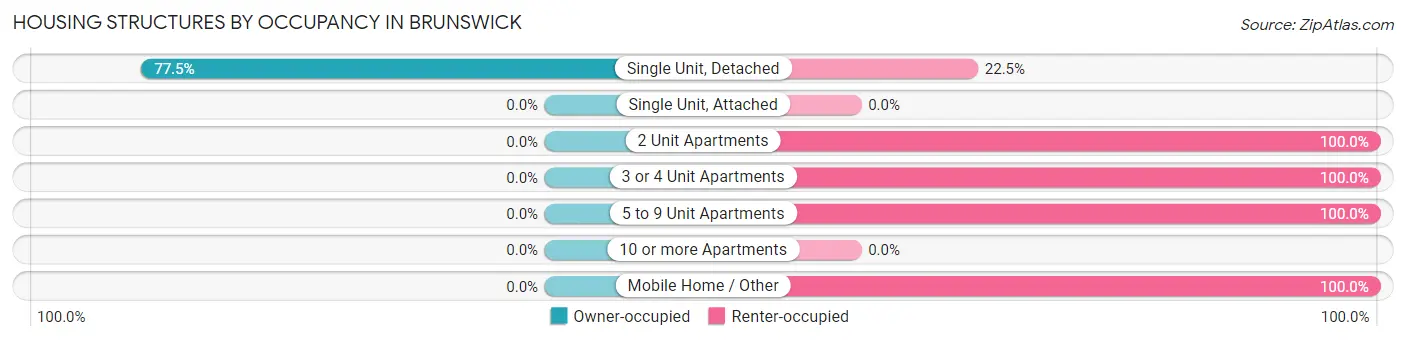
| Structure Type | Owner-occupied | Renter-occupied |
| Single Unit, Detached | 69 (77.5%) | 20 (22.5%) |
| Single Unit, Attached | 0 (0.0%) | 0 (0.0%) |
| 2 Unit Apartments | 0 (0.0%) | 2 (100.0%) |
| 3 or 4 Unit Apartments | 0 (0.0%) | 17 (100.0%) |
| 5 to 9 Unit Apartments | 0 (0.0%) | 117 (100.0%) |
| 10 or more Apartments | 0 (0.0%) | 0 (0.0%) |
| Mobile Home / Other | 0 (0.0%) | 24 (100.0%) |
| Total | 69 (27.7%) | 180 (72.3%) |
Housing Structures by Number of Rooms in Brunswick
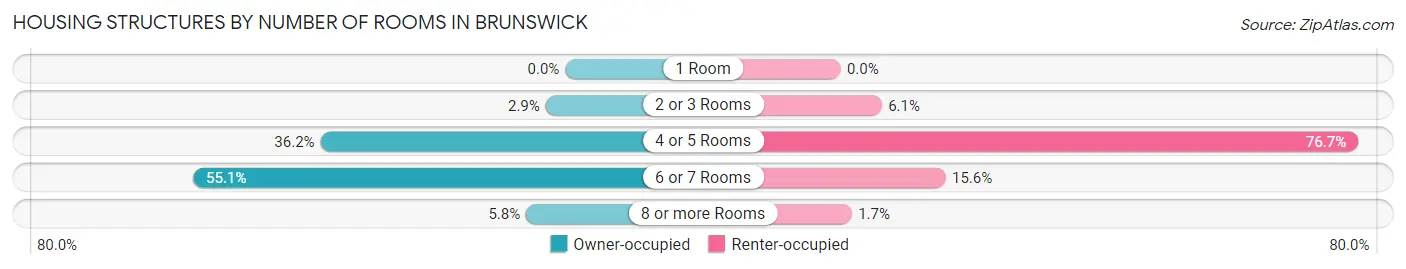
| Number of Rooms | Owner-occupied | Renter-occupied |
| 1 Room | 0 (0.0%) | 0 (0.0%) |
| 2 or 3 Rooms | 2 (2.9%) | 11 (6.1%) |
| 4 or 5 Rooms | 25 (36.2%) | 138 (76.7%) |
| 6 or 7 Rooms | 38 (55.1%) | 28 (15.6%) |
| 8 or more Rooms | 4 (5.8%) | 3 (1.7%) |
| Total | 69 (100.0%) | 180 (100.0%) |
Housing Structure by Heating Type in Brunswick
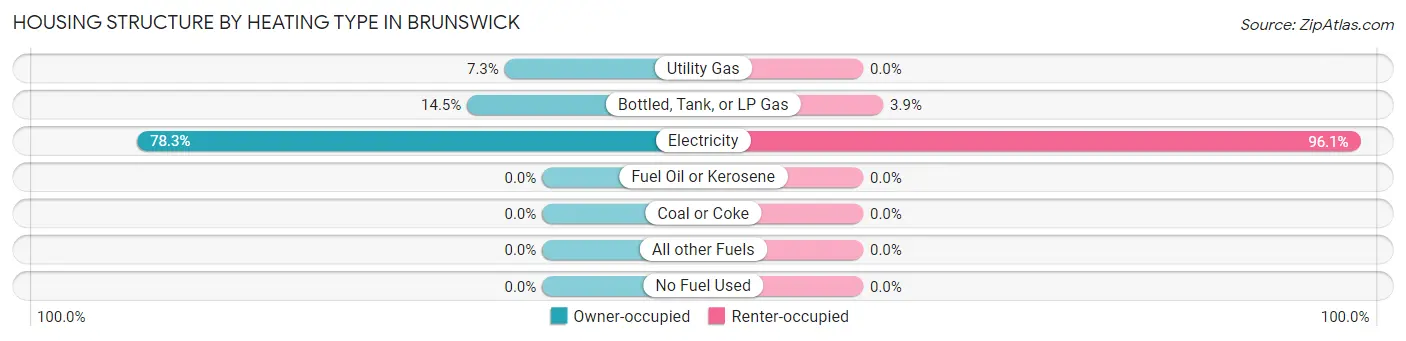
| Heating Type | Owner-occupied | Renter-occupied |
| Utility Gas | 5 (7.2%) | 0 (0.0%) |
| Bottled, Tank, or LP Gas | 10 (14.5%) | 7 (3.9%) |
| Electricity | 54 (78.3%) | 173 (96.1%) |
| Fuel Oil or Kerosene | 0 (0.0%) | 0 (0.0%) |
| Coal or Coke | 0 (0.0%) | 0 (0.0%) |
| All other Fuels | 0 (0.0%) | 0 (0.0%) |
| No Fuel Used | 0 (0.0%) | 0 (0.0%) |
| Total | 69 (100.0%) | 180 (100.0%) |
Household Vehicle Usage in Brunswick
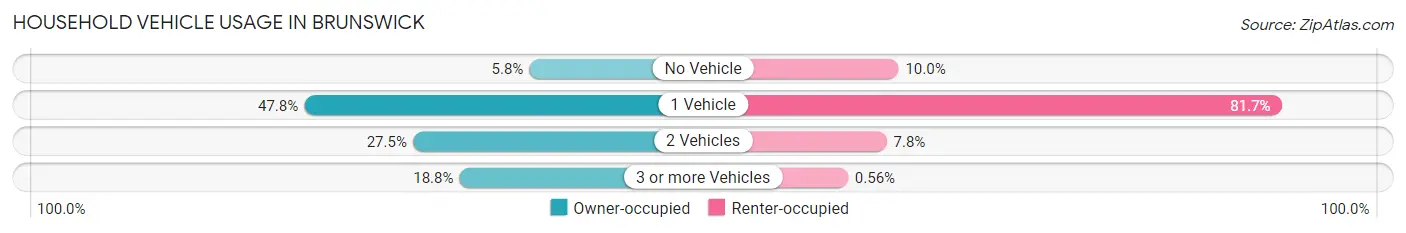
| Vehicles per Household | Owner-occupied | Renter-occupied |
| No Vehicle | 4 (5.8%) | 18 (10.0%) |
| 1 Vehicle | 33 (47.8%) | 147 (81.7%) |
| 2 Vehicles | 19 (27.5%) | 14 (7.8%) |
| 3 or more Vehicles | 13 (18.8%) | 1 (0.6%) |
| Total | 69 (100.0%) | 180 (100.0%) |
Real Estate & Mortgages in Brunswick
Real Estate and Mortgage Overview in Brunswick
| Characteristic | Without Mortgage | With Mortgage |
| Housing Units | 47 | 22 |
| Median Property Value | - | - |
| Median Household Income | $40,417 | $0 |
| Monthly Housing Costs | $488 | $0 |
| Real Estate Taxes | $1,145 | $0 |
Property Value by Mortgage Status in Brunswick
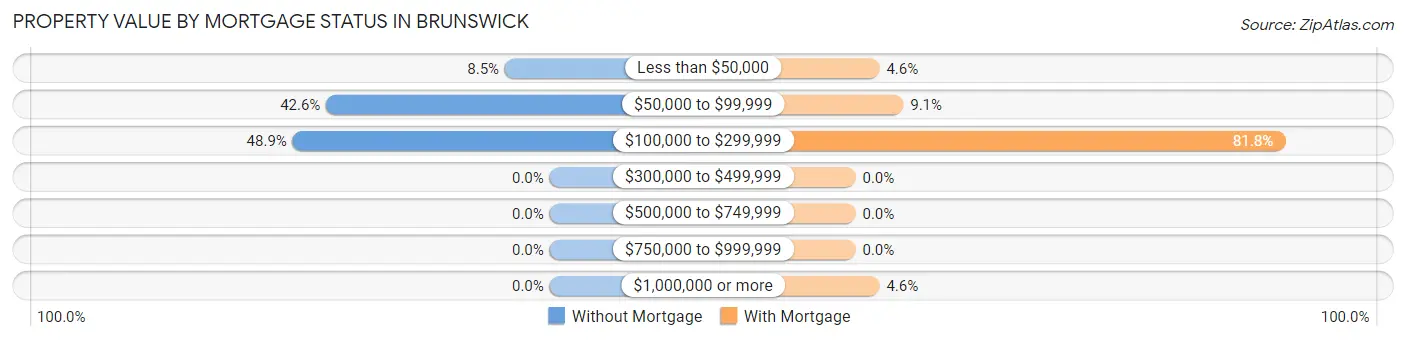
| Property Value | Without Mortgage | With Mortgage |
| Less than $50,000 | 4 (8.5%) | 1 (4.5%) |
| $50,000 to $99,999 | 20 (42.5%) | 2 (9.1%) |
| $100,000 to $299,999 | 23 (48.9%) | 18 (81.8%) |
| $300,000 to $499,999 | 0 (0.0%) | 0 (0.0%) |
| $500,000 to $749,999 | 0 (0.0%) | 0 (0.0%) |
| $750,000 to $999,999 | 0 (0.0%) | 0 (0.0%) |
| $1,000,000 or more | 0 (0.0%) | 1 (4.5%) |
| Total | 47 (100.0%) | 22 (100.0%) |
Household Income by Mortgage Status in Brunswick
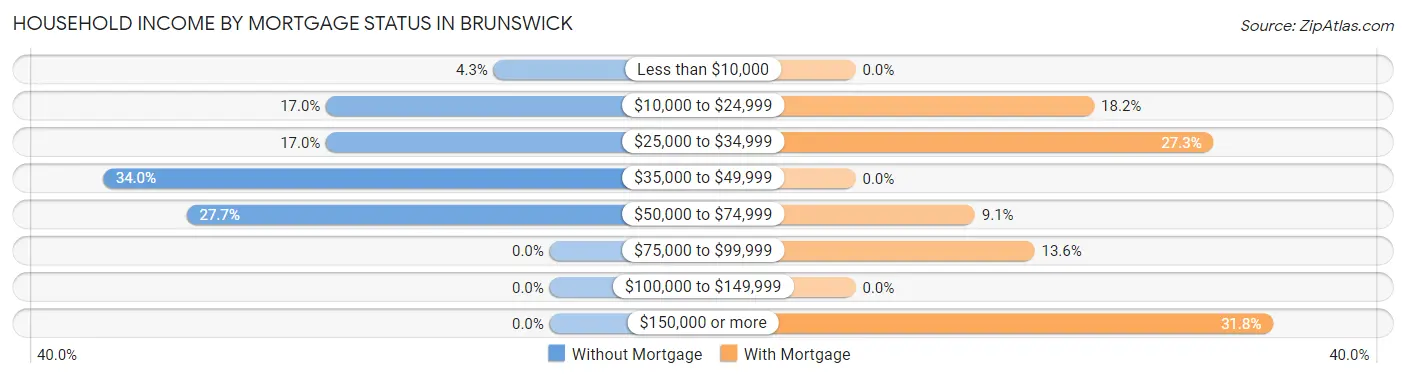
| Household Income | Without Mortgage | With Mortgage |
| Less than $10,000 | 2 (4.3%) | 0 (0.0%) |
| $10,000 to $24,999 | 8 (17.0%) | 4 (18.2%) |
| $25,000 to $34,999 | 8 (17.0%) | 6 (27.3%) |
| $35,000 to $49,999 | 16 (34.0%) | 0 (0.0%) |
| $50,000 to $74,999 | 13 (27.7%) | 2 (9.1%) |
| $75,000 to $99,999 | 0 (0.0%) | 3 (13.6%) |
| $100,000 to $149,999 | 0 (0.0%) | 0 (0.0%) |
| $150,000 or more | 0 (0.0%) | 7 (31.8%) |
| Total | 47 (100.0%) | 22 (100.0%) |
Property Value to Household Income Ratio in Brunswick
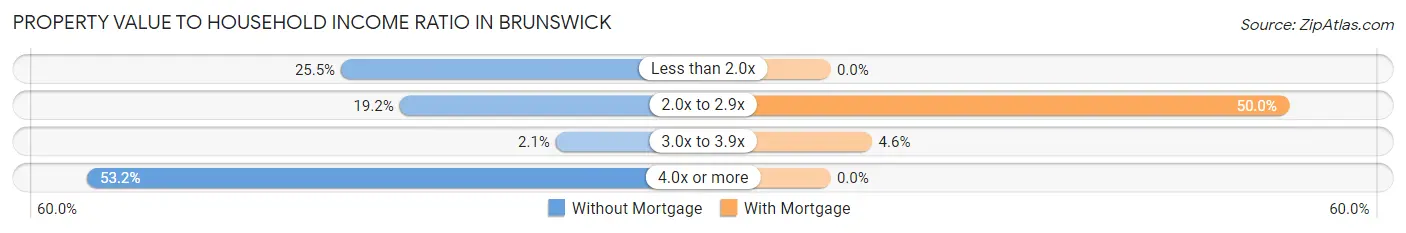
| Value-to-Income Ratio | Without Mortgage | With Mortgage |
| Less than 2.0x | 12 (25.5%) | 0 (0.0%) |
| 2.0x to 2.9x | 9 (19.2%) | 11 (50.0%) |
| 3.0x to 3.9x | 1 (2.1%) | 1 (4.5%) |
| 4.0x or more | 25 (53.2%) | 0 (0.0%) |
| Total | 47 (100.0%) | 22 (100.0%) |
Real Estate Taxes by Mortgage Status in Brunswick
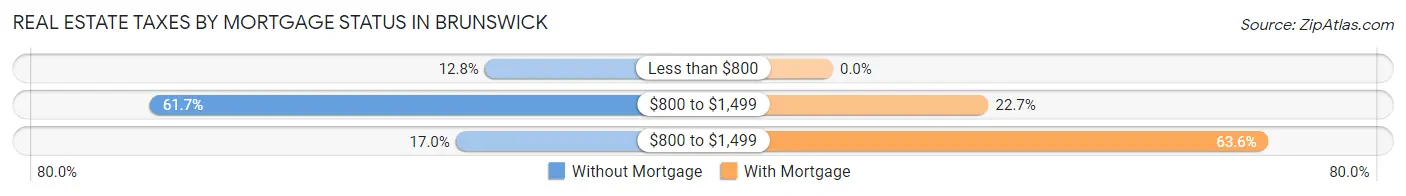
| Property Taxes | Without Mortgage | With Mortgage |
| Less than $800 | 6 (12.8%) | 0 (0.0%) |
| $800 to $1,499 | 29 (61.7%) | 5 (22.7%) |
| $800 to $1,499 | 8 (17.0%) | 14 (63.6%) |
| Total | 47 (100.0%) | 22 (100.0%) |
Health & Disability in Brunswick
Health Insurance Coverage by Age in Brunswick
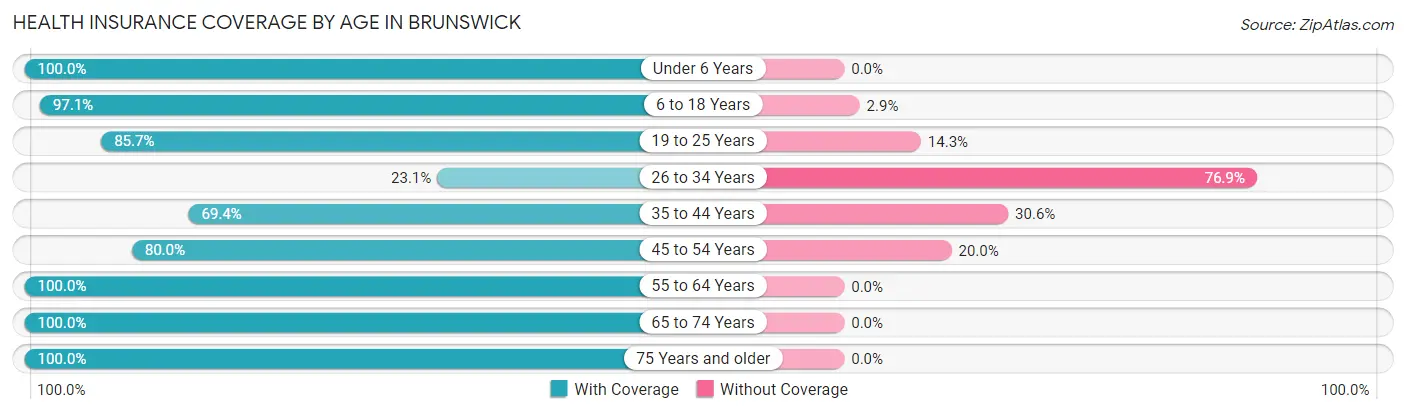
| Age Bracket | With Coverage | Without Coverage |
| Under 6 Years | 52 (100.0%) | 0 (0.0%) |
| 6 to 18 Years | 136 (97.1%) | 4 (2.9%) |
| 19 to 25 Years | 24 (85.7%) | 4 (14.3%) |
| 26 to 34 Years | 36 (23.1%) | 120 (76.9%) |
| 35 to 44 Years | 25 (69.4%) | 11 (30.6%) |
| 45 to 54 Years | 28 (80.0%) | 7 (20.0%) |
| 55 to 64 Years | 33 (100.0%) | 0 (0.0%) |
| 65 to 74 Years | 9 (100.0%) | 0 (0.0%) |
| 75 Years and older | 62 (100.0%) | 0 (0.0%) |
| Total | 405 (73.5%) | 146 (26.5%) |
Health Insurance Coverage by Citizenship Status in Brunswick
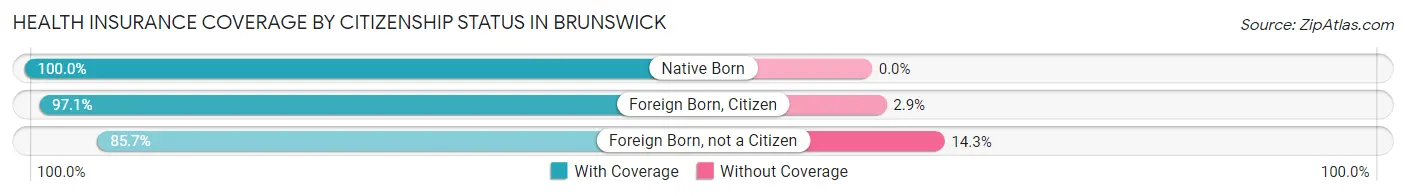
| Citizenship Status | With Coverage | Without Coverage |
| Native Born | 52 (100.0%) | 0 (0.0%) |
| Foreign Born, Citizen | 136 (97.1%) | 4 (2.9%) |
| Foreign Born, not a Citizen | 24 (85.7%) | 4 (14.3%) |
Health Insurance Coverage by Household Income in Brunswick
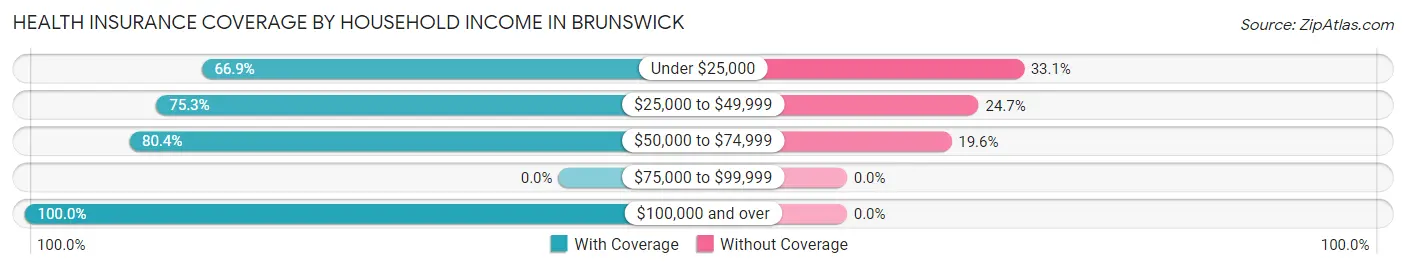
| Household Income | With Coverage | Without Coverage |
| Under $25,000 | 236 (66.9%) | 117 (33.1%) |
| $25,000 to $49,999 | 61 (75.3%) | 20 (24.7%) |
| $50,000 to $74,999 | 37 (80.4%) | 9 (19.6%) |
| $75,000 to $99,999 | 0 (0.0%) | 0 (0.0%) |
| $100,000 and over | 71 (100.0%) | 0 (0.0%) |
Public vs Private Health Insurance Coverage by Age in Brunswick
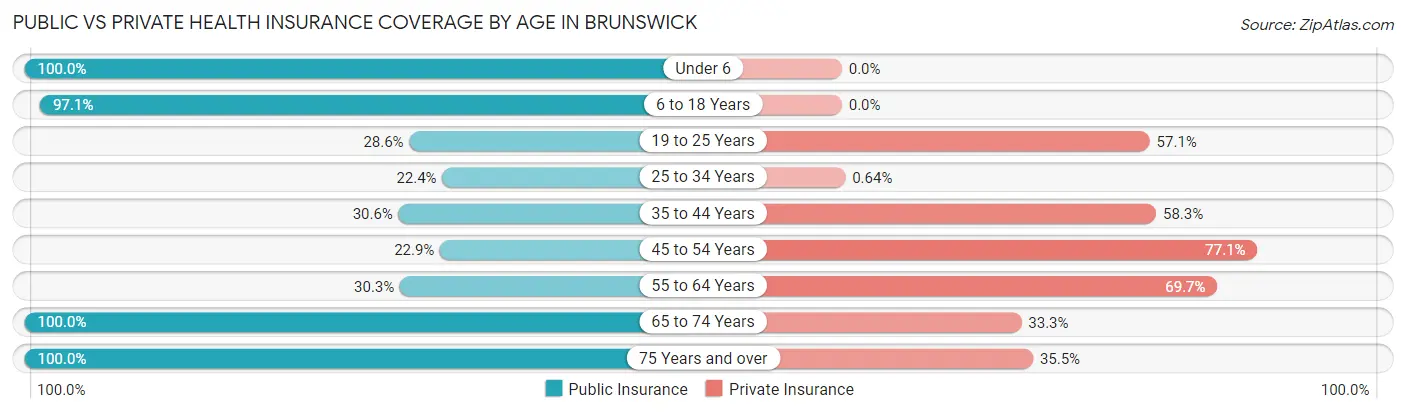
| Age Bracket | Public Insurance | Private Insurance |
| Under 6 | 52 (100.0%) | 0 (0.0%) |
| 6 to 18 Years | 136 (97.1%) | 0 (0.0%) |
| 19 to 25 Years | 8 (28.6%) | 16 (57.1%) |
| 25 to 34 Years | 35 (22.4%) | 1 (0.6%) |
| 35 to 44 Years | 11 (30.6%) | 21 (58.3%) |
| 45 to 54 Years | 8 (22.9%) | 27 (77.1%) |
| 55 to 64 Years | 10 (30.3%) | 23 (69.7%) |
| 65 to 74 Years | 9 (100.0%) | 3 (33.3%) |
| 75 Years and over | 62 (100.0%) | 22 (35.5%) |
| Total | 331 (60.1%) | 113 (20.5%) |
Disability Status by Sex by Age in Brunswick
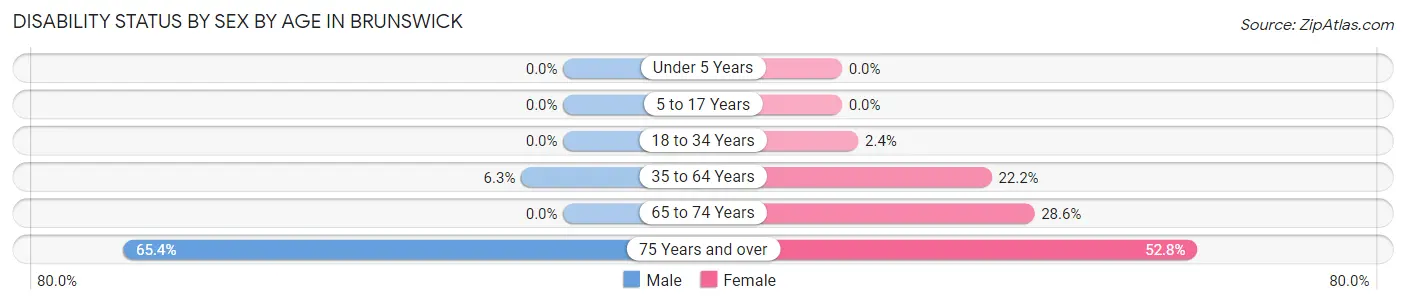
| Age Bracket | Male | Female |
| Under 5 Years | 0 (0.0%) | 0 (0.0%) |
| 5 to 17 Years | 0 (0.0%) | 0 (0.0%) |
| 18 to 34 Years | 0 (0.0%) | 4 (2.4%) |
| 35 to 64 Years | 2 (6.2%) | 16 (22.2%) |
| 65 to 74 Years | 0 (0.0%) | 2 (28.6%) |
| 75 Years and over | 17 (65.4%) | 19 (52.8%) |
Disability Class by Sex by Age in Brunswick
Disability Class: Hearing Difficulty
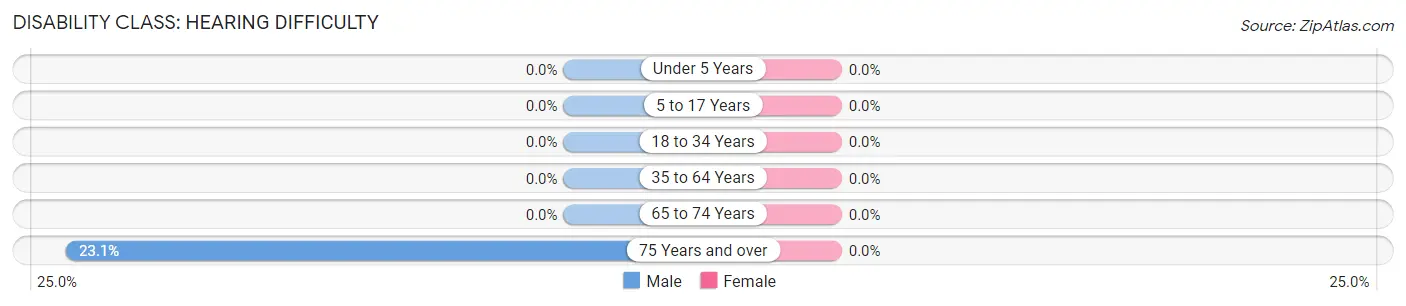
| Age Bracket | Male | Female |
| Under 5 Years | 0 (0.0%) | 0 (0.0%) |
| 5 to 17 Years | 0 (0.0%) | 0 (0.0%) |
| 18 to 34 Years | 0 (0.0%) | 0 (0.0%) |
| 35 to 64 Years | 0 (0.0%) | 0 (0.0%) |
| 65 to 74 Years | 0 (0.0%) | 0 (0.0%) |
| 75 Years and over | 6 (23.1%) | 0 (0.0%) |
Disability Class: Vision Difficulty
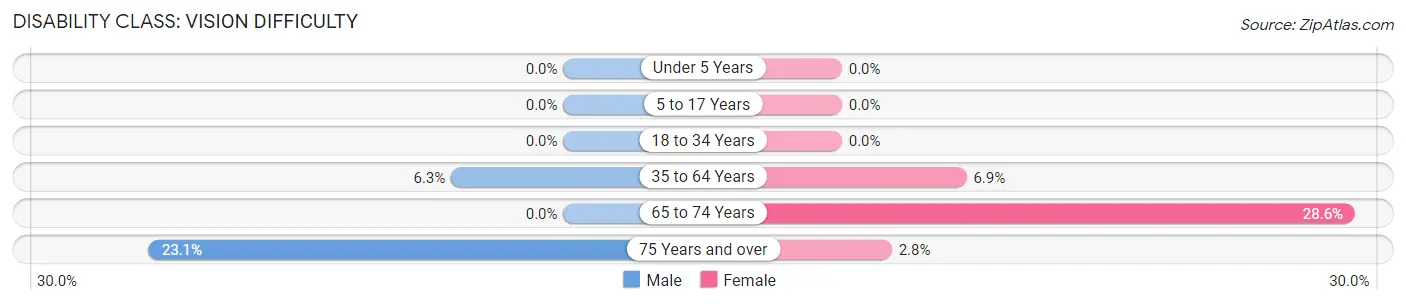
| Age Bracket | Male | Female |
| Under 5 Years | 0 (0.0%) | 0 (0.0%) |
| 5 to 17 Years | 0 (0.0%) | 0 (0.0%) |
| 18 to 34 Years | 0 (0.0%) | 0 (0.0%) |
| 35 to 64 Years | 2 (6.2%) | 5 (6.9%) |
| 65 to 74 Years | 0 (0.0%) | 2 (28.6%) |
| 75 Years and over | 6 (23.1%) | 1 (2.8%) |
Disability Class: Cognitive Difficulty
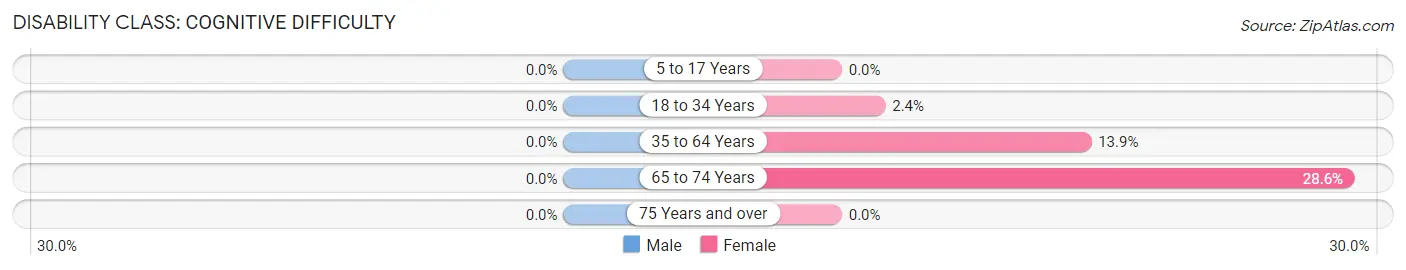
| Age Bracket | Male | Female |
| 5 to 17 Years | 0 (0.0%) | 0 (0.0%) |
| 18 to 34 Years | 0 (0.0%) | 4 (2.4%) |
| 35 to 64 Years | 0 (0.0%) | 10 (13.9%) |
| 65 to 74 Years | 0 (0.0%) | 2 (28.6%) |
| 75 Years and over | 0 (0.0%) | 0 (0.0%) |
Disability Class: Ambulatory Difficulty
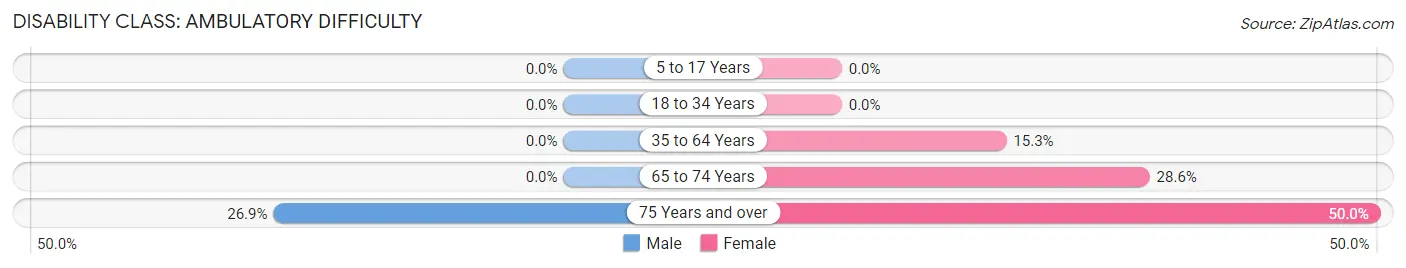
| Age Bracket | Male | Female |
| 5 to 17 Years | 0 (0.0%) | 0 (0.0%) |
| 18 to 34 Years | 0 (0.0%) | 0 (0.0%) |
| 35 to 64 Years | 0 (0.0%) | 11 (15.3%) |
| 65 to 74 Years | 0 (0.0%) | 2 (28.6%) |
| 75 Years and over | 7 (26.9%) | 18 (50.0%) |
Disability Class: Self-Care Difficulty
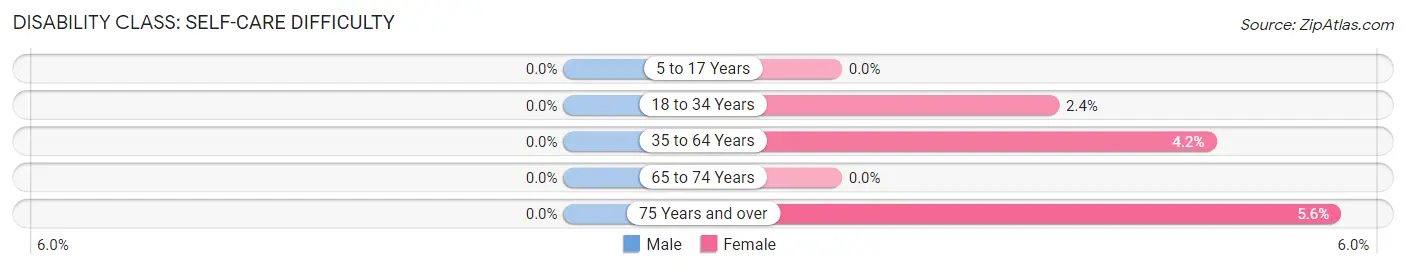
| Age Bracket | Male | Female |
| 5 to 17 Years | 0 (0.0%) | 0 (0.0%) |
| 18 to 34 Years | 0 (0.0%) | 4 (2.4%) |
| 35 to 64 Years | 0 (0.0%) | 3 (4.2%) |
| 65 to 74 Years | 0 (0.0%) | 0 (0.0%) |
| 75 Years and over | 0 (0.0%) | 2 (5.6%) |
Technology Access in Brunswick
Computing Device Access in Brunswick
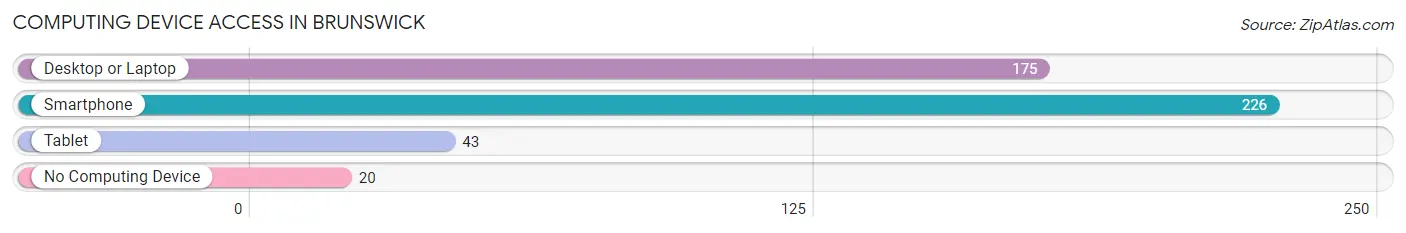
| Device Type | # Households | % Households |
| Desktop or Laptop | 175 | 70.3% |
| Smartphone | 226 | 90.8% |
| Tablet | 43 | 17.3% |
| No Computing Device | 20 | 8.0% |
| Total | 249 | 100.0% |
Internet Access in Brunswick
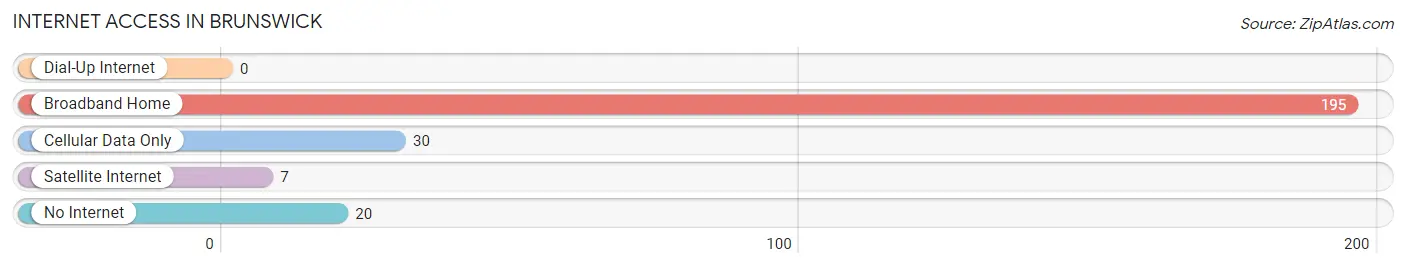
| Internet Type | # Households | % Households |
| Dial-Up Internet | 0 | 0.0% |
| Broadband Home | 195 | 78.3% |
| Cellular Data Only | 30 | 12.0% |
| Satellite Internet | 7 | 2.8% |
| No Internet | 20 | 8.0% |
| Total | 249 | 100.0% |
Brunswick Summary
Brunswick County is located in southeastern North Carolina, along the Atlantic coast. It is bordered by New Hanover County to the north, Columbus County to the west, and Pender County to the south. The county seat is Bolivia, and the largest city is Southport. Brunswick County is part of the Wilmington Metropolitan Statistical Area.
History
Brunswick County was formed in 1764 from parts of Bladen County and New Hanover County. It was named for the British royal house of Brunswick-Lüneburg. The county was originally part of the Cape Fear region, and was home to many Native American tribes, including the Waccamaw, Cape Fear, and Catawba.
The county was home to many early settlers, including the Moore family, who established the town of Southport in 1792. The town was a major port for the export of naval stores, such as tar, pitch, and turpentine. The county was also home to many plantations, which relied on the labor of enslaved African Americans.
Geography
Brunswick County covers an area of 845 square miles, making it the largest county in North Carolina. The county is located along the Atlantic coast, and is bordered by New Hanover County to the north, Columbus County to the west, and Pender County to the south. The county is divided into two distinct regions: the coastal plain and the sandhills. The coastal plain is characterized by flat, sandy terrain, while the sandhills are characterized by rolling hills and pine forests.
The county is home to several rivers, including the Cape Fear, the Northeast Cape Fear, and the Shallotte. The county is also home to several lakes, including Lake Waccamaw, Lake Tabor, and Lake Sutton.
Economy
Brunswick County has a diverse economy, with industries ranging from agriculture to tourism. The county is home to several large agricultural operations, including hog farms, poultry farms, and vegetable farms. The county is also home to several manufacturing companies, including Brunswick Boat Group, which produces boats and marine engines.
Tourism is a major industry in the county, with visitors drawn to the area's beaches, fishing, and other outdoor activities. The county is also home to several golf courses, including the Ocean Ridge Plantation and the Sea Trail Plantation.
Demographics
As of the 2010 census, Brunswick County had a population of 107,431. The population is predominantly white (77.3%), with African Americans making up 19.2% of the population. Other racial groups include Native Americans (1.2%), Asians (1.1%), and Hispanics (1.1%).
The median household income in the county is $45,845, and the median home value is $179,400. The unemployment rate is 5.2%. The county is home to several colleges and universities, including Brunswick Community College and the University of North Carolina at Wilmington.
Common Questions
What is Per Capita Income in Brunswick?
Per Capita income in Brunswick is $8,641.
What is the Median Family Income in Brunswick?
Median Family Income in Brunswick is $16,260.
What is the Median Household income in Brunswick?
Median Household Income in Brunswick is $16,643.
What is Income or Wage Gap in Brunswick?
Income or Wage Gap in Brunswick is 26.9%.
Women in Brunswick earn 73.1 cents for every dollar earned by a man.
What is Inequality or Gini Index in Brunswick?
Inequality or Gini Index in Brunswick is 0.42.
What is the Total Population of Brunswick?
Total Population of Brunswick is 1,233.
What is the Total Male Population of Brunswick?
Total Male Population of Brunswick is 884.
What is the Total Female Population of Brunswick?
Total Female Population of Brunswick is 349.
What is the Ratio of Males per 100 Females in Brunswick?
There are 253.30 Males per 100 Females in Brunswick.
What is the Ratio of Females per 100 Males in Brunswick?
There are 39.48 Females per 100 Males in Brunswick.
What is the Median Population Age in Brunswick?
Median Population Age in Brunswick is 33.0 Years.
What is the Average Family Size in Brunswick
Average Family Size in Brunswick is 2.6 People.
What is the Average Household Size in Brunswick
Average Household Size in Brunswick is 2.2 People.
How Large is the Labor Force in Brunswick?
There are 230 People in the Labor Forcein in Brunswick.
What is the Percentage of People in the Labor Force in Brunswick?
21.8% of People are in the Labor Force in Brunswick.
What is the Unemployment Rate in Brunswick?
Unemployment Rate in Brunswick is 6.1%.