Edenton, NC Map & Demographics
Edenton Map
Edenton Overview
$29,316
PER CAPITA INCOME
$40,682
AVG FAMILY INCOME
$46,979
AVG HOUSEHOLD INCOME
57.9%
WAGE / INCOME GAP [ % ]
42.1¢/ $1
WAGE / INCOME GAP [ $ ]
0.53
INEQUALITY / GINI INDEX
4,512
TOTAL POPULATION
2,148
MALE POPULATION
2,364
FEMALE POPULATION
90.86
MALES / 100 FEMALES
110.06
FEMALES / 100 MALES
45.5
MEDIAN AGE
2.5
AVG FAMILY SIZE
1.9
AVG HOUSEHOLD SIZE
2,084
LABOR FORCE [ PEOPLE ]
56.2%
PERCENT IN LABOR FORCE
6.2%
UNEMPLOYMENT RATE
Edenton Zip Codes
Edenton Area Codes
Income in Edenton
Income Overview in Edenton
Per Capita Income in Edenton is $29,316, while median incomes of families and households are $40,682 and $46,979 respectively.
| Characteristic | Number | Measure |
| Per Capita Income | 4,512 | $29,316 |
| Median Family Income | 1,244 | $40,682 |
| Mean Family Income | 1,244 | $68,222 |
| Median Household Income | 2,210 | $46,979 |
| Mean Household Income | 2,210 | $57,613 |
| Income Deficit | 1,244 | $0 |
| Wage / Income Gap (%) | 4,512 | 57.94% |
| Wage / Income Gap ($) | 4,512 | 42.06¢ per $1 |
| Gini / Inequality Index | 4,512 | 0.53 |
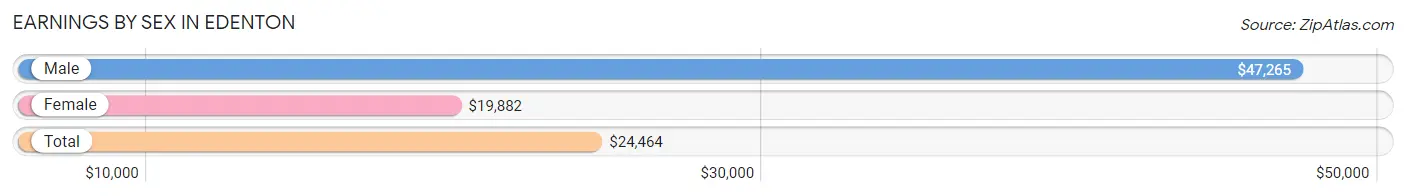
Earnings by Sex in Edenton
Average Earnings in Edenton are $24,464, $47,265 for men and $19,882 for women, a difference of 57.9%.
| Sex | Number | Average Earnings |
| Male | 983 (43.1%) | $47,265 |
| Female | 1,300 (56.9%) | $19,882 |
| Total | 2,283 (100.0%) | $24,464 |
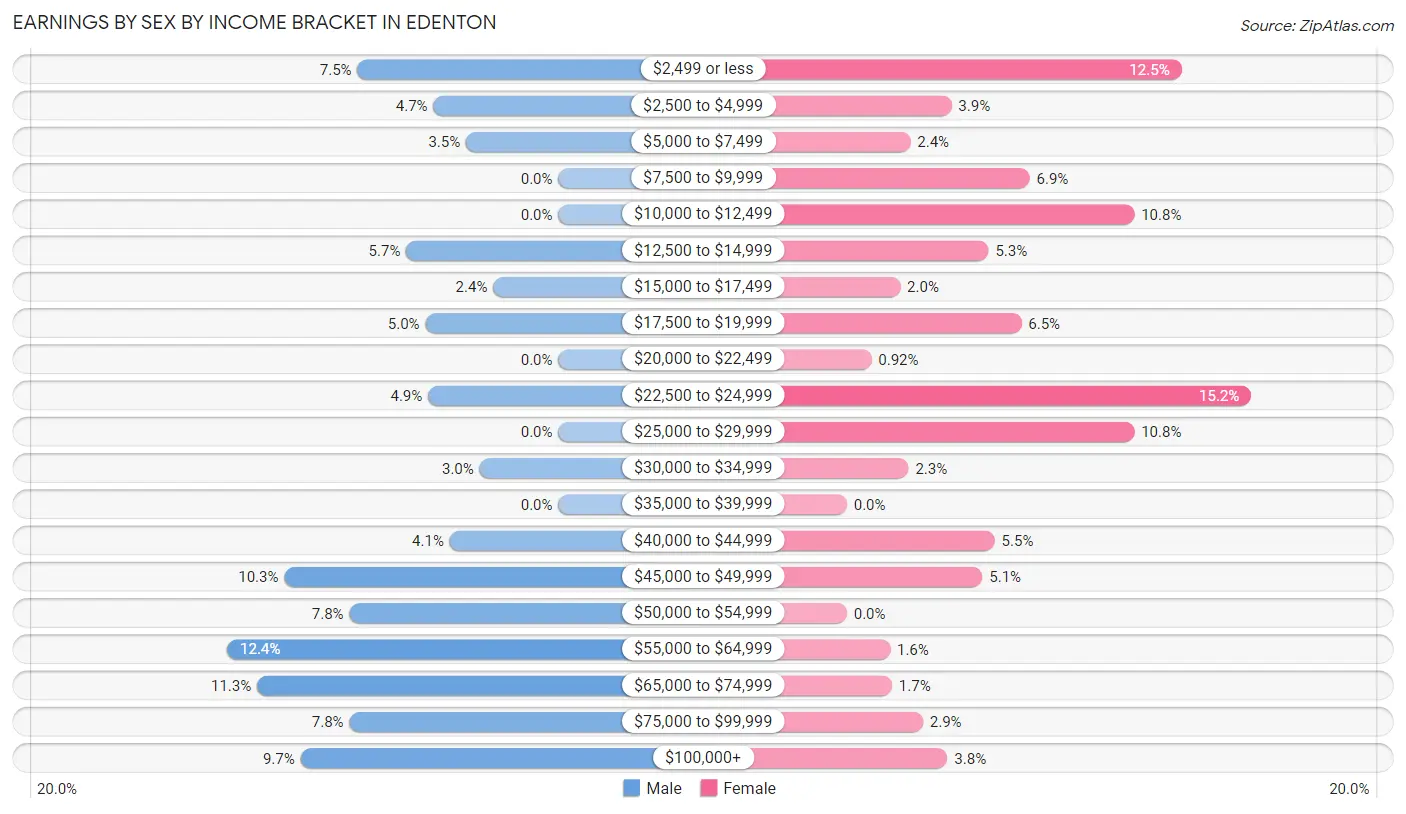
Earnings by Sex by Income Bracket in Edenton
The most common earnings brackets in Edenton are $55,000 to $64,999 for men (122 | 12.4%) and $22,500 to $24,999 for women (197 | 15.1%).
| Income | Male | Female |
| $2,499 or less | 74 (7.5%) | 163 (12.5%) |
| $2,500 to $4,999 | 46 (4.7%) | 51 (3.9%) |
| $5,000 to $7,499 | 34 (3.5%) | 31 (2.4%) |
| $7,500 to $9,999 | 0 (0.0%) | 89 (6.9%) |
| $10,000 to $12,499 | 0 (0.0%) | 140 (10.8%) |
| $12,500 to $14,999 | 56 (5.7%) | 69 (5.3%) |
| $15,000 to $17,499 | 24 (2.4%) | 26 (2.0%) |
| $17,500 to $19,999 | 49 (5.0%) | 85 (6.5%) |
| $20,000 to $22,499 | 0 (0.0%) | 12 (0.9%) |
| $22,500 to $24,999 | 48 (4.9%) | 197 (15.1%) |
| $25,000 to $29,999 | 0 (0.0%) | 140 (10.8%) |
| $30,000 to $34,999 | 29 (2.9%) | 30 (2.3%) |
| $35,000 to $39,999 | 0 (0.0%) | 0 (0.0%) |
| $40,000 to $44,999 | 40 (4.1%) | 72 (5.5%) |
| $45,000 to $49,999 | 101 (10.3%) | 66 (5.1%) |
| $50,000 to $54,999 | 77 (7.8%) | 0 (0.0%) |
| $55,000 to $64,999 | 122 (12.4%) | 21 (1.6%) |
| $65,000 to $74,999 | 111 (11.3%) | 22 (1.7%) |
| $75,000 to $99,999 | 77 (7.8%) | 37 (2.9%) |
| $100,000+ | 95 (9.7%) | 49 (3.8%) |
| Total | 983 (100.0%) | 1,300 (100.0%) |
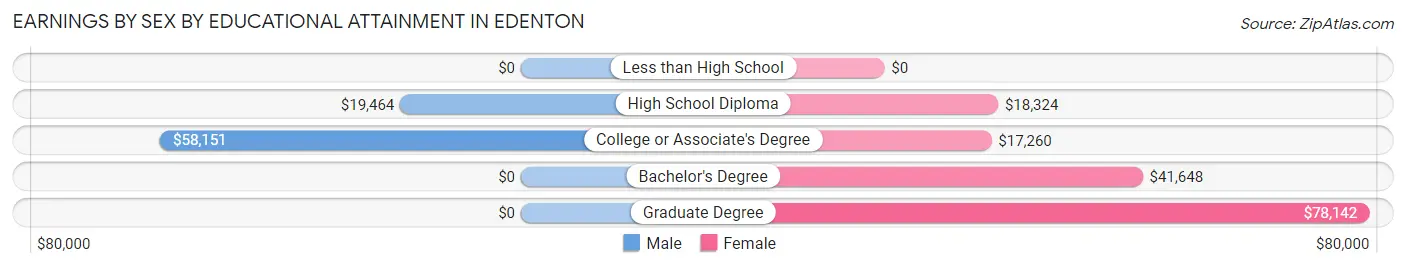
Earnings by Sex by Educational Attainment in Edenton
Average earnings in Edenton are $47,265 for men and $22,551 for women, a difference of 52.3%. Men with an educational attainment of college or associate's degree enjoy the highest average annual earnings of $58,151, while those with high school diploma education earn the least with $19,464. Women with an educational attainment of graduate degree earn the most with the average annual earnings of $78,142, while those with college or associate's degree education have the smallest earnings of $17,260.
| Educational Attainment | Male Income | Female Income |
| Less than High School | - | - |
| High School Diploma | $19,464 | $18,324 |
| College or Associate's Degree | $58,151 | $17,260 |
| Bachelor's Degree | - | - |
| Graduate Degree | - | - |
| Total | $47,265 | $22,551 |
Family Income in Edenton
Family Income Brackets in Edenton
According to the Edenton family income data, there are 202 families falling into the $35,000 to $49,999 income range, which is the most common income bracket and makes up 16.2% of all families. Conversely, the $150,000 to $199,999 income bracket is the least frequent group with only 31 families (2.5%) belonging to this category.
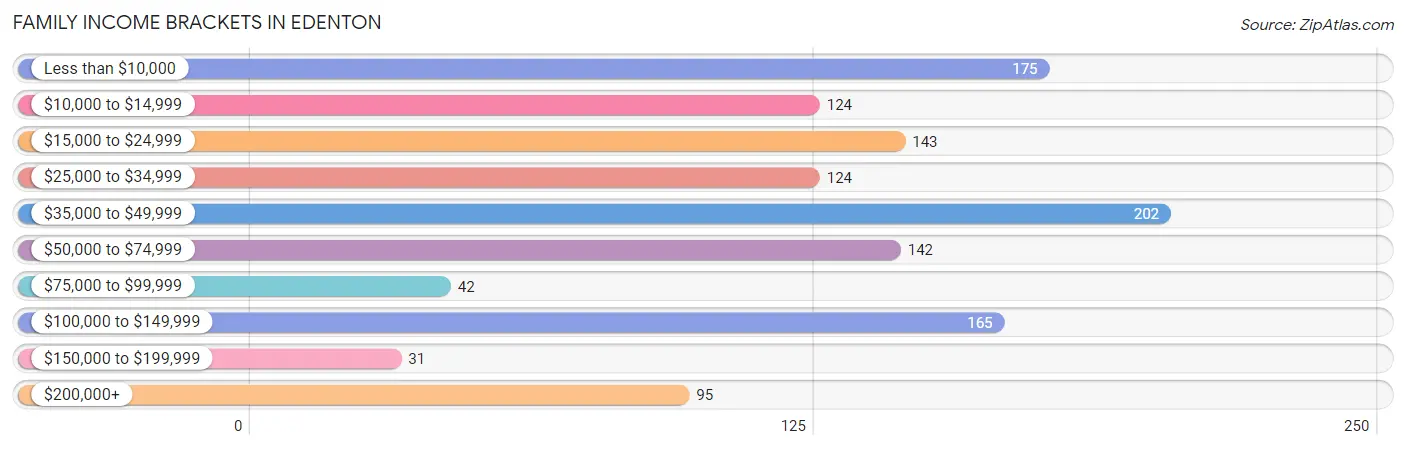
| Income Bracket | # Families | % Families |
| Less than $10,000 | 175 | 14.1% |
| $10,000 to $14,999 | 124 | 10.0% |
| $15,000 to $24,999 | 143 | 11.5% |
| $25,000 to $34,999 | 124 | 10.0% |
| $35,000 to $49,999 | 202 | 16.2% |
| $50,000 to $74,999 | 142 | 11.4% |
| $75,000 to $99,999 | 42 | 3.4% |
| $100,000 to $149,999 | 165 | 13.3% |
| $150,000 to $199,999 | 31 | 2.5% |
| $200,000+ | 95 | 7.6% |
Family Income by Famaliy Size in Edenton
3-person families (314 | 25.2%) account for the highest median family income in Edenton with $47,801 per family, while 2-person families (806 | 64.8%) have the highest median income of $17,154 per family member.
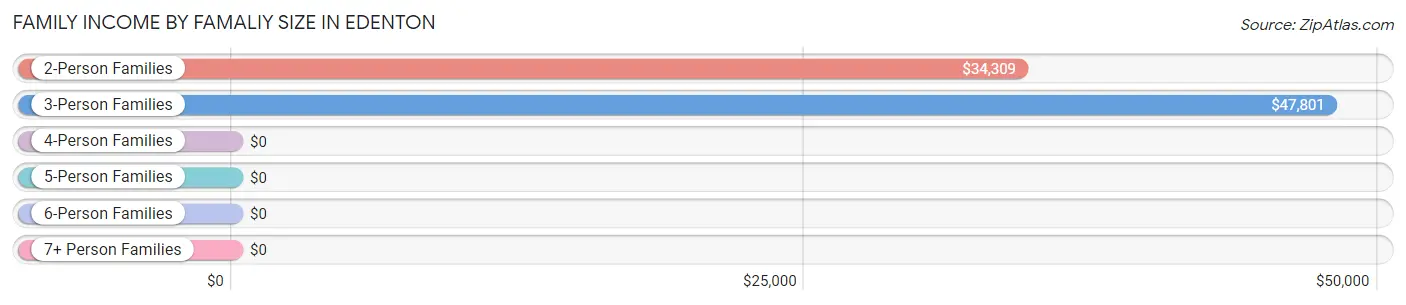
| Income Bracket | # Families | Median Income |
| 2-Person Families | 806 (64.8%) | $34,309 |
| 3-Person Families | 314 (25.2%) | $47,801 |
| 4-Person Families | 118 (9.5%) | $0 |
| 5-Person Families | 6 (0.5%) | $0 |
| 6-Person Families | 0 (0.0%) | $0 |
| 7+ Person Families | 0 (0.0%) | $0 |
| Total | 1,244 (100.0%) | $40,682 |
Family Income by Number of Earners in Edenton
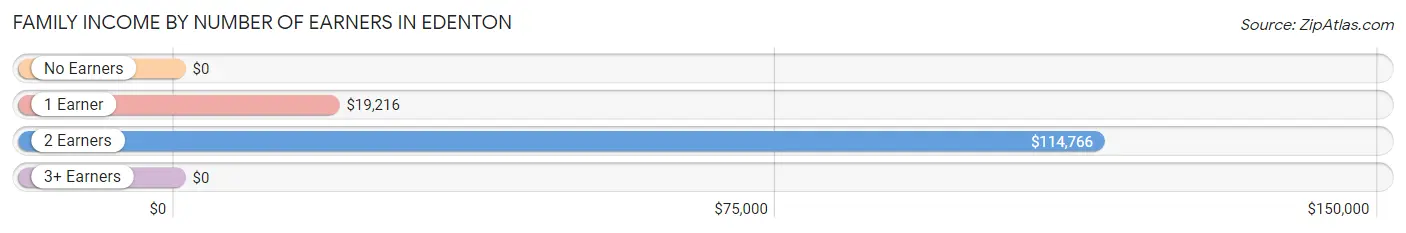
| Number of Earners | # Families | Median Income |
| No Earners | 201 (16.2%) | $0 |
| 1 Earner | 604 (48.5%) | $19,216 |
| 2 Earners | 387 (31.1%) | $114,766 |
| 3+ Earners | 52 (4.2%) | $0 |
| Total | 1,244 (100.0%) | $40,682 |
Household Income in Edenton
Household Income Brackets in Edenton
With 422 households falling in the category, the $50,000 to $74,999 income range is the most frequent in Edenton, accounting for 19.1% of all households. In contrast, only 66 households (3.0%) fall into the $150,000 to $199,999 income bracket, making it the least populous group.
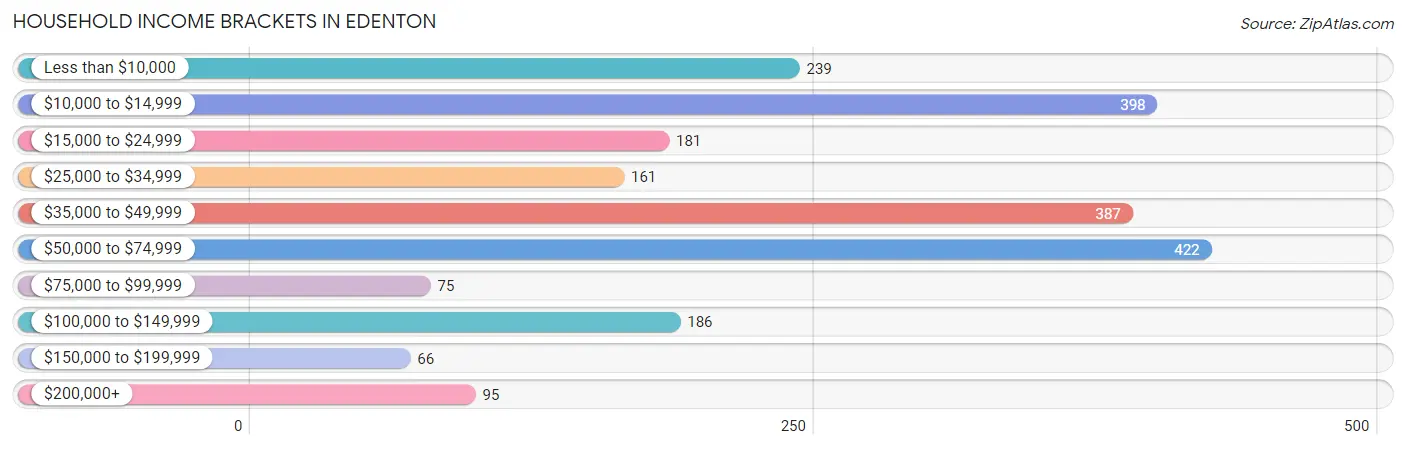
| Income Bracket | # Households | % Households |
| Less than $10,000 | 239 | 10.8% |
| $10,000 to $14,999 | 398 | 18.0% |
| $15,000 to $24,999 | 181 | 8.2% |
| $25,000 to $34,999 | 161 | 7.3% |
| $35,000 to $49,999 | 387 | 17.5% |
| $50,000 to $74,999 | 422 | 19.1% |
| $75,000 to $99,999 | 75 | 3.4% |
| $100,000 to $149,999 | 186 | 8.4% |
| $150,000 to $199,999 | 66 | 3.0% |
| $200,000+ | 95 | 4.3% |
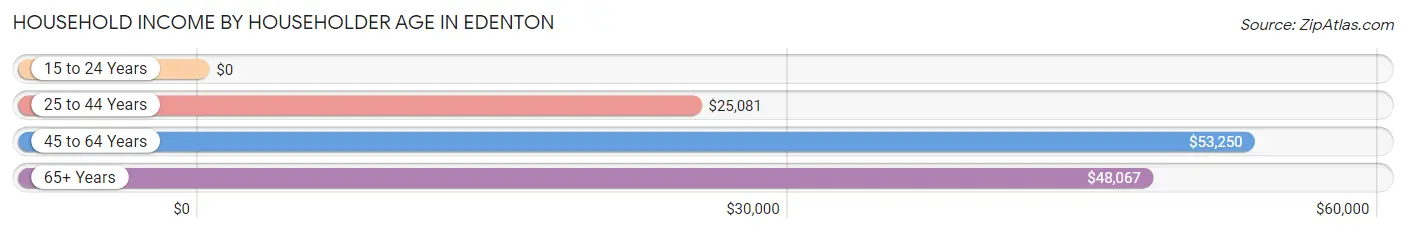
Household Income by Householder Age in Edenton
The median household income in Edenton is $46,979, with the highest median household income of $53,250 found in the 45 to 64 years age bracket for the primary householder. A total of 649 households (29.4%) fall into this category.
| Income Bracket | # Households | Median Income |
| 15 to 24 Years | 0 (0.0%) | $0 |
| 25 to 44 Years | 743 (33.6%) | $25,081 |
| 45 to 64 Years | 649 (29.4%) | $53,250 |
| 65+ Years | 818 (37.0%) | $48,067 |
| Total | 2,210 (100.0%) | $46,979 |
Poverty in Edenton
Income Below Poverty by Sex and Age in Edenton
With 27.3% poverty level for males and 45.4% for females among the residents of Edenton, 16 and 17 year old males and under 5 year old females are the most vulnerable to poverty, with 76 males (100.0%) and 140 females (100.0%) in their respective age groups living below the poverty level.
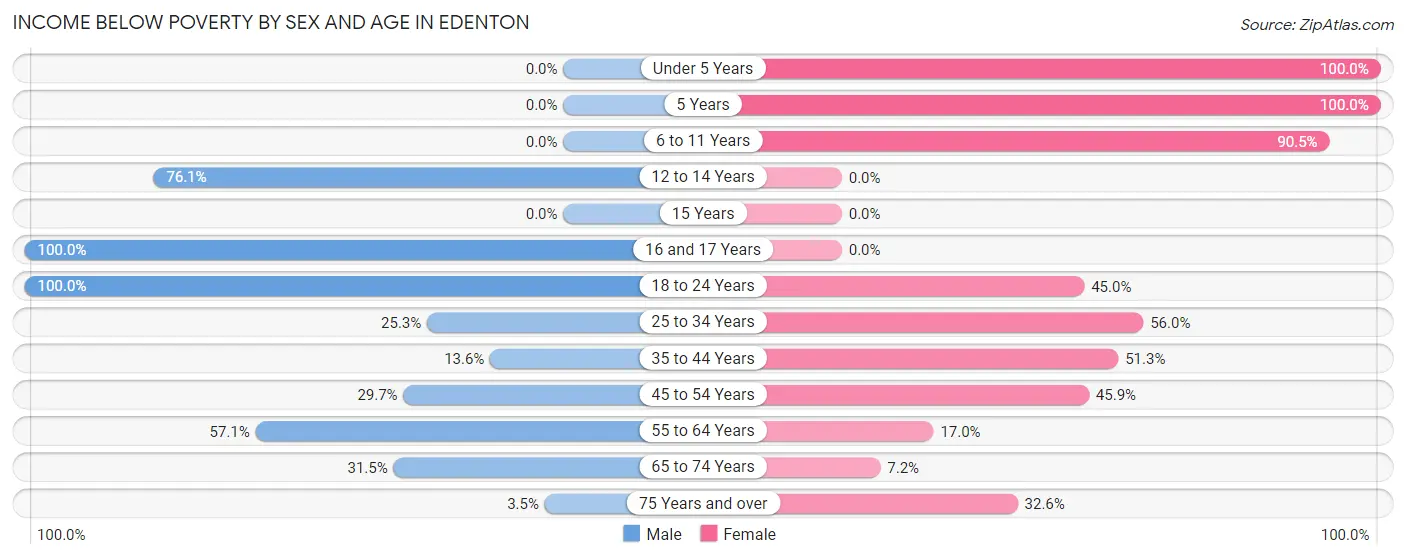
| Age Bracket | Male | Female |
| Under 5 Years | 0 (0.0%) | 140 (100.0%) |
| 5 Years | 0 (0.0%) | 106 (100.0%) |
| 6 to 11 Years | 0 (0.0%) | 124 (90.5%) |
| 12 to 14 Years | 35 (76.1%) | 0 (0.0%) |
| 15 Years | 0 (0.0%) | 0 (0.0%) |
| 16 and 17 Years | 76 (100.0%) | 0 (0.0%) |
| 18 to 24 Years | 43 (100.0%) | 18 (45.0%) |
| 25 to 34 Years | 87 (25.3%) | 207 (55.9%) |
| 35 to 44 Years | 33 (13.6%) | 137 (51.3%) |
| 45 to 54 Years | 84 (29.7%) | 139 (45.9%) |
| 55 to 64 Years | 100 (57.1%) | 41 (17.0%) |
| 65 to 74 Years | 104 (31.5%) | 29 (7.2%) |
| 75 Years and over | 6 (3.5%) | 62 (32.6%) |
| Total | 568 (27.3%) | 1,003 (45.4%) |
Income Above Poverty by Sex and Age in Edenton
According to the poverty statistics in Edenton, males aged under 5 years and females aged 12 to 14 years are the age groups that are most secure financially, with 100.0% of males and 100.0% of females in these age groups living above the poverty line.
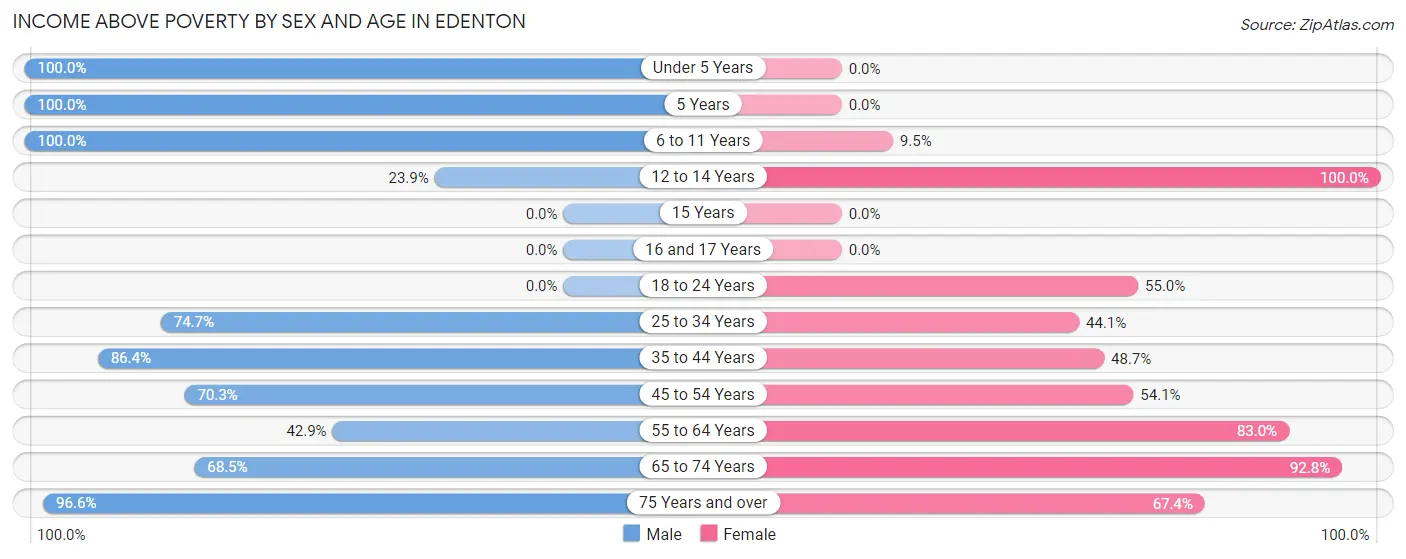
| Age Bracket | Male | Female |
| Under 5 Years | 149 (100.0%) | 0 (0.0%) |
| 5 Years | 58 (100.0%) | 0 (0.0%) |
| 6 to 11 Years | 157 (100.0%) | 13 (9.5%) |
| 12 to 14 Years | 11 (23.9%) | 11 (100.0%) |
| 15 Years | 0 (0.0%) | 0 (0.0%) |
| 16 and 17 Years | 0 (0.0%) | 0 (0.0%) |
| 18 to 24 Years | 0 (0.0%) | 22 (55.0%) |
| 25 to 34 Years | 257 (74.7%) | 163 (44.1%) |
| 35 to 44 Years | 210 (86.4%) | 130 (48.7%) |
| 45 to 54 Years | 199 (70.3%) | 164 (54.1%) |
| 55 to 64 Years | 75 (42.9%) | 200 (83.0%) |
| 65 to 74 Years | 226 (68.5%) | 376 (92.8%) |
| 75 Years and over | 168 (96.6%) | 128 (67.4%) |
| Total | 1,510 (72.7%) | 1,207 (54.6%) |
Income Below Poverty Among Married-Couple Families in Edenton
The poverty statistics for married-couple families in Edenton show that 13.1% or 73 of the total 558 families live below the poverty line. Families with 1 or 2 children have the highest poverty rate of 41.5%, comprising of 44 families. On the other hand, families with 3 or 4 children have the lowest poverty rate of 0.0%, which includes 0 families.
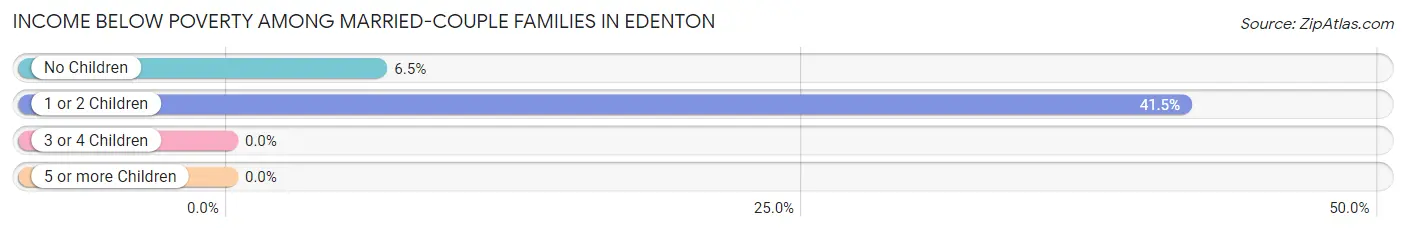
| Children | Above Poverty | Below Poverty |
| No Children | 417 (93.5%) | 29 (6.5%) |
| 1 or 2 Children | 62 (58.5%) | 44 (41.5%) |
| 3 or 4 Children | 6 (100.0%) | 0 (0.0%) |
| 5 or more Children | 0 (0.0%) | 0 (0.0%) |
| Total | 485 (86.9%) | 73 (13.1%) |
Income Below Poverty Among Single-Parent Households in Edenton
According to the poverty data in Edenton, 46.8% or 73 single-father households and 52.6% or 279 single-mother households are living below the poverty line. Among single-father households, those with no children have the highest poverty rate, with 73 households (100.0%) experiencing poverty. Likewise, among single-mother households, those with 1 or 2 children have the highest poverty rate, with 279 households (73.4%) falling below the poverty line.
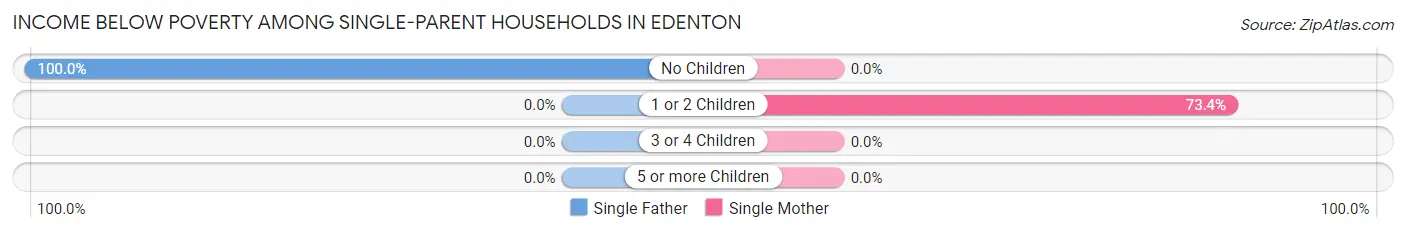
| Children | Single Father | Single Mother |
| No Children | 73 (100.0%) | 0 (0.0%) |
| 1 or 2 Children | 0 (0.0%) | 279 (73.4%) |
| 3 or 4 Children | 0 (0.0%) | 0 (0.0%) |
| 5 or more Children | 0 (0.0%) | 0 (0.0%) |
| Total | 73 (46.8%) | 279 (52.6%) |
Income Below Poverty Among Married-Couple vs Single-Parent Households in Edenton
The poverty data for Edenton shows that 73 of the married-couple family households (13.1%) and 352 of the single-parent households (51.3%) are living below the poverty level. Within the married-couple family households, those with 1 or 2 children have the highest poverty rate, with 44 households (41.5%) falling below the poverty line. Among the single-parent households, those with 1 or 2 children have the highest poverty rate, with 279 household (60.3%) living below poverty.
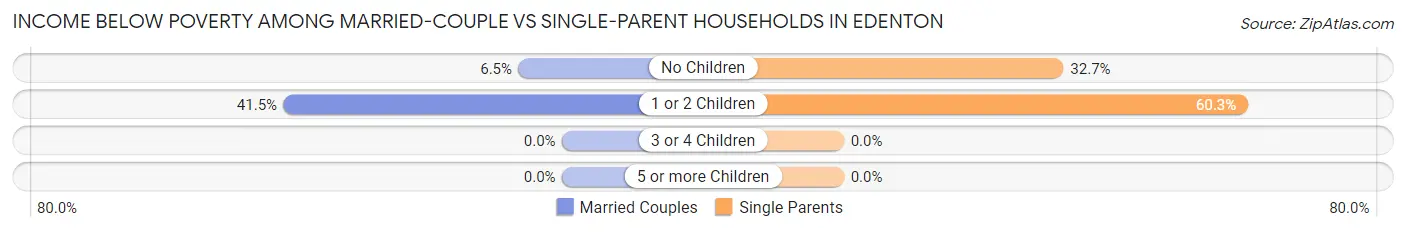
| Children | Married-Couple Families | Single-Parent Households |
| No Children | 29 (6.5%) | 73 (32.7%) |
| 1 or 2 Children | 44 (41.5%) | 279 (60.3%) |
| 3 or 4 Children | 0 (0.0%) | 0 (0.0%) |
| 5 or more Children | 0 (0.0%) | 0 (0.0%) |
| Total | 73 (13.1%) | 352 (51.3%) |
Race in Edenton
The most populous races in Edenton are Black / African American (2,605 | 57.7%), White / Caucasian (1,896 | 42.0%), and Hispanic or Latino (11 | 0.2%).
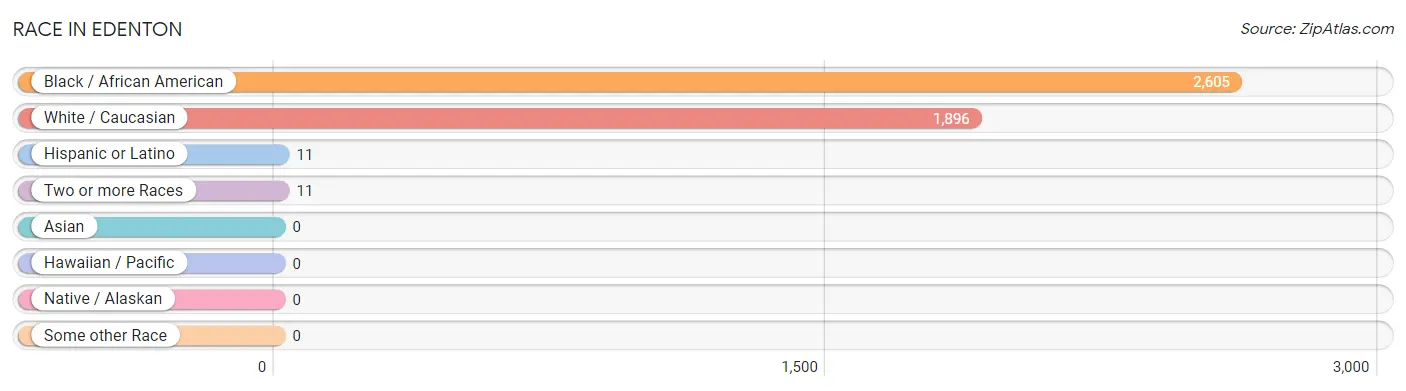
| Race | # Population | % Population |
| Asian | 0 | 0.0% |
| Black / African American | 2,605 | 57.7% |
| Hawaiian / Pacific | 0 | 0.0% |
| Hispanic or Latino | 11 | 0.2% |
| Native / Alaskan | 0 | 0.0% |
| White / Caucasian | 1,896 | 42.0% |
| Two or more Races | 11 | 0.2% |
| Some other Race | 0 | 0.0% |
| Total | 4,512 | 100.0% |
Ancestry in Edenton
The most populous ancestries reported in Edenton are English (588 | 13.0%), American (243 | 5.4%), Irish (223 | 4.9%), German (221 | 4.9%), and Scotch-Irish (174 | 3.9%), together accounting for 32.1% of all Edenton residents.
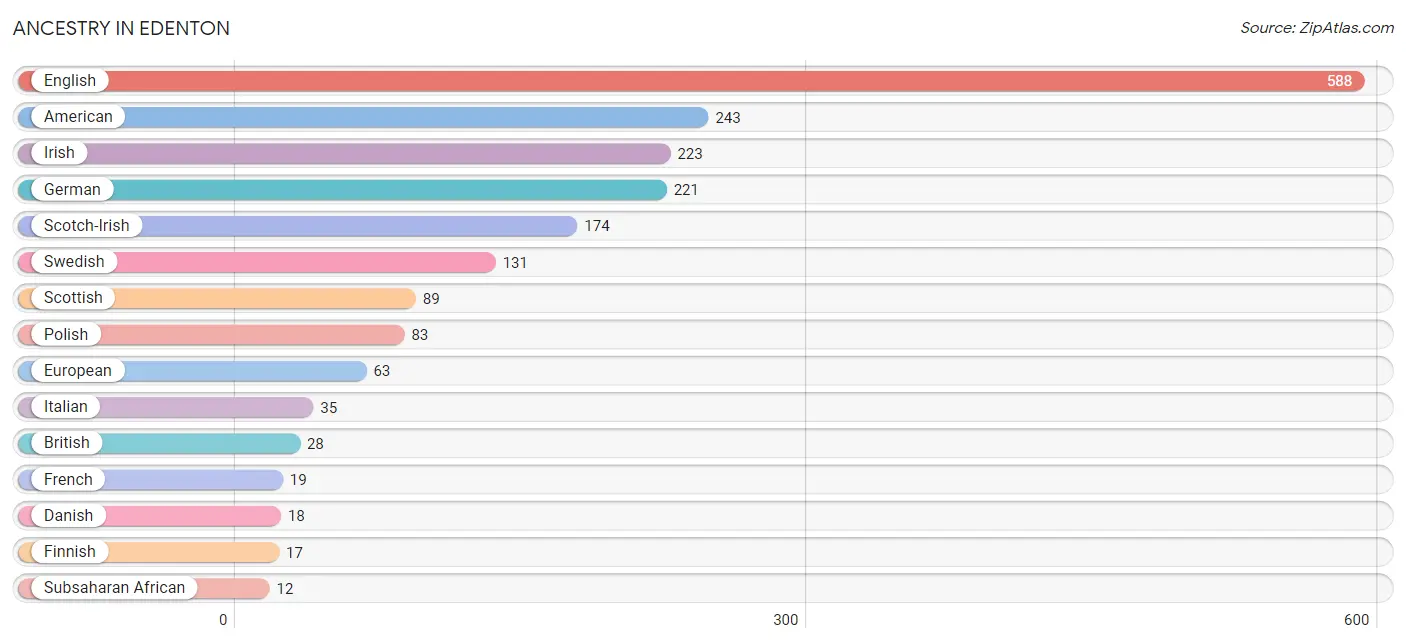
| Ancestry | # Population | % Population |
| American | 243 | 5.4% |
| British | 28 | 0.6% |
| Danish | 18 | 0.4% |
| English | 588 | 13.0% |
| European | 63 | 1.4% |
| Finnish | 17 | 0.4% |
| French | 19 | 0.4% |
| German | 221 | 4.9% |
| Irish | 223 | 4.9% |
| Italian | 35 | 0.8% |
| Mexican | 11 | 0.2% |
| Polish | 83 | 1.8% |
| Scotch-Irish | 174 | 3.9% |
| Scottish | 89 | 2.0% |
| Subsaharan African | 12 | 0.3% |
| Swedish | 131 | 2.9% | View All 16 Rows |
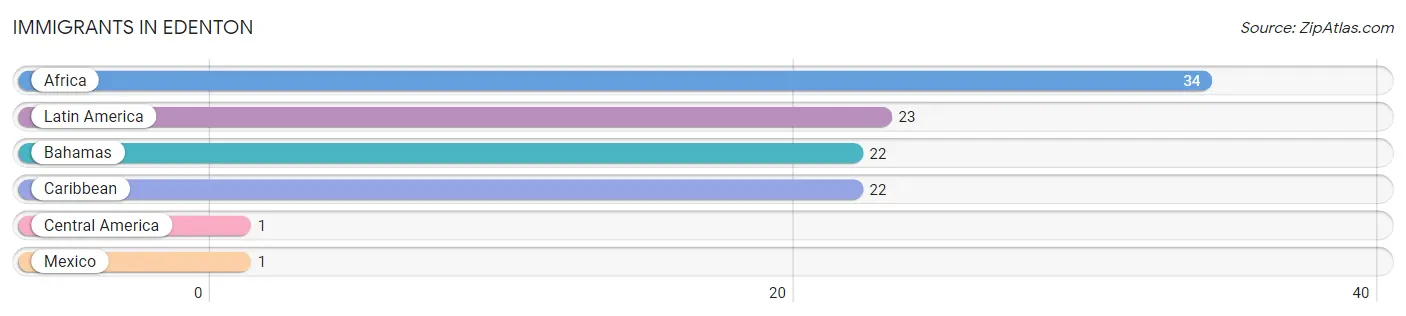
Immigrants in Edenton
The most numerous immigrant groups reported in Edenton came from Africa (34 | 0.7%), Latin America (23 | 0.5%), Bahamas (22 | 0.5%), Caribbean (22 | 0.5%), and Central America (1 | 0.0%), together accounting for 2.3% of all Edenton residents.
| Immigration Origin | # Population | % Population |
| Africa | 34 | 0.7% |
| Bahamas | 22 | 0.5% |
| Caribbean | 22 | 0.5% |
| Central America | 1 | 0.0% |
| Latin America | 23 | 0.5% |
| Mexico | 1 | 0.0% | View All 6 Rows |
Sex and Age in Edenton
Sex and Age in Edenton
The most populous age groups in Edenton are 25 to 29 Years (221 | 10.3%) for men and 70 to 74 Years (308 | 13.0%) for women.
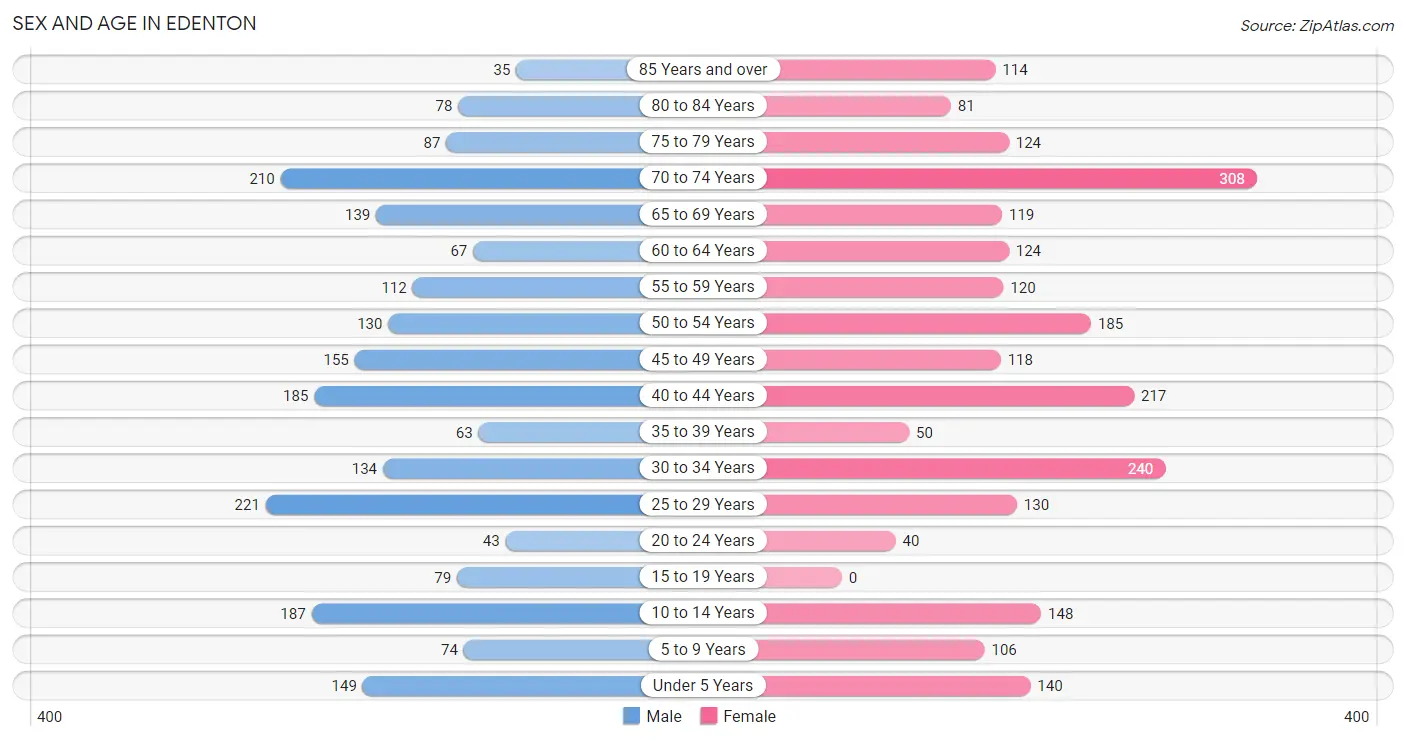
| Age Bracket | Male | Female |
| Under 5 Years | 149 (6.9%) | 140 (5.9%) |
| 5 to 9 Years | 74 (3.5%) | 106 (4.5%) |
| 10 to 14 Years | 187 (8.7%) | 148 (6.3%) |
| 15 to 19 Years | 79 (3.7%) | 0 (0.0%) |
| 20 to 24 Years | 43 (2.0%) | 40 (1.7%) |
| 25 to 29 Years | 221 (10.3%) | 130 (5.5%) |
| 30 to 34 Years | 134 (6.2%) | 240 (10.2%) |
| 35 to 39 Years | 63 (2.9%) | 50 (2.1%) |
| 40 to 44 Years | 185 (8.6%) | 217 (9.2%) |
| 45 to 49 Years | 155 (7.2%) | 118 (5.0%) |
| 50 to 54 Years | 130 (6.0%) | 185 (7.8%) |
| 55 to 59 Years | 112 (5.2%) | 120 (5.1%) |
| 60 to 64 Years | 67 (3.1%) | 124 (5.2%) |
| 65 to 69 Years | 139 (6.5%) | 119 (5.0%) |
| 70 to 74 Years | 210 (9.8%) | 308 (13.0%) |
| 75 to 79 Years | 87 (4.1%) | 124 (5.2%) |
| 80 to 84 Years | 78 (3.6%) | 81 (3.4%) |
| 85 Years and over | 35 (1.6%) | 114 (4.8%) |
| Total | 2,148 (100.0%) | 2,364 (100.0%) |
Families and Households in Edenton
Median Family Size in Edenton
The median family size in Edenton is 2.54 persons per family, with single female/mother families (530 | 42.6%) accounting for the largest median family size of 2.58 persons per family. On the other hand, single male/father families (156 | 12.5%) represent the smallest median family size with 2.44 persons per family.
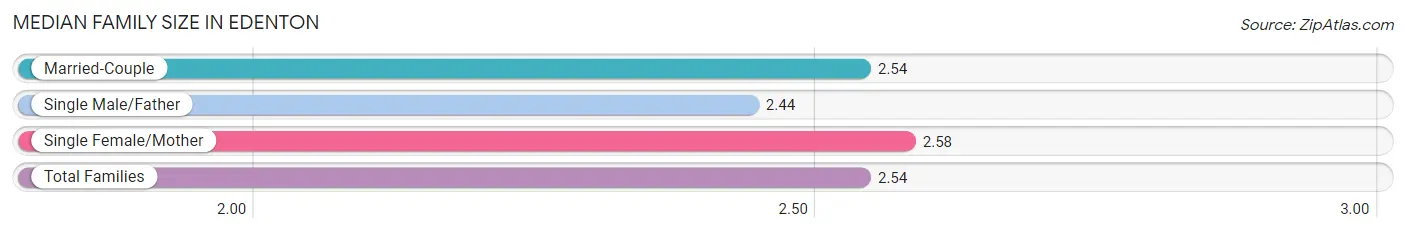
| Family Type | # Families | Family Size |
| Married-Couple | 558 (44.9%) | 2.54 |
| Single Male/Father | 156 (12.5%) | 2.44 |
| Single Female/Mother | 530 (42.6%) | 2.58 |
| Total Families | 1,244 (100.0%) | 2.54 |
Median Household Size in Edenton
The median household size in Edenton is 1.92 persons per household, with single female/mother households (530 | 24.0%) accounting for the largest median household size of 2.69 persons per household. non-family households (966 | 43.7%) represent the smallest median household size with 1.05 persons per household.
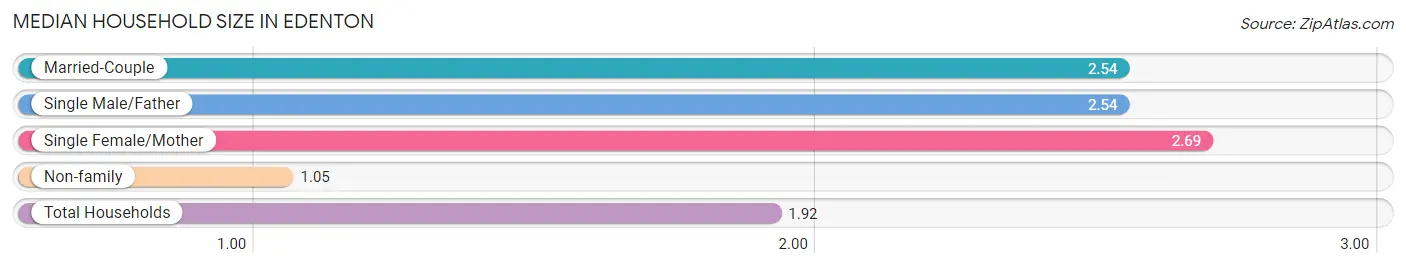
| Household Type | # Households | Household Size |
| Married-Couple | 558 (25.3%) | 2.54 |
| Single Male/Father | 156 (7.1%) | 2.54 |
| Single Female/Mother | 530 (24.0%) | 2.69 |
| Non-family | 966 (43.7%) | 1.05 |
| Total Households | 2,210 (100.0%) | 1.92 |
Household Size by Marriage Status in Edenton
Out of a total of 2,210 households in Edenton, 1,244 (56.3%) are family households, while 966 (43.7%) are nonfamily households. The most numerous type of family households are 2-person households, comprising 736, and the most common type of nonfamily households are 1-person households, comprising 906.
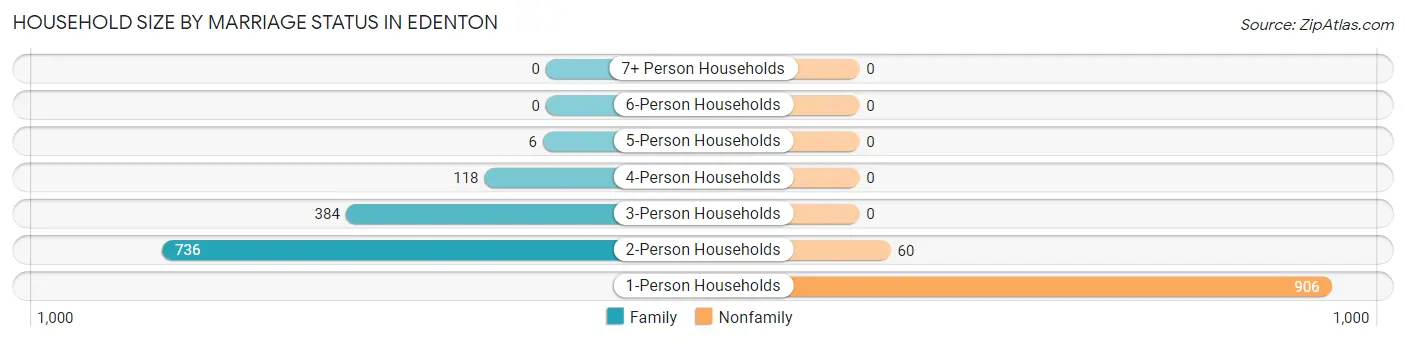
| Household Size | Family Households | Nonfamily Households |
| 1-Person Households | - | 906 (41.0%) |
| 2-Person Households | 736 (33.3%) | 60 (2.7%) |
| 3-Person Households | 384 (17.4%) | 0 (0.0%) |
| 4-Person Households | 118 (5.3%) | 0 (0.0%) |
| 5-Person Households | 6 (0.3%) | 0 (0.0%) |
| 6-Person Households | 0 (0.0%) | 0 (0.0%) |
| 7+ Person Households | 0 (0.0%) | 0 (0.0%) |
| Total | 1,244 (56.3%) | 966 (43.7%) |
Female Fertility in Edenton
Fertility by Age in Edenton
Average fertility rate in Edenton is 189.0 births per 1,000 women. Women in the age bracket of 20 to 34 years have the highest fertility rate with 356.0 births per 1,000 women. Women in the age bracket of 20 to 34 years acount for 97.3% of all women with births.
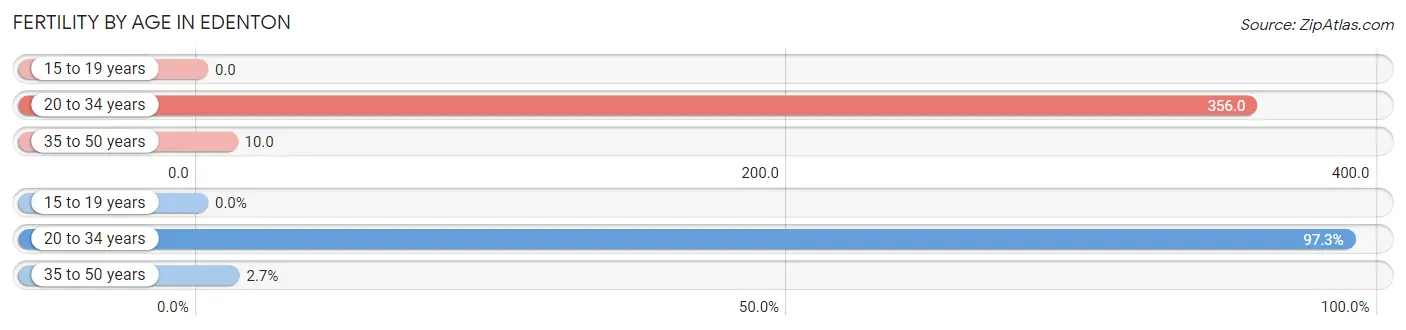
| Age Bracket | Women with Births | Births / 1,000 Women |
| 15 to 19 years | 0 (0.0%) | 0.0 |
| 20 to 34 years | 146 (97.3%) | 356.0 |
| 35 to 50 years | 4 (2.7%) | 10.0 |
| Total | 150 (100.0%) | 189.0 |
Fertility by Age by Marriage Status in Edenton
2.7% of women with births (150) in Edenton are married. The highest percentage of unmarried women with births falls into 20 to 34 years age bracket with 100.0% of them unmarried at the time of birth, while the lowest percentage of unmarried women with births belong to 35 to 50 years age bracket with 0.0% of them unmarried.
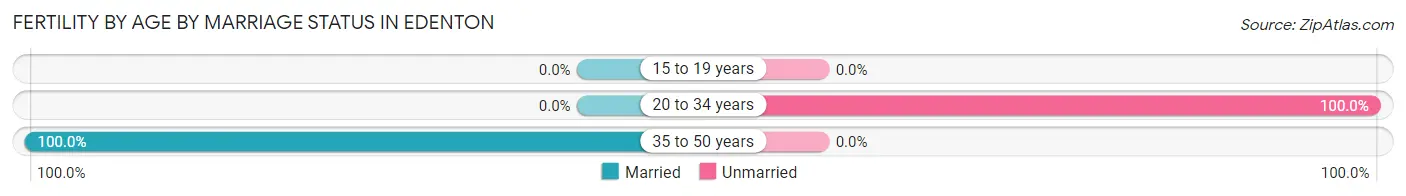
| Age Bracket | Married | Unmarried |
| 15 to 19 years | 0 (0.0%) | 0 (0.0%) |
| 20 to 34 years | 0 (0.0%) | 146 (100.0%) |
| 35 to 50 years | 4 (100.0%) | 0 (0.0%) |
| Total | 4 (2.7%) | 146 (97.3%) |
Fertility by Education in Edenton
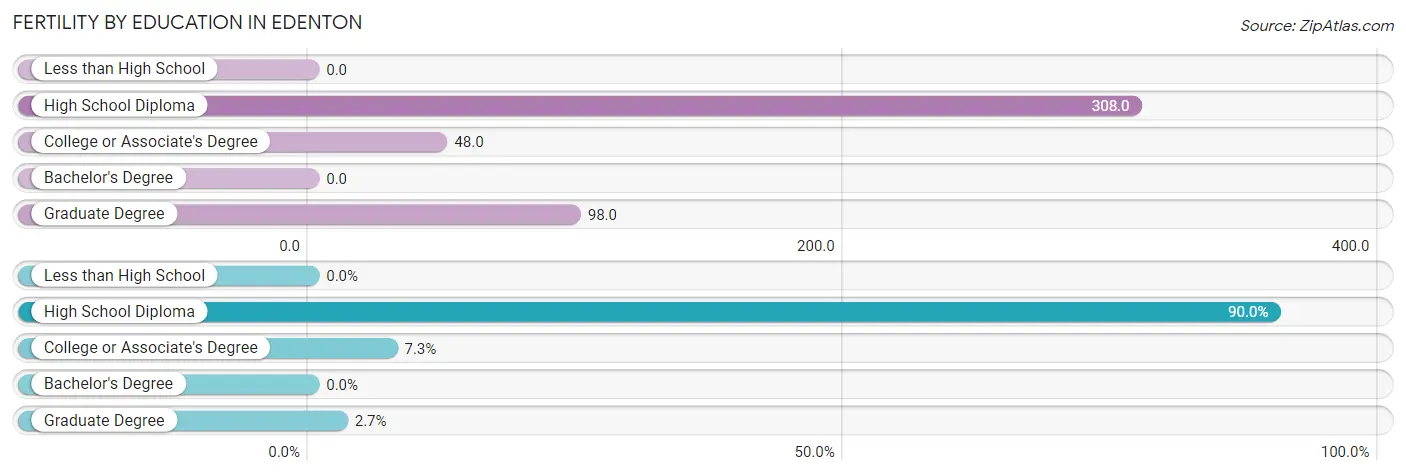
| Educational Attainment | Women with Births | Births / 1,000 Women |
| Less than High School | 0 (0.0%) | 0.0 |
| High School Diploma | 135 (90.0%) | 308.0 |
| College or Associate's Degree | 11 (7.3%) | 48.0 |
| Bachelor's Degree | 0 (0.0%) | 0.0 |
| Graduate Degree | 4 (2.7%) | 98.0 |
| Total | 150 (100.0%) | 189.0 |
Fertility by Education by Marriage Status in Edenton
97.3% of women with births in Edenton are unmarried. Women with the educational attainment of graduate degree are most likely to be married with 100.0% of them married at childbirth, while women with the educational attainment of high school diploma are least likely to be married with 100.0% of them unmarried at childbirth.
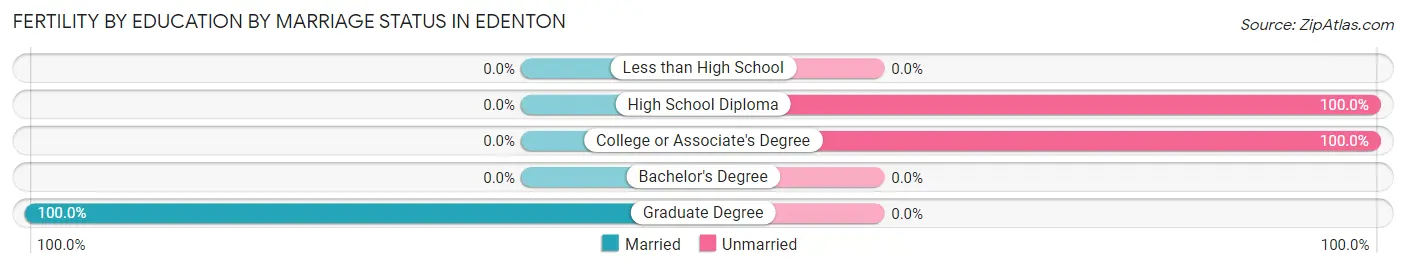
| Educational Attainment | Married | Unmarried |
| Less than High School | 0 (0.0%) | 0 (0.0%) |
| High School Diploma | 0 (0.0%) | 135 (100.0%) |
| College or Associate's Degree | 0 (0.0%) | 11 (100.0%) |
| Bachelor's Degree | 0 (0.0%) | 0 (0.0%) |
| Graduate Degree | 4 (100.0%) | 0 (0.0%) |
| Total | 4 (2.7%) | 146 (97.3%) |
Employment Characteristics in Edenton
Employment by Class of Employer in Edenton
Among the 1,796 employed individuals in Edenton, private company employees (1,026 | 57.1%), not-for-profit organizations (268 | 14.9%), and unpaid family workers (126 | 7.0%) make up the most common classes of employment.
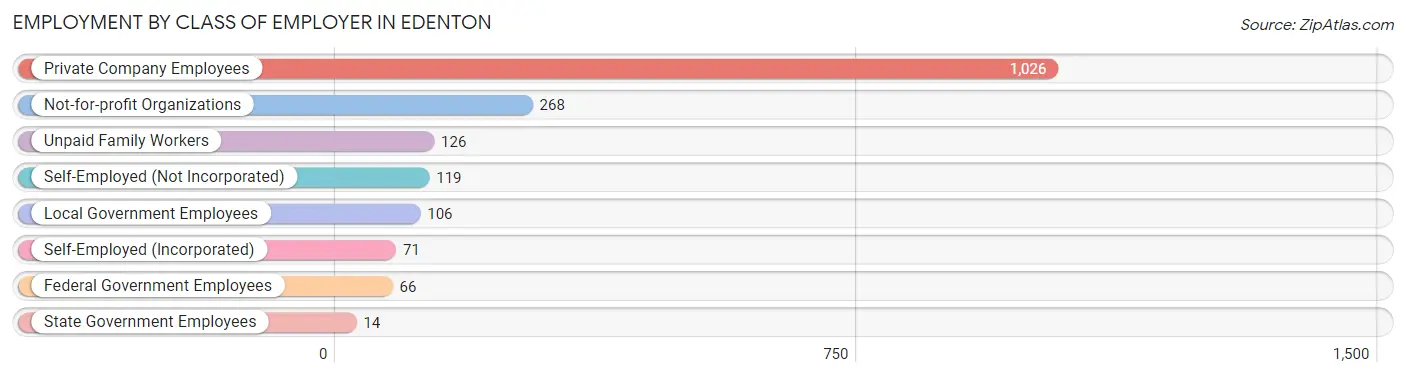
| Employer Class | # Employees | % Employees |
| Private Company Employees | 1,026 | 57.1% |
| Self-Employed (Incorporated) | 71 | 4.0% |
| Self-Employed (Not Incorporated) | 119 | 6.6% |
| Not-for-profit Organizations | 268 | 14.9% |
| Local Government Employees | 106 | 5.9% |
| State Government Employees | 14 | 0.8% |
| Federal Government Employees | 66 | 3.7% |
| Unpaid Family Workers | 126 | 7.0% |
| Total | 1,796 | 100.0% |
Employment Status by Age in Edenton
According to the labor force statistics for Edenton, out of the total population over 16 years of age (3,708), 56.2% or 2,084 individuals are in the labor force, with 6.2% or 129 of them unemployed. The age group with the highest labor force participation rate is 25 to 29 years, with 99.1% or 348 individuals in the labor force. Within the labor force, the 20 to 24 years age range has the highest percentage of unemployed individuals, with 45.0% or 18 of them being unemployed.
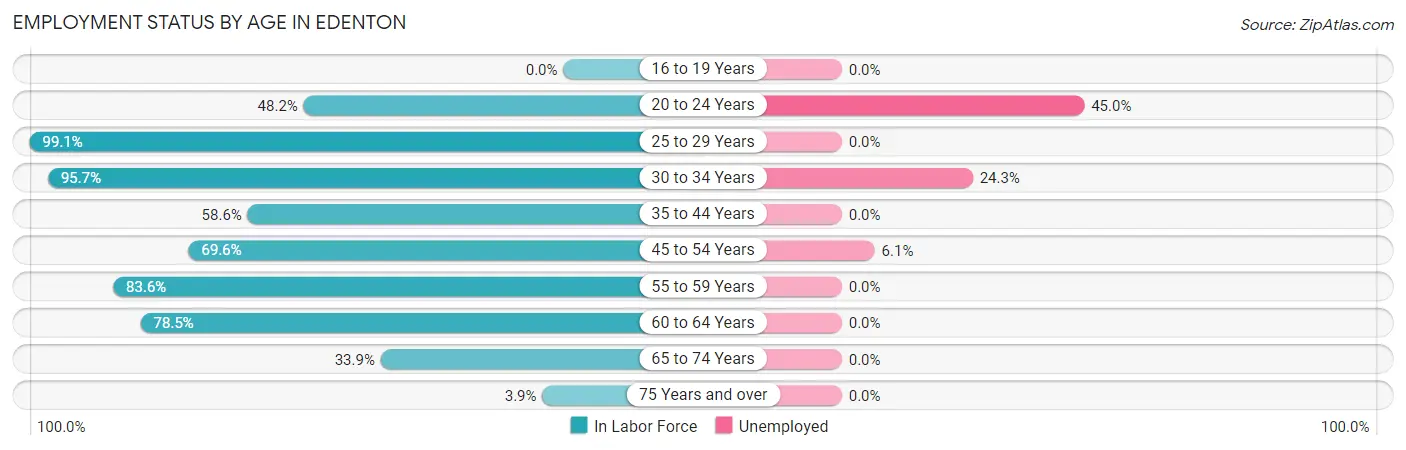
| Age Bracket | In Labor Force | Unemployed |
| 16 to 19 Years | 0 (0.0%) | 0 (0.0%) |
| 20 to 24 Years | 40 (48.2%) | 18 (45.0%) |
| 25 to 29 Years | 348 (99.1%) | 0 (0.0%) |
| 30 to 34 Years | 358 (95.7%) | 87 (24.3%) |
| 35 to 44 Years | 302 (58.6%) | 0 (0.0%) |
| 45 to 54 Years | 409 (69.6%) | 25 (6.1%) |
| 55 to 59 Years | 194 (83.6%) | 0 (0.0%) |
| 60 to 64 Years | 150 (78.5%) | 0 (0.0%) |
| 65 to 74 Years | 263 (33.9%) | 0 (0.0%) |
| 75 Years and over | 20 (3.9%) | 0 (0.0%) |
| Total | 2,084 (56.2%) | 129 (6.2%) |
Employment Status by Educational Attainment in Edenton
According to labor force statistics for Edenton, 78.2% of individuals (1,760) out of the total population between 25 and 64 years of age (2,251) are in the labor force, with 6.4% or 113 of them being unemployed. The group with the highest labor force participation rate are those with the educational attainment of high school diploma, with 88.2% or 749 individuals in the labor force. Within the labor force, individuals with high school diploma education have the highest percentage of unemployment, with 11.6% or 87 of them being unemployed.
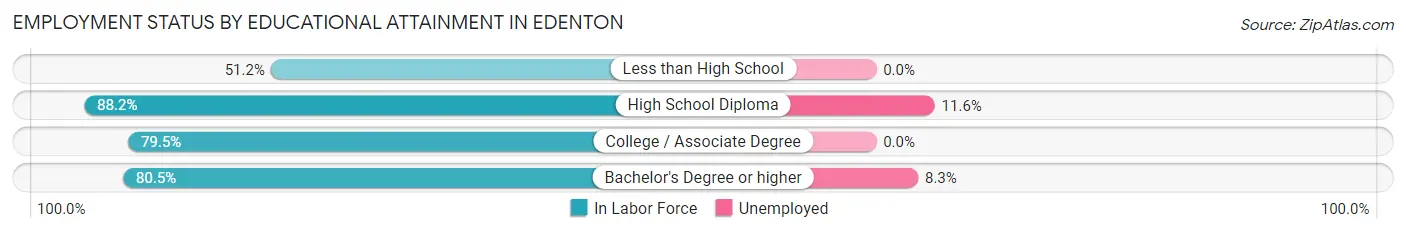
| Educational Attainment | In Labor Force | Unemployed |
| Less than High School | 193 (51.2%) | 0 (0.0%) |
| High School Diploma | 749 (88.2%) | 98 (11.6%) |
| College / Associate Degree | 517 (79.5%) | 0 (0.0%) |
| Bachelor's Degree or higher | 302 (80.5%) | 31 (8.3%) |
| Total | 1,760 (78.2%) | 144 (6.4%) |
Employment Occupations by Sex in Edenton
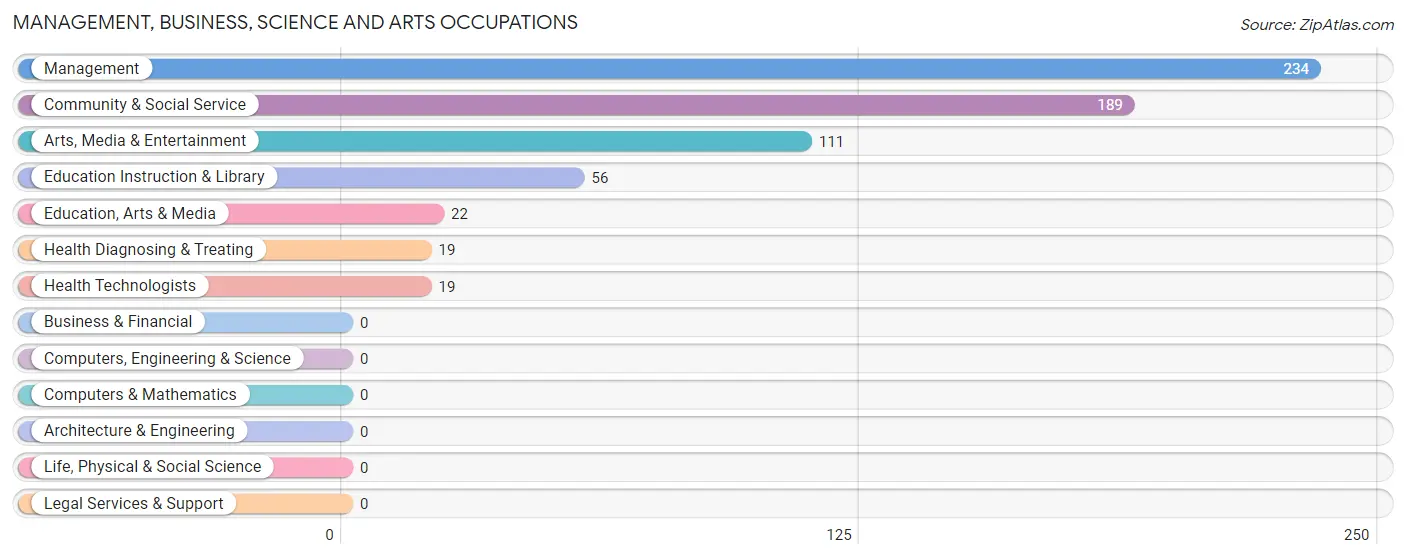
Management, Business, Science and Arts Occupations
The most common Management, Business, Science and Arts occupations in Edenton are Management (234 | 12.0%), Community & Social Service (189 | 9.7%), Arts, Media & Entertainment (111 | 5.7%), Education Instruction & Library (56 | 2.9%), and Education, Arts & Media (22 | 1.1%).
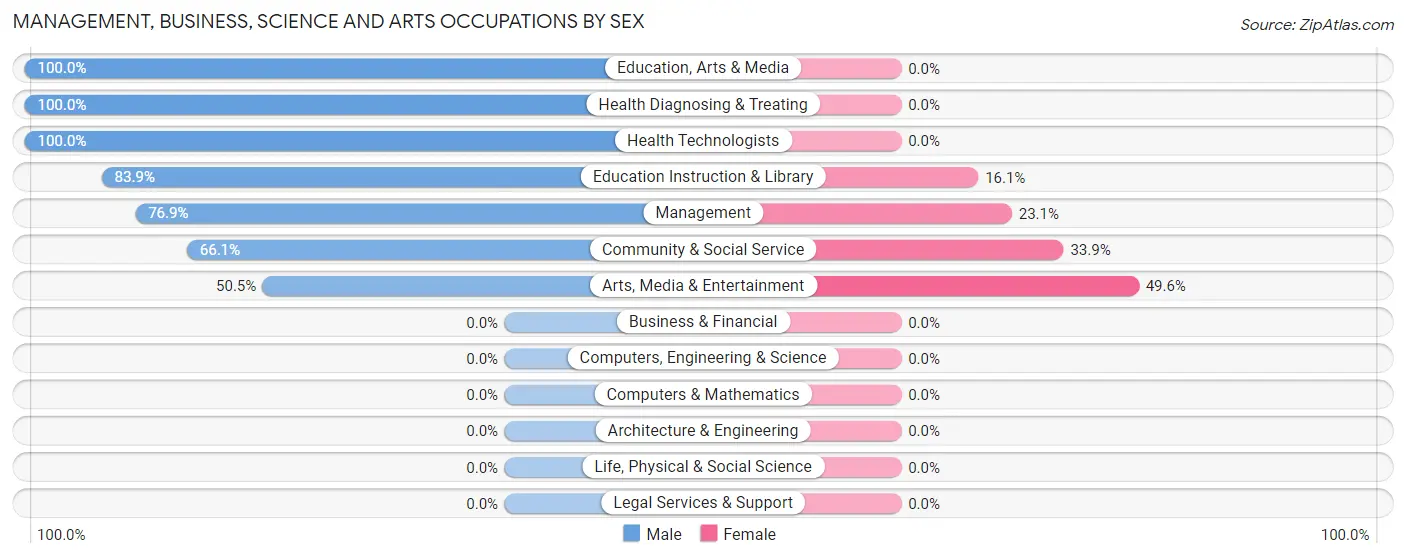
Management, Business, Science and Arts Occupations by Sex
Within the Management, Business, Science and Arts occupations in Edenton, the most male-oriented occupations are Education, Arts & Media (100.0%), Health Diagnosing & Treating (100.0%), and Health Technologists (100.0%), while the most female-oriented occupations are Arts, Media & Entertainment (49.5%), Community & Social Service (33.9%), and Management (23.1%).
| Occupation | Male | Female |
| Management | 180 (76.9%) | 54 (23.1%) |
| Business & Financial | 0 (0.0%) | 0 (0.0%) |
| Computers, Engineering & Science | 0 (0.0%) | 0 (0.0%) |
| Computers & Mathematics | 0 (0.0%) | 0 (0.0%) |
| Architecture & Engineering | 0 (0.0%) | 0 (0.0%) |
| Life, Physical & Social Science | 0 (0.0%) | 0 (0.0%) |
| Community & Social Service | 125 (66.1%) | 64 (33.9%) |
| Education, Arts & Media | 22 (100.0%) | 0 (0.0%) |
| Legal Services & Support | 0 (0.0%) | 0 (0.0%) |
| Education Instruction & Library | 47 (83.9%) | 9 (16.1%) |
| Arts, Media & Entertainment | 56 (50.4%) | 55 (49.5%) |
| Health Diagnosing & Treating | 19 (100.0%) | 0 (0.0%) |
| Health Technologists | 19 (100.0%) | 0 (0.0%) |
| Total (Category) | 324 (73.3%) | 118 (26.7%) |
| Total (Overall) | 947 (48.5%) | 1,007 (51.5%) |
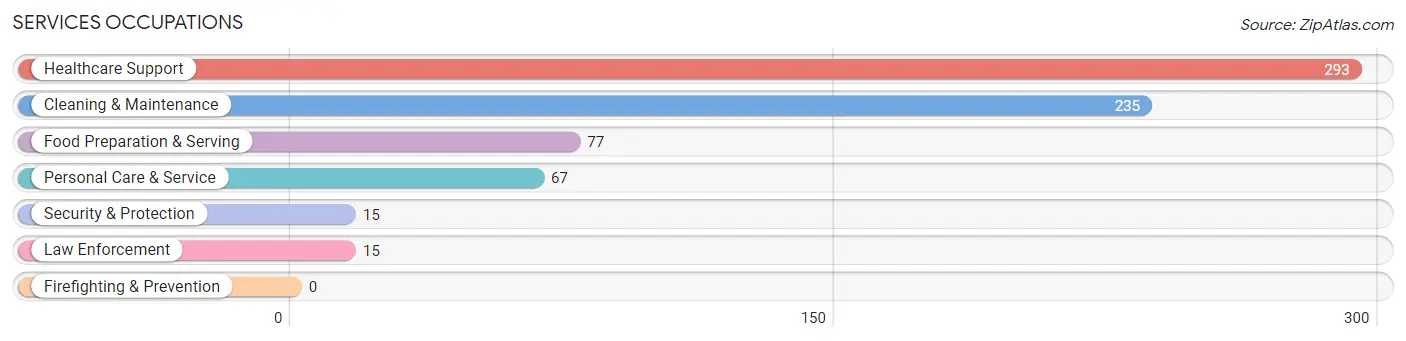
Services Occupations
The most common Services occupations in Edenton are Healthcare Support (293 | 15.0%), Cleaning & Maintenance (235 | 12.0%), Food Preparation & Serving (77 | 3.9%), Personal Care & Service (67 | 3.4%), and Security & Protection (15 | 0.8%).
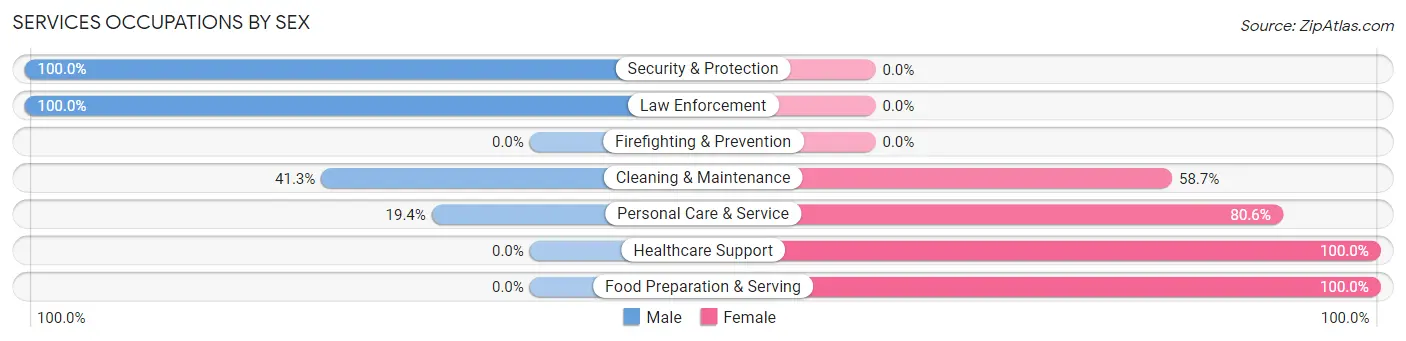
Services Occupations by Sex
Within the Services occupations in Edenton, the most male-oriented occupations are Security & Protection (100.0%), Law Enforcement (100.0%), and Cleaning & Maintenance (41.3%), while the most female-oriented occupations are Healthcare Support (100.0%), Food Preparation & Serving (100.0%), and Personal Care & Service (80.6%).
| Occupation | Male | Female |
| Healthcare Support | 0 (0.0%) | 293 (100.0%) |
| Security & Protection | 15 (100.0%) | 0 (0.0%) |
| Firefighting & Prevention | 0 (0.0%) | 0 (0.0%) |
| Law Enforcement | 15 (100.0%) | 0 (0.0%) |
| Food Preparation & Serving | 0 (0.0%) | 77 (100.0%) |
| Cleaning & Maintenance | 97 (41.3%) | 138 (58.7%) |
| Personal Care & Service | 13 (19.4%) | 54 (80.6%) |
| Total (Category) | 125 (18.2%) | 562 (81.8%) |
| Total (Overall) | 947 (48.5%) | 1,007 (51.5%) |
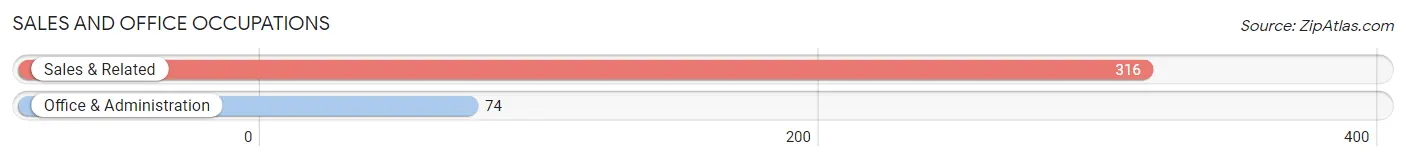
Sales and Office Occupations
The most common Sales and Office occupations in Edenton are Sales & Related (316 | 16.2%), and Office & Administration (74 | 3.8%).
Sales and Office Occupations by Sex
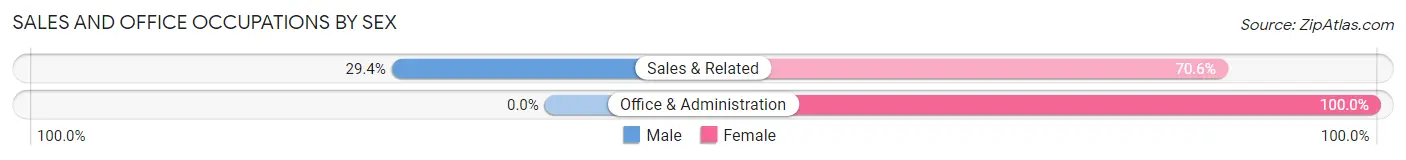
| Occupation | Male | Female |
| Sales & Related | 93 (29.4%) | 223 (70.6%) |
| Office & Administration | 0 (0.0%) | 74 (100.0%) |
| Total (Category) | 93 (23.8%) | 297 (76.1%) |
| Total (Overall) | 947 (48.5%) | 1,007 (51.5%) |
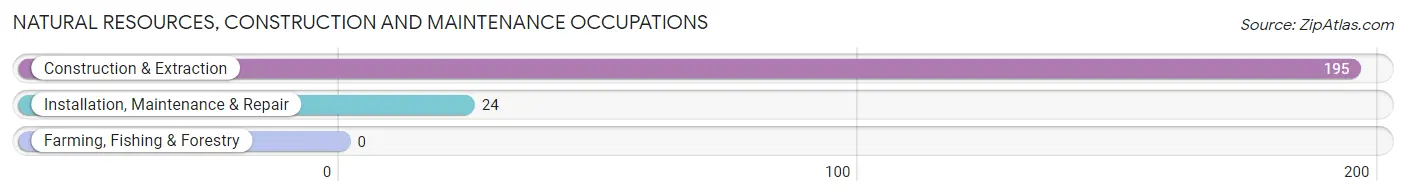
Natural Resources, Construction and Maintenance Occupations
The most common Natural Resources, Construction and Maintenance occupations in Edenton are Construction & Extraction (195 | 10.0%), and Installation, Maintenance & Repair (24 | 1.2%).
Natural Resources, Construction and Maintenance Occupations by Sex
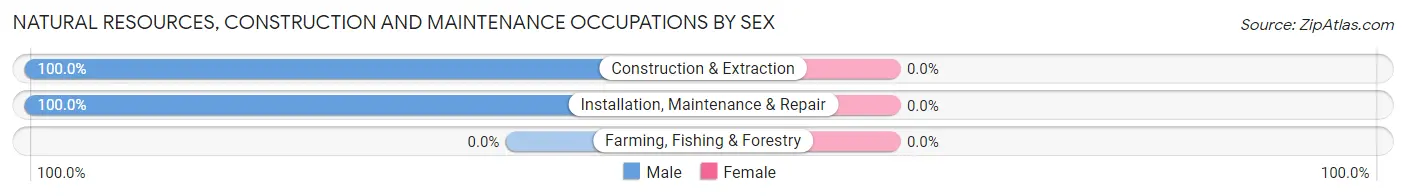
| Occupation | Male | Female |
| Farming, Fishing & Forestry | 0 (0.0%) | 0 (0.0%) |
| Construction & Extraction | 195 (100.0%) | 0 (0.0%) |
| Installation, Maintenance & Repair | 24 (100.0%) | 0 (0.0%) |
| Total (Category) | 219 (100.0%) | 0 (0.0%) |
| Total (Overall) | 947 (48.5%) | 1,007 (51.5%) |
Production, Transportation and Moving Occupations
The most common Production, Transportation and Moving occupations in Edenton are Production (200 | 10.2%), and Transportation (16 | 0.8%).
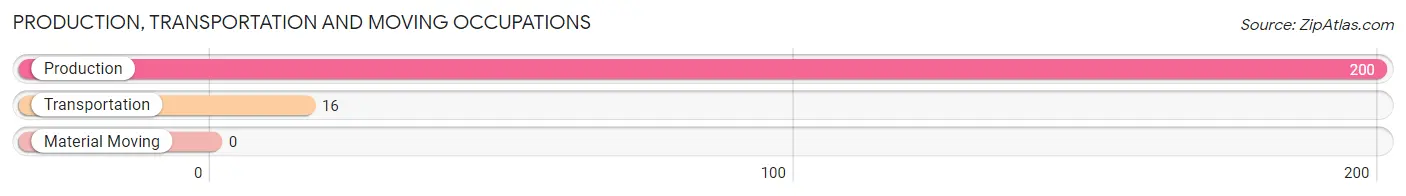
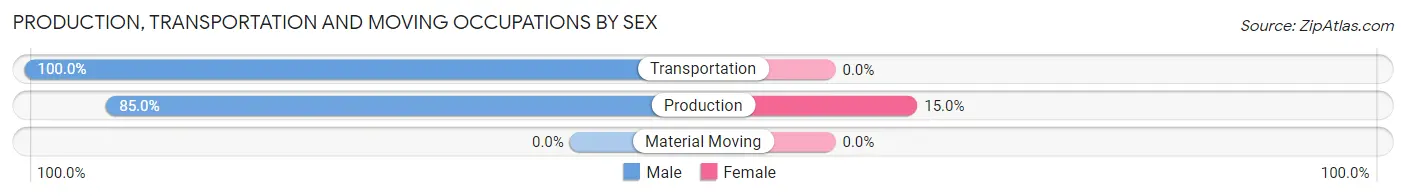
Production, Transportation and Moving Occupations by Sex
| Occupation | Male | Female |
| Production | 170 (85.0%) | 30 (15.0%) |
| Transportation | 16 (100.0%) | 0 (0.0%) |
| Material Moving | 0 (0.0%) | 0 (0.0%) |
| Total (Category) | 186 (86.1%) | 30 (13.9%) |
| Total (Overall) | 947 (48.5%) | 1,007 (51.5%) |
Employment Industries by Sex in Edenton
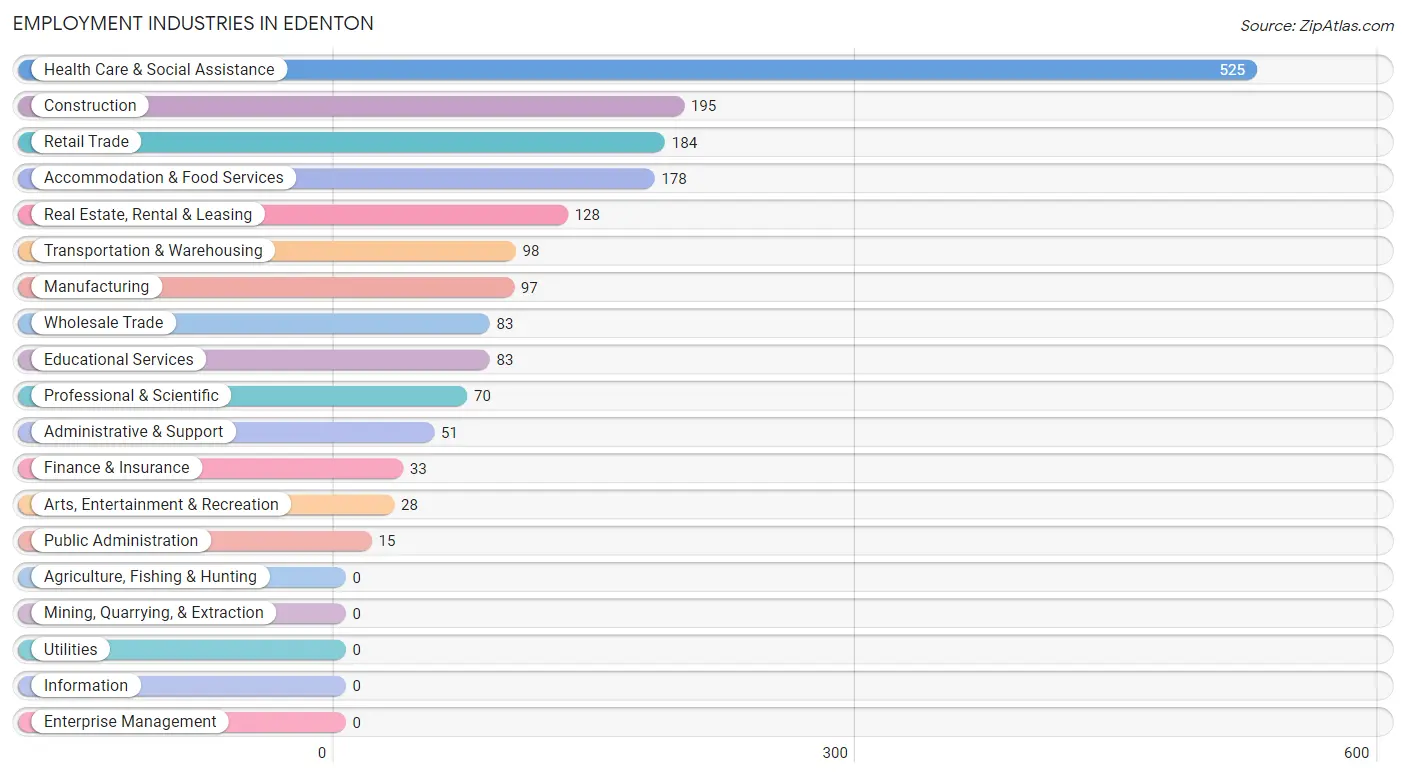
Employment Industries in Edenton
The major employment industries in Edenton include Health Care & Social Assistance (525 | 26.9%), Construction (195 | 10.0%), Retail Trade (184 | 9.4%), Accommodation & Food Services (178 | 9.1%), and Real Estate, Rental & Leasing (128 | 6.6%).
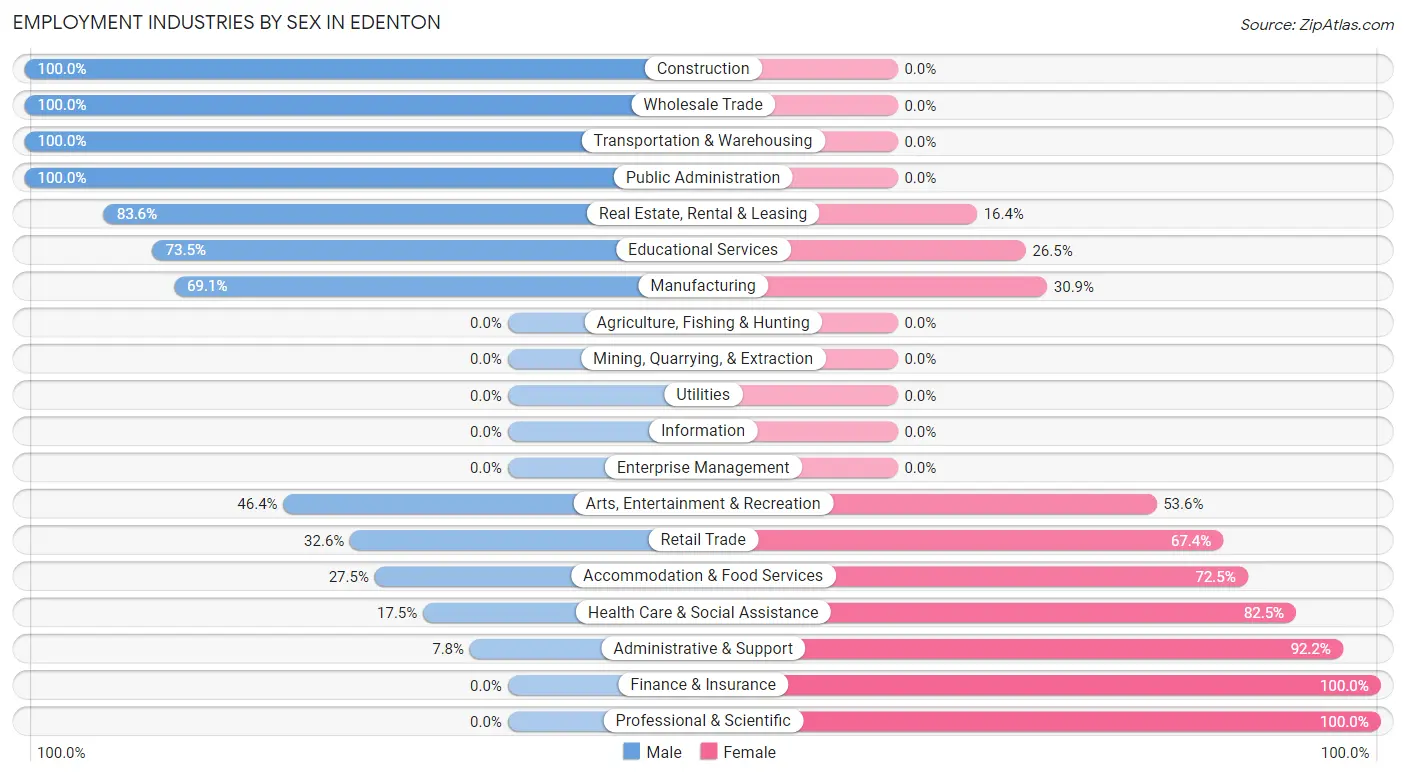
Employment Industries by Sex in Edenton
The Edenton industries that see more men than women are Construction (100.0%), Wholesale Trade (100.0%), and Transportation & Warehousing (100.0%), whereas the industries that tend to have a higher number of women are Finance & Insurance (100.0%), Professional & Scientific (100.0%), and Administrative & Support (92.2%).
| Industry | Male | Female |
| Agriculture, Fishing & Hunting | 0 (0.0%) | 0 (0.0%) |
| Mining, Quarrying, & Extraction | 0 (0.0%) | 0 (0.0%) |
| Construction | 195 (100.0%) | 0 (0.0%) |
| Manufacturing | 67 (69.1%) | 30 (30.9%) |
| Wholesale Trade | 83 (100.0%) | 0 (0.0%) |
| Retail Trade | 60 (32.6%) | 124 (67.4%) |
| Transportation & Warehousing | 98 (100.0%) | 0 (0.0%) |
| Utilities | 0 (0.0%) | 0 (0.0%) |
| Information | 0 (0.0%) | 0 (0.0%) |
| Finance & Insurance | 0 (0.0%) | 33 (100.0%) |
| Real Estate, Rental & Leasing | 107 (83.6%) | 21 (16.4%) |
| Professional & Scientific | 0 (0.0%) | 70 (100.0%) |
| Enterprise Management | 0 (0.0%) | 0 (0.0%) |
| Administrative & Support | 4 (7.8%) | 47 (92.2%) |
| Educational Services | 61 (73.5%) | 22 (26.5%) |
| Health Care & Social Assistance | 92 (17.5%) | 433 (82.5%) |
| Arts, Entertainment & Recreation | 13 (46.4%) | 15 (53.6%) |
| Accommodation & Food Services | 49 (27.5%) | 129 (72.5%) |
| Public Administration | 15 (100.0%) | 0 (0.0%) |
| Total | 947 (48.5%) | 1,007 (51.5%) |
Education in Edenton
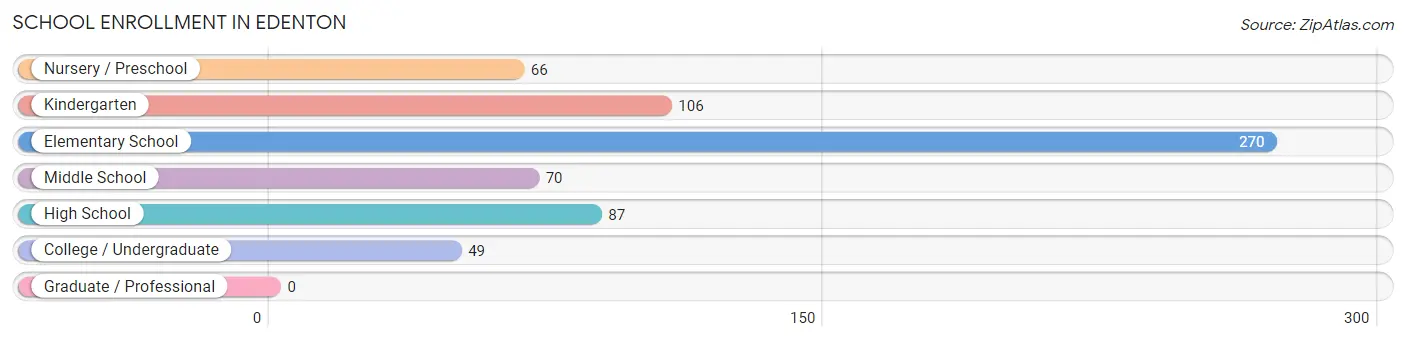
School Enrollment in Edenton
The most common levels of schooling among the 648 students in Edenton are elementary school (270 | 41.7%), kindergarten (106 | 16.4%), and high school (87 | 13.4%).
| School Level | # Students | % Students |
| Nursery / Preschool | 66 | 10.2% |
| Kindergarten | 106 | 16.4% |
| Elementary School | 270 | 41.7% |
| Middle School | 70 | 10.8% |
| High School | 87 | 13.4% |
| College / Undergraduate | 49 | 7.6% |
| Graduate / Professional | 0 | 0.0% |
| Total | 648 | 100.0% |
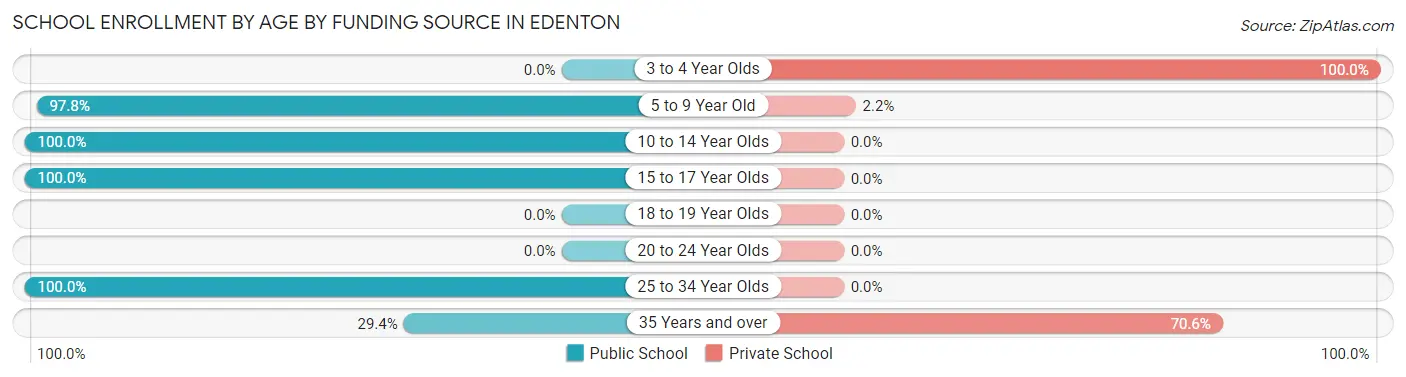
School Enrollment by Age by Funding Source in Edenton
Out of a total of 648 students who are enrolled in schools in Edenton, 36 (5.6%) attend a private institution, while the remaining 612 (94.4%) are enrolled in public schools. The age group of 3 to 4 year olds has the highest likelihood of being enrolled in private schools, with 8 (100.0% in the age bracket) enrolled. Conversely, the age group of 10 to 14 year olds has the lowest likelihood of being enrolled in a private school, with 335 (100.0% in the age bracket) attending a public institution.
| Age Bracket | Public School | Private School |
| 3 to 4 Year Olds | 0 (0.0%) | 8 (100.0%) |
| 5 to 9 Year Old | 176 (97.8%) | 4 (2.2%) |
| 10 to 14 Year Olds | 335 (100.0%) | 0 (0.0%) |
| 15 to 17 Year Olds | 76 (100.0%) | 0 (0.0%) |
| 18 to 19 Year Olds | 0 (0.0%) | 0 (0.0%) |
| 20 to 24 Year Olds | 0 (0.0%) | 0 (0.0%) |
| 25 to 34 Year Olds | 15 (100.0%) | 0 (0.0%) |
| 35 Years and over | 10 (29.4%) | 24 (70.6%) |
| Total | 612 (94.4%) | 36 (5.6%) |
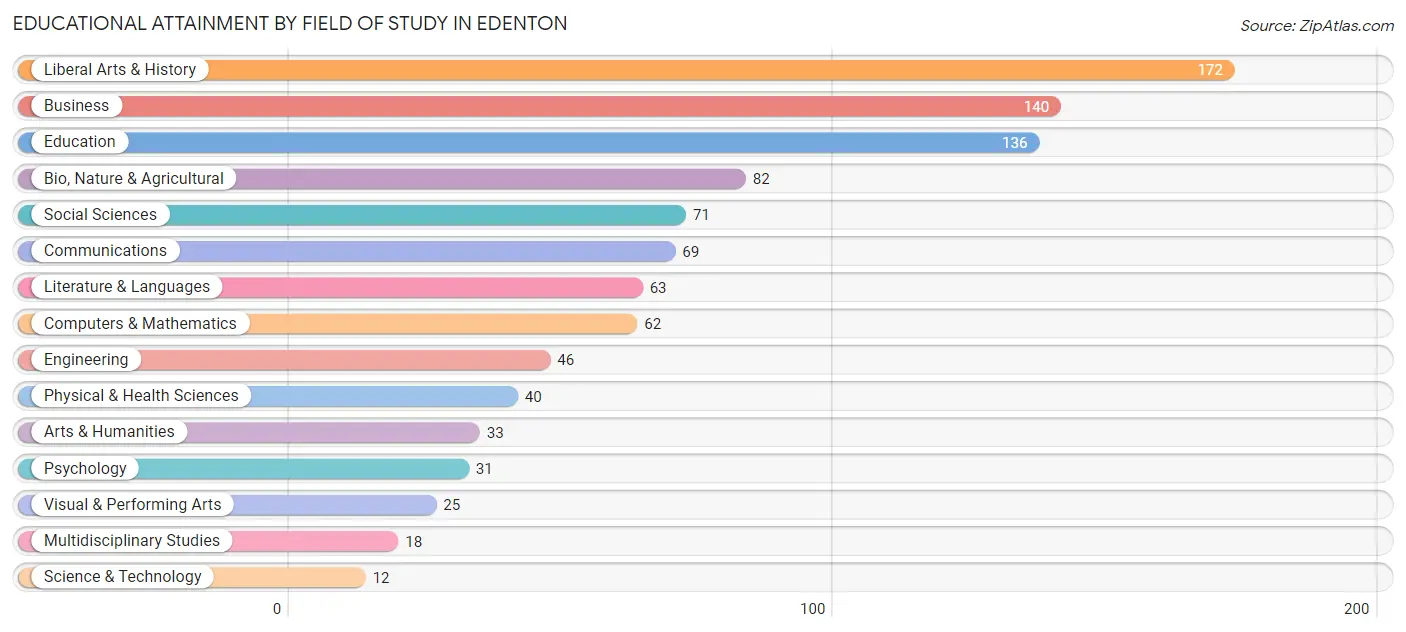
Educational Attainment by Field of Study in Edenton
Liberal arts & history (172 | 17.2%), business (140 | 14.0%), education (136 | 13.6%), bio, nature & agricultural (82 | 8.2%), and social sciences (71 | 7.1%) are the most common fields of study among 1,000 individuals in Edenton who have obtained a bachelor's degree or higher.
| Field of Study | # Graduates | % Graduates |
| Computers & Mathematics | 62 | 6.2% |
| Bio, Nature & Agricultural | 82 | 8.2% |
| Physical & Health Sciences | 40 | 4.0% |
| Psychology | 31 | 3.1% |
| Social Sciences | 71 | 7.1% |
| Engineering | 46 | 4.6% |
| Multidisciplinary Studies | 18 | 1.8% |
| Science & Technology | 12 | 1.2% |
| Business | 140 | 14.0% |
| Education | 136 | 13.6% |
| Literature & Languages | 63 | 6.3% |
| Liberal Arts & History | 172 | 17.2% |
| Visual & Performing Arts | 25 | 2.5% |
| Communications | 69 | 6.9% |
| Arts & Humanities | 33 | 3.3% |
| Total | 1,000 | 100.0% |
Transportation & Commute in Edenton
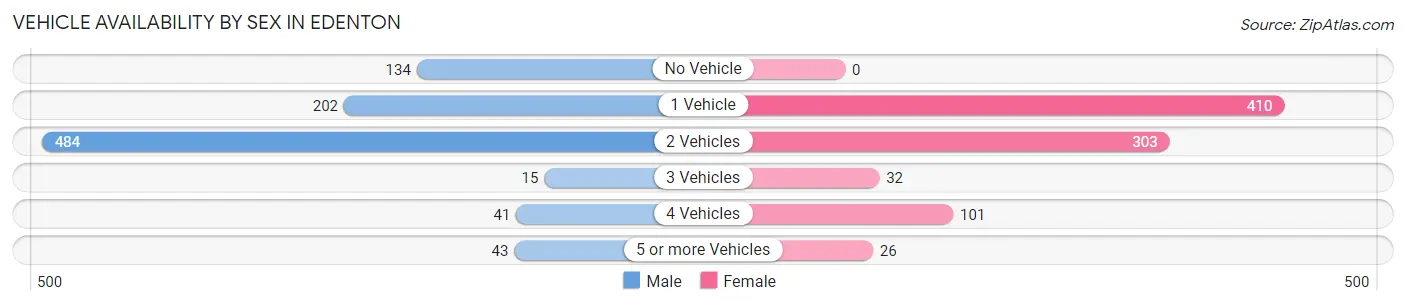
Vehicle Availability by Sex in Edenton
The most prevalent vehicle ownership categories in Edenton are males with 2 vehicles (484, accounting for 52.7%) and females with 2 vehicles (303, making up 55.5%).
| Vehicles Available | Male | Female |
| No Vehicle | 134 (14.6%) | 0 (0.0%) |
| 1 Vehicle | 202 (22.0%) | 410 (47.0%) |
| 2 Vehicles | 484 (52.7%) | 303 (34.7%) |
| 3 Vehicles | 15 (1.6%) | 32 (3.7%) |
| 4 Vehicles | 41 (4.5%) | 101 (11.6%) |
| 5 or more Vehicles | 43 (4.7%) | 26 (3.0%) |
| Total | 919 (100.0%) | 872 (100.0%) |
Commute Time in Edenton
The most frequently occuring commute durations in Edenton are 5 to 9 minutes (653 commuters, 37.3%), 10 to 14 minutes (216 commuters, 12.3%), and 90 or more minutes (202 commuters, 11.6%).
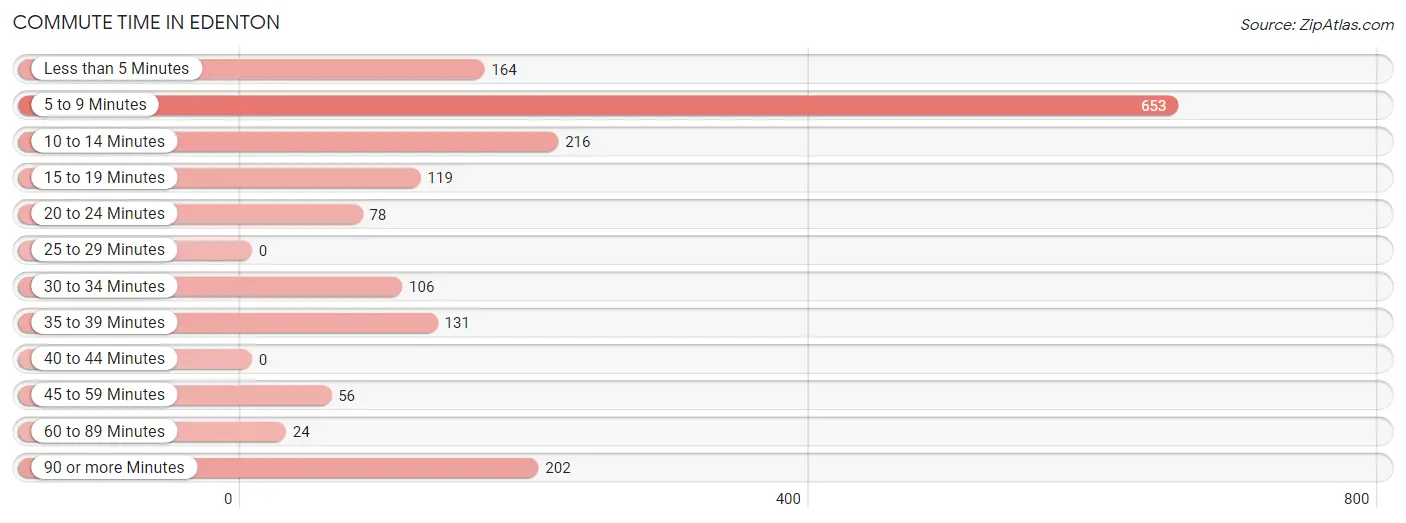
| Commute Time | # Commuters | % Commuters |
| Less than 5 Minutes | 164 | 9.4% |
| 5 to 9 Minutes | 653 | 37.3% |
| 10 to 14 Minutes | 216 | 12.3% |
| 15 to 19 Minutes | 119 | 6.8% |
| 20 to 24 Minutes | 78 | 4.5% |
| 25 to 29 Minutes | 0 | 0.0% |
| 30 to 34 Minutes | 106 | 6.1% |
| 35 to 39 Minutes | 131 | 7.5% |
| 40 to 44 Minutes | 0 | 0.0% |
| 45 to 59 Minutes | 56 | 3.2% |
| 60 to 89 Minutes | 24 | 1.4% |
| 90 or more Minutes | 202 | 11.6% |
Commute Time by Sex in Edenton
The most common commute times in Edenton are 5 to 9 minutes (423 commuters, 45.8%) for males and 5 to 9 minutes (230 commuters, 27.9%) for females.
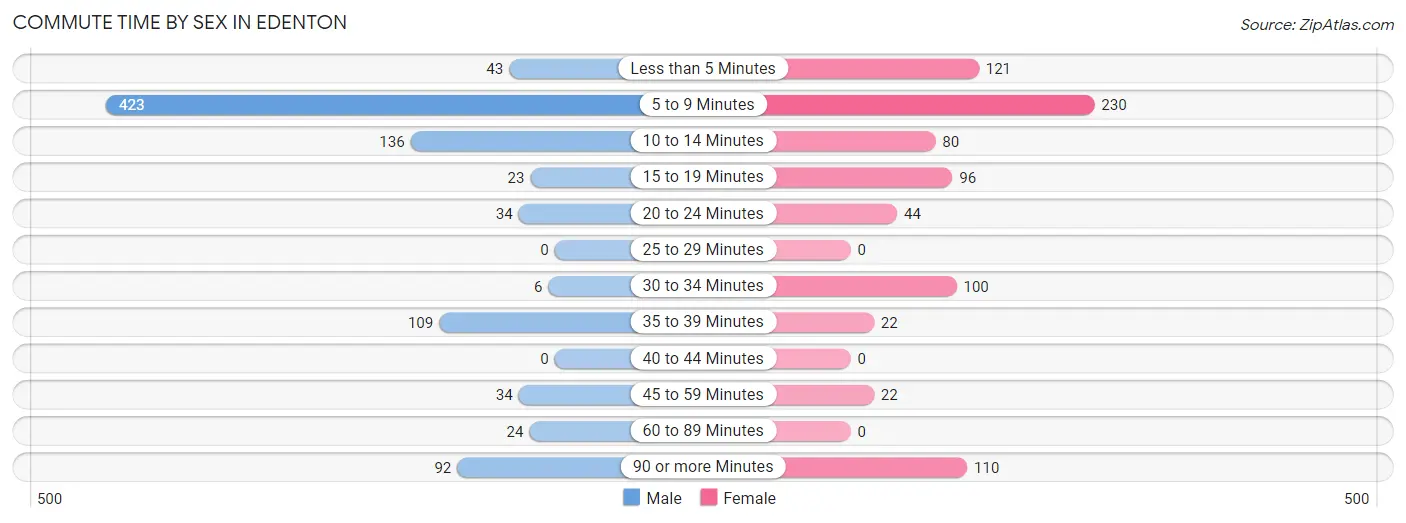
| Commute Time | Male | Female |
| Less than 5 Minutes | 43 (4.6%) | 121 (14.7%) |
| 5 to 9 Minutes | 423 (45.8%) | 230 (27.9%) |
| 10 to 14 Minutes | 136 (14.7%) | 80 (9.7%) |
| 15 to 19 Minutes | 23 (2.5%) | 96 (11.6%) |
| 20 to 24 Minutes | 34 (3.7%) | 44 (5.3%) |
| 25 to 29 Minutes | 0 (0.0%) | 0 (0.0%) |
| 30 to 34 Minutes | 6 (0.6%) | 100 (12.1%) |
| 35 to 39 Minutes | 109 (11.8%) | 22 (2.7%) |
| 40 to 44 Minutes | 0 (0.0%) | 0 (0.0%) |
| 45 to 59 Minutes | 34 (3.7%) | 22 (2.7%) |
| 60 to 89 Minutes | 24 (2.6%) | 0 (0.0%) |
| 90 or more Minutes | 92 (10.0%) | 110 (13.3%) |
Time of Departure to Work by Sex in Edenton
The most frequent times of departure to work in Edenton are 6:30 AM to 6:59 AM (197, 21.3%) for males and 7:30 AM to 7:59 AM (163, 19.8%) for females.
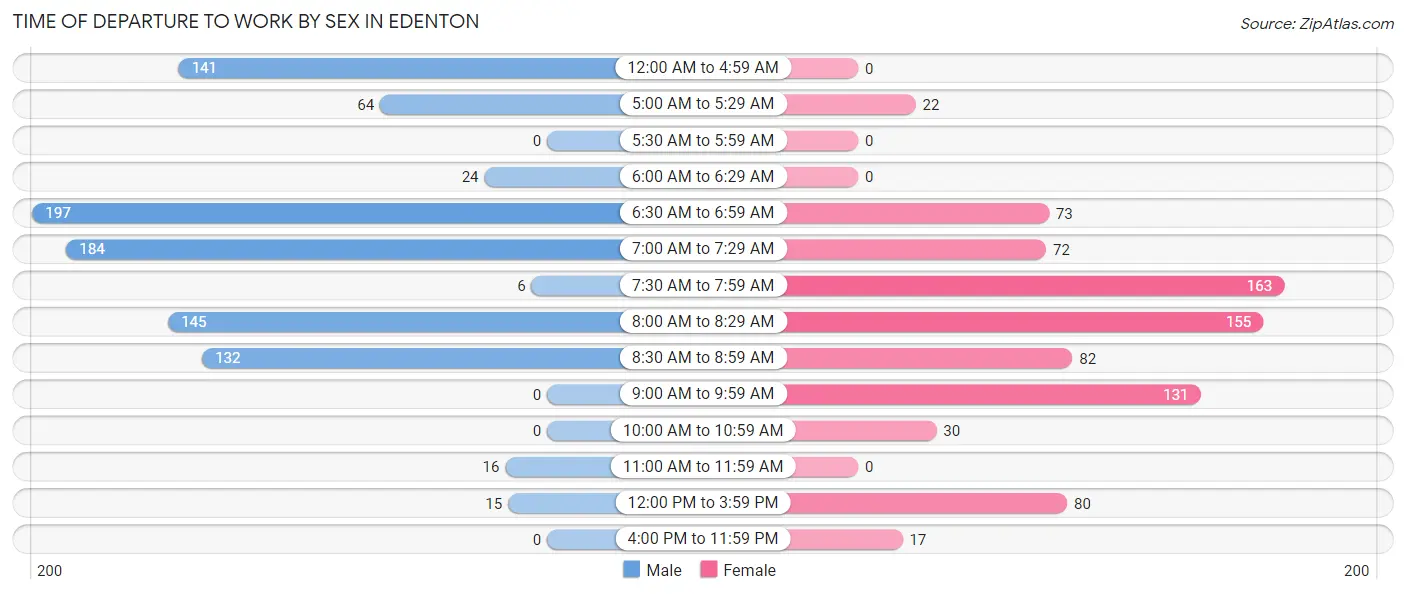
| Time of Departure | Male | Female |
| 12:00 AM to 4:59 AM | 141 (15.3%) | 0 (0.0%) |
| 5:00 AM to 5:29 AM | 64 (6.9%) | 22 (2.7%) |
| 5:30 AM to 5:59 AM | 0 (0.0%) | 0 (0.0%) |
| 6:00 AM to 6:29 AM | 24 (2.6%) | 0 (0.0%) |
| 6:30 AM to 6:59 AM | 197 (21.3%) | 73 (8.8%) |
| 7:00 AM to 7:29 AM | 184 (19.9%) | 72 (8.7%) |
| 7:30 AM to 7:59 AM | 6 (0.6%) | 163 (19.8%) |
| 8:00 AM to 8:29 AM | 145 (15.7%) | 155 (18.8%) |
| 8:30 AM to 8:59 AM | 132 (14.3%) | 82 (9.9%) |
| 9:00 AM to 9:59 AM | 0 (0.0%) | 131 (15.9%) |
| 10:00 AM to 10:59 AM | 0 (0.0%) | 30 (3.6%) |
| 11:00 AM to 11:59 AM | 16 (1.7%) | 0 (0.0%) |
| 12:00 PM to 3:59 PM | 15 (1.6%) | 80 (9.7%) |
| 4:00 PM to 11:59 PM | 0 (0.0%) | 17 (2.1%) |
| Total | 924 (100.0%) | 825 (100.0%) |
Housing Occupancy in Edenton
Occupancy by Ownership in Edenton
Of the total 2,210 dwellings in Edenton, owner-occupied units account for 936 (42.3%), while renter-occupied units make up 1,274 (57.7%).
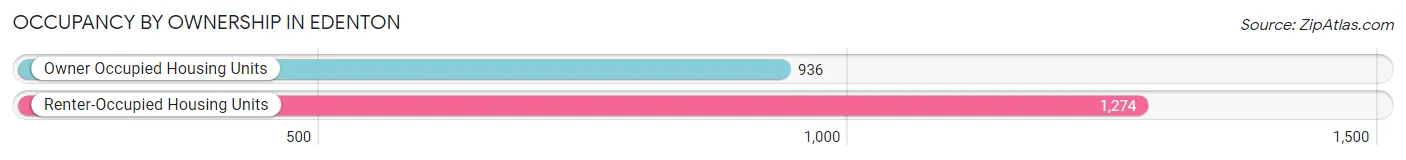
| Occupancy | # Housing Units | % Housing Units |
| Owner Occupied Housing Units | 936 | 42.3% |
| Renter-Occupied Housing Units | 1,274 | 57.7% |
| Total Occupied Housing Units | 2,210 | 100.0% |
Occupancy by Household Size in Edenton
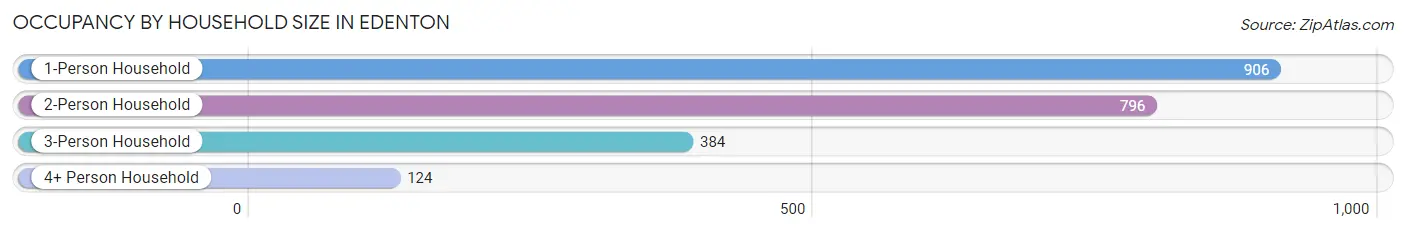
| Household Size | # Housing Units | % Housing Units |
| 1-Person Household | 906 | 41.0% |
| 2-Person Household | 796 | 36.0% |
| 3-Person Household | 384 | 17.4% |
| 4+ Person Household | 124 | 5.6% |
| Total Housing Units | 2,210 | 100.0% |
Occupancy by Ownership by Household Size in Edenton
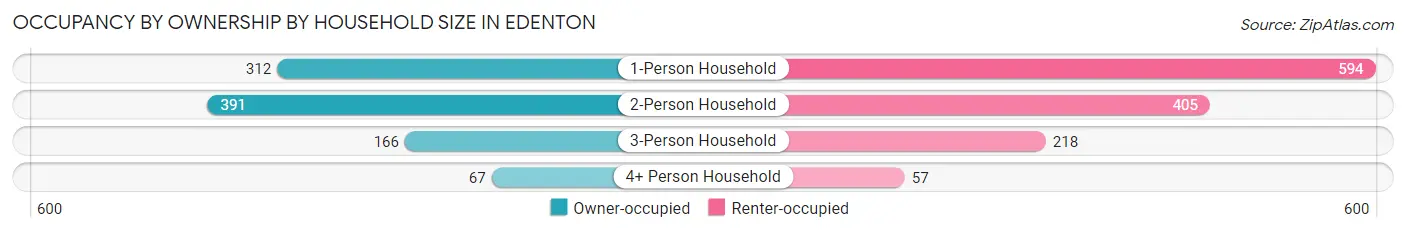
| Household Size | Owner-occupied | Renter-occupied |
| 1-Person Household | 312 (34.4%) | 594 (65.6%) |
| 2-Person Household | 391 (49.1%) | 405 (50.9%) |
| 3-Person Household | 166 (43.2%) | 218 (56.8%) |
| 4+ Person Household | 67 (54.0%) | 57 (46.0%) |
| Total Housing Units | 936 (42.3%) | 1,274 (57.7%) |
Occupancy by Educational Attainment in Edenton
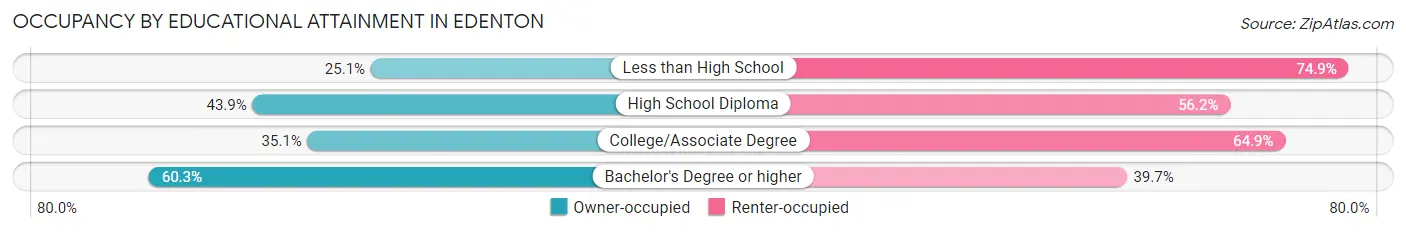
| Household Size | Owner-occupied | Renter-occupied |
| Less than High School | 86 (25.1%) | 257 (74.9%) |
| High School Diploma | 228 (43.9%) | 292 (56.1%) |
| College/Associate Degree | 265 (35.1%) | 490 (64.9%) |
| Bachelor's Degree or higher | 357 (60.3%) | 235 (39.7%) |
Occupancy by Age of Householder in Edenton
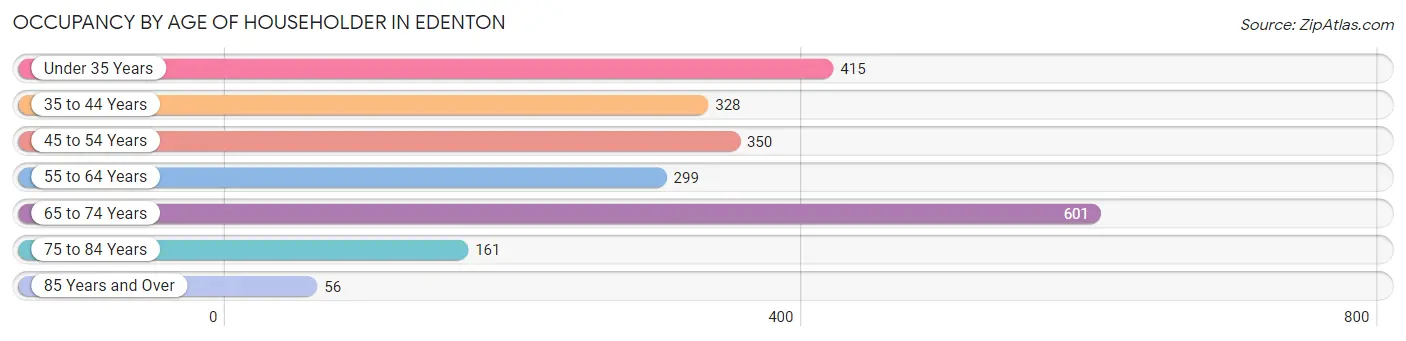
| Age Bracket | # Households | % Households |
| Under 35 Years | 415 | 18.8% |
| 35 to 44 Years | 328 | 14.8% |
| 45 to 54 Years | 350 | 15.8% |
| 55 to 64 Years | 299 | 13.5% |
| 65 to 74 Years | 601 | 27.2% |
| 75 to 84 Years | 161 | 7.3% |
| 85 Years and Over | 56 | 2.5% |
| Total | 2,210 | 100.0% |
Housing Finances in Edenton
Median Income by Occupancy in Edenton
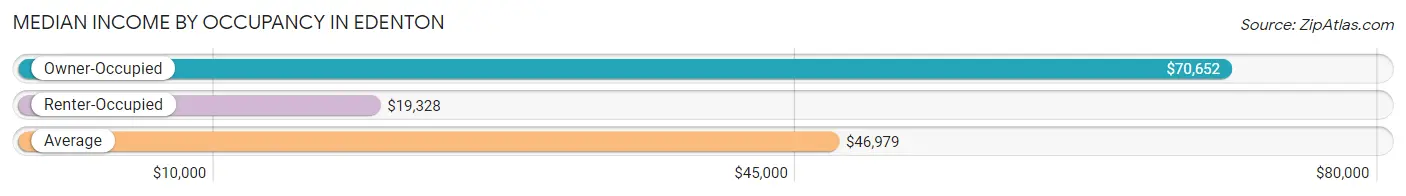
| Occupancy Type | # Households | Median Income |
| Owner-Occupied | 936 (42.3%) | $70,652 |
| Renter-Occupied | 1,274 (57.7%) | $19,328 |
| Average | 2,210 (100.0%) | $46,979 |
Occupancy by Householder Income Bracket in Edenton
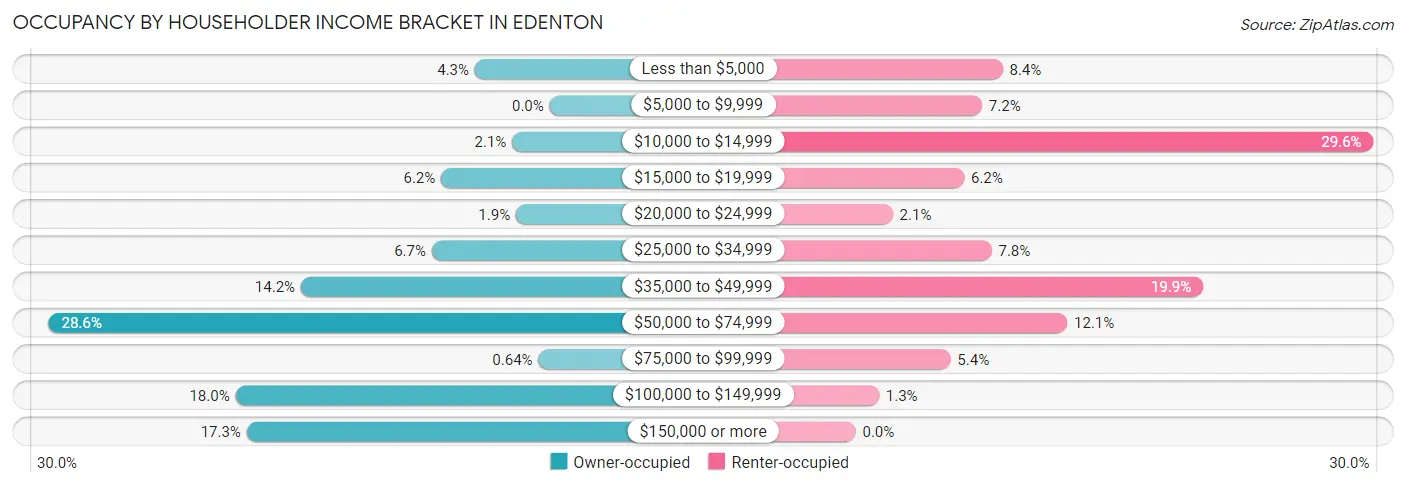
| Income Bracket | Owner-occupied | Renter-occupied |
| Less than $5,000 | 40 (4.3%) | 107 (8.4%) |
| $5,000 to $9,999 | 0 (0.0%) | 92 (7.2%) |
| $10,000 to $14,999 | 20 (2.1%) | 377 (29.6%) |
| $15,000 to $19,999 | 58 (6.2%) | 79 (6.2%) |
| $20,000 to $24,999 | 18 (1.9%) | 27 (2.1%) |
| $25,000 to $34,999 | 63 (6.7%) | 99 (7.8%) |
| $35,000 to $49,999 | 133 (14.2%) | 253 (19.9%) |
| $50,000 to $74,999 | 268 (28.6%) | 154 (12.1%) |
| $75,000 to $99,999 | 6 (0.6%) | 69 (5.4%) |
| $100,000 to $149,999 | 168 (17.9%) | 17 (1.3%) |
| $150,000 or more | 162 (17.3%) | 0 (0.0%) |
| Total | 936 (100.0%) | 1,274 (100.0%) |
Monthly Housing Cost Tiers in Edenton
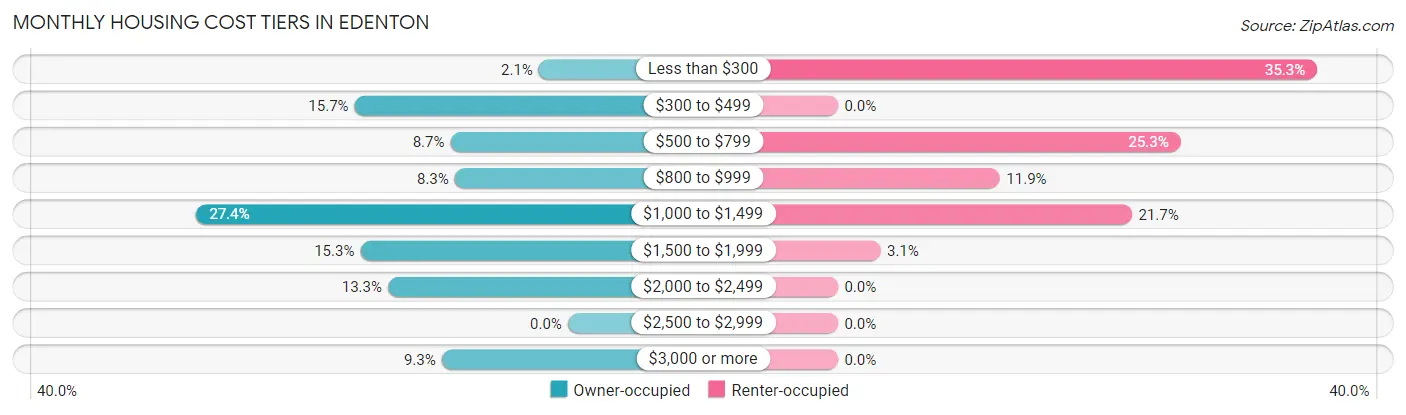
| Monthly Cost | Owner-occupied | Renter-occupied |
| Less than $300 | 20 (2.1%) | 450 (35.3%) |
| $300 to $499 | 147 (15.7%) | 0 (0.0%) |
| $500 to $799 | 81 (8.6%) | 322 (25.3%) |
| $800 to $999 | 78 (8.3%) | 152 (11.9%) |
| $1,000 to $1,499 | 256 (27.4%) | 276 (21.7%) |
| $1,500 to $1,999 | 143 (15.3%) | 40 (3.1%) |
| $2,000 to $2,499 | 124 (13.3%) | 0 (0.0%) |
| $2,500 to $2,999 | 0 (0.0%) | 0 (0.0%) |
| $3,000 or more | 87 (9.3%) | 0 (0.0%) |
| Total | 936 (100.0%) | 1,274 (100.0%) |
Physical Housing Characteristics in Edenton
Housing Structures in Edenton
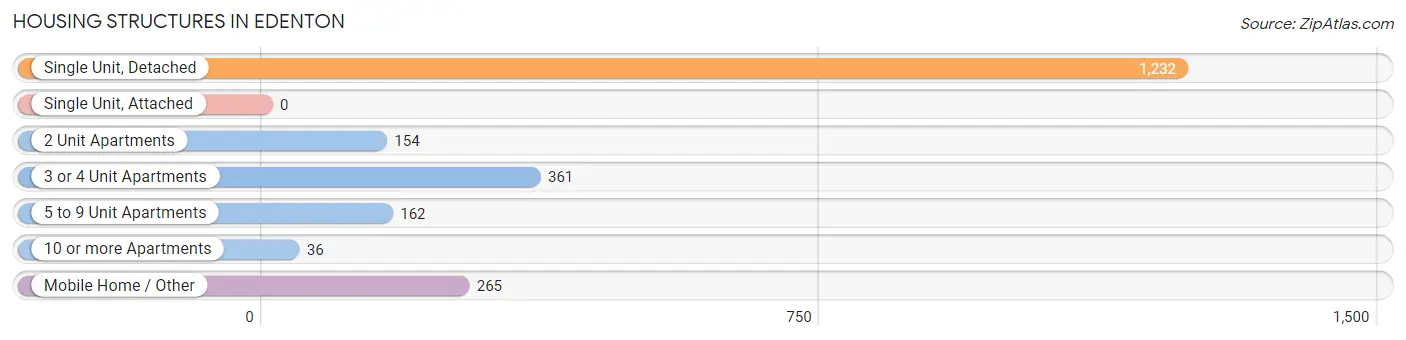
| Structure Type | # Housing Units | % Housing Units |
| Single Unit, Detached | 1,232 | 55.7% |
| Single Unit, Attached | 0 | 0.0% |
| 2 Unit Apartments | 154 | 7.0% |
| 3 or 4 Unit Apartments | 361 | 16.3% |
| 5 to 9 Unit Apartments | 162 | 7.3% |
| 10 or more Apartments | 36 | 1.6% |
| Mobile Home / Other | 265 | 12.0% |
| Total | 2,210 | 100.0% |
Housing Structures by Occupancy in Edenton
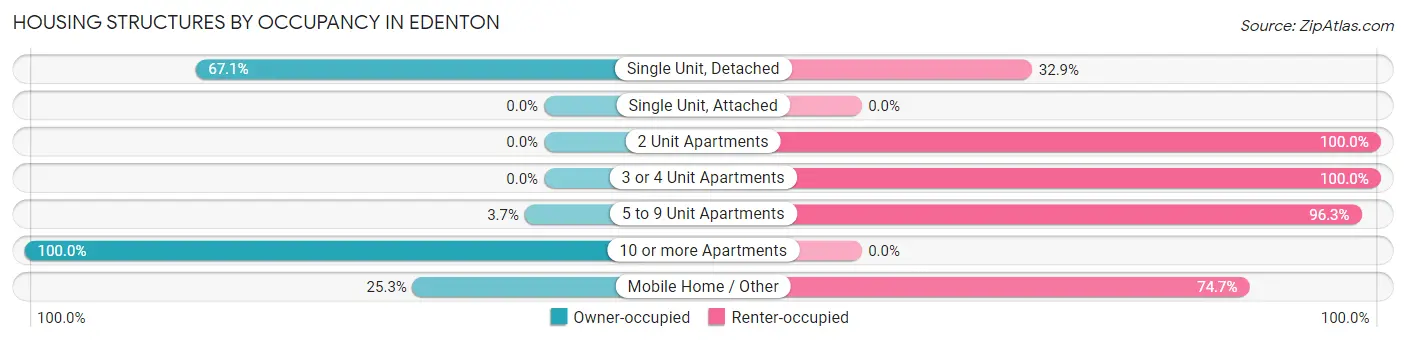
| Structure Type | Owner-occupied | Renter-occupied |
| Single Unit, Detached | 827 (67.1%) | 405 (32.9%) |
| Single Unit, Attached | 0 (0.0%) | 0 (0.0%) |
| 2 Unit Apartments | 0 (0.0%) | 154 (100.0%) |
| 3 or 4 Unit Apartments | 0 (0.0%) | 361 (100.0%) |
| 5 to 9 Unit Apartments | 6 (3.7%) | 156 (96.3%) |
| 10 or more Apartments | 36 (100.0%) | 0 (0.0%) |
| Mobile Home / Other | 67 (25.3%) | 198 (74.7%) |
| Total | 936 (42.3%) | 1,274 (57.7%) |
Housing Structures by Number of Rooms in Edenton
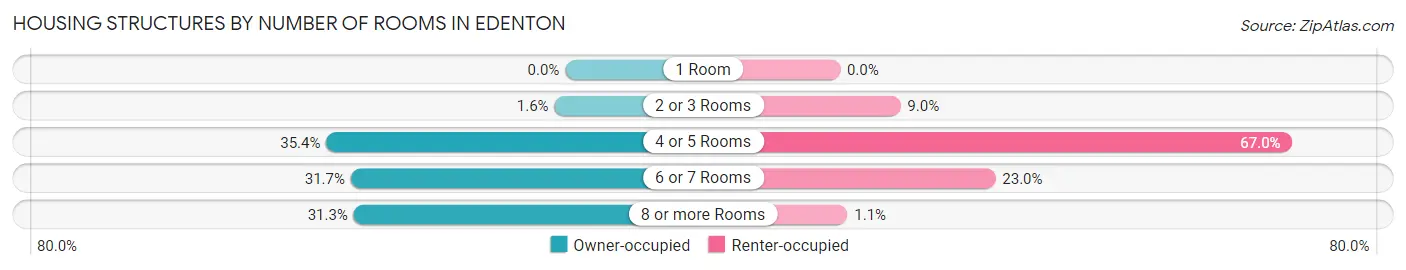
| Number of Rooms | Owner-occupied | Renter-occupied |
| 1 Room | 0 (0.0%) | 0 (0.0%) |
| 2 or 3 Rooms | 15 (1.6%) | 114 (8.9%) |
| 4 or 5 Rooms | 331 (35.4%) | 853 (66.9%) |
| 6 or 7 Rooms | 297 (31.7%) | 293 (23.0%) |
| 8 or more Rooms | 293 (31.3%) | 14 (1.1%) |
| Total | 936 (100.0%) | 1,274 (100.0%) |
Housing Structure by Heating Type in Edenton
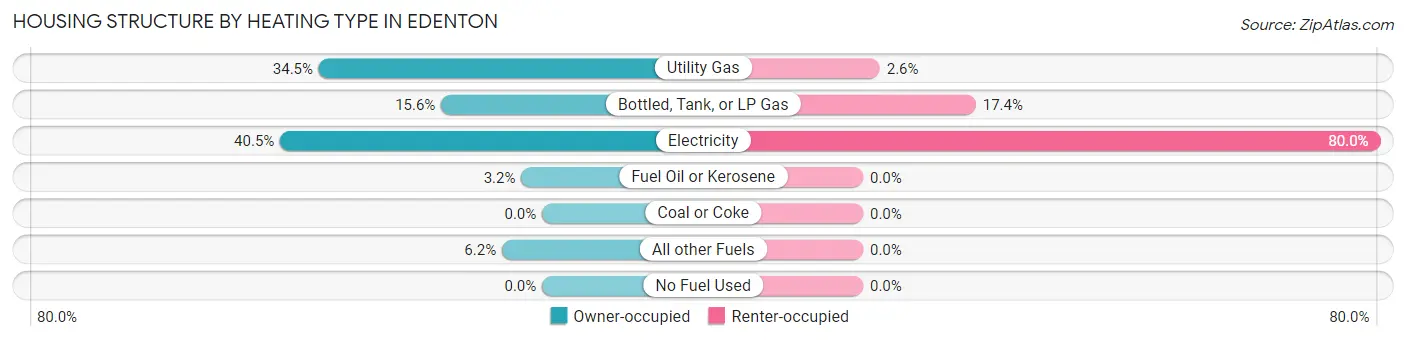
| Heating Type | Owner-occupied | Renter-occupied |
| Utility Gas | 323 (34.5%) | 33 (2.6%) |
| Bottled, Tank, or LP Gas | 146 (15.6%) | 222 (17.4%) |
| Electricity | 379 (40.5%) | 1,019 (80.0%) |
| Fuel Oil or Kerosene | 30 (3.2%) | 0 (0.0%) |
| Coal or Coke | 0 (0.0%) | 0 (0.0%) |
| All other Fuels | 58 (6.2%) | 0 (0.0%) |
| No Fuel Used | 0 (0.0%) | 0 (0.0%) |
| Total | 936 (100.0%) | 1,274 (100.0%) |
Household Vehicle Usage in Edenton
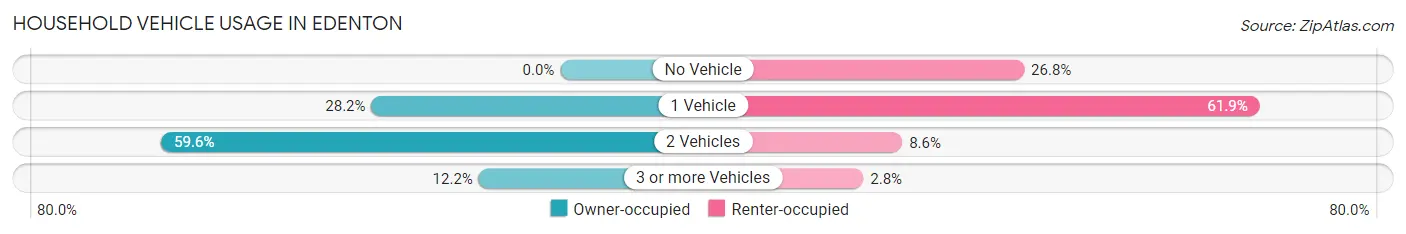
| Vehicles per Household | Owner-occupied | Renter-occupied |
| No Vehicle | 0 (0.0%) | 341 (26.8%) |
| 1 Vehicle | 264 (28.2%) | 789 (61.9%) |
| 2 Vehicles | 558 (59.6%) | 109 (8.6%) |
| 3 or more Vehicles | 114 (12.2%) | 35 (2.8%) |
| Total | 936 (100.0%) | 1,274 (100.0%) |
Real Estate & Mortgages in Edenton
Real Estate and Mortgage Overview in Edenton
| Characteristic | Without Mortgage | With Mortgage |
| Housing Units | 342 | 594 |
| Median Property Value | $227,500 | $220,200 |
| Median Household Income | $60,761 | $83 |
| Monthly Housing Costs | $517 | $87 |
| Real Estate Taxes | - | - |
Property Value by Mortgage Status in Edenton
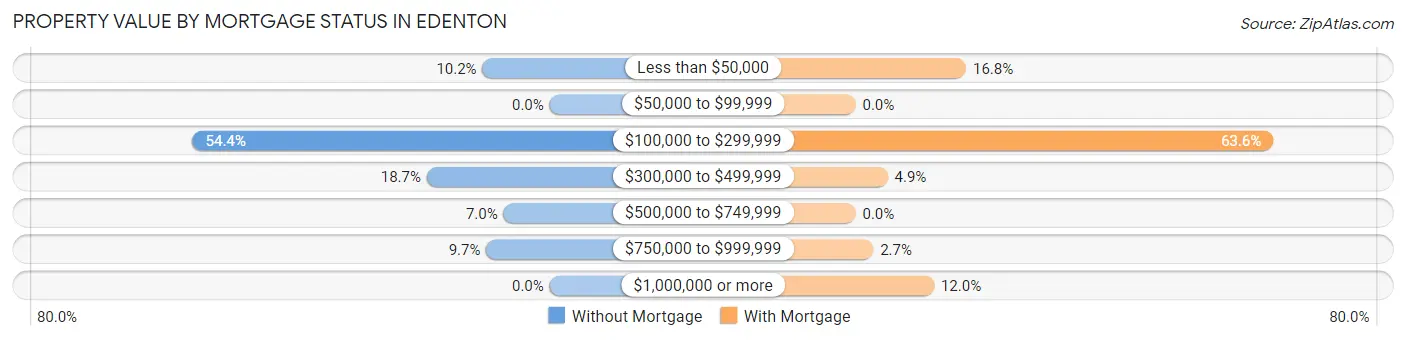
| Property Value | Without Mortgage | With Mortgage |
| Less than $50,000 | 35 (10.2%) | 100 (16.8%) |
| $50,000 to $99,999 | 0 (0.0%) | 0 (0.0%) |
| $100,000 to $299,999 | 186 (54.4%) | 378 (63.6%) |
| $300,000 to $499,999 | 64 (18.7%) | 29 (4.9%) |
| $500,000 to $749,999 | 24 (7.0%) | 0 (0.0%) |
| $750,000 to $999,999 | 33 (9.7%) | 16 (2.7%) |
| $1,000,000 or more | 0 (0.0%) | 71 (11.9%) |
| Total | 342 (100.0%) | 594 (100.0%) |
Household Income by Mortgage Status in Edenton
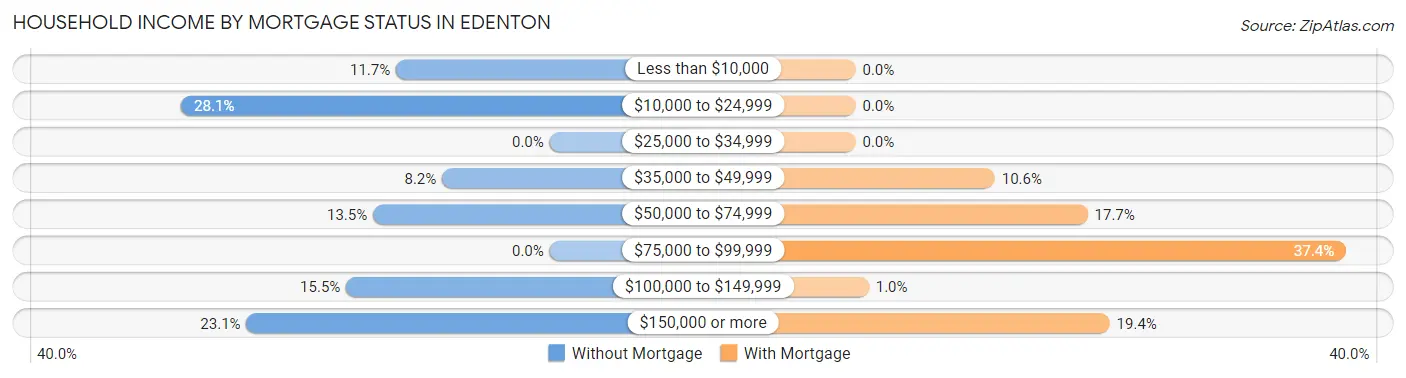
| Household Income | Without Mortgage | With Mortgage |
| Less than $10,000 | 40 (11.7%) | 0 (0.0%) |
| $10,000 to $24,999 | 96 (28.1%) | 0 (0.0%) |
| $25,000 to $34,999 | 0 (0.0%) | 0 (0.0%) |
| $35,000 to $49,999 | 28 (8.2%) | 63 (10.6%) |
| $50,000 to $74,999 | 46 (13.5%) | 105 (17.7%) |
| $75,000 to $99,999 | 0 (0.0%) | 222 (37.4%) |
| $100,000 to $149,999 | 53 (15.5%) | 6 (1.0%) |
| $150,000 or more | 79 (23.1%) | 115 (19.4%) |
| Total | 342 (100.0%) | 594 (100.0%) |
Property Value to Household Income Ratio in Edenton
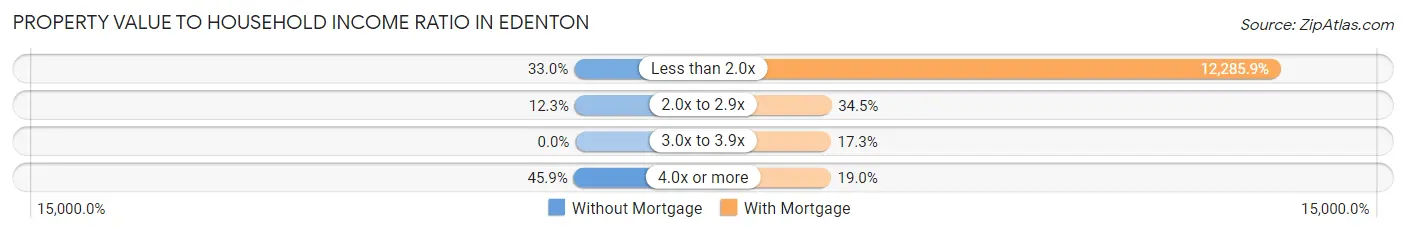
| Value-to-Income Ratio | Without Mortgage | With Mortgage |
| Less than 2.0x | 113 (33.0%) | 72,978 (12,285.9%) |
| 2.0x to 2.9x | 42 (12.3%) | 205 (34.5%) |
| 3.0x to 3.9x | 0 (0.0%) | 103 (17.3%) |
| 4.0x or more | 157 (45.9%) | 113 (19.0%) |
| Total | 342 (100.0%) | 594 (100.0%) |
Real Estate Taxes by Mortgage Status in Edenton
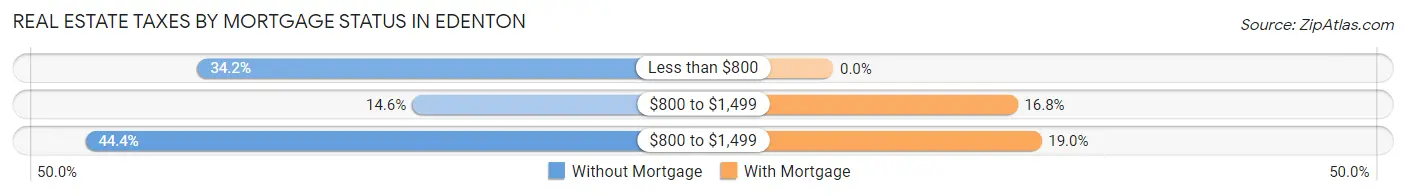
| Property Taxes | Without Mortgage | With Mortgage |
| Less than $800 | 117 (34.2%) | 0 (0.0%) |
| $800 to $1,499 | 50 (14.6%) | 100 (16.8%) |
| $800 to $1,499 | 152 (44.4%) | 113 (19.0%) |
| Total | 342 (100.0%) | 594 (100.0%) |
Health & Disability in Edenton
Health Insurance Coverage by Age in Edenton
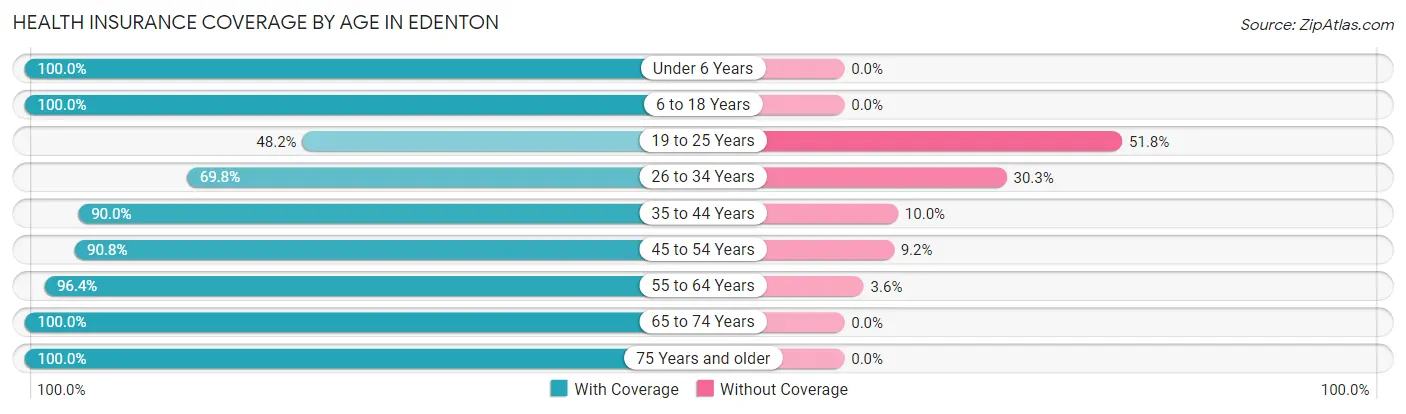
| Age Bracket | With Coverage | Without Coverage |
| Under 6 Years | 453 (100.0%) | 0 (0.0%) |
| 6 to 18 Years | 427 (100.0%) | 0 (0.0%) |
| 19 to 25 Years | 40 (48.2%) | 43 (51.8%) |
| 26 to 34 Years | 498 (69.8%) | 216 (30.2%) |
| 35 to 44 Years | 459 (90.0%) | 51 (10.0%) |
| 45 to 54 Years | 532 (90.8%) | 54 (9.2%) |
| 55 to 64 Years | 401 (96.4%) | 15 (3.6%) |
| 65 to 74 Years | 735 (100.0%) | 0 (0.0%) |
| 75 Years and older | 364 (100.0%) | 0 (0.0%) |
| Total | 3,909 (91.2%) | 379 (8.8%) |
Health Insurance Coverage by Citizenship Status in Edenton
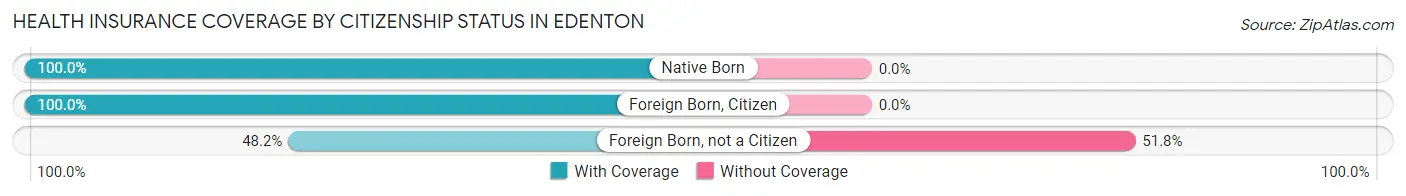
| Citizenship Status | With Coverage | Without Coverage |
| Native Born | 453 (100.0%) | 0 (0.0%) |
| Foreign Born, Citizen | 427 (100.0%) | 0 (0.0%) |
| Foreign Born, not a Citizen | 40 (48.2%) | 43 (51.8%) |
Health Insurance Coverage by Household Income in Edenton
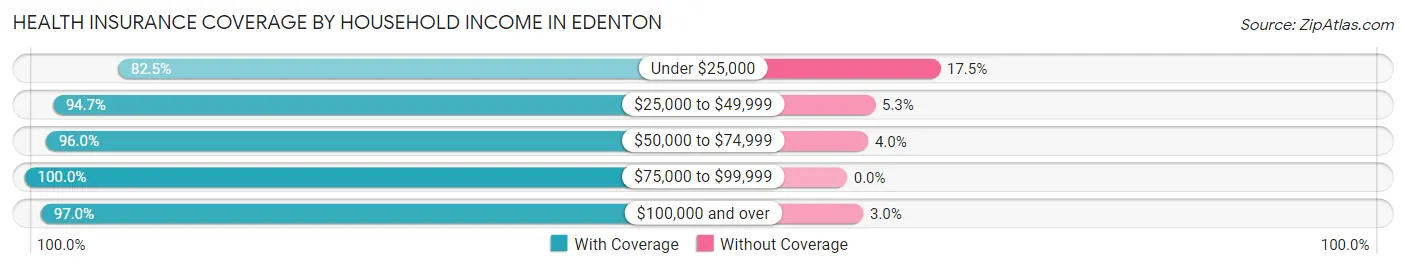
| Household Income | With Coverage | Without Coverage |
| Under $25,000 | 1,294 (82.5%) | 274 (17.5%) |
| $25,000 to $49,999 | 916 (94.7%) | 51 (5.3%) |
| $50,000 to $74,999 | 701 (96.0%) | 29 (4.0%) |
| $75,000 to $99,999 | 163 (100.0%) | 0 (0.0%) |
| $100,000 and over | 797 (97.0%) | 25 (3.0%) |
Public vs Private Health Insurance Coverage by Age in Edenton
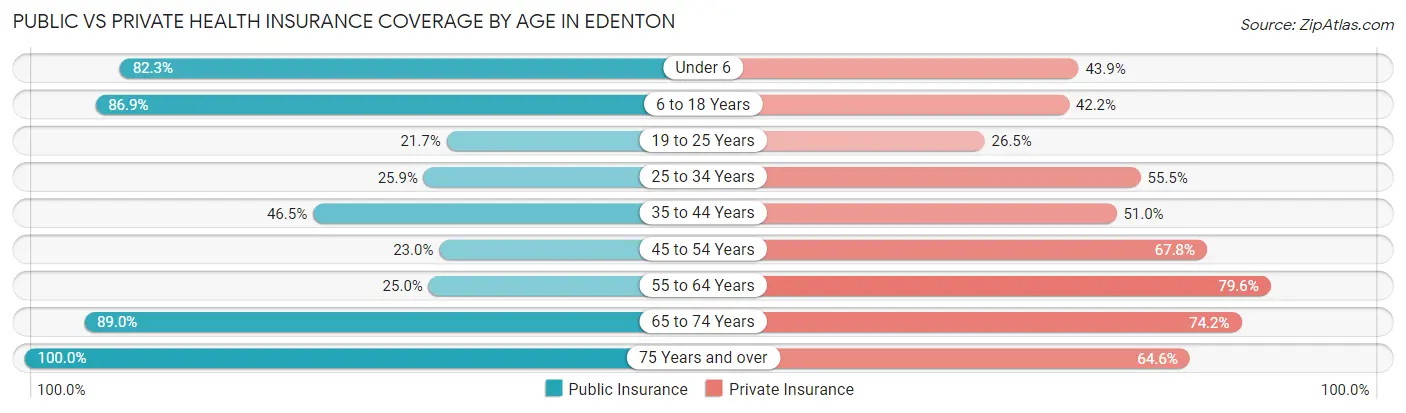
| Age Bracket | Public Insurance | Private Insurance |
| Under 6 | 373 (82.3%) | 199 (43.9%) |
| 6 to 18 Years | 371 (86.9%) | 180 (42.1%) |
| 19 to 25 Years | 18 (21.7%) | 22 (26.5%) |
| 25 to 34 Years | 185 (25.9%) | 396 (55.5%) |
| 35 to 44 Years | 237 (46.5%) | 260 (51.0%) |
| 45 to 54 Years | 135 (23.0%) | 397 (67.7%) |
| 55 to 64 Years | 104 (25.0%) | 331 (79.6%) |
| 65 to 74 Years | 654 (89.0%) | 545 (74.2%) |
| 75 Years and over | 364 (100.0%) | 235 (64.6%) |
| Total | 2,441 (56.9%) | 2,565 (59.8%) |
Disability Status by Sex by Age in Edenton
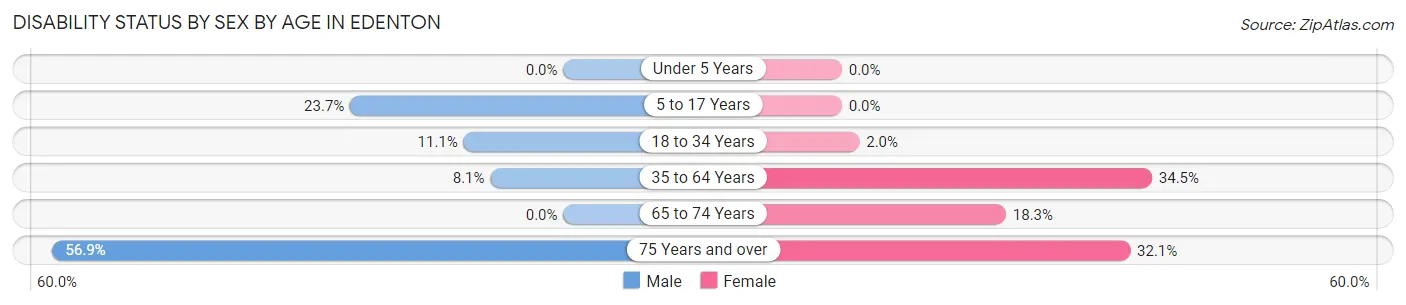
| Age Bracket | Male | Female |
| Under 5 Years | 0 (0.0%) | 0 (0.0%) |
| 5 to 17 Years | 80 (23.7%) | 0 (0.0%) |
| 18 to 34 Years | 43 (11.1%) | 8 (1.9%) |
| 35 to 64 Years | 57 (8.1%) | 280 (34.5%) |
| 65 to 74 Years | 0 (0.0%) | 74 (18.3%) |
| 75 Years and over | 99 (56.9%) | 61 (32.1%) |
Disability Class by Sex by Age in Edenton
Disability Class: Hearing Difficulty
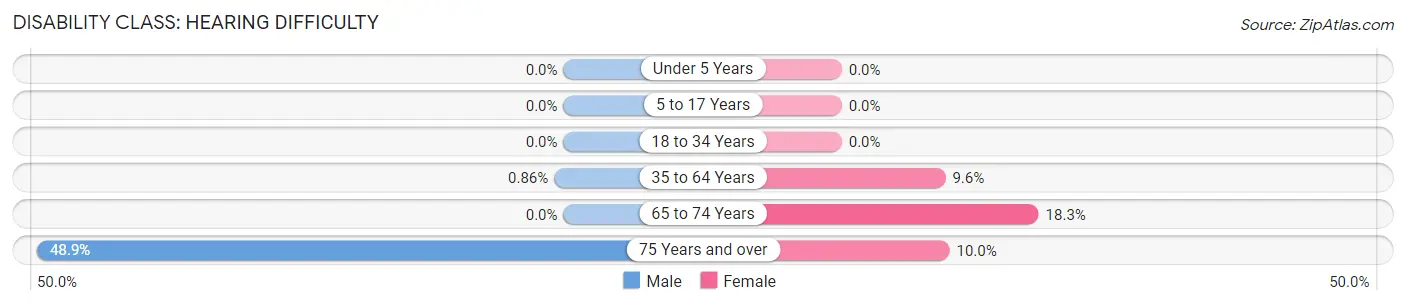
| Age Bracket | Male | Female |
| Under 5 Years | 0 (0.0%) | 0 (0.0%) |
| 5 to 17 Years | 0 (0.0%) | 0 (0.0%) |
| 18 to 34 Years | 0 (0.0%) | 0 (0.0%) |
| 35 to 64 Years | 6 (0.9%) | 78 (9.6%) |
| 65 to 74 Years | 0 (0.0%) | 74 (18.3%) |
| 75 Years and over | 85 (48.8%) | 19 (10.0%) |
Disability Class: Vision Difficulty
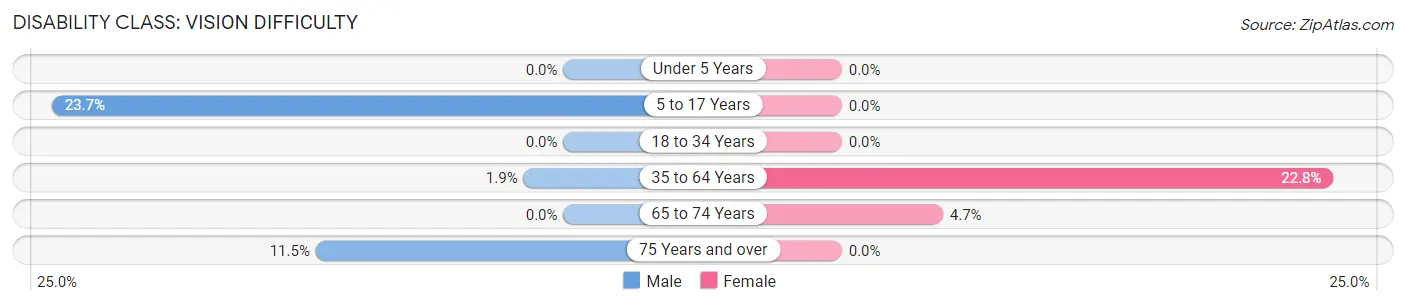
| Age Bracket | Male | Female |
| Under 5 Years | 0 (0.0%) | 0 (0.0%) |
| 5 to 17 Years | 80 (23.7%) | 0 (0.0%) |
| 18 to 34 Years | 0 (0.0%) | 0 (0.0%) |
| 35 to 64 Years | 13 (1.8%) | 185 (22.8%) |
| 65 to 74 Years | 0 (0.0%) | 19 (4.7%) |
| 75 Years and over | 20 (11.5%) | 0 (0.0%) |
Disability Class: Cognitive Difficulty
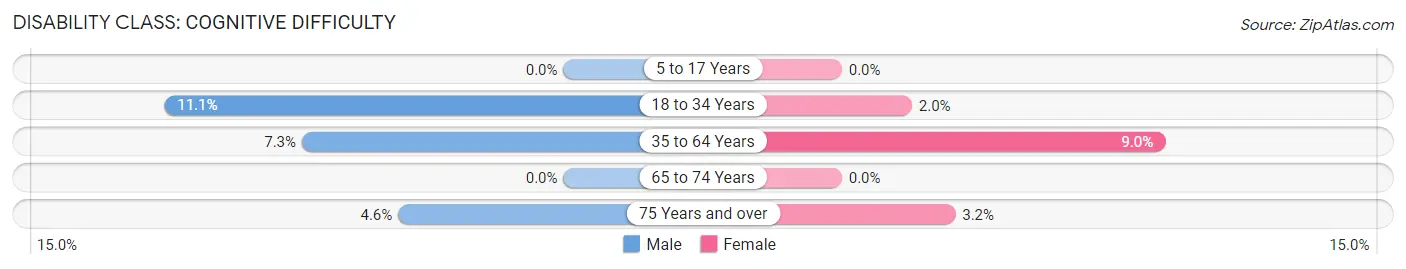
| Age Bracket | Male | Female |
| 5 to 17 Years | 0 (0.0%) | 0 (0.0%) |
| 18 to 34 Years | 43 (11.1%) | 8 (1.9%) |
| 35 to 64 Years | 51 (7.3%) | 73 (9.0%) |
| 65 to 74 Years | 0 (0.0%) | 0 (0.0%) |
| 75 Years and over | 8 (4.6%) | 6 (3.2%) |
Disability Class: Ambulatory Difficulty
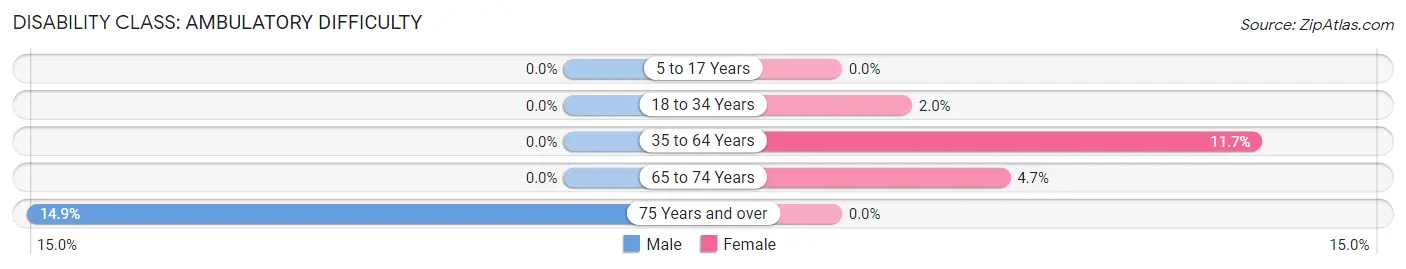
| Age Bracket | Male | Female |
| 5 to 17 Years | 0 (0.0%) | 0 (0.0%) |
| 18 to 34 Years | 0 (0.0%) | 8 (1.9%) |
| 35 to 64 Years | 0 (0.0%) | 95 (11.7%) |
| 65 to 74 Years | 0 (0.0%) | 19 (4.7%) |
| 75 Years and over | 26 (14.9%) | 0 (0.0%) |
Disability Class: Self-Care Difficulty
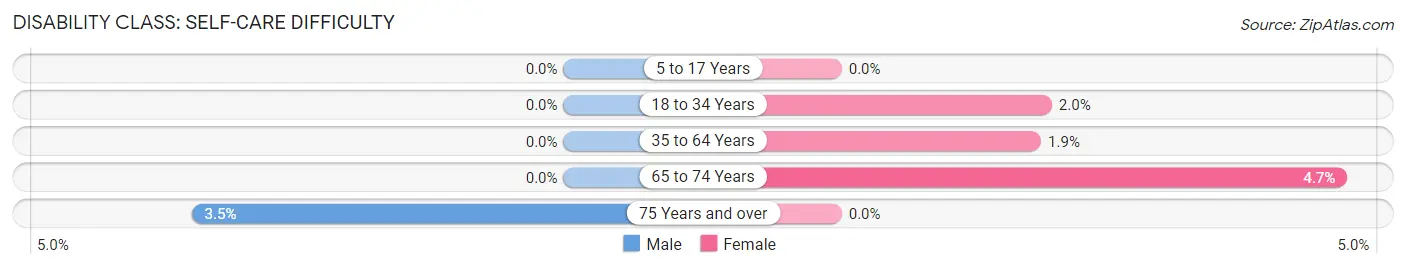
| Age Bracket | Male | Female |
| 5 to 17 Years | 0 (0.0%) | 0 (0.0%) |
| 18 to 34 Years | 0 (0.0%) | 8 (1.9%) |
| 35 to 64 Years | 0 (0.0%) | 15 (1.8%) |
| 65 to 74 Years | 0 (0.0%) | 19 (4.7%) |
| 75 Years and over | 6 (3.5%) | 0 (0.0%) |
Technology Access in Edenton
Computing Device Access in Edenton
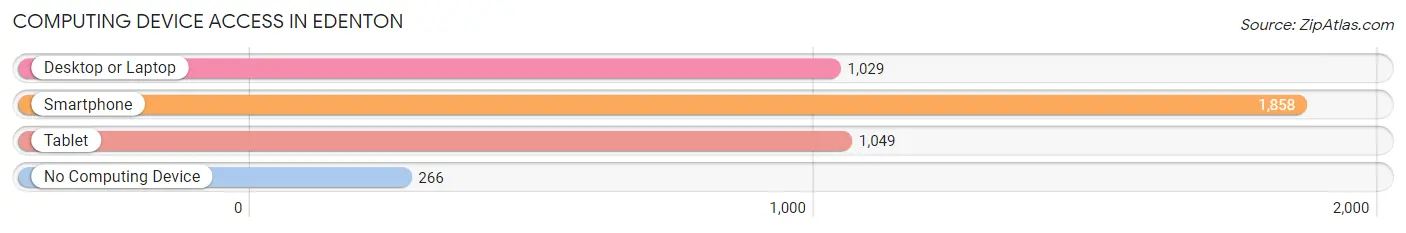
| Device Type | # Households | % Households |
| Desktop or Laptop | 1,029 | 46.6% |
| Smartphone | 1,858 | 84.1% |
| Tablet | 1,049 | 47.5% |
| No Computing Device | 266 | 12.0% |
| Total | 2,210 | 100.0% |
Internet Access in Edenton
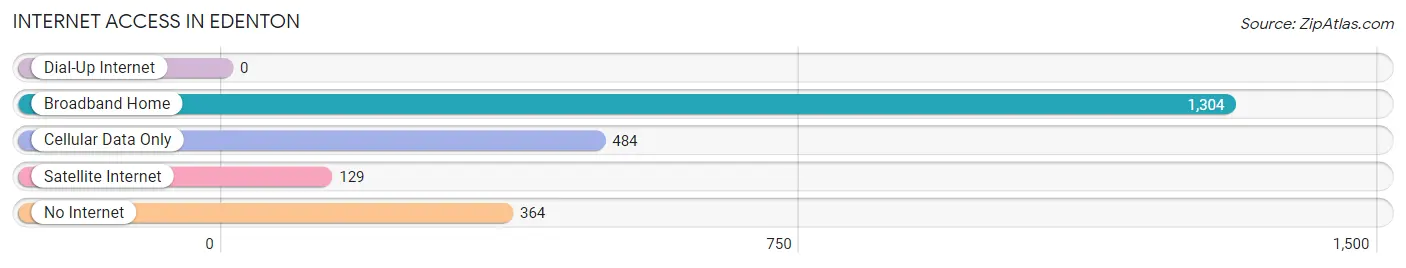
| Internet Type | # Households | % Households |
| Dial-Up Internet | 0 | 0.0% |
| Broadband Home | 1,304 | 59.0% |
| Cellular Data Only | 484 | 21.9% |
| Satellite Internet | 129 | 5.8% |
| No Internet | 364 | 16.5% |
| Total | 2,210 | 100.0% |
Edenton Summary
Edenton, NC is a small town located in the northeastern corner of North Carolina. It is situated on the Albemarle Sound, a large body of water that separates the mainland from the Outer Banks. The town is the county seat of Chowan County and is part of the Inner Banks region of the state. Edenton has a population of 5,004 as of the 2010 census and is the second oldest town in North Carolina.
History
Edenton was founded in 1712 by a group of English settlers led by John Heckleman. The town was named after Governor Charles Eden, who had granted the settlers a charter to establish the town. The settlers built a fort to protect the town from Native American attacks and the town quickly grew. By 1722, Edenton had become the largest town in the colony of North Carolina.
During the American Revolution, Edenton was a major center of Patriot activity. The Edenton Tea Party, held in 1774, was the first organized political protest against British rule in the colonies. The town was also the site of the Edenton Declaration of Independence, which was signed by fifty-one men in 1775.
In the 19th century, Edenton became a major port and shipbuilding center. The town was also a center of the slave trade, with many of the ships built in Edenton being used to transport slaves to the West Indies.
Geography
Edenton is located in the northeastern corner of North Carolina, on the Albemarle Sound. The town is situated on the banks of the Chowan River, which flows into the sound. The town is surrounded by rural farmland and is located about 50 miles south of Norfolk, Virginia.
The climate in Edenton is humid subtropical, with hot, humid summers and mild winters. The average annual temperature is around 68°F (20°C). The town receives an average of 48 inches (122 cm) of precipitation per year.
Economy
Edenton’s economy is largely based on tourism and agriculture. The town is home to several historic sites, including the Cupola House, the oldest surviving house in North Carolina, and the Edenton Cotton Mill, which is now a museum. The town also has several marinas and boat docks, which attract visitors from all over the region.
Agriculture is also an important part of the local economy. The town is home to several large farms, which produce corn, soybeans, wheat, and other crops. The town also has several seafood processing plants, which process local catches of shrimp, oysters, and other seafood.
Demographics
As of the 2010 census, Edenton had a population of 5,004. The racial makeup of the town was 79.3% White, 17.2% African American, 0.7% Native American, 0.7% Asian, 0.2% Pacific Islander, and 1.9% from other races. Hispanic or Latino of any race were 2.3% of the population.
The median household income in Edenton was $35,945, and the median family income was $45,945. The per capita income for the town was $20,945. About 17.2% of the population was below the poverty line.
Edenton is served by the Edenton-Chowan County Public Schools system. The town is home to several churches, including the Edenton United Methodist Church, the Edenton Baptist Church, and the Edenton Presbyterian Church. The town also has several parks and recreational facilities, including the Edenton Bayfront Park and the Edenton Marina.
Common Questions
What is Per Capita Income in Edenton?
Per Capita income in Edenton is $29,316.
What is the Median Family Income in Edenton?
Median Family Income in Edenton is $40,682.
What is the Median Household income in Edenton?
Median Household Income in Edenton is $46,979.
What is Income or Wage Gap in Edenton?
Income or Wage Gap in Edenton is 57.9%.
Women in Edenton earn 42.1 cents for every dollar earned by a man.
What is Inequality or Gini Index in Edenton?
Inequality or Gini Index in Edenton is 0.53.
What is the Total Population of Edenton?
Total Population of Edenton is 4,512.
What is the Total Male Population of Edenton?
Total Male Population of Edenton is 2,148.
What is the Total Female Population of Edenton?
Total Female Population of Edenton is 2,364.
What is the Ratio of Males per 100 Females in Edenton?
There are 90.86 Males per 100 Females in Edenton.
What is the Ratio of Females per 100 Males in Edenton?
There are 110.06 Females per 100 Males in Edenton.
What is the Median Population Age in Edenton?
Median Population Age in Edenton is 45.5 Years.
What is the Average Family Size in Edenton
Average Family Size in Edenton is 2.5 People.
What is the Average Household Size in Edenton
Average Household Size in Edenton is 1.9 People.
How Large is the Labor Force in Edenton?
There are 2,084 People in the Labor Forcein in Edenton.
What is the Percentage of People in the Labor Force in Edenton?
56.2% of People are in the Labor Force in Edenton.
What is the Unemployment Rate in Edenton?
Unemployment Rate in Edenton is 6.2%.