Gilbert, MN Map & Demographics
Gilbert Map
Gilbert Overview
$31,728
PER CAPITA INCOME
$73,182
AVG FAMILY INCOME
$51,250
AVG HOUSEHOLD INCOME
60.5%
WAGE / INCOME GAP [ % ]
39.5¢/ $1
WAGE / INCOME GAP [ $ ]
0.44
INEQUALITY / GINI INDEX
1,821
TOTAL POPULATION
884
MALE POPULATION
937
FEMALE POPULATION
94.34
MALES / 100 FEMALES
106.00
FEMALES / 100 MALES
45.6
MEDIAN AGE
2.8
AVG FAMILY SIZE
2.3
AVG HOUSEHOLD SIZE
784
LABOR FORCE [ PEOPLE ]
52.8%
PERCENT IN LABOR FORCE
1.1%
UNEMPLOYMENT RATE
Gilbert Zip Codes
Gilbert Area Codes
Income in Gilbert
Income Overview in Gilbert
Per Capita Income in Gilbert is $31,728, while median incomes of families and households are $73,182 and $51,250 respectively.
| Characteristic | Number | Measure |
| Per Capita Income | 1,821 | $31,728 |
| Median Family Income | 500 | $73,182 |
| Mean Family Income | 500 | $86,587 |
| Median Household Income | 794 | $51,250 |
| Mean Household Income | 794 | $71,233 |
| Income Deficit | 500 | $0 |
| Wage / Income Gap (%) | 1,821 | 60.46% |
| Wage / Income Gap ($) | 1,821 | 39.54¢ per $1 |
| Gini / Inequality Index | 1,821 | 0.44 |
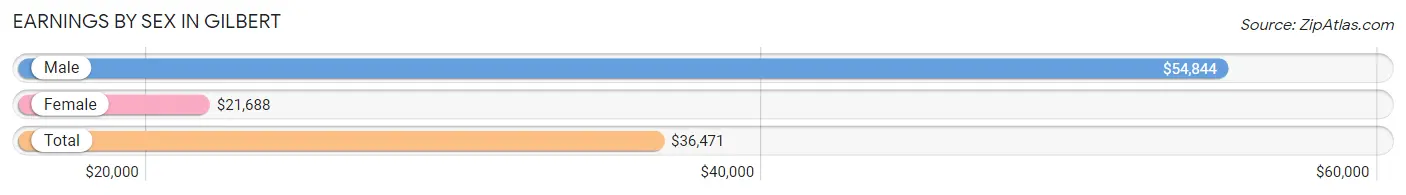
Earnings by Sex in Gilbert
Average Earnings in Gilbert are $36,471, $54,844 for men and $21,688 for women, a difference of 60.5%.
| Sex | Number | Average Earnings |
| Male | 435 (53.2%) | $54,844 |
| Female | 383 (46.8%) | $21,688 |
| Total | 818 (100.0%) | $36,471 |
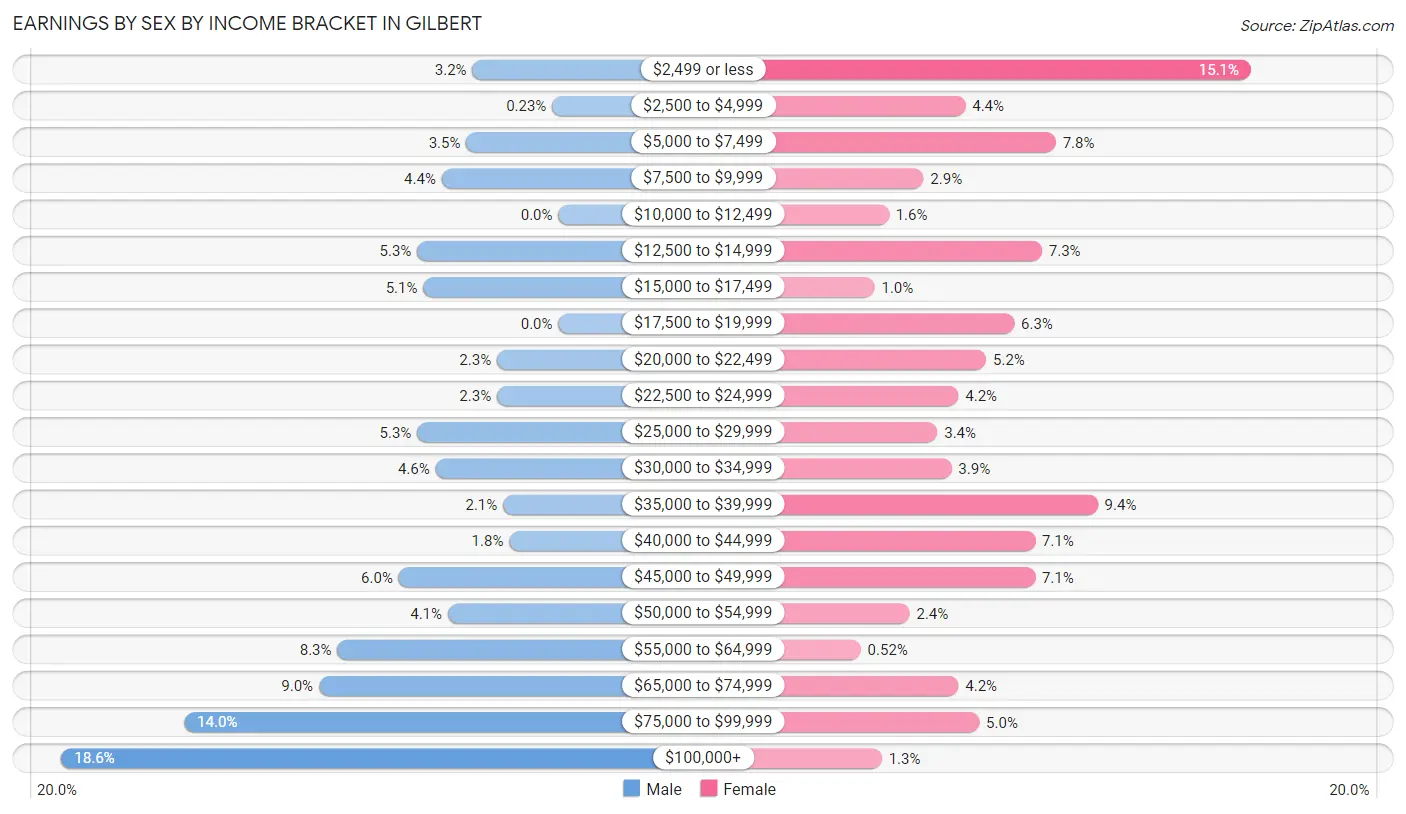
Earnings by Sex by Income Bracket in Gilbert
The most common earnings brackets in Gilbert are $100,000+ for men (81 | 18.6%) and $2,499 or less for women (58 | 15.1%).
| Income | Male | Female |
| $2,499 or less | 14 (3.2%) | 58 (15.1%) |
| $2,500 to $4,999 | 1 (0.2%) | 17 (4.4%) |
| $5,000 to $7,499 | 15 (3.5%) | 30 (7.8%) |
| $7,500 to $9,999 | 19 (4.4%) | 11 (2.9%) |
| $10,000 to $12,499 | 0 (0.0%) | 6 (1.6%) |
| $12,500 to $14,999 | 23 (5.3%) | 28 (7.3%) |
| $15,000 to $17,499 | 22 (5.1%) | 4 (1.0%) |
| $17,500 to $19,999 | 0 (0.0%) | 24 (6.3%) |
| $20,000 to $22,499 | 10 (2.3%) | 20 (5.2%) |
| $22,500 to $24,999 | 10 (2.3%) | 16 (4.2%) |
| $25,000 to $29,999 | 23 (5.3%) | 13 (3.4%) |
| $30,000 to $34,999 | 20 (4.6%) | 15 (3.9%) |
| $35,000 to $39,999 | 9 (2.1%) | 36 (9.4%) |
| $40,000 to $44,999 | 8 (1.8%) | 27 (7.0%) |
| $45,000 to $49,999 | 26 (6.0%) | 27 (7.0%) |
| $50,000 to $54,999 | 18 (4.1%) | 9 (2.4%) |
| $55,000 to $64,999 | 36 (8.3%) | 2 (0.5%) |
| $65,000 to $74,999 | 39 (9.0%) | 16 (4.2%) |
| $75,000 to $99,999 | 61 (14.0%) | 19 (5.0%) |
| $100,000+ | 81 (18.6%) | 5 (1.3%) |
| Total | 435 (100.0%) | 383 (100.0%) |
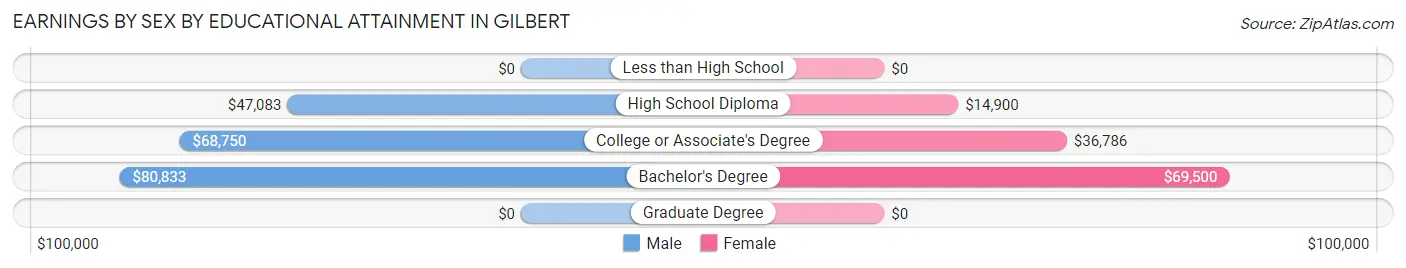
Earnings by Sex by Educational Attainment in Gilbert
Average earnings in Gilbert are $61,786 for men and $29,545 for women, a difference of 52.2%. Men with an educational attainment of bachelor's degree enjoy the highest average annual earnings of $80,833, while those with high school diploma education earn the least with $47,083. Women with an educational attainment of bachelor's degree earn the most with the average annual earnings of $69,500, while those with high school diploma education have the smallest earnings of $14,900.
| Educational Attainment | Male Income | Female Income |
| Less than High School | - | - |
| High School Diploma | $47,083 | $14,900 |
| College or Associate's Degree | $68,750 | $36,786 |
| Bachelor's Degree | $80,833 | $69,500 |
| Graduate Degree | - | - |
| Total | $61,786 | $29,545 |
Family Income in Gilbert
Family Income Brackets in Gilbert
According to the Gilbert family income data, there are 84 families falling into the $50,000 to $74,999 income range, which is the most common income bracket and makes up 16.8% of all families. Conversely, the $25,000 to $34,999 income bracket is the least frequent group with only 11 families (2.2%) belonging to this category.
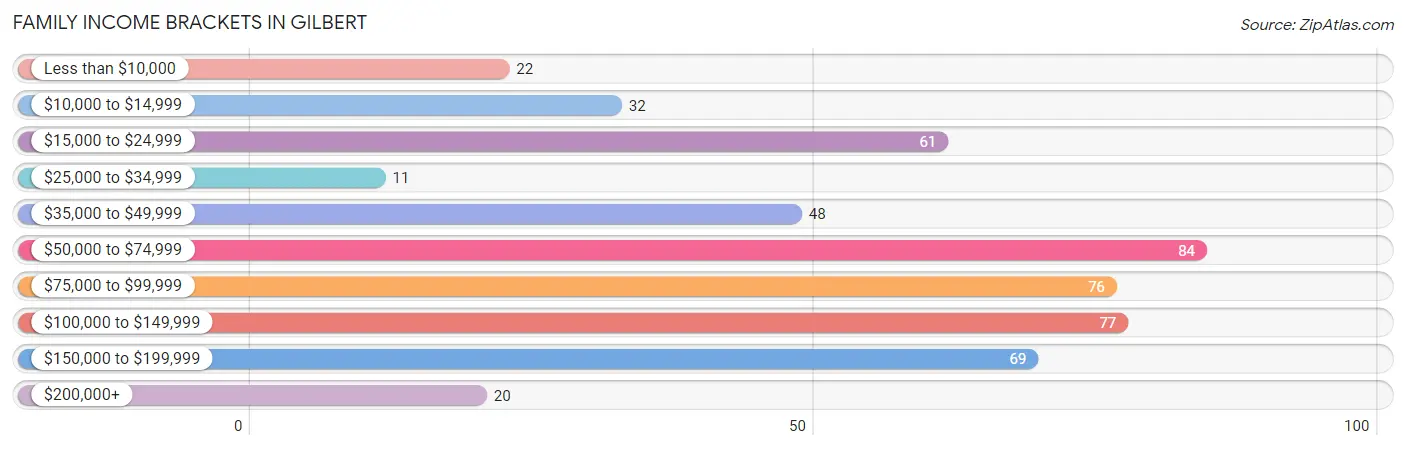
| Income Bracket | # Families | % Families |
| Less than $10,000 | 22 | 4.4% |
| $10,000 to $14,999 | 32 | 6.4% |
| $15,000 to $24,999 | 61 | 12.2% |
| $25,000 to $34,999 | 11 | 2.2% |
| $35,000 to $49,999 | 48 | 9.6% |
| $50,000 to $74,999 | 84 | 16.8% |
| $75,000 to $99,999 | 76 | 15.2% |
| $100,000 to $149,999 | 77 | 15.4% |
| $150,000 to $199,999 | 69 | 13.8% |
| $200,000+ | 20 | 4.0% |
Family Income by Famaliy Size in Gilbert
4-person families (63 | 12.6%) account for the highest median family income in Gilbert with $117,679 per family, while 2-person families (244 | 48.8%) have the highest median income of $30,938 per family member.
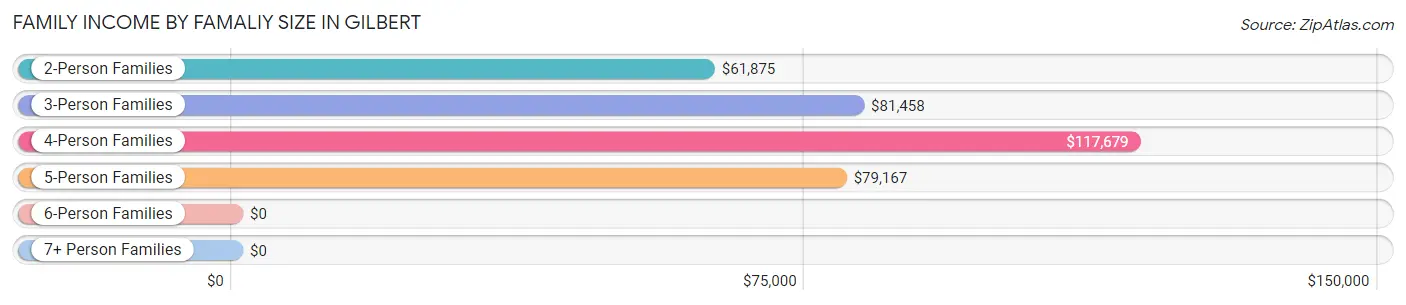
| Income Bracket | # Families | Median Income |
| 2-Person Families | 244 (48.8%) | $61,875 |
| 3-Person Families | 153 (30.6%) | $81,458 |
| 4-Person Families | 63 (12.6%) | $117,679 |
| 5-Person Families | 12 (2.4%) | $79,167 |
| 6-Person Families | 28 (5.6%) | $0 |
| 7+ Person Families | 0 (0.0%) | $0 |
| Total | 500 (100.0%) | $73,182 |
Family Income by Number of Earners in Gilbert
The median family income in Gilbert is $73,182, with families comprising 3+ earners (52) having the highest median family income of $174,000, while families with 1 earner (210) have the lowest median family income of $48,542, accounting for 10.4% and 42.0% of families, respectively.
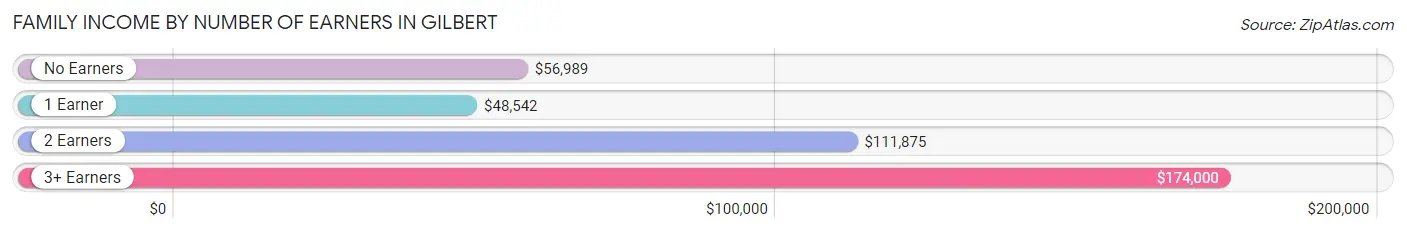
| Number of Earners | # Families | Median Income |
| No Earners | 111 (22.2%) | $56,989 |
| 1 Earner | 210 (42.0%) | $48,542 |
| 2 Earners | 127 (25.4%) | $111,875 |
| 3+ Earners | 52 (10.4%) | $174,000 |
| Total | 500 (100.0%) | $73,182 |
Household Income in Gilbert
Household Income Brackets in Gilbert
With 135 households falling in the category, the $15,000 to $24,999 income range is the most frequent in Gilbert, accounting for 17.0% of all households. In contrast, only 20 households (2.5%) fall into the $200,000+ income bracket, making it the least populous group.
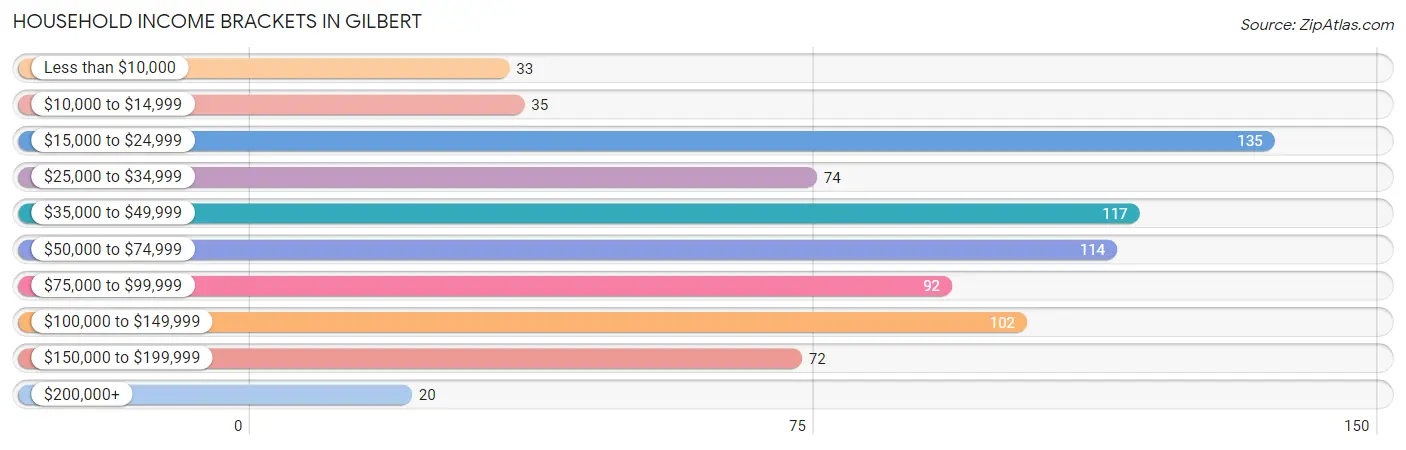
| Income Bracket | # Households | % Households |
| Less than $10,000 | 33 | 4.2% |
| $10,000 to $14,999 | 35 | 4.4% |
| $15,000 to $24,999 | 135 | 17.0% |
| $25,000 to $34,999 | 74 | 9.3% |
| $35,000 to $49,999 | 117 | 14.7% |
| $50,000 to $74,999 | 114 | 14.4% |
| $75,000 to $99,999 | 92 | 11.6% |
| $100,000 to $149,999 | 102 | 12.8% |
| $150,000 to $199,999 | 72 | 9.1% |
| $200,000+ | 20 | 2.5% |
Household Income by Householder Age in Gilbert
The median household income in Gilbert is $51,250, with the highest median household income of $57,500 found in the 45 to 64 years age bracket for the primary householder. A total of 318 households (40.1%) fall into this category.
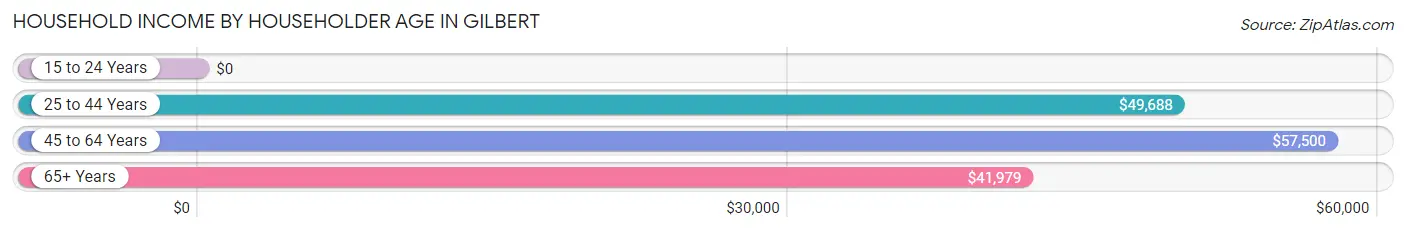
| Income Bracket | # Households | Median Income |
| 15 to 24 Years | 0 (0.0%) | $0 |
| 25 to 44 Years | 177 (22.3%) | $49,688 |
| 45 to 64 Years | 318 (40.1%) | $57,500 |
| 65+ Years | 299 (37.7%) | $41,979 |
| Total | 794 (100.0%) | $51,250 |
Poverty in Gilbert
Income Below Poverty by Sex and Age in Gilbert
With 17.4% poverty level for males and 19.2% for females among the residents of Gilbert, 5 year old males and 15 year old females are the most vulnerable to poverty, with 6 males (60.0%) and 8 females (66.7%) in their respective age groups living below the poverty level.
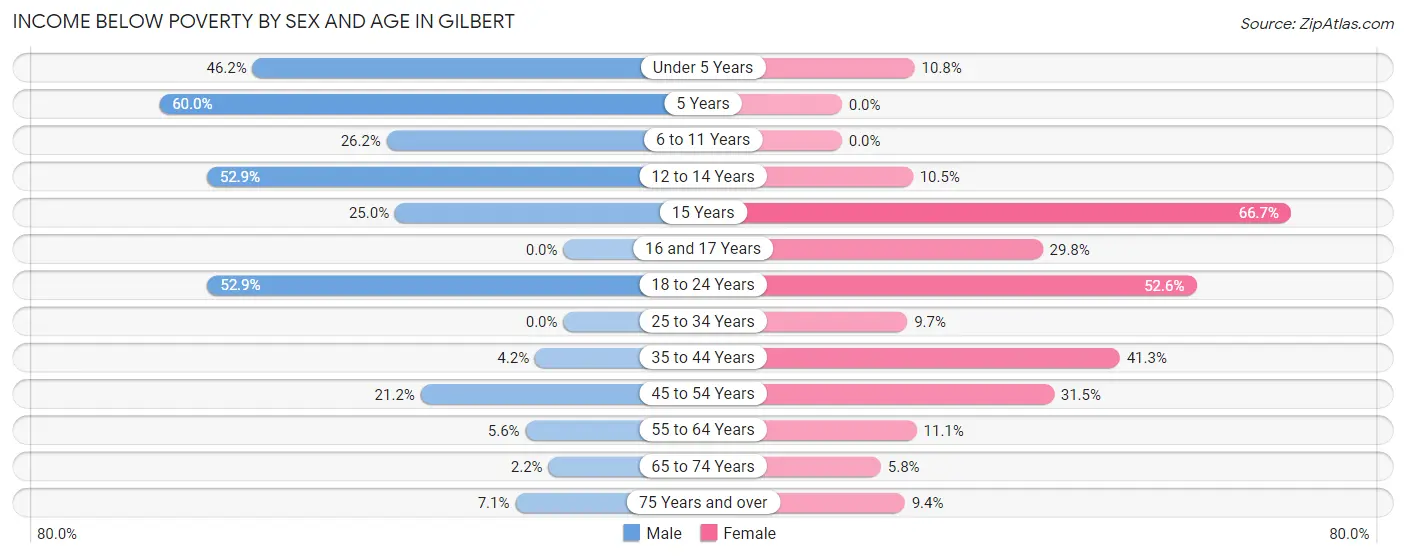
| Age Bracket | Male | Female |
| Under 5 Years | 18 (46.2%) | 4 (10.8%) |
| 5 Years | 6 (60.0%) | 0 (0.0%) |
| 6 to 11 Years | 16 (26.2%) | 0 (0.0%) |
| 12 to 14 Years | 27 (52.9%) | 4 (10.5%) |
| 15 Years | 4 (25.0%) | 8 (66.7%) |
| 16 and 17 Years | 0 (0.0%) | 17 (29.8%) |
| 18 to 24 Years | 37 (52.9%) | 20 (52.6%) |
| 25 to 34 Years | 0 (0.0%) | 7 (9.7%) |
| 35 to 44 Years | 4 (4.2%) | 52 (41.3%) |
| 45 to 54 Years | 25 (21.2%) | 34 (31.5%) |
| 55 to 64 Years | 8 (5.6%) | 16 (11.1%) |
| 65 to 74 Years | 3 (2.2%) | 8 (5.8%) |
| 75 Years and over | 4 (7.1%) | 10 (9.3%) |
| Total | 152 (17.4%) | 180 (19.2%) |
Income Above Poverty by Sex and Age in Gilbert
According to the poverty statistics in Gilbert, males aged 16 and 17 years and females aged 6 to 11 years are the age groups that are most secure financially, with 100.0% of males and 100.0% of females in these age groups living above the poverty line.
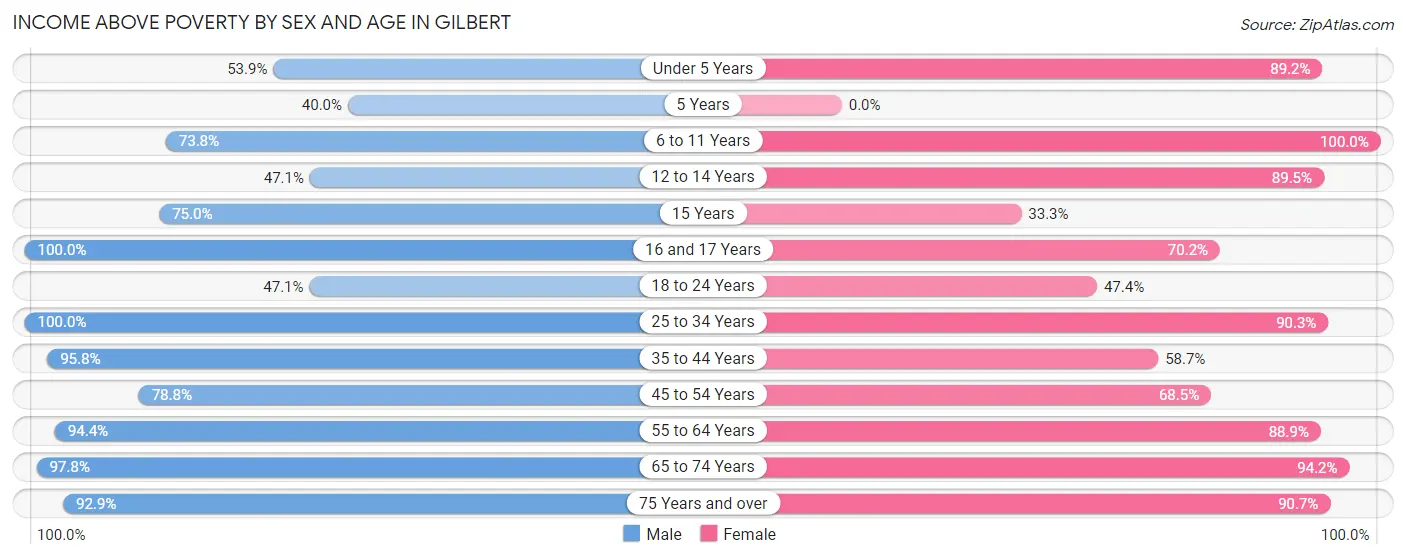
| Age Bracket | Male | Female |
| Under 5 Years | 21 (53.8%) | 33 (89.2%) |
| 5 Years | 4 (40.0%) | 0 (0.0%) |
| 6 to 11 Years | 45 (73.8%) | 60 (100.0%) |
| 12 to 14 Years | 24 (47.1%) | 34 (89.5%) |
| 15 Years | 12 (75.0%) | 4 (33.3%) |
| 16 and 17 Years | 19 (100.0%) | 40 (70.2%) |
| 18 to 24 Years | 33 (47.1%) | 18 (47.4%) |
| 25 to 34 Years | 59 (100.0%) | 65 (90.3%) |
| 35 to 44 Years | 91 (95.8%) | 74 (58.7%) |
| 45 to 54 Years | 93 (78.8%) | 74 (68.5%) |
| 55 to 64 Years | 134 (94.4%) | 128 (88.9%) |
| 65 to 74 Years | 133 (97.8%) | 130 (94.2%) |
| 75 Years and over | 52 (92.9%) | 97 (90.6%) |
| Total | 720 (82.6%) | 757 (80.8%) |
Income Below Poverty Among Married-Couple Families in Gilbert
The poverty statistics for married-couple families in Gilbert show that 2.4% or 8 of the total 340 families live below the poverty line. Families with 3 or 4 children have the highest poverty rate of 10.8%, comprising of 4 families. On the other hand, families with 1 or 2 children have the lowest poverty rate of 0.0%, which includes 0 families.
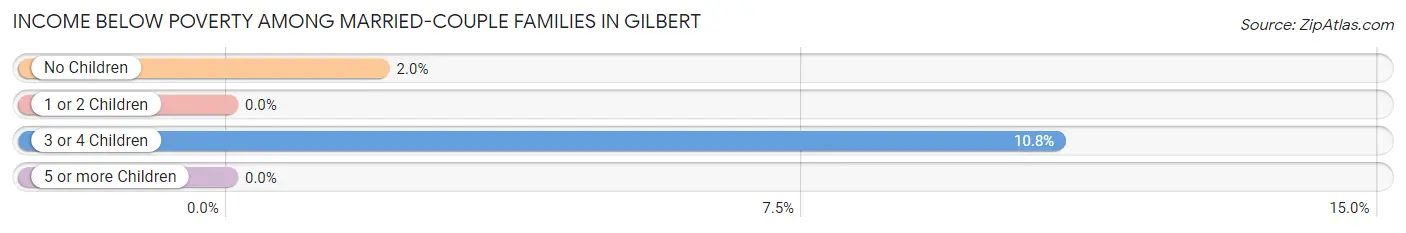
| Children | Above Poverty | Below Poverty |
| No Children | 198 (98.0%) | 4 (2.0%) |
| 1 or 2 Children | 101 (100.0%) | 0 (0.0%) |
| 3 or 4 Children | 33 (89.2%) | 4 (10.8%) |
| 5 or more Children | 0 (0.0%) | 0 (0.0%) |
| Total | 332 (97.7%) | 8 (2.4%) |
Income Below Poverty Among Single-Parent Households in Gilbert
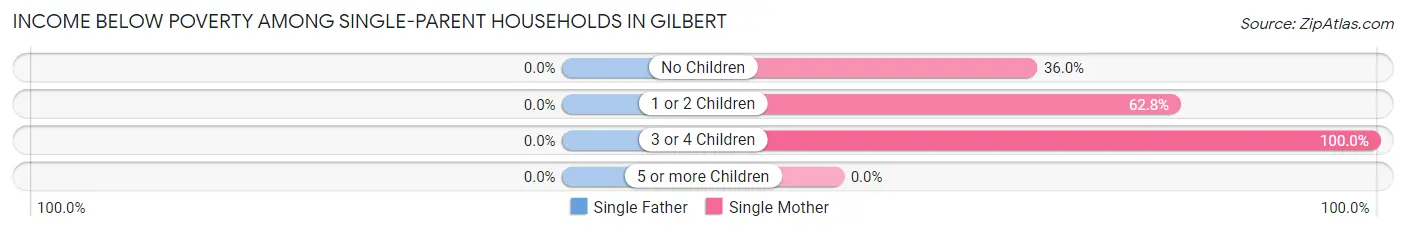
| Children | Single Father | Single Mother |
| No Children | 0 (0.0%) | 18 (36.0%) |
| 1 or 2 Children | 0 (0.0%) | 49 (62.8%) |
| 3 or 4 Children | 0 (0.0%) | 12 (100.0%) |
| 5 or more Children | 0 (0.0%) | 0 (0.0%) |
| Total | 0 (0.0%) | 79 (56.4%) |
Income Below Poverty Among Married-Couple vs Single-Parent Households in Gilbert
The poverty data for Gilbert shows that 8 of the married-couple family households (2.4%) and 79 of the single-parent households (49.4%) are living below the poverty level. Within the married-couple family households, those with 3 or 4 children have the highest poverty rate, with 4 households (10.8%) falling below the poverty line. Among the single-parent households, those with 3 or 4 children have the highest poverty rate, with 12 household (100.0%) living below poverty.
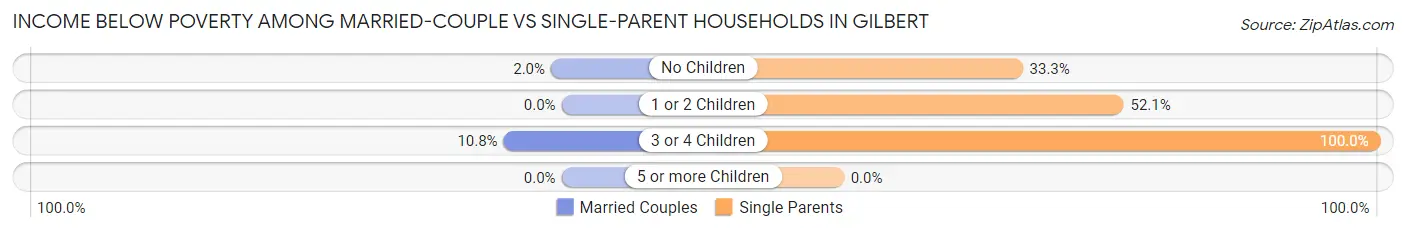
| Children | Married-Couple Families | Single-Parent Households |
| No Children | 4 (2.0%) | 18 (33.3%) |
| 1 or 2 Children | 0 (0.0%) | 49 (52.1%) |
| 3 or 4 Children | 4 (10.8%) | 12 (100.0%) |
| 5 or more Children | 0 (0.0%) | 0 (0.0%) |
| Total | 8 (2.4%) | 79 (49.4%) |
Race in Gilbert
The most populous races in Gilbert are White / Caucasian (1,766 | 97.0%), Two or more Races (45 | 2.5%), and Some other Race (8 | 0.4%).
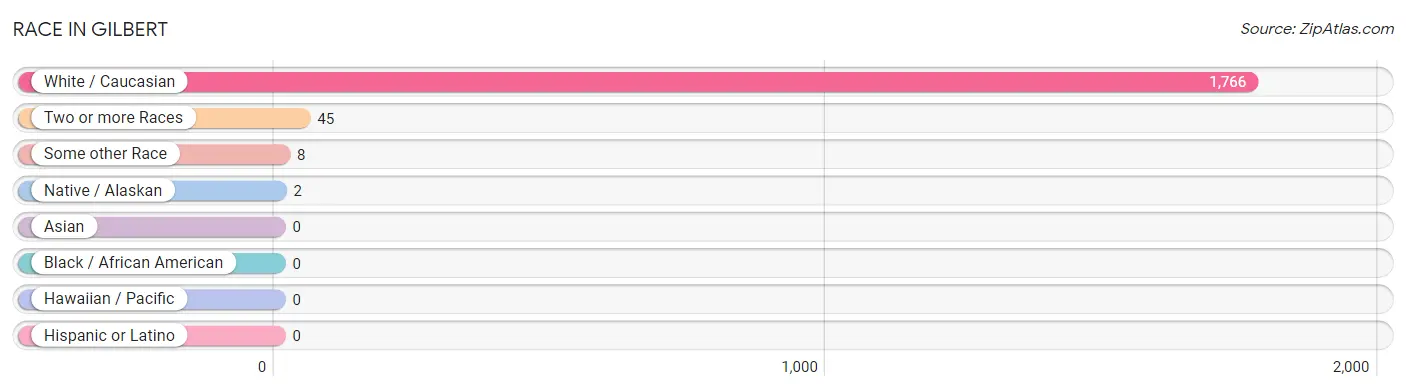
| Race | # Population | % Population |
| Asian | 0 | 0.0% |
| Black / African American | 0 | 0.0% |
| Hawaiian / Pacific | 0 | 0.0% |
| Hispanic or Latino | 0 | 0.0% |
| Native / Alaskan | 2 | 0.1% |
| White / Caucasian | 1,766 | 97.0% |
| Two or more Races | 45 | 2.5% |
| Some other Race | 8 | 0.4% |
| Total | 1,821 | 100.0% |
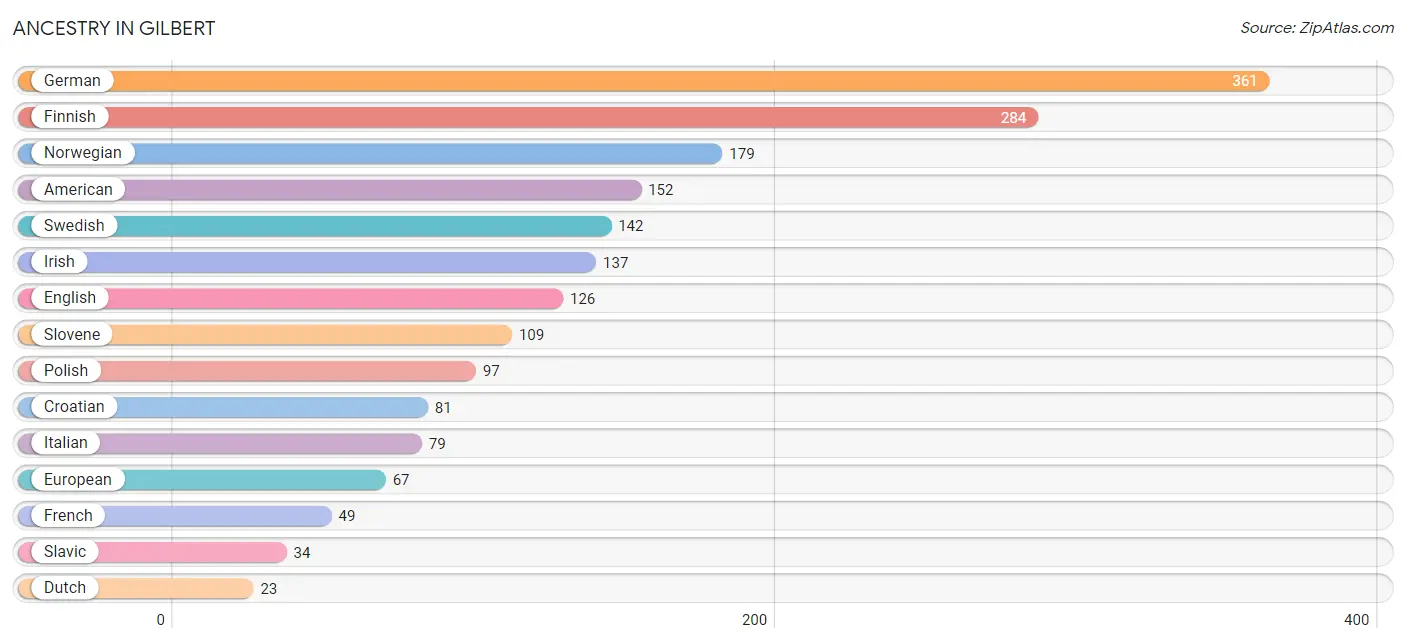
Ancestry in Gilbert
The most populous ancestries reported in Gilbert are German (361 | 19.8%), Finnish (284 | 15.6%), Norwegian (179 | 9.8%), American (152 | 8.4%), and Swedish (142 | 7.8%), together accounting for 61.4% of all Gilbert residents.
| Ancestry | # Population | % Population |
| American | 152 | 8.4% |
| Australian | 2 | 0.1% |
| Austrian | 7 | 0.4% |
| British | 7 | 0.4% |
| Cherokee | 14 | 0.8% |
| Chippewa | 2 | 0.1% |
| Croatian | 81 | 4.4% |
| Czech | 20 | 1.1% |
| Danish | 2 | 0.1% |
| Dutch | 23 | 1.3% |
| English | 126 | 6.9% |
| European | 67 | 3.7% |
| Finnish | 284 | 15.6% |
| French | 49 | 2.7% |
| French Canadian | 20 | 1.1% |
| German | 361 | 19.8% |
| Irish | 137 | 7.5% |
| Italian | 79 | 4.3% |
| Northern European | 7 | 0.4% |
| Norwegian | 179 | 9.8% |
| Polish | 97 | 5.3% |
| Russian | 8 | 0.4% |
| Scandinavian | 8 | 0.4% |
| Scottish | 7 | 0.4% |
| Serbian | 8 | 0.4% |
| Slavic | 34 | 1.9% |
| Slovak | 12 | 0.7% |
| Slovene | 109 | 6.0% |
| Sri Lankan | 8 | 0.4% |
| Swedish | 142 | 7.8% |
| Welsh | 6 | 0.3% |
| Yugoslavian | 17 | 0.9% | View All 32 Rows |
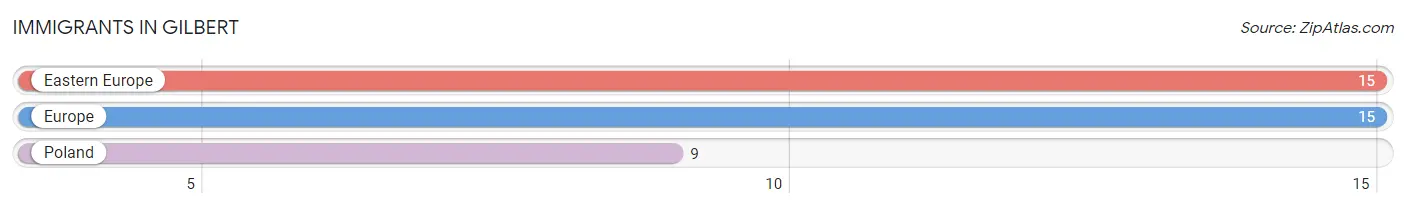
Immigrants in Gilbert
The most numerous immigrant groups reported in Gilbert came from Eastern Europe (15 | 0.8%), Europe (15 | 0.8%), and Poland (9 | 0.5%), together accounting for 2.1% of all Gilbert residents.
| Immigration Origin | # Population | % Population |
| Eastern Europe | 15 | 0.8% |
| Europe | 15 | 0.8% |
| Poland | 9 | 0.5% | View All 3 Rows |
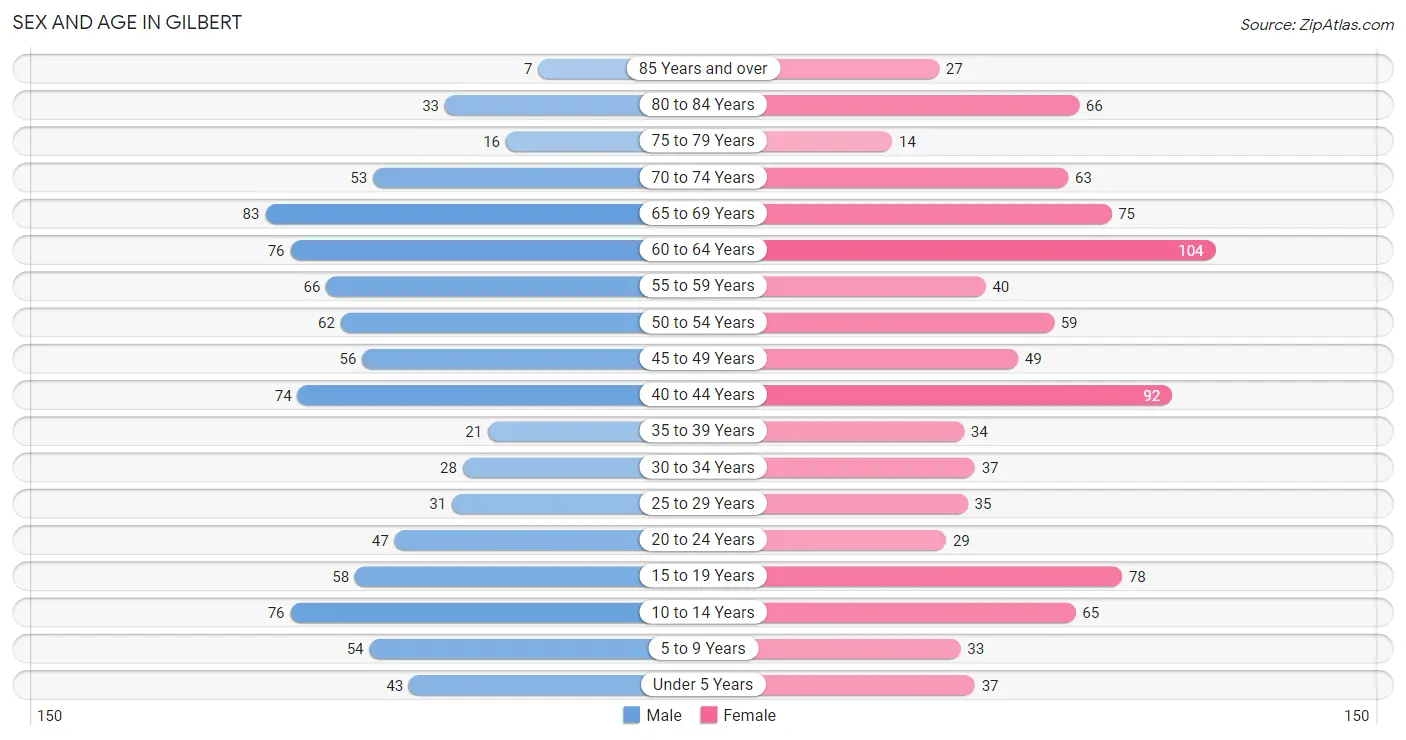
Sex and Age in Gilbert
Sex and Age in Gilbert
The most populous age groups in Gilbert are 65 to 69 Years (83 | 9.4%) for men and 60 to 64 Years (104 | 11.1%) for women.
| Age Bracket | Male | Female |
| Under 5 Years | 43 (4.9%) | 37 (4.0%) |
| 5 to 9 Years | 54 (6.1%) | 33 (3.5%) |
| 10 to 14 Years | 76 (8.6%) | 65 (6.9%) |
| 15 to 19 Years | 58 (6.6%) | 78 (8.3%) |
| 20 to 24 Years | 47 (5.3%) | 29 (3.1%) |
| 25 to 29 Years | 31 (3.5%) | 35 (3.7%) |
| 30 to 34 Years | 28 (3.2%) | 37 (4.0%) |
| 35 to 39 Years | 21 (2.4%) | 34 (3.6%) |
| 40 to 44 Years | 74 (8.4%) | 92 (9.8%) |
| 45 to 49 Years | 56 (6.3%) | 49 (5.2%) |
| 50 to 54 Years | 62 (7.0%) | 59 (6.3%) |
| 55 to 59 Years | 66 (7.5%) | 40 (4.3%) |
| 60 to 64 Years | 76 (8.6%) | 104 (11.1%) |
| 65 to 69 Years | 83 (9.4%) | 75 (8.0%) |
| 70 to 74 Years | 53 (6.0%) | 63 (6.7%) |
| 75 to 79 Years | 16 (1.8%) | 14 (1.5%) |
| 80 to 84 Years | 33 (3.7%) | 66 (7.0%) |
| 85 Years and over | 7 (0.8%) | 27 (2.9%) |
| Total | 884 (100.0%) | 937 (100.0%) |
Families and Households in Gilbert
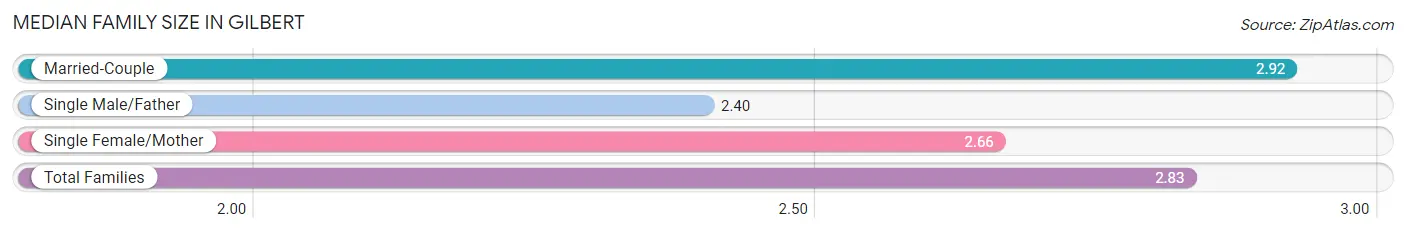
Median Family Size in Gilbert
The median family size in Gilbert is 2.83 persons per family, with married-couple families (340 | 68.0%) accounting for the largest median family size of 2.92 persons per family. On the other hand, single male/father families (20 | 4.0%) represent the smallest median family size with 2.40 persons per family.
| Family Type | # Families | Family Size |
| Married-Couple | 340 (68.0%) | 2.92 |
| Single Male/Father | 20 (4.0%) | 2.40 |
| Single Female/Mother | 140 (28.0%) | 2.66 |
| Total Families | 500 (100.0%) | 2.83 |
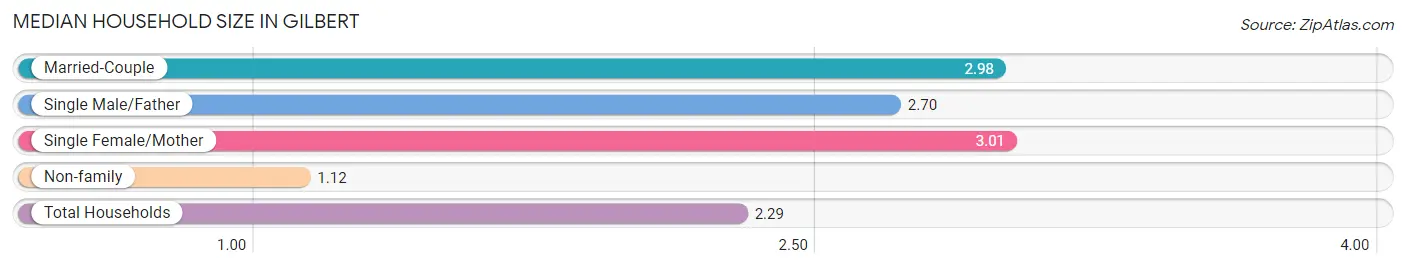
Median Household Size in Gilbert
The median household size in Gilbert is 2.29 persons per household, with single female/mother households (140 | 17.6%) accounting for the largest median household size of 3.01 persons per household. non-family households (294 | 37.0%) represent the smallest median household size with 1.12 persons per household.
| Household Type | # Households | Household Size |
| Married-Couple | 340 (42.8%) | 2.98 |
| Single Male/Father | 20 (2.5%) | 2.70 |
| Single Female/Mother | 140 (17.6%) | 3.01 |
| Non-family | 294 (37.0%) | 1.12 |
| Total Households | 794 (100.0%) | 2.29 |
Household Size by Marriage Status in Gilbert
Out of a total of 794 households in Gilbert, 500 (63.0%) are family households, while 294 (37.0%) are nonfamily households. The most numerous type of family households are 2-person households, comprising 219, and the most common type of nonfamily households are 1-person households, comprising 262.
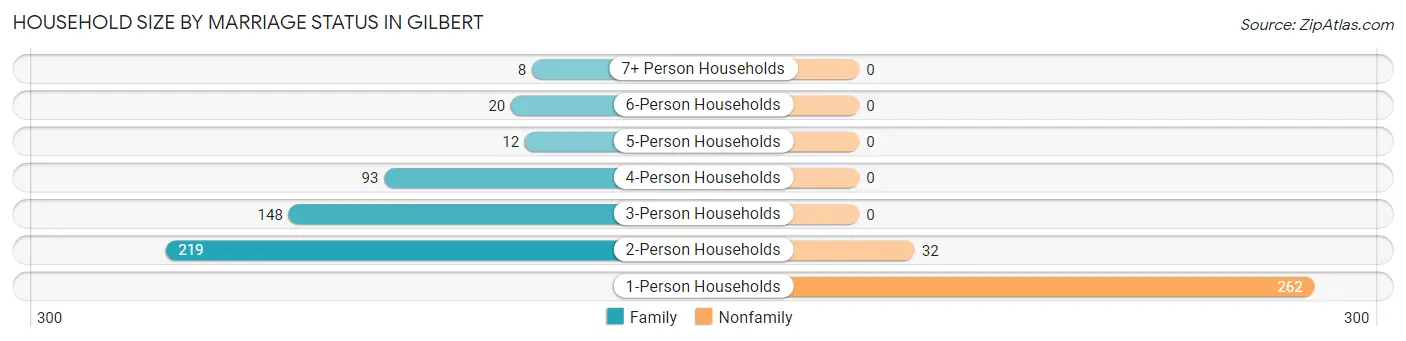
| Household Size | Family Households | Nonfamily Households |
| 1-Person Households | - | 262 (33.0%) |
| 2-Person Households | 219 (27.6%) | 32 (4.0%) |
| 3-Person Households | 148 (18.6%) | 0 (0.0%) |
| 4-Person Households | 93 (11.7%) | 0 (0.0%) |
| 5-Person Households | 12 (1.5%) | 0 (0.0%) |
| 6-Person Households | 20 (2.5%) | 0 (0.0%) |
| 7+ Person Households | 8 (1.0%) | 0 (0.0%) |
| Total | 500 (63.0%) | 294 (37.0%) |
Female Fertility in Gilbert
Fertility by Age in Gilbert
Average fertility rate in Gilbert is 50.0 births per 1,000 women. Women in the age bracket of 20 to 34 years have the highest fertility rate with 178.0 births per 1,000 women. Women in the age bracket of 20 to 34 years acount for 100.0% of all women with births.
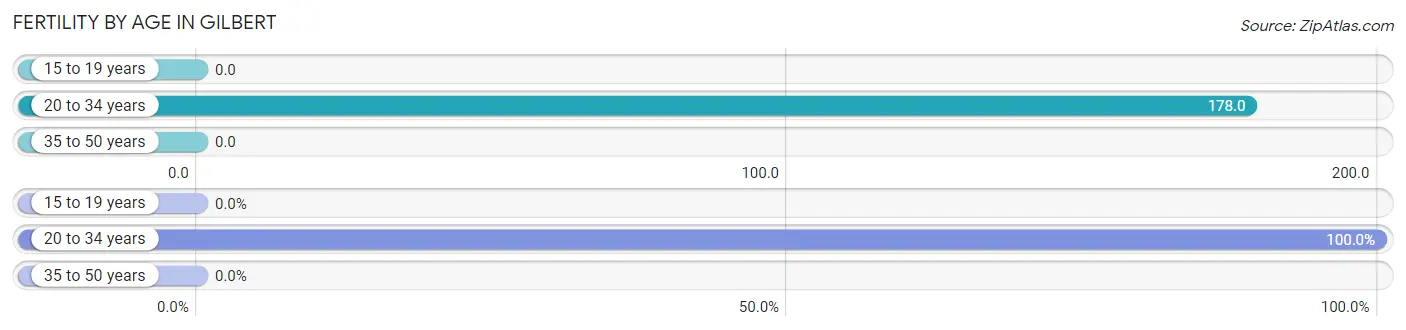
| Age Bracket | Women with Births | Births / 1,000 Women |
| 15 to 19 years | 0 (0.0%) | 0.0 |
| 20 to 34 years | 18 (100.0%) | 178.0 |
| 35 to 50 years | 0 (0.0%) | 0.0 |
| Total | 18 (100.0%) | 50.0 |
Fertility by Age by Marriage Status in Gilbert
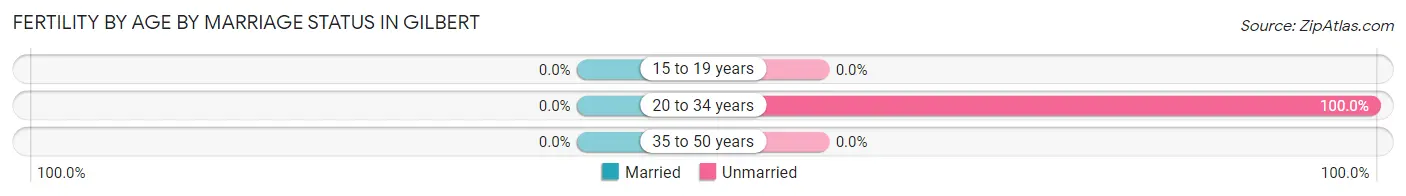
| Age Bracket | Married | Unmarried |
| 15 to 19 years | 0 (0.0%) | 0 (0.0%) |
| 20 to 34 years | 0 (0.0%) | 18 (100.0%) |
| 35 to 50 years | 0 (0.0%) | 0 (0.0%) |
| Total | 0 (0.0%) | 18 (100.0%) |
Fertility by Education in Gilbert
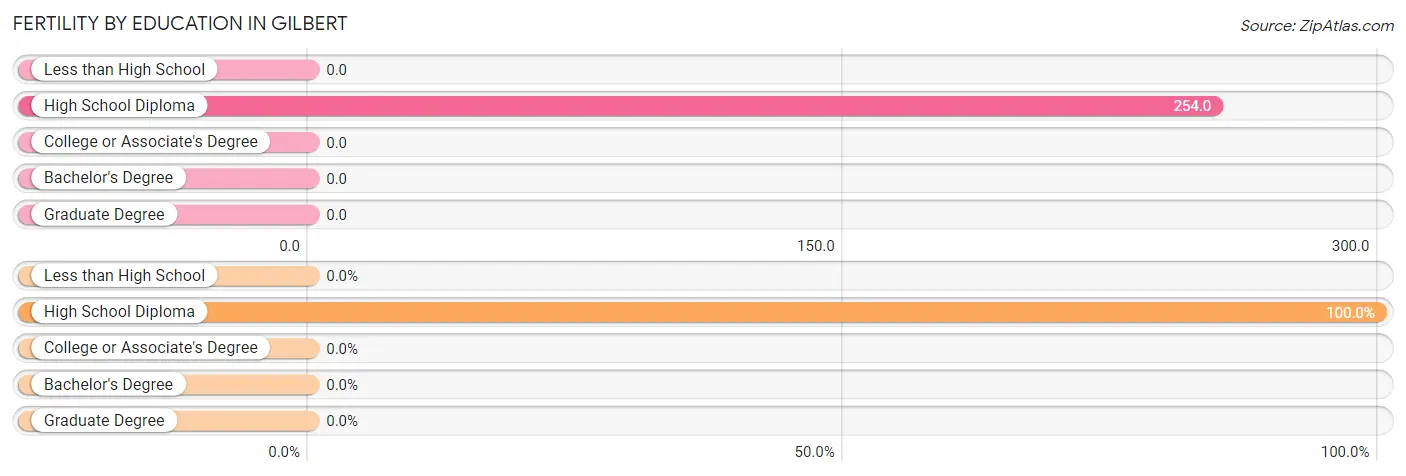
| Educational Attainment | Women with Births | Births / 1,000 Women |
| Less than High School | 0 (0.0%) | 0.0 |
| High School Diploma | 18 (100.0%) | 254.0 |
| College or Associate's Degree | 0 (0.0%) | 0.0 |
| Bachelor's Degree | 0 (0.0%) | 0.0 |
| Graduate Degree | 0 (0.0%) | 0.0 |
| Total | 18 (100.0%) | 50.0 |
Fertility by Education by Marriage Status in Gilbert
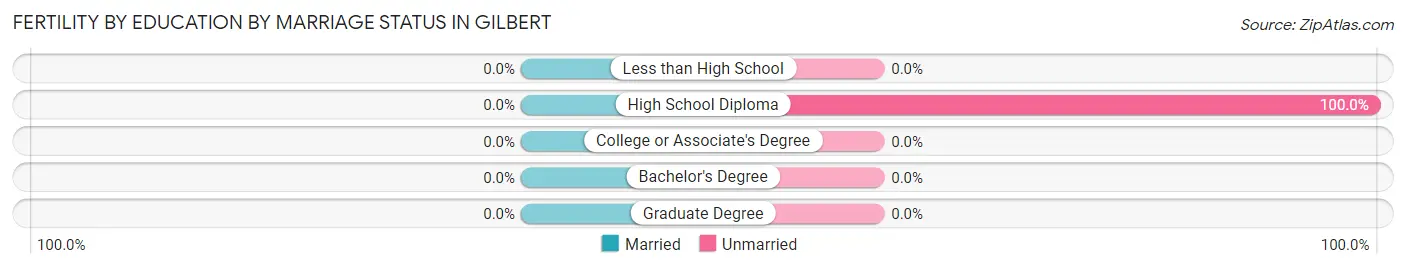
| Educational Attainment | Married | Unmarried |
| Less than High School | 0 (0.0%) | 0 (0.0%) |
| High School Diploma | 0 (0.0%) | 18 (100.0%) |
| College or Associate's Degree | 0 (0.0%) | 0 (0.0%) |
| Bachelor's Degree | 0 (0.0%) | 0 (0.0%) |
| Graduate Degree | 0 (0.0%) | 0 (0.0%) |
| Total | 0 (0.0%) | 18 (100.0%) |
Employment Characteristics in Gilbert
Employment by Class of Employer in Gilbert
Among the 742 employed individuals in Gilbert, private company employees (509 | 68.6%), local government employees (92 | 12.4%), and not-for-profit organizations (72 | 9.7%) make up the most common classes of employment.
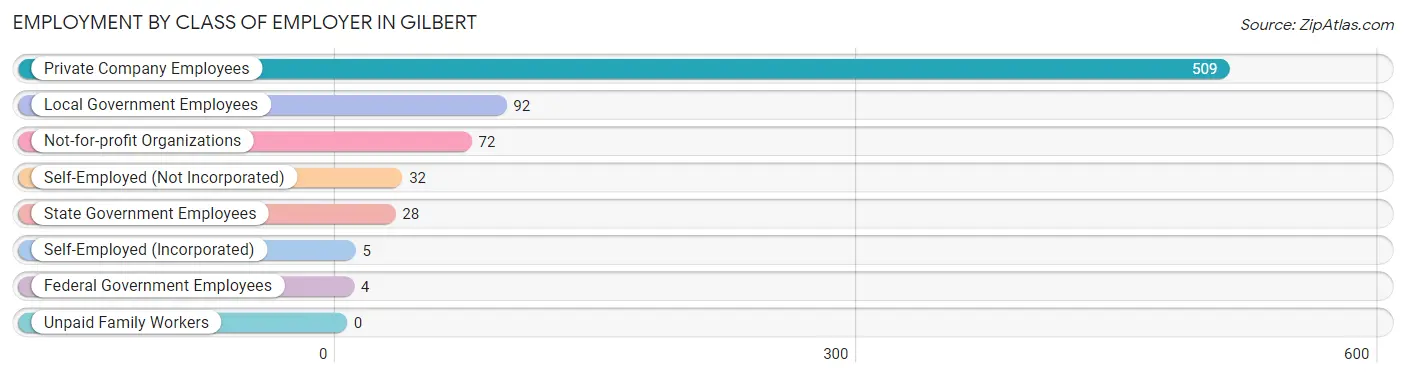
| Employer Class | # Employees | % Employees |
| Private Company Employees | 509 | 68.6% |
| Self-Employed (Incorporated) | 5 | 0.7% |
| Self-Employed (Not Incorporated) | 32 | 4.3% |
| Not-for-profit Organizations | 72 | 9.7% |
| Local Government Employees | 92 | 12.4% |
| State Government Employees | 28 | 3.8% |
| Federal Government Employees | 4 | 0.5% |
| Unpaid Family Workers | 0 | 0.0% |
| Total | 742 | 100.0% |
Employment Status by Age in Gilbert
According to the labor force statistics for Gilbert, out of the total population over 16 years of age (1,485), 52.8% or 784 individuals are in the labor force, with 1.1% or 9 of them unemployed. The age group with the highest labor force participation rate is 25 to 29 years, with 92.4% or 61 individuals in the labor force. Within the labor force, the 30 to 34 years age range has the highest percentage of unemployed individuals, with 5.0% or 3 of them being unemployed.
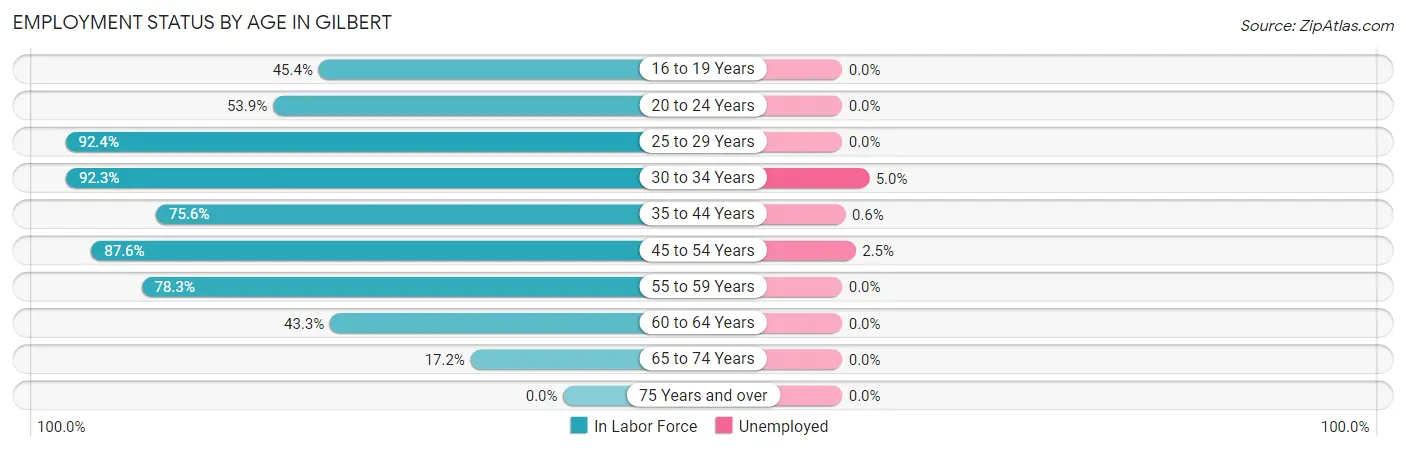
| Age Bracket | In Labor Force | Unemployed |
| 16 to 19 Years | 49 (45.4%) | 0 (0.0%) |
| 20 to 24 Years | 41 (53.9%) | 0 (0.0%) |
| 25 to 29 Years | 61 (92.4%) | 0 (0.0%) |
| 30 to 34 Years | 60 (92.3%) | 3 (5.0%) |
| 35 to 44 Years | 167 (75.6%) | 1 (0.6%) |
| 45 to 54 Years | 198 (87.6%) | 5 (2.5%) |
| 55 to 59 Years | 83 (78.3%) | 0 (0.0%) |
| 60 to 64 Years | 78 (43.3%) | 0 (0.0%) |
| 65 to 74 Years | 47 (17.2%) | 0 (0.0%) |
| 75 Years and over | 0 (0.0%) | 0 (0.0%) |
| Total | 784 (52.8%) | 9 (1.1%) |
Employment Status by Educational Attainment in Gilbert
According to labor force statistics for Gilbert, 74.9% of individuals (647) out of the total population between 25 and 64 years of age (864) are in the labor force, with 1.4% or 9 of them being unemployed. The group with the highest labor force participation rate are those with the educational attainment of high school diploma, with 80.5% or 215 individuals in the labor force. Within the labor force, individuals with high school diploma education have the highest percentage of unemployment, with 1.9% or 4 of them being unemployed.
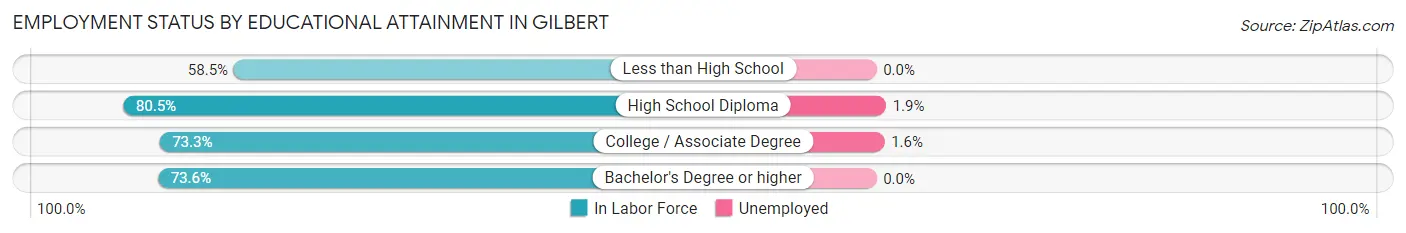
| Educational Attainment | In Labor Force | Unemployed |
| Less than High School | 24 (58.5%) | 0 (0.0%) |
| High School Diploma | 215 (80.5%) | 5 (1.9%) |
| College / Associate Degree | 316 (73.3%) | 7 (1.6%) |
| Bachelor's Degree or higher | 92 (73.6%) | 0 (0.0%) |
| Total | 647 (74.9%) | 12 (1.4%) |
Employment Occupations by Sex in Gilbert
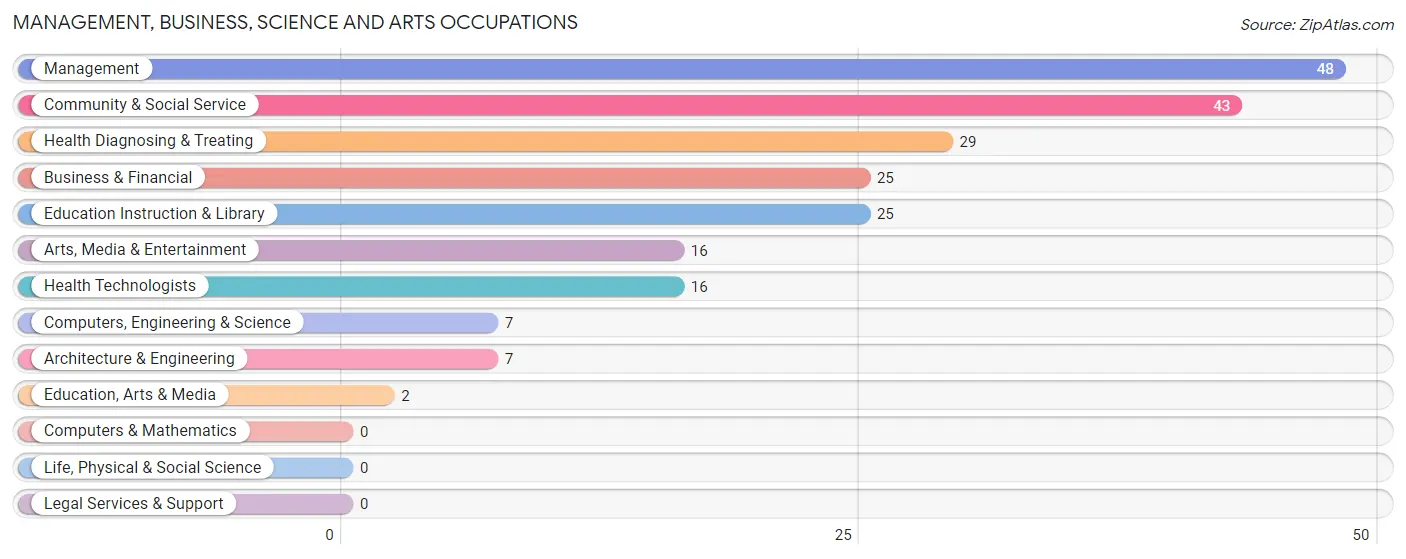
Management, Business, Science and Arts Occupations
The most common Management, Business, Science and Arts occupations in Gilbert are Management (48 | 6.2%), Community & Social Service (43 | 5.6%), Health Diagnosing & Treating (29 | 3.7%), Business & Financial (25 | 3.2%), and Education Instruction & Library (25 | 3.2%).
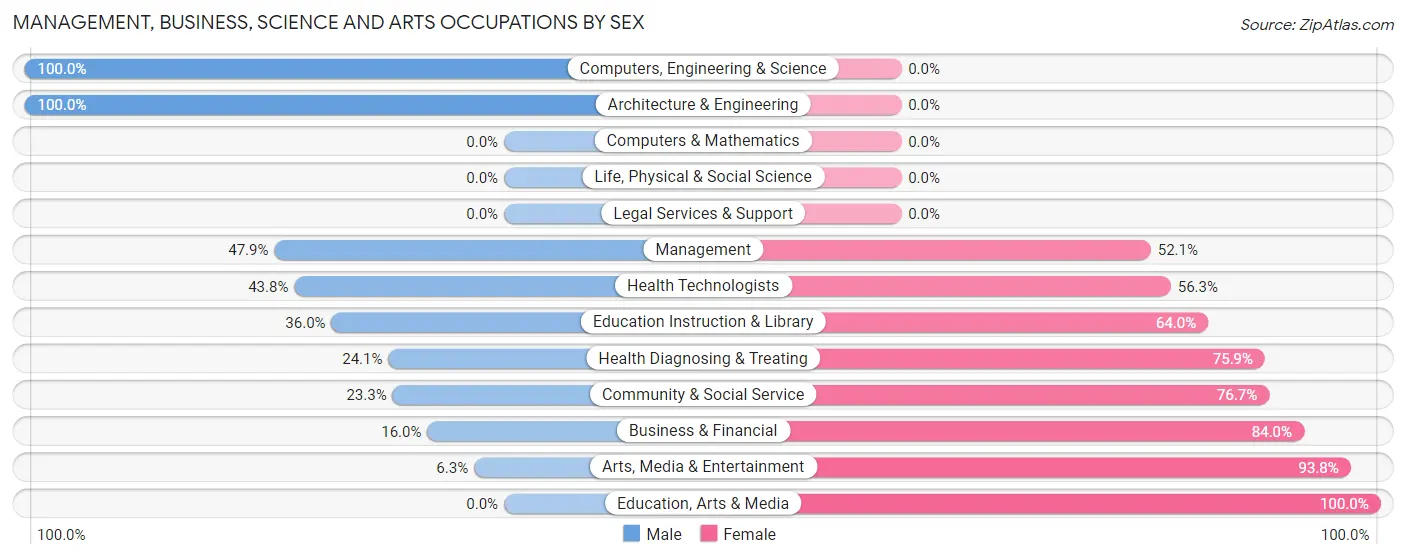
Management, Business, Science and Arts Occupations by Sex
Within the Management, Business, Science and Arts occupations in Gilbert, the most male-oriented occupations are Computers, Engineering & Science (100.0%), Architecture & Engineering (100.0%), and Management (47.9%), while the most female-oriented occupations are Education, Arts & Media (100.0%), Arts, Media & Entertainment (93.8%), and Business & Financial (84.0%).
| Occupation | Male | Female |
| Management | 23 (47.9%) | 25 (52.1%) |
| Business & Financial | 4 (16.0%) | 21 (84.0%) |
| Computers, Engineering & Science | 7 (100.0%) | 0 (0.0%) |
| Computers & Mathematics | 0 (0.0%) | 0 (0.0%) |
| Architecture & Engineering | 7 (100.0%) | 0 (0.0%) |
| Life, Physical & Social Science | 0 (0.0%) | 0 (0.0%) |
| Community & Social Service | 10 (23.3%) | 33 (76.7%) |
| Education, Arts & Media | 0 (0.0%) | 2 (100.0%) |
| Legal Services & Support | 0 (0.0%) | 0 (0.0%) |
| Education Instruction & Library | 9 (36.0%) | 16 (64.0%) |
| Arts, Media & Entertainment | 1 (6.2%) | 15 (93.8%) |
| Health Diagnosing & Treating | 7 (24.1%) | 22 (75.9%) |
| Health Technologists | 7 (43.8%) | 9 (56.2%) |
| Total (Category) | 51 (33.6%) | 101 (66.4%) |
| Total (Overall) | 420 (54.2%) | 355 (45.8%) |
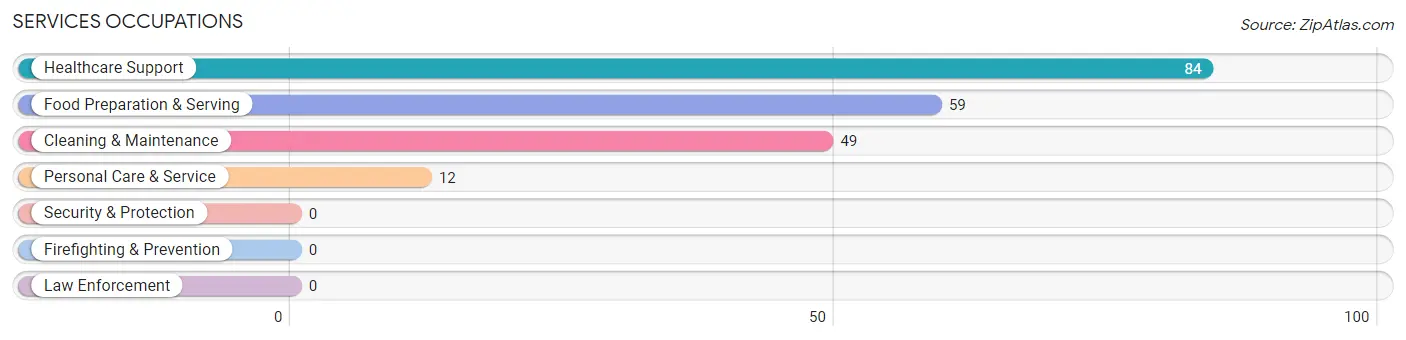
Services Occupations
The most common Services occupations in Gilbert are Healthcare Support (84 | 10.8%), Food Preparation & Serving (59 | 7.6%), Cleaning & Maintenance (49 | 6.3%), and Personal Care & Service (12 | 1.5%).
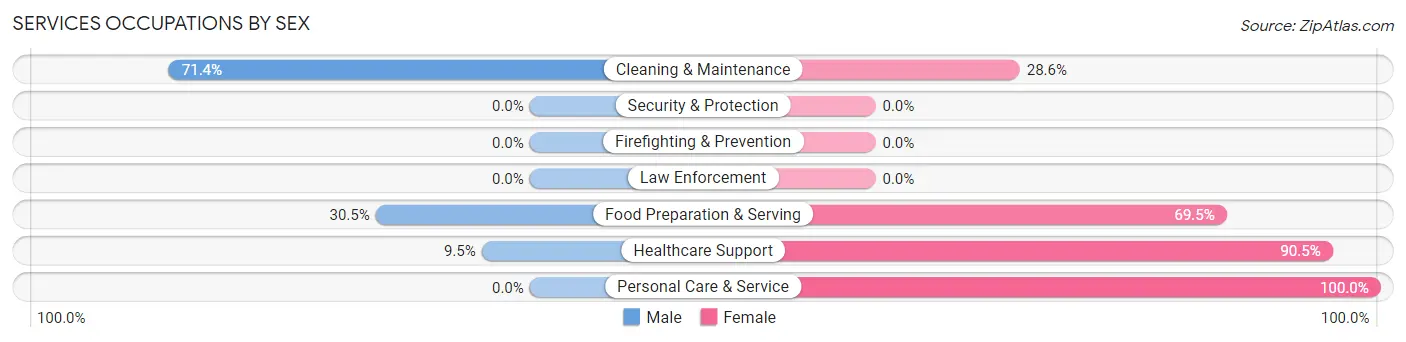
Services Occupations by Sex
Within the Services occupations in Gilbert, the most male-oriented occupations are Cleaning & Maintenance (71.4%), Food Preparation & Serving (30.5%), and Healthcare Support (9.5%), while the most female-oriented occupations are Personal Care & Service (100.0%), Healthcare Support (90.5%), and Food Preparation & Serving (69.5%).
| Occupation | Male | Female |
| Healthcare Support | 8 (9.5%) | 76 (90.5%) |
| Security & Protection | 0 (0.0%) | 0 (0.0%) |
| Firefighting & Prevention | 0 (0.0%) | 0 (0.0%) |
| Law Enforcement | 0 (0.0%) | 0 (0.0%) |
| Food Preparation & Serving | 18 (30.5%) | 41 (69.5%) |
| Cleaning & Maintenance | 35 (71.4%) | 14 (28.6%) |
| Personal Care & Service | 0 (0.0%) | 12 (100.0%) |
| Total (Category) | 61 (29.9%) | 143 (70.1%) |
| Total (Overall) | 420 (54.2%) | 355 (45.8%) |
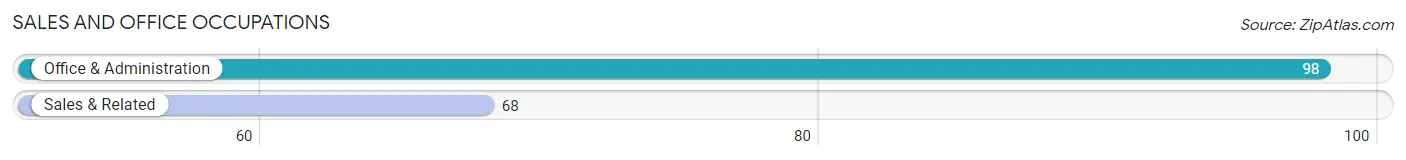
Sales and Office Occupations
The most common Sales and Office occupations in Gilbert are Office & Administration (98 | 12.7%), and Sales & Related (68 | 8.8%).
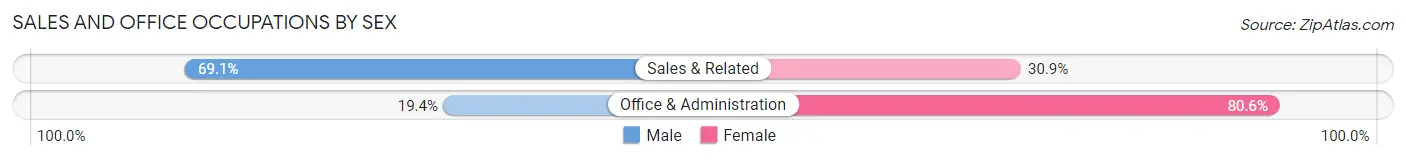
Sales and Office Occupations by Sex
| Occupation | Male | Female |
| Sales & Related | 47 (69.1%) | 21 (30.9%) |
| Office & Administration | 19 (19.4%) | 79 (80.6%) |
| Total (Category) | 66 (39.8%) | 100 (60.2%) |
| Total (Overall) | 420 (54.2%) | 355 (45.8%) |
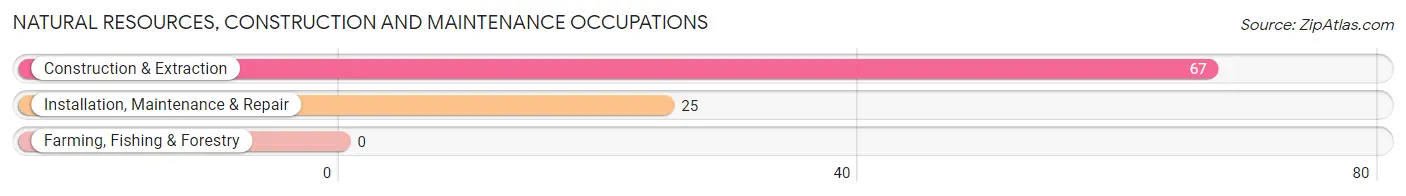
Natural Resources, Construction and Maintenance Occupations
The most common Natural Resources, Construction and Maintenance occupations in Gilbert are Construction & Extraction (67 | 8.6%), and Installation, Maintenance & Repair (25 | 3.2%).
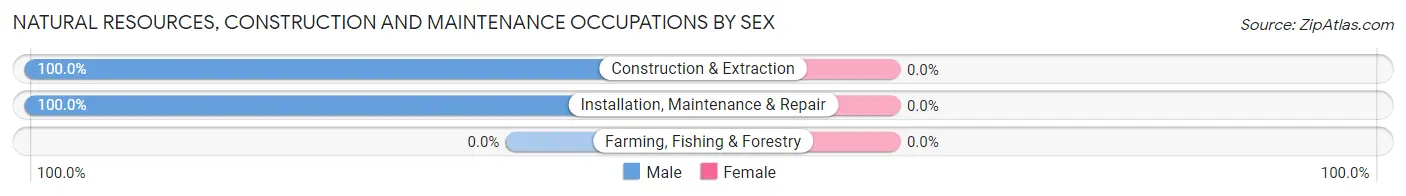
Natural Resources, Construction and Maintenance Occupations by Sex
| Occupation | Male | Female |
| Farming, Fishing & Forestry | 0 (0.0%) | 0 (0.0%) |
| Construction & Extraction | 67 (100.0%) | 0 (0.0%) |
| Installation, Maintenance & Repair | 25 (100.0%) | 0 (0.0%) |
| Total (Category) | 92 (100.0%) | 0 (0.0%) |
| Total (Overall) | 420 (54.2%) | 355 (45.8%) |
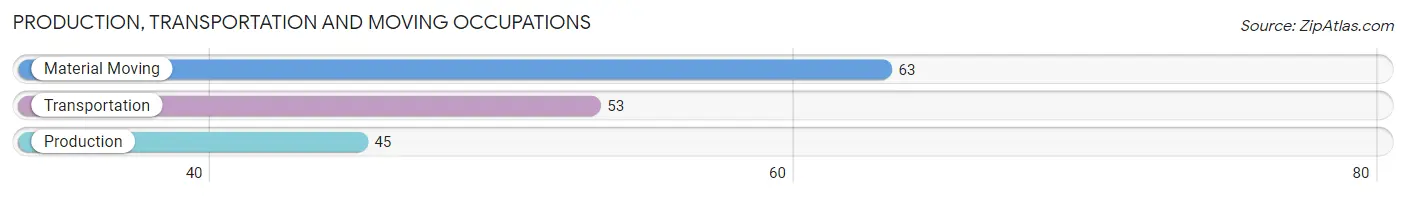
Production, Transportation and Moving Occupations
The most common Production, Transportation and Moving occupations in Gilbert are Material Moving (63 | 8.1%), Transportation (53 | 6.8%), and Production (45 | 5.8%).
Production, Transportation and Moving Occupations by Sex
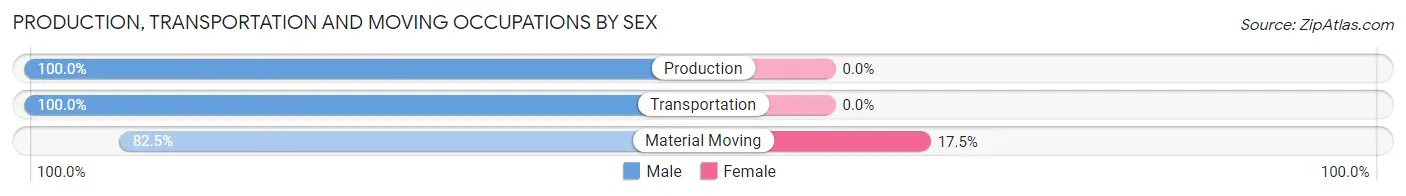
| Occupation | Male | Female |
| Production | 45 (100.0%) | 0 (0.0%) |
| Transportation | 53 (100.0%) | 0 (0.0%) |
| Material Moving | 52 (82.5%) | 11 (17.5%) |
| Total (Category) | 150 (93.2%) | 11 (6.8%) |
| Total (Overall) | 420 (54.2%) | 355 (45.8%) |
Employment Industries by Sex in Gilbert
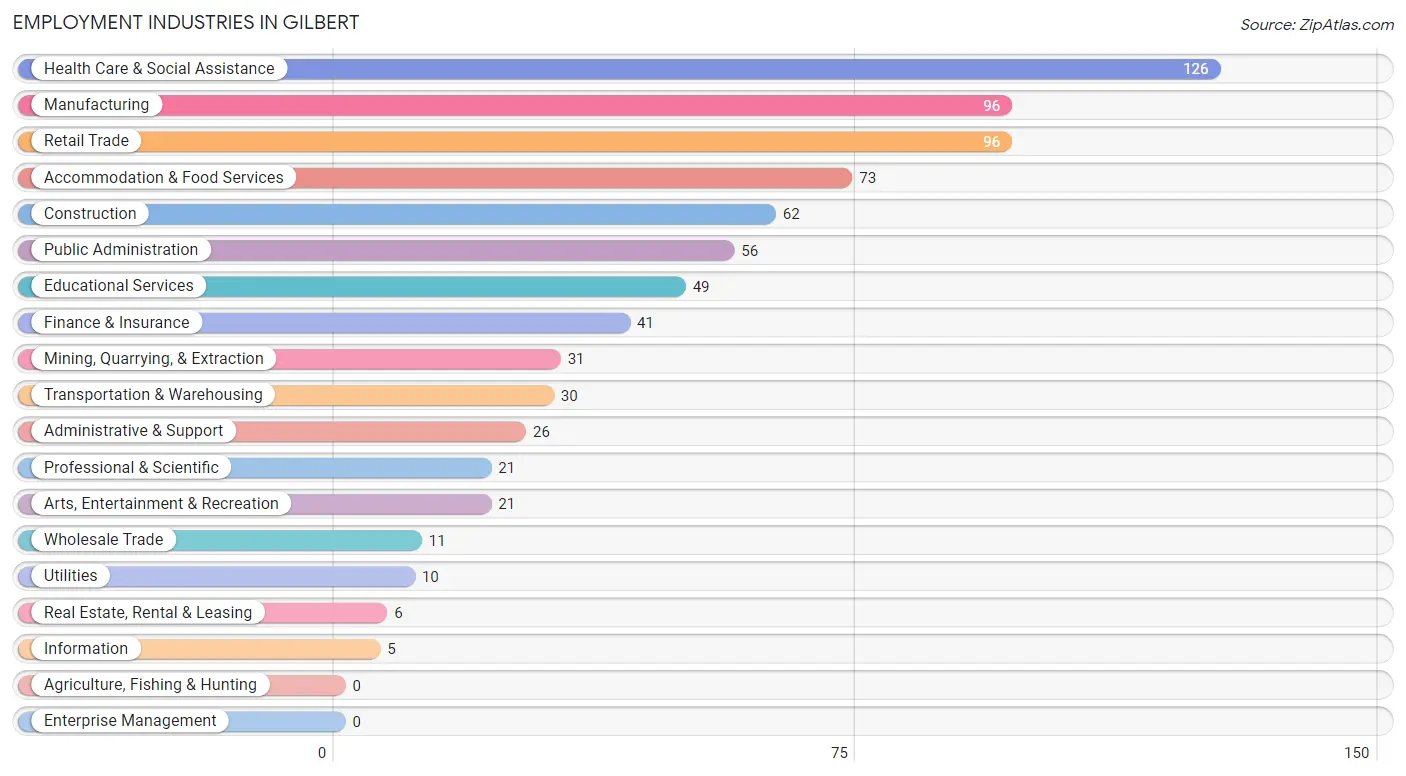
Employment Industries in Gilbert
The major employment industries in Gilbert include Health Care & Social Assistance (126 | 16.3%), Manufacturing (96 | 12.4%), Retail Trade (96 | 12.4%), Accommodation & Food Services (73 | 9.4%), and Construction (62 | 8.0%).
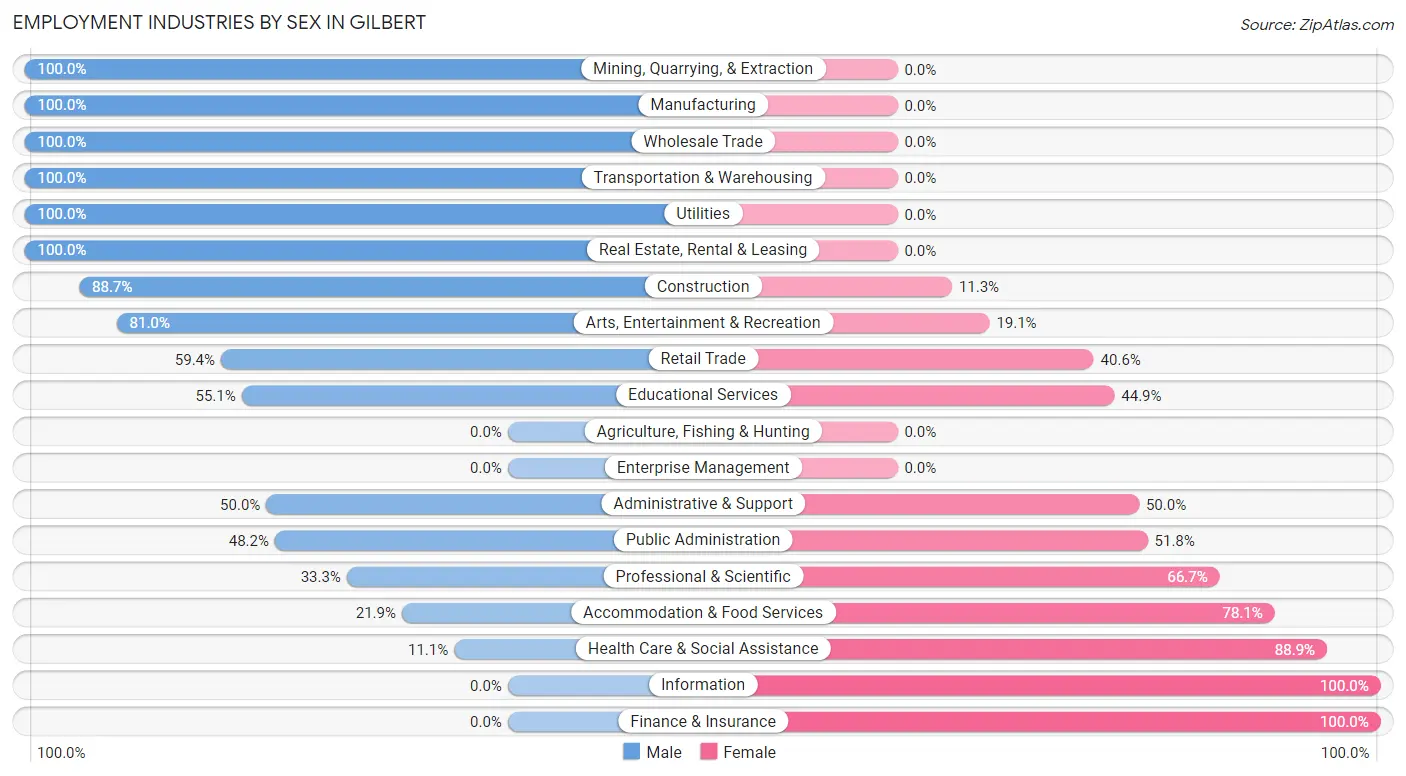
Employment Industries by Sex in Gilbert
The Gilbert industries that see more men than women are Mining, Quarrying, & Extraction (100.0%), Manufacturing (100.0%), and Wholesale Trade (100.0%), whereas the industries that tend to have a higher number of women are Information (100.0%), Finance & Insurance (100.0%), and Health Care & Social Assistance (88.9%).
| Industry | Male | Female |
| Agriculture, Fishing & Hunting | 0 (0.0%) | 0 (0.0%) |
| Mining, Quarrying, & Extraction | 31 (100.0%) | 0 (0.0%) |
| Construction | 55 (88.7%) | 7 (11.3%) |
| Manufacturing | 96 (100.0%) | 0 (0.0%) |
| Wholesale Trade | 11 (100.0%) | 0 (0.0%) |
| Retail Trade | 57 (59.4%) | 39 (40.6%) |
| Transportation & Warehousing | 30 (100.0%) | 0 (0.0%) |
| Utilities | 10 (100.0%) | 0 (0.0%) |
| Information | 0 (0.0%) | 5 (100.0%) |
| Finance & Insurance | 0 (0.0%) | 41 (100.0%) |
| Real Estate, Rental & Leasing | 6 (100.0%) | 0 (0.0%) |
| Professional & Scientific | 7 (33.3%) | 14 (66.7%) |
| Enterprise Management | 0 (0.0%) | 0 (0.0%) |
| Administrative & Support | 13 (50.0%) | 13 (50.0%) |
| Educational Services | 27 (55.1%) | 22 (44.9%) |
| Health Care & Social Assistance | 14 (11.1%) | 112 (88.9%) |
| Arts, Entertainment & Recreation | 17 (80.9%) | 4 (19.1%) |
| Accommodation & Food Services | 16 (21.9%) | 57 (78.1%) |
| Public Administration | 27 (48.2%) | 29 (51.8%) |
| Total | 420 (54.2%) | 355 (45.8%) |
Education in Gilbert
School Enrollment in Gilbert
The most common levels of schooling among the 379 students in Gilbert are high school (122 | 32.2%), middle school (89 | 23.5%), and elementary school (88 | 23.2%).
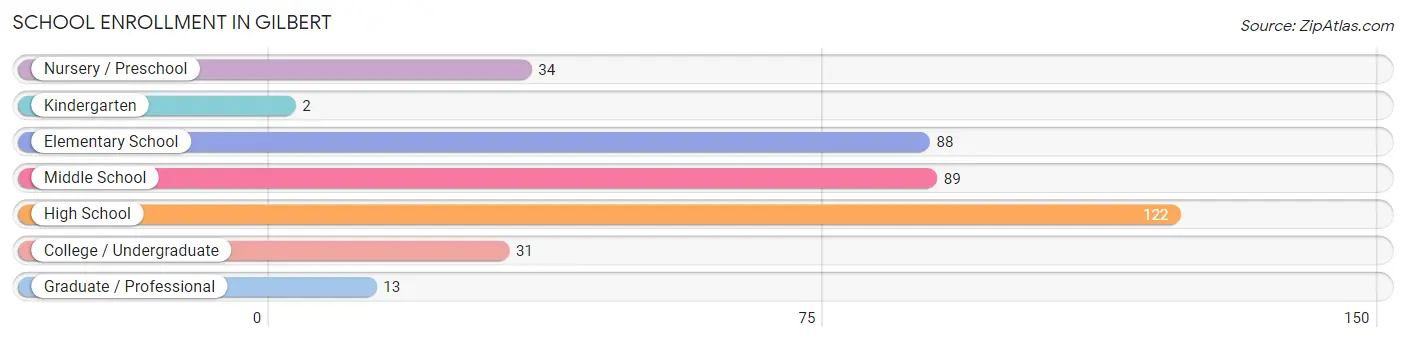
| School Level | # Students | % Students |
| Nursery / Preschool | 34 | 9.0% |
| Kindergarten | 2 | 0.5% |
| Elementary School | 88 | 23.2% |
| Middle School | 89 | 23.5% |
| High School | 122 | 32.2% |
| College / Undergraduate | 31 | 8.2% |
| Graduate / Professional | 13 | 3.4% |
| Total | 379 | 100.0% |
School Enrollment by Age by Funding Source in Gilbert
Out of a total of 379 students who are enrolled in schools in Gilbert, 27 (7.1%) attend a private institution, while the remaining 352 (92.9%) are enrolled in public schools. The age group of 15 to 17 year olds has the highest likelihood of being enrolled in private schools, with 11 (10.6% in the age bracket) enrolled. Conversely, the age group of 3 to 4 year olds has the lowest likelihood of being enrolled in a private school, with 24 (100.0% in the age bracket) attending a public institution.
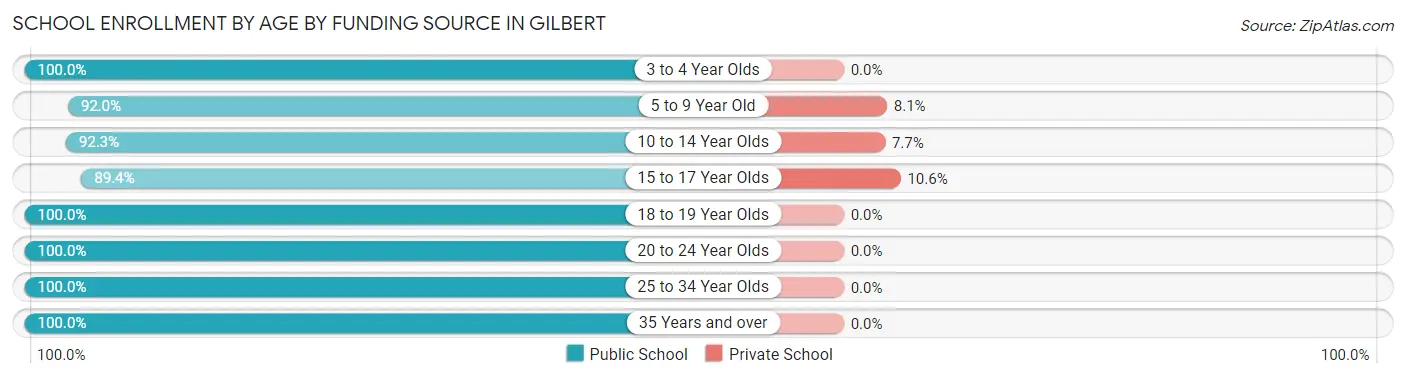
| Age Bracket | Public School | Private School |
| 3 to 4 Year Olds | 24 (100.0%) | 0 (0.0%) |
| 5 to 9 Year Old | 80 (91.9%) | 7 (8.1%) |
| 10 to 14 Year Olds | 108 (92.3%) | 9 (7.7%) |
| 15 to 17 Year Olds | 93 (89.4%) | 11 (10.6%) |
| 18 to 19 Year Olds | 8 (100.0%) | 0 (0.0%) |
| 20 to 24 Year Olds | 20 (100.0%) | 0 (0.0%) |
| 25 to 34 Year Olds | 8 (100.0%) | 0 (0.0%) |
| 35 Years and over | 11 (100.0%) | 0 (0.0%) |
| Total | 352 (92.9%) | 27 (7.1%) |
Educational Attainment by Field of Study in Gilbert
Education (51 | 25.3%), business (41 | 20.3%), engineering (25 | 12.4%), arts & humanities (24 | 11.9%), and science & technology (23 | 11.4%) are the most common fields of study among 202 individuals in Gilbert who have obtained a bachelor's degree or higher.
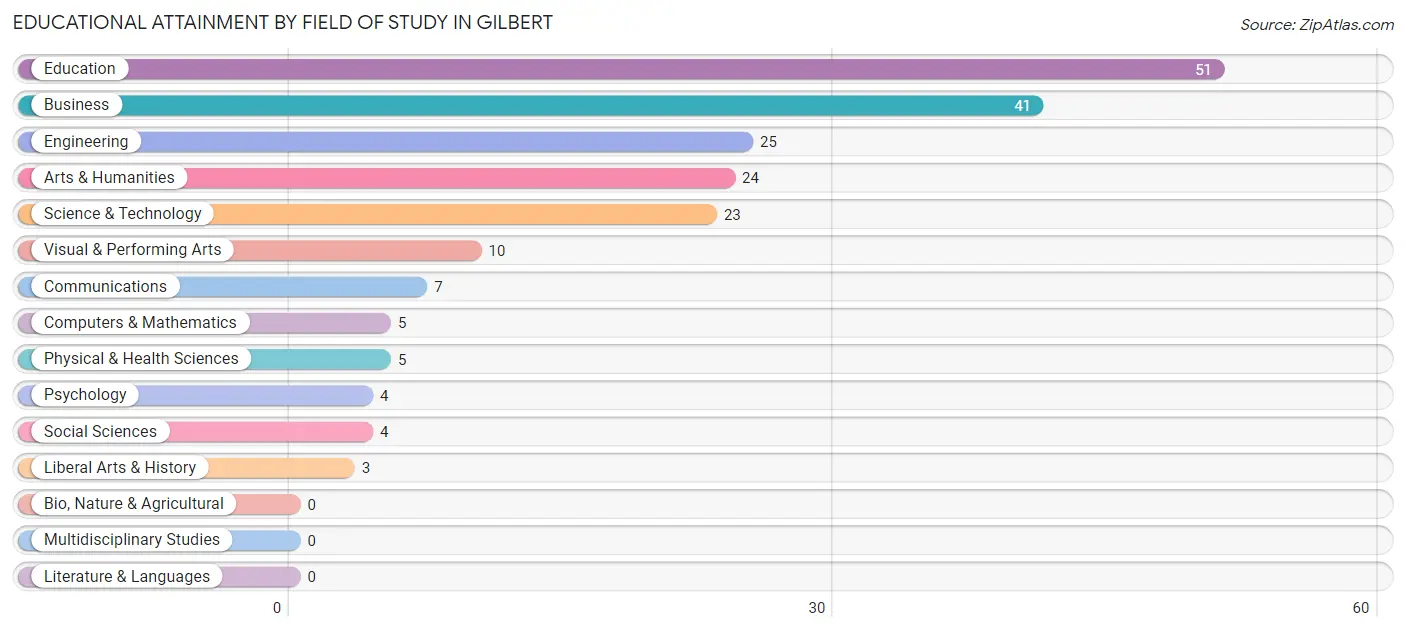
| Field of Study | # Graduates | % Graduates |
| Computers & Mathematics | 5 | 2.5% |
| Bio, Nature & Agricultural | 0 | 0.0% |
| Physical & Health Sciences | 5 | 2.5% |
| Psychology | 4 | 2.0% |
| Social Sciences | 4 | 2.0% |
| Engineering | 25 | 12.4% |
| Multidisciplinary Studies | 0 | 0.0% |
| Science & Technology | 23 | 11.4% |
| Business | 41 | 20.3% |
| Education | 51 | 25.3% |
| Literature & Languages | 0 | 0.0% |
| Liberal Arts & History | 3 | 1.5% |
| Visual & Performing Arts | 10 | 5.0% |
| Communications | 7 | 3.5% |
| Arts & Humanities | 24 | 11.9% |
| Total | 202 | 100.0% |
Transportation & Commute in Gilbert
Vehicle Availability by Sex in Gilbert
The most prevalent vehicle ownership categories in Gilbert are males with 2 vehicles (193, accounting for 48.2%) and females with 2 vehicles (163, making up 56.6%).
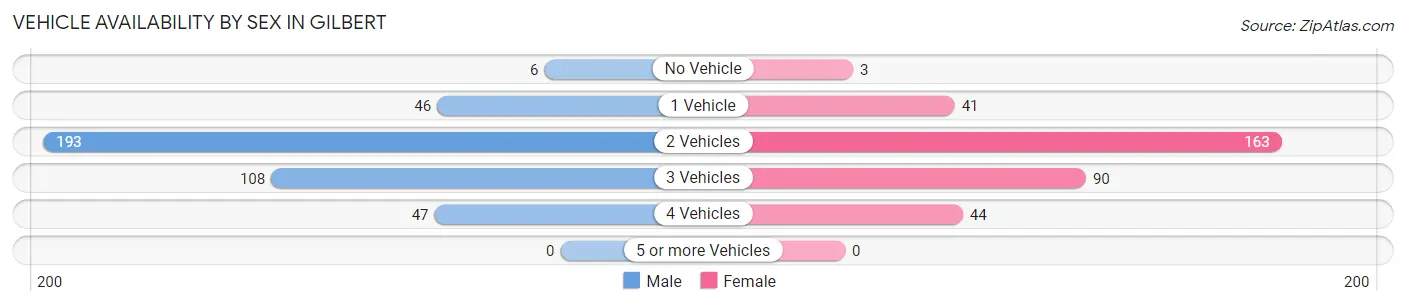
| Vehicles Available | Male | Female |
| No Vehicle | 6 (1.5%) | 3 (0.9%) |
| 1 Vehicle | 46 (11.5%) | 41 (12.0%) |
| 2 Vehicles | 193 (48.2%) | 163 (47.8%) |
| 3 Vehicles | 108 (27.0%) | 90 (26.4%) |
| 4 Vehicles | 47 (11.7%) | 44 (12.9%) |
| 5 or more Vehicles | 0 (0.0%) | 0 (0.0%) |
| Total | 400 (100.0%) | 341 (100.0%) |
Commute Time in Gilbert
The most frequently occuring commute durations in Gilbert are 15 to 19 minutes (161 commuters, 22.4%), 10 to 14 minutes (151 commuters, 21.0%), and 5 to 9 minutes (89 commuters, 12.4%).
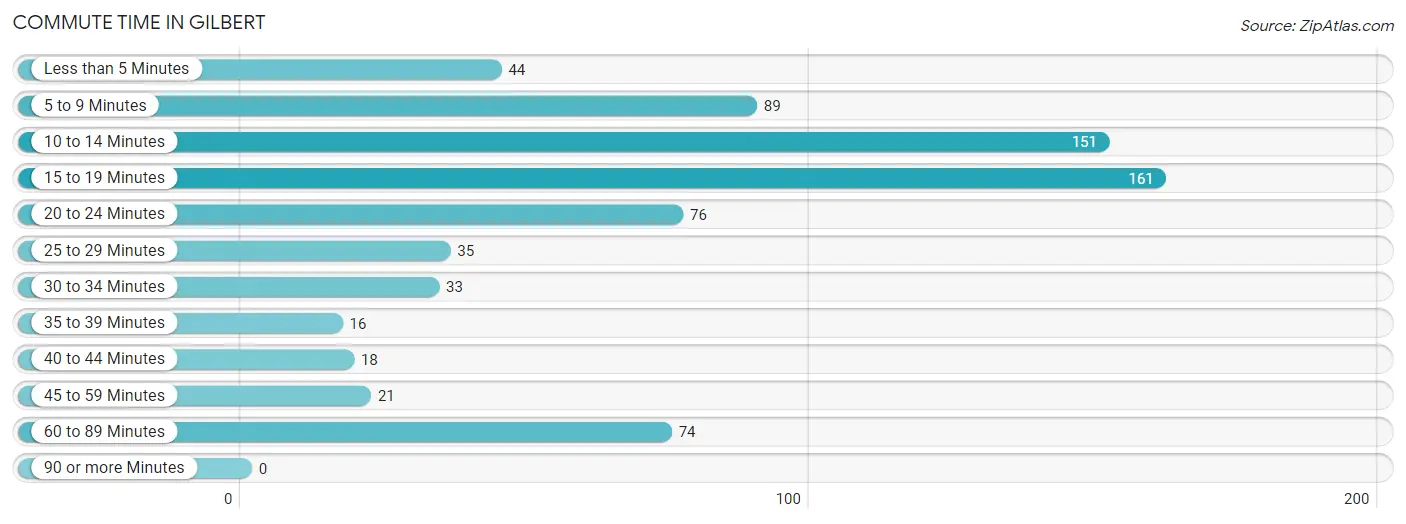
| Commute Time | # Commuters | % Commuters |
| Less than 5 Minutes | 44 | 6.1% |
| 5 to 9 Minutes | 89 | 12.4% |
| 10 to 14 Minutes | 151 | 21.0% |
| 15 to 19 Minutes | 161 | 22.4% |
| 20 to 24 Minutes | 76 | 10.6% |
| 25 to 29 Minutes | 35 | 4.9% |
| 30 to 34 Minutes | 33 | 4.6% |
| 35 to 39 Minutes | 16 | 2.2% |
| 40 to 44 Minutes | 18 | 2.5% |
| 45 to 59 Minutes | 21 | 2.9% |
| 60 to 89 Minutes | 74 | 10.3% |
| 90 or more Minutes | 0 | 0.0% |
Commute Time by Sex in Gilbert
The most common commute times in Gilbert are 10 to 14 minutes (89 commuters, 22.9%) for males and 15 to 19 minutes (86 commuters, 26.1%) for females.
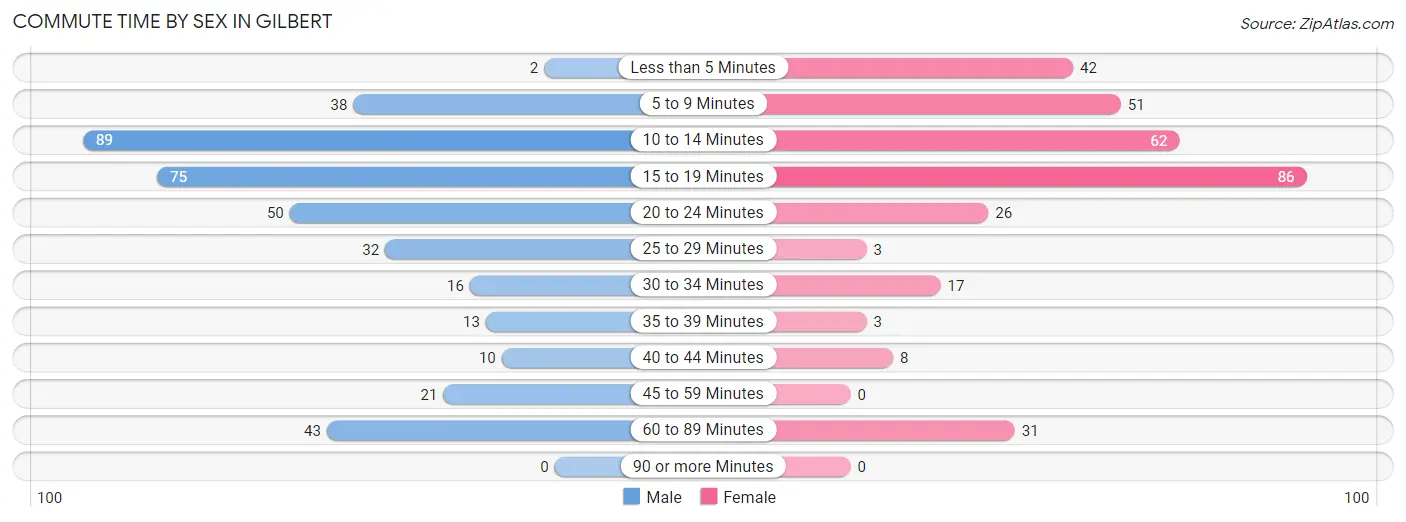
| Commute Time | Male | Female |
| Less than 5 Minutes | 2 (0.5%) | 42 (12.8%) |
| 5 to 9 Minutes | 38 (9.8%) | 51 (15.5%) |
| 10 to 14 Minutes | 89 (22.9%) | 62 (18.8%) |
| 15 to 19 Minutes | 75 (19.3%) | 86 (26.1%) |
| 20 to 24 Minutes | 50 (12.9%) | 26 (7.9%) |
| 25 to 29 Minutes | 32 (8.2%) | 3 (0.9%) |
| 30 to 34 Minutes | 16 (4.1%) | 17 (5.2%) |
| 35 to 39 Minutes | 13 (3.3%) | 3 (0.9%) |
| 40 to 44 Minutes | 10 (2.6%) | 8 (2.4%) |
| 45 to 59 Minutes | 21 (5.4%) | 0 (0.0%) |
| 60 to 89 Minutes | 43 (11.1%) | 31 (9.4%) |
| 90 or more Minutes | 0 (0.0%) | 0 (0.0%) |
Time of Departure to Work by Sex in Gilbert
The most frequent times of departure to work in Gilbert are 6:00 AM to 6:29 AM (90, 23.1%) for males and 7:30 AM to 7:59 AM (52, 15.8%) for females.
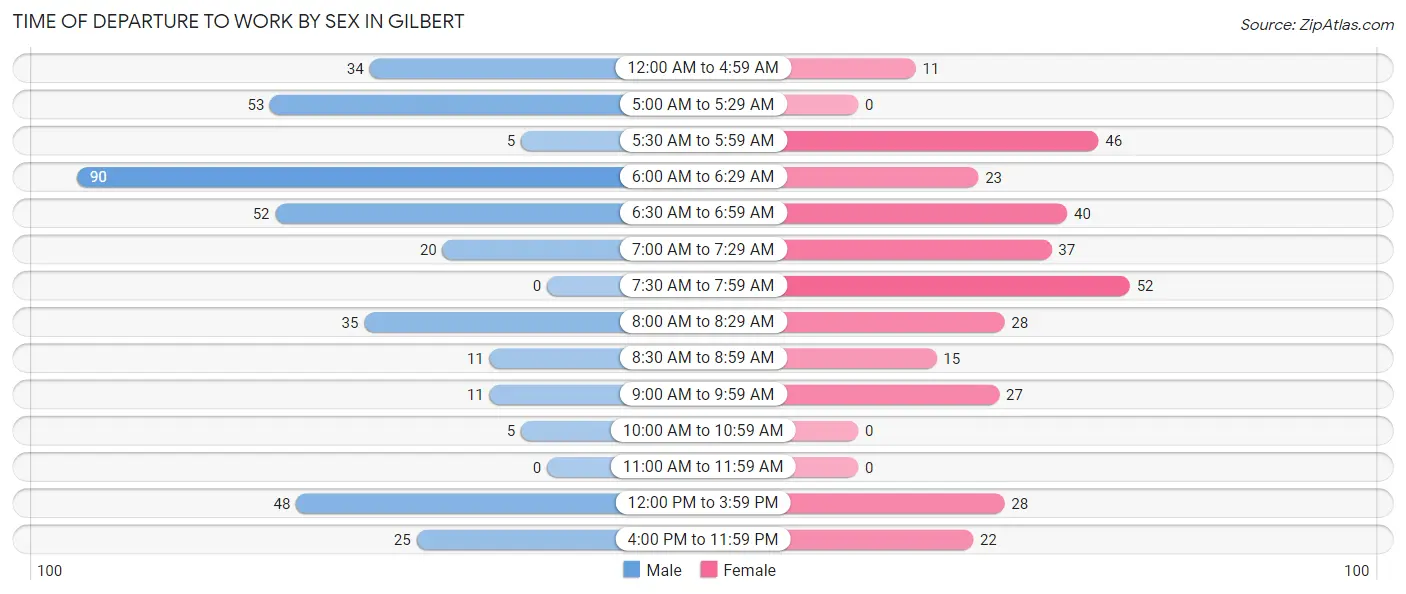
| Time of Departure | Male | Female |
| 12:00 AM to 4:59 AM | 34 (8.7%) | 11 (3.3%) |
| 5:00 AM to 5:29 AM | 53 (13.6%) | 0 (0.0%) |
| 5:30 AM to 5:59 AM | 5 (1.3%) | 46 (14.0%) |
| 6:00 AM to 6:29 AM | 90 (23.1%) | 23 (7.0%) |
| 6:30 AM to 6:59 AM | 52 (13.4%) | 40 (12.2%) |
| 7:00 AM to 7:29 AM | 20 (5.1%) | 37 (11.3%) |
| 7:30 AM to 7:59 AM | 0 (0.0%) | 52 (15.8%) |
| 8:00 AM to 8:29 AM | 35 (9.0%) | 28 (8.5%) |
| 8:30 AM to 8:59 AM | 11 (2.8%) | 15 (4.6%) |
| 9:00 AM to 9:59 AM | 11 (2.8%) | 27 (8.2%) |
| 10:00 AM to 10:59 AM | 5 (1.3%) | 0 (0.0%) |
| 11:00 AM to 11:59 AM | 0 (0.0%) | 0 (0.0%) |
| 12:00 PM to 3:59 PM | 48 (12.3%) | 28 (8.5%) |
| 4:00 PM to 11:59 PM | 25 (6.4%) | 22 (6.7%) |
| Total | 389 (100.0%) | 329 (100.0%) |
Housing Occupancy in Gilbert
Occupancy by Ownership in Gilbert
Of the total 794 dwellings in Gilbert, owner-occupied units account for 657 (82.8%), while renter-occupied units make up 137 (17.2%).
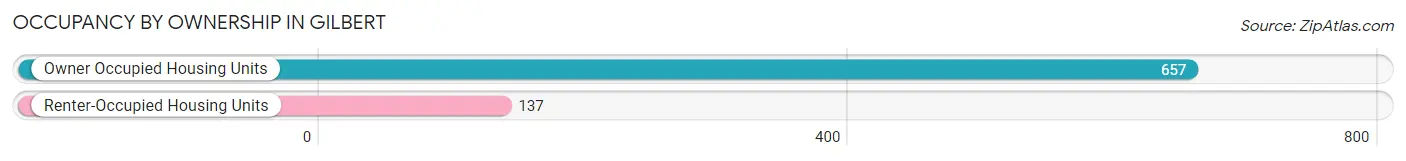
| Occupancy | # Housing Units | % Housing Units |
| Owner Occupied Housing Units | 657 | 82.8% |
| Renter-Occupied Housing Units | 137 | 17.2% |
| Total Occupied Housing Units | 794 | 100.0% |
Occupancy by Household Size in Gilbert
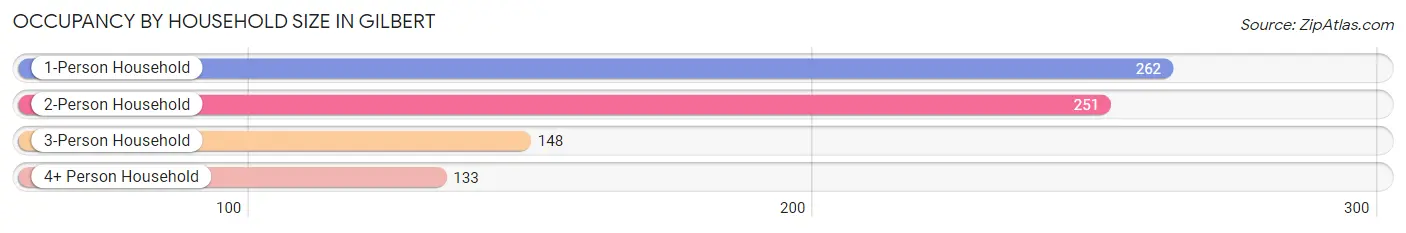
| Household Size | # Housing Units | % Housing Units |
| 1-Person Household | 262 | 33.0% |
| 2-Person Household | 251 | 31.6% |
| 3-Person Household | 148 | 18.6% |
| 4+ Person Household | 133 | 16.8% |
| Total Housing Units | 794 | 100.0% |
Occupancy by Ownership by Household Size in Gilbert
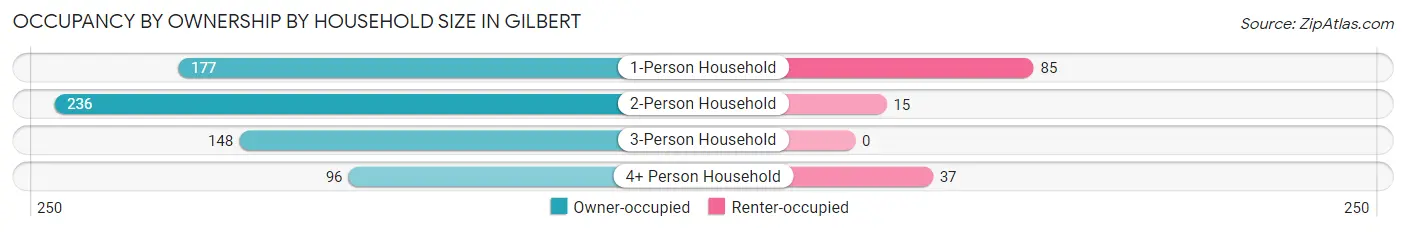
| Household Size | Owner-occupied | Renter-occupied |
| 1-Person Household | 177 (67.6%) | 85 (32.4%) |
| 2-Person Household | 236 (94.0%) | 15 (6.0%) |
| 3-Person Household | 148 (100.0%) | 0 (0.0%) |
| 4+ Person Household | 96 (72.2%) | 37 (27.8%) |
| Total Housing Units | 657 (82.8%) | 137 (17.2%) |
Occupancy by Educational Attainment in Gilbert
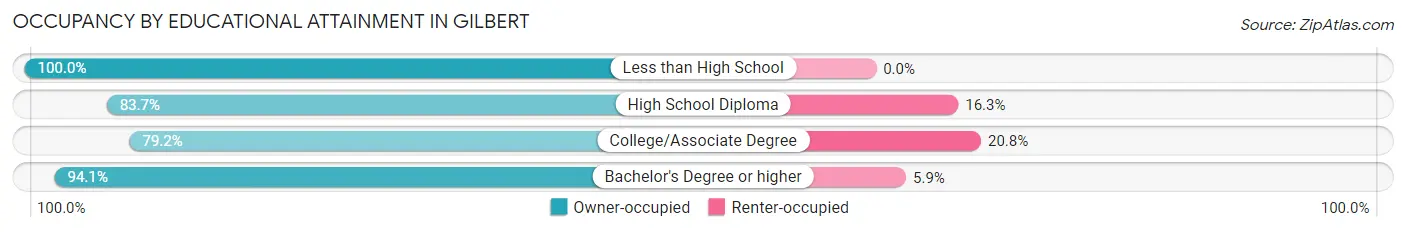
| Household Size | Owner-occupied | Renter-occupied |
| Less than High School | 7 (100.0%) | 0 (0.0%) |
| High School Diploma | 216 (83.7%) | 42 (16.3%) |
| College/Associate Degree | 339 (79.2%) | 89 (20.8%) |
| Bachelor's Degree or higher | 95 (94.1%) | 6 (5.9%) |
Occupancy by Age of Householder in Gilbert
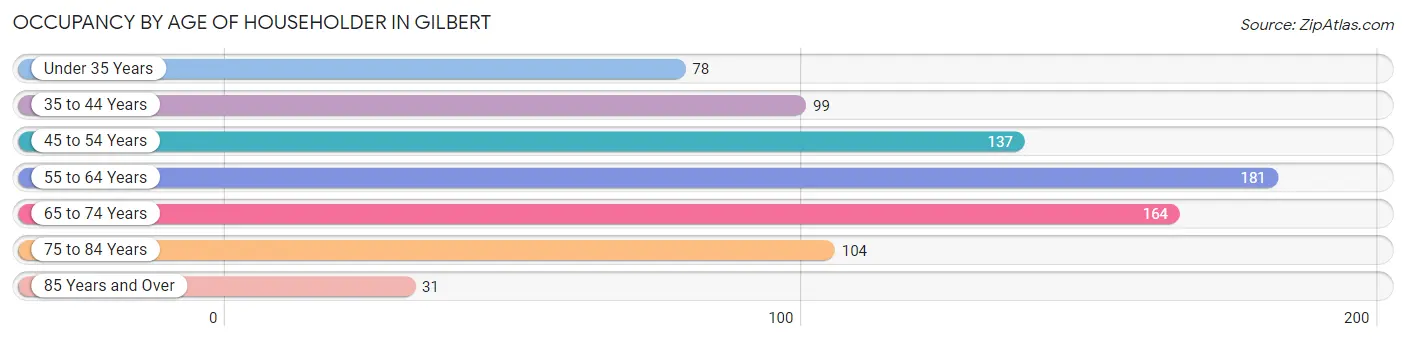
| Age Bracket | # Households | % Households |
| Under 35 Years | 78 | 9.8% |
| 35 to 44 Years | 99 | 12.5% |
| 45 to 54 Years | 137 | 17.2% |
| 55 to 64 Years | 181 | 22.8% |
| 65 to 74 Years | 164 | 20.6% |
| 75 to 84 Years | 104 | 13.1% |
| 85 Years and Over | 31 | 3.9% |
| Total | 794 | 100.0% |
Housing Finances in Gilbert
Median Income by Occupancy in Gilbert
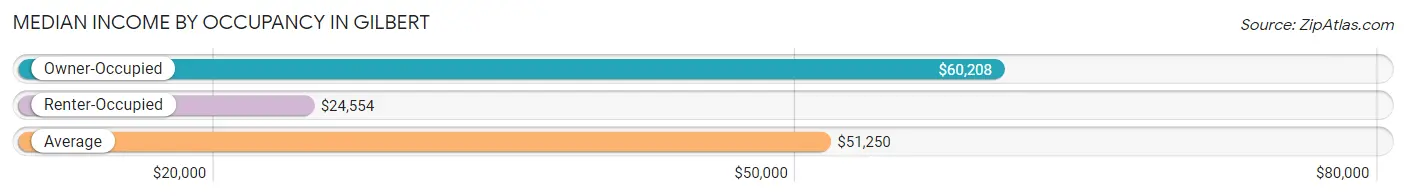
| Occupancy Type | # Households | Median Income |
| Owner-Occupied | 657 (82.8%) | $60,208 |
| Renter-Occupied | 137 (17.2%) | $24,554 |
| Average | 794 (100.0%) | $51,250 |
Occupancy by Householder Income Bracket in Gilbert
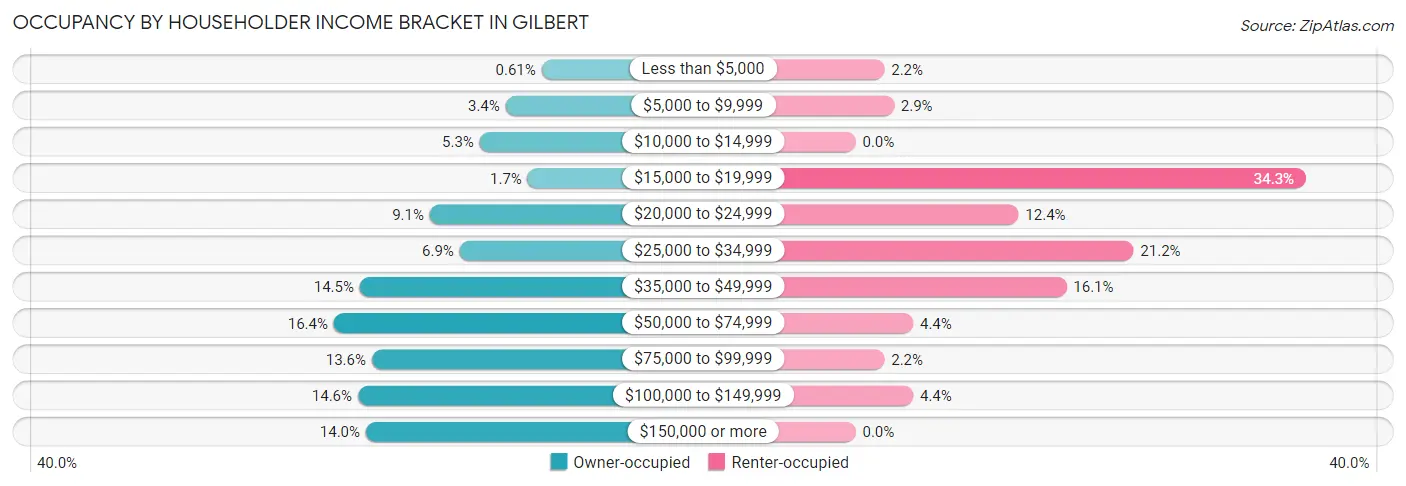
| Income Bracket | Owner-occupied | Renter-occupied |
| Less than $5,000 | 4 (0.6%) | 3 (2.2%) |
| $5,000 to $9,999 | 22 (3.4%) | 4 (2.9%) |
| $10,000 to $14,999 | 35 (5.3%) | 0 (0.0%) |
| $15,000 to $19,999 | 11 (1.7%) | 47 (34.3%) |
| $20,000 to $24,999 | 60 (9.1%) | 17 (12.4%) |
| $25,000 to $34,999 | 45 (6.9%) | 29 (21.2%) |
| $35,000 to $49,999 | 95 (14.5%) | 22 (16.1%) |
| $50,000 to $74,999 | 108 (16.4%) | 6 (4.4%) |
| $75,000 to $99,999 | 89 (13.6%) | 3 (2.2%) |
| $100,000 to $149,999 | 96 (14.6%) | 6 (4.4%) |
| $150,000 or more | 92 (14.0%) | 0 (0.0%) |
| Total | 657 (100.0%) | 137 (100.0%) |
Monthly Housing Cost Tiers in Gilbert
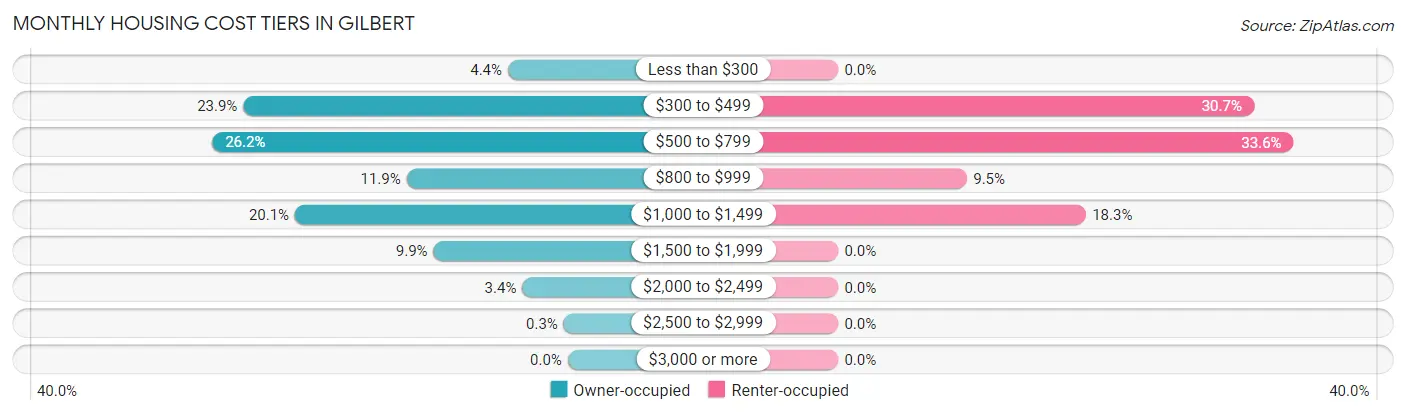
| Monthly Cost | Owner-occupied | Renter-occupied |
| Less than $300 | 29 (4.4%) | 0 (0.0%) |
| $300 to $499 | 157 (23.9%) | 42 (30.7%) |
| $500 to $799 | 172 (26.2%) | 46 (33.6%) |
| $800 to $999 | 78 (11.9%) | 13 (9.5%) |
| $1,000 to $1,499 | 132 (20.1%) | 25 (18.2%) |
| $1,500 to $1,999 | 65 (9.9%) | 0 (0.0%) |
| $2,000 to $2,499 | 22 (3.4%) | 0 (0.0%) |
| $2,500 to $2,999 | 2 (0.3%) | 0 (0.0%) |
| $3,000 or more | 0 (0.0%) | 0 (0.0%) |
| Total | 657 (100.0%) | 137 (100.0%) |
Physical Housing Characteristics in Gilbert
Housing Structures in Gilbert
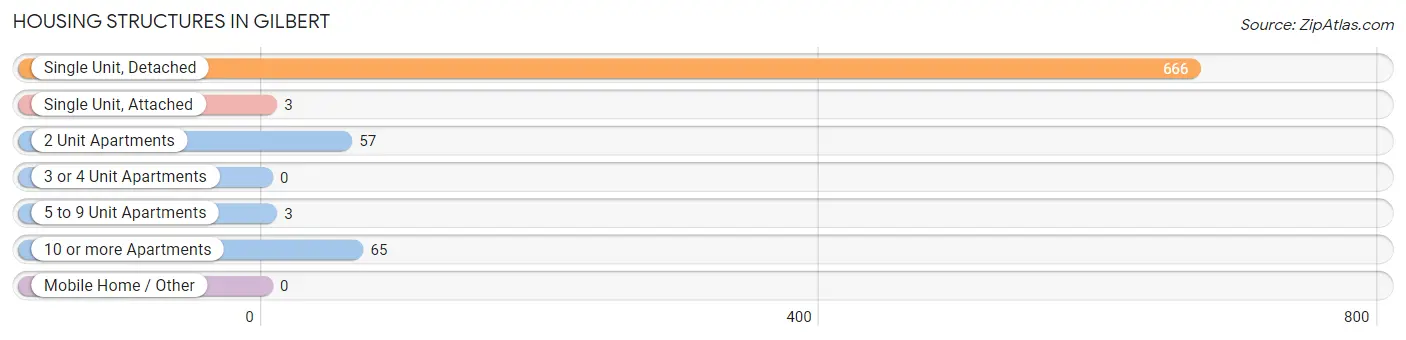
| Structure Type | # Housing Units | % Housing Units |
| Single Unit, Detached | 666 | 83.9% |
| Single Unit, Attached | 3 | 0.4% |
| 2 Unit Apartments | 57 | 7.2% |
| 3 or 4 Unit Apartments | 0 | 0.0% |
| 5 to 9 Unit Apartments | 3 | 0.4% |
| 10 or more Apartments | 65 | 8.2% |
| Mobile Home / Other | 0 | 0.0% |
| Total | 794 | 100.0% |
Housing Structures by Occupancy in Gilbert
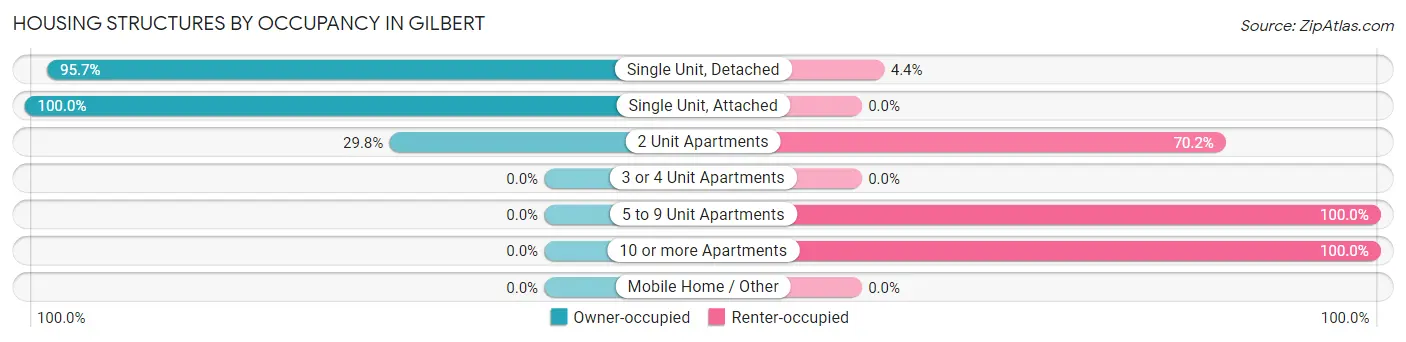
| Structure Type | Owner-occupied | Renter-occupied |
| Single Unit, Detached | 637 (95.7%) | 29 (4.3%) |
| Single Unit, Attached | 3 (100.0%) | 0 (0.0%) |
| 2 Unit Apartments | 17 (29.8%) | 40 (70.2%) |
| 3 or 4 Unit Apartments | 0 (0.0%) | 0 (0.0%) |
| 5 to 9 Unit Apartments | 0 (0.0%) | 3 (100.0%) |
| 10 or more Apartments | 0 (0.0%) | 65 (100.0%) |
| Mobile Home / Other | 0 (0.0%) | 0 (0.0%) |
| Total | 657 (82.8%) | 137 (17.2%) |
Housing Structures by Number of Rooms in Gilbert
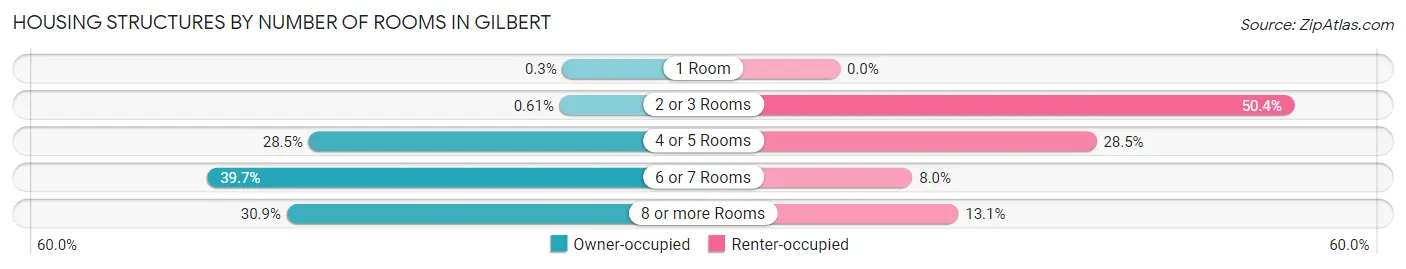
| Number of Rooms | Owner-occupied | Renter-occupied |
| 1 Room | 2 (0.3%) | 0 (0.0%) |
| 2 or 3 Rooms | 4 (0.6%) | 69 (50.4%) |
| 4 or 5 Rooms | 187 (28.5%) | 39 (28.5%) |
| 6 or 7 Rooms | 261 (39.7%) | 11 (8.0%) |
| 8 or more Rooms | 203 (30.9%) | 18 (13.1%) |
| Total | 657 (100.0%) | 137 (100.0%) |
Housing Structure by Heating Type in Gilbert
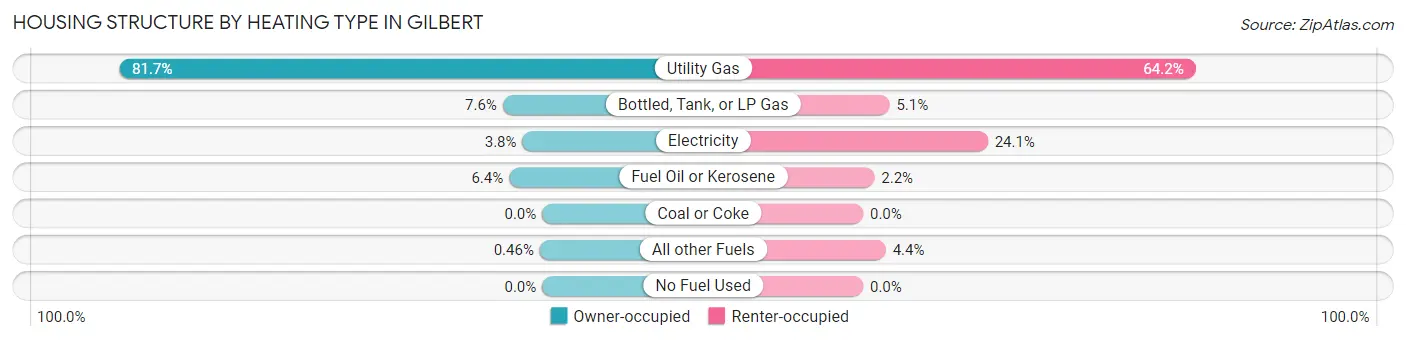
| Heating Type | Owner-occupied | Renter-occupied |
| Utility Gas | 537 (81.7%) | 88 (64.2%) |
| Bottled, Tank, or LP Gas | 50 (7.6%) | 7 (5.1%) |
| Electricity | 25 (3.8%) | 33 (24.1%) |
| Fuel Oil or Kerosene | 42 (6.4%) | 3 (2.2%) |
| Coal or Coke | 0 (0.0%) | 0 (0.0%) |
| All other Fuels | 3 (0.5%) | 6 (4.4%) |
| No Fuel Used | 0 (0.0%) | 0 (0.0%) |
| Total | 657 (100.0%) | 137 (100.0%) |
Household Vehicle Usage in Gilbert
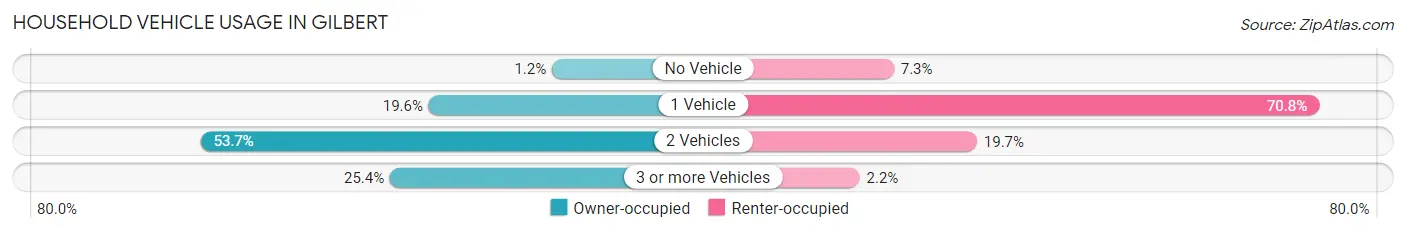
| Vehicles per Household | Owner-occupied | Renter-occupied |
| No Vehicle | 8 (1.2%) | 10 (7.3%) |
| 1 Vehicle | 129 (19.6%) | 97 (70.8%) |
| 2 Vehicles | 353 (53.7%) | 27 (19.7%) |
| 3 or more Vehicles | 167 (25.4%) | 3 (2.2%) |
| Total | 657 (100.0%) | 137 (100.0%) |
Real Estate & Mortgages in Gilbert
Real Estate and Mortgage Overview in Gilbert
| Characteristic | Without Mortgage | With Mortgage |
| Housing Units | 327 | 330 |
| Median Property Value | $97,000 | $130,100 |
| Median Household Income | $53,083 | $69 |
| Monthly Housing Costs | $484 | $0 |
| Real Estate Taxes | $891 | $0 |
Property Value by Mortgage Status in Gilbert
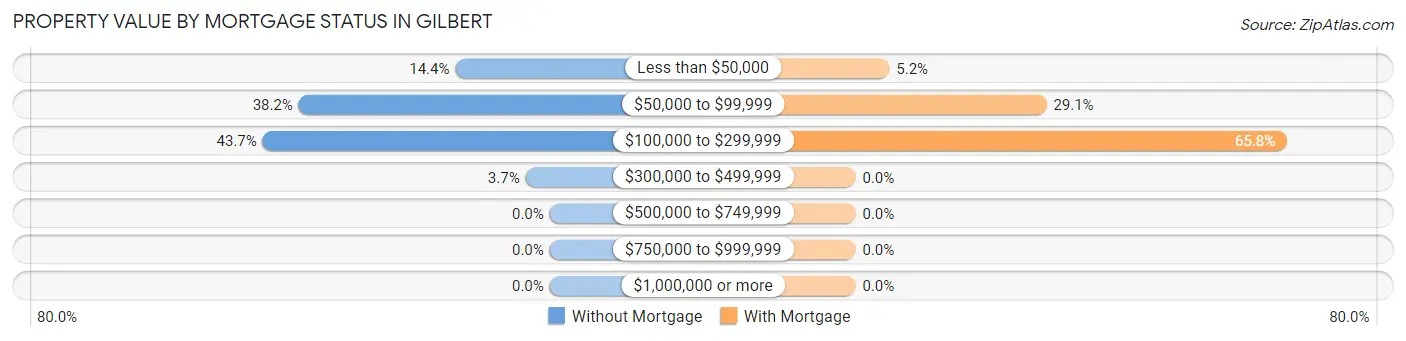
| Property Value | Without Mortgage | With Mortgage |
| Less than $50,000 | 47 (14.4%) | 17 (5.1%) |
| $50,000 to $99,999 | 125 (38.2%) | 96 (29.1%) |
| $100,000 to $299,999 | 143 (43.7%) | 217 (65.8%) |
| $300,000 to $499,999 | 12 (3.7%) | 0 (0.0%) |
| $500,000 to $749,999 | 0 (0.0%) | 0 (0.0%) |
| $750,000 to $999,999 | 0 (0.0%) | 0 (0.0%) |
| $1,000,000 or more | 0 (0.0%) | 0 (0.0%) |
| Total | 327 (100.0%) | 330 (100.0%) |
Household Income by Mortgage Status in Gilbert
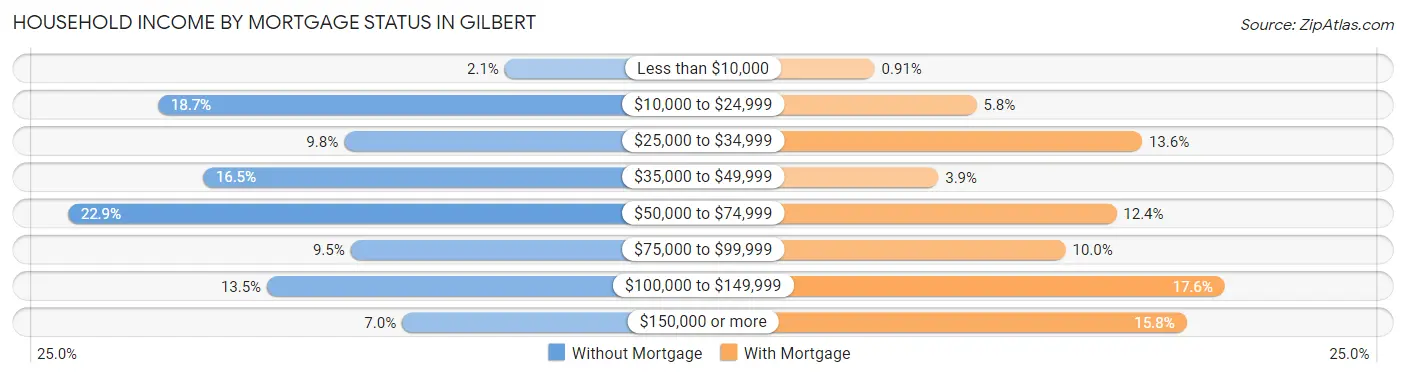
| Household Income | Without Mortgage | With Mortgage |
| Less than $10,000 | 7 (2.1%) | 3 (0.9%) |
| $10,000 to $24,999 | 61 (18.6%) | 19 (5.8%) |
| $25,000 to $34,999 | 32 (9.8%) | 45 (13.6%) |
| $35,000 to $49,999 | 54 (16.5%) | 13 (3.9%) |
| $50,000 to $74,999 | 75 (22.9%) | 41 (12.4%) |
| $75,000 to $99,999 | 31 (9.5%) | 33 (10.0%) |
| $100,000 to $149,999 | 44 (13.5%) | 58 (17.6%) |
| $150,000 or more | 23 (7.0%) | 52 (15.8%) |
| Total | 327 (100.0%) | 330 (100.0%) |
Property Value to Household Income Ratio in Gilbert
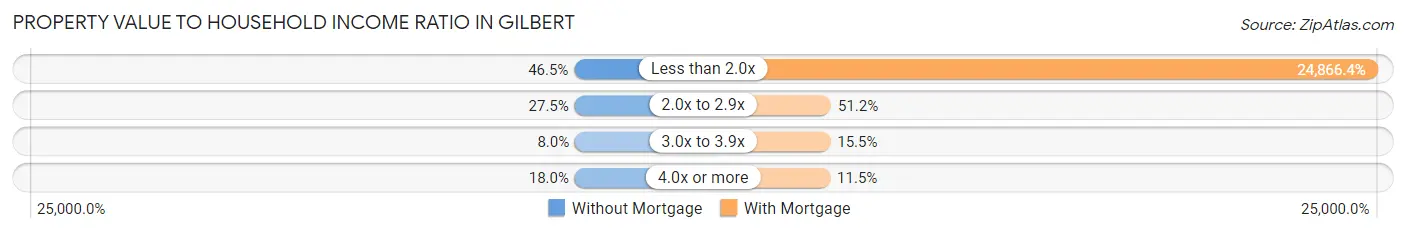
| Value-to-Income Ratio | Without Mortgage | With Mortgage |
| Less than 2.0x | 152 (46.5%) | 82,059 (24,866.4%) |
| 2.0x to 2.9x | 90 (27.5%) | 169 (51.2%) |
| 3.0x to 3.9x | 26 (8.0%) | 51 (15.4%) |
| 4.0x or more | 59 (18.0%) | 38 (11.5%) |
| Total | 327 (100.0%) | 330 (100.0%) |
Real Estate Taxes by Mortgage Status in Gilbert
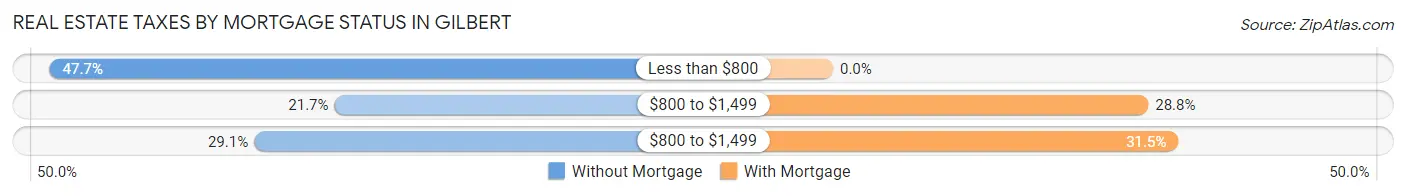
| Property Taxes | Without Mortgage | With Mortgage |
| Less than $800 | 156 (47.7%) | 0 (0.0%) |
| $800 to $1,499 | 71 (21.7%) | 95 (28.8%) |
| $800 to $1,499 | 95 (29.0%) | 104 (31.5%) |
| Total | 327 (100.0%) | 330 (100.0%) |
Health & Disability in Gilbert
Health Insurance Coverage by Age in Gilbert
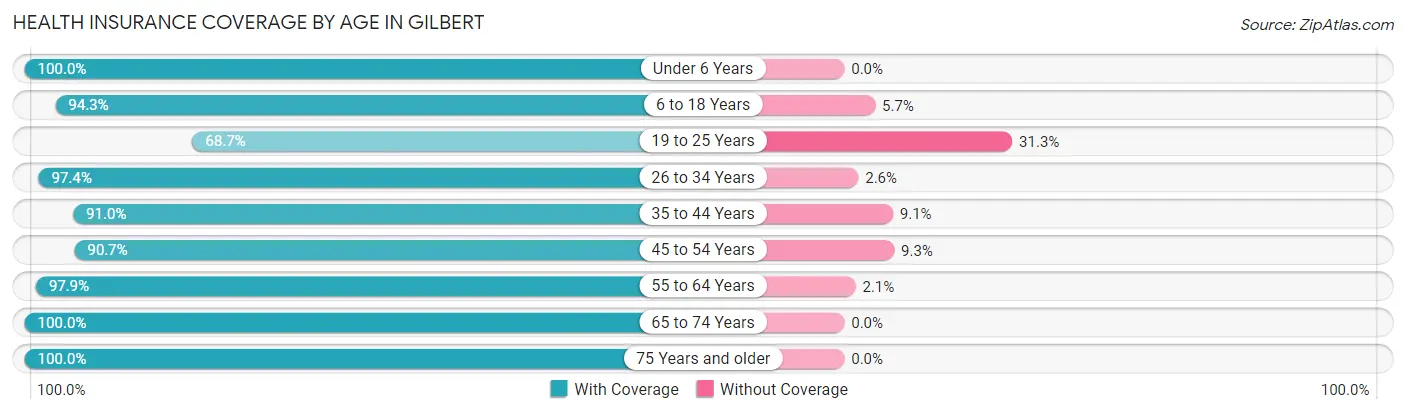
| Age Bracket | With Coverage | Without Coverage |
| Under 6 Years | 90 (100.0%) | 0 (0.0%) |
| 6 to 18 Years | 312 (94.3%) | 19 (5.7%) |
| 19 to 25 Years | 79 (68.7%) | 36 (31.3%) |
| 26 to 34 Years | 112 (97.4%) | 3 (2.6%) |
| 35 to 44 Years | 201 (90.9%) | 20 (9.0%) |
| 45 to 54 Years | 205 (90.7%) | 21 (9.3%) |
| 55 to 64 Years | 280 (97.9%) | 6 (2.1%) |
| 65 to 74 Years | 274 (100.0%) | 0 (0.0%) |
| 75 Years and older | 163 (100.0%) | 0 (0.0%) |
| Total | 1,716 (94.2%) | 105 (5.8%) |
Health Insurance Coverage by Citizenship Status in Gilbert
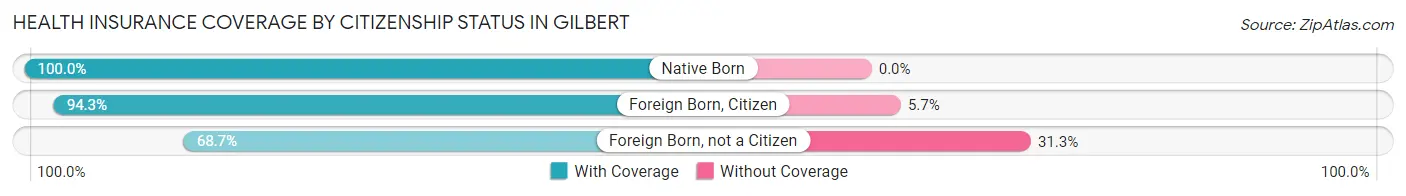
| Citizenship Status | With Coverage | Without Coverage |
| Native Born | 90 (100.0%) | 0 (0.0%) |
| Foreign Born, Citizen | 312 (94.3%) | 19 (5.7%) |
| Foreign Born, not a Citizen | 79 (68.7%) | 36 (31.3%) |
Health Insurance Coverage by Household Income in Gilbert
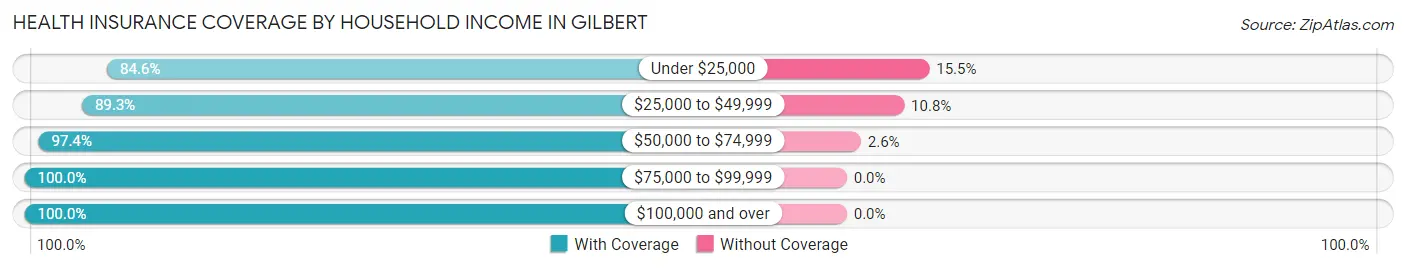
| Household Income | With Coverage | Without Coverage |
| Under $25,000 | 290 (84.6%) | 53 (15.4%) |
| $25,000 to $49,999 | 382 (89.2%) | 46 (10.7%) |
| $50,000 to $74,999 | 222 (97.4%) | 6 (2.6%) |
| $75,000 to $99,999 | 224 (100.0%) | 0 (0.0%) |
| $100,000 and over | 593 (100.0%) | 0 (0.0%) |
Public vs Private Health Insurance Coverage by Age in Gilbert
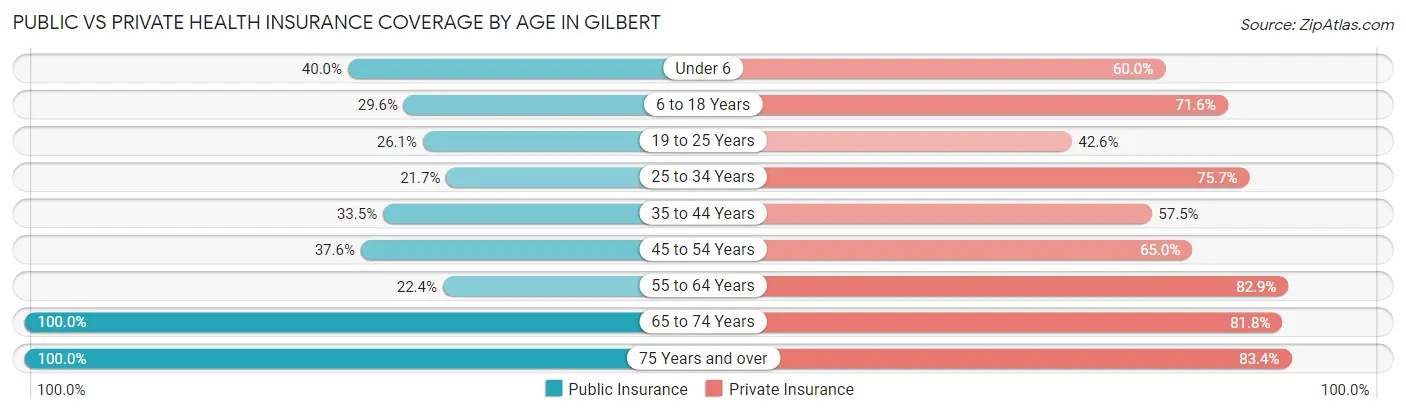
| Age Bracket | Public Insurance | Private Insurance |
| Under 6 | 36 (40.0%) | 54 (60.0%) |
| 6 to 18 Years | 98 (29.6%) | 237 (71.6%) |
| 19 to 25 Years | 30 (26.1%) | 49 (42.6%) |
| 25 to 34 Years | 25 (21.7%) | 87 (75.6%) |
| 35 to 44 Years | 74 (33.5%) | 127 (57.5%) |
| 45 to 54 Years | 85 (37.6%) | 147 (65.0%) |
| 55 to 64 Years | 64 (22.4%) | 237 (82.9%) |
| 65 to 74 Years | 274 (100.0%) | 224 (81.8%) |
| 75 Years and over | 163 (100.0%) | 136 (83.4%) |
| Total | 849 (46.6%) | 1,298 (71.3%) |
Disability Status by Sex by Age in Gilbert
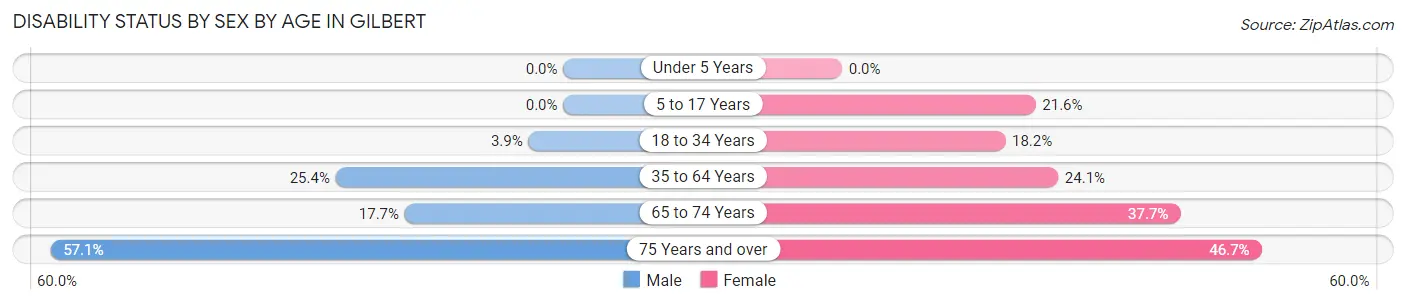
| Age Bracket | Male | Female |
| Under 5 Years | 0 (0.0%) | 0 (0.0%) |
| 5 to 17 Years | 0 (0.0%) | 36 (21.6%) |
| 18 to 34 Years | 5 (3.9%) | 20 (18.2%) |
| 35 to 64 Years | 90 (25.4%) | 91 (24.1%) |
| 65 to 74 Years | 24 (17.6%) | 52 (37.7%) |
| 75 Years and over | 32 (57.1%) | 50 (46.7%) |
Disability Class by Sex by Age in Gilbert
Disability Class: Hearing Difficulty
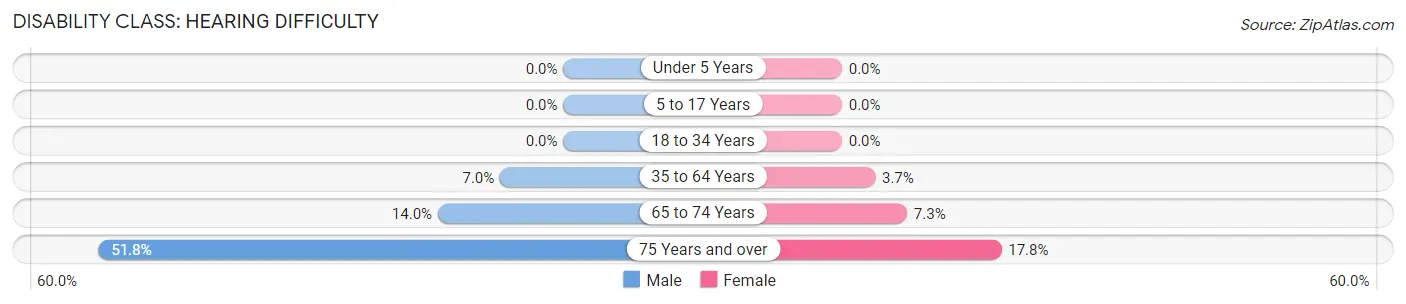
| Age Bracket | Male | Female |
| Under 5 Years | 0 (0.0%) | 0 (0.0%) |
| 5 to 17 Years | 0 (0.0%) | 0 (0.0%) |
| 18 to 34 Years | 0 (0.0%) | 0 (0.0%) |
| 35 to 64 Years | 25 (7.0%) | 14 (3.7%) |
| 65 to 74 Years | 19 (14.0%) | 10 (7.2%) |
| 75 Years and over | 29 (51.8%) | 19 (17.8%) |
Disability Class: Vision Difficulty
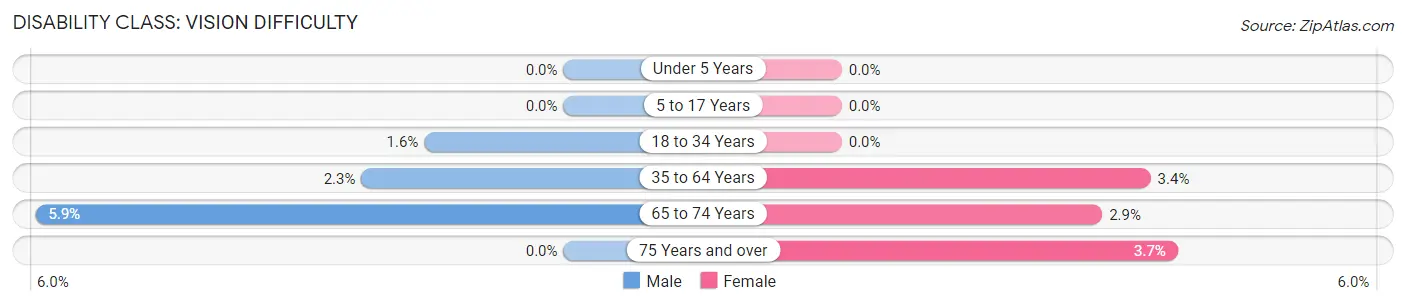
| Age Bracket | Male | Female |
| Under 5 Years | 0 (0.0%) | 0 (0.0%) |
| 5 to 17 Years | 0 (0.0%) | 0 (0.0%) |
| 18 to 34 Years | 2 (1.5%) | 0 (0.0%) |
| 35 to 64 Years | 8 (2.2%) | 13 (3.4%) |
| 65 to 74 Years | 8 (5.9%) | 4 (2.9%) |
| 75 Years and over | 0 (0.0%) | 4 (3.7%) |
Disability Class: Cognitive Difficulty
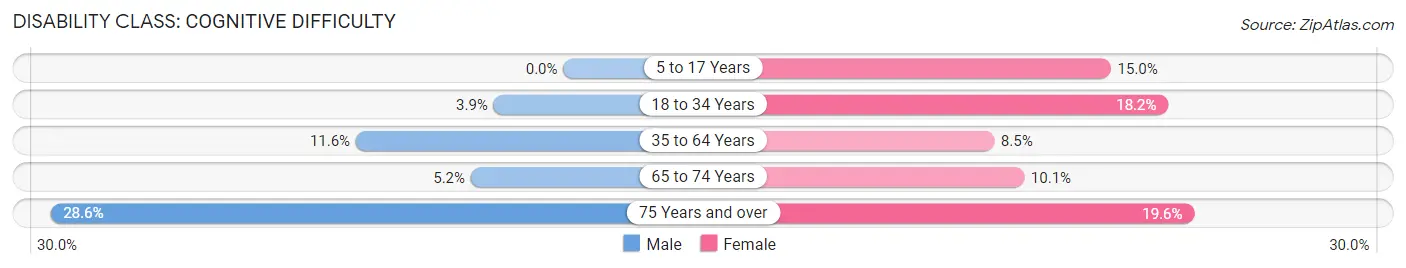
| Age Bracket | Male | Female |
| 5 to 17 Years | 0 (0.0%) | 25 (15.0%) |
| 18 to 34 Years | 5 (3.9%) | 20 (18.2%) |
| 35 to 64 Years | 41 (11.6%) | 32 (8.5%) |
| 65 to 74 Years | 7 (5.1%) | 14 (10.1%) |
| 75 Years and over | 16 (28.6%) | 21 (19.6%) |
Disability Class: Ambulatory Difficulty
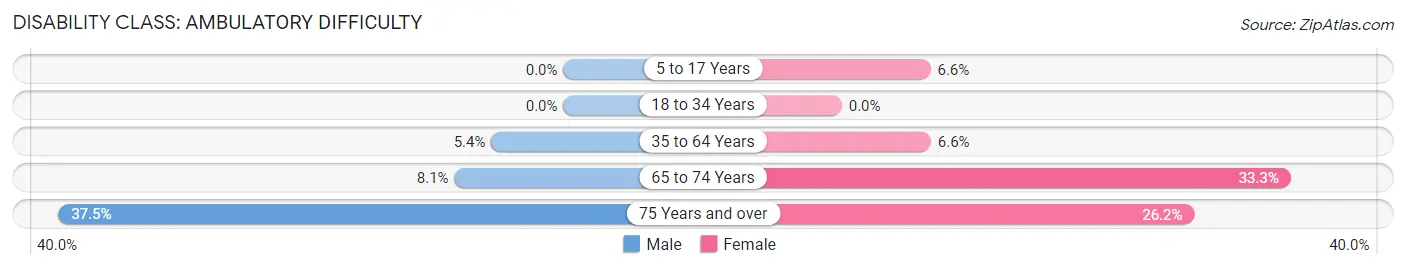
| Age Bracket | Male | Female |
| 5 to 17 Years | 0 (0.0%) | 11 (6.6%) |
| 18 to 34 Years | 0 (0.0%) | 0 (0.0%) |
| 35 to 64 Years | 19 (5.3%) | 25 (6.6%) |
| 65 to 74 Years | 11 (8.1%) | 46 (33.3%) |
| 75 Years and over | 21 (37.5%) | 28 (26.2%) |
Disability Class: Self-Care Difficulty
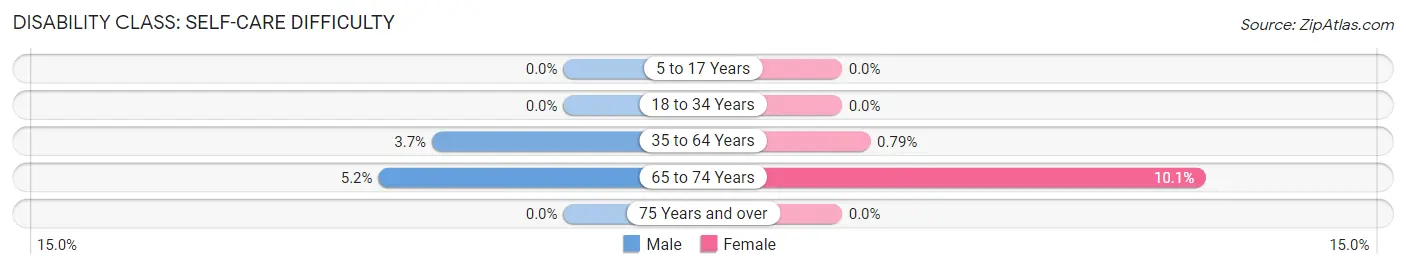
| Age Bracket | Male | Female |
| 5 to 17 Years | 0 (0.0%) | 0 (0.0%) |
| 18 to 34 Years | 0 (0.0%) | 0 (0.0%) |
| 35 to 64 Years | 13 (3.7%) | 3 (0.8%) |
| 65 to 74 Years | 7 (5.1%) | 14 (10.1%) |
| 75 Years and over | 0 (0.0%) | 0 (0.0%) |
Technology Access in Gilbert
Computing Device Access in Gilbert
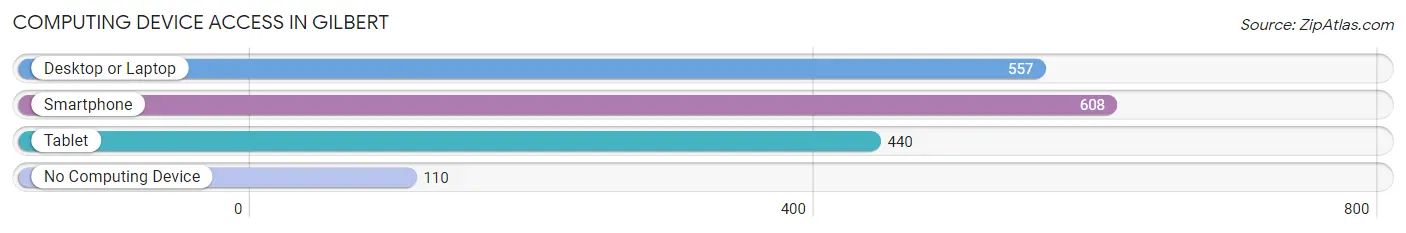
| Device Type | # Households | % Households |
| Desktop or Laptop | 557 | 70.2% |
| Smartphone | 608 | 76.6% |
| Tablet | 440 | 55.4% |
| No Computing Device | 110 | 13.9% |
| Total | 794 | 100.0% |
Internet Access in Gilbert
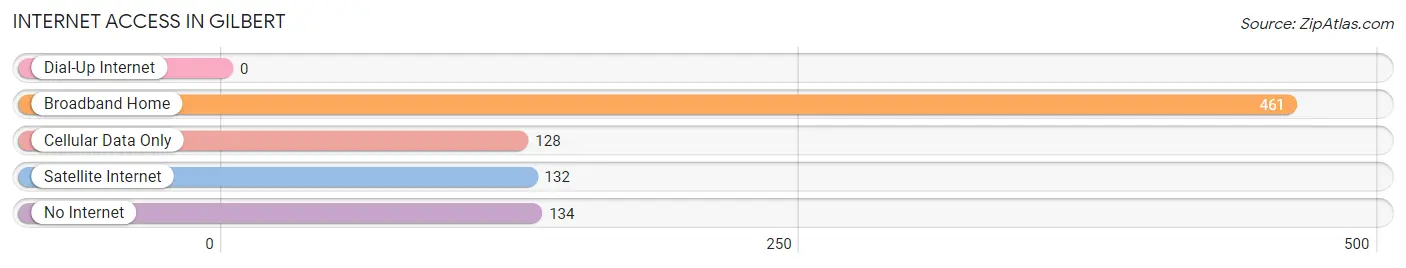
| Internet Type | # Households | % Households |
| Dial-Up Internet | 0 | 0.0% |
| Broadband Home | 461 | 58.1% |
| Cellular Data Only | 128 | 16.1% |
| Satellite Internet | 132 | 16.6% |
| No Internet | 134 | 16.9% |
| Total | 794 | 100.0% |
Gilbert Summary
Gilbert, Minnesota is a small town located in the northern part of the state, about 20 miles east of Duluth. It is situated in St. Louis County, and is part of the Iron Range region. The town was founded in 1887 and was named after Gilbert S. Hartley, a local businessman. The population of Gilbert was 1,845 as of the 2010 census.
Geography
Gilbert is located at the intersection of Minnesota State Highway 37 and County Road 7. It is situated on the Mesabi Iron Range, a region of Minnesota known for its iron ore deposits. The town is surrounded by forests and lakes, and is located near the Boundary Waters Canoe Area Wilderness. The town is located in a hilly area, with an elevation of 1,400 feet above sea level.
History
The area around Gilbert was first settled in the late 1800s by Finnish and Swedish immigrants. The town was founded in 1887 and was named after Gilbert S. Hartley, a local businessman. The town was incorporated in 1901.
In the early 1900s, the town was a major center for iron ore mining. The mines provided employment for many of the town's residents. The town also had a sawmill, a flour mill, and a brickyard.
In the 1950s, the iron ore industry began to decline, and the town's economy shifted to tourism. The town is now a popular destination for outdoor recreation, such as fishing, hunting, and camping.
Economy
The economy of Gilbert is largely based on tourism. The town is a popular destination for outdoor recreation, such as fishing, hunting, and camping. The town also has several restaurants, bars, and shops.
The town is also home to several businesses, including a lumber mill, a sawmill, and a brickyard. The town is also home to a number of small manufacturing companies.
Demographics
As of the 2010 census, the population of Gilbert was 1,845. The racial makeup of the town was 97.2% White, 0.3% African American, 0.2% Native American, 0.2% Asian, 0.1% Pacific Islander, 0.7% from other races, and 1.3% from two or more races. Hispanic or Latino of any race were 1.7% of the population.
The median income for a household in the town was $41,250, and the median income for a family was $50,000. The per capita income for the town was $20,845. About 8.3% of families and 11.2% of the population were below the poverty line, including 16.2% of those under age 18 and 8.3% of those age 65 or over.
Conclusion
Gilbert, Minnesota is a small town located in the northern part of the state, about 20 miles east of Duluth. It is situated in St. Louis County, and is part of the Iron Range region. The town was founded in 1887 and was named after Gilbert S. Hartley, a local businessman. The population of Gilbert was 1,845 as of the 2010 census. The economy of Gilbert is largely based on tourism, with outdoor recreation being a popular activity. The town also has several businesses, including a lumber mill, a sawmill, and a brickyard. The racial makeup of the town was 97.2% White, 0.3% African American, 0.2% Native American, 0.2% Asian, 0.1% Pacific Islander, 0.7% from other races, and 1.3% from two or more races. The median income for a household in the town was $41,250, and the median income for a family was $50,000.
Common Questions
What is Per Capita Income in Gilbert?
Per Capita income in Gilbert is $31,728.
What is the Median Family Income in Gilbert?
Median Family Income in Gilbert is $73,182.
What is the Median Household income in Gilbert?
Median Household Income in Gilbert is $51,250.
What is Income or Wage Gap in Gilbert?
Income or Wage Gap in Gilbert is 60.5%.
Women in Gilbert earn 39.5 cents for every dollar earned by a man.
What is Inequality or Gini Index in Gilbert?
Inequality or Gini Index in Gilbert is 0.44.
What is the Total Population of Gilbert?
Total Population of Gilbert is 1,821.
What is the Total Male Population of Gilbert?
Total Male Population of Gilbert is 884.
What is the Total Female Population of Gilbert?
Total Female Population of Gilbert is 937.
What is the Ratio of Males per 100 Females in Gilbert?
There are 94.34 Males per 100 Females in Gilbert.
What is the Ratio of Females per 100 Males in Gilbert?
There are 106.00 Females per 100 Males in Gilbert.
What is the Median Population Age in Gilbert?
Median Population Age in Gilbert is 45.6 Years.
What is the Average Family Size in Gilbert
Average Family Size in Gilbert is 2.8 People.
What is the Average Household Size in Gilbert
Average Household Size in Gilbert is 2.3 People.
How Large is the Labor Force in Gilbert?
There are 784 People in the Labor Forcein in Gilbert.
What is the Percentage of People in the Labor Force in Gilbert?
52.8% of People are in the Labor Force in Gilbert.
What is the Unemployment Rate in Gilbert?
Unemployment Rate in Gilbert is 1.1%.