Zip Codes with the Highest Poverty Level Among Children Under the Age of 5 in Minnesota
RELATED REPORTS & OPTIONS
Highest Poverty | Child 0-5
Minnesota
Compare Zip Codes
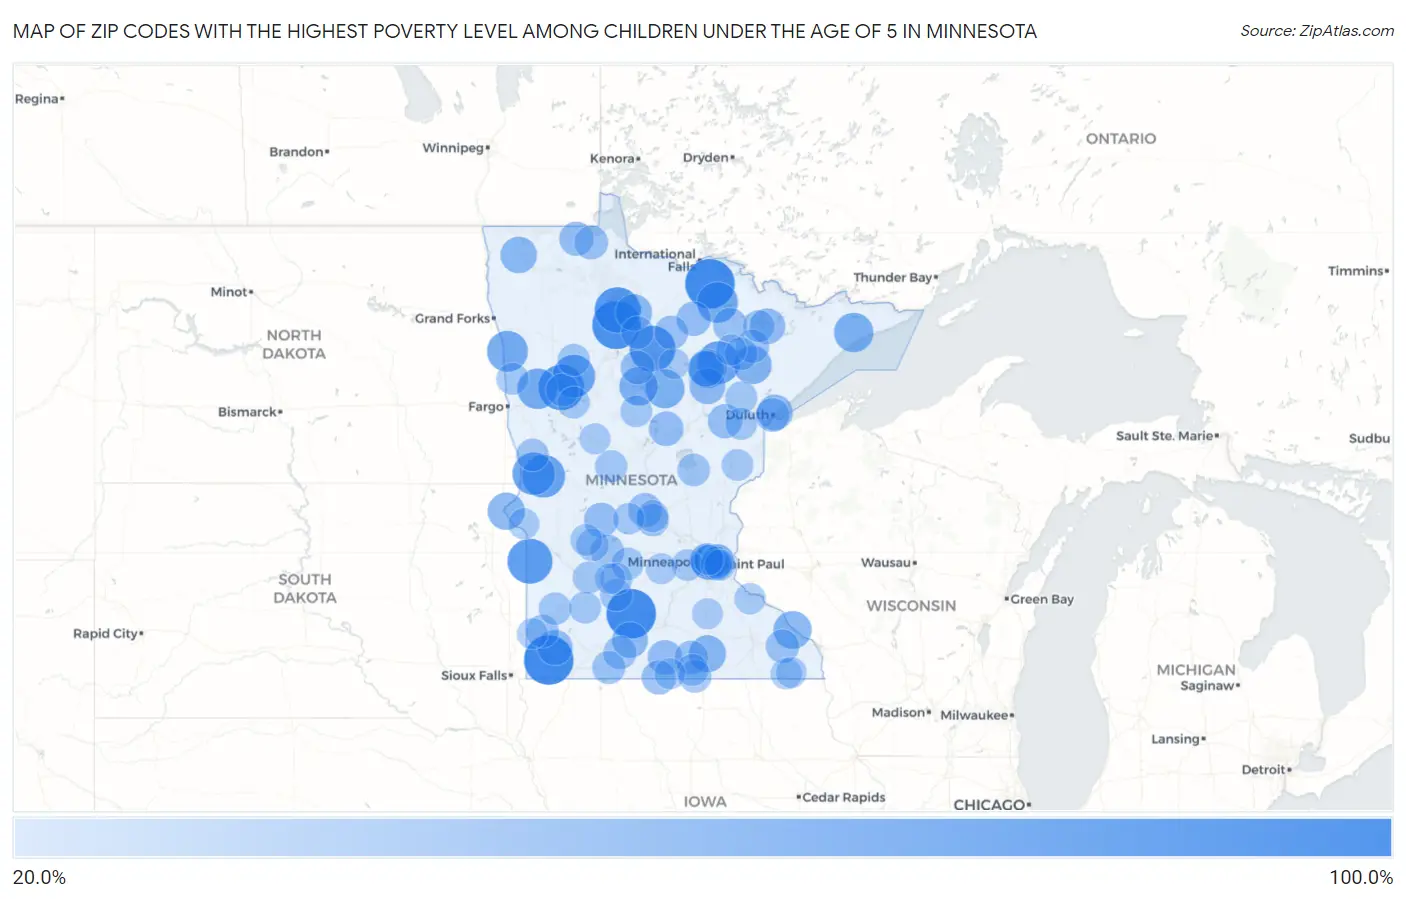
Map of Zip Codes with the Highest Poverty Level Among Children Under the Age of 5 in Minnesota
20.0%
100.0%
Zip Codes with the Highest Poverty Level Among Children Under the Age of 5 in Minnesota
| Zip Code | Child Poverty | vs State | vs National | |
| 1. | 56669 | 100.0% | 11.3%(+88.7)#1 | 18.1%(+81.9)#364 |
| 2. | 56147 | 100.0% | 11.3%(+88.7)#2 | 18.1%(+81.9)#487 |
| 3. | 56030 | 100.0% | 11.3%(+88.7)#3 | 18.1%(+81.9)#560 |
| 4. | 56670 | 94.3% | 11.3%(+83.0)#4 | 18.1%(+76.2)#590 |
| 5. | 56681 | 85.7% | 11.3%(+74.4)#5 | 18.1%(+67.7)#694 |
| 6. | 56666 | 85.4% | 11.3%(+74.1)#6 | 18.1%(+67.4)#697 |
| 7. | 56591 | 84.3% | 11.3%(+73.0)#7 | 18.1%(+66.2)#726 |
| 8. | 56257 | 82.4% | 11.3%(+71.0)#8 | 18.1%(+64.3)#762 |
| 9. | 56566 | 74.5% | 11.3%(+63.2)#9 | 18.1%(+56.5)#984 |
| 10. | 56590 | 73.7% | 11.3%(+62.4)#10 | 18.1%(+55.6)#1,023 |
| 11. | 55753 | 73.6% | 11.3%(+62.2)#11 | 18.1%(+55.5)#1,026 |
| 12. | 56565 | 72.7% | 11.3%(+61.4)#12 | 18.1%(+54.7)#1,058 |
| 13. | 56568 | 66.7% | 11.3%(+55.3)#13 | 18.1%(+48.6)#1,315 |
| 14. | 55772 | 66.7% | 11.3%(+55.3)#14 | 18.1%(+48.6)#1,316 |
| 15. | 56585 | 64.9% | 11.3%(+53.5)#15 | 18.1%(+46.8)#1,392 |
| 16. | 55612 | 61.1% | 11.3%(+49.8)#16 | 18.1%(+43.0)#1,621 |
| 17. | 56672 | 60.0% | 11.3%(+48.7)#17 | 18.1%(+41.9)#1,675 |
| 18. | 55716 | 59.3% | 11.3%(+47.9)#18 | 18.1%(+41.2)#1,750 |
| 19. | 56484 | 58.1% | 11.3%(+46.8)#19 | 18.1%(+40.1)#1,817 |
| 20. | 55734 | 56.8% | 11.3%(+45.5)#20 | 18.1%(+38.8)#1,923 |
| 21. | 55959 | 55.7% | 11.3%(+44.4)#21 | 18.1%(+37.6)#2,011 |
| 22. | 56219 | 52.8% | 11.3%(+41.5)#22 | 18.1%(+34.7)#2,267 |
| 23. | 56035 | 52.2% | 11.3%(+40.8)#23 | 18.1%(+34.1)#2,330 |
| 24. | 56650 | 50.9% | 11.3%(+39.6)#24 | 18.1%(+32.9)#2,433 |
| 25. | 56729 | 50.0% | 11.3%(+38.7)#25 | 18.1%(+31.9)#2,612 |
| 26. | 55793 | 47.8% | 11.3%(+36.5)#26 | 18.1%(+29.8)#2,832 |
| 27. | 55764 | 47.8% | 11.3%(+36.5)#27 | 18.1%(+29.8)#2,833 |
| 28. | 56081 | 47.7% | 11.3%(+36.3)#28 | 18.1%(+29.6)#2,851 |
| 29. | 55454 | 47.2% | 11.3%(+35.9)#29 | 18.1%(+29.1)#2,897 |
| 30. | 55805 | 47.1% | 11.3%(+35.7)#30 | 18.1%(+29.0)#2,913 |
| 31. | 55782 | 46.7% | 11.3%(+35.3)#31 | 18.1%(+28.6)#2,966 |
| 32. | 56122 | 45.8% | 11.3%(+34.5)#32 | 18.1%(+27.8)#3,079 |
| 33. | 55404 | 44.4% | 11.3%(+33.1)#33 | 18.1%(+26.3)#3,284 |
| 34. | 56023 | 43.8% | 11.3%(+32.4)#34 | 18.1%(+25.7)#3,379 |
| 35. | 56441 | 43.0% | 11.3%(+31.7)#35 | 18.1%(+25.0)#3,472 |
| 36. | 56316 | 42.9% | 11.3%(+31.5)#36 | 18.1%(+24.8)#3,504 |
| 37. | 56639 | 42.9% | 11.3%(+31.5)#37 | 18.1%(+24.8)#3,514 |
| 38. | 55798 | 41.9% | 11.3%(+30.6)#38 | 18.1%(+23.9)#3,671 |
| 39. | 56756 | 41.3% | 11.3%(+30.0)#39 | 18.1%(+23.2)#3,782 |
| 40. | 56027 | 41.3% | 11.3%(+30.0)#40 | 18.1%(+23.2)#3,783 |
| 41. | 56374 | 41.1% | 11.3%(+29.7)#41 | 18.1%(+23.0)#3,820 |
| 42. | 55723 | 40.7% | 11.3%(+29.4)#42 | 18.1%(+22.6)#3,893 |
| 43. | 55806 | 40.2% | 11.3%(+28.8)#43 | 18.1%(+22.1)#3,984 |
| 44. | 56763 | 40.2% | 11.3%(+28.8)#44 | 18.1%(+22.1)#3,986 |
| 45. | 56633 | 40.0% | 11.3%(+28.7)#45 | 18.1%(+22.0)#3,999 |
| 46. | 56032 | 40.0% | 11.3%(+28.7)#46 | 18.1%(+21.9)#4,029 |
| 47. | 56688 | 40.0% | 11.3%(+28.7)#47 | 18.1%(+21.9)#4,040 |
| 48. | 55979 | 38.9% | 11.3%(+27.6)#48 | 18.1%(+20.9)#4,222 |
| 49. | 56201 | 38.6% | 11.3%(+27.3)#49 | 18.1%(+20.5)#4,289 |
| 50. | 55792 | 38.5% | 11.3%(+27.2)#50 | 18.1%(+20.5)#4,297 |
| 51. | 56160 | 38.2% | 11.3%(+26.9)#51 | 18.1%(+20.2)#4,361 |
| 52. | 56143 | 37.9% | 11.3%(+26.6)#52 | 18.1%(+19.9)#4,420 |
| 53. | 55411 | 37.4% | 11.3%(+26.1)#53 | 18.1%(+19.3)#4,516 |
| 54. | 56569 | 37.1% | 11.3%(+25.8)#54 | 18.1%(+19.1)#4,571 |
| 55. | 56139 | 37.0% | 11.3%(+25.7)#55 | 18.1%(+19.0)#4,590 |
| 56. | 55768 | 36.5% | 11.3%(+25.2)#56 | 18.1%(+18.4)#4,701 |
| 57. | 56029 | 36.4% | 11.3%(+25.0)#57 | 18.1%(+18.3)#4,735 |
| 58. | 56301 | 36.3% | 11.3%(+24.9)#58 | 18.1%(+18.2)#4,767 |
| 59. | 56630 | 35.8% | 11.3%(+24.4)#59 | 18.1%(+17.7)#4,873 |
| 60. | 56386 | 35.7% | 11.3%(+24.4)#60 | 18.1%(+17.7)#4,890 |
| 61. | 56543 | 35.7% | 11.3%(+24.4)#61 | 18.1%(+17.7)#4,898 |
| 62. | 55333 | 35.3% | 11.3%(+24.0)#62 | 18.1%(+17.2)#5,007 |
| 63. | 56252 | 35.2% | 11.3%(+23.9)#63 | 18.1%(+17.1)#5,022 |
| 64. | 56157 | 35.1% | 11.3%(+23.8)#64 | 18.1%(+17.1)#5,037 |
| 65. | 56228 | 34.8% | 11.3%(+23.4)#65 | 18.1%(+16.7)#5,118 |
| 66. | 56651 | 34.8% | 11.3%(+23.4)#66 | 18.1%(+16.7)#5,120 |
| 67. | 56440 | 34.4% | 11.3%(+23.1)#67 | 18.1%(+16.4)#5,201 |
| 68. | 55130 | 34.0% | 11.3%(+22.6)#68 | 18.1%(+15.9)#5,299 |
| 69. | 56387 | 33.8% | 11.3%(+22.5)#69 | 18.1%(+15.8)#5,329 |
| 70. | 55310 | 33.8% | 11.3%(+22.4)#70 | 18.1%(+15.7)#5,354 |
| 71. | 55790 | 33.3% | 11.3%(+22.0)#71 | 18.1%(+15.3)#5,450 |
| 72. | 56285 | 33.3% | 11.3%(+22.0)#72 | 18.1%(+15.3)#5,470 |
| 73. | 56578 | 33.3% | 11.3%(+22.0)#73 | 18.1%(+15.3)#5,484 |
| 74. | 55702 | 33.3% | 11.3%(+22.0)#74 | 18.1%(+15.3)#5,504 |
| 75. | 56255 | 33.3% | 11.3%(+22.0)#75 | 18.1%(+15.3)#5,510 |
| 76. | 56574 | 33.3% | 11.3%(+22.0)#76 | 18.1%(+15.3)#5,521 |
| 77. | 55780 | 33.3% | 11.3%(+22.0)#77 | 18.1%(+15.3)#5,523 |
| 78. | 56020 | 33.3% | 11.3%(+22.0)#78 | 18.1%(+15.3)#5,533 |
| 79. | 55117 | 32.8% | 11.3%(+21.4)#79 | 18.1%(+14.7)#5,648 |
| 80. | 56435 | 32.6% | 11.3%(+21.3)#80 | 18.1%(+14.5)#5,694 |
| 81. | 56271 | 32.4% | 11.3%(+21.0)#81 | 18.1%(+14.3)#5,754 |
| 82. | 55103 | 32.3% | 11.3%(+21.0)#82 | 18.1%(+14.2)#5,764 |
| 83. | 55072 | 32.2% | 11.3%(+20.8)#83 | 18.1%(+14.1)#5,806 |
| 84. | 55384 | 31.8% | 11.3%(+20.5)#84 | 18.1%(+13.8)#5,879 |
| 85. | 56376 | 31.6% | 11.3%(+20.2)#85 | 18.1%(+13.5)#5,939 |
| 86. | 55922 | 31.0% | 11.3%(+19.6)#86 | 18.1%(+12.9)#6,102 |
| 87. | 55066 | 30.9% | 11.3%(+19.6)#87 | 18.1%(+12.9)#6,110 |
| 88. | 55102 | 30.4% | 11.3%(+19.1)#88 | 18.1%(+12.3)#6,245 |
| 89. | 55719 | 30.0% | 11.3%(+18.7)#89 | 18.1%(+11.9)#6,342 |
| 90. | 56225 | 29.8% | 11.3%(+18.5)#90 | 18.1%(+11.7)#6,411 |
| 91. | 56518 | 29.7% | 11.3%(+18.4)#91 | 18.1%(+11.7)#6,441 |
| 92. | 56033 | 29.6% | 11.3%(+18.3)#92 | 18.1%(+11.6)#6,473 |
| 93. | 55021 | 29.4% | 11.3%(+18.1)#93 | 18.1%(+11.3)#6,537 |
| 94. | 55954 | 29.3% | 11.3%(+17.9)#94 | 18.1%(+11.2)#6,581 |
| 95. | 55354 | 29.1% | 11.3%(+17.7)#95 | 18.1%(+11.0)#6,628 |
| 96. | 55106 | 29.0% | 11.3%(+17.6)#96 | 18.1%(+10.9)#6,663 |
| 97. | 56277 | 28.9% | 11.3%(+17.6)#97 | 18.1%(+10.9)#6,666 |
| 98. | 56164 | 28.9% | 11.3%(+17.6)#98 | 18.1%(+10.8)#6,683 |
| 99. | 56636 | 28.5% | 11.3%(+17.1)#99 | 18.1%(+10.4)#6,834 |
| 100. | 55413 | 27.4% | 11.3%(+16.1)#100 | 18.1%(+9.33)#7,167 |
Common Questions
What are the Top 10 Zip Codes with the Highest Poverty Level Among Children Under the Age of 5 in Minnesota?
Top 10 Zip Codes with the Highest Poverty Level Among Children Under the Age of 5 in Minnesota are:
What zip code has the Highest Poverty Level Among Children Under the Age of 5 in Minnesota?
56669 has the Highest Poverty Level Among Children Under the Age of 5 in Minnesota with 100.0%.
What is the Poverty Level Among Children Under the Age of 5 in the State of Minnesota?
Poverty Level Among Children Under the Age of 5 in Minnesota is 11.3%.
What is the Poverty Level Among Children Under the Age of 5 in the United States?
Poverty Level Among Children Under the Age of 5 in the United States is 18.1%.