Homestead, IA Map & Demographics
Homestead Map
Homestead Overview
$24,420
PER CAPITA INCOME
$83,500
AVG FAMILY INCOME
$69,167
AVG HOUSEHOLD INCOME
0.24
INEQUALITY / GINI INDEX
126
TOTAL POPULATION
49
MALE POPULATION
77
FEMALE POPULATION
63.64
MALES / 100 FEMALES
157.14
FEMALES / 100 MALES
35.3
MEDIAN AGE
3.5
AVG FAMILY SIZE
2.5
AVG HOUSEHOLD SIZE
28
LABOR FORCE [ PEOPLE ]
36.8%
PERCENT IN LABOR FORCE
Homestead Zip Codes
Homestead Area Codes
Income in Homestead
Income Overview in Homestead
Per Capita Income in Homestead is $24,420, while median incomes of families and households are $83,500 and $69,167 respectively.
| Characteristic | Number | Measure |
| Per Capita Income | 126 | $24,420 |
| Median Family Income | 30 | $83,500 |
| Mean Family Income | 30 | $80,533 |
| Median Household Income | 50 | $69,167 |
| Mean Household Income | 50 | $62,886 |
| Income Deficit | 30 | $0 |
| Wage / Income Gap (%) | 126 | 0.00% |
| Wage / Income Gap ($) | 126 | 100.00¢ per $1 |
| Gini / Inequality Index | 126 | 0.24 |
Earnings by Sex in Homestead
| Sex | Number | Average Earnings |
| Male | 18 (64.3%) | $0 |
| Female | 10 (35.7%) | $0 |
| Total | 28 (100.0%) | $0 |
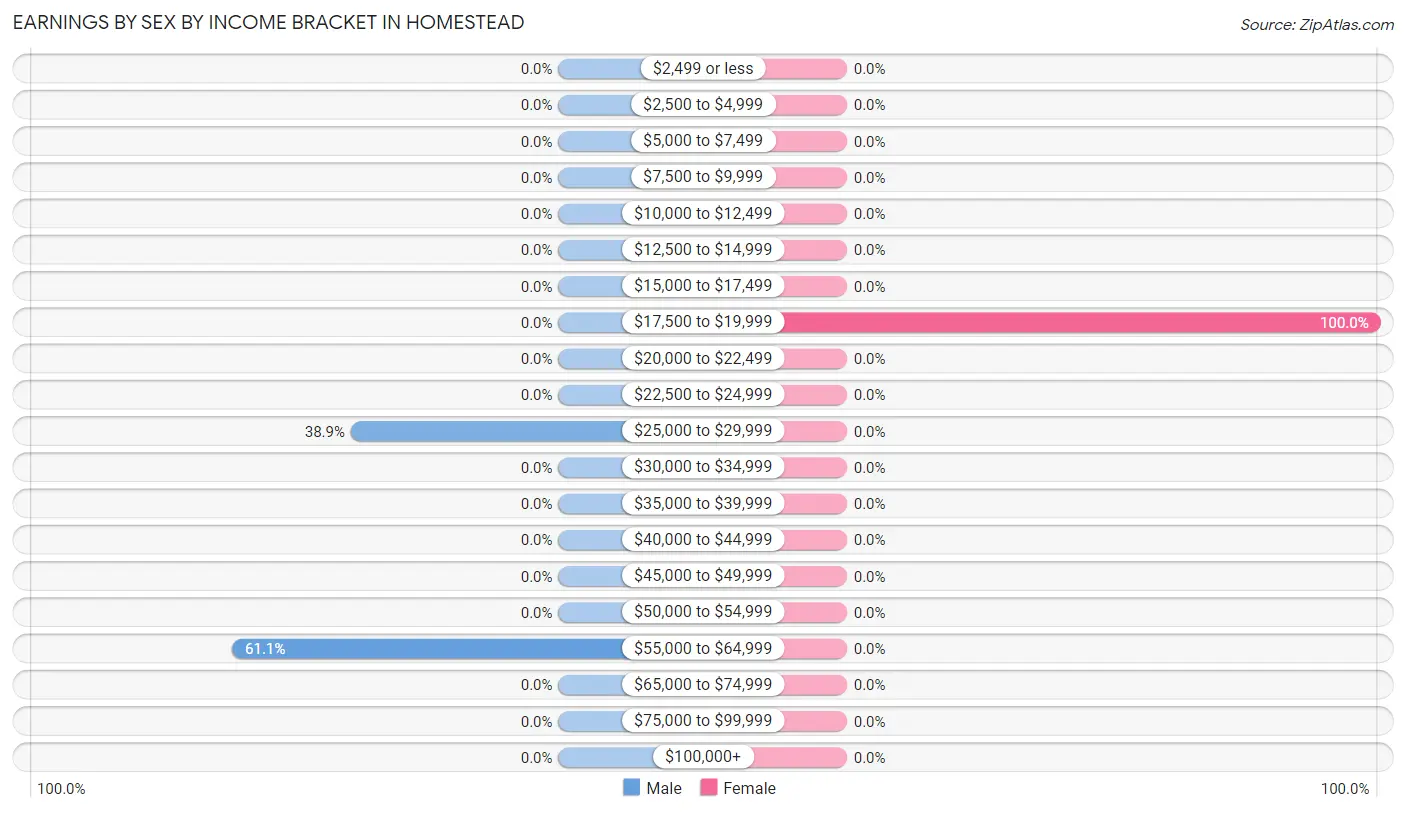
Earnings by Sex by Income Bracket in Homestead
The most common earnings brackets in Homestead are $55,000 to $64,999 for men (11 | 61.1%) and $17,500 to $19,999 for women (10 | 100.0%).
| Income | Male | Female |
| $2,499 or less | 0 (0.0%) | 0 (0.0%) |
| $2,500 to $4,999 | 0 (0.0%) | 0 (0.0%) |
| $5,000 to $7,499 | 0 (0.0%) | 0 (0.0%) |
| $7,500 to $9,999 | 0 (0.0%) | 0 (0.0%) |
| $10,000 to $12,499 | 0 (0.0%) | 0 (0.0%) |
| $12,500 to $14,999 | 0 (0.0%) | 0 (0.0%) |
| $15,000 to $17,499 | 0 (0.0%) | 0 (0.0%) |
| $17,500 to $19,999 | 0 (0.0%) | 10 (100.0%) |
| $20,000 to $22,499 | 0 (0.0%) | 0 (0.0%) |
| $22,500 to $24,999 | 0 (0.0%) | 0 (0.0%) |
| $25,000 to $29,999 | 7 (38.9%) | 0 (0.0%) |
| $30,000 to $34,999 | 0 (0.0%) | 0 (0.0%) |
| $35,000 to $39,999 | 0 (0.0%) | 0 (0.0%) |
| $40,000 to $44,999 | 0 (0.0%) | 0 (0.0%) |
| $45,000 to $49,999 | 0 (0.0%) | 0 (0.0%) |
| $50,000 to $54,999 | 0 (0.0%) | 0 (0.0%) |
| $55,000 to $64,999 | 11 (61.1%) | 0 (0.0%) |
| $65,000 to $74,999 | 0 (0.0%) | 0 (0.0%) |
| $75,000 to $99,999 | 0 (0.0%) | 0 (0.0%) |
| $100,000+ | 0 (0.0%) | 0 (0.0%) |
| Total | 18 (100.0%) | 10 (100.0%) |
Earnings by Sex by Educational Attainment in Homestead
| Educational Attainment | Male Income | Female Income |
| Less than High School | - | - |
| High School Diploma | - | - |
| College or Associate's Degree | - | - |
| Bachelor's Degree | - | - |
| Graduate Degree | - | - |
| Total | - | - |
Family Income in Homestead
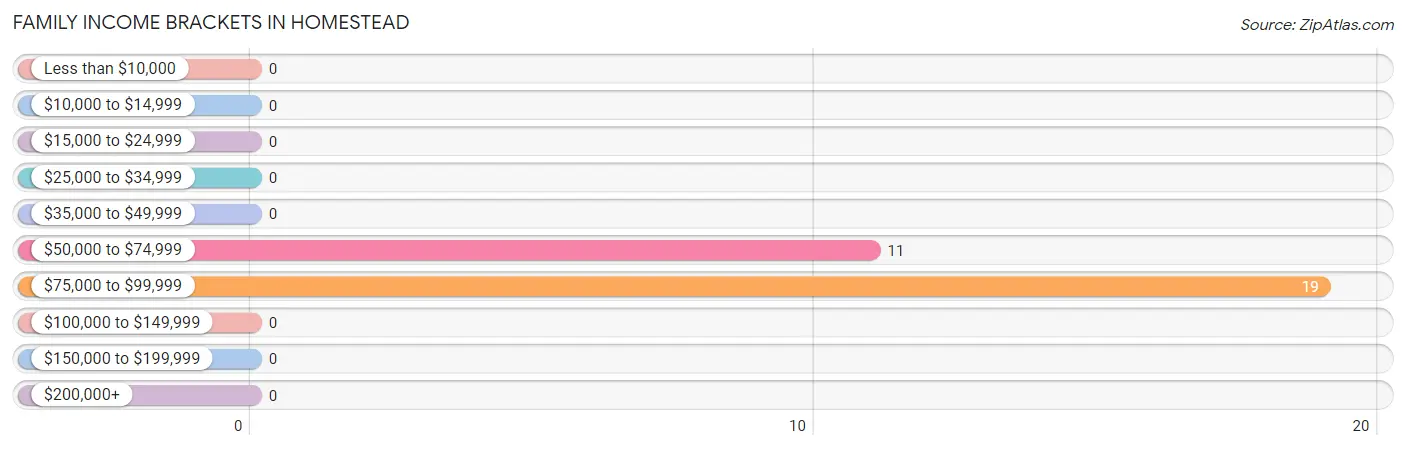
Family Income Brackets in Homestead
According to the Homestead family income data, there are 19 families falling into the $75,000 to $99,999 income range, which is the most common income bracket and makes up 63.3% of all families.
| Income Bracket | # Families | % Families |
| Less than $10,000 | 0 | 0.0% |
| $10,000 to $14,999 | 0 | 0.0% |
| $15,000 to $24,999 | 0 | 0.0% |
| $25,000 to $34,999 | 0 | 0.0% |
| $35,000 to $49,999 | 0 | 0.0% |
| $50,000 to $74,999 | 11 | 36.7% |
| $75,000 to $99,999 | 19 | 63.3% |
| $100,000 to $149,999 | 0 | 0.0% |
| $150,000 to $199,999 | 0 | 0.0% |
| $200,000+ | 0 | 0.0% |
Family Income by Famaliy Size in Homestead
| Income Bracket | # Families | Median Income |
| 2-Person Families | 9 (30.0%) | $0 |
| 3-Person Families | 11 (36.7%) | $0 |
| 4-Person Families | 0 (0.0%) | $0 |
| 5-Person Families | 0 (0.0%) | $0 |
| 6-Person Families | 10 (33.3%) | $0 |
| 7+ Person Families | 0 (0.0%) | $0 |
| Total | 30 (100.0%) | $83,500 |
Family Income by Number of Earners in Homestead
| Number of Earners | # Families | Median Income |
| No Earners | 20 (66.7%) | $0 |
| 1 Earner | 0 (0.0%) | $0 |
| 2 Earners | 10 (33.3%) | $0 |
| 3+ Earners | 0 (0.0%) | $0 |
| Total | 30 (100.0%) | $83,500 |
Household Income in Homestead
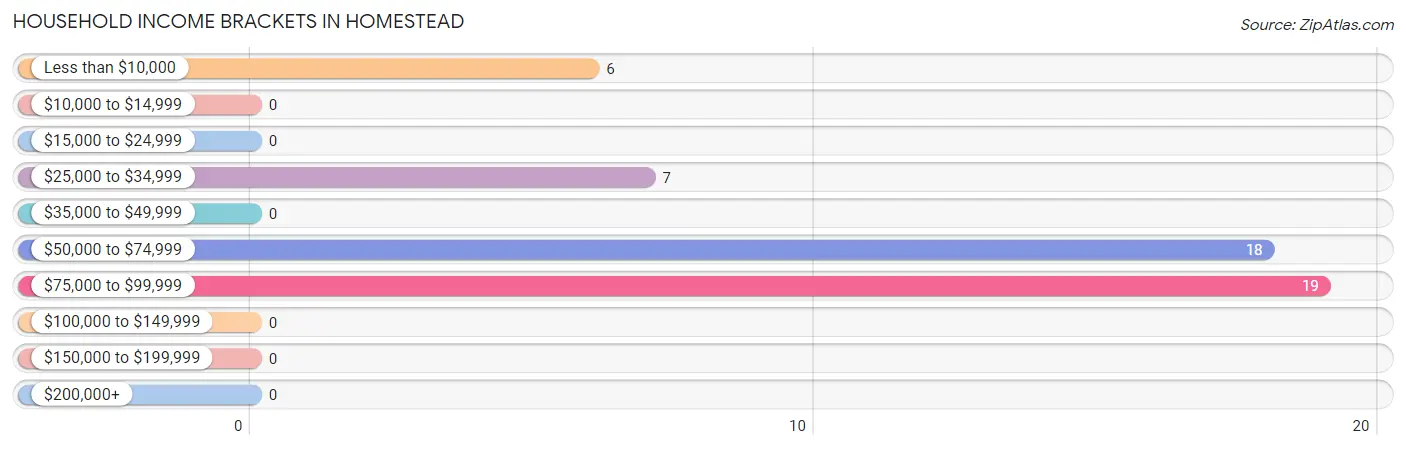
Household Income Brackets in Homestead
With 19 households falling in the category, the $75,000 to $99,999 income range is the most frequent in Homestead, accounting for 38.0% of all households.
| Income Bracket | # Households | % Households |
| Less than $10,000 | 6 | 12.0% |
| $10,000 to $14,999 | 0 | 0.0% |
| $15,000 to $24,999 | 0 | 0.0% |
| $25,000 to $34,999 | 7 | 14.0% |
| $35,000 to $49,999 | 0 | 0.0% |
| $50,000 to $74,999 | 18 | 36.0% |
| $75,000 to $99,999 | 19 | 38.0% |
| $100,000 to $149,999 | 0 | 0.0% |
| $150,000 to $199,999 | 0 | 0.0% |
| $200,000+ | 0 | 0.0% |
Household Income by Householder Age in Homestead
The median household income in Homestead is $69,167, with the highest median household income of $68,958 found in the 65+ years age bracket for the primary householder. A total of 33 households (66.0%) fall into this category.
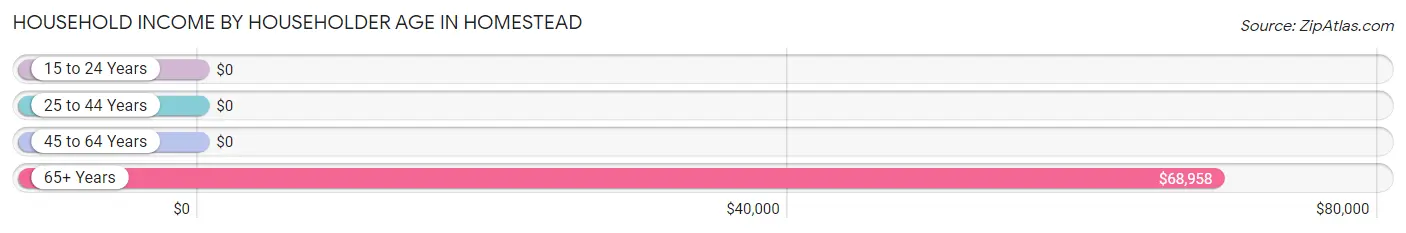
| Income Bracket | # Households | Median Income |
| 15 to 24 Years | 0 (0.0%) | $0 |
| 25 to 44 Years | 10 (20.0%) | $0 |
| 45 to 64 Years | 7 (14.0%) | $0 |
| 65+ Years | 33 (66.0%) | $68,958 |
| Total | 50 (100.0%) | $69,167 |
Poverty in Homestead
Income Below Poverty by Sex and Age in Homestead
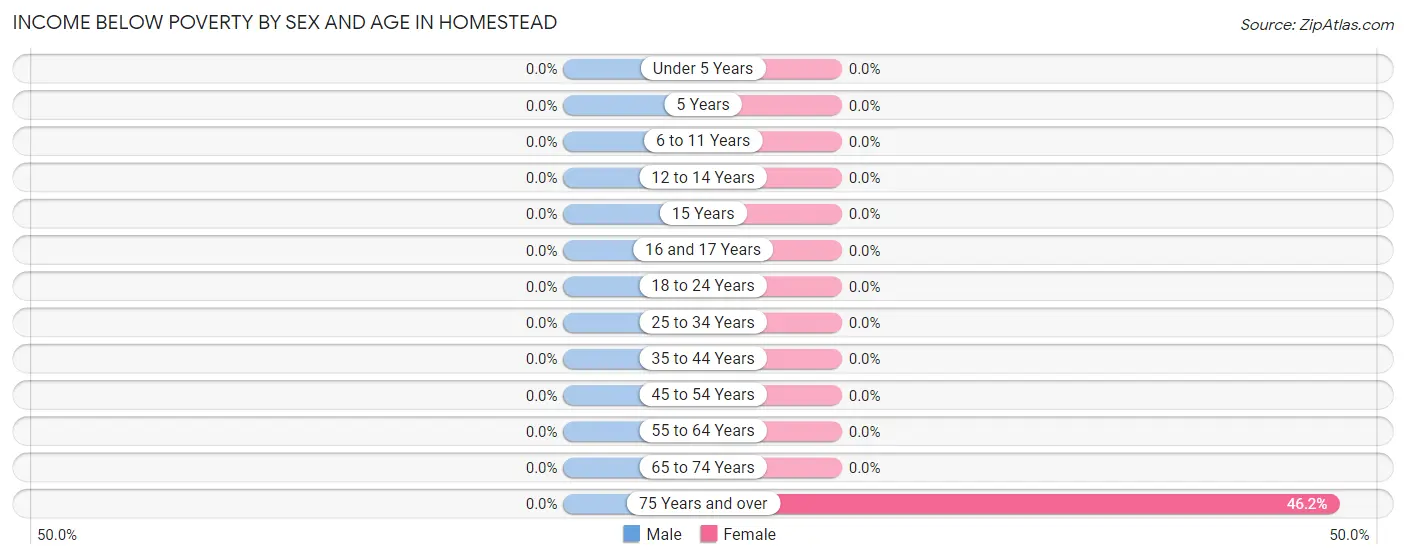
| Age Bracket | Male | Female |
| Under 5 Years | 0 (0.0%) | 0 (0.0%) |
| 5 Years | 0 (0.0%) | 0 (0.0%) |
| 6 to 11 Years | 0 (0.0%) | 0 (0.0%) |
| 12 to 14 Years | 0 (0.0%) | 0 (0.0%) |
| 15 Years | 0 (0.0%) | 0 (0.0%) |
| 16 and 17 Years | 0 (0.0%) | 0 (0.0%) |
| 18 to 24 Years | 0 (0.0%) | 0 (0.0%) |
| 25 to 34 Years | 0 (0.0%) | 0 (0.0%) |
| 35 to 44 Years | 0 (0.0%) | 0 (0.0%) |
| 45 to 54 Years | 0 (0.0%) | 0 (0.0%) |
| 55 to 64 Years | 0 (0.0%) | 0 (0.0%) |
| 65 to 74 Years | 0 (0.0%) | 0 (0.0%) |
| 75 Years and over | 0 (0.0%) | 6 (46.2%) |
| Total | 0 (0.0%) | 6 (7.8%) |
Income Above Poverty by Sex and Age in Homestead
According to the poverty statistics in Homestead, males aged 6 to 11 years and females aged under 5 years are the age groups that are most secure financially, with 100.0% of males and 100.0% of females in these age groups living above the poverty line.
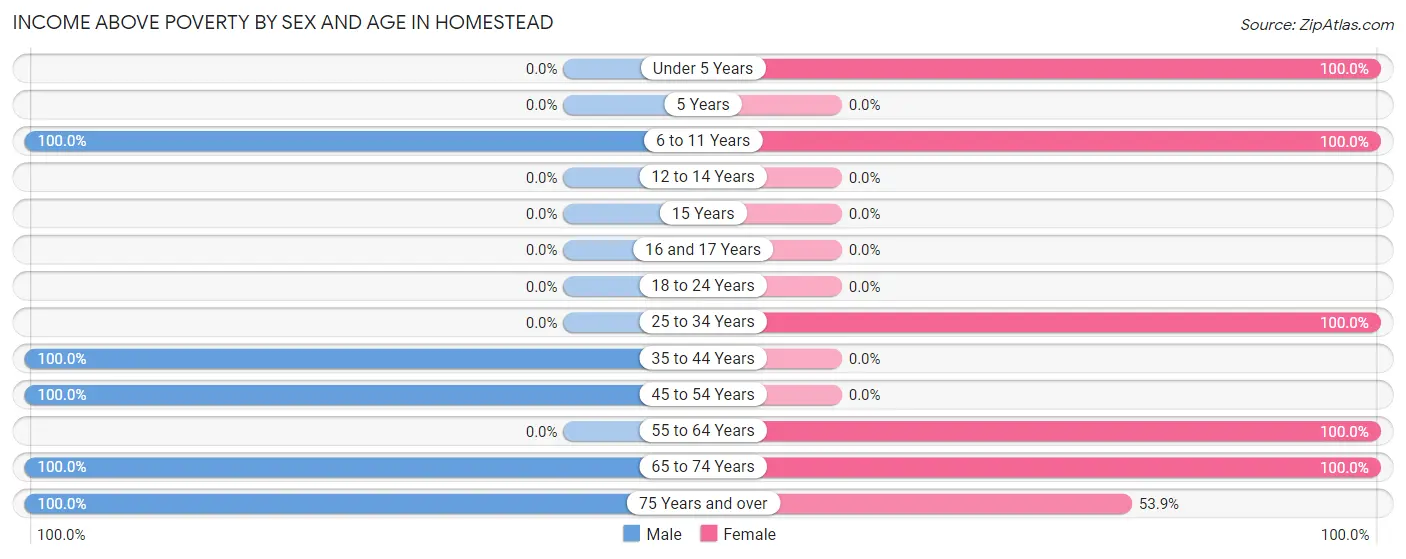
| Age Bracket | Male | Female |
| Under 5 Years | 0 (0.0%) | 23 (100.0%) |
| 5 Years | 0 (0.0%) | 0 (0.0%) |
| 6 to 11 Years | 11 (100.0%) | 16 (100.0%) |
| 12 to 14 Years | 0 (0.0%) | 0 (0.0%) |
| 15 Years | 0 (0.0%) | 0 (0.0%) |
| 16 and 17 Years | 0 (0.0%) | 0 (0.0%) |
| 18 to 24 Years | 0 (0.0%) | 0 (0.0%) |
| 25 to 34 Years | 0 (0.0%) | 10 (100.0%) |
| 35 to 44 Years | 11 (100.0%) | 0 (0.0%) |
| 45 to 54 Years | 7 (100.0%) | 0 (0.0%) |
| 55 to 64 Years | 0 (0.0%) | 8 (100.0%) |
| 65 to 74 Years | 11 (100.0%) | 7 (100.0%) |
| 75 Years and over | 9 (100.0%) | 7 (53.8%) |
| Total | 49 (100.0%) | 71 (92.2%) |
Income Below Poverty Among Married-Couple Families in Homestead
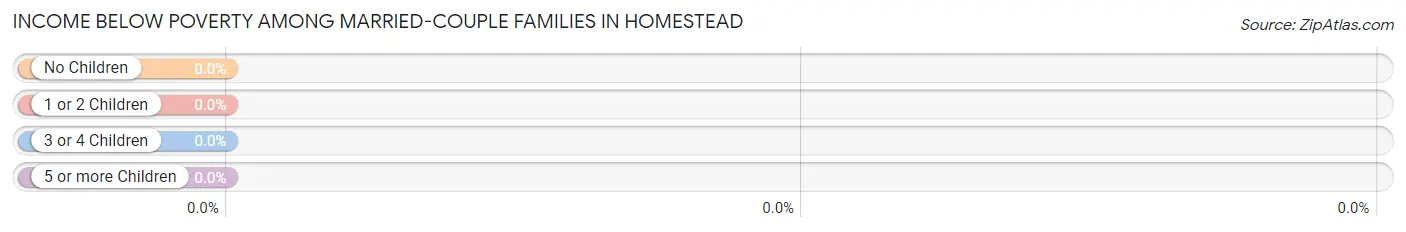
| Children | Above Poverty | Below Poverty |
| No Children | 9 (100.0%) | 0 (0.0%) |
| 1 or 2 Children | 11 (100.0%) | 0 (0.0%) |
| 3 or 4 Children | 10 (100.0%) | 0 (0.0%) |
| 5 or more Children | 0 (0.0%) | 0 (0.0%) |
| Total | 30 (100.0%) | 0 (0.0%) |
Income Below Poverty Among Single-Parent Households in Homestead
| Children | Single Father | Single Mother |
| No Children | 0 (0.0%) | 0 (0.0%) |
| 1 or 2 Children | 0 (0.0%) | 0 (0.0%) |
| 3 or 4 Children | 0 (0.0%) | 0 (0.0%) |
| 5 or more Children | 0 (0.0%) | 0 (0.0%) |
| Total | 0 (0.0%) | 0 (0.0%) |
Income Below Poverty Among Married-Couple vs Single-Parent Households in Homestead
| Children | Married-Couple Families | Single-Parent Households |
| No Children | 0 (0.0%) | 0 (0.0%) |
| 1 or 2 Children | 0 (0.0%) | 0 (0.0%) |
| 3 or 4 Children | 0 (0.0%) | 0 (0.0%) |
| 5 or more Children | 0 (0.0%) | 0 (0.0%) |
| Total | 0 (0.0%) | 0 (0.0%) |
Race in Homestead
The most populous races in Homestead are , and White / Caucasian (126 | 100.0%).
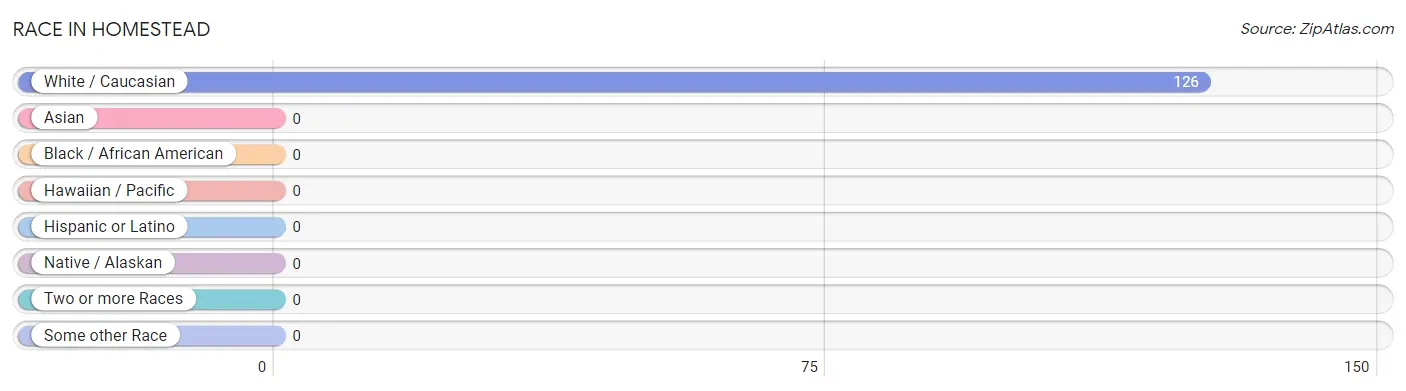
| Race | # Population | % Population |
| Asian | 0 | 0.0% |
| Black / African American | 0 | 0.0% |
| Hawaiian / Pacific | 0 | 0.0% |
| Hispanic or Latino | 0 | 0.0% |
| Native / Alaskan | 0 | 0.0% |
| White / Caucasian | 126 | 100.0% |
| Two or more Races | 0 | 0.0% |
| Some other Race | 0 | 0.0% |
| Total | 126 | 100.0% |
Ancestry in Homestead
The most populous ancestries reported in Homestead are German (79 | 62.7%), Irish (75 | 59.5%), Danish (23 | 18.2%), English (22 | 17.5%), and Swiss (11 | 8.7%), together accounting for 166.7% of all Homestead residents.
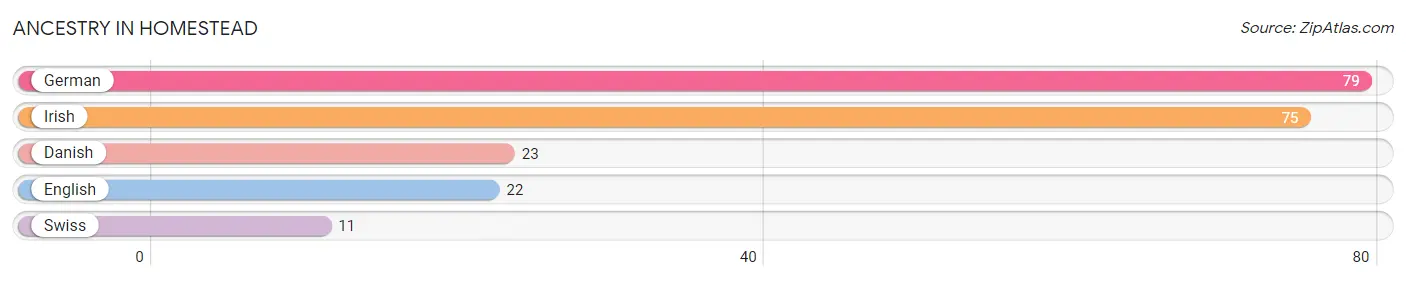
| Ancestry | # Population | % Population |
| Danish | 23 | 18.2% |
| English | 22 | 17.5% |
| German | 79 | 62.7% |
| Irish | 75 | 59.5% |
| Swiss | 11 | 8.7% | View All 5 Rows |
Immigrants in Homestead

| Immigration Origin | # Population | % Population | View All 0 Rows |
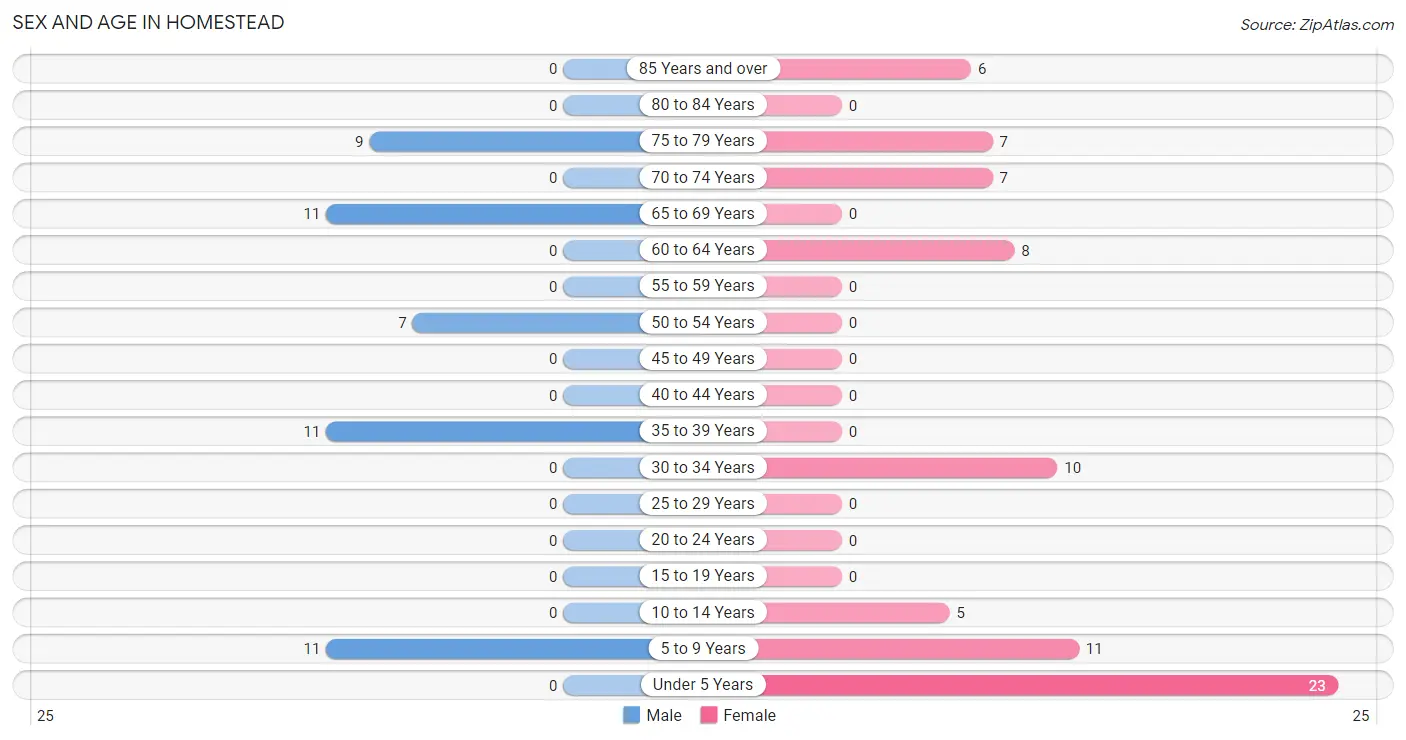
Sex and Age in Homestead
Sex and Age in Homestead
The most populous age groups in Homestead are 5 to 9 Years (11 | 22.5%) for men and Under 5 Years (23 | 29.9%) for women.
| Age Bracket | Male | Female |
| Under 5 Years | 0 (0.0%) | 23 (29.9%) |
| 5 to 9 Years | 11 (22.5%) | 11 (14.3%) |
| 10 to 14 Years | 0 (0.0%) | 5 (6.5%) |
| 15 to 19 Years | 0 (0.0%) | 0 (0.0%) |
| 20 to 24 Years | 0 (0.0%) | 0 (0.0%) |
| 25 to 29 Years | 0 (0.0%) | 0 (0.0%) |
| 30 to 34 Years | 0 (0.0%) | 10 (13.0%) |
| 35 to 39 Years | 11 (22.5%) | 0 (0.0%) |
| 40 to 44 Years | 0 (0.0%) | 0 (0.0%) |
| 45 to 49 Years | 0 (0.0%) | 0 (0.0%) |
| 50 to 54 Years | 7 (14.3%) | 0 (0.0%) |
| 55 to 59 Years | 0 (0.0%) | 0 (0.0%) |
| 60 to 64 Years | 0 (0.0%) | 8 (10.4%) |
| 65 to 69 Years | 11 (22.5%) | 0 (0.0%) |
| 70 to 74 Years | 0 (0.0%) | 7 (9.1%) |
| 75 to 79 Years | 9 (18.4%) | 7 (9.1%) |
| 80 to 84 Years | 0 (0.0%) | 0 (0.0%) |
| 85 Years and over | 0 (0.0%) | 6 (7.8%) |
| Total | 49 (100.0%) | 77 (100.0%) |
Families and Households in Homestead
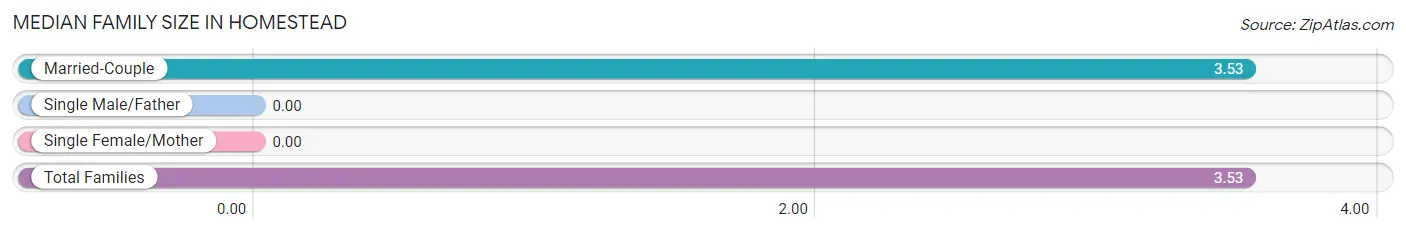
Median Family Size in Homestead
| Family Type | # Families | Family Size |
| Married-Couple | 30 (100.0%) | 3.53 |
| Single Male/Father | 0 (0.0%) | - |
| Single Female/Mother | 0 (0.0%) | - |
| Total Families | 30 (100.0%) | 3.53 |
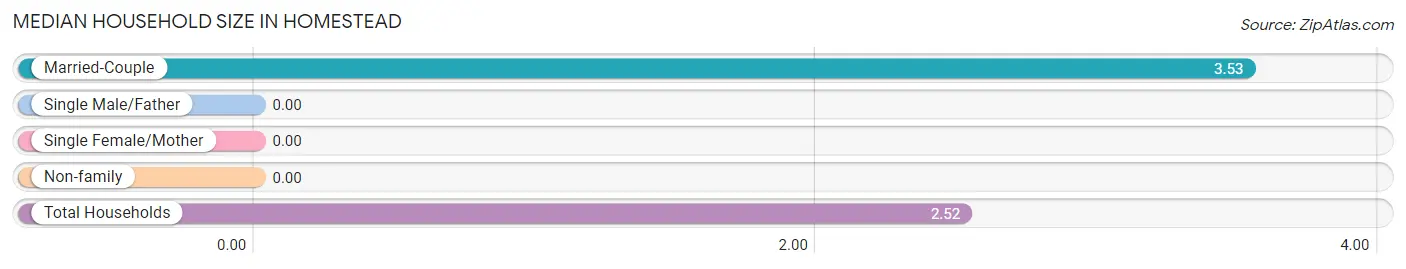
Median Household Size in Homestead
| Household Type | # Households | Household Size |
| Married-Couple | 30 (60.0%) | 3.53 |
| Single Male/Father | 0 (0.0%) | - |
| Single Female/Mother | 0 (0.0%) | - |
| Non-family | 20 (40.0%) | - |
| Total Households | 50 (100.0%) | 2.52 |
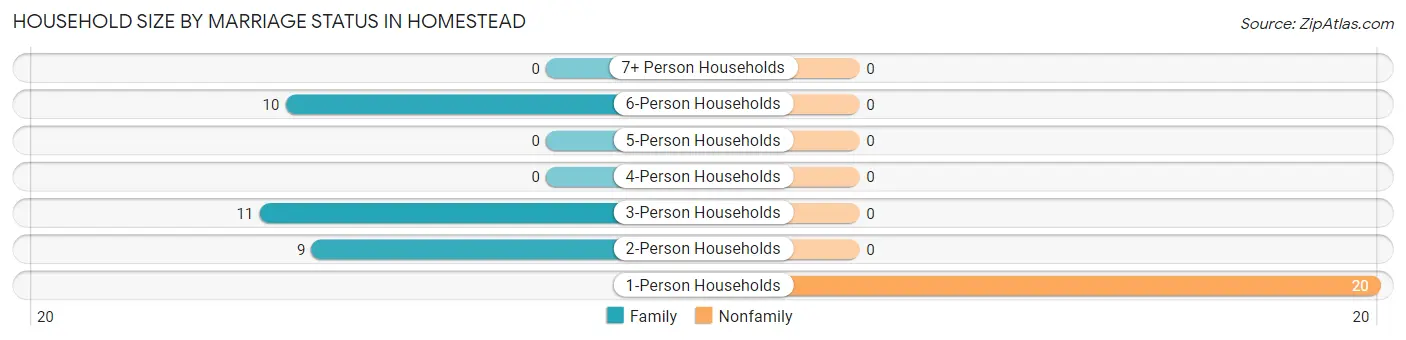
Household Size by Marriage Status in Homestead
Out of a total of 50 households in Homestead, 30 (60.0%) are family households, while 20 (40.0%) are nonfamily households. The most numerous type of family households are 3-person households, comprising 11, and the most common type of nonfamily households are 1-person households, comprising 20.
| Household Size | Family Households | Nonfamily Households |
| 1-Person Households | - | 20 (40.0%) |
| 2-Person Households | 9 (18.0%) | 0 (0.0%) |
| 3-Person Households | 11 (22.0%) | 0 (0.0%) |
| 4-Person Households | 0 (0.0%) | 0 (0.0%) |
| 5-Person Households | 0 (0.0%) | 0 (0.0%) |
| 6-Person Households | 10 (20.0%) | 0 (0.0%) |
| 7+ Person Households | 0 (0.0%) | 0 (0.0%) |
| Total | 30 (60.0%) | 20 (40.0%) |
Female Fertility in Homestead
Fertility by Age in Homestead
| Age Bracket | Women with Births | Births / 1,000 Women |
| 15 to 19 years | 0 (0.0%) | 0.0 |
| 20 to 34 years | 0 (0.0%) | 0.0 |
| 35 to 50 years | 0 (0.0%) | 0.0 |
| Total | 0 (0.0%) | 0.0 |
Fertility by Age by Marriage Status in Homestead
| Age Bracket | Married | Unmarried |
| 15 to 19 years | 0 (0.0%) | 0 (0.0%) |
| 20 to 34 years | 0 (0.0%) | 0 (0.0%) |
| 35 to 50 years | 0 (0.0%) | 0 (0.0%) |
| Total | 0 (0.0%) | 0 (0.0%) |
Fertility by Education in Homestead
| Educational Attainment | Women with Births | Births / 1,000 Women |
| Less than High School | 0 (0.0%) | 0.0 |
| High School Diploma | 0 (0.0%) | 0.0 |
| College or Associate's Degree | 0 (0.0%) | 0.0 |
| Bachelor's Degree | 0 (0.0%) | 0.0 |
| Graduate Degree | 0 (0.0%) | 0.0 |
| Total | 0 (0.0%) | 0.0 |
Fertility by Education by Marriage Status in Homestead
| Educational Attainment | Married | Unmarried |
| Less than High School | 0 (0.0%) | 0 (0.0%) |
| High School Diploma | 0 (0.0%) | 0 (0.0%) |
| College or Associate's Degree | 0 (0.0%) | 0 (0.0%) |
| Bachelor's Degree | 0 (0.0%) | 0 (0.0%) |
| Graduate Degree | 0 (0.0%) | 0 (0.0%) |
| Total | 0 (0.0%) | 0 (0.0%) |
Employment Characteristics in Homestead
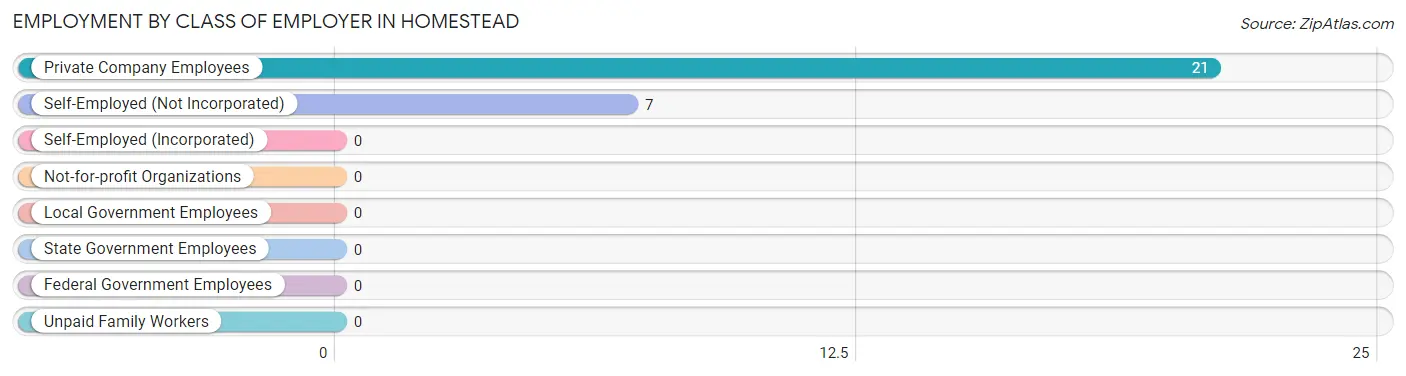
Employment by Class of Employer in Homestead
Among the 28 employed individuals in Homestead, private company employees (21 | 75.0%), and self-employed (not incorporated) (7 | 25.0%) make up the most common classes of employment.
| Employer Class | # Employees | % Employees |
| Private Company Employees | 21 | 75.0% |
| Self-Employed (Incorporated) | 0 | 0.0% |
| Self-Employed (Not Incorporated) | 7 | 25.0% |
| Not-for-profit Organizations | 0 | 0.0% |
| Local Government Employees | 0 | 0.0% |
| State Government Employees | 0 | 0.0% |
| Federal Government Employees | 0 | 0.0% |
| Unpaid Family Workers | 0 | 0.0% |
| Total | 28 | 100.0% |
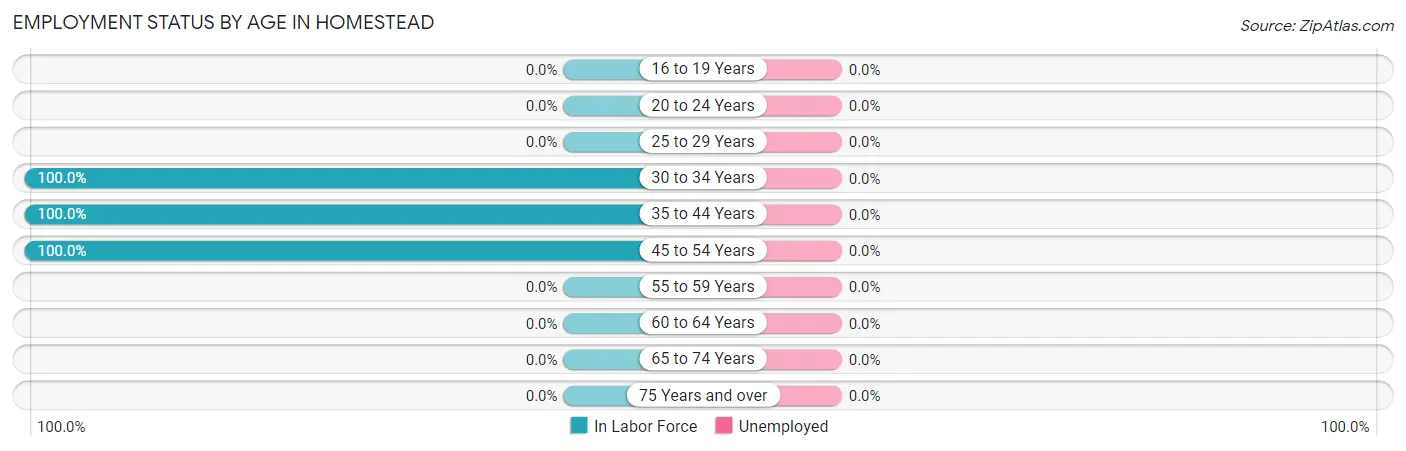
Employment Status by Age in Homestead
| Age Bracket | In Labor Force | Unemployed |
| 16 to 19 Years | 0 (0.0%) | 0 (0.0%) |
| 20 to 24 Years | 0 (0.0%) | 0 (0.0%) |
| 25 to 29 Years | 0 (0.0%) | 0 (0.0%) |
| 30 to 34 Years | 10 (100.0%) | 0 (0.0%) |
| 35 to 44 Years | 11 (100.0%) | 0 (0.0%) |
| 45 to 54 Years | 7 (100.0%) | 0 (0.0%) |
| 55 to 59 Years | 0 (0.0%) | 0 (0.0%) |
| 60 to 64 Years | 0 (0.0%) | 0 (0.0%) |
| 65 to 74 Years | 0 (0.0%) | 0 (0.0%) |
| 75 Years and over | 0 (0.0%) | 0 (0.0%) |
| Total | 28 (36.8%) | 0 (0.0%) |
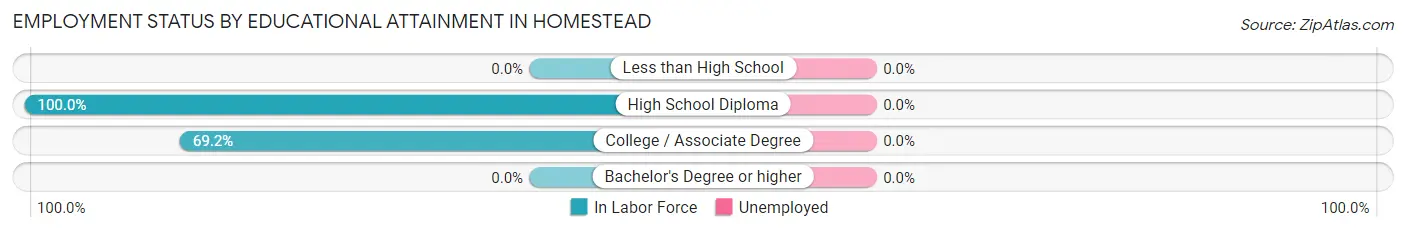
Employment Status by Educational Attainment in Homestead
| Educational Attainment | In Labor Force | Unemployed |
| Less than High School | 0 (0.0%) | 0 (0.0%) |
| High School Diploma | 10 (100.0%) | 0 (0.0%) |
| College / Associate Degree | 18 (69.2%) | 0 (0.0%) |
| Bachelor's Degree or higher | 0 (0.0%) | 0 (0.0%) |
| Total | 28 (77.8%) | 0 (0.0%) |
Employment Occupations by Sex in Homestead
Management, Business, Science and Arts Occupations
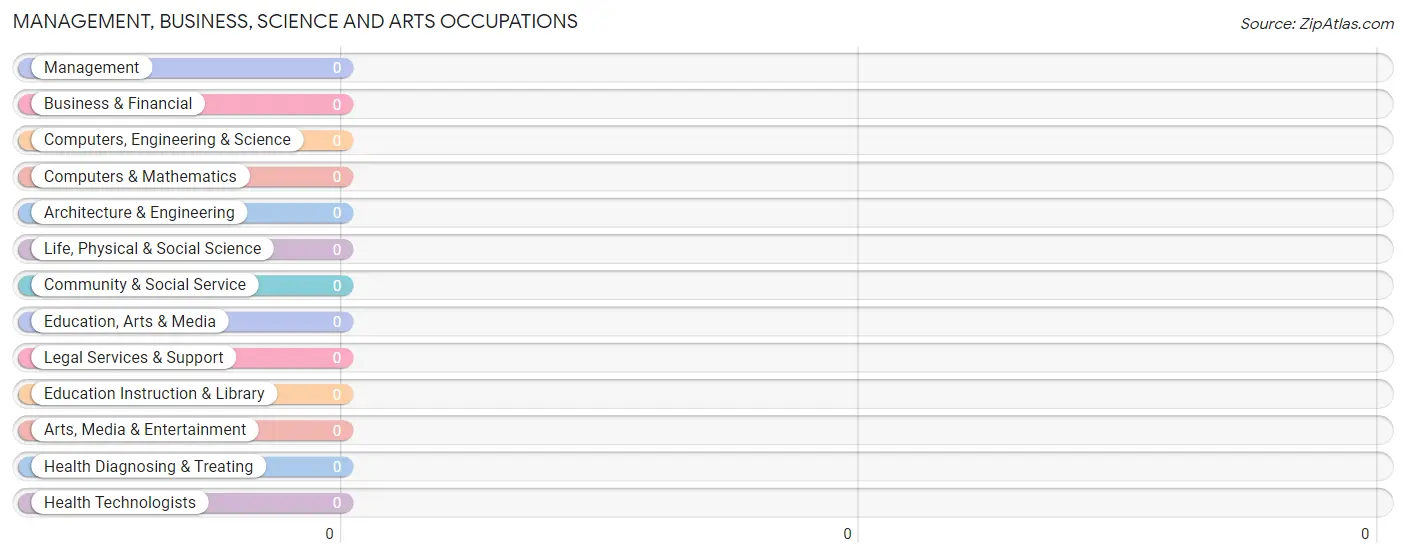
Management, Business, Science and Arts Occupations by Sex
| Occupation | Male | Female |
| Management | 0 (0.0%) | 0 (0.0%) |
| Business & Financial | 0 (0.0%) | 0 (0.0%) |
| Computers, Engineering & Science | 0 (0.0%) | 0 (0.0%) |
| Computers & Mathematics | 0 (0.0%) | 0 (0.0%) |
| Architecture & Engineering | 0 (0.0%) | 0 (0.0%) |
| Life, Physical & Social Science | 0 (0.0%) | 0 (0.0%) |
| Community & Social Service | 0 (0.0%) | 0 (0.0%) |
| Education, Arts & Media | 0 (0.0%) | 0 (0.0%) |
| Legal Services & Support | 0 (0.0%) | 0 (0.0%) |
| Education Instruction & Library | 0 (0.0%) | 0 (0.0%) |
| Arts, Media & Entertainment | 0 (0.0%) | 0 (0.0%) |
| Health Diagnosing & Treating | 0 (0.0%) | 0 (0.0%) |
| Health Technologists | 0 (0.0%) | 0 (0.0%) |
| Total (Category) | 0 (0.0%) | 0 (0.0%) |
| Total (Overall) | 18 (64.3%) | 10 (35.7%) |
Services Occupations
Services Occupations by Sex
| Occupation | Male | Female |
| Healthcare Support | 0 (0.0%) | 0 (0.0%) |
| Security & Protection | 0 (0.0%) | 0 (0.0%) |
| Firefighting & Prevention | 0 (0.0%) | 0 (0.0%) |
| Law Enforcement | 0 (0.0%) | 0 (0.0%) |
| Food Preparation & Serving | 0 (0.0%) | 0 (0.0%) |
| Cleaning & Maintenance | 0 (0.0%) | 0 (0.0%) |
| Personal Care & Service | 0 (0.0%) | 0 (0.0%) |
| Total (Category) | 0 (0.0%) | 0 (0.0%) |
| Total (Overall) | 18 (64.3%) | 10 (35.7%) |
Sales and Office Occupations
The most common Sales and Office occupations in Homestead are , and Office & Administration (10 | 35.7%).
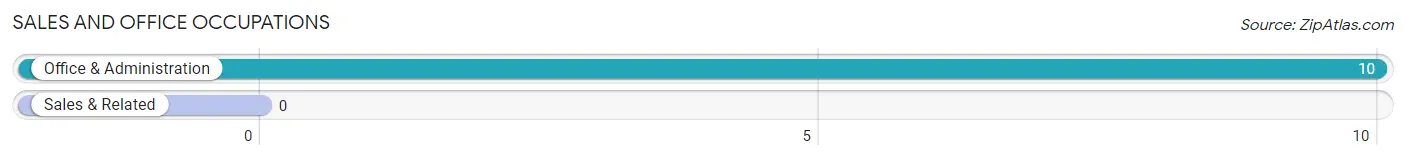
Sales and Office Occupations by Sex
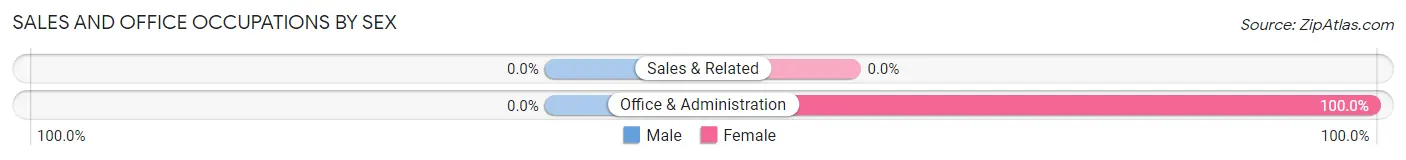
| Occupation | Male | Female |
| Sales & Related | 0 (0.0%) | 0 (0.0%) |
| Office & Administration | 0 (0.0%) | 10 (100.0%) |
| Total (Category) | 0 (0.0%) | 10 (100.0%) |
| Total (Overall) | 18 (64.3%) | 10 (35.7%) |
Natural Resources, Construction and Maintenance Occupations
The most common Natural Resources, Construction and Maintenance occupations in Homestead are Installation, Maintenance & Repair (11 | 39.3%), and Construction & Extraction (7 | 25.0%).
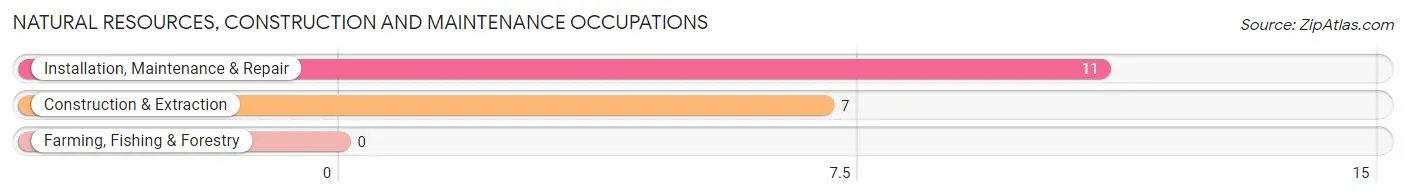
Natural Resources, Construction and Maintenance Occupations by Sex
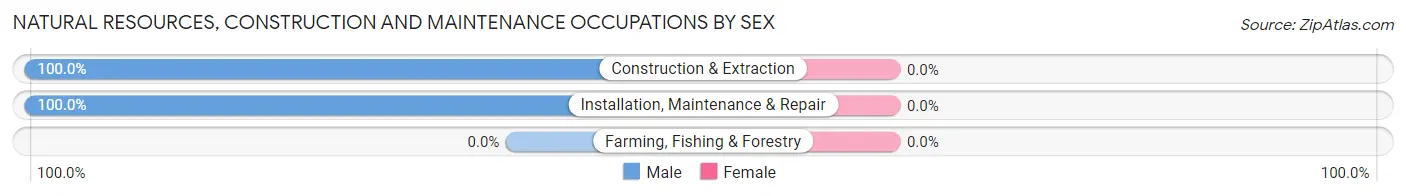
| Occupation | Male | Female |
| Farming, Fishing & Forestry | 0 (0.0%) | 0 (0.0%) |
| Construction & Extraction | 7 (100.0%) | 0 (0.0%) |
| Installation, Maintenance & Repair | 11 (100.0%) | 0 (0.0%) |
| Total (Category) | 18 (100.0%) | 0 (0.0%) |
| Total (Overall) | 18 (64.3%) | 10 (35.7%) |
Production, Transportation and Moving Occupations
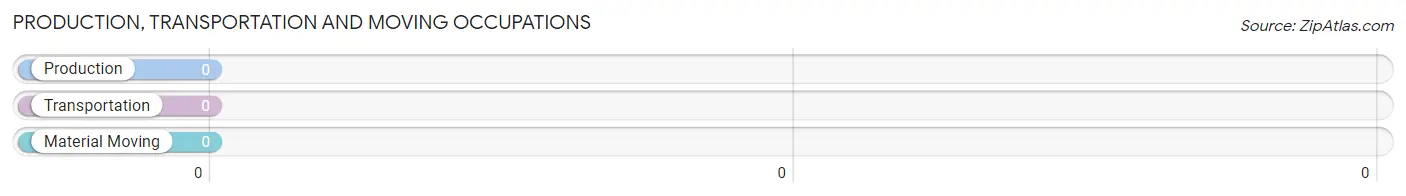
Production, Transportation and Moving Occupations by Sex
| Occupation | Male | Female |
| Production | 0 (0.0%) | 0 (0.0%) |
| Transportation | 0 (0.0%) | 0 (0.0%) |
| Material Moving | 0 (0.0%) | 0 (0.0%) |
| Total (Category) | 0 (0.0%) | 0 (0.0%) |
| Total (Overall) | 18 (64.3%) | 10 (35.7%) |
Employment Industries by Sex in Homestead
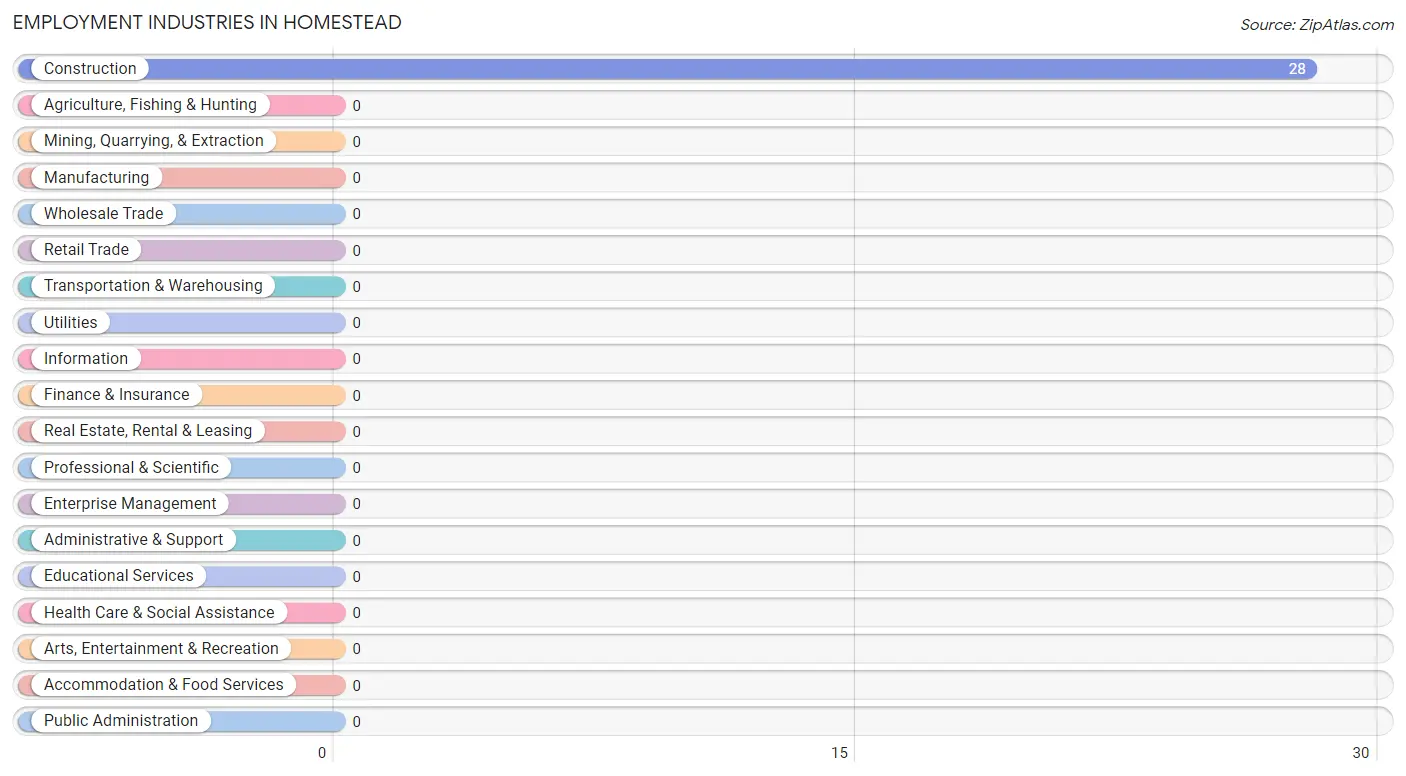
Employment Industries in Homestead
The major employment industries in Homestead include , and Construction (28 | 100.0%).
Employment Industries by Sex in Homestead
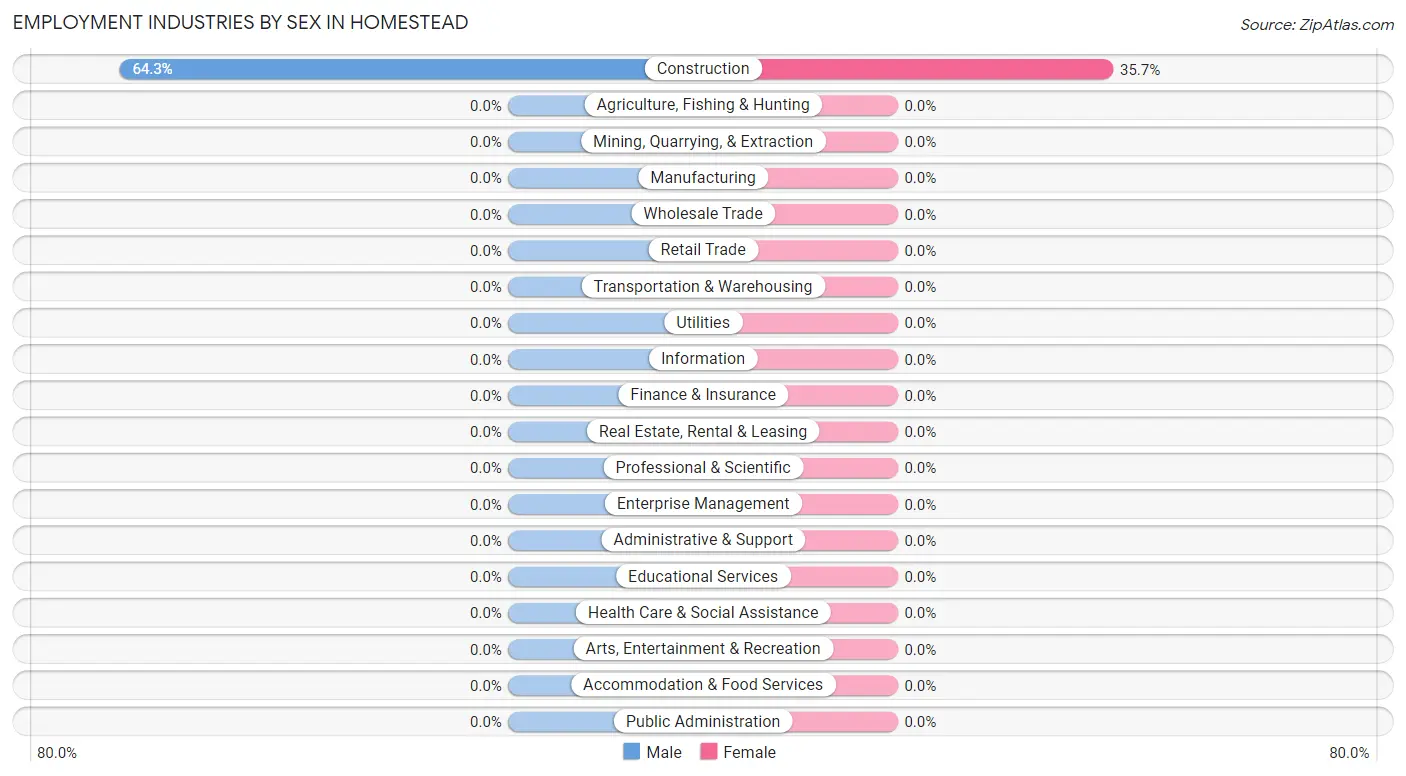
| Industry | Male | Female |
| Agriculture, Fishing & Hunting | 0 (0.0%) | 0 (0.0%) |
| Mining, Quarrying, & Extraction | 0 (0.0%) | 0 (0.0%) |
| Construction | 18 (64.3%) | 10 (35.7%) |
| Manufacturing | 0 (0.0%) | 0 (0.0%) |
| Wholesale Trade | 0 (0.0%) | 0 (0.0%) |
| Retail Trade | 0 (0.0%) | 0 (0.0%) |
| Transportation & Warehousing | 0 (0.0%) | 0 (0.0%) |
| Utilities | 0 (0.0%) | 0 (0.0%) |
| Information | 0 (0.0%) | 0 (0.0%) |
| Finance & Insurance | 0 (0.0%) | 0 (0.0%) |
| Real Estate, Rental & Leasing | 0 (0.0%) | 0 (0.0%) |
| Professional & Scientific | 0 (0.0%) | 0 (0.0%) |
| Enterprise Management | 0 (0.0%) | 0 (0.0%) |
| Administrative & Support | 0 (0.0%) | 0 (0.0%) |
| Educational Services | 0 (0.0%) | 0 (0.0%) |
| Health Care & Social Assistance | 0 (0.0%) | 0 (0.0%) |
| Arts, Entertainment & Recreation | 0 (0.0%) | 0 (0.0%) |
| Accommodation & Food Services | 0 (0.0%) | 0 (0.0%) |
| Public Administration | 0 (0.0%) | 0 (0.0%) |
| Total | 18 (64.3%) | 10 (35.7%) |
Education in Homestead
School Enrollment in Homestead
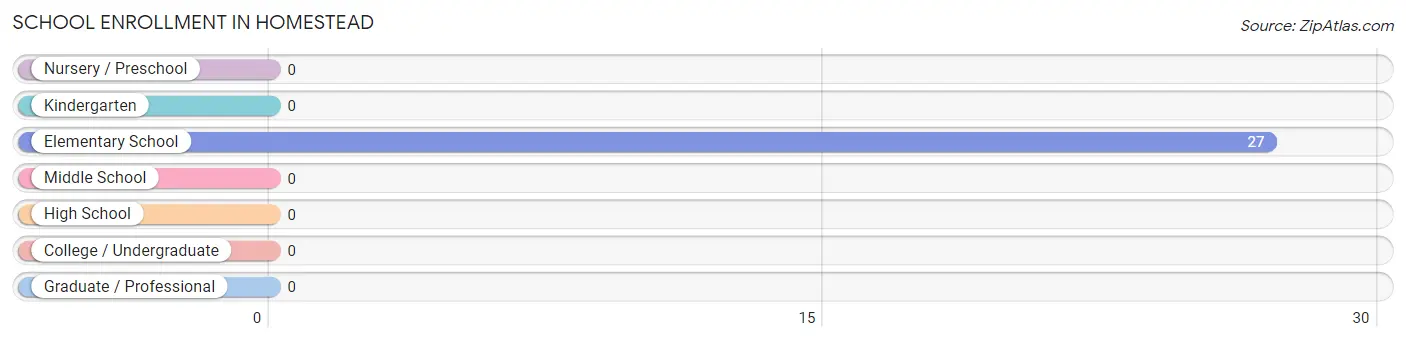
| School Level | # Students | % Students |
| Nursery / Preschool | 0 | 0.0% |
| Kindergarten | 0 | 0.0% |
| Elementary School | 27 | 100.0% |
| Middle School | 0 | 0.0% |
| High School | 0 | 0.0% |
| College / Undergraduate | 0 | 0.0% |
| Graduate / Professional | 0 | 0.0% |
| Total | 27 | 100.0% |
School Enrollment by Age by Funding Source in Homestead
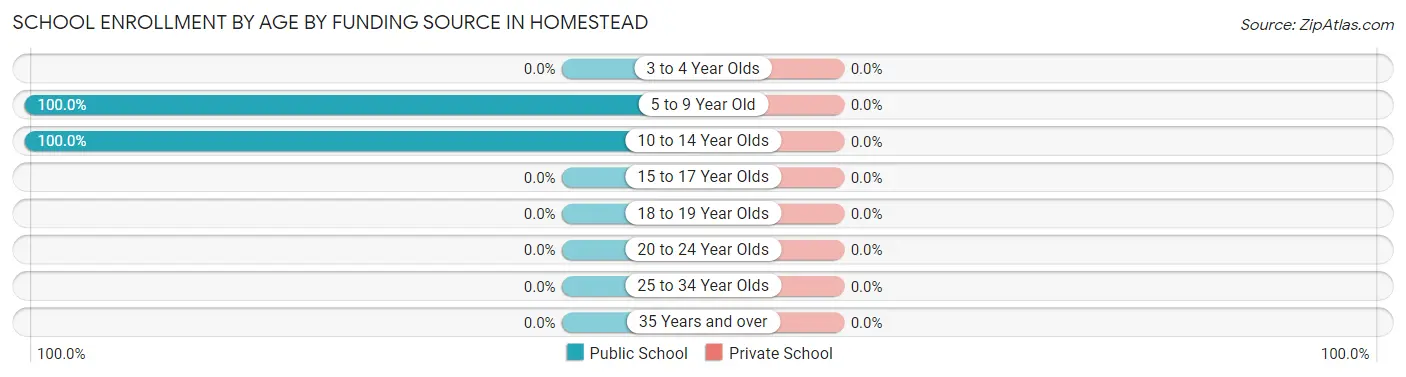
| Age Bracket | Public School | Private School |
| 3 to 4 Year Olds | 0 (0.0%) | 0 (0.0%) |
| 5 to 9 Year Old | 22 (100.0%) | 0 (0.0%) |
| 10 to 14 Year Olds | 5 (100.0%) | 0 (0.0%) |
| 15 to 17 Year Olds | 0 (0.0%) | 0 (0.0%) |
| 18 to 19 Year Olds | 0 (0.0%) | 0 (0.0%) |
| 20 to 24 Year Olds | 0 (0.0%) | 0 (0.0%) |
| 25 to 34 Year Olds | 0 (0.0%) | 0 (0.0%) |
| 35 Years and over | 0 (0.0%) | 0 (0.0%) |
| Total | 27 (100.0%) | 0 (0.0%) |
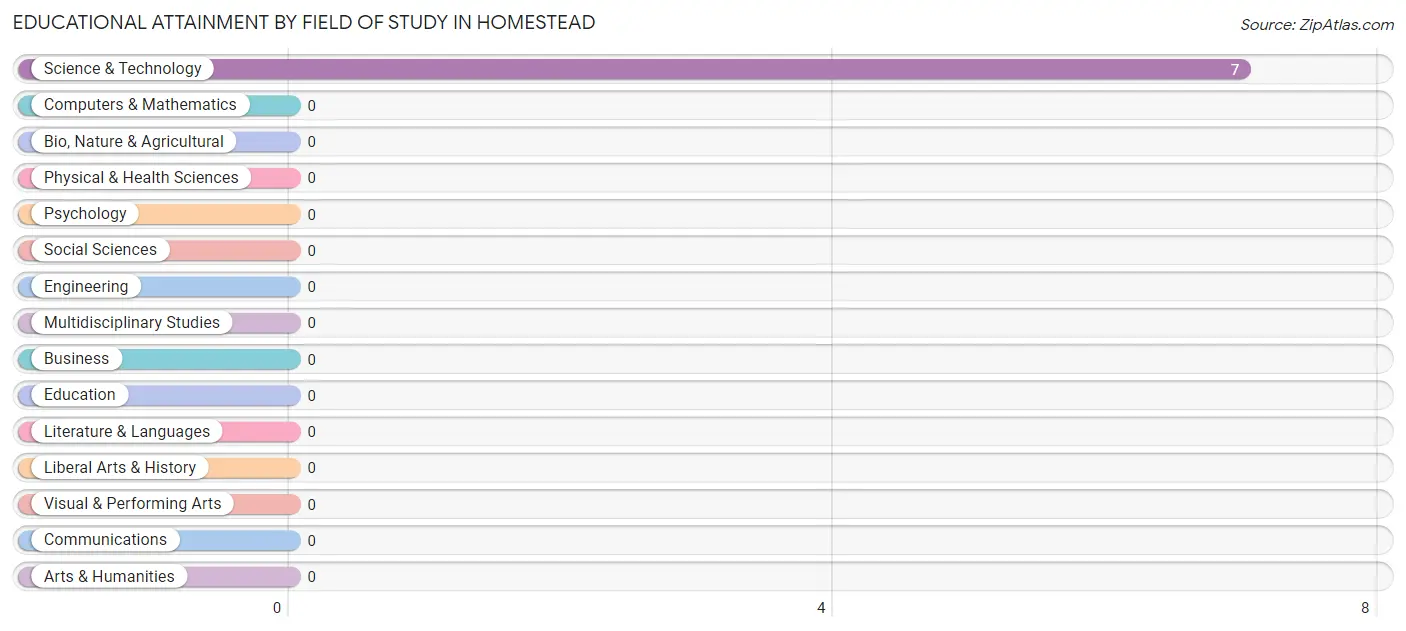
Educational Attainment by Field of Study in Homestead
, and science & technology (7 | 100.0%) are the most common fields of study among 7 individuals in Homestead who have obtained a bachelor's degree or higher.
| Field of Study | # Graduates | % Graduates |
| Computers & Mathematics | 0 | 0.0% |
| Bio, Nature & Agricultural | 0 | 0.0% |
| Physical & Health Sciences | 0 | 0.0% |
| Psychology | 0 | 0.0% |
| Social Sciences | 0 | 0.0% |
| Engineering | 0 | 0.0% |
| Multidisciplinary Studies | 0 | 0.0% |
| Science & Technology | 7 | 100.0% |
| Business | 0 | 0.0% |
| Education | 0 | 0.0% |
| Literature & Languages | 0 | 0.0% |
| Liberal Arts & History | 0 | 0.0% |
| Visual & Performing Arts | 0 | 0.0% |
| Communications | 0 | 0.0% |
| Arts & Humanities | 0 | 0.0% |
| Total | 7 | 100.0% |
Transportation & Commute in Homestead
Vehicle Availability by Sex in Homestead
The most prevalent vehicle ownership categories in Homestead are males with 2 vehicles (11, accounting for 61.1%) and females with 2 vehicles (10, making up 110.0%).
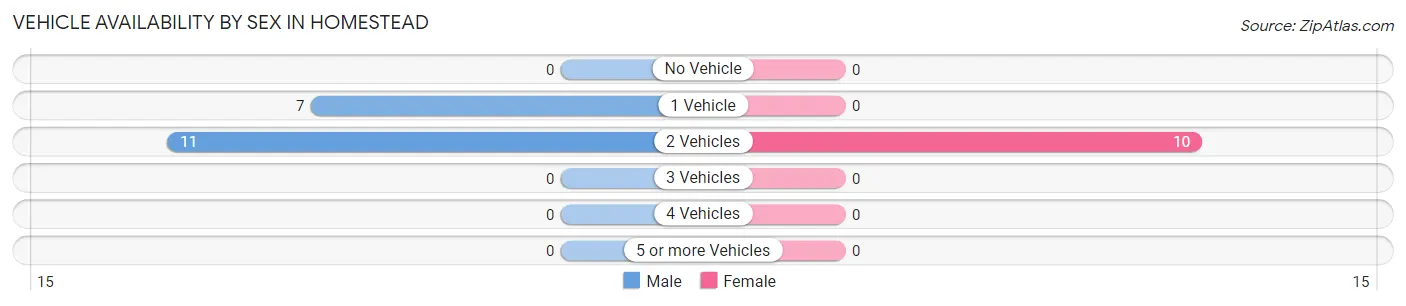
| Vehicles Available | Male | Female |
| No Vehicle | 0 (0.0%) | 0 (0.0%) |
| 1 Vehicle | 7 (38.9%) | 0 (0.0%) |
| 2 Vehicles | 11 (61.1%) | 10 (100.0%) |
| 3 Vehicles | 0 (0.0%) | 0 (0.0%) |
| 4 Vehicles | 0 (0.0%) | 0 (0.0%) |
| 5 or more Vehicles | 0 (0.0%) | 0 (0.0%) |
| Total | 18 (100.0%) | 10 (100.0%) |
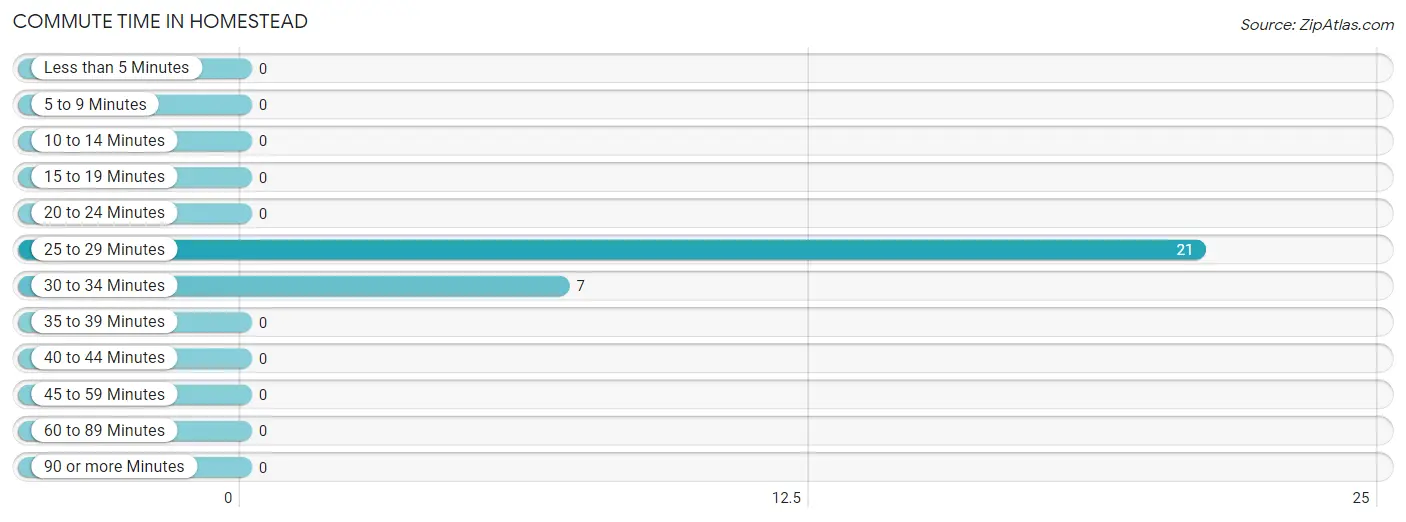
Commute Time in Homestead
The most frequently occuring commute durations in Homestead are 25 to 29 minutes (21 commuters, 75.0%), 30 to 34 minutes (7 commuters, 25.0%), and less than 5 minutes (0 commuters, 0.0%).
| Commute Time | # Commuters | % Commuters |
| Less than 5 Minutes | 0 | 0.0% |
| 5 to 9 Minutes | 0 | 0.0% |
| 10 to 14 Minutes | 0 | 0.0% |
| 15 to 19 Minutes | 0 | 0.0% |
| 20 to 24 Minutes | 0 | 0.0% |
| 25 to 29 Minutes | 21 | 75.0% |
| 30 to 34 Minutes | 7 | 25.0% |
| 35 to 39 Minutes | 0 | 0.0% |
| 40 to 44 Minutes | 0 | 0.0% |
| 45 to 59 Minutes | 0 | 0.0% |
| 60 to 89 Minutes | 0 | 0.0% |
| 90 or more Minutes | 0 | 0.0% |
Commute Time by Sex in Homestead
The most common commute times in Homestead are 25 to 29 minutes (11 commuters, 61.1%) for males and 25 to 29 minutes (10 commuters, 100.0%) for females.
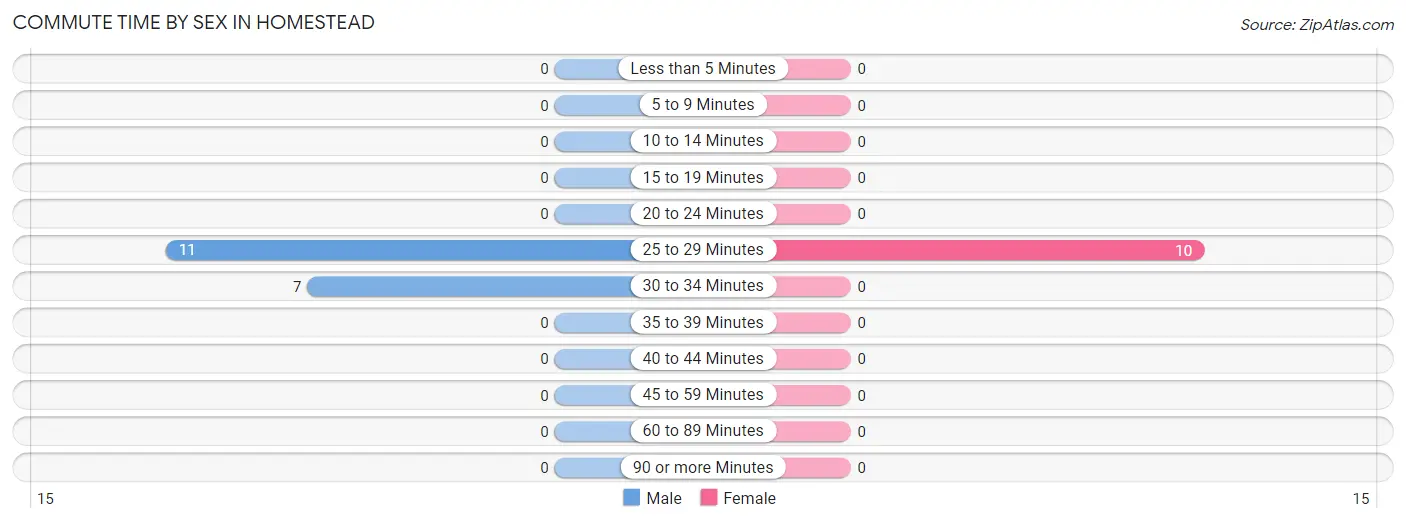
| Commute Time | Male | Female |
| Less than 5 Minutes | 0 (0.0%) | 0 (0.0%) |
| 5 to 9 Minutes | 0 (0.0%) | 0 (0.0%) |
| 10 to 14 Minutes | 0 (0.0%) | 0 (0.0%) |
| 15 to 19 Minutes | 0 (0.0%) | 0 (0.0%) |
| 20 to 24 Minutes | 0 (0.0%) | 0 (0.0%) |
| 25 to 29 Minutes | 11 (61.1%) | 10 (100.0%) |
| 30 to 34 Minutes | 7 (38.9%) | 0 (0.0%) |
| 35 to 39 Minutes | 0 (0.0%) | 0 (0.0%) |
| 40 to 44 Minutes | 0 (0.0%) | 0 (0.0%) |
| 45 to 59 Minutes | 0 (0.0%) | 0 (0.0%) |
| 60 to 89 Minutes | 0 (0.0%) | 0 (0.0%) |
| 90 or more Minutes | 0 (0.0%) | 0 (0.0%) |
Time of Departure to Work by Sex in Homestead
The most frequent times of departure to work in Homestead are 6:30 AM to 6:59 AM (18, 100.0%) for males and 7:30 AM to 7:59 AM (10, 100.0%) for females.
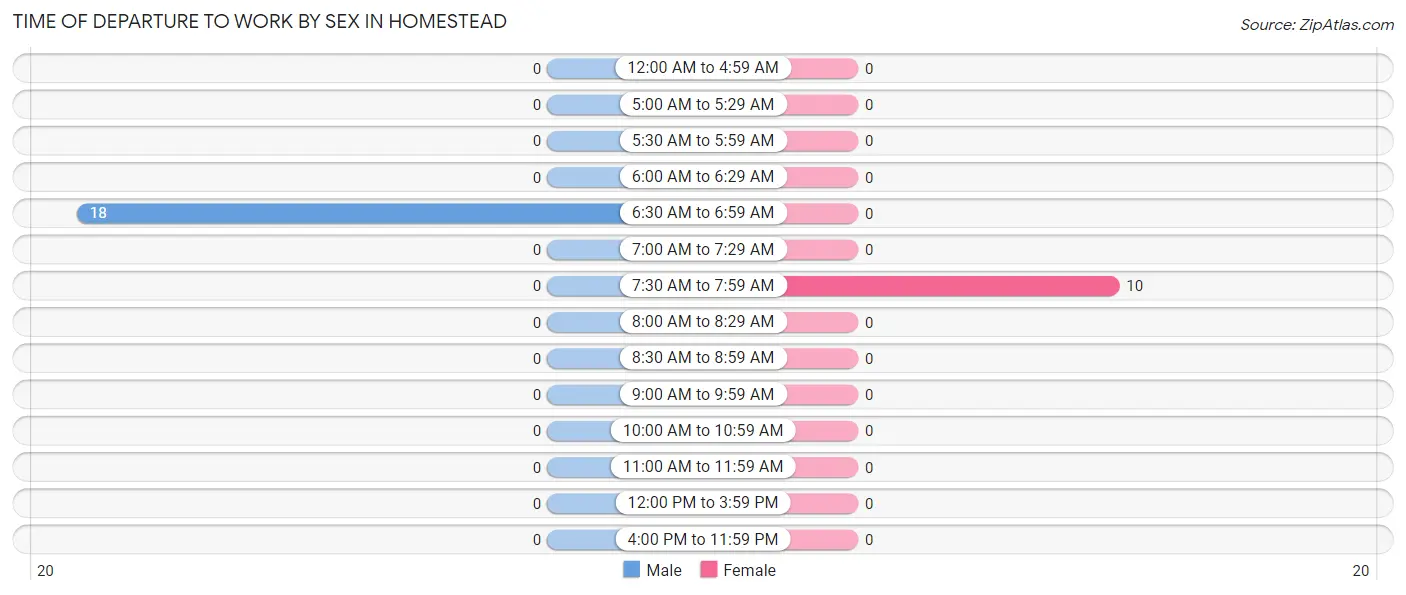
| Time of Departure | Male | Female |
| 12:00 AM to 4:59 AM | 0 (0.0%) | 0 (0.0%) |
| 5:00 AM to 5:29 AM | 0 (0.0%) | 0 (0.0%) |
| 5:30 AM to 5:59 AM | 0 (0.0%) | 0 (0.0%) |
| 6:00 AM to 6:29 AM | 0 (0.0%) | 0 (0.0%) |
| 6:30 AM to 6:59 AM | 18 (100.0%) | 0 (0.0%) |
| 7:00 AM to 7:29 AM | 0 (0.0%) | 0 (0.0%) |
| 7:30 AM to 7:59 AM | 0 (0.0%) | 10 (100.0%) |
| 8:00 AM to 8:29 AM | 0 (0.0%) | 0 (0.0%) |
| 8:30 AM to 8:59 AM | 0 (0.0%) | 0 (0.0%) |
| 9:00 AM to 9:59 AM | 0 (0.0%) | 0 (0.0%) |
| 10:00 AM to 10:59 AM | 0 (0.0%) | 0 (0.0%) |
| 11:00 AM to 11:59 AM | 0 (0.0%) | 0 (0.0%) |
| 12:00 PM to 3:59 PM | 0 (0.0%) | 0 (0.0%) |
| 4:00 PM to 11:59 PM | 0 (0.0%) | 0 (0.0%) |
| Total | 18 (100.0%) | 10 (100.0%) |
Housing Occupancy in Homestead
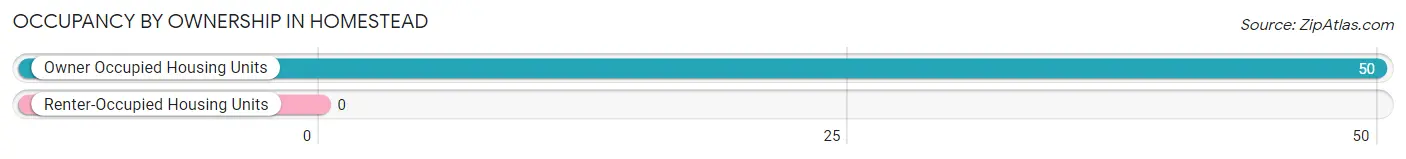
Occupancy by Ownership in Homestead
Of the total 50 dwellings in Homestead, owner-occupied units account for 50 (100.0%), while renter-occupied units make up 0 (0.0%).
| Occupancy | # Housing Units | % Housing Units |
| Owner Occupied Housing Units | 50 | 100.0% |
| Renter-Occupied Housing Units | 0 | 0.0% |
| Total Occupied Housing Units | 50 | 100.0% |
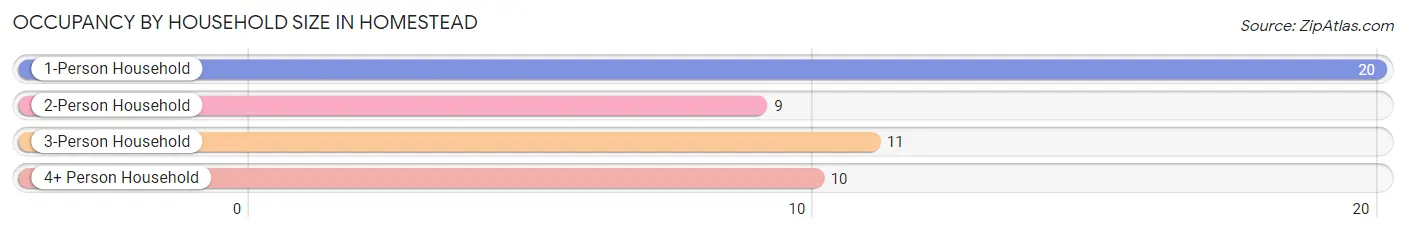
Occupancy by Household Size in Homestead
| Household Size | # Housing Units | % Housing Units |
| 1-Person Household | 20 | 40.0% |
| 2-Person Household | 9 | 18.0% |
| 3-Person Household | 11 | 22.0% |
| 4+ Person Household | 10 | 20.0% |
| Total Housing Units | 50 | 100.0% |
Occupancy by Ownership by Household Size in Homestead
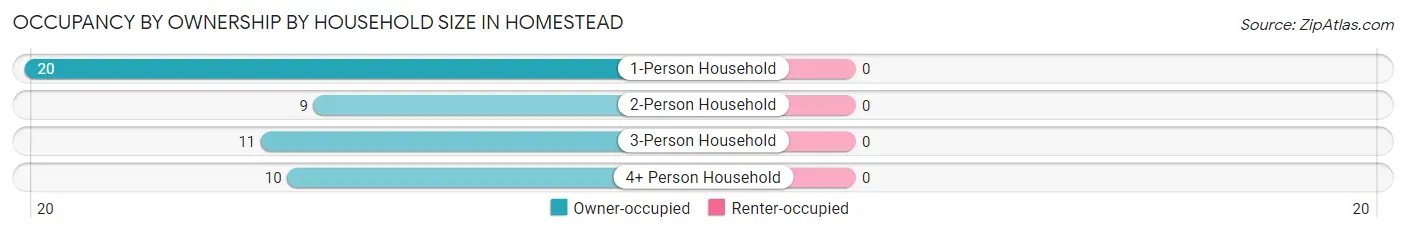
| Household Size | Owner-occupied | Renter-occupied |
| 1-Person Household | 20 (100.0%) | 0 (0.0%) |
| 2-Person Household | 9 (100.0%) | 0 (0.0%) |
| 3-Person Household | 11 (100.0%) | 0 (0.0%) |
| 4+ Person Household | 10 (100.0%) | 0 (0.0%) |
| Total Housing Units | 50 (100.0%) | 0 (0.0%) |
Occupancy by Educational Attainment in Homestead
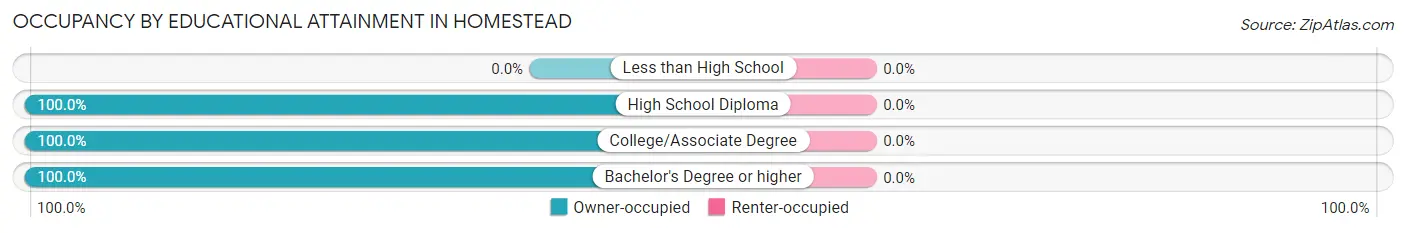
| Household Size | Owner-occupied | Renter-occupied |
| Less than High School | 0 (0.0%) | 0 (0.0%) |
| High School Diploma | 10 (100.0%) | 0 (0.0%) |
| College/Associate Degree | 33 (100.0%) | 0 (0.0%) |
| Bachelor's Degree or higher | 7 (100.0%) | 0 (0.0%) |
Occupancy by Age of Householder in Homestead
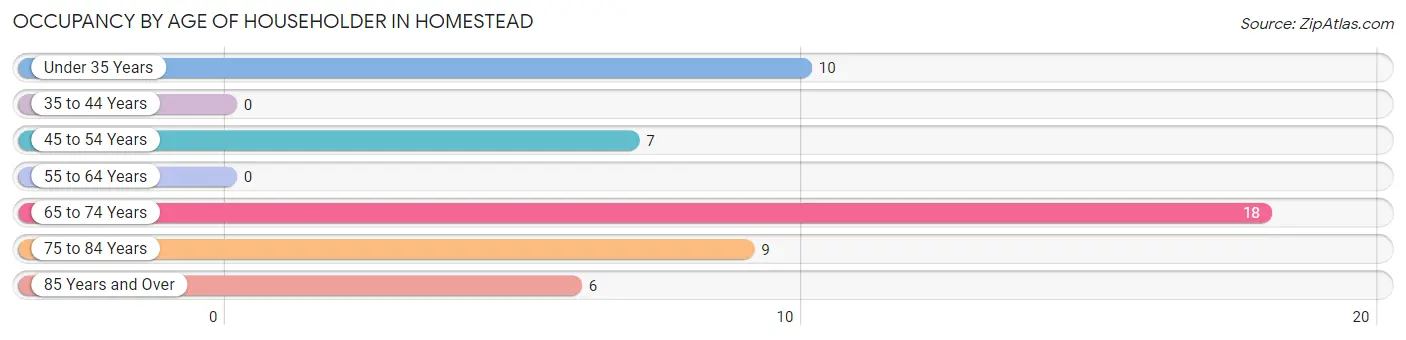
| Age Bracket | # Households | % Households |
| Under 35 Years | 10 | 20.0% |
| 35 to 44 Years | 0 | 0.0% |
| 45 to 54 Years | 7 | 14.0% |
| 55 to 64 Years | 0 | 0.0% |
| 65 to 74 Years | 18 | 36.0% |
| 75 to 84 Years | 9 | 18.0% |
| 85 Years and Over | 6 | 12.0% |
| Total | 50 | 100.0% |
Housing Finances in Homestead
Median Income by Occupancy in Homestead
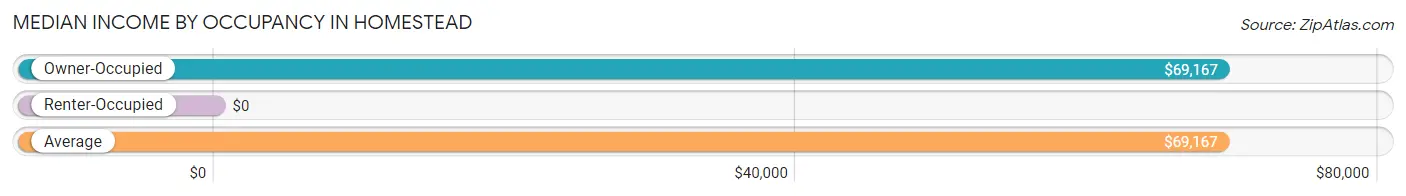
| Occupancy Type | # Households | Median Income |
| Owner-Occupied | 50 (100.0%) | $69,167 |
| Renter-Occupied | 0 (0.0%) | $0 |
| Average | 50 (100.0%) | $69,167 |
Occupancy by Householder Income Bracket in Homestead
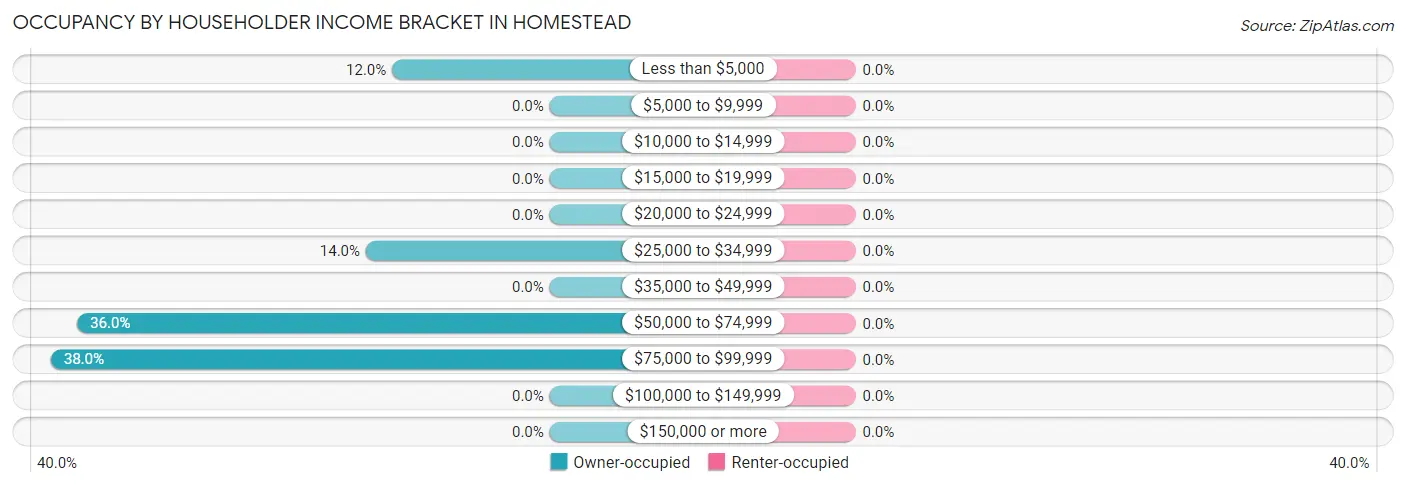
| Income Bracket | Owner-occupied | Renter-occupied |
| Less than $5,000 | 6 (12.0%) | 0 (0.0%) |
| $5,000 to $9,999 | 0 (0.0%) | 0 (0.0%) |
| $10,000 to $14,999 | 0 (0.0%) | 0 (0.0%) |
| $15,000 to $19,999 | 0 (0.0%) | 0 (0.0%) |
| $20,000 to $24,999 | 0 (0.0%) | 0 (0.0%) |
| $25,000 to $34,999 | 7 (14.0%) | 0 (0.0%) |
| $35,000 to $49,999 | 0 (0.0%) | 0 (0.0%) |
| $50,000 to $74,999 | 18 (36.0%) | 0 (0.0%) |
| $75,000 to $99,999 | 19 (38.0%) | 0 (0.0%) |
| $100,000 to $149,999 | 0 (0.0%) | 0 (0.0%) |
| $150,000 or more | 0 (0.0%) | 0 (0.0%) |
| Total | 50 (100.0%) | 0 (0.0%) |
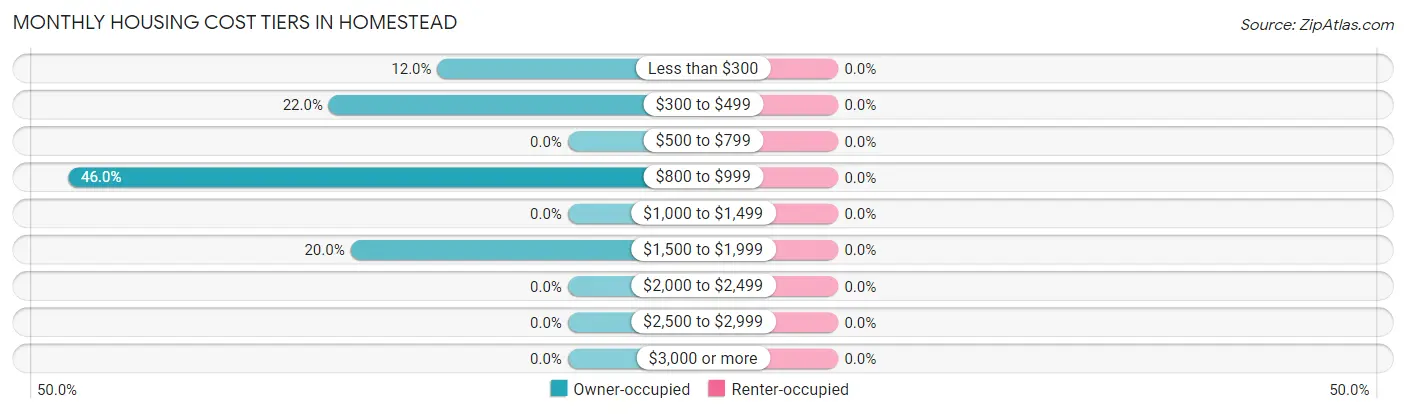
Monthly Housing Cost Tiers in Homestead
| Monthly Cost | Owner-occupied | Renter-occupied |
| Less than $300 | 6 (12.0%) | 0 (0.0%) |
| $300 to $499 | 11 (22.0%) | 0 (0.0%) |
| $500 to $799 | 0 (0.0%) | 0 (0.0%) |
| $800 to $999 | 23 (46.0%) | 0 (0.0%) |
| $1,000 to $1,499 | 0 (0.0%) | 0 (0.0%) |
| $1,500 to $1,999 | 10 (20.0%) | 0 (0.0%) |
| $2,000 to $2,499 | 0 (0.0%) | 0 (0.0%) |
| $2,500 to $2,999 | 0 (0.0%) | 0 (0.0%) |
| $3,000 or more | 0 (0.0%) | 0 (0.0%) |
| Total | 50 (100.0%) | 0 (0.0%) |
Physical Housing Characteristics in Homestead
Housing Structures in Homestead
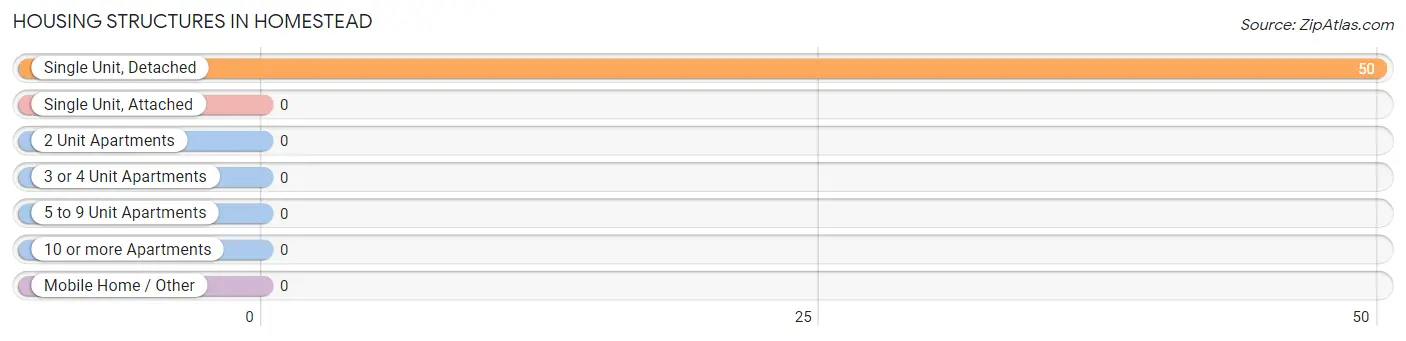
| Structure Type | # Housing Units | % Housing Units |
| Single Unit, Detached | 50 | 100.0% |
| Single Unit, Attached | 0 | 0.0% |
| 2 Unit Apartments | 0 | 0.0% |
| 3 or 4 Unit Apartments | 0 | 0.0% |
| 5 to 9 Unit Apartments | 0 | 0.0% |
| 10 or more Apartments | 0 | 0.0% |
| Mobile Home / Other | 0 | 0.0% |
| Total | 50 | 100.0% |
Housing Structures by Occupancy in Homestead
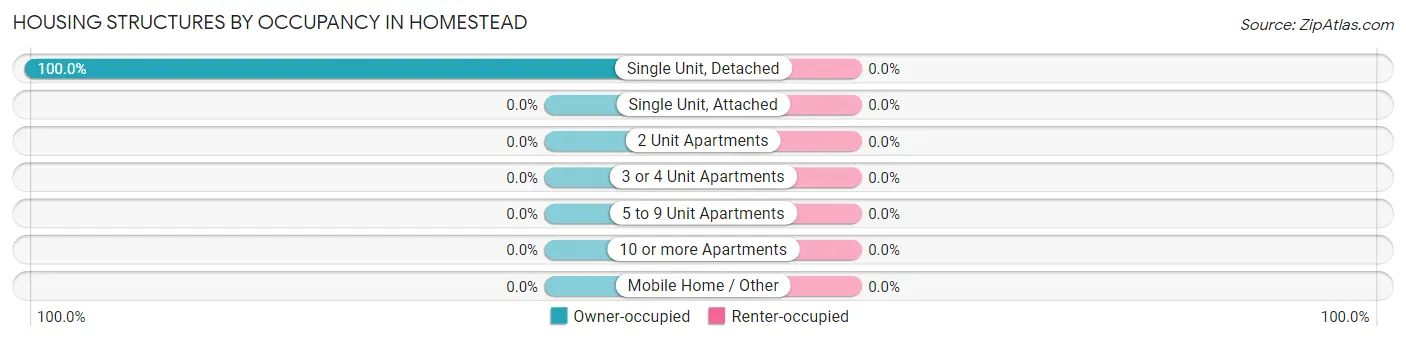
| Structure Type | Owner-occupied | Renter-occupied |
| Single Unit, Detached | 50 (100.0%) | 0 (0.0%) |
| Single Unit, Attached | 0 (0.0%) | 0 (0.0%) |
| 2 Unit Apartments | 0 (0.0%) | 0 (0.0%) |
| 3 or 4 Unit Apartments | 0 (0.0%) | 0 (0.0%) |
| 5 to 9 Unit Apartments | 0 (0.0%) | 0 (0.0%) |
| 10 or more Apartments | 0 (0.0%) | 0 (0.0%) |
| Mobile Home / Other | 0 (0.0%) | 0 (0.0%) |
| Total | 50 (100.0%) | 0 (0.0%) |
Housing Structures by Number of Rooms in Homestead
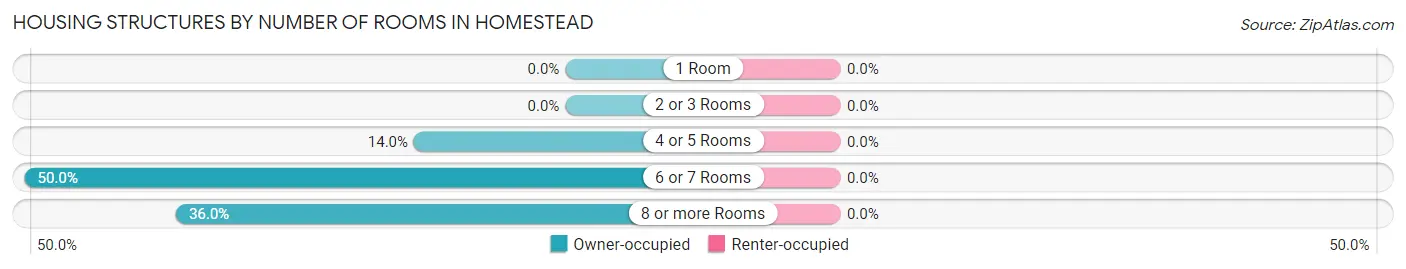
| Number of Rooms | Owner-occupied | Renter-occupied |
| 1 Room | 0 (0.0%) | 0 (0.0%) |
| 2 or 3 Rooms | 0 (0.0%) | 0 (0.0%) |
| 4 or 5 Rooms | 7 (14.0%) | 0 (0.0%) |
| 6 or 7 Rooms | 25 (50.0%) | 0 (0.0%) |
| 8 or more Rooms | 18 (36.0%) | 0 (0.0%) |
| Total | 50 (100.0%) | 0 (0.0%) |
Housing Structure by Heating Type in Homestead
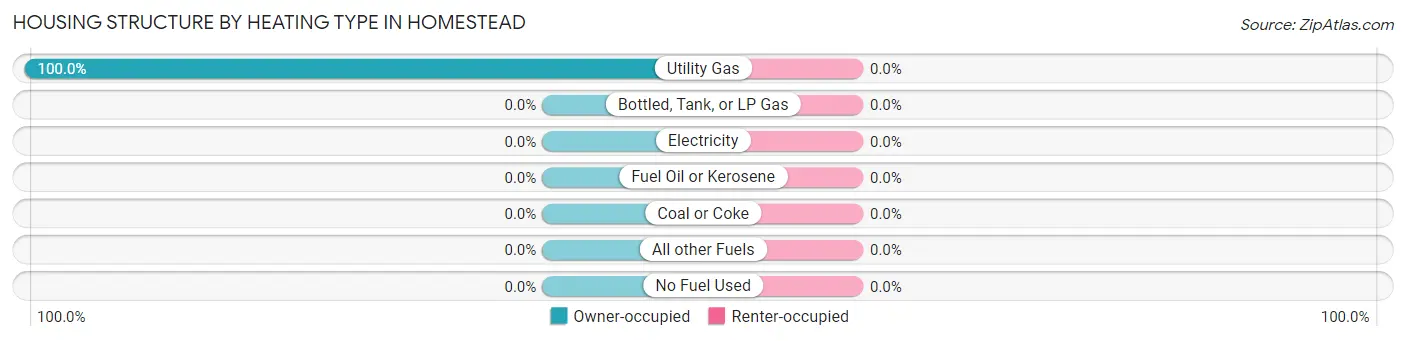
| Heating Type | Owner-occupied | Renter-occupied |
| Utility Gas | 50 (100.0%) | 0 (0.0%) |
| Bottled, Tank, or LP Gas | 0 (0.0%) | 0 (0.0%) |
| Electricity | 0 (0.0%) | 0 (0.0%) |
| Fuel Oil or Kerosene | 0 (0.0%) | 0 (0.0%) |
| Coal or Coke | 0 (0.0%) | 0 (0.0%) |
| All other Fuels | 0 (0.0%) | 0 (0.0%) |
| No Fuel Used | 0 (0.0%) | 0 (0.0%) |
| Total | 50 (100.0%) | 0 (0.0%) |
Household Vehicle Usage in Homestead
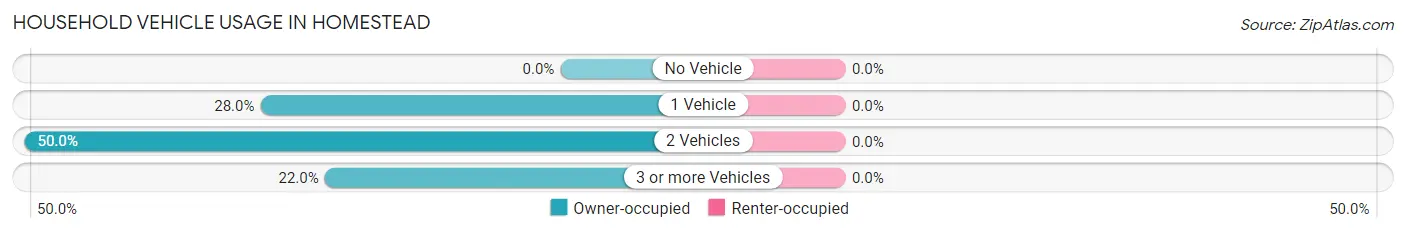
| Vehicles per Household | Owner-occupied | Renter-occupied |
| No Vehicle | 0 (0.0%) | 0 (0.0%) |
| 1 Vehicle | 14 (28.0%) | 0 (0.0%) |
| 2 Vehicles | 25 (50.0%) | 0 (0.0%) |
| 3 or more Vehicles | 11 (22.0%) | 0 (0.0%) |
| Total | 50 (100.0%) | 0 (0.0%) |
Real Estate & Mortgages in Homestead
Real Estate and Mortgage Overview in Homestead
| Characteristic | Without Mortgage | With Mortgage |
| Housing Units | 26 | 24 |
| Median Property Value | $133,300 | $0 |
| Median Household Income | $69,091 | $0 |
| Monthly Housing Costs | - | - |
| Real Estate Taxes | - | - |
Property Value by Mortgage Status in Homestead
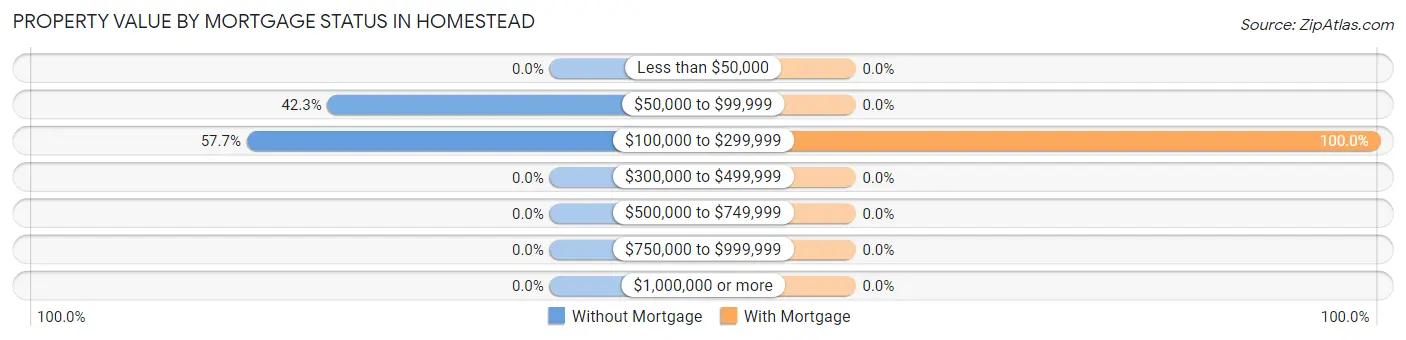
| Property Value | Without Mortgage | With Mortgage |
| Less than $50,000 | 0 (0.0%) | 0 (0.0%) |
| $50,000 to $99,999 | 11 (42.3%) | 0 (0.0%) |
| $100,000 to $299,999 | 15 (57.7%) | 24 (100.0%) |
| $300,000 to $499,999 | 0 (0.0%) | 0 (0.0%) |
| $500,000 to $749,999 | 0 (0.0%) | 0 (0.0%) |
| $750,000 to $999,999 | 0 (0.0%) | 0 (0.0%) |
| $1,000,000 or more | 0 (0.0%) | 0 (0.0%) |
| Total | 26 (100.0%) | 24 (100.0%) |
Household Income by Mortgage Status in Homestead
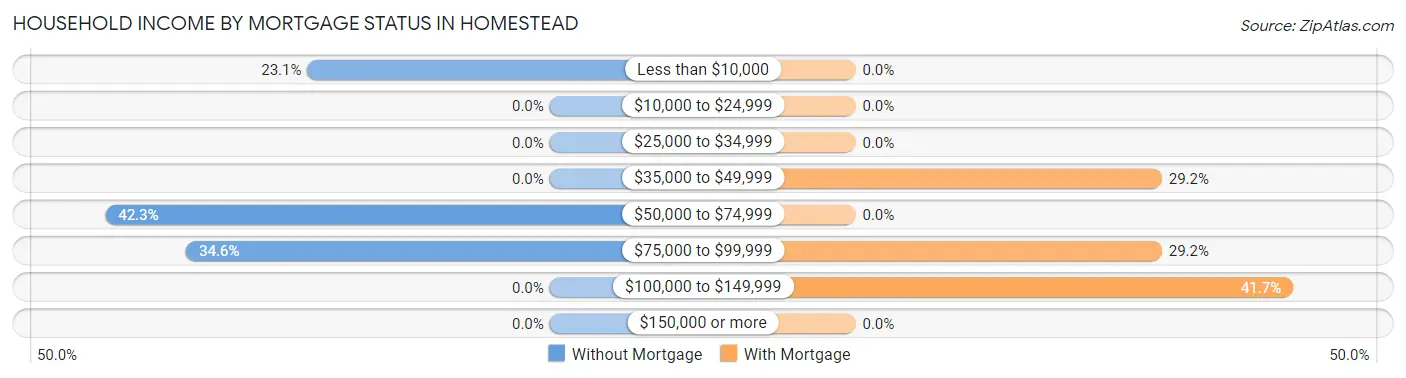
| Household Income | Without Mortgage | With Mortgage |
| Less than $10,000 | 6 (23.1%) | 0 (0.0%) |
| $10,000 to $24,999 | 0 (0.0%) | 0 (0.0%) |
| $25,000 to $34,999 | 0 (0.0%) | 0 (0.0%) |
| $35,000 to $49,999 | 0 (0.0%) | 7 (29.2%) |
| $50,000 to $74,999 | 11 (42.3%) | 0 (0.0%) |
| $75,000 to $99,999 | 9 (34.6%) | 7 (29.2%) |
| $100,000 to $149,999 | 0 (0.0%) | 10 (41.7%) |
| $150,000 or more | 0 (0.0%) | 0 (0.0%) |
| Total | 26 (100.0%) | 24 (100.0%) |
Property Value to Household Income Ratio in Homestead
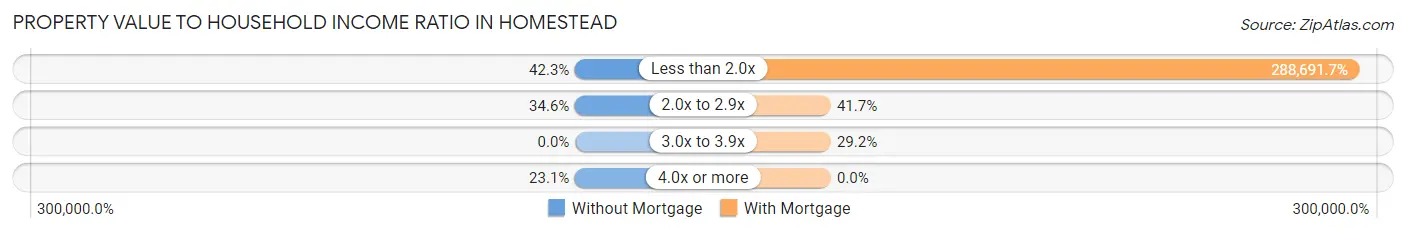
| Value-to-Income Ratio | Without Mortgage | With Mortgage |
| Less than 2.0x | 11 (42.3%) | 69,286 (288,691.7%) |
| 2.0x to 2.9x | 9 (34.6%) | 10 (41.7%) |
| 3.0x to 3.9x | 0 (0.0%) | 7 (29.2%) |
| 4.0x or more | 6 (23.1%) | 0 (0.0%) |
| Total | 26 (100.0%) | 24 (100.0%) |
Real Estate Taxes by Mortgage Status in Homestead
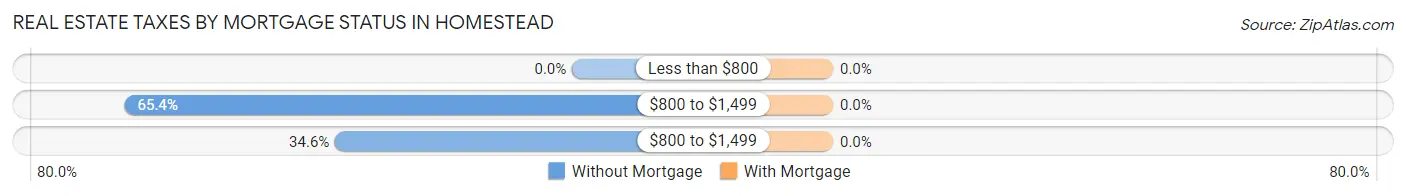
| Property Taxes | Without Mortgage | With Mortgage |
| Less than $800 | 0 (0.0%) | 0 (0.0%) |
| $800 to $1,499 | 17 (65.4%) | 0 (0.0%) |
| $800 to $1,499 | 9 (34.6%) | 0 (0.0%) |
| Total | 26 (100.0%) | 24 (100.0%) |
Health & Disability in Homestead
Health Insurance Coverage by Age in Homestead
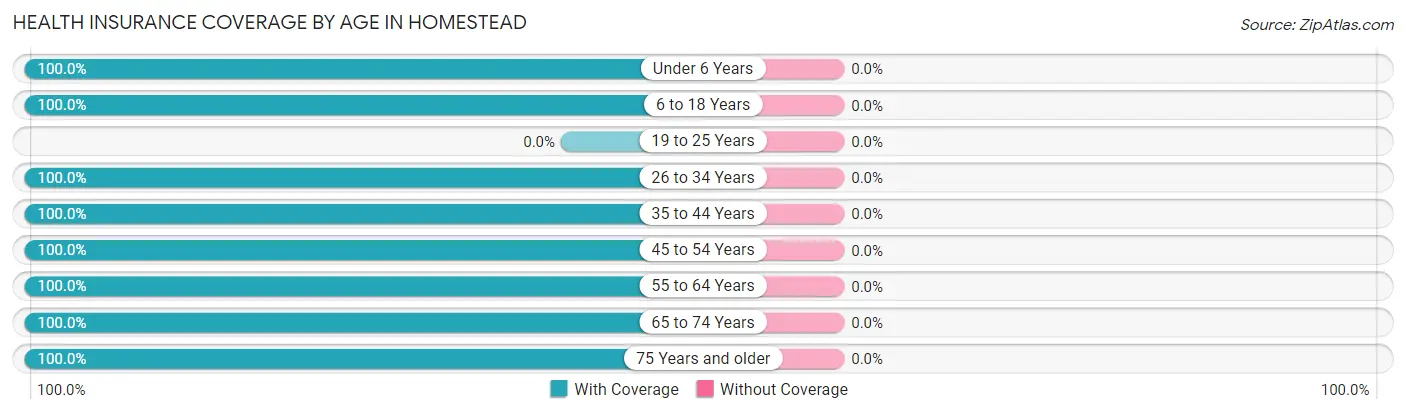
| Age Bracket | With Coverage | Without Coverage |
| Under 6 Years | 23 (100.0%) | 0 (0.0%) |
| 6 to 18 Years | 27 (100.0%) | 0 (0.0%) |
| 19 to 25 Years | 0 (0.0%) | 0 (0.0%) |
| 26 to 34 Years | 10 (100.0%) | 0 (0.0%) |
| 35 to 44 Years | 11 (100.0%) | 0 (0.0%) |
| 45 to 54 Years | 7 (100.0%) | 0 (0.0%) |
| 55 to 64 Years | 8 (100.0%) | 0 (0.0%) |
| 65 to 74 Years | 18 (100.0%) | 0 (0.0%) |
| 75 Years and older | 22 (100.0%) | 0 (0.0%) |
| Total | 126 (100.0%) | 0 (0.0%) |
Health Insurance Coverage by Citizenship Status in Homestead
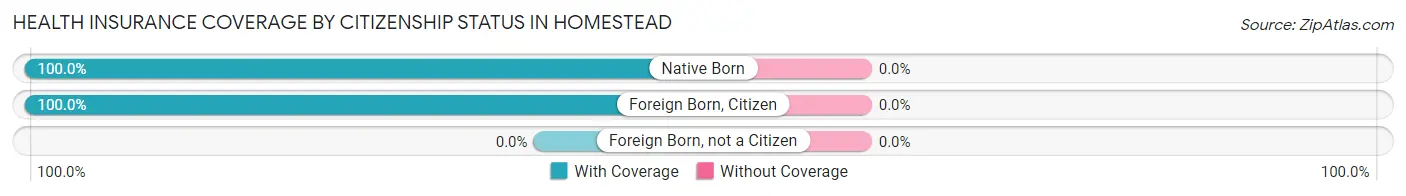
| Citizenship Status | With Coverage | Without Coverage |
| Native Born | 23 (100.0%) | 0 (0.0%) |
| Foreign Born, Citizen | 27 (100.0%) | 0 (0.0%) |
| Foreign Born, not a Citizen | 0 (0.0%) | 0 (0.0%) |
Health Insurance Coverage by Household Income in Homestead
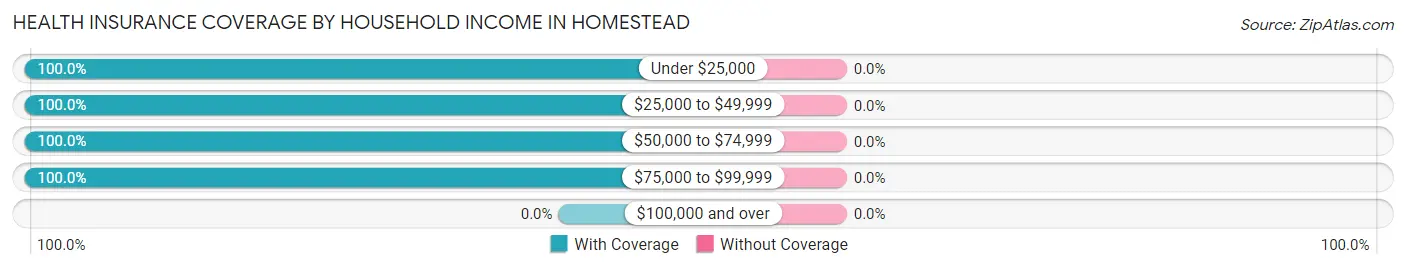
| Household Income | With Coverage | Without Coverage |
| Under $25,000 | 6 (100.0%) | 0 (0.0%) |
| $25,000 to $49,999 | 7 (100.0%) | 0 (0.0%) |
| $50,000 to $74,999 | 31 (100.0%) | 0 (0.0%) |
| $75,000 to $99,999 | 82 (100.0%) | 0 (0.0%) |
| $100,000 and over | 0 (0.0%) | 0 (0.0%) |
Public vs Private Health Insurance Coverage by Age in Homestead
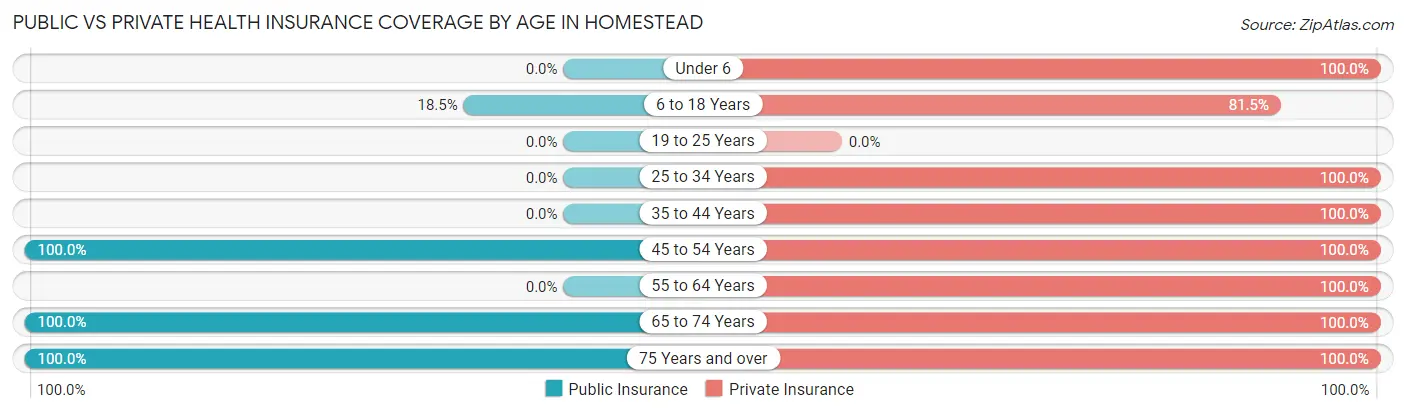
| Age Bracket | Public Insurance | Private Insurance |
| Under 6 | 0 (0.0%) | 23 (100.0%) |
| 6 to 18 Years | 5 (18.5%) | 22 (81.5%) |
| 19 to 25 Years | 0 (0.0%) | 0 (0.0%) |
| 25 to 34 Years | 0 (0.0%) | 10 (100.0%) |
| 35 to 44 Years | 0 (0.0%) | 11 (100.0%) |
| 45 to 54 Years | 7 (100.0%) | 7 (100.0%) |
| 55 to 64 Years | 0 (0.0%) | 8 (100.0%) |
| 65 to 74 Years | 18 (100.0%) | 18 (100.0%) |
| 75 Years and over | 22 (100.0%) | 22 (100.0%) |
| Total | 52 (41.3%) | 121 (96.0%) |
Disability Status by Sex by Age in Homestead
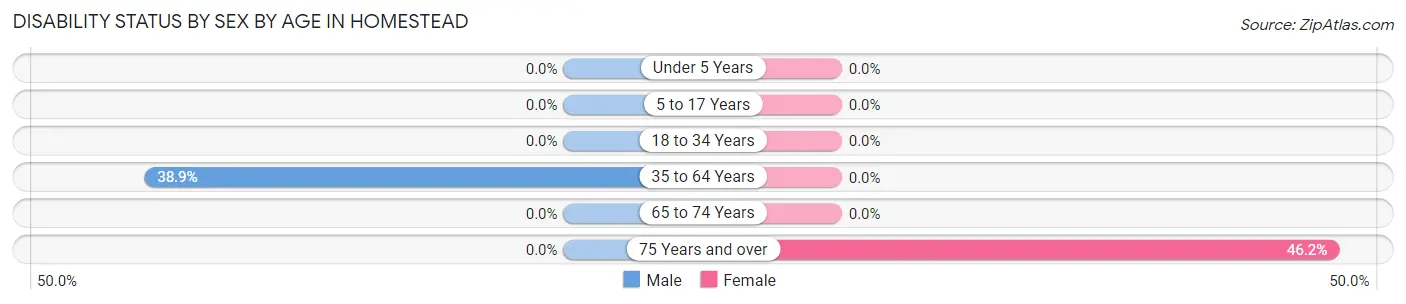
| Age Bracket | Male | Female |
| Under 5 Years | 0 (0.0%) | 0 (0.0%) |
| 5 to 17 Years | 0 (0.0%) | 0 (0.0%) |
| 18 to 34 Years | 0 (0.0%) | 0 (0.0%) |
| 35 to 64 Years | 7 (38.9%) | 0 (0.0%) |
| 65 to 74 Years | 0 (0.0%) | 0 (0.0%) |
| 75 Years and over | 0 (0.0%) | 6 (46.2%) |
Disability Class by Sex by Age in Homestead
Disability Class: Hearing Difficulty
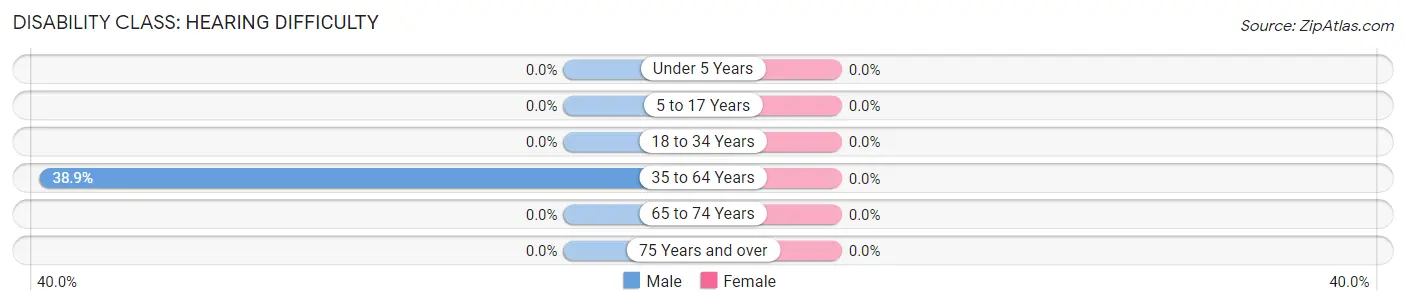
| Age Bracket | Male | Female |
| Under 5 Years | 0 (0.0%) | 0 (0.0%) |
| 5 to 17 Years | 0 (0.0%) | 0 (0.0%) |
| 18 to 34 Years | 0 (0.0%) | 0 (0.0%) |
| 35 to 64 Years | 7 (38.9%) | 0 (0.0%) |
| 65 to 74 Years | 0 (0.0%) | 0 (0.0%) |
| 75 Years and over | 0 (0.0%) | 0 (0.0%) |
Disability Class: Vision Difficulty
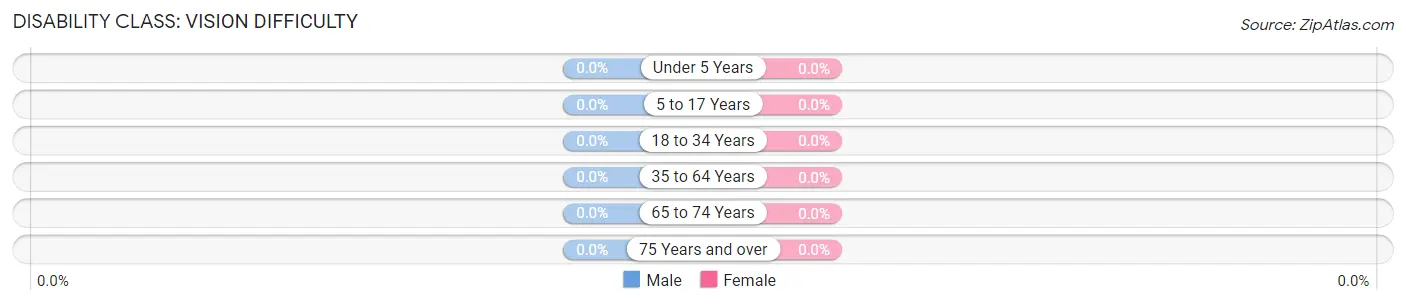
| Age Bracket | Male | Female |
| Under 5 Years | 0 (0.0%) | 0 (0.0%) |
| 5 to 17 Years | 0 (0.0%) | 0 (0.0%) |
| 18 to 34 Years | 0 (0.0%) | 0 (0.0%) |
| 35 to 64 Years | 0 (0.0%) | 0 (0.0%) |
| 65 to 74 Years | 0 (0.0%) | 0 (0.0%) |
| 75 Years and over | 0 (0.0%) | 0 (0.0%) |
Disability Class: Cognitive Difficulty
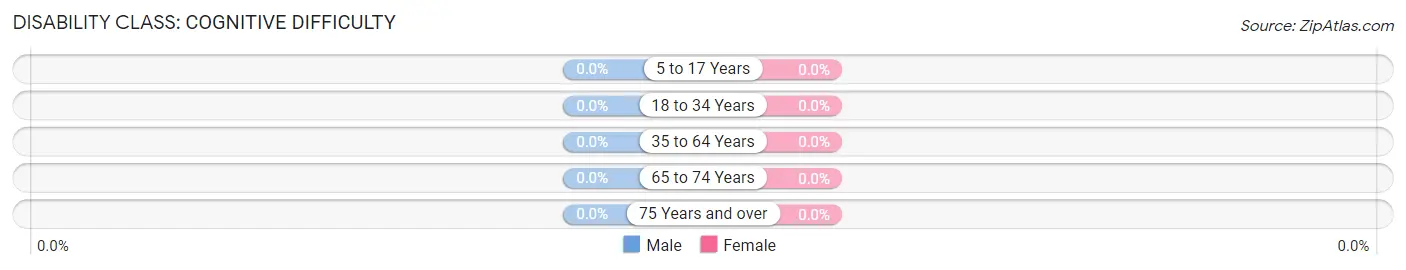
| Age Bracket | Male | Female |
| 5 to 17 Years | 0 (0.0%) | 0 (0.0%) |
| 18 to 34 Years | 0 (0.0%) | 0 (0.0%) |
| 35 to 64 Years | 0 (0.0%) | 0 (0.0%) |
| 65 to 74 Years | 0 (0.0%) | 0 (0.0%) |
| 75 Years and over | 0 (0.0%) | 0 (0.0%) |
Disability Class: Ambulatory Difficulty
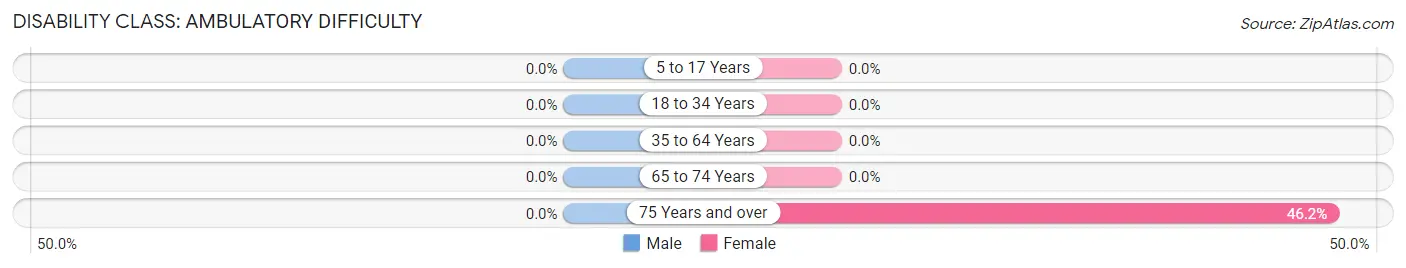
| Age Bracket | Male | Female |
| 5 to 17 Years | 0 (0.0%) | 0 (0.0%) |
| 18 to 34 Years | 0 (0.0%) | 0 (0.0%) |
| 35 to 64 Years | 0 (0.0%) | 0 (0.0%) |
| 65 to 74 Years | 0 (0.0%) | 0 (0.0%) |
| 75 Years and over | 0 (0.0%) | 6 (46.2%) |
Disability Class: Self-Care Difficulty
| Age Bracket | Male | Female |
| 5 to 17 Years | 0 (0.0%) | 0 (0.0%) |
| 18 to 34 Years | 0 (0.0%) | 0 (0.0%) |
| 35 to 64 Years | 0 (0.0%) | 0 (0.0%) |
| 65 to 74 Years | 0 (0.0%) | 0 (0.0%) |
| 75 Years and over | 0 (0.0%) | 0 (0.0%) |
Technology Access in Homestead
Computing Device Access in Homestead
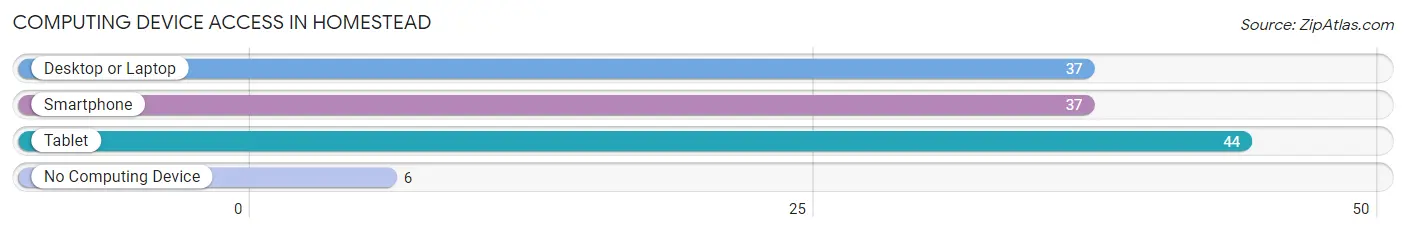
| Device Type | # Households | % Households |
| Desktop or Laptop | 37 | 74.0% |
| Smartphone | 37 | 74.0% |
| Tablet | 44 | 88.0% |
| No Computing Device | 6 | 12.0% |
| Total | 50 | 100.0% |
Internet Access in Homestead
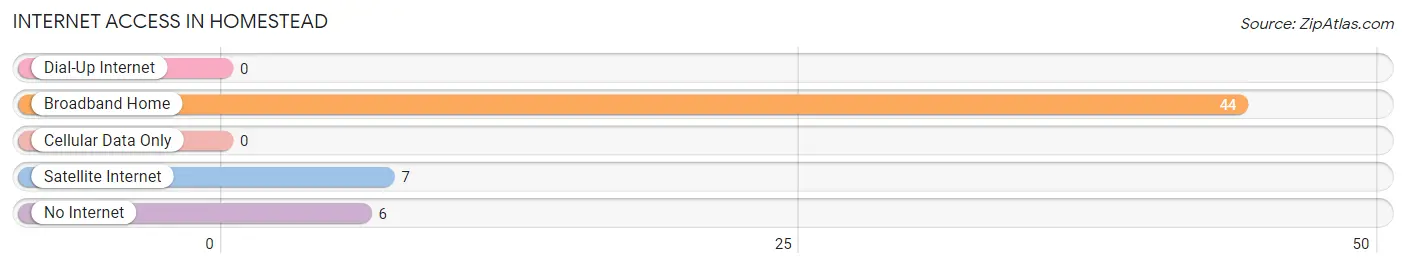
| Internet Type | # Households | % Households |
| Dial-Up Internet | 0 | 0.0% |
| Broadband Home | 44 | 88.0% |
| Cellular Data Only | 0 | 0.0% |
| Satellite Internet | 7 | 14.0% |
| No Internet | 6 | 12.0% |
| Total | 50 | 100.0% |
Homestead Summary
Homestead, Iowa is a small town located in the southeastern corner of the state, in Appanoose County. It is situated along the Chariton River, and is approximately 30 miles from the state capital of Des Moines. The town was founded in 1854, and was named after the Homestead Act of 1862, which granted settlers 160 acres of land in exchange for five years of continuous residence. The town has a population of approximately 1,000 people, and is known for its small-town charm and friendly atmosphere.
Geography
Homestead is located in the southeastern corner of Iowa, in Appanoose County. It is situated along the Chariton River, and is approximately 30 miles from the state capital of Des Moines. The town is located in the rolling hills of the Des Moines River Valley, and is surrounded by farmland and wooded areas. The town is located at an elevation of 890 feet above sea level.
Economy
Homestead’s economy is largely based on agriculture and manufacturing. The town is home to several small businesses, including a grocery store, a hardware store, and a few restaurants. The town also has a few small manufacturing plants, which produce a variety of products, including furniture, clothing, and automotive parts. The town is also home to a few small farms, which produce a variety of crops, including corn, soybeans, and hay.
Demographics
As of the 2010 census, the population of Homestead was 1,000 people. The racial makeup of the town was 97.2% White, 0.7% African American, 0.3% Native American, 0.2% Asian, 0.1% Pacific Islander, 0.3% from other races, and 1.3% from two or more races. Hispanic or Latino of any race were 1.3% of the population.
The median income for a household in Homestead was $37,500, and the median income for a family was $45,000. The per capita income for the town was $18,000. About 11.2% of families and 13.2% of the population were below the poverty line, including 16.7% of those under age 18 and 8.3% of those age 65 or over.
Conclusion
Homestead, Iowa is a small town located in the southeastern corner of the state, in Appanoose County. It is situated along the Chariton River, and is approximately 30 miles from the state capital of Des Moines. The town was founded in 1854, and was named after the Homestead Act of 1862, which granted settlers 160 acres of land in exchange for five years of continuous residence. The town has a population of approximately 1,000 people, and is known for its small-town charm and friendly atmosphere. The town’s economy is largely based on agriculture and manufacturing, and the town is home to several small businesses, including a grocery store, a hardware store, and a few restaurants. The racial makeup of the town is 97.2% White, 0.7% African American, 0.3% Native American, 0.2% Asian, 0.1% Pacific Islander, 0.3% from other races, and 1.3% from two or more races. The median income for a household in Homestead was $37,500, and the median income for a family was $45,000. The per capita income for the town was $18,000.
Common Questions
What is Per Capita Income in Homestead?
Per Capita income in Homestead is $24,420.
What is the Median Family Income in Homestead?
Median Family Income in Homestead is $83,500.
What is the Median Household income in Homestead?
Median Household Income in Homestead is $69,167.
What is Inequality or Gini Index in Homestead?
Inequality or Gini Index in Homestead is 0.24.
What is the Total Population of Homestead?
Total Population of Homestead is 126.
What is the Total Male Population of Homestead?
Total Male Population of Homestead is 49.
What is the Total Female Population of Homestead?
Total Female Population of Homestead is 77.
What is the Ratio of Males per 100 Females in Homestead?
There are 63.64 Males per 100 Females in Homestead.
What is the Ratio of Females per 100 Males in Homestead?
There are 157.14 Females per 100 Males in Homestead.
What is the Median Population Age in Homestead?
Median Population Age in Homestead is 35.3 Years.
What is the Average Family Size in Homestead
Average Family Size in Homestead is 3.5 People.
What is the Average Household Size in Homestead
Average Household Size in Homestead is 2.5 People.
How Large is the Labor Force in Homestead?
There are 28 People in the Labor Forcein in Homestead.
What is the Percentage of People in the Labor Force in Homestead?
36.8% of People are in the Labor Force in Homestead.