Burr Oak, IA Map & Demographics
Burr Oak Map
Burr Oak Overview
$20,553
PER CAPITA INCOME
$31,534
AVG FAMILY INCOME
$46,250
AVG HOUSEHOLD INCOME
0.38
INEQUALITY / GINI INDEX
234
TOTAL POPULATION
124
MALE POPULATION
110
FEMALE POPULATION
112.73
MALES / 100 FEMALES
88.71
FEMALES / 100 MALES
33.8
MEDIAN AGE
2.8
AVG FAMILY SIZE
2.4
AVG HOUSEHOLD SIZE
98
LABOR FORCE [ PEOPLE ]
57.6%
PERCENT IN LABOR FORCE
Burr Oak Area Codes
Income in Burr Oak
Income Overview in Burr Oak
Per Capita Income in Burr Oak is $20,553, while median incomes of families and households are $31,534 and $46,250 respectively.
| Characteristic | Number | Measure |
| Per Capita Income | 234 | $20,553 |
| Median Family Income | 71 | $31,534 |
| Mean Family Income | 71 | $41,511 |
| Median Household Income | 99 | $46,250 |
| Mean Household Income | 99 | $49,310 |
| Income Deficit | 71 | $0 |
| Wage / Income Gap (%) | 234 | 0.00% |
| Wage / Income Gap ($) | 234 | 100.00¢ per $1 |
| Gini / Inequality Index | 234 | 0.38 |
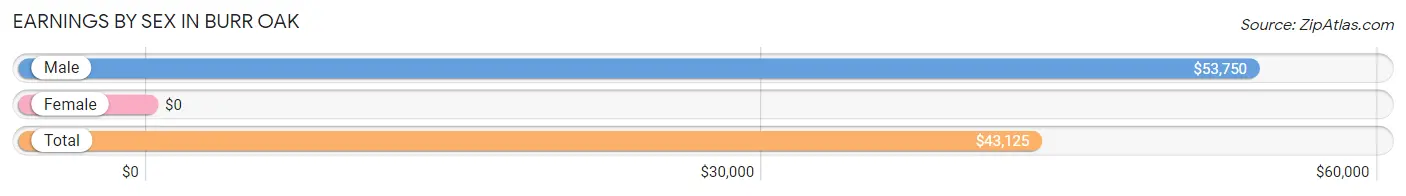
Earnings by Sex in Burr Oak
| Sex | Number | Average Earnings |
| Male | 62 (63.3%) | $53,750 |
| Female | 36 (36.7%) | $0 |
| Total | 98 (100.0%) | $43,125 |
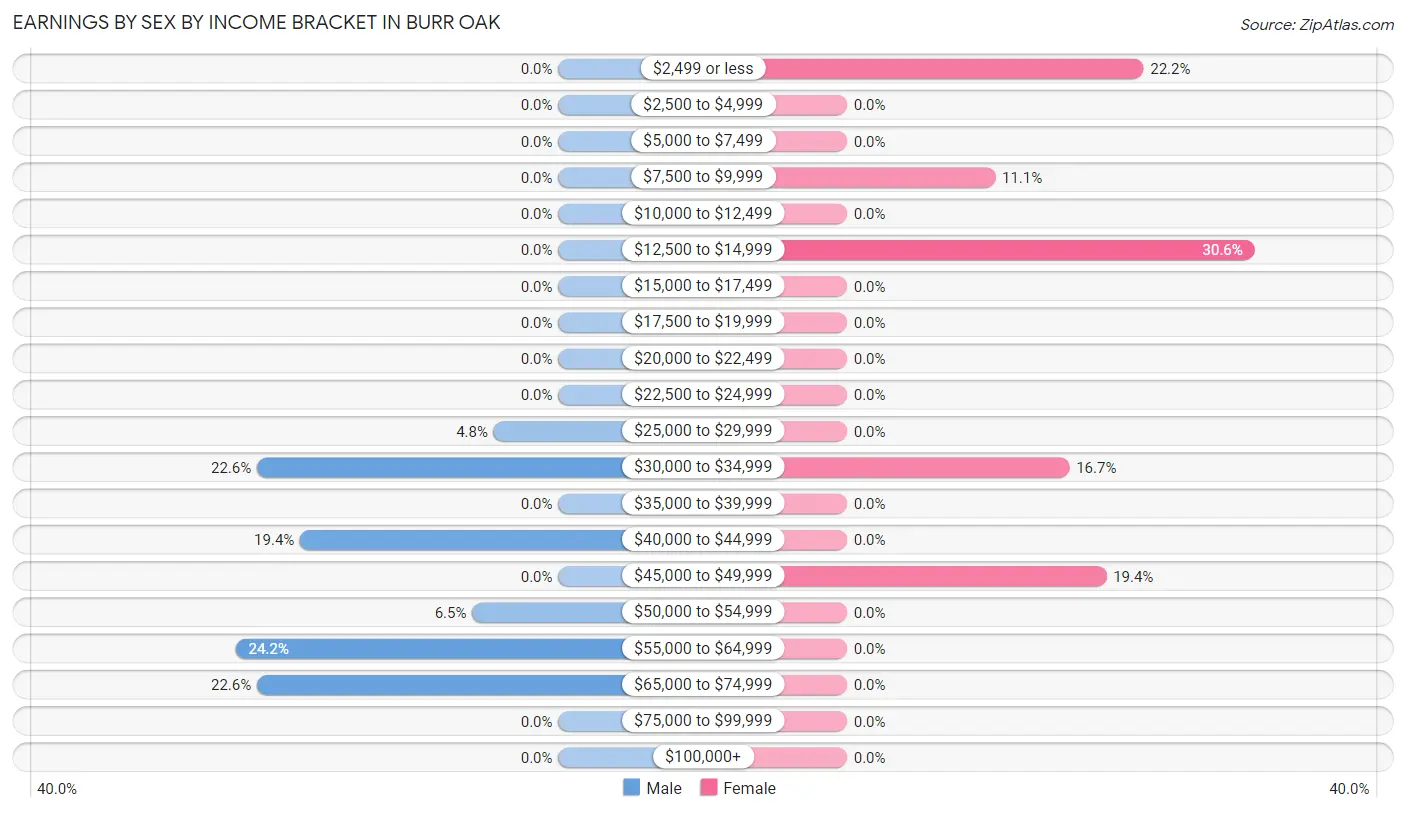
Earnings by Sex by Income Bracket in Burr Oak
The most common earnings brackets in Burr Oak are $55,000 to $64,999 for men (15 | 24.2%) and $12,500 to $14,999 for women (11 | 30.6%).
| Income | Male | Female |
| $2,499 or less | 0 (0.0%) | 8 (22.2%) |
| $2,500 to $4,999 | 0 (0.0%) | 0 (0.0%) |
| $5,000 to $7,499 | 0 (0.0%) | 0 (0.0%) |
| $7,500 to $9,999 | 0 (0.0%) | 4 (11.1%) |
| $10,000 to $12,499 | 0 (0.0%) | 0 (0.0%) |
| $12,500 to $14,999 | 0 (0.0%) | 11 (30.6%) |
| $15,000 to $17,499 | 0 (0.0%) | 0 (0.0%) |
| $17,500 to $19,999 | 0 (0.0%) | 0 (0.0%) |
| $20,000 to $22,499 | 0 (0.0%) | 0 (0.0%) |
| $22,500 to $24,999 | 0 (0.0%) | 0 (0.0%) |
| $25,000 to $29,999 | 3 (4.8%) | 0 (0.0%) |
| $30,000 to $34,999 | 14 (22.6%) | 6 (16.7%) |
| $35,000 to $39,999 | 0 (0.0%) | 0 (0.0%) |
| $40,000 to $44,999 | 12 (19.4%) | 0 (0.0%) |
| $45,000 to $49,999 | 0 (0.0%) | 7 (19.4%) |
| $50,000 to $54,999 | 4 (6.5%) | 0 (0.0%) |
| $55,000 to $64,999 | 15 (24.2%) | 0 (0.0%) |
| $65,000 to $74,999 | 14 (22.6%) | 0 (0.0%) |
| $75,000 to $99,999 | 0 (0.0%) | 0 (0.0%) |
| $100,000+ | 0 (0.0%) | 0 (0.0%) |
| Total | 62 (100.0%) | 36 (100.0%) |
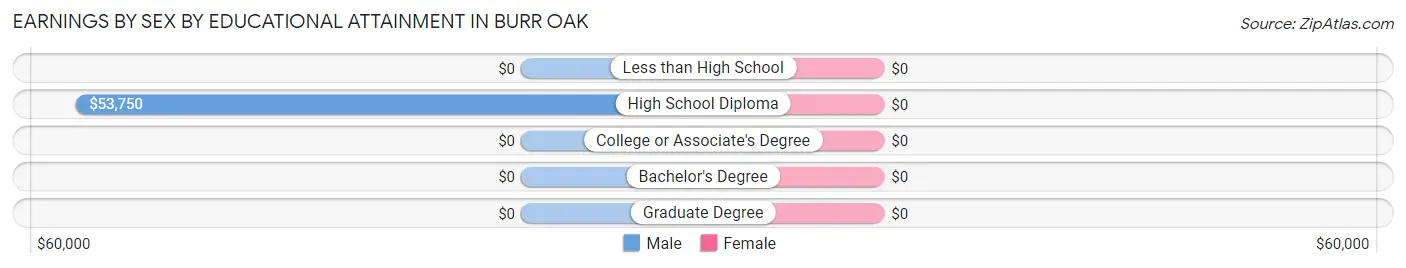
Earnings by Sex by Educational Attainment in Burr Oak
| Educational Attainment | Male Income | Female Income |
| Less than High School | - | - |
| High School Diploma | $53,750 | $0 |
| College or Associate's Degree | - | - |
| Bachelor's Degree | - | - |
| Graduate Degree | - | - |
| Total | $44,688 | $0 |
Family Income in Burr Oak
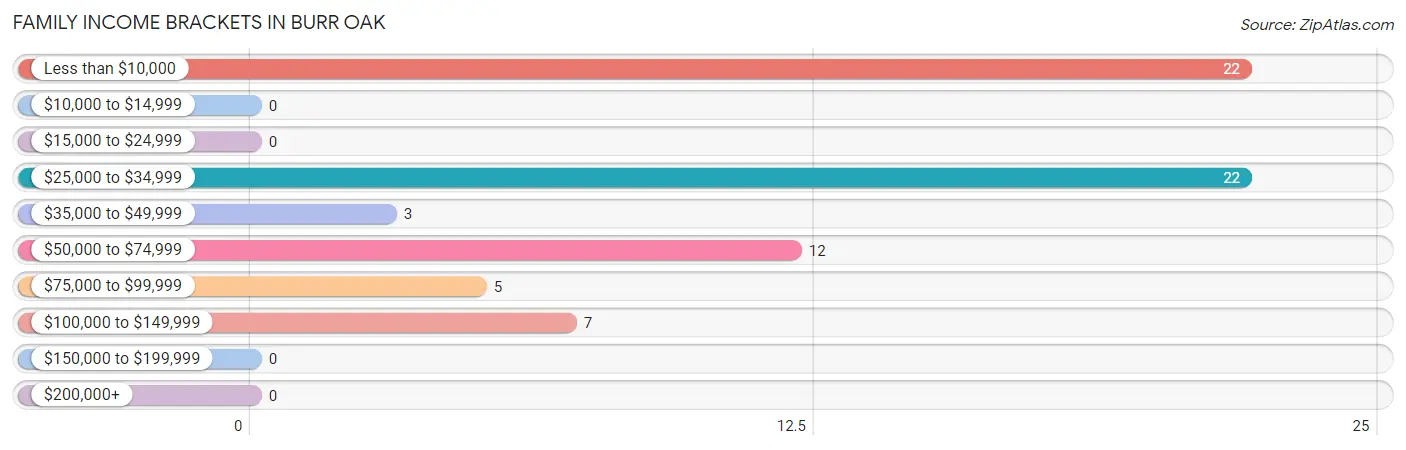
Family Income Brackets in Burr Oak
According to the Burr Oak family income data, there are 22 families falling into the less than $10,000 income range, which is the most common income bracket and makes up 31.0% of all families.
| Income Bracket | # Families | % Families |
| Less than $10,000 | 22 | 31.0% |
| $10,000 to $14,999 | 0 | 0.0% |
| $15,000 to $24,999 | 0 | 0.0% |
| $25,000 to $34,999 | 22 | 31.0% |
| $35,000 to $49,999 | 3 | 4.2% |
| $50,000 to $74,999 | 12 | 16.9% |
| $75,000 to $99,999 | 5 | 7.0% |
| $100,000 to $149,999 | 7 | 9.9% |
| $150,000 to $199,999 | 0 | 0.0% |
| $200,000+ | 0 | 0.0% |
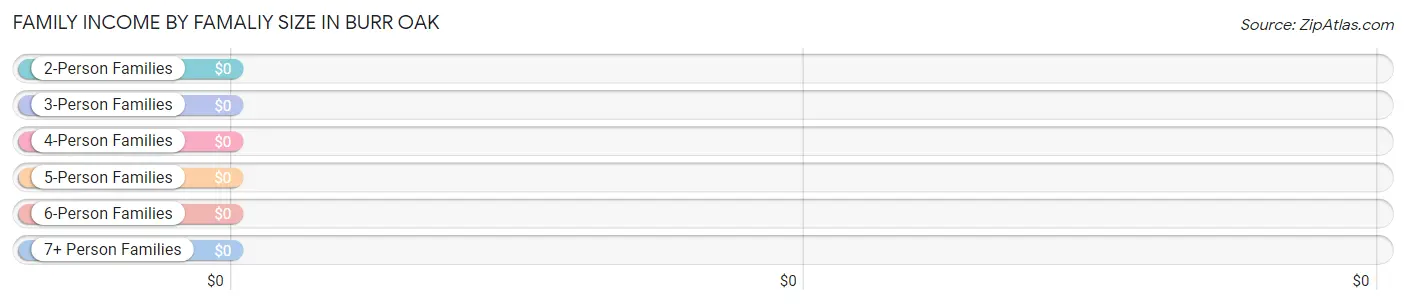
Family Income by Famaliy Size in Burr Oak
| Income Bracket | # Families | Median Income |
| 2-Person Families | 37 (52.1%) | $0 |
| 3-Person Families | 0 (0.0%) | $0 |
| 4-Person Families | 12 (16.9%) | $0 |
| 5-Person Families | 22 (31.0%) | $0 |
| 6-Person Families | 0 (0.0%) | $0 |
| 7+ Person Families | 0 (0.0%) | $0 |
| Total | 71 (100.0%) | $31,534 |
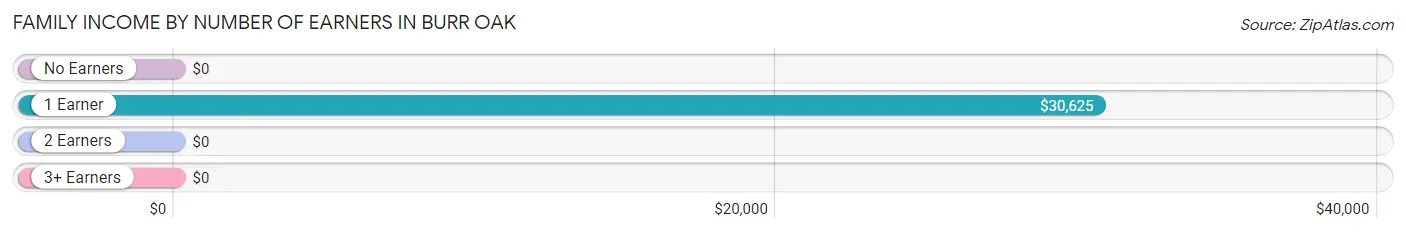
Family Income by Number of Earners in Burr Oak
| Number of Earners | # Families | Median Income |
| No Earners | 15 (21.1%) | $0 |
| 1 Earner | 37 (52.1%) | $30,625 |
| 2 Earners | 19 (26.8%) | $0 |
| 3+ Earners | 0 (0.0%) | $0 |
| Total | 71 (100.0%) | $31,534 |
Household Income in Burr Oak
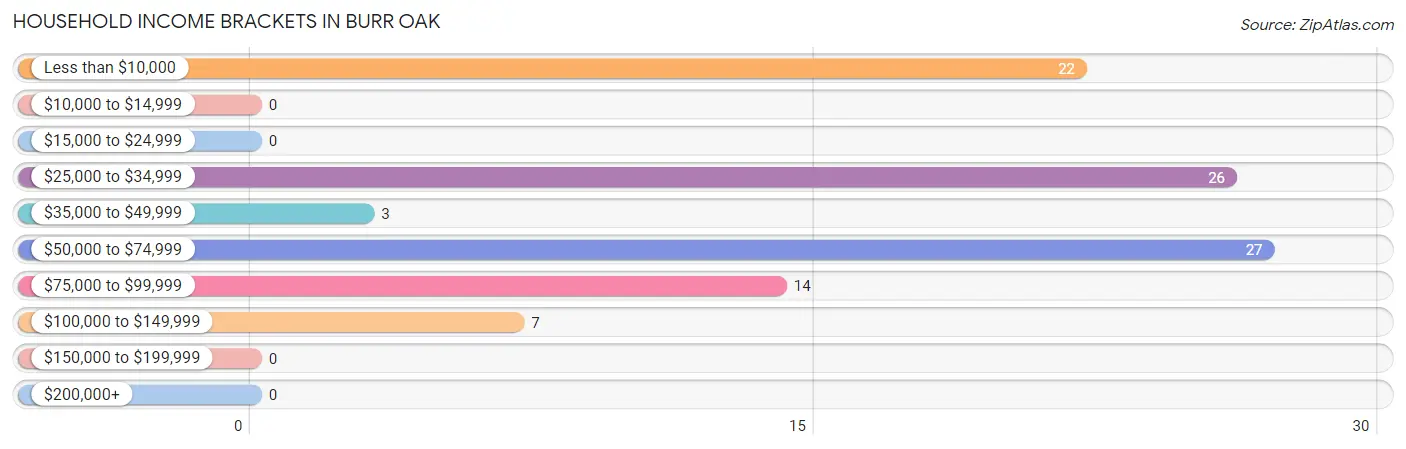
Household Income Brackets in Burr Oak
With 27 households falling in the category, the $50,000 to $74,999 income range is the most frequent in Burr Oak, accounting for 27.3% of all households.
| Income Bracket | # Households | % Households |
| Less than $10,000 | 22 | 22.2% |
| $10,000 to $14,999 | 0 | 0.0% |
| $15,000 to $24,999 | 0 | 0.0% |
| $25,000 to $34,999 | 26 | 26.3% |
| $35,000 to $49,999 | 3 | 3.0% |
| $50,000 to $74,999 | 27 | 27.3% |
| $75,000 to $99,999 | 14 | 14.1% |
| $100,000 to $149,999 | 7 | 7.1% |
| $150,000 to $199,999 | 0 | 0.0% |
| $200,000+ | 0 | 0.0% |
Household Income by Householder Age in Burr Oak
| Income Bracket | # Households | Median Income |
| 15 to 24 Years | 6 (6.1%) | $0 |
| 25 to 44 Years | 34 (34.3%) | $0 |
| 45 to 64 Years | 29 (29.3%) | $0 |
| 65+ Years | 30 (30.3%) | $0 |
| Total | 99 (100.0%) | $46,250 |
Poverty in Burr Oak
Income Below Poverty by Sex and Age in Burr Oak
With 43.5% poverty level for males and 57.3% for females among the residents of Burr Oak, 6 to 11 year old males and 6 to 11 year old females are the most vulnerable to poverty, with 11 males (100.0%) and 16 females (100.0%) in their respective age groups living below the poverty level.
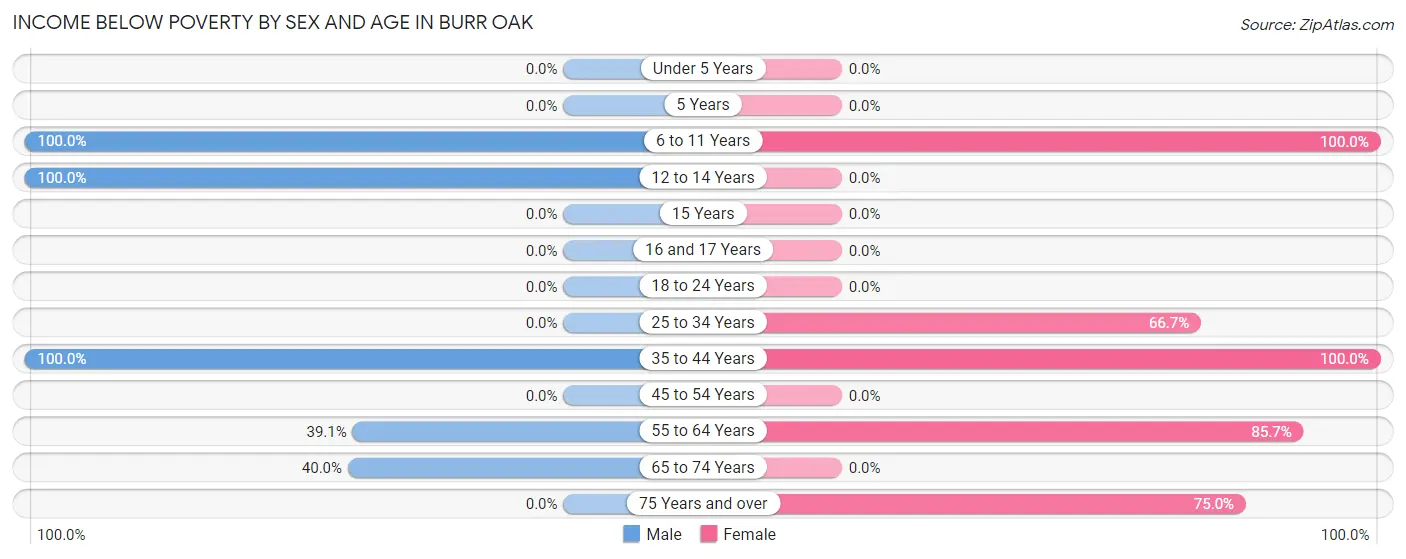
| Age Bracket | Male | Female |
| Under 5 Years | 0 (0.0%) | 0 (0.0%) |
| 5 Years | 0 (0.0%) | 0 (0.0%) |
| 6 to 11 Years | 11 (100.0%) | 16 (100.0%) |
| 12 to 14 Years | 10 (100.0%) | 0 (0.0%) |
| 15 Years | 0 (0.0%) | 0 (0.0%) |
| 16 and 17 Years | 0 (0.0%) | 0 (0.0%) |
| 18 to 24 Years | 0 (0.0%) | 0 (0.0%) |
| 25 to 34 Years | 0 (0.0%) | 22 (66.7%) |
| 35 to 44 Years | 14 (100.0%) | 4 (100.0%) |
| 45 to 54 Years | 0 (0.0%) | 0 (0.0%) |
| 55 to 64 Years | 9 (39.1%) | 12 (85.7%) |
| 65 to 74 Years | 10 (40.0%) | 0 (0.0%) |
| 75 Years and over | 0 (0.0%) | 9 (75.0%) |
| Total | 54 (43.5%) | 63 (57.3%) |
Income Above Poverty by Sex and Age in Burr Oak
According to the poverty statistics in Burr Oak, males aged under 5 years and females aged under 5 years are the age groups that are most secure financially, with 100.0% of males and 100.0% of females in these age groups living above the poverty line.
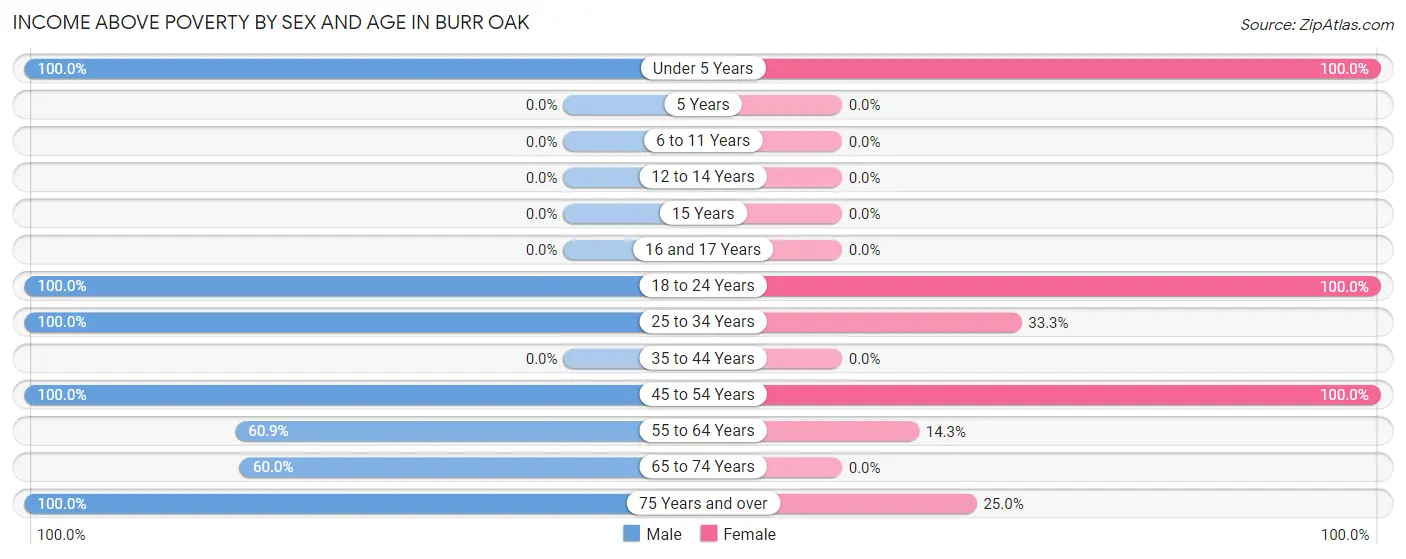
| Age Bracket | Male | Female |
| Under 5 Years | 9 (100.0%) | 18 (100.0%) |
| 5 Years | 0 (0.0%) | 0 (0.0%) |
| 6 to 11 Years | 0 (0.0%) | 0 (0.0%) |
| 12 to 14 Years | 0 (0.0%) | 0 (0.0%) |
| 15 Years | 0 (0.0%) | 0 (0.0%) |
| 16 and 17 Years | 0 (0.0%) | 0 (0.0%) |
| 18 to 24 Years | 7 (100.0%) | 6 (100.0%) |
| 25 to 34 Years | 12 (100.0%) | 11 (33.3%) |
| 35 to 44 Years | 0 (0.0%) | 0 (0.0%) |
| 45 to 54 Years | 7 (100.0%) | 7 (100.0%) |
| 55 to 64 Years | 14 (60.9%) | 2 (14.3%) |
| 65 to 74 Years | 15 (60.0%) | 0 (0.0%) |
| 75 Years and over | 6 (100.0%) | 3 (25.0%) |
| Total | 70 (56.5%) | 47 (42.7%) |
Income Below Poverty Among Married-Couple Families in Burr Oak
The poverty statistics for married-couple families in Burr Oak show that 62.5% or 40 of the total 64 families live below the poverty line. Families with 3 or 4 children have the highest poverty rate of 100.0%, comprising of 22 families. On the other hand, families with 1 or 2 children have the lowest poverty rate of 0.0%, which includes 0 families.
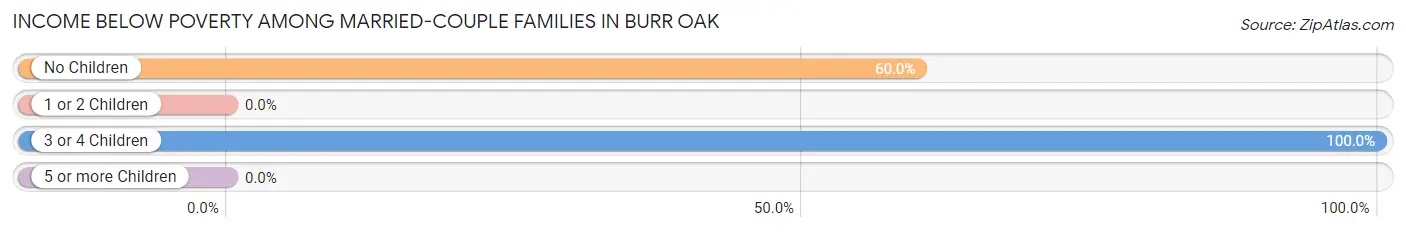
| Children | Above Poverty | Below Poverty |
| No Children | 12 (40.0%) | 18 (60.0%) |
| 1 or 2 Children | 12 (100.0%) | 0 (0.0%) |
| 3 or 4 Children | 0 (0.0%) | 22 (100.0%) |
| 5 or more Children | 0 (0.0%) | 0 (0.0%) |
| Total | 24 (37.5%) | 40 (62.5%) |
Income Below Poverty Among Single-Parent Households in Burr Oak
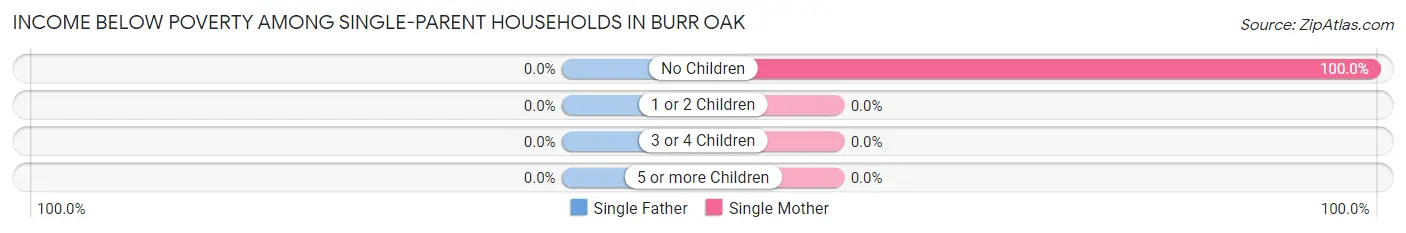
| Children | Single Father | Single Mother |
| No Children | 0 (0.0%) | 4 (100.0%) |
| 1 or 2 Children | 0 (0.0%) | 0 (0.0%) |
| 3 or 4 Children | 0 (0.0%) | 0 (0.0%) |
| 5 or more Children | 0 (0.0%) | 0 (0.0%) |
| Total | 0 (0.0%) | 4 (100.0%) |
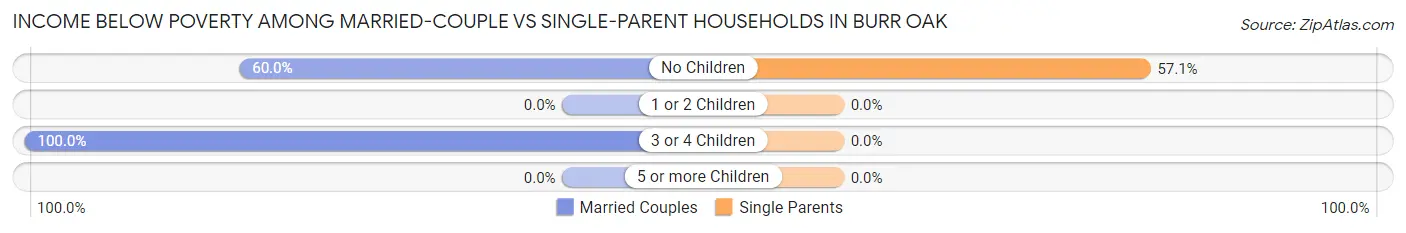
Income Below Poverty Among Married-Couple vs Single-Parent Households in Burr Oak
The poverty data for Burr Oak shows that 40 of the married-couple family households (62.5%) and 4 of the single-parent households (57.1%) are living below the poverty level. Within the married-couple family households, those with 3 or 4 children have the highest poverty rate, with 22 households (100.0%) falling below the poverty line. Among the single-parent households, those with no children have the highest poverty rate, with 4 household (57.1%) living below poverty.
| Children | Married-Couple Families | Single-Parent Households |
| No Children | 18 (60.0%) | 4 (57.1%) |
| 1 or 2 Children | 0 (0.0%) | 0 (0.0%) |
| 3 or 4 Children | 22 (100.0%) | 0 (0.0%) |
| 5 or more Children | 0 (0.0%) | 0 (0.0%) |
| Total | 40 (62.5%) | 4 (57.1%) |
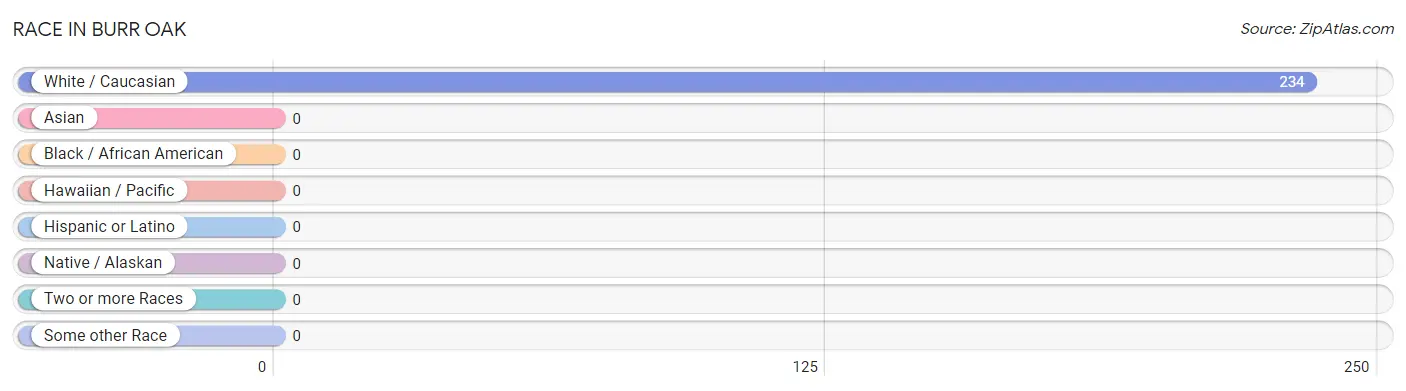
Race in Burr Oak
The most populous races in Burr Oak are , and White / Caucasian (234 | 100.0%).
| Race | # Population | % Population |
| Asian | 0 | 0.0% |
| Black / African American | 0 | 0.0% |
| Hawaiian / Pacific | 0 | 0.0% |
| Hispanic or Latino | 0 | 0.0% |
| Native / Alaskan | 0 | 0.0% |
| White / Caucasian | 234 | 100.0% |
| Two or more Races | 0 | 0.0% |
| Some other Race | 0 | 0.0% |
| Total | 234 | 100.0% |
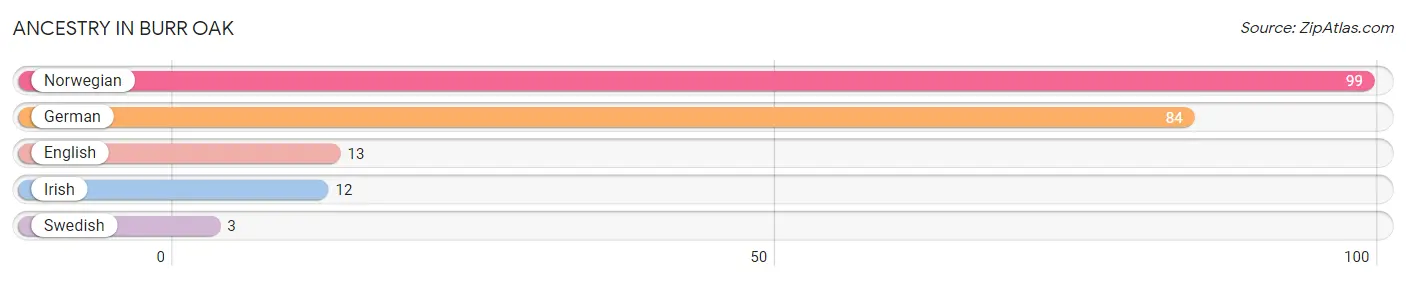
Ancestry in Burr Oak
The most populous ancestries reported in Burr Oak are Norwegian (99 | 42.3%), German (84 | 35.9%), English (13 | 5.6%), Irish (12 | 5.1%), and Swedish (3 | 1.3%), together accounting for 90.2% of all Burr Oak residents.
| Ancestry | # Population | % Population |
| English | 13 | 5.6% |
| German | 84 | 35.9% |
| Irish | 12 | 5.1% |
| Norwegian | 99 | 42.3% |
| Swedish | 3 | 1.3% | View All 5 Rows |
Immigrants in Burr Oak

| Immigration Origin | # Population | % Population | View All 0 Rows |
Sex and Age in Burr Oak
Sex and Age in Burr Oak
The most populous age groups in Burr Oak are 70 to 74 Years (25 | 20.2%) for men and 30 to 34 Years (22 | 20.0%) for women.
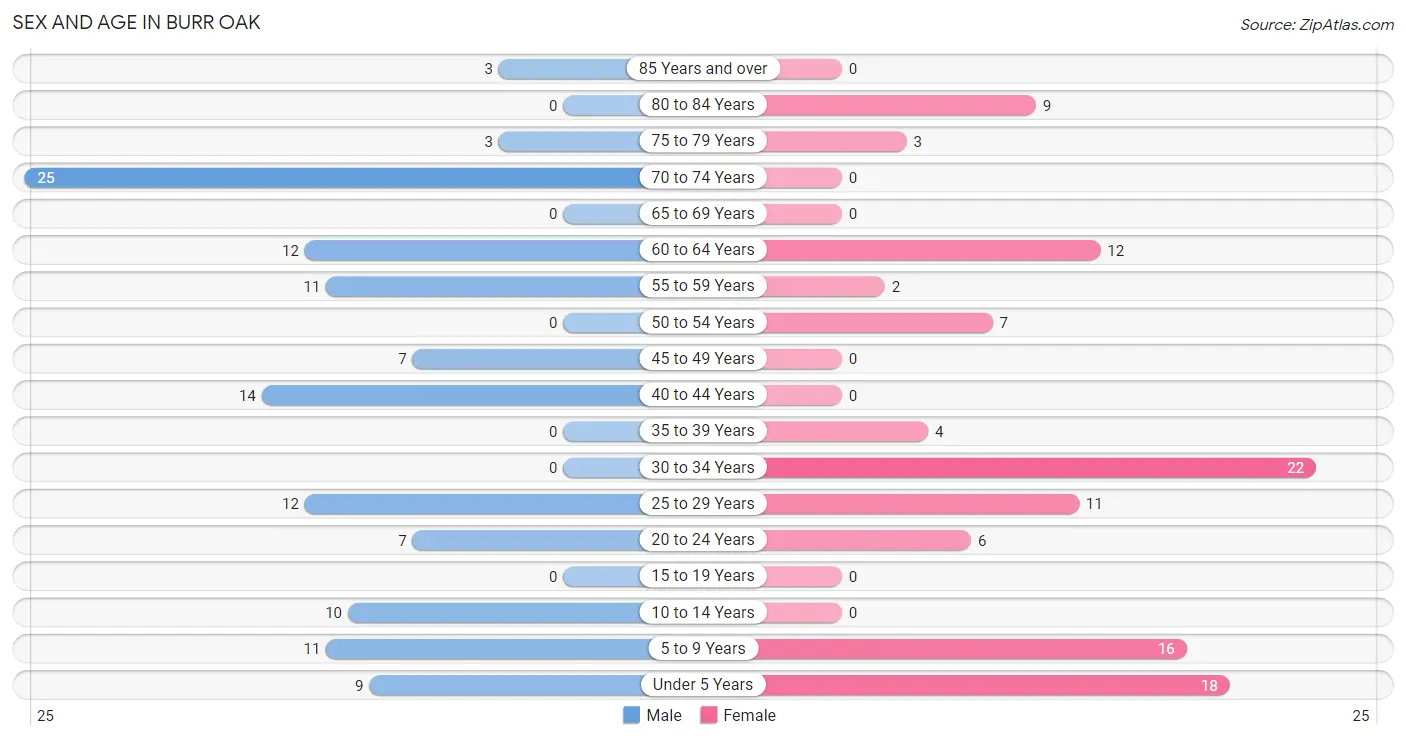
| Age Bracket | Male | Female |
| Under 5 Years | 9 (7.3%) | 18 (16.4%) |
| 5 to 9 Years | 11 (8.9%) | 16 (14.5%) |
| 10 to 14 Years | 10 (8.1%) | 0 (0.0%) |
| 15 to 19 Years | 0 (0.0%) | 0 (0.0%) |
| 20 to 24 Years | 7 (5.7%) | 6 (5.4%) |
| 25 to 29 Years | 12 (9.7%) | 11 (10.0%) |
| 30 to 34 Years | 0 (0.0%) | 22 (20.0%) |
| 35 to 39 Years | 0 (0.0%) | 4 (3.6%) |
| 40 to 44 Years | 14 (11.3%) | 0 (0.0%) |
| 45 to 49 Years | 7 (5.7%) | 0 (0.0%) |
| 50 to 54 Years | 0 (0.0%) | 7 (6.4%) |
| 55 to 59 Years | 11 (8.9%) | 2 (1.8%) |
| 60 to 64 Years | 12 (9.7%) | 12 (10.9%) |
| 65 to 69 Years | 0 (0.0%) | 0 (0.0%) |
| 70 to 74 Years | 25 (20.2%) | 0 (0.0%) |
| 75 to 79 Years | 3 (2.4%) | 3 (2.7%) |
| 80 to 84 Years | 0 (0.0%) | 9 (8.2%) |
| 85 Years and over | 3 (2.4%) | 0 (0.0%) |
| Total | 124 (100.0%) | 110 (100.0%) |
Families and Households in Burr Oak
Median Family Size in Burr Oak
The median family size in Burr Oak is 2.80 persons per family, with married-couple families (64 | 90.1%) accounting for the largest median family size of 2.89 persons per family. On the other hand, single male/father families (3 | 4.2%) represent the smallest median family size with 2.00 persons per family.
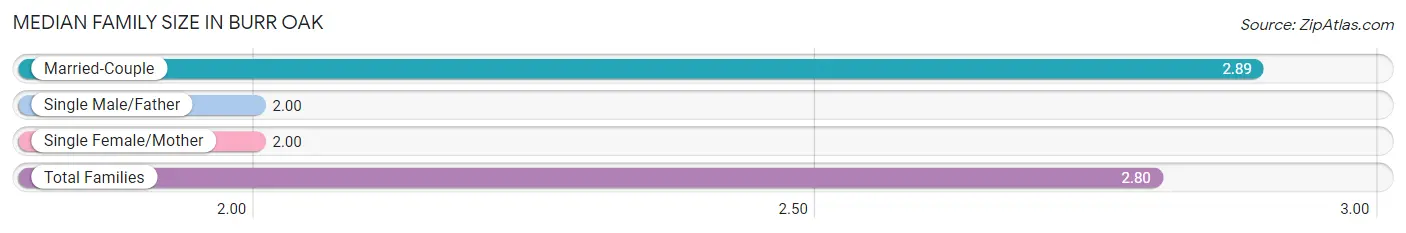
| Family Type | # Families | Family Size |
| Married-Couple | 64 (90.1%) | 2.89 |
| Single Male/Father | 3 (4.2%) | 2.00 |
| Single Female/Mother | 4 (5.6%) | 2.00 |
| Total Families | 71 (100.0%) | 2.80 |
Median Household Size in Burr Oak
The median household size in Burr Oak is 2.36 persons per household, with married-couple households (64 | 64.6%) accounting for the largest median household size of 2.89 persons per household. non-family households (28 | 28.3%) represent the smallest median household size with 1.25 persons per household.
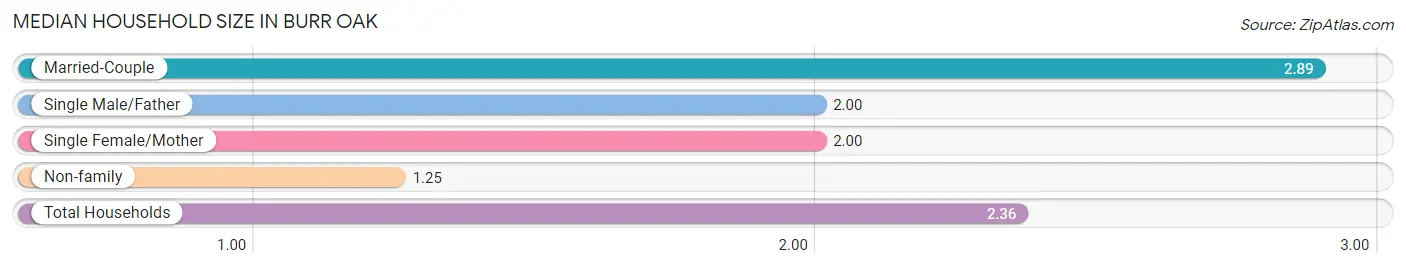
| Household Type | # Households | Household Size |
| Married-Couple | 64 (64.6%) | 2.89 |
| Single Male/Father | 3 (3.0%) | 2.00 |
| Single Female/Mother | 4 (4.0%) | 2.00 |
| Non-family | 28 (28.3%) | 1.25 |
| Total Households | 99 (100.0%) | 2.36 |
Household Size by Marriage Status in Burr Oak
Out of a total of 99 households in Burr Oak, 71 (71.7%) are family households, while 28 (28.3%) are nonfamily households. The most numerous type of family households are 2-person households, comprising 37, and the most common type of nonfamily households are 1-person households, comprising 22.
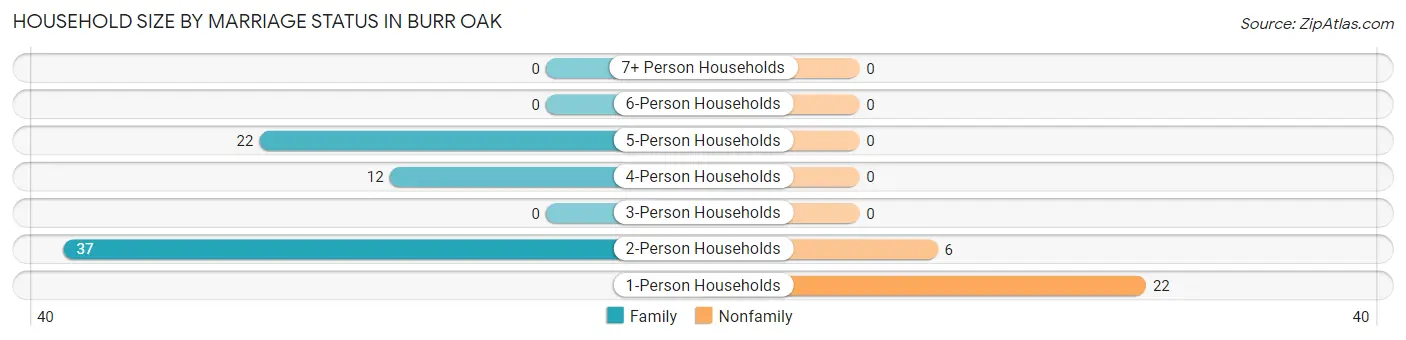
| Household Size | Family Households | Nonfamily Households |
| 1-Person Households | - | 22 (22.2%) |
| 2-Person Households | 37 (37.4%) | 6 (6.1%) |
| 3-Person Households | 0 (0.0%) | 0 (0.0%) |
| 4-Person Households | 12 (12.1%) | 0 (0.0%) |
| 5-Person Households | 22 (22.2%) | 0 (0.0%) |
| 6-Person Households | 0 (0.0%) | 0 (0.0%) |
| 7+ Person Households | 0 (0.0%) | 0 (0.0%) |
| Total | 71 (71.7%) | 28 (28.3%) |
Female Fertility in Burr Oak
Fertility by Age in Burr Oak
Average fertility rate in Burr Oak is 256.0 births per 1,000 women. Women in the age bracket of 20 to 34 years have the highest fertility rate with 282.0 births per 1,000 women. Women in the age bracket of 20 to 34 years acount for 100.0% of all women with births.
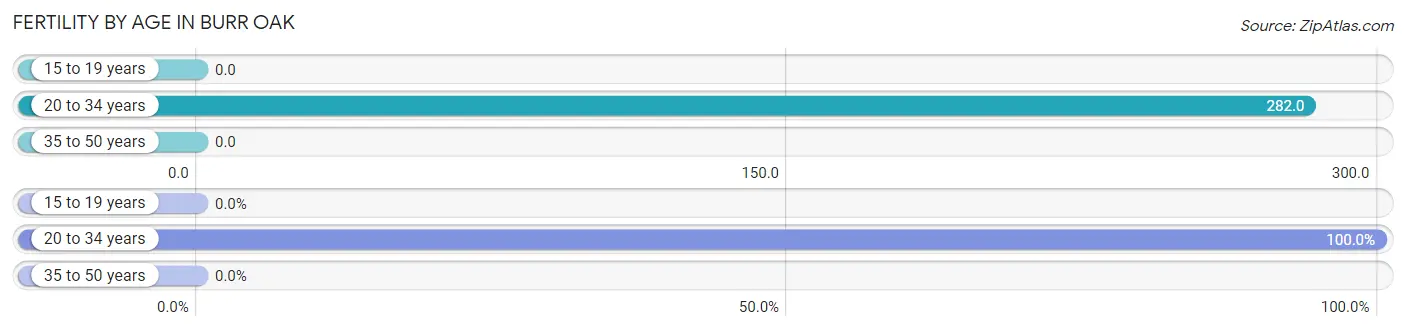
| Age Bracket | Women with Births | Births / 1,000 Women |
| 15 to 19 years | 0 (0.0%) | 0.0 |
| 20 to 34 years | 11 (100.0%) | 282.0 |
| 35 to 50 years | 0 (0.0%) | 0.0 |
| Total | 11 (100.0%) | 256.0 |
Fertility by Age by Marriage Status in Burr Oak
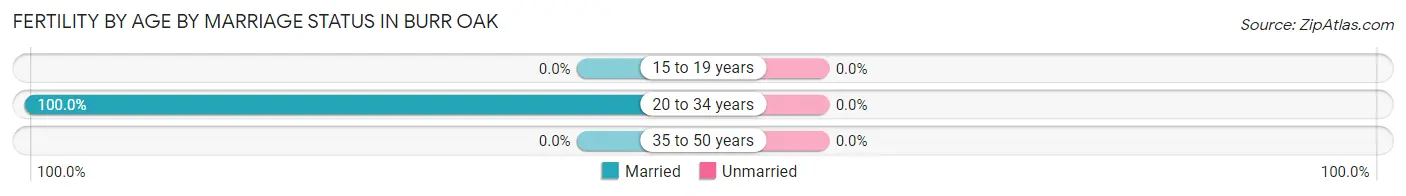
| Age Bracket | Married | Unmarried |
| 15 to 19 years | 0 (0.0%) | 0 (0.0%) |
| 20 to 34 years | 11 (100.0%) | 0 (0.0%) |
| 35 to 50 years | 0 (0.0%) | 0 (0.0%) |
| Total | 11 (100.0%) | 0 (0.0%) |
Fertility by Education in Burr Oak
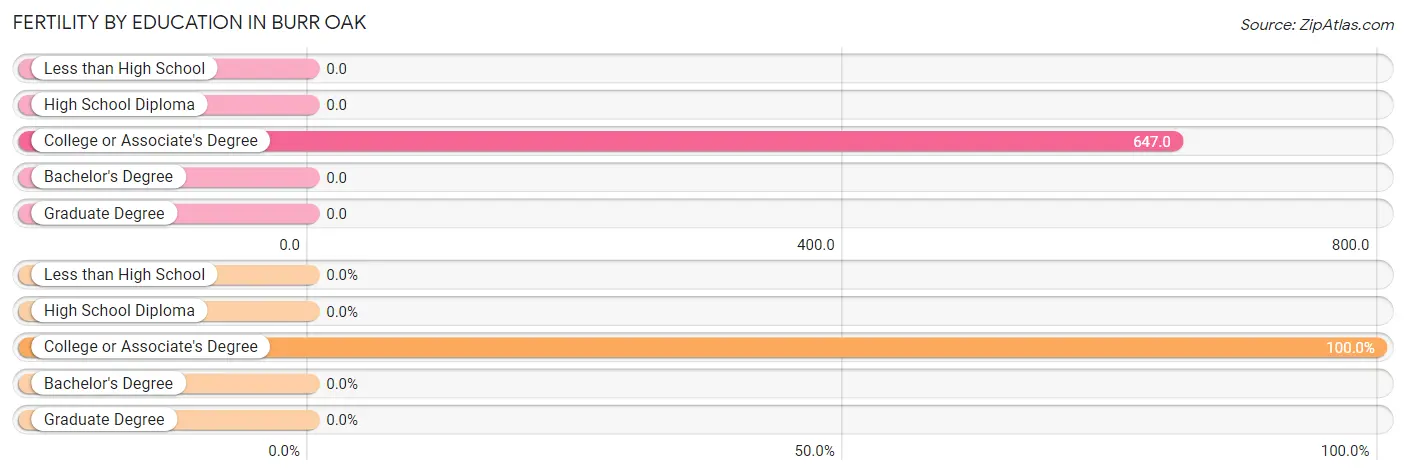
| Educational Attainment | Women with Births | Births / 1,000 Women |
| Less than High School | 0 (0.0%) | 0.0 |
| High School Diploma | 0 (0.0%) | 0.0 |
| College or Associate's Degree | 11 (100.0%) | 647.0 |
| Bachelor's Degree | 0 (0.0%) | 0.0 |
| Graduate Degree | 0 (0.0%) | 0.0 |
| Total | 11 (100.0%) | 256.0 |
Fertility by Education by Marriage Status in Burr Oak
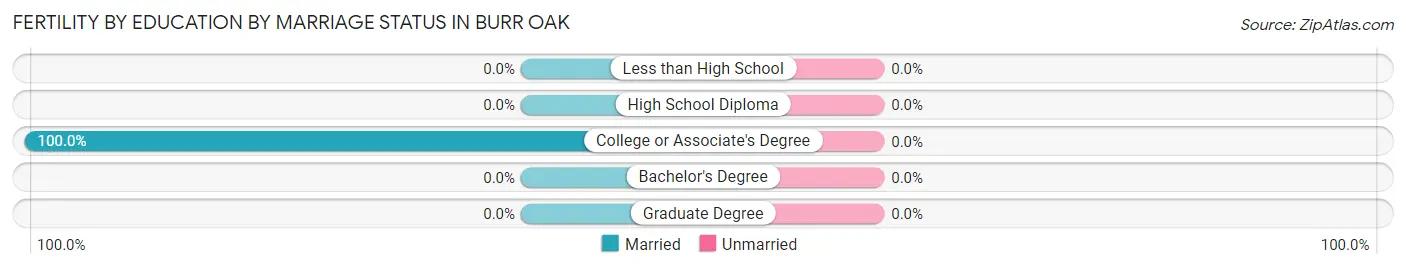
| Educational Attainment | Married | Unmarried |
| Less than High School | 0 (0.0%) | 0 (0.0%) |
| High School Diploma | 0 (0.0%) | 0 (0.0%) |
| College or Associate's Degree | 11 (100.0%) | 0 (0.0%) |
| Bachelor's Degree | 0 (0.0%) | 0 (0.0%) |
| Graduate Degree | 0 (0.0%) | 0 (0.0%) |
| Total | 11 (100.0%) | 0 (0.0%) |
Employment Characteristics in Burr Oak
Employment by Class of Employer in Burr Oak
Among the 98 employed individuals in Burr Oak, private company employees (88 | 89.8%), and self-employed (not incorporated) (10 | 10.2%) make up the most common classes of employment.
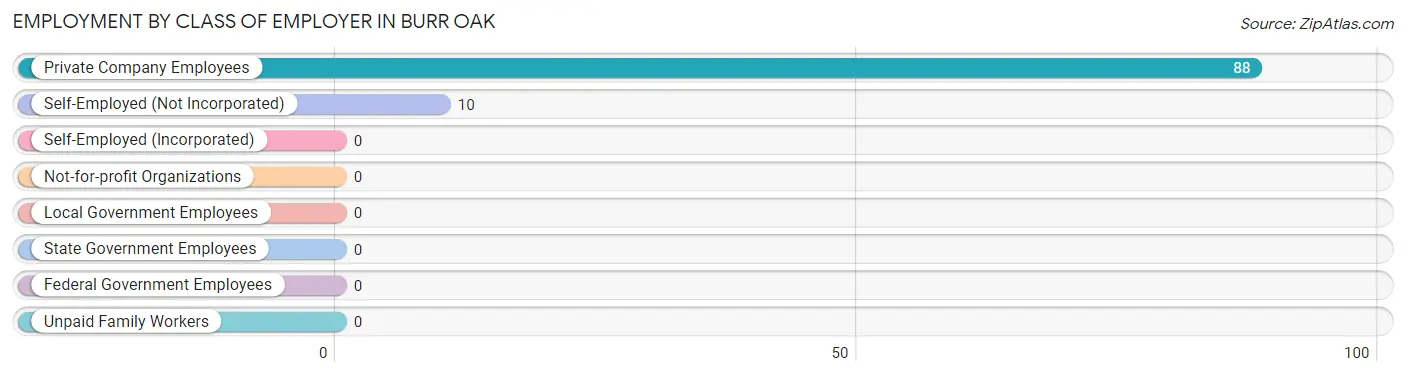
| Employer Class | # Employees | % Employees |
| Private Company Employees | 88 | 89.8% |
| Self-Employed (Incorporated) | 0 | 0.0% |
| Self-Employed (Not Incorporated) | 10 | 10.2% |
| Not-for-profit Organizations | 0 | 0.0% |
| Local Government Employees | 0 | 0.0% |
| State Government Employees | 0 | 0.0% |
| Federal Government Employees | 0 | 0.0% |
| Unpaid Family Workers | 0 | 0.0% |
| Total | 98 | 100.0% |
Employment Status by Age in Burr Oak
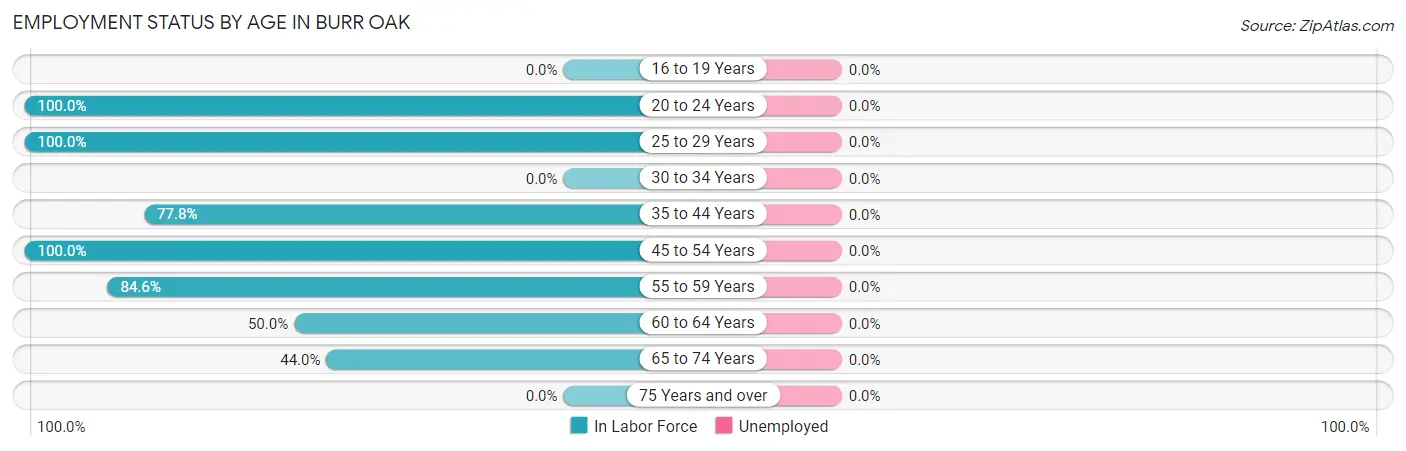
| Age Bracket | In Labor Force | Unemployed |
| 16 to 19 Years | 0 (0.0%) | 0 (0.0%) |
| 20 to 24 Years | 13 (100.0%) | 0 (0.0%) |
| 25 to 29 Years | 23 (100.0%) | 0 (0.0%) |
| 30 to 34 Years | 0 (0.0%) | 0 (0.0%) |
| 35 to 44 Years | 14 (77.8%) | 0 (0.0%) |
| 45 to 54 Years | 14 (100.0%) | 0 (0.0%) |
| 55 to 59 Years | 11 (84.6%) | 0 (0.0%) |
| 60 to 64 Years | 12 (50.0%) | 0 (0.0%) |
| 65 to 74 Years | 11 (44.0%) | 0 (0.0%) |
| 75 Years and over | 0 (0.0%) | 0 (0.0%) |
| Total | 98 (57.6%) | 0 (0.0%) |
Employment Status by Educational Attainment in Burr Oak
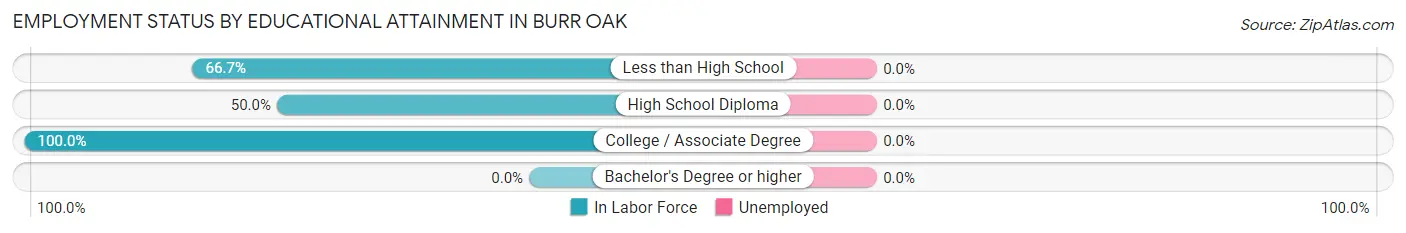
| Educational Attainment | In Labor Force | Unemployed |
| Less than High School | 8 (66.7%) | 0 (0.0%) |
| High School Diploma | 36 (50.0%) | 0 (0.0%) |
| College / Associate Degree | 30 (100.0%) | 0 (0.0%) |
| Bachelor's Degree or higher | 0 (0.0%) | 0 (0.0%) |
| Total | 74 (64.9%) | 0 (0.0%) |
Employment Occupations by Sex in Burr Oak
Management, Business, Science and Arts Occupations
The most common Management, Business, Science and Arts occupations in Burr Oak are Management (18 | 18.4%), and Business & Financial (6 | 6.1%).
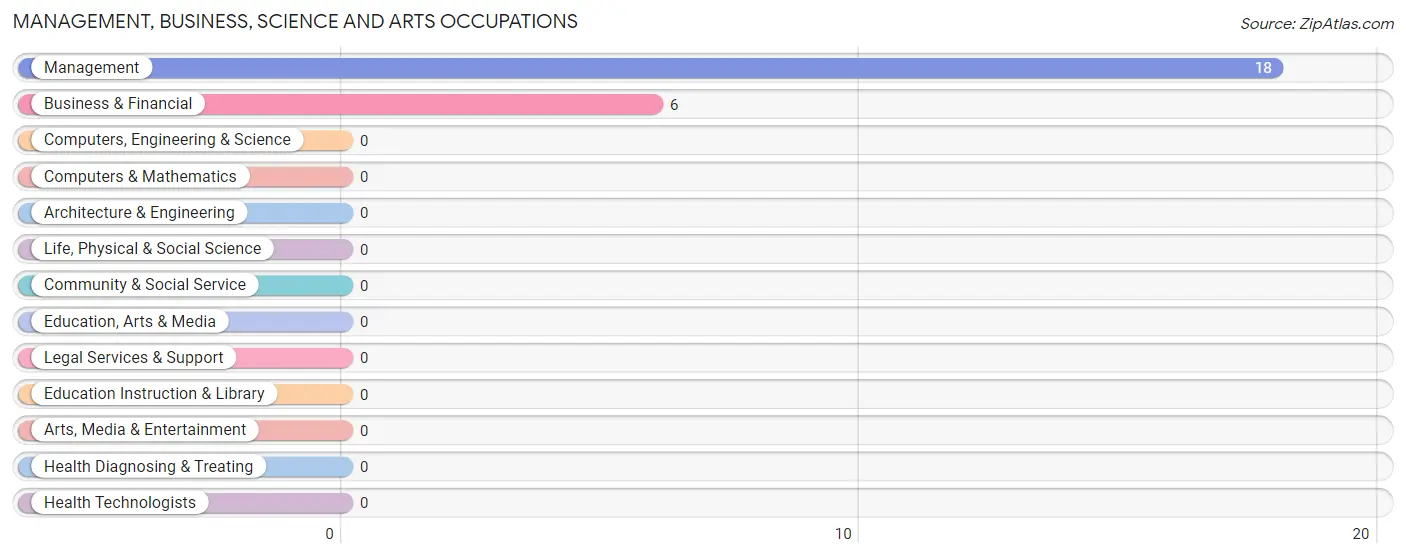
Management, Business, Science and Arts Occupations by Sex
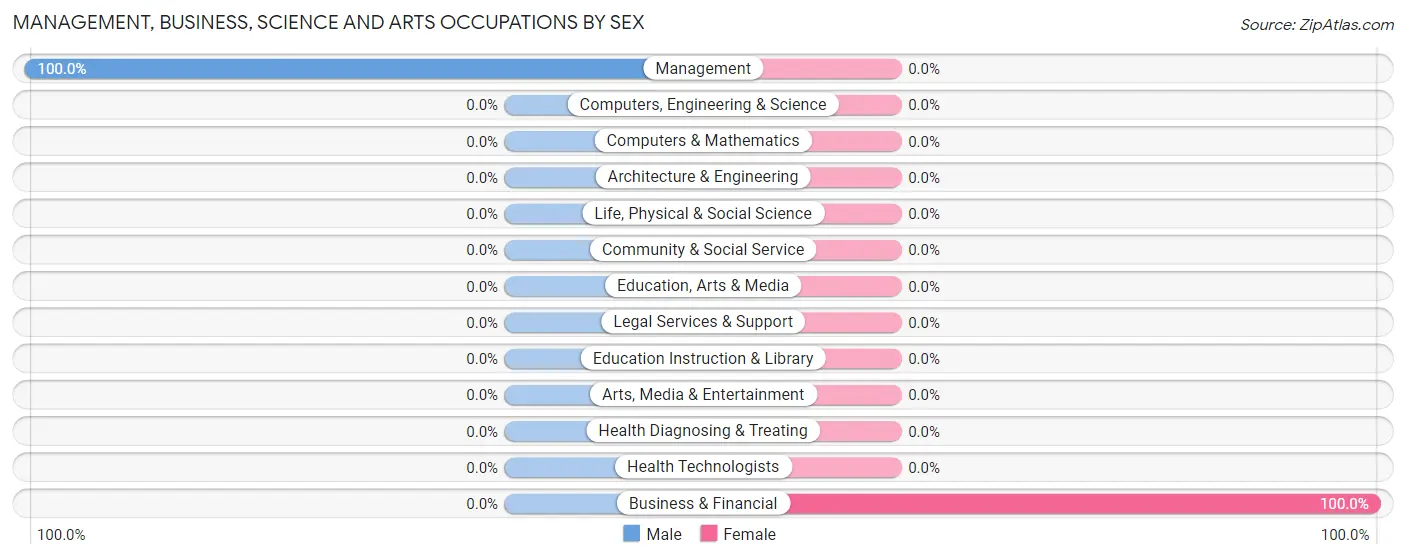
| Occupation | Male | Female |
| Management | 18 (100.0%) | 0 (0.0%) |
| Business & Financial | 0 (0.0%) | 6 (100.0%) |
| Computers, Engineering & Science | 0 (0.0%) | 0 (0.0%) |
| Computers & Mathematics | 0 (0.0%) | 0 (0.0%) |
| Architecture & Engineering | 0 (0.0%) | 0 (0.0%) |
| Life, Physical & Social Science | 0 (0.0%) | 0 (0.0%) |
| Community & Social Service | 0 (0.0%) | 0 (0.0%) |
| Education, Arts & Media | 0 (0.0%) | 0 (0.0%) |
| Legal Services & Support | 0 (0.0%) | 0 (0.0%) |
| Education Instruction & Library | 0 (0.0%) | 0 (0.0%) |
| Arts, Media & Entertainment | 0 (0.0%) | 0 (0.0%) |
| Health Diagnosing & Treating | 0 (0.0%) | 0 (0.0%) |
| Health Technologists | 0 (0.0%) | 0 (0.0%) |
| Total (Category) | 18 (75.0%) | 6 (25.0%) |
| Total (Overall) | 62 (63.3%) | 36 (36.7%) |
Services Occupations
The most common Services occupations in Burr Oak are , and Personal Care & Service (11 | 11.2%).
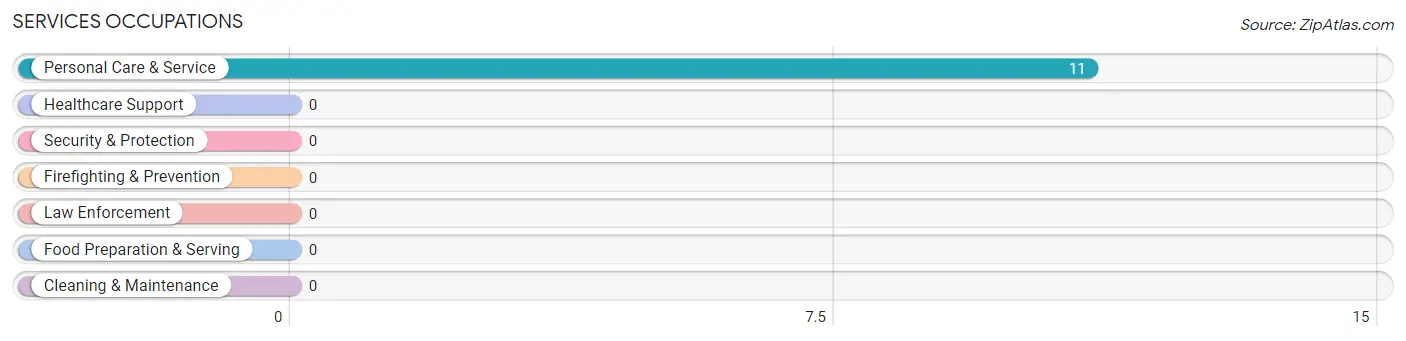
Services Occupations by Sex
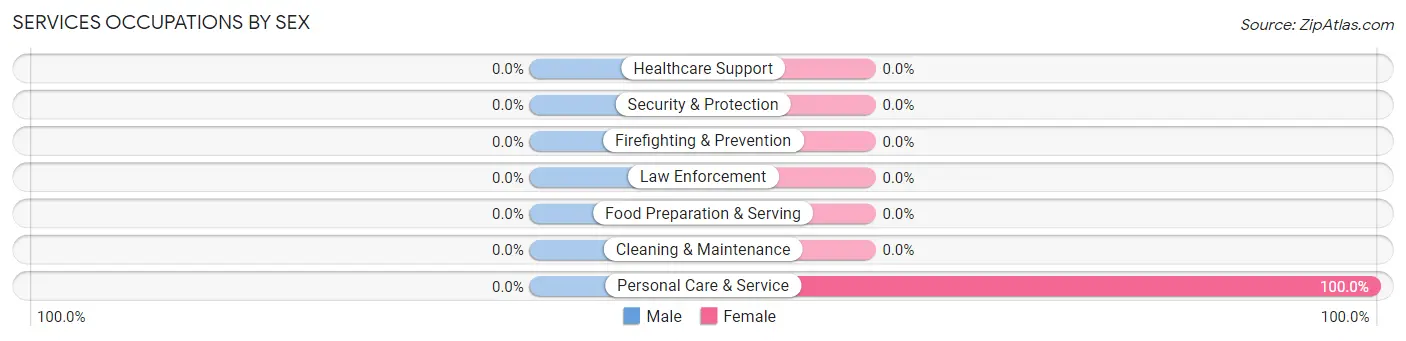
| Occupation | Male | Female |
| Healthcare Support | 0 (0.0%) | 0 (0.0%) |
| Security & Protection | 0 (0.0%) | 0 (0.0%) |
| Firefighting & Prevention | 0 (0.0%) | 0 (0.0%) |
| Law Enforcement | 0 (0.0%) | 0 (0.0%) |
| Food Preparation & Serving | 0 (0.0%) | 0 (0.0%) |
| Cleaning & Maintenance | 0 (0.0%) | 0 (0.0%) |
| Personal Care & Service | 0 (0.0%) | 11 (100.0%) |
| Total (Category) | 0 (0.0%) | 11 (100.0%) |
| Total (Overall) | 62 (63.3%) | 36 (36.7%) |
Sales and Office Occupations
The most common Sales and Office occupations in Burr Oak are Office & Administration (8 | 8.2%), and Sales & Related (4 | 4.1%).
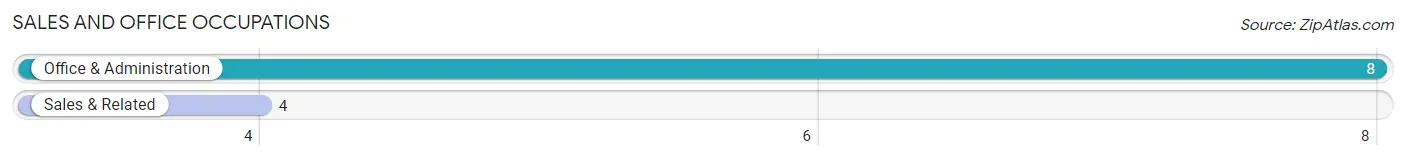
Sales and Office Occupations by Sex
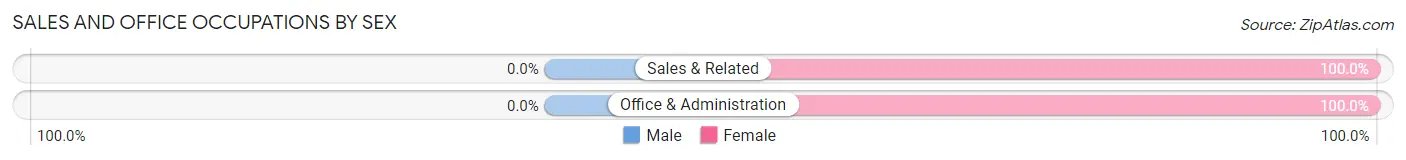
| Occupation | Male | Female |
| Sales & Related | 0 (0.0%) | 4 (100.0%) |
| Office & Administration | 0 (0.0%) | 8 (100.0%) |
| Total (Category) | 0 (0.0%) | 12 (100.0%) |
| Total (Overall) | 62 (63.3%) | 36 (36.7%) |
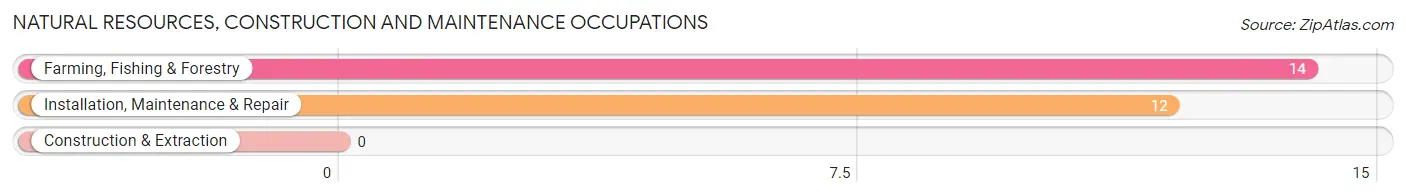
Natural Resources, Construction and Maintenance Occupations
The most common Natural Resources, Construction and Maintenance occupations in Burr Oak are Farming, Fishing & Forestry (14 | 14.3%), and Installation, Maintenance & Repair (12 | 12.2%).
Natural Resources, Construction and Maintenance Occupations by Sex
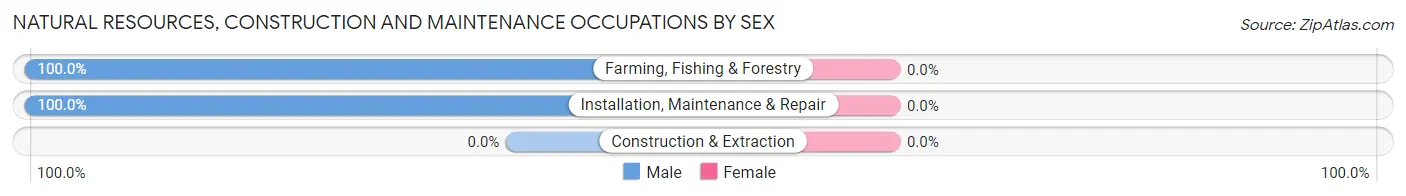
| Occupation | Male | Female |
| Farming, Fishing & Forestry | 14 (100.0%) | 0 (0.0%) |
| Construction & Extraction | 0 (0.0%) | 0 (0.0%) |
| Installation, Maintenance & Repair | 12 (100.0%) | 0 (0.0%) |
| Total (Category) | 26 (100.0%) | 0 (0.0%) |
| Total (Overall) | 62 (63.3%) | 36 (36.7%) |
Production, Transportation and Moving Occupations
The most common Production, Transportation and Moving occupations in Burr Oak are Transportation (14 | 14.3%), and Production (11 | 11.2%).
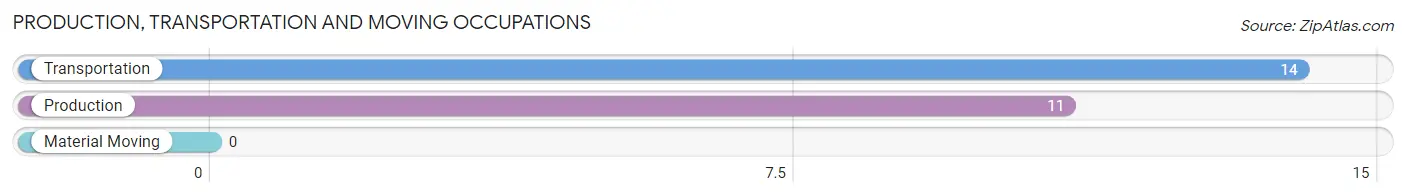
Production, Transportation and Moving Occupations by Sex
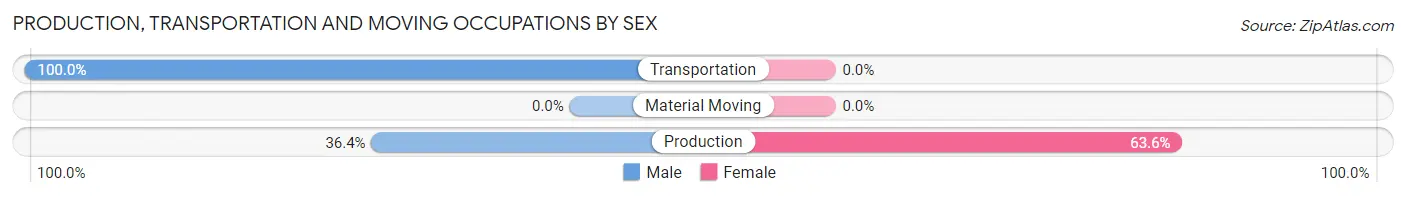
| Occupation | Male | Female |
| Production | 4 (36.4%) | 7 (63.6%) |
| Transportation | 14 (100.0%) | 0 (0.0%) |
| Material Moving | 0 (0.0%) | 0 (0.0%) |
| Total (Category) | 18 (72.0%) | 7 (28.0%) |
| Total (Overall) | 62 (63.3%) | 36 (36.7%) |
Employment Industries by Sex in Burr Oak
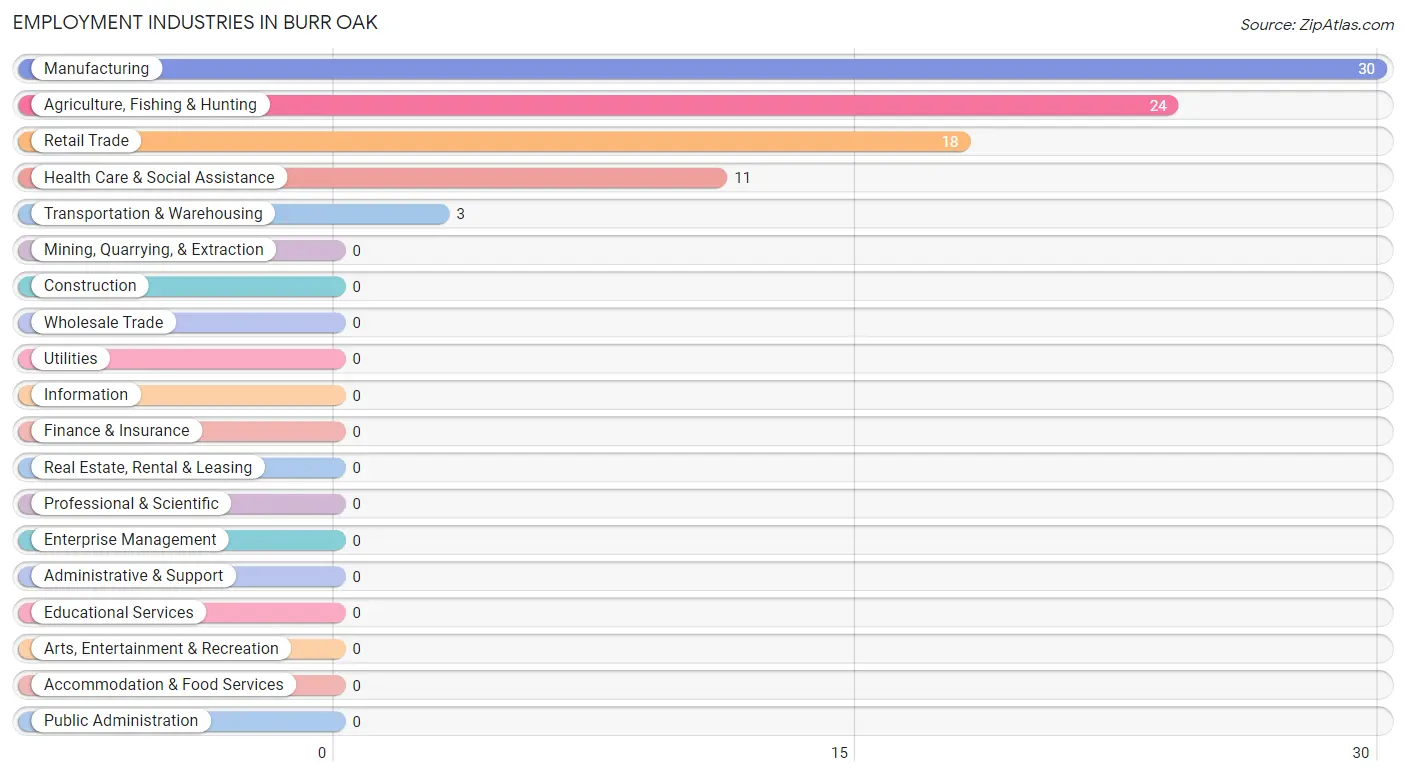
Employment Industries in Burr Oak
The major employment industries in Burr Oak include Manufacturing (30 | 30.6%), Agriculture, Fishing & Hunting (24 | 24.5%), Retail Trade (18 | 18.4%), Health Care & Social Assistance (11 | 11.2%), and Transportation & Warehousing (3 | 3.1%).
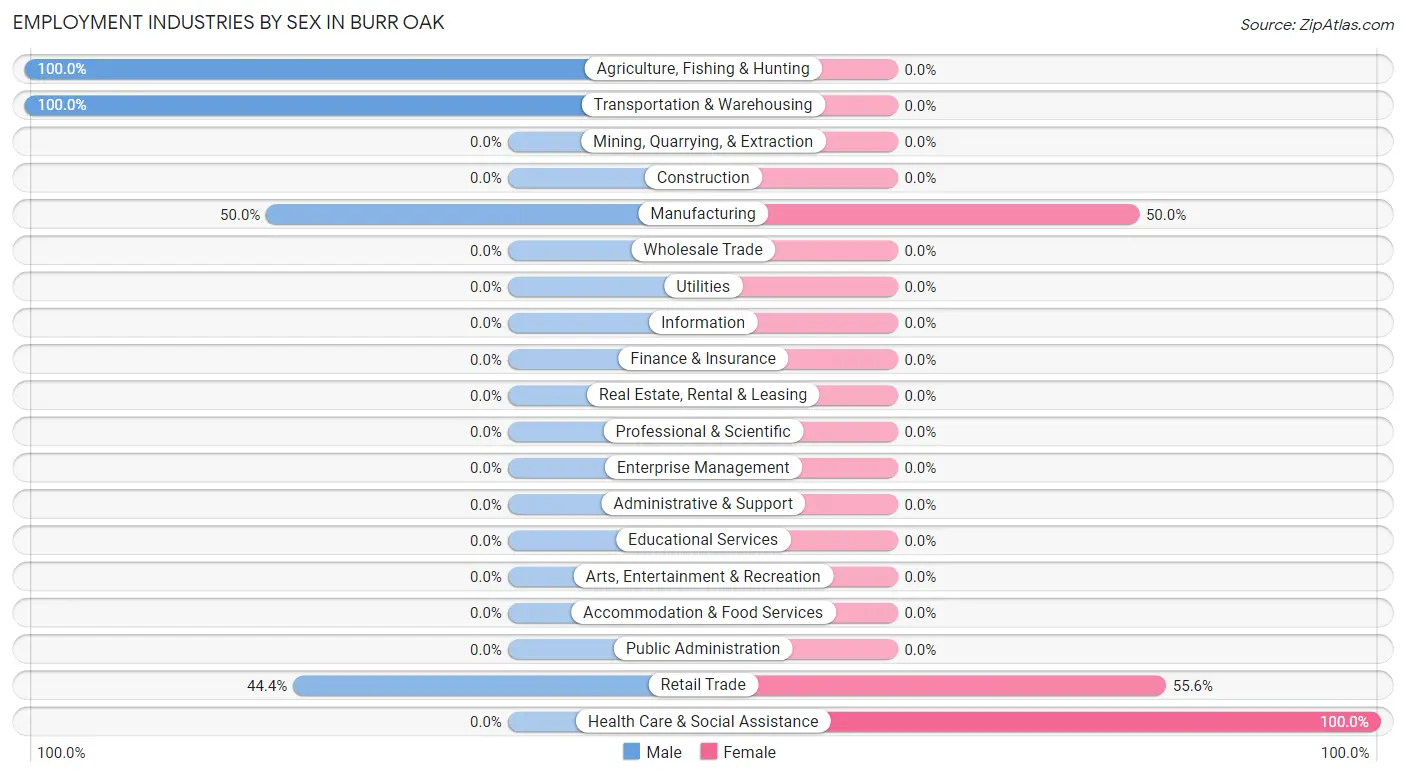
Employment Industries by Sex in Burr Oak
The Burr Oak industries that see more men than women are Agriculture, Fishing & Hunting (100.0%), Transportation & Warehousing (100.0%), and Manufacturing (50.0%), whereas the industries that tend to have a higher number of women are Health Care & Social Assistance (100.0%), Retail Trade (55.6%), and Manufacturing (50.0%).
| Industry | Male | Female |
| Agriculture, Fishing & Hunting | 24 (100.0%) | 0 (0.0%) |
| Mining, Quarrying, & Extraction | 0 (0.0%) | 0 (0.0%) |
| Construction | 0 (0.0%) | 0 (0.0%) |
| Manufacturing | 15 (50.0%) | 15 (50.0%) |
| Wholesale Trade | 0 (0.0%) | 0 (0.0%) |
| Retail Trade | 8 (44.4%) | 10 (55.6%) |
| Transportation & Warehousing | 3 (100.0%) | 0 (0.0%) |
| Utilities | 0 (0.0%) | 0 (0.0%) |
| Information | 0 (0.0%) | 0 (0.0%) |
| Finance & Insurance | 0 (0.0%) | 0 (0.0%) |
| Real Estate, Rental & Leasing | 0 (0.0%) | 0 (0.0%) |
| Professional & Scientific | 0 (0.0%) | 0 (0.0%) |
| Enterprise Management | 0 (0.0%) | 0 (0.0%) |
| Administrative & Support | 0 (0.0%) | 0 (0.0%) |
| Educational Services | 0 (0.0%) | 0 (0.0%) |
| Health Care & Social Assistance | 0 (0.0%) | 11 (100.0%) |
| Arts, Entertainment & Recreation | 0 (0.0%) | 0 (0.0%) |
| Accommodation & Food Services | 0 (0.0%) | 0 (0.0%) |
| Public Administration | 0 (0.0%) | 0 (0.0%) |
| Total | 62 (63.3%) | 36 (36.7%) |
Education in Burr Oak
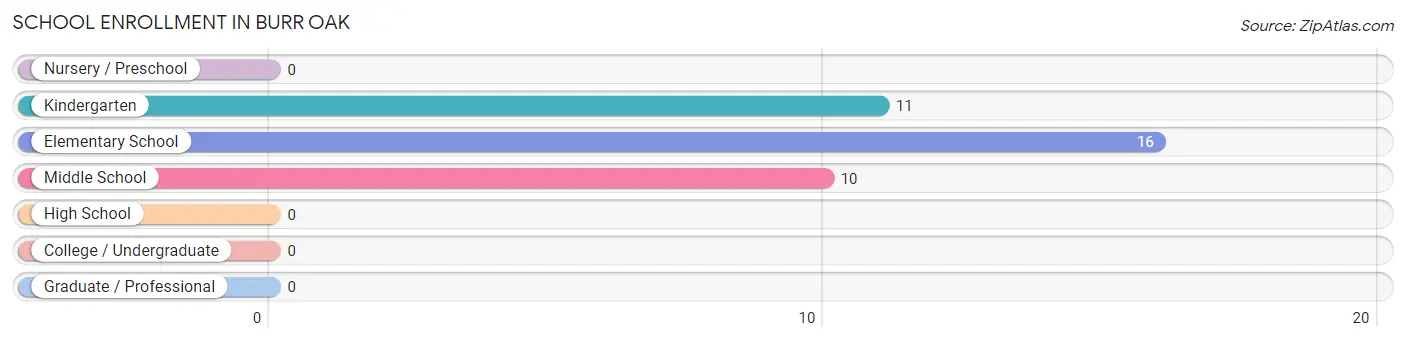
School Enrollment in Burr Oak
The most common levels of schooling among the 37 students in Burr Oak are elementary school (16 | 43.2%), kindergarten (11 | 29.7%), and middle school (10 | 27.0%).
| School Level | # Students | % Students |
| Nursery / Preschool | 0 | 0.0% |
| Kindergarten | 11 | 29.7% |
| Elementary School | 16 | 43.2% |
| Middle School | 10 | 27.0% |
| High School | 0 | 0.0% |
| College / Undergraduate | 0 | 0.0% |
| Graduate / Professional | 0 | 0.0% |
| Total | 37 | 100.0% |
School Enrollment by Age by Funding Source in Burr Oak
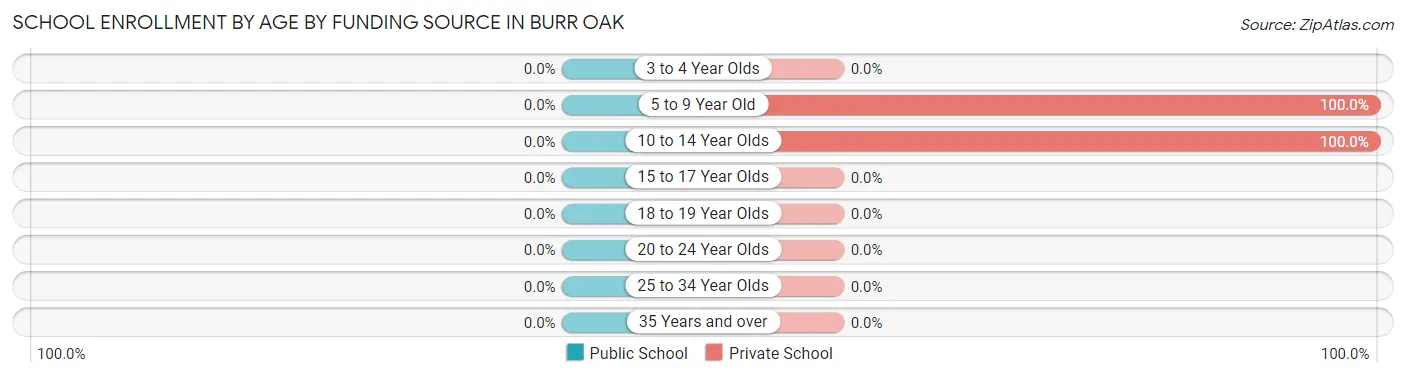
| Age Bracket | Public School | Private School |
| 3 to 4 Year Olds | 0 (0.0%) | 0 (0.0%) |
| 5 to 9 Year Old | 0 (0.0%) | 27 (100.0%) |
| 10 to 14 Year Olds | 0 (0.0%) | 10 (100.0%) |
| 15 to 17 Year Olds | 0 (0.0%) | 0 (0.0%) |
| 18 to 19 Year Olds | 0 (0.0%) | 0 (0.0%) |
| 20 to 24 Year Olds | 0 (0.0%) | 0 (0.0%) |
| 25 to 34 Year Olds | 0 (0.0%) | 0 (0.0%) |
| 35 Years and over | 0 (0.0%) | 0 (0.0%) |
| Total | 0 (0.0%) | 37 (100.0%) |
Educational Attainment by Field of Study in Burr Oak
Literature & languages (9 | 60.0%), bio, nature & agricultural (3 | 20.0%), and education (3 | 20.0%) are the most common fields of study among 15 individuals in Burr Oak who have obtained a bachelor's degree or higher.
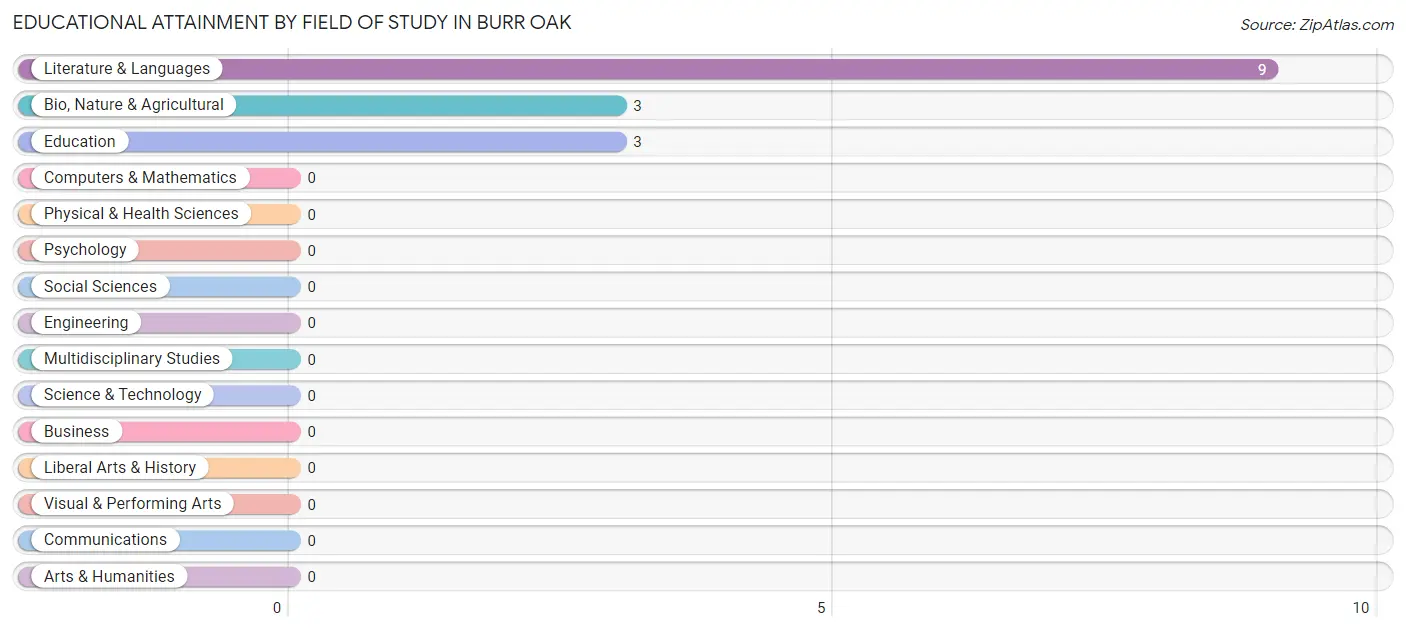
| Field of Study | # Graduates | % Graduates |
| Computers & Mathematics | 0 | 0.0% |
| Bio, Nature & Agricultural | 3 | 20.0% |
| Physical & Health Sciences | 0 | 0.0% |
| Psychology | 0 | 0.0% |
| Social Sciences | 0 | 0.0% |
| Engineering | 0 | 0.0% |
| Multidisciplinary Studies | 0 | 0.0% |
| Science & Technology | 0 | 0.0% |
| Business | 0 | 0.0% |
| Education | 3 | 20.0% |
| Literature & Languages | 9 | 60.0% |
| Liberal Arts & History | 0 | 0.0% |
| Visual & Performing Arts | 0 | 0.0% |
| Communications | 0 | 0.0% |
| Arts & Humanities | 0 | 0.0% |
| Total | 15 | 100.0% |
Transportation & Commute in Burr Oak
Vehicle Availability by Sex in Burr Oak
The most prevalent vehicle ownership categories in Burr Oak are males with 3 vehicles (19, accounting for 30.6%) and females with 3 vehicles (17, making up 52.8%).
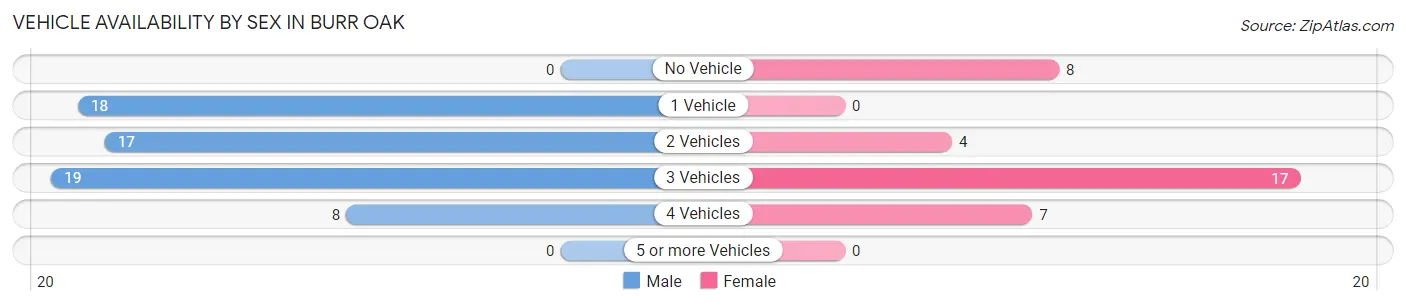
| Vehicles Available | Male | Female |
| No Vehicle | 0 (0.0%) | 8 (22.2%) |
| 1 Vehicle | 18 (29.0%) | 0 (0.0%) |
| 2 Vehicles | 17 (27.4%) | 4 (11.1%) |
| 3 Vehicles | 19 (30.6%) | 17 (47.2%) |
| 4 Vehicles | 8 (12.9%) | 7 (19.4%) |
| 5 or more Vehicles | 0 (0.0%) | 0 (0.0%) |
| Total | 62 (100.0%) | 36 (100.0%) |
Commute Time in Burr Oak
The most frequently occuring commute durations in Burr Oak are 20 to 24 minutes (35 commuters, 35.7%), 30 to 34 minutes (17 commuters, 17.3%), and 40 to 44 minutes (16 commuters, 16.3%).
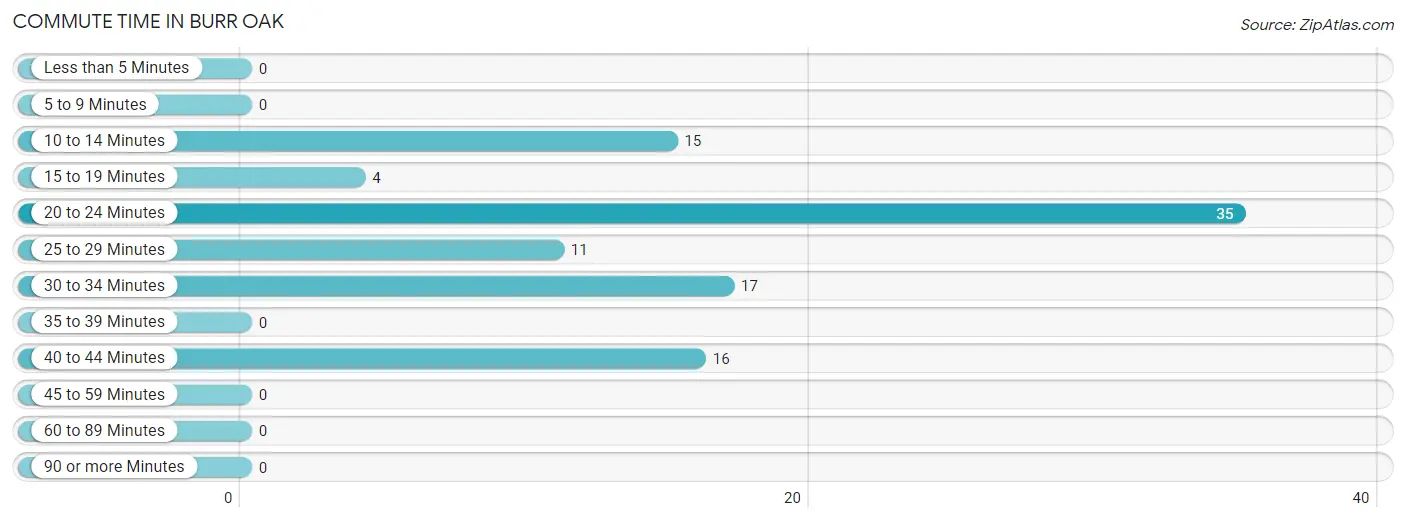
| Commute Time | # Commuters | % Commuters |
| Less than 5 Minutes | 0 | 0.0% |
| 5 to 9 Minutes | 0 | 0.0% |
| 10 to 14 Minutes | 15 | 15.3% |
| 15 to 19 Minutes | 4 | 4.1% |
| 20 to 24 Minutes | 35 | 35.7% |
| 25 to 29 Minutes | 11 | 11.2% |
| 30 to 34 Minutes | 17 | 17.3% |
| 35 to 39 Minutes | 0 | 0.0% |
| 40 to 44 Minutes | 16 | 16.3% |
| 45 to 59 Minutes | 0 | 0.0% |
| 60 to 89 Minutes | 0 | 0.0% |
| 90 or more Minutes | 0 | 0.0% |
Commute Time by Sex in Burr Oak
The most common commute times in Burr Oak are 20 to 24 minutes (18 commuters, 29.0%) for males and 20 to 24 minutes (17 commuters, 47.2%) for females.
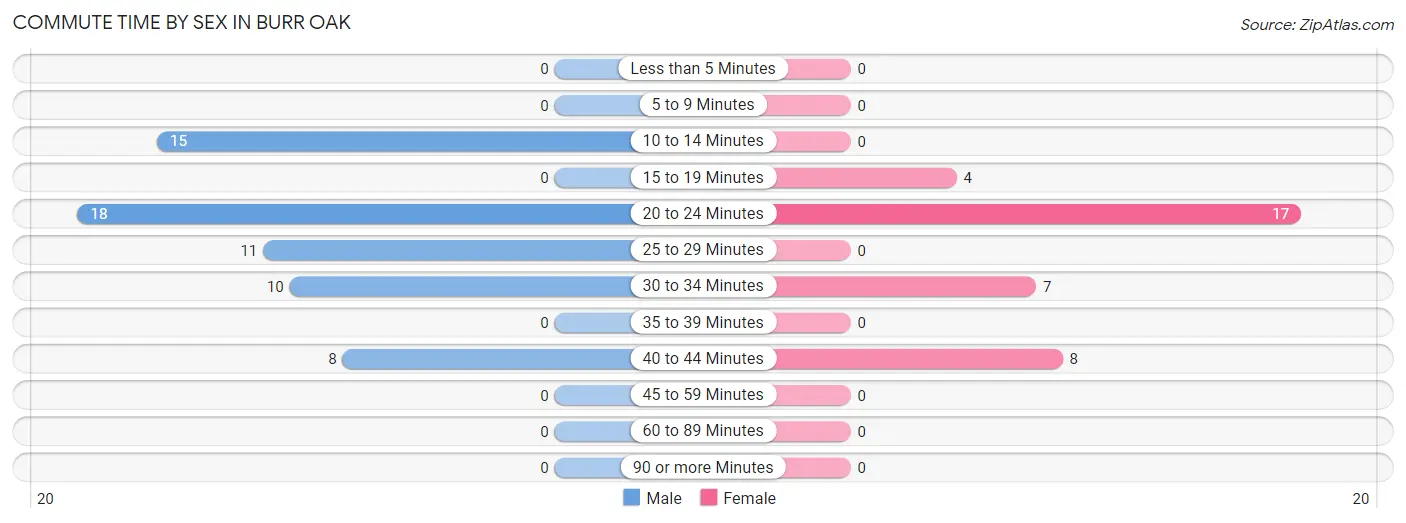
| Commute Time | Male | Female |
| Less than 5 Minutes | 0 (0.0%) | 0 (0.0%) |
| 5 to 9 Minutes | 0 (0.0%) | 0 (0.0%) |
| 10 to 14 Minutes | 15 (24.2%) | 0 (0.0%) |
| 15 to 19 Minutes | 0 (0.0%) | 4 (11.1%) |
| 20 to 24 Minutes | 18 (29.0%) | 17 (47.2%) |
| 25 to 29 Minutes | 11 (17.7%) | 0 (0.0%) |
| 30 to 34 Minutes | 10 (16.1%) | 7 (19.4%) |
| 35 to 39 Minutes | 0 (0.0%) | 0 (0.0%) |
| 40 to 44 Minutes | 8 (12.9%) | 8 (22.2%) |
| 45 to 59 Minutes | 0 (0.0%) | 0 (0.0%) |
| 60 to 89 Minutes | 0 (0.0%) | 0 (0.0%) |
| 90 or more Minutes | 0 (0.0%) | 0 (0.0%) |
Time of Departure to Work by Sex in Burr Oak
The most frequent times of departure to work in Burr Oak are 12:00 AM to 4:59 AM (18, 29.0%) for males and 7:00 AM to 7:29 AM (11, 30.6%) for females.
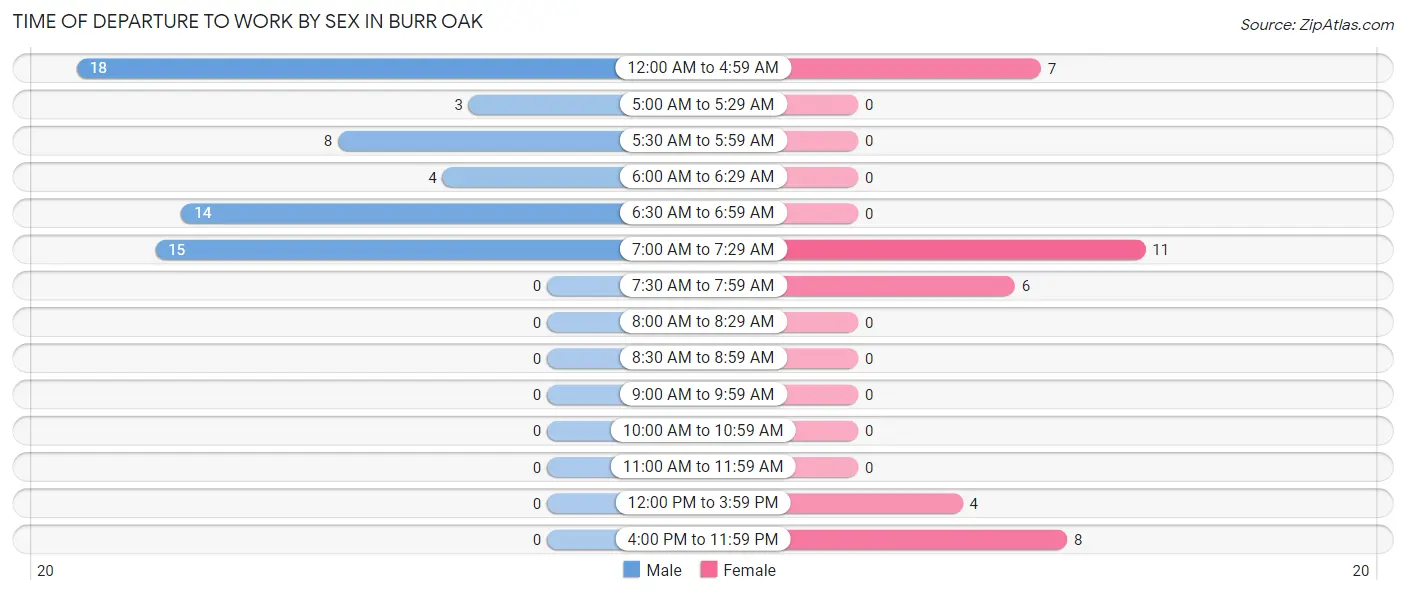
| Time of Departure | Male | Female |
| 12:00 AM to 4:59 AM | 18 (29.0%) | 7 (19.4%) |
| 5:00 AM to 5:29 AM | 3 (4.8%) | 0 (0.0%) |
| 5:30 AM to 5:59 AM | 8 (12.9%) | 0 (0.0%) |
| 6:00 AM to 6:29 AM | 4 (6.5%) | 0 (0.0%) |
| 6:30 AM to 6:59 AM | 14 (22.6%) | 0 (0.0%) |
| 7:00 AM to 7:29 AM | 15 (24.2%) | 11 (30.6%) |
| 7:30 AM to 7:59 AM | 0 (0.0%) | 6 (16.7%) |
| 8:00 AM to 8:29 AM | 0 (0.0%) | 0 (0.0%) |
| 8:30 AM to 8:59 AM | 0 (0.0%) | 0 (0.0%) |
| 9:00 AM to 9:59 AM | 0 (0.0%) | 0 (0.0%) |
| 10:00 AM to 10:59 AM | 0 (0.0%) | 0 (0.0%) |
| 11:00 AM to 11:59 AM | 0 (0.0%) | 0 (0.0%) |
| 12:00 PM to 3:59 PM | 0 (0.0%) | 4 (11.1%) |
| 4:00 PM to 11:59 PM | 0 (0.0%) | 8 (22.2%) |
| Total | 62 (100.0%) | 36 (100.0%) |
Housing Occupancy in Burr Oak
Occupancy by Ownership in Burr Oak
Of the total 99 dwellings in Burr Oak, owner-occupied units account for 73 (73.7%), while renter-occupied units make up 26 (26.3%).
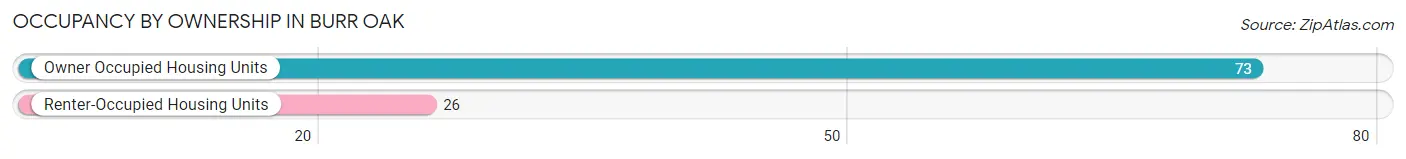
| Occupancy | # Housing Units | % Housing Units |
| Owner Occupied Housing Units | 73 | 73.7% |
| Renter-Occupied Housing Units | 26 | 26.3% |
| Total Occupied Housing Units | 99 | 100.0% |
Occupancy by Household Size in Burr Oak
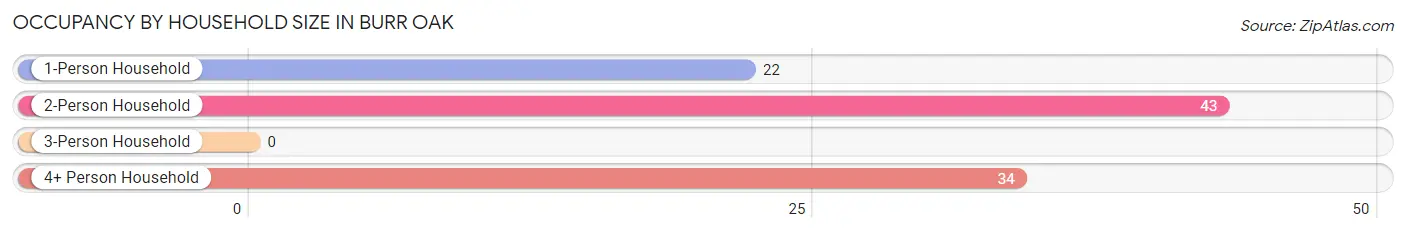
| Household Size | # Housing Units | % Housing Units |
| 1-Person Household | 22 | 22.2% |
| 2-Person Household | 43 | 43.4% |
| 3-Person Household | 0 | 0.0% |
| 4+ Person Household | 34 | 34.3% |
| Total Housing Units | 99 | 100.0% |
Occupancy by Ownership by Household Size in Burr Oak
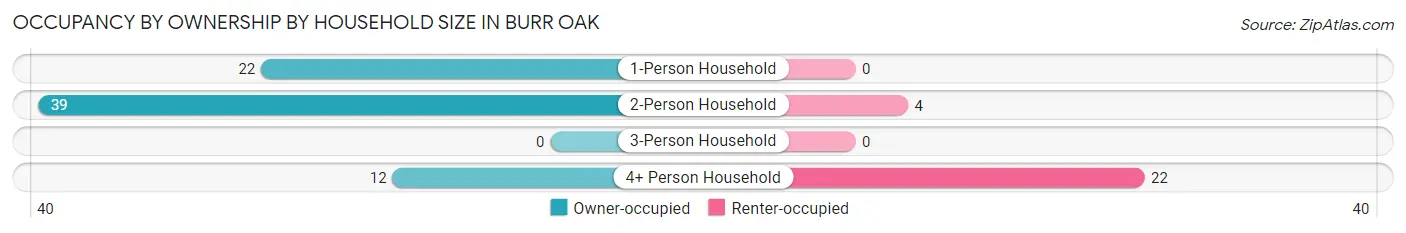
| Household Size | Owner-occupied | Renter-occupied |
| 1-Person Household | 22 (100.0%) | 0 (0.0%) |
| 2-Person Household | 39 (90.7%) | 4 (9.3%) |
| 3-Person Household | 0 (0.0%) | 0 (0.0%) |
| 4+ Person Household | 12 (35.3%) | 22 (64.7%) |
| Total Housing Units | 73 (73.7%) | 26 (26.3%) |
Occupancy by Educational Attainment in Burr Oak
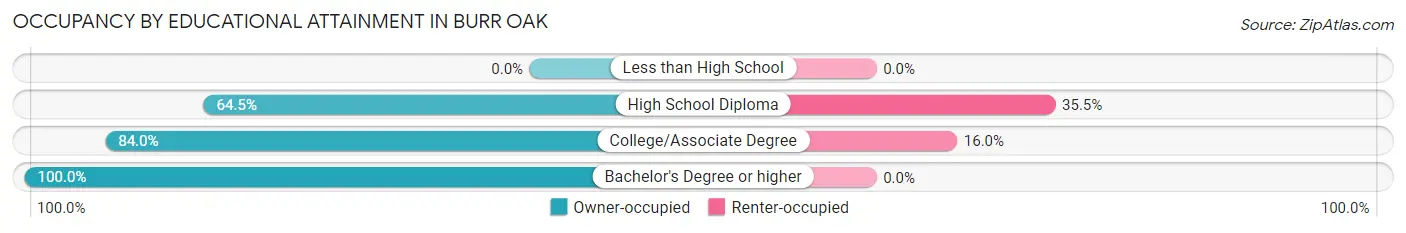
| Household Size | Owner-occupied | Renter-occupied |
| Less than High School | 0 (0.0%) | 0 (0.0%) |
| High School Diploma | 40 (64.5%) | 22 (35.5%) |
| College/Associate Degree | 21 (84.0%) | 4 (16.0%) |
| Bachelor's Degree or higher | 12 (100.0%) | 0 (0.0%) |
Occupancy by Age of Householder in Burr Oak
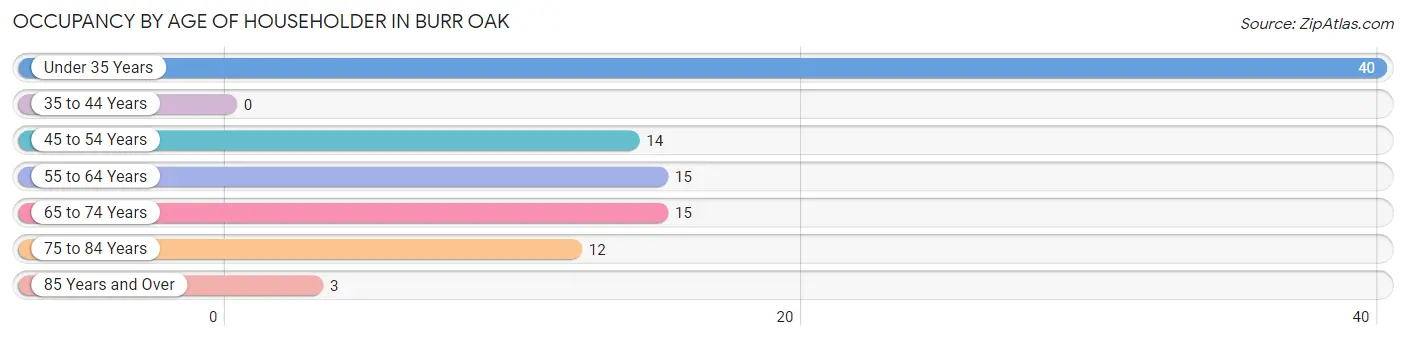
| Age Bracket | # Households | % Households |
| Under 35 Years | 40 | 40.4% |
| 35 to 44 Years | 0 | 0.0% |
| 45 to 54 Years | 14 | 14.1% |
| 55 to 64 Years | 15 | 15.1% |
| 65 to 74 Years | 15 | 15.1% |
| 75 to 84 Years | 12 | 12.1% |
| 85 Years and Over | 3 | 3.0% |
| Total | 99 | 100.0% |
Housing Finances in Burr Oak
Median Income by Occupancy in Burr Oak
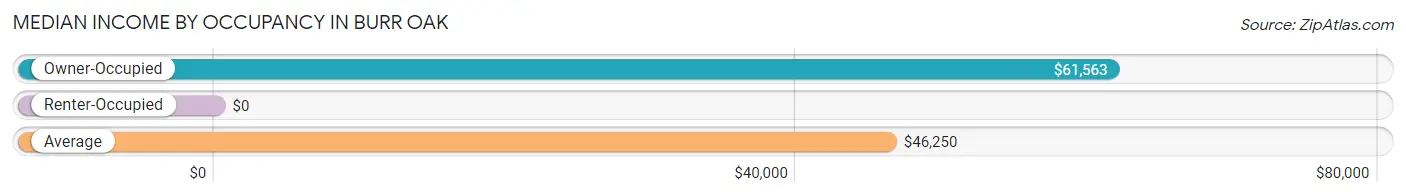
| Occupancy Type | # Households | Median Income |
| Owner-Occupied | 73 (73.7%) | $61,563 |
| Renter-Occupied | 26 (26.3%) | $0 |
| Average | 99 (100.0%) | $46,250 |
Occupancy by Householder Income Bracket in Burr Oak
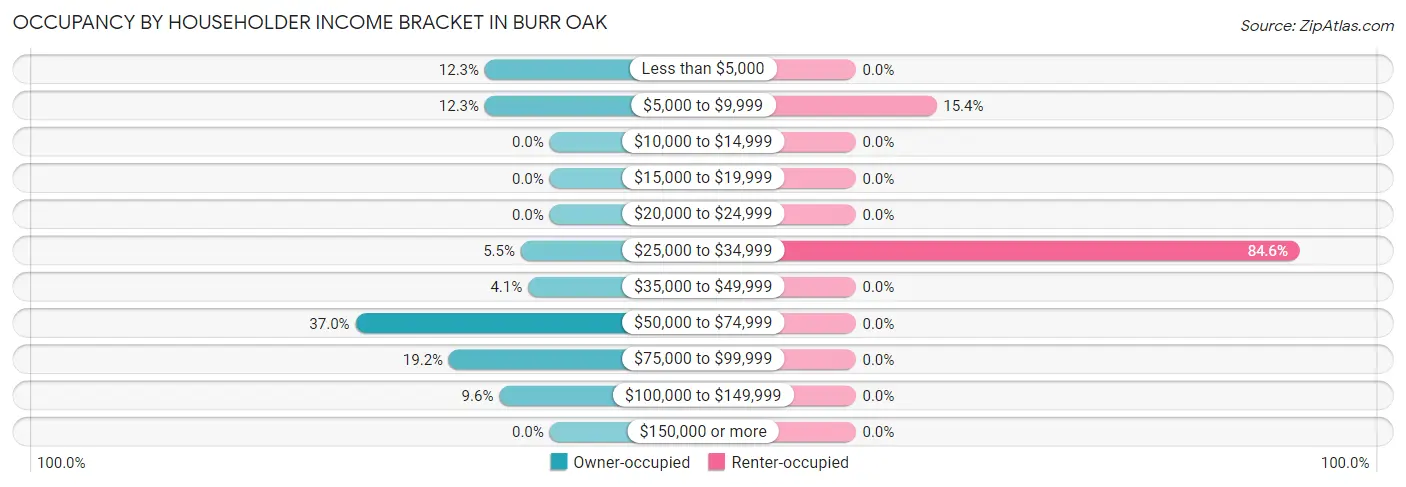
| Income Bracket | Owner-occupied | Renter-occupied |
| Less than $5,000 | 9 (12.3%) | 0 (0.0%) |
| $5,000 to $9,999 | 9 (12.3%) | 4 (15.4%) |
| $10,000 to $14,999 | 0 (0.0%) | 0 (0.0%) |
| $15,000 to $19,999 | 0 (0.0%) | 0 (0.0%) |
| $20,000 to $24,999 | 0 (0.0%) | 0 (0.0%) |
| $25,000 to $34,999 | 4 (5.5%) | 22 (84.6%) |
| $35,000 to $49,999 | 3 (4.1%) | 0 (0.0%) |
| $50,000 to $74,999 | 27 (37.0%) | 0 (0.0%) |
| $75,000 to $99,999 | 14 (19.2%) | 0 (0.0%) |
| $100,000 to $149,999 | 7 (9.6%) | 0 (0.0%) |
| $150,000 or more | 0 (0.0%) | 0 (0.0%) |
| Total | 73 (100.0%) | 26 (100.0%) |
Monthly Housing Cost Tiers in Burr Oak
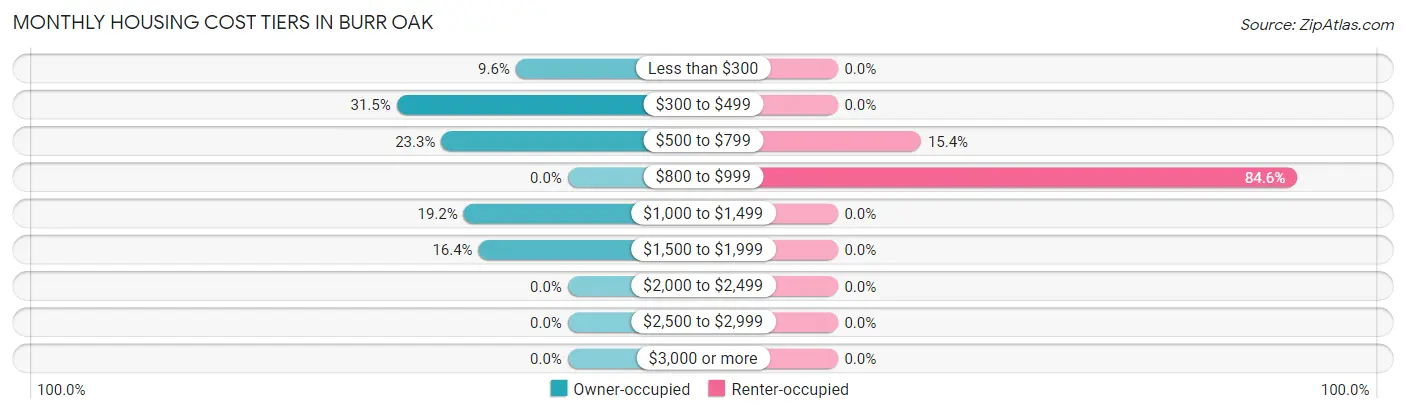
| Monthly Cost | Owner-occupied | Renter-occupied |
| Less than $300 | 7 (9.6%) | 0 (0.0%) |
| $300 to $499 | 23 (31.5%) | 0 (0.0%) |
| $500 to $799 | 17 (23.3%) | 4 (15.4%) |
| $800 to $999 | 0 (0.0%) | 22 (84.6%) |
| $1,000 to $1,499 | 14 (19.2%) | 0 (0.0%) |
| $1,500 to $1,999 | 12 (16.4%) | 0 (0.0%) |
| $2,000 to $2,499 | 0 (0.0%) | 0 (0.0%) |
| $2,500 to $2,999 | 0 (0.0%) | 0 (0.0%) |
| $3,000 or more | 0 (0.0%) | 0 (0.0%) |
| Total | 73 (100.0%) | 26 (100.0%) |
Physical Housing Characteristics in Burr Oak
Housing Structures in Burr Oak
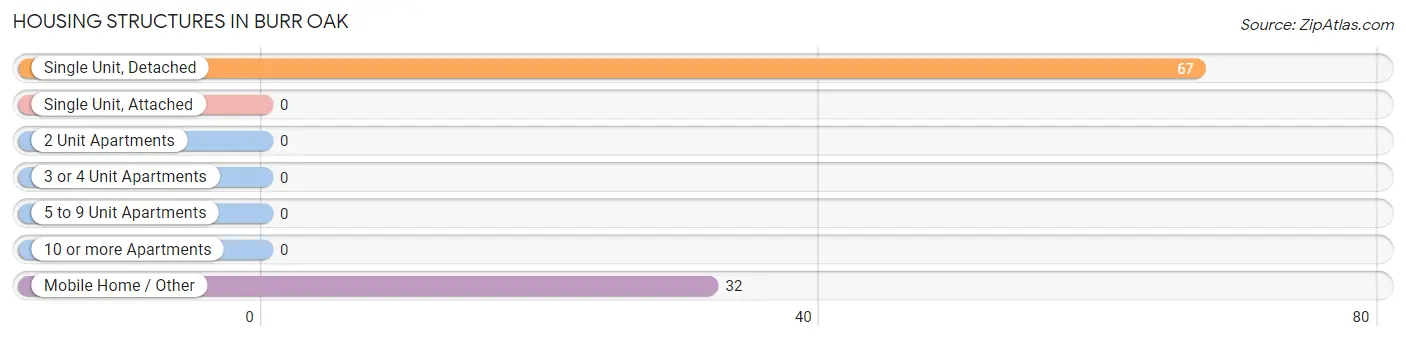
| Structure Type | # Housing Units | % Housing Units |
| Single Unit, Detached | 67 | 67.7% |
| Single Unit, Attached | 0 | 0.0% |
| 2 Unit Apartments | 0 | 0.0% |
| 3 or 4 Unit Apartments | 0 | 0.0% |
| 5 to 9 Unit Apartments | 0 | 0.0% |
| 10 or more Apartments | 0 | 0.0% |
| Mobile Home / Other | 32 | 32.3% |
| Total | 99 | 100.0% |
Housing Structures by Occupancy in Burr Oak
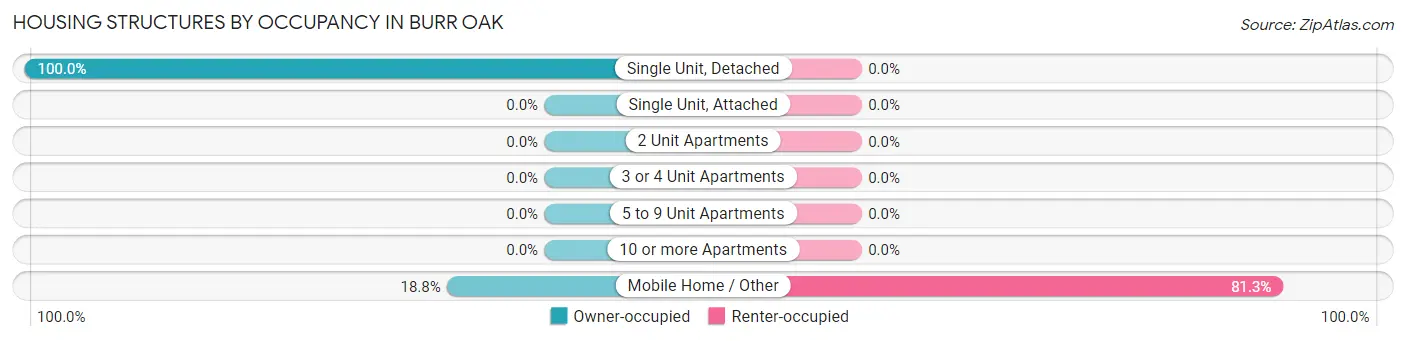
| Structure Type | Owner-occupied | Renter-occupied |
| Single Unit, Detached | 67 (100.0%) | 0 (0.0%) |
| Single Unit, Attached | 0 (0.0%) | 0 (0.0%) |
| 2 Unit Apartments | 0 (0.0%) | 0 (0.0%) |
| 3 or 4 Unit Apartments | 0 (0.0%) | 0 (0.0%) |
| 5 to 9 Unit Apartments | 0 (0.0%) | 0 (0.0%) |
| 10 or more Apartments | 0 (0.0%) | 0 (0.0%) |
| Mobile Home / Other | 6 (18.8%) | 26 (81.2%) |
| Total | 73 (73.7%) | 26 (26.3%) |
Housing Structures by Number of Rooms in Burr Oak
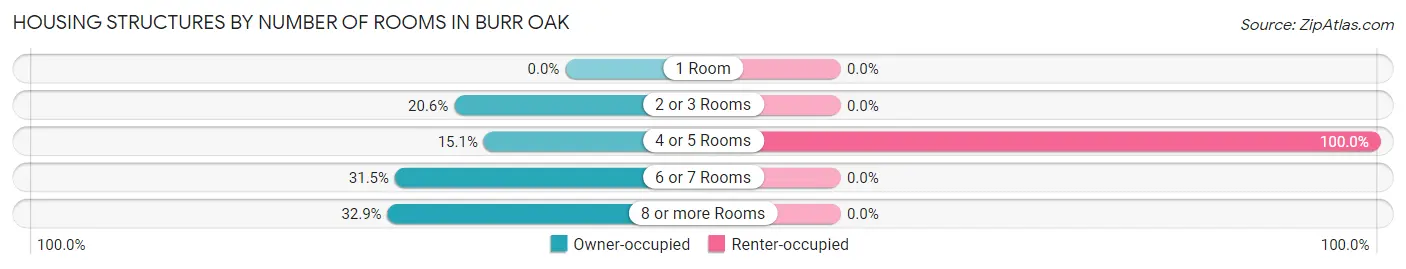
| Number of Rooms | Owner-occupied | Renter-occupied |
| 1 Room | 0 (0.0%) | 0 (0.0%) |
| 2 or 3 Rooms | 15 (20.5%) | 0 (0.0%) |
| 4 or 5 Rooms | 11 (15.1%) | 26 (100.0%) |
| 6 or 7 Rooms | 23 (31.5%) | 0 (0.0%) |
| 8 or more Rooms | 24 (32.9%) | 0 (0.0%) |
| Total | 73 (100.0%) | 26 (100.0%) |
Housing Structure by Heating Type in Burr Oak
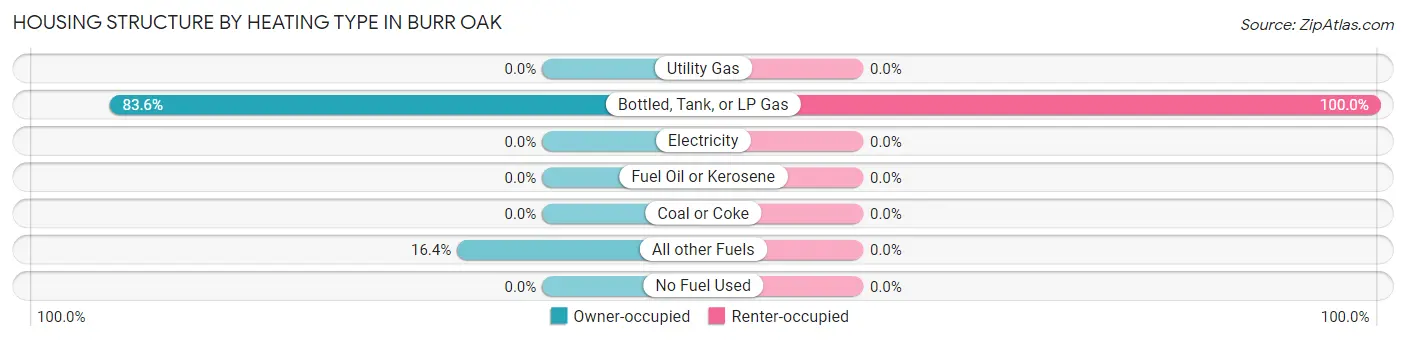
| Heating Type | Owner-occupied | Renter-occupied |
| Utility Gas | 0 (0.0%) | 0 (0.0%) |
| Bottled, Tank, or LP Gas | 61 (83.6%) | 26 (100.0%) |
| Electricity | 0 (0.0%) | 0 (0.0%) |
| Fuel Oil or Kerosene | 0 (0.0%) | 0 (0.0%) |
| Coal or Coke | 0 (0.0%) | 0 (0.0%) |
| All other Fuels | 12 (16.4%) | 0 (0.0%) |
| No Fuel Used | 0 (0.0%) | 0 (0.0%) |
| Total | 73 (100.0%) | 26 (100.0%) |
Household Vehicle Usage in Burr Oak
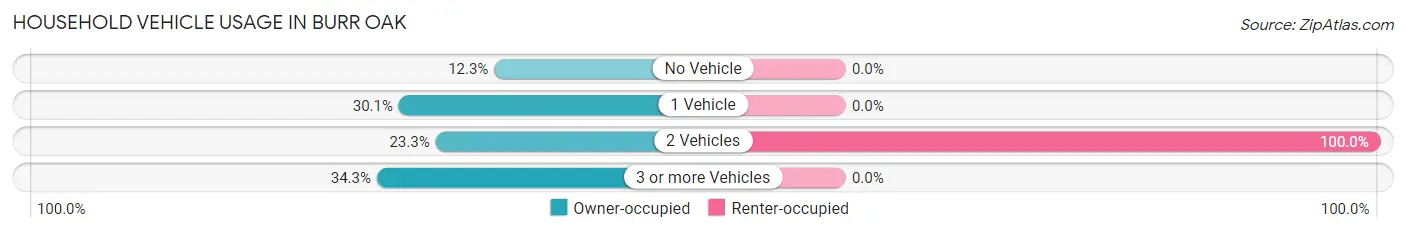
| Vehicles per Household | Owner-occupied | Renter-occupied |
| No Vehicle | 9 (12.3%) | 0 (0.0%) |
| 1 Vehicle | 22 (30.1%) | 0 (0.0%) |
| 2 Vehicles | 17 (23.3%) | 26 (100.0%) |
| 3 or more Vehicles | 25 (34.3%) | 0 (0.0%) |
| Total | 73 (100.0%) | 26 (100.0%) |
Real Estate & Mortgages in Burr Oak
Real Estate and Mortgage Overview in Burr Oak
| Characteristic | Without Mortgage | With Mortgage |
| Housing Units | 36 | 37 |
| Median Property Value | $84,000 | $140,600 |
| Median Household Income | $87,917 | $0 |
| Monthly Housing Costs | $400 | $0 |
| Real Estate Taxes | $457 | $0 |
Property Value by Mortgage Status in Burr Oak
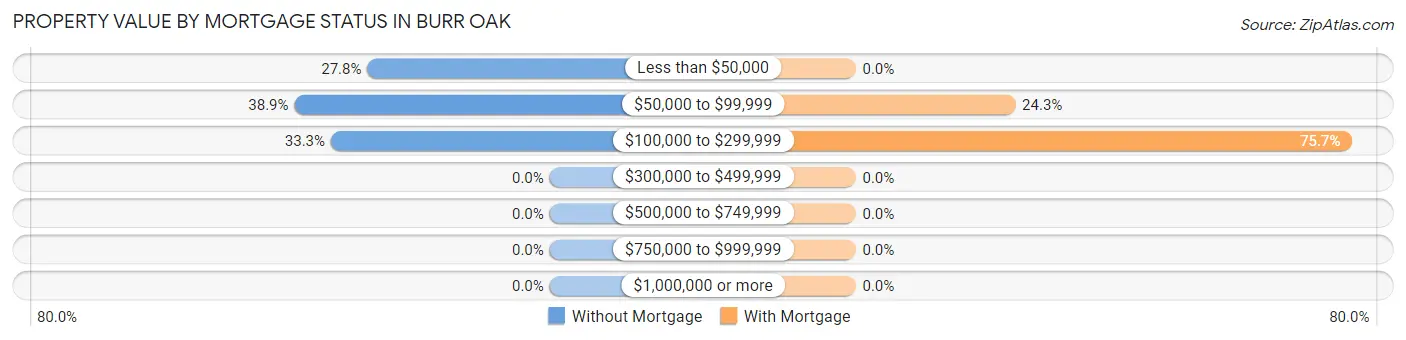
| Property Value | Without Mortgage | With Mortgage |
| Less than $50,000 | 10 (27.8%) | 0 (0.0%) |
| $50,000 to $99,999 | 14 (38.9%) | 9 (24.3%) |
| $100,000 to $299,999 | 12 (33.3%) | 28 (75.7%) |
| $300,000 to $499,999 | 0 (0.0%) | 0 (0.0%) |
| $500,000 to $749,999 | 0 (0.0%) | 0 (0.0%) |
| $750,000 to $999,999 | 0 (0.0%) | 0 (0.0%) |
| $1,000,000 or more | 0 (0.0%) | 0 (0.0%) |
| Total | 36 (100.0%) | 37 (100.0%) |
Household Income by Mortgage Status in Burr Oak
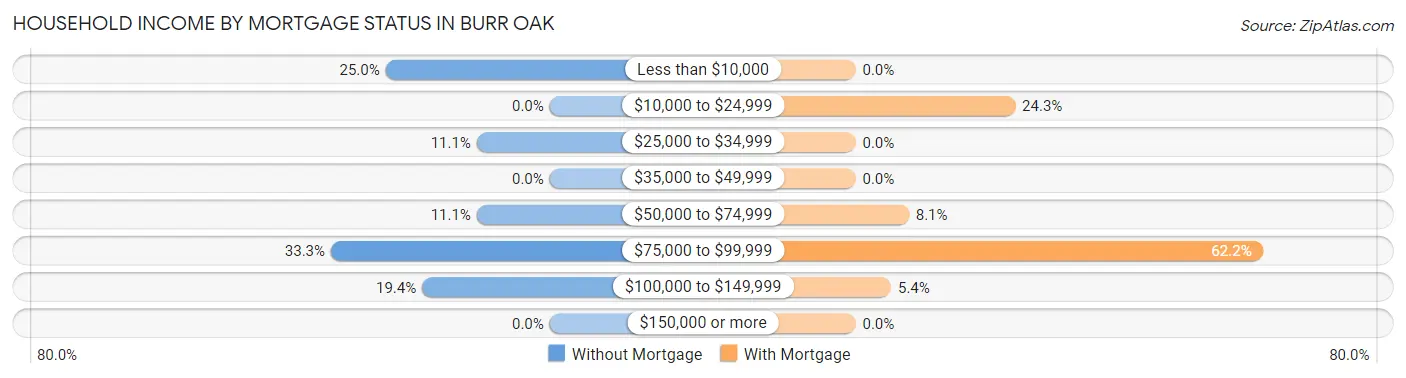
| Household Income | Without Mortgage | With Mortgage |
| Less than $10,000 | 9 (25.0%) | 0 (0.0%) |
| $10,000 to $24,999 | 0 (0.0%) | 9 (24.3%) |
| $25,000 to $34,999 | 4 (11.1%) | 0 (0.0%) |
| $35,000 to $49,999 | 0 (0.0%) | 0 (0.0%) |
| $50,000 to $74,999 | 4 (11.1%) | 3 (8.1%) |
| $75,000 to $99,999 | 12 (33.3%) | 23 (62.2%) |
| $100,000 to $149,999 | 7 (19.4%) | 2 (5.4%) |
| $150,000 or more | 0 (0.0%) | 0 (0.0%) |
| Total | 36 (100.0%) | 37 (100.0%) |
Property Value to Household Income Ratio in Burr Oak
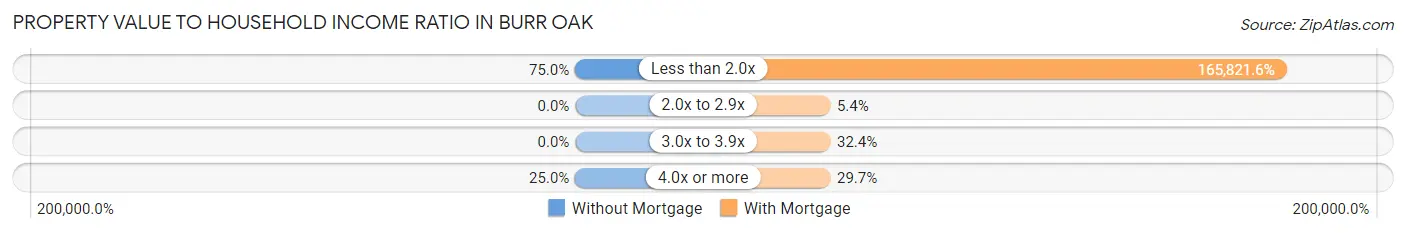
| Value-to-Income Ratio | Without Mortgage | With Mortgage |
| Less than 2.0x | 27 (75.0%) | 61,354 (165,821.6%) |
| 2.0x to 2.9x | 0 (0.0%) | 2 (5.4%) |
| 3.0x to 3.9x | 0 (0.0%) | 12 (32.4%) |
| 4.0x or more | 9 (25.0%) | 11 (29.7%) |
| Total | 36 (100.0%) | 37 (100.0%) |
Real Estate Taxes by Mortgage Status in Burr Oak
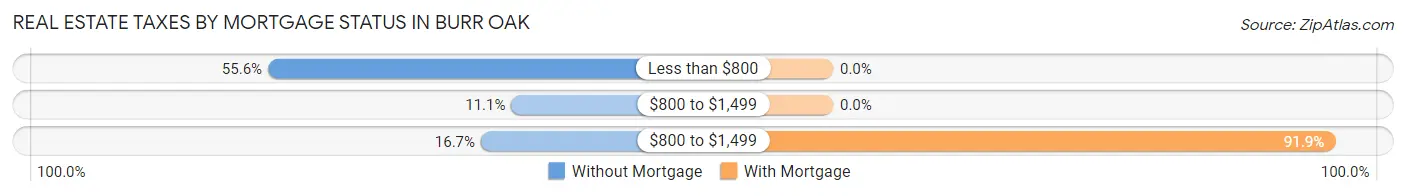
| Property Taxes | Without Mortgage | With Mortgage |
| Less than $800 | 20 (55.6%) | 0 (0.0%) |
| $800 to $1,499 | 4 (11.1%) | 0 (0.0%) |
| $800 to $1,499 | 6 (16.7%) | 34 (91.9%) |
| Total | 36 (100.0%) | 37 (100.0%) |
Health & Disability in Burr Oak
Health Insurance Coverage by Age in Burr Oak
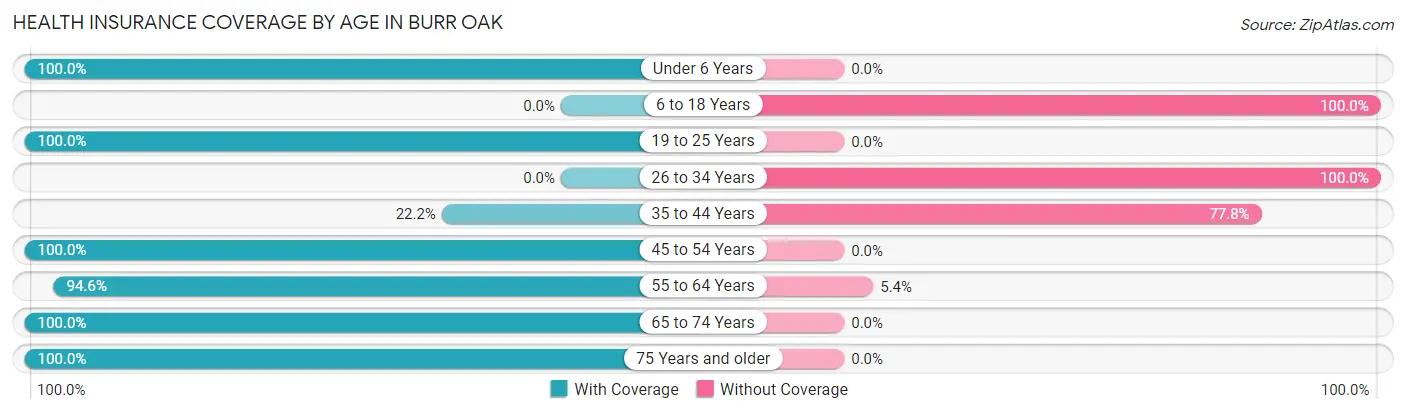
| Age Bracket | With Coverage | Without Coverage |
| Under 6 Years | 27 (100.0%) | 0 (0.0%) |
| 6 to 18 Years | 0 (0.0%) | 37 (100.0%) |
| 19 to 25 Years | 36 (100.0%) | 0 (0.0%) |
| 26 to 34 Years | 0 (0.0%) | 22 (100.0%) |
| 35 to 44 Years | 4 (22.2%) | 14 (77.8%) |
| 45 to 54 Years | 14 (100.0%) | 0 (0.0%) |
| 55 to 64 Years | 35 (94.6%) | 2 (5.4%) |
| 65 to 74 Years | 25 (100.0%) | 0 (0.0%) |
| 75 Years and older | 18 (100.0%) | 0 (0.0%) |
| Total | 159 (67.9%) | 75 (32.1%) |
Health Insurance Coverage by Citizenship Status in Burr Oak
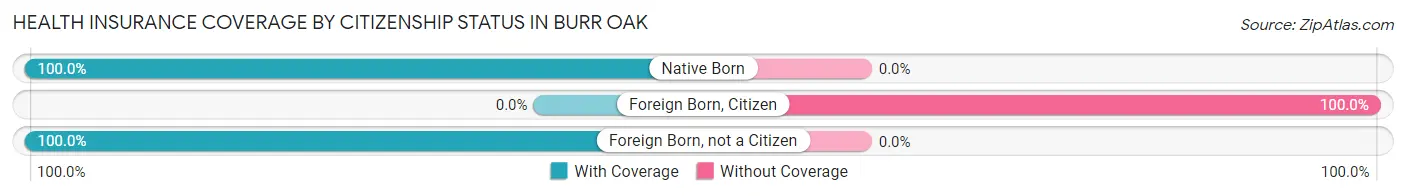
| Citizenship Status | With Coverage | Without Coverage |
| Native Born | 27 (100.0%) | 0 (0.0%) |
| Foreign Born, Citizen | 0 (0.0%) | 37 (100.0%) |
| Foreign Born, not a Citizen | 36 (100.0%) | 0 (0.0%) |
Health Insurance Coverage by Household Income in Burr Oak
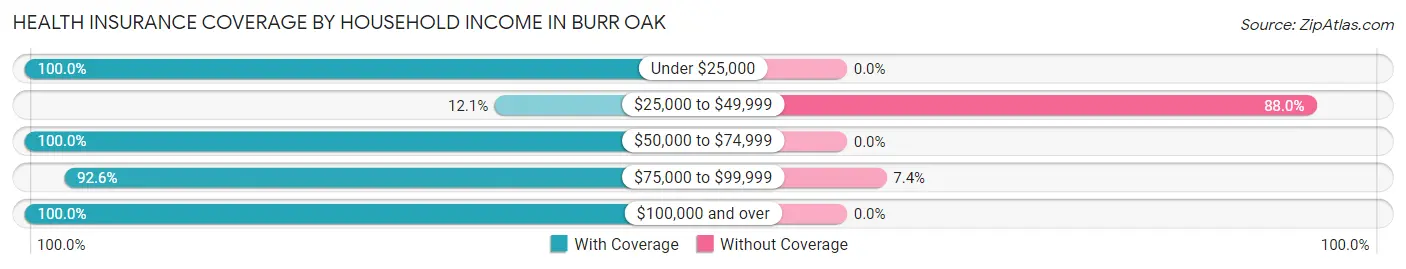
| Household Income | With Coverage | Without Coverage |
| Under $25,000 | 44 (100.0%) | 0 (0.0%) |
| $25,000 to $49,999 | 10 (12.0%) | 73 (87.9%) |
| $50,000 to $74,999 | 65 (100.0%) | 0 (0.0%) |
| $75,000 to $99,999 | 25 (92.6%) | 2 (7.4%) |
| $100,000 and over | 15 (100.0%) | 0 (0.0%) |
Public vs Private Health Insurance Coverage by Age in Burr Oak
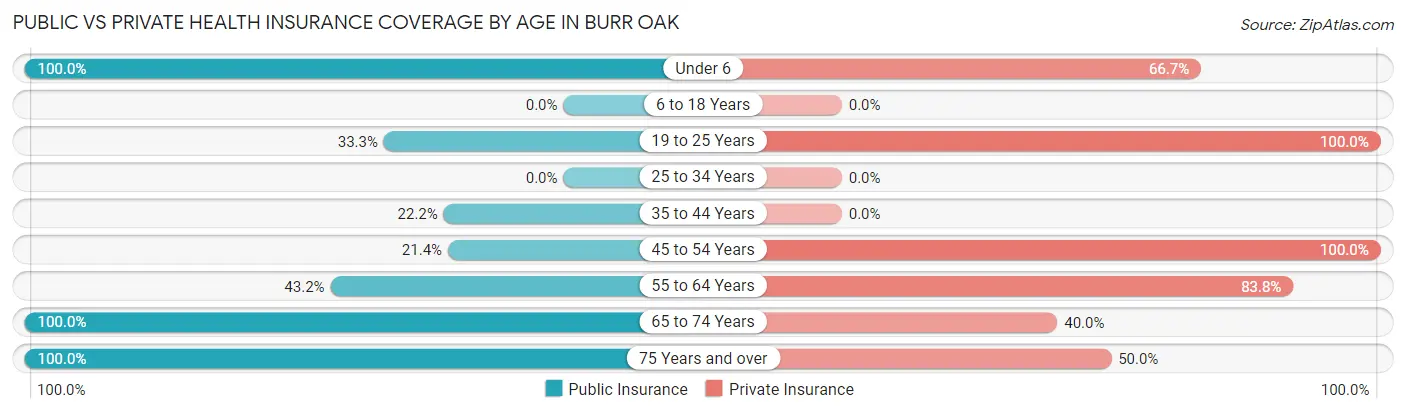
| Age Bracket | Public Insurance | Private Insurance |
| Under 6 | 27 (100.0%) | 18 (66.7%) |
| 6 to 18 Years | 0 (0.0%) | 0 (0.0%) |
| 19 to 25 Years | 12 (33.3%) | 36 (100.0%) |
| 25 to 34 Years | 0 (0.0%) | 0 (0.0%) |
| 35 to 44 Years | 4 (22.2%) | 0 (0.0%) |
| 45 to 54 Years | 3 (21.4%) | 14 (100.0%) |
| 55 to 64 Years | 16 (43.2%) | 31 (83.8%) |
| 65 to 74 Years | 25 (100.0%) | 10 (40.0%) |
| 75 Years and over | 18 (100.0%) | 9 (50.0%) |
| Total | 105 (44.9%) | 118 (50.4%) |
Disability Status by Sex by Age in Burr Oak
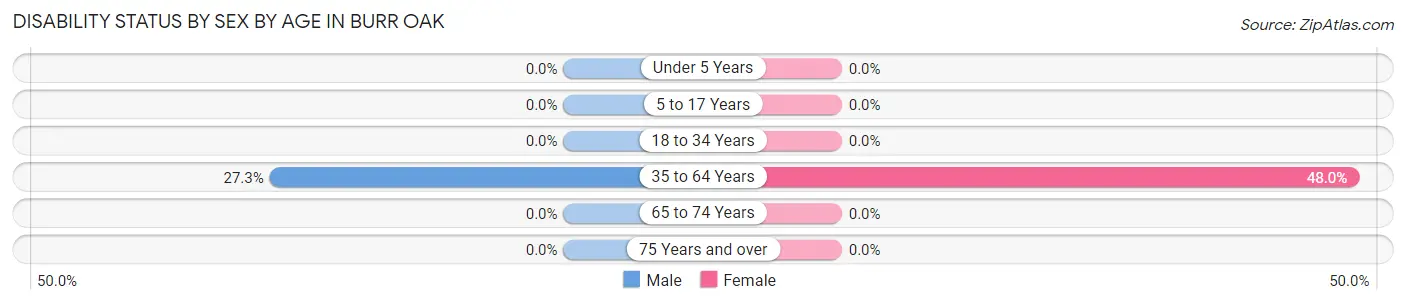
| Age Bracket | Male | Female |
| Under 5 Years | 0 (0.0%) | 0 (0.0%) |
| 5 to 17 Years | 0 (0.0%) | 0 (0.0%) |
| 18 to 34 Years | 0 (0.0%) | 0 (0.0%) |
| 35 to 64 Years | 12 (27.3%) | 12 (48.0%) |
| 65 to 74 Years | 0 (0.0%) | 0 (0.0%) |
| 75 Years and over | 0 (0.0%) | 0 (0.0%) |
Disability Class by Sex by Age in Burr Oak
Disability Class: Hearing Difficulty
| Age Bracket | Male | Female |
| Under 5 Years | 0 (0.0%) | 0 (0.0%) |
| 5 to 17 Years | 0 (0.0%) | 0 (0.0%) |
| 18 to 34 Years | 0 (0.0%) | 0 (0.0%) |
| 35 to 64 Years | 0 (0.0%) | 0 (0.0%) |
| 65 to 74 Years | 0 (0.0%) | 0 (0.0%) |
| 75 Years and over | 0 (0.0%) | 0 (0.0%) |
Disability Class: Vision Difficulty
| Age Bracket | Male | Female |
| Under 5 Years | 0 (0.0%) | 0 (0.0%) |
| 5 to 17 Years | 0 (0.0%) | 0 (0.0%) |
| 18 to 34 Years | 0 (0.0%) | 0 (0.0%) |
| 35 to 64 Years | 0 (0.0%) | 0 (0.0%) |
| 65 to 74 Years | 0 (0.0%) | 0 (0.0%) |
| 75 Years and over | 0 (0.0%) | 0 (0.0%) |
Disability Class: Cognitive Difficulty
| Age Bracket | Male | Female |
| 5 to 17 Years | 0 (0.0%) | 0 (0.0%) |
| 18 to 34 Years | 0 (0.0%) | 0 (0.0%) |
| 35 to 64 Years | 0 (0.0%) | 0 (0.0%) |
| 65 to 74 Years | 0 (0.0%) | 0 (0.0%) |
| 75 Years and over | 0 (0.0%) | 0 (0.0%) |
Disability Class: Ambulatory Difficulty
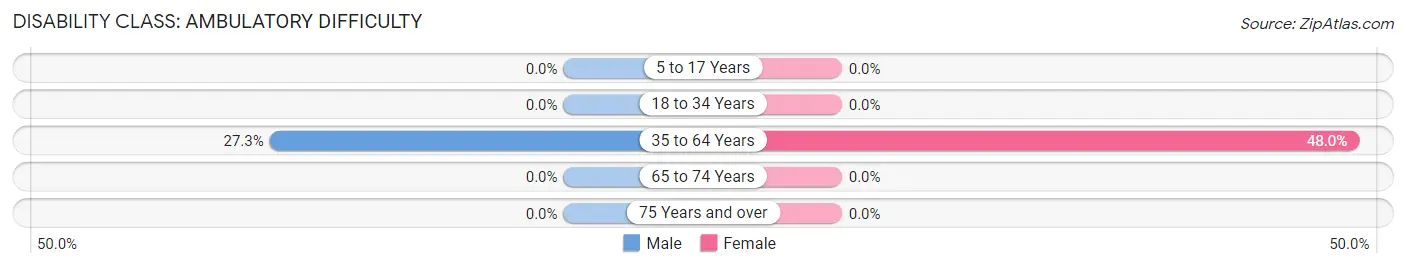
| Age Bracket | Male | Female |
| 5 to 17 Years | 0 (0.0%) | 0 (0.0%) |
| 18 to 34 Years | 0 (0.0%) | 0 (0.0%) |
| 35 to 64 Years | 12 (27.3%) | 12 (48.0%) |
| 65 to 74 Years | 0 (0.0%) | 0 (0.0%) |
| 75 Years and over | 0 (0.0%) | 0 (0.0%) |
Disability Class: Self-Care Difficulty
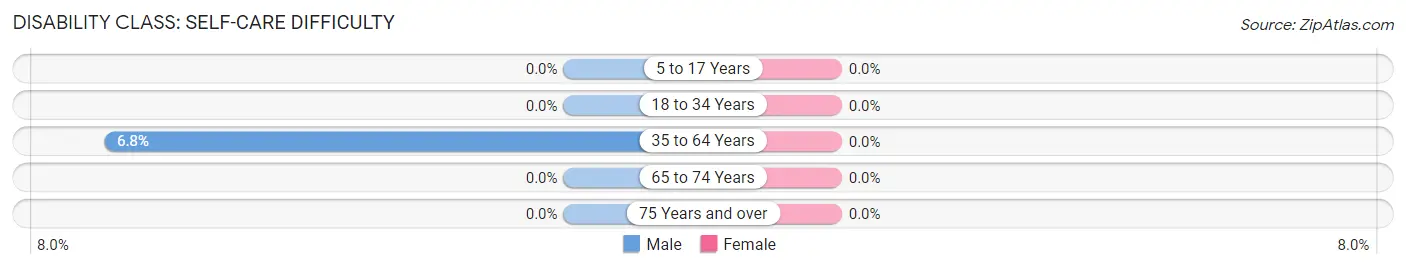
| Age Bracket | Male | Female |
| 5 to 17 Years | 0 (0.0%) | 0 (0.0%) |
| 18 to 34 Years | 0 (0.0%) | 0 (0.0%) |
| 35 to 64 Years | 3 (6.8%) | 0 (0.0%) |
| 65 to 74 Years | 0 (0.0%) | 0 (0.0%) |
| 75 Years and over | 0 (0.0%) | 0 (0.0%) |
Technology Access in Burr Oak
Computing Device Access in Burr Oak
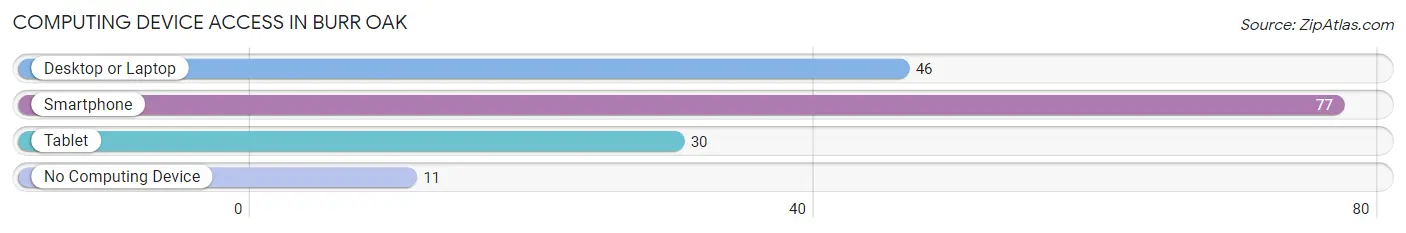
| Device Type | # Households | % Households |
| Desktop or Laptop | 46 | 46.5% |
| Smartphone | 77 | 77.8% |
| Tablet | 30 | 30.3% |
| No Computing Device | 11 | 11.1% |
| Total | 99 | 100.0% |
Internet Access in Burr Oak
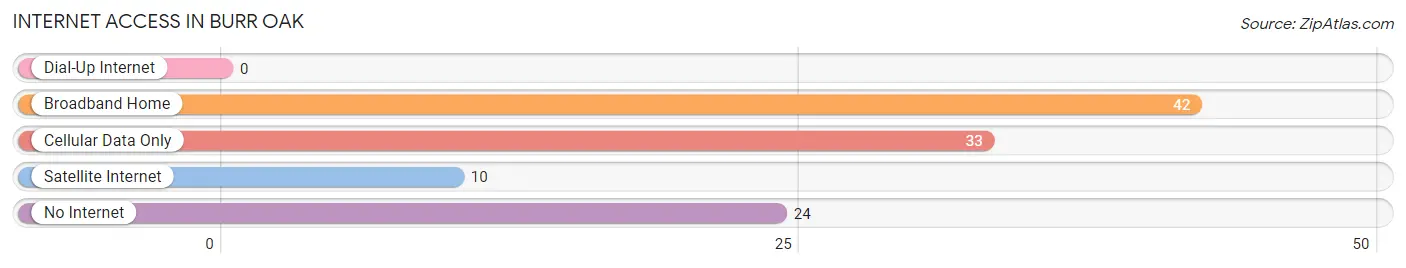
| Internet Type | # Households | % Households |
| Dial-Up Internet | 0 | 0.0% |
| Broadband Home | 42 | 42.4% |
| Cellular Data Only | 33 | 33.3% |
| Satellite Internet | 10 | 10.1% |
| No Internet | 24 | 24.2% |
| Total | 99 | 100.0% |
Burr Oak Summary
Burr Oak, Iowa is a small town located in the northeast corner of the state, in the heart of the Midwest. It is situated in the rolling hills of the Driftless Area, a region of the Midwest that was not glaciated during the last ice age. The town is located in Mitchell County, and is part of the Mason City Micropolitan Statistical Area. As of the 2010 census, the population of Burr Oak was 545.
History
Burr Oak was founded in 1856 by a group of settlers from Ohio. The town was named after a nearby grove of burr oak trees. The first settlers were primarily farmers, and the town quickly grew to include a post office, a general store, a blacksmith shop, and a school.
In the late 19th century, Burr Oak was a thriving agricultural community. The town was home to several grain elevators, a creamery, and a cheese factory. The town also had a number of churches, including the Methodist Episcopal Church, the Congregational Church, and the United Brethren Church.
In the early 20th century, Burr Oak experienced a period of growth and prosperity. The town was home to a number of businesses, including a bank, a hotel, a movie theater, and a variety of stores. The town also had a number of churches, including the Methodist Episcopal Church, the Congregational Church, and the United Brethren Church.
Geography
Burr Oak is located in the northeast corner of Iowa, in the heart of the Midwest. The town is situated in the rolling hills of the Driftless Area, a region of the Midwest that was not glaciated during the last ice age. The town is located in Mitchell County, and is part of the Mason City Micropolitan Statistical Area.
The town is located at the intersection of two major highways, Iowa Highway 9 and Iowa Highway 14. The town is located approximately 25 miles north of Mason City, and approximately 50 miles south of Rochester, Minnesota.
Economy
The economy of Burr Oak is largely based on agriculture. The town is home to several grain elevators, a creamery, and a cheese factory. The town also has a number of businesses, including a bank, a hotel, a movie theater, and a variety of stores.
The town is also home to a number of manufacturing companies, including a furniture factory, a metal fabrication plant, and a plastics factory. The town is also home to a number of small businesses, including a bakery, a florist, and a variety of restaurants.
Demographics
As of the 2010 census, the population of Burr Oak was 545. The town has a total area of 0.8 square miles, all of which is land. The population density was 690.7 people per square mile.
The racial makeup of the town was 97.3% White, 0.2% African American, 0.2% Native American, 0.2% Asian, 0.4% from other races, and 1.7% from two or more races. Hispanic or Latino of any race were 1.3% of the population.
The median income for a household in the town was $41,250, and the median income for a family was $48,750. The per capita income for the town was $19,945. About 8.3% of families and 10.2% of the population were below the poverty line, including 14.3% of those under age 18 and 8.3% of those age 65 or over.
Common Questions
What is Per Capita Income in Burr Oak?
Per Capita income in Burr Oak is $20,553.
What is the Median Family Income in Burr Oak?
Median Family Income in Burr Oak is $31,534.
What is the Median Household income in Burr Oak?
Median Household Income in Burr Oak is $46,250.
What is Inequality or Gini Index in Burr Oak?
Inequality or Gini Index in Burr Oak is 0.38.
What is the Total Population of Burr Oak?
Total Population of Burr Oak is 234.
What is the Total Male Population of Burr Oak?
Total Male Population of Burr Oak is 124.
What is the Total Female Population of Burr Oak?
Total Female Population of Burr Oak is 110.
What is the Ratio of Males per 100 Females in Burr Oak?
There are 112.73 Males per 100 Females in Burr Oak.
What is the Ratio of Females per 100 Males in Burr Oak?
There are 88.71 Females per 100 Males in Burr Oak.
What is the Median Population Age in Burr Oak?
Median Population Age in Burr Oak is 33.8 Years.
What is the Average Family Size in Burr Oak
Average Family Size in Burr Oak is 2.8 People.
What is the Average Household Size in Burr Oak
Average Household Size in Burr Oak is 2.4 People.
How Large is the Labor Force in Burr Oak?
There are 98 People in the Labor Forcein in Burr Oak.
What is the Percentage of People in the Labor Force in Burr Oak?
57.6% of People are in the Labor Force in Burr Oak.