Zip Codes with the Highest Percentage of Population with a Degree in Visual and Performing Arts in Burlington, VT
RELATED REPORTS & OPTIONS
Visual and Performing Arts
Burlington
Compare Zip Codes
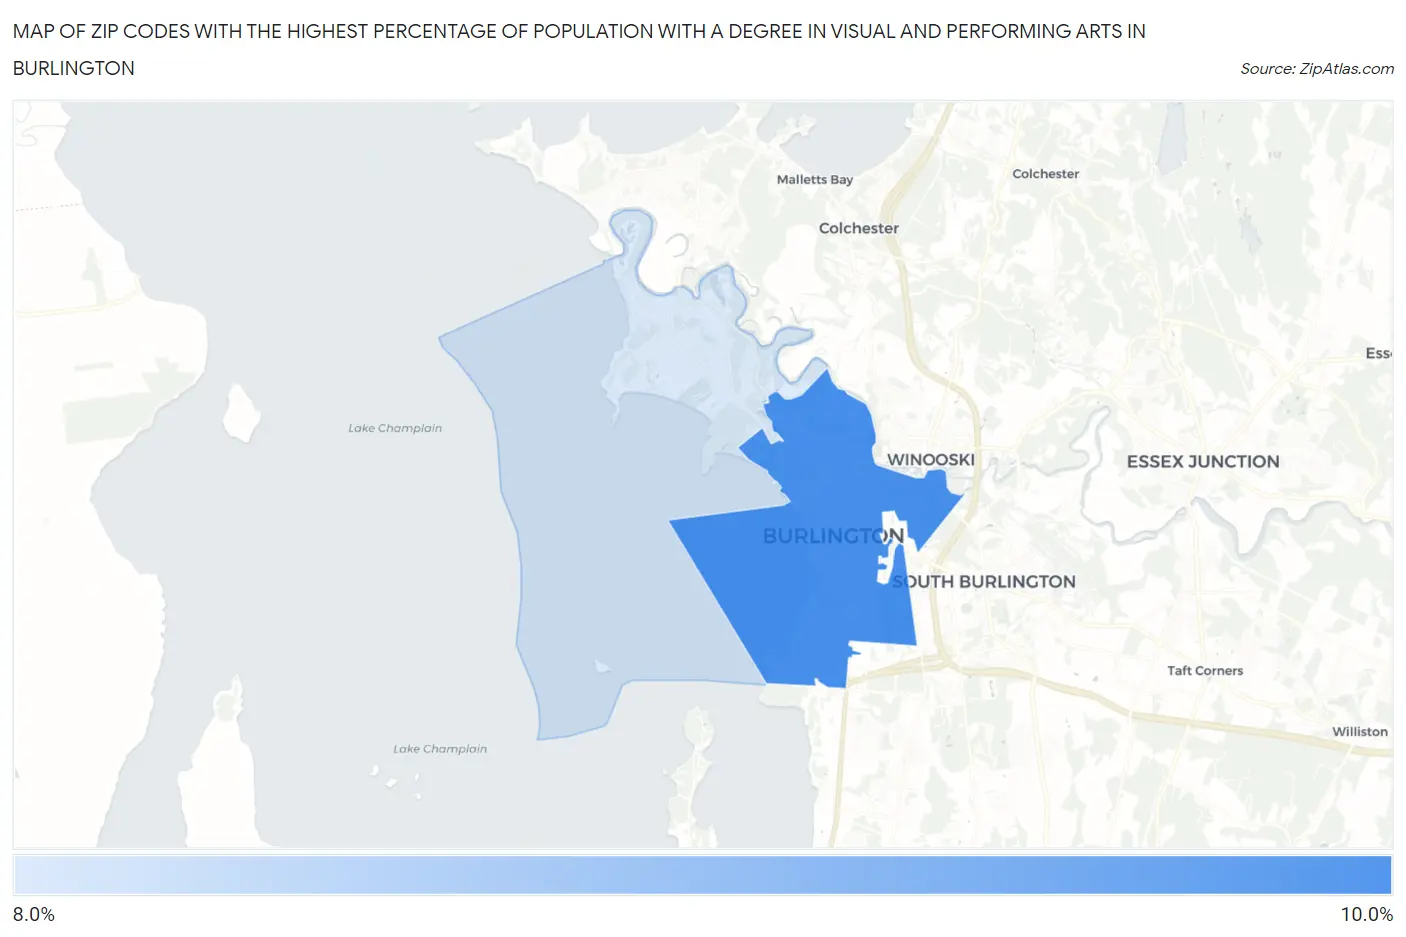
Map of Zip Codes with the Highest Percentage of Population with a Degree in Visual and Performing Arts in Burlington
8.2%
9.9%
Zip Codes with the Highest Percentage of Population with a Degree in Visual and Performing Arts in Burlington, VT
| Zip Code | % Graduates | vs State | vs National | |
| 1. | 05401 | 9.9% | 6.7%(+3.17)#48 | 4.3%(+5.61)#1,882 |
| 2. | 05408 | 8.2% | 6.7%(+1.47)#65 | 4.3%(+3.91)#2,743 |
1
Common Questions
What are the Top Zip Codes with the Highest Percentage of Population with a Degree in Visual and Performing Arts in Burlington, VT?
Top Zip Codes with the Highest Percentage of Population with a Degree in Visual and Performing Arts in Burlington, VT are:
What zip code has the Highest Percentage of Population with a Degree in Visual and Performing Arts in Burlington, VT?
05401 has the Highest Percentage of Population with a Degree in Visual and Performing Arts in Burlington, VT with 9.9%.
What is the Percentage of Population with a Degree in Visual and Performing Arts in Burlington, VT?
Percentage of Population with a Degree in Visual and Performing Arts in Burlington is 9.5%.
What is the Percentage of Population with a Degree in Visual and Performing Arts in Vermont?
Percentage of Population with a Degree in Visual and Performing Arts in Vermont is 6.7%.
What is the Percentage of Population with a Degree in Visual and Performing Arts in the United States?
Percentage of Population with a Degree in Visual and Performing Arts in the United States is 4.3%.