Zip Codes with the Highest Percentage of Population with a Degree in Visual and Performing Arts in Barton, VT
RELATED REPORTS & OPTIONS
Visual and Performing Arts
Barton
Compare Zip Codes
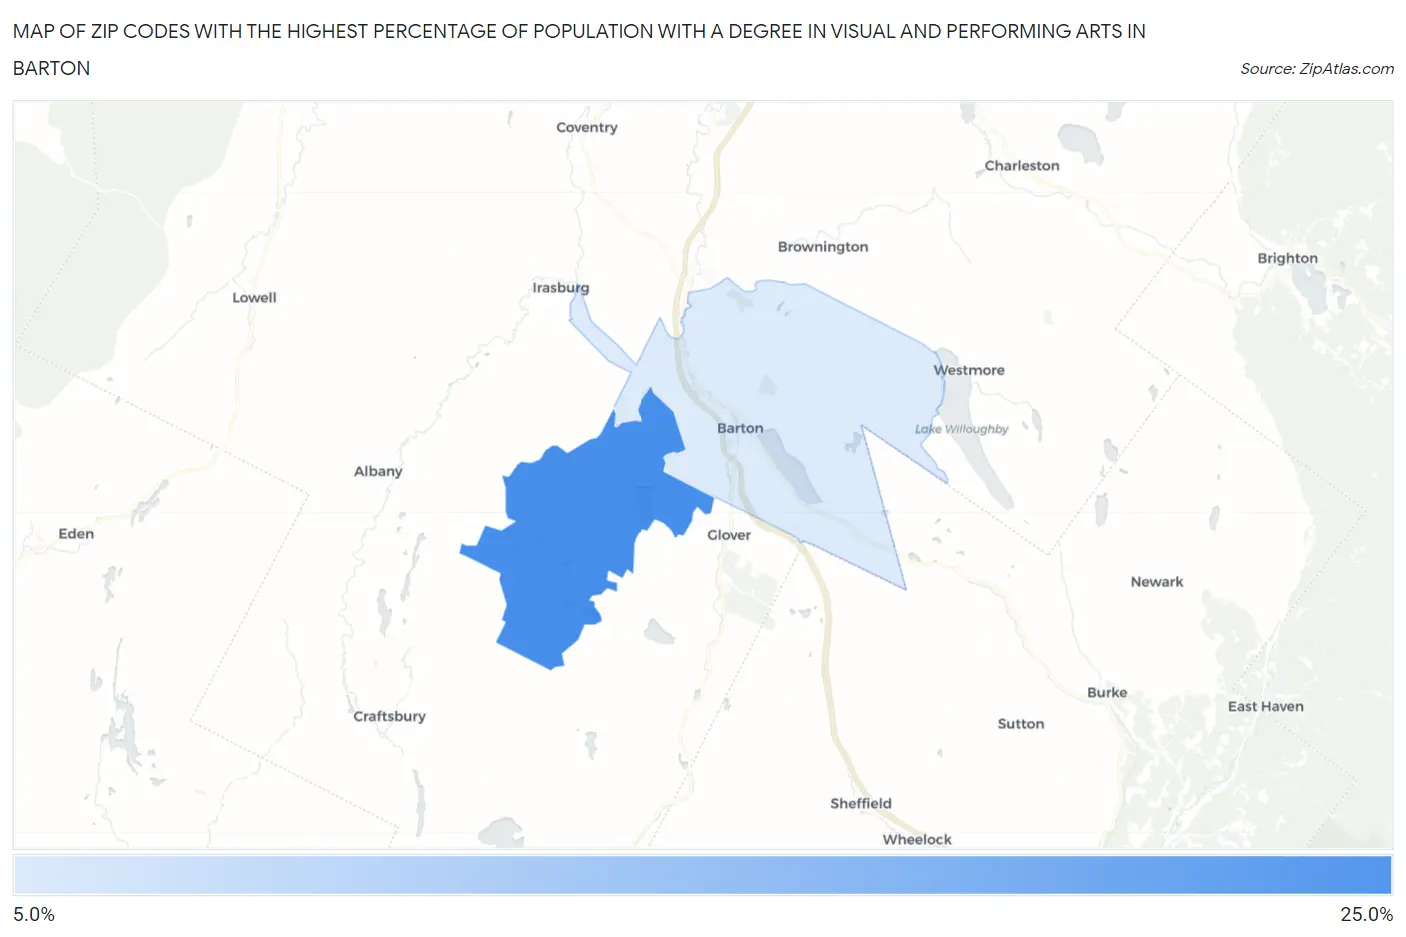
Map of Zip Codes with the Highest Percentage of Population with a Degree in Visual and Performing Arts in Barton
6.5%
20.1%
Zip Codes with the Highest Percentage of Population with a Degree in Visual and Performing Arts in Barton, VT
| Zip Code | % Graduates | vs State | vs National | |
| 1. | 05875 | 20.1% | 6.7%(+13.4)#7 | 4.3%(+15.9)#466 |
| 2. | 05822 | 6.5% | 6.7%(-0.207)#103 | 4.3%(+2.23)#4,245 |
1
Common Questions
What are the Top Zip Codes with the Highest Percentage of Population with a Degree in Visual and Performing Arts in Barton, VT?
Top Zip Codes with the Highest Percentage of Population with a Degree in Visual and Performing Arts in Barton, VT are:
What zip code has the Highest Percentage of Population with a Degree in Visual and Performing Arts in Barton, VT?
05875 has the Highest Percentage of Population with a Degree in Visual and Performing Arts in Barton, VT with 20.1%.
What is the Percentage of Population with a Degree in Visual and Performing Arts in Barton, VT?
Percentage of Population with a Degree in Visual and Performing Arts in Barton is 2.9%.
What is the Percentage of Population with a Degree in Visual and Performing Arts in Vermont?
Percentage of Population with a Degree in Visual and Performing Arts in Vermont is 6.7%.
What is the Percentage of Population with a Degree in Visual and Performing Arts in the United States?
Percentage of Population with a Degree in Visual and Performing Arts in the United States is 4.3%.