Zip Codes with the Highest Percentage of Population Employed in Education Instruction & Library in Utah
RELATED REPORTS & OPTIONS
Education Instruction & Library
Utah
Compare Zip Codes
Map of Zip Codes with the Highest Percentage of Population Employed in Education Instruction & Library in Utah
0.0%
40.0%
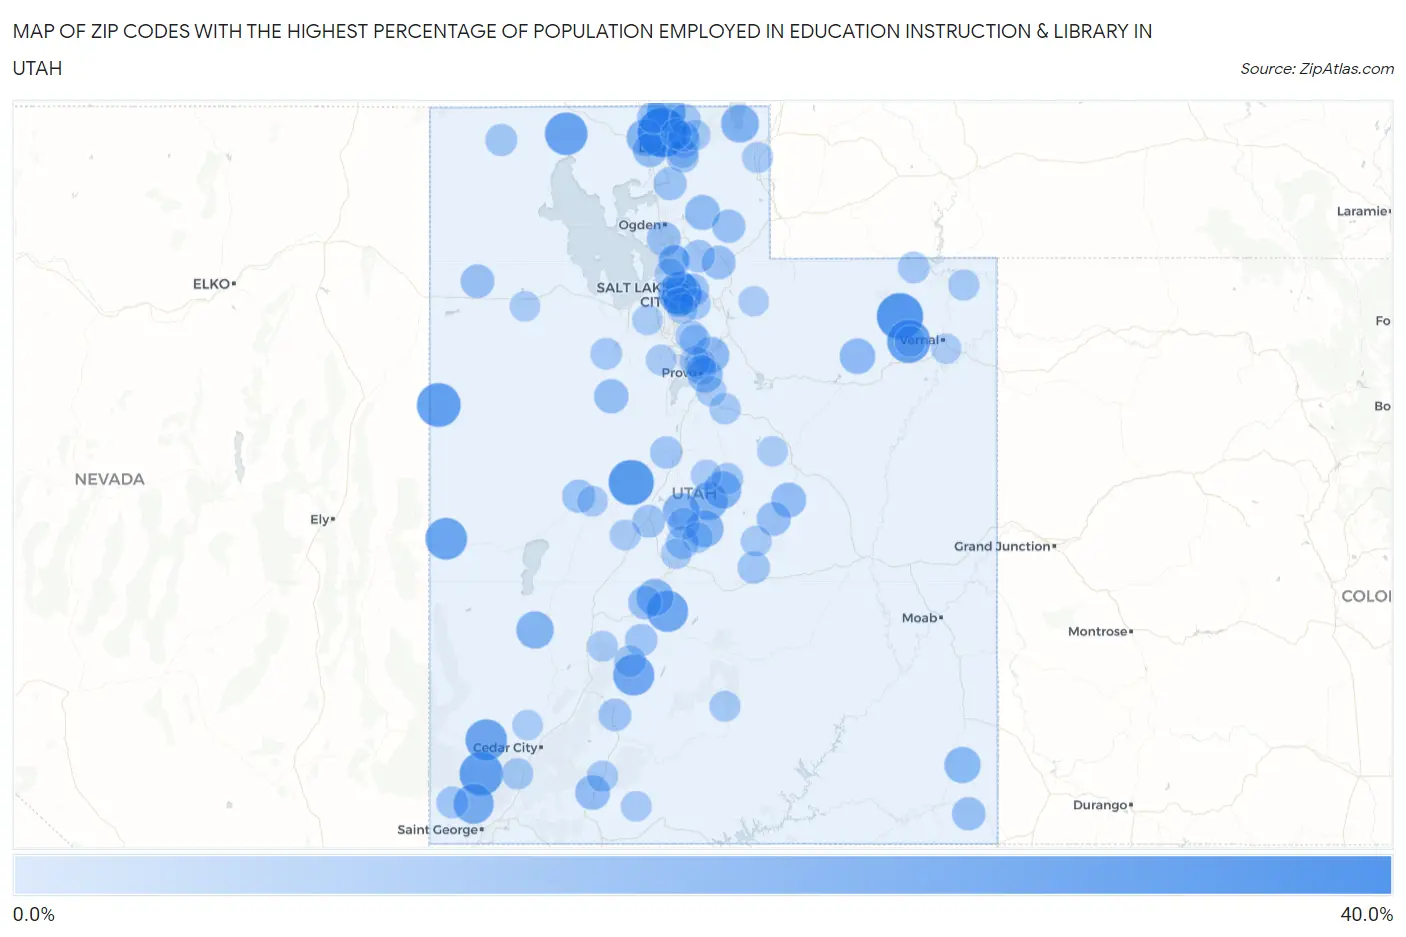
Zip Codes with the Highest Percentage of Population Employed in Education Instruction & Library in Utah
| Zip Code | % Employed | vs State | vs National | |
| 1. | 84304 | 30.4% | 6.4% (+24.1)#1 | 6.2% (+24.3)#256 |
| 2. | 84085 | 26.5% | 6.4% (+20.1)#2 | 6.2% (+20.3)#327 |
| 3. | 84638 | 25.2% | 6.4% (+18.8)#3 | 6.2% (+19.0)#357 |
| 4. | 84034 | 23.3% | 6.4% (+17.0)#4 | 6.2% (+17.1)#447 |
| 5. | 84722 | 23.0% | 6.4% (+16.6)#5 | 6.2% (+16.8)#467 |
| 6. | 84076 | 22.7% | 6.4% (+16.3)#6 | 6.2% (+16.5)#481 |
| 7. | 84112 | 22.7% | 6.4% (+16.3)#7 | 6.2% (+16.5)#484 |
| 8. | 84336 | 22.0% | 6.4% (+15.6)#8 | 6.2% (+15.8)#516 |
| 9. | 84728 | 20.9% | 6.4% (+14.6)#9 | 6.2% (+14.7)#572 |
| 10. | 84756 | 20.7% | 6.4% (+14.3)#10 | 6.2% (+14.5)#592 |
| 11. | 84744 | 20.3% | 6.4% (+13.9)#11 | 6.2% (+14.1)#624 |
| 12. | 84723 | 20.1% | 6.4% (+13.7)#12 | 6.2% (+13.9)#640 |
| 13. | 84783 | 18.9% | 6.4% (+12.5)#13 | 6.2% (+12.7)#745 |
| 14. | 84308 | 17.5% | 6.4% (+11.1)#14 | 6.2% (+11.3)#891 |
| 15. | 84038 | 16.3% | 6.4% (+9.89)#15 | 6.2% (+10.1)#1,056 |
| 16. | 84627 | 16.2% | 6.4% (+9.81)#16 | 6.2% (+10.0)#1,069 |
| 17. | 84662 | 15.8% | 6.4% (+9.43)#17 | 6.2% (+9.62)#1,130 |
| 18. | 84751 | 15.8% | 6.4% (+9.39)#18 | 6.2% (+9.58)#1,141 |
| 19. | 84711 | 15.3% | 6.4% (+8.94)#19 | 6.2% (+9.13)#1,229 |
| 20. | 84642 | 15.2% | 6.4% (+8.78)#20 | 6.2% (+8.98)#1,255 |
| 21. | 84630 | 15.1% | 6.4% (+8.74)#21 | 6.2% (+8.93)#1,262 |
| 22. | 84334 | 15.0% | 6.4% (+8.62)#22 | 6.2% (+8.82)#1,281 |
| 23. | 84511 | 14.4% | 6.4% (+7.98)#23 | 6.2% (+8.17)#1,430 |
| 24. | 84604 | 13.9% | 6.4% (+7.53)#24 | 6.2% (+7.73)#1,565 |
| 25. | 84001 | 13.5% | 6.4% (+7.09)#25 | 6.2% (+7.28)#1,719 |
| 26. | 84606 | 13.1% | 6.4% (+6.76)#26 | 6.2% (+6.95)#1,851 |
| 27. | 84317 | 12.8% | 6.4% (+6.40)#27 | 6.2% (+6.60)#1,980 |
| 28. | 84518 | 12.5% | 6.4% (+6.16)#28 | 6.2% (+6.36)#2,099 |
| 29. | 84729 | 12.5% | 6.4% (+6.12)#29 | 6.2% (+6.32)#2,120 |
| 30. | 84309 | 12.1% | 6.4% (+5.73)#30 | 6.2% (+5.93)#2,330 |
| 31. | 84080 | 12.0% | 6.4% (+5.67)#31 | 6.2% (+5.86)#2,361 |
| 32. | 84056 | 11.6% | 6.4% (+5.18)#32 | 6.2% (+5.38)#2,655 |
| 33. | 84513 | 11.5% | 6.4% (+5.10)#33 | 6.2% (+5.30)#2,710 |
| 34. | 84083 | 11.2% | 6.4% (+4.87)#34 | 6.2% (+5.06)#2,890 |
| 35. | 84033 | 11.2% | 6.4% (+4.82)#35 | 6.2% (+5.01)#2,916 |
| 36. | 84724 | 11.1% | 6.4% (+4.73)#36 | 6.2% (+4.93)#2,972 |
| 37. | 84102 | 11.0% | 6.4% (+4.58)#37 | 6.2% (+4.77)#3,087 |
| 38. | 84534 | 10.9% | 6.4% (+4.52)#38 | 6.2% (+4.72)#3,133 |
| 39. | 84018 | 10.8% | 6.4% (+4.41)#39 | 6.2% (+4.60)#3,216 |
| 40. | 84635 | 10.7% | 6.4% (+4.30)#40 | 6.2% (+4.49)#3,296 |
| 41. | 84324 | 10.6% | 6.4% (+4.20)#41 | 6.2% (+4.39)#3,388 |
| 42. | 84622 | 10.6% | 6.4% (+4.19)#42 | 6.2% (+4.38)#3,396 |
| 43. | 84305 | 10.5% | 6.4% (+4.16)#43 | 6.2% (+4.36)#3,418 |
| 44. | 84108 | 10.5% | 6.4% (+4.16)#44 | 6.2% (+4.36)#3,421 |
| 45. | 84341 | 10.5% | 6.4% (+4.13)#45 | 6.2% (+4.32)#3,454 |
| 46. | 84759 | 10.0% | 6.4% (+3.66)#46 | 6.2% (+3.85)#3,890 |
| 47. | 84656 | 10.0% | 6.4% (+3.57)#47 | 6.2% (+3.77)#3,992 |
| 48. | 84326 | 9.9% | 6.4% (+3.55)#48 | 6.2% (+3.75)#4,017 |
| 49. | 84050 | 9.8% | 6.4% (+3.47)#49 | 6.2% (+3.66)#4,122 |
| 50. | 84522 | 9.7% | 6.4% (+3.34)#50 | 6.2% (+3.53)#4,275 |
| 51. | 84105 | 9.6% | 6.4% (+3.24)#51 | 6.2% (+3.44)#4,378 |
| 52. | 84648 | 9.6% | 6.4% (+3.23)#52 | 6.2% (+3.42)#4,395 |
| 53. | 84750 | 9.6% | 6.4% (+3.21)#53 | 6.2% (+3.41)#4,418 |
| 54. | 84765 | 9.5% | 6.4% (+3.08)#54 | 6.2% (+3.27)#4,578 |
| 55. | 84103 | 9.4% | 6.4% (+2.99)#55 | 6.2% (+3.18)#4,695 |
| 56. | 84329 | 9.3% | 6.4% (+2.94)#56 | 6.2% (+3.14)#4,764 |
| 57. | 84634 | 9.3% | 6.4% (+2.92)#57 | 6.2% (+3.12)#4,804 |
| 58. | 84740 | 9.3% | 6.4% (+2.88)#58 | 6.2% (+3.08)#4,855 |
| 59. | 84333 | 8.9% | 6.4% (+2.51)#59 | 6.2% (+2.71)#5,404 |
| 60. | 84069 | 8.8% | 6.4% (+2.41)#60 | 6.2% (+2.61)#5,552 |
| 61. | 84004 | 8.8% | 6.4% (+2.41)#61 | 6.2% (+2.60)#5,560 |
| 62. | 84109 | 8.8% | 6.4% (+2.41)#62 | 6.2% (+2.60)#5,563 |
| 63. | 84046 | 8.7% | 6.4% (+2.32)#63 | 6.2% (+2.51)#5,736 |
| 64. | 84097 | 8.6% | 6.4% (+2.25)#64 | 6.2% (+2.45)#5,864 |
| 65. | 84647 | 8.6% | 6.4% (+2.21)#65 | 6.2% (+2.40)#5,945 |
| 66. | 84720 | 8.5% | 6.4% (+2.16)#66 | 6.2% (+2.35)#6,021 |
| 67. | 84025 | 8.5% | 6.4% (+2.13)#67 | 6.2% (+2.33)#6,074 |
| 68. | 84710 | 8.5% | 6.4% (+2.07)#68 | 6.2% (+2.27)#6,180 |
| 69. | 84039 | 8.3% | 6.4% (+1.95)#69 | 6.2% (+2.15)#6,446 |
| 70. | 84660 | 8.3% | 6.4% (+1.92)#70 | 6.2% (+2.11)#6,530 |
| 71. | 84023 | 8.2% | 6.4% (+1.82)#71 | 6.2% (+2.01)#6,722 |
| 72. | 84037 | 8.2% | 6.4% (+1.79)#72 | 6.2% (+1.99)#6,788 |
| 73. | 84332 | 8.2% | 6.4% (+1.79)#73 | 6.2% (+1.98)#6,797 |
| 74. | 84523 | 8.1% | 6.4% (+1.76)#74 | 6.2% (+1.95)#6,854 |
| 75. | 84321 | 8.1% | 6.4% (+1.73)#75 | 6.2% (+1.93)#6,906 |
| 76. | 84318 | 8.1% | 6.4% (+1.73)#76 | 6.2% (+1.92)#6,919 |
| 77. | 84064 | 8.1% | 6.4% (+1.70)#77 | 6.2% (+1.90)#6,962 |
| 78. | 84335 | 8.0% | 6.4% (+1.62)#78 | 6.2% (+1.82)#7,143 |
| 79. | 84716 | 8.0% | 6.4% (+1.58)#79 | 6.2% (+1.77)#7,269 |
| 80. | 84636 | 7.9% | 6.4% (+1.56)#80 | 6.2% (+1.75)#7,303 |
| 81. | 84087 | 7.9% | 6.4% (+1.53)#81 | 6.2% (+1.73)#7,360 |
| 82. | 84057 | 7.9% | 6.4% (+1.51)#82 | 6.2% (+1.71)#7,403 |
| 83. | 84003 | 7.8% | 6.4% (+1.40)#83 | 6.2% (+1.60)#7,683 |
| 84. | 84602 | 7.8% | 6.4% (+1.40)#84 | 6.2% (+1.59)#7,697 |
| 85. | 84005 | 7.7% | 6.4% (+1.37)#85 | 6.2% (+1.56)#7,763 |
| 86. | 84741 | 7.7% | 6.4% (+1.33)#86 | 6.2% (+1.53)#7,863 |
| 87. | 84713 | 7.7% | 6.4% (+1.32)#87 | 6.2% (+1.52)#7,883 |
| 88. | 84643 | 7.7% | 6.4% (+1.31)#88 | 6.2% (+1.51)#7,922 |
| 89. | 84124 | 7.7% | 6.4% (+1.30)#89 | 6.2% (+1.49)#7,970 |
| 90. | 84624 | 7.7% | 6.4% (+1.29)#90 | 6.2% (+1.49)#7,990 |
| 91. | 84646 | 7.7% | 6.4% (+1.28)#91 | 6.2% (+1.47)#8,032 |
| 92. | 84526 | 7.5% | 6.4% (+1.17)#92 | 6.2% (+1.36)#8,312 |
| 93. | 84652 | 7.5% | 6.4% (+1.13)#93 | 6.2% (+1.33)#8,401 |
| 94. | 84721 | 7.5% | 6.4% (+1.09)#94 | 6.2% (+1.29)#8,488 |
| 95. | 84664 | 7.4% | 6.4% (+1.02)#95 | 6.2% (+1.21)#8,714 |
| 96. | 84006 | 7.4% | 6.4% (+1.01)#96 | 6.2% (+1.21)#8,724 |
| 97. | 84055 | 7.3% | 6.4% (+0.941)#97 | 6.2% (+1.14)#8,925 |
| 98. | 84029 | 7.3% | 6.4% (+0.932)#98 | 6.2% (+1.13)#8,953 |
| 99. | 84078 | 7.3% | 6.4% (+0.926)#99 | 6.2% (+1.12)#8,970 |
| 100. | 84106 | 7.2% | 6.4% (+0.868)#100 | 6.2% (+1.06)#9,160 |
Common Questions
What are the Top 10 Zip Codes with the Highest Percentage of Population Employed in Education Instruction & Library in Utah?
Top 10 Zip Codes with the Highest Percentage of Population Employed in Education Instruction & Library in Utah are:
What zip code has the Highest Percentage of Population Employed in Education Instruction & Library in Utah?
84304 has the Highest Percentage of Population Employed in Education Instruction & Library in Utah with 30.4%.
What is the Percentage of Population Employed in Education Instruction & Library in the State of Utah?
Percentage of Population Employed in Education Instruction & Library in Utah is 6.4%.
What is the Percentage of Population Employed in Education Instruction & Library in the United States?
Percentage of Population Employed in Education Instruction & Library in the United States is 6.2%.