Zip Codes with the Highest Percentage of Population with a Degree in Computers and Mathematics in Tennessee
RELATED REPORTS & OPTIONS
Computers and Mathematics
Tennessee
Compare Zip Codes
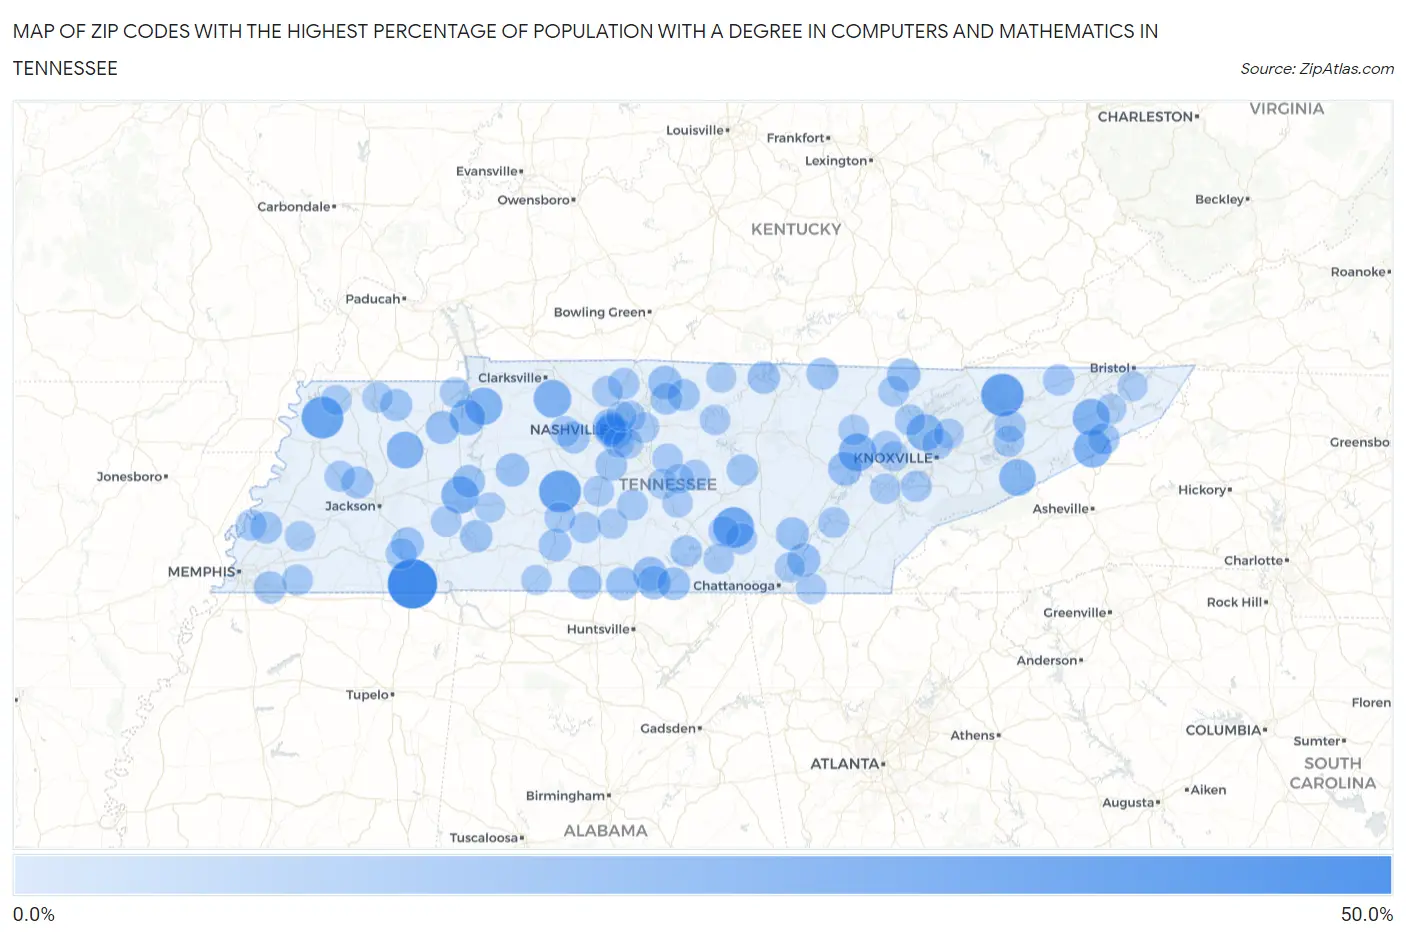
Map of Zip Codes with the Highest Percentage of Population with a Degree in Computers and Mathematics in Tennessee
0.0%
50.0%
Zip Codes with the Highest Percentage of Population with a Degree in Computers and Mathematics in Tennessee
| Zip Code | % Graduates | vs State | vs National | |
| 1. | 38339 | 42.2% | 3.7%(+38.5)#1 | 4.9%(+37.3)#120 |
| 2. | 37881 | 28.6% | 3.7%(+24.9)#2 | 4.9%(+23.7)#243 |
| 3. | 38487 | 27.3% | 3.7%(+23.6)#3 | 4.9%(+22.4)#258 |
| 4. | 38240 | 27.2% | 3.7%(+23.5)#4 | 4.9%(+22.3)#260 |
| 5. | 37305 | 25.0% | 3.7%(+21.3)#5 | 4.9%(+20.1)#297 |
| 6. | 37657 | 19.1% | 3.7%(+15.5)#6 | 4.9%(+14.3)#496 |
| 7. | 37171 | 19.0% | 3.7%(+15.4)#7 | 4.9%(+14.2)#502 |
| 8. | 37829 | 18.9% | 3.7%(+15.2)#8 | 4.9%(+14.0)#511 |
| 9. | 37690 | 18.4% | 3.7%(+14.7)#9 | 4.9%(+13.5)#546 |
| 10. | 37175 | 18.4% | 3.7%(+14.7)#10 | 4.9%(+13.5)#547 |
| 11. | 38363 | 18.3% | 3.7%(+14.7)#11 | 4.9%(+13.4)#549 |
| 12. | 38258 | 17.5% | 3.7%(+13.9)#12 | 4.9%(+12.6)#585 |
| 13. | 37754 | 17.3% | 3.7%(+13.6)#13 | 4.9%(+12.4)#609 |
| 14. | 37722 | 17.2% | 3.7%(+13.5)#14 | 4.9%(+12.3)#618 |
| 15. | 38221 | 15.5% | 3.7%(+11.8)#15 | 4.9%(+10.6)#747 |
| 16. | 37854 | 12.0% | 3.7%(+8.28)#16 | 4.9%(+7.06)#1,220 |
| 17. | 37348 | 11.8% | 3.7%(+8.09)#17 | 4.9%(+6.87)#1,265 |
| 18. | 37022 | 11.4% | 3.7%(+7.70)#18 | 4.9%(+6.49)#1,351 |
| 19. | 37819 | 11.4% | 3.7%(+7.69)#19 | 4.9%(+6.47)#1,359 |
| 20. | 37335 | 11.3% | 3.7%(+7.61)#20 | 4.9%(+6.39)#1,385 |
| 21. | 37219 | 11.3% | 3.7%(+7.60)#21 | 4.9%(+6.38)#1,387 |
| 22. | 38477 | 11.1% | 3.7%(+7.46)#22 | 4.9%(+6.24)#1,412 |
| 23. | 37140 | 11.1% | 3.7%(+7.43)#23 | 4.9%(+6.22)#1,421 |
| 24. | 37341 | 10.9% | 3.7%(+7.18)#24 | 4.9%(+5.97)#1,492 |
| 25. | 38236 | 10.7% | 3.7%(+7.04)#25 | 4.9%(+5.82)#1,521 |
| 26. | 38488 | 10.5% | 3.7%(+6.78)#26 | 4.9%(+5.56)#1,597 |
| 27. | 37338 | 10.2% | 3.7%(+6.55)#27 | 4.9%(+5.34)#1,681 |
| 28. | 38334 | 10.2% | 3.7%(+6.53)#28 | 4.9%(+5.31)#1,688 |
| 29. | 37345 | 10.2% | 3.7%(+6.51)#29 | 4.9%(+5.29)#1,696 |
| 30. | 38425 | 9.5% | 3.7%(+5.81)#30 | 4.9%(+4.60)#1,972 |
| 31. | 38551 | 9.5% | 3.7%(+5.81)#31 | 4.9%(+4.59)#1,974 |
| 32. | 38380 | 9.4% | 3.7%(+5.76)#32 | 4.9%(+4.54)#2,002 |
| 33. | 38456 | 9.2% | 3.7%(+5.54)#33 | 4.9%(+4.32)#2,101 |
| 34. | 38125 | 9.2% | 3.7%(+5.51)#34 | 4.9%(+4.30)#2,119 |
| 35. | 38225 | 8.9% | 3.7%(+5.22)#35 | 4.9%(+4.00)#2,315 |
| 36. | 37210 | 8.7% | 3.7%(+5.01)#36 | 4.9%(+3.80)#2,427 |
| 37. | 38337 | 8.6% | 3.7%(+4.92)#37 | 4.9%(+3.71)#2,472 |
| 38. | 38577 | 8.6% | 3.7%(+4.87)#38 | 4.9%(+3.66)#2,506 |
| 39. | 37074 | 8.4% | 3.7%(+4.70)#39 | 4.9%(+3.49)#2,603 |
| 40. | 37067 | 8.2% | 3.7%(+4.48)#40 | 4.9%(+3.27)#2,779 |
| 41. | 38058 | 8.1% | 3.7%(+4.44)#41 | 4.9%(+3.22)#2,811 |
| 42. | 37082 | 8.1% | 3.7%(+4.40)#42 | 4.9%(+3.19)#2,833 |
| 43. | 37813 | 8.1% | 3.7%(+4.38)#43 | 4.9%(+3.16)#2,856 |
| 44. | 37650 | 8.0% | 3.7%(+4.37)#44 | 4.9%(+3.15)#2,866 |
| 45. | 37031 | 7.9% | 3.7%(+4.26)#45 | 4.9%(+3.04)#2,950 |
| 46. | 37330 | 7.8% | 3.7%(+4.15)#46 | 4.9%(+2.93)#3,042 |
| 47. | 38587 | 7.8% | 3.7%(+4.11)#47 | 4.9%(+2.89)#3,078 |
| 48. | 37188 | 7.4% | 3.7%(+3.76)#48 | 4.9%(+2.55)#3,397 |
| 49. | 37873 | 7.4% | 3.7%(+3.71)#49 | 4.9%(+2.49)#3,447 |
| 50. | 37339 | 7.3% | 3.7%(+3.64)#50 | 4.9%(+2.42)#3,510 |
| 51. | 38451 | 7.2% | 3.7%(+3.55)#51 | 4.9%(+2.33)#3,603 |
| 52. | 38315 | 7.2% | 3.7%(+3.51)#52 | 4.9%(+2.29)#3,638 |
| 53. | 37228 | 7.2% | 3.7%(+3.50)#53 | 4.9%(+2.28)#3,656 |
| 54. | 37203 | 7.0% | 3.7%(+3.34)#54 | 4.9%(+2.13)#3,797 |
| 55. | 37737 | 7.0% | 3.7%(+3.28)#55 | 4.9%(+2.06)#3,887 |
| 56. | 37890 | 6.9% | 3.7%(+3.24)#56 | 4.9%(+2.02)#3,924 |
| 57. | 37138 | 6.8% | 3.7%(+3.12)#57 | 4.9%(+1.90)#4,074 |
| 58. | 38023 | 6.8% | 3.7%(+3.10)#58 | 4.9%(+1.88)#4,109 |
| 59. | 38474 | 6.6% | 3.7%(+2.95)#59 | 4.9%(+1.73)#4,300 |
| 60. | 38066 | 6.6% | 3.7%(+2.92)#60 | 4.9%(+1.71)#4,330 |
| 61. | 37180 | 6.5% | 3.7%(+2.84)#61 | 4.9%(+1.63)#4,427 |
| 62. | 37847 | 6.5% | 3.7%(+2.81)#62 | 4.9%(+1.59)#4,487 |
| 63. | 37201 | 6.5% | 3.7%(+2.80)#63 | 4.9%(+1.59)#4,494 |
| 64. | 38001 | 6.5% | 3.7%(+2.80)#64 | 4.9%(+1.58)#4,497 |
| 65. | 37769 | 6.4% | 3.7%(+2.76)#65 | 4.9%(+1.55)#4,542 |
| 66. | 37322 | 6.3% | 3.7%(+2.67)#66 | 4.9%(+1.46)#4,692 |
| 67. | 37073 | 6.3% | 3.7%(+2.57)#67 | 4.9%(+1.36)#4,840 |
| 68. | 37122 | 6.2% | 3.7%(+2.53)#68 | 4.9%(+1.32)#4,921 |
| 69. | 37301 | 6.2% | 3.7%(+2.52)#69 | 4.9%(+1.31)#4,941 |
| 70. | 37840 | 6.2% | 3.7%(+2.52)#70 | 4.9%(+1.30)#4,948 |
| 71. | 38374 | 6.2% | 3.7%(+2.51)#71 | 4.9%(+1.29)#4,968 |
| 72. | 37190 | 6.1% | 3.7%(+2.38)#72 | 4.9%(+1.17)#5,186 |
| 73. | 37174 | 6.1% | 3.7%(+2.38)#73 | 4.9%(+1.16)#5,208 |
| 74. | 37770 | 6.0% | 3.7%(+2.33)#74 | 4.9%(+1.12)#5,276 |
| 75. | 37356 | 6.0% | 3.7%(+2.27)#75 | 4.9%(+1.06)#5,372 |
| 76. | 37918 | 5.9% | 3.7%(+2.22)#76 | 4.9%(+1.00)#5,487 |
| 77. | 37302 | 5.9% | 3.7%(+2.20)#77 | 4.9%(+0.980)#5,538 |
| 78. | 38237 | 5.8% | 3.7%(+2.10)#78 | 4.9%(+0.884)#5,715 |
| 79. | 37211 | 5.8% | 3.7%(+2.08)#79 | 4.9%(+0.860)#5,769 |
| 80. | 37187 | 5.7% | 3.7%(+2.05)#80 | 4.9%(+0.835)#5,819 |
| 81. | 37085 | 5.7% | 3.7%(+1.98)#81 | 4.9%(+0.769)#5,949 |
| 82. | 38560 | 5.6% | 3.7%(+1.88)#82 | 4.9%(+0.662)#6,180 |
| 83. | 37774 | 5.5% | 3.7%(+1.84)#83 | 4.9%(+0.626)#6,263 |
| 84. | 37013 | 5.5% | 3.7%(+1.80)#84 | 4.9%(+0.582)#6,355 |
| 85. | 37604 | 5.5% | 3.7%(+1.77)#85 | 4.9%(+0.558)#6,393 |
| 86. | 37127 | 5.4% | 3.7%(+1.77)#86 | 4.9%(+0.555)#6,401 |
| 87. | 37721 | 5.4% | 3.7%(+1.77)#87 | 4.9%(+0.551)#6,409 |
| 88. | 37018 | 5.4% | 3.7%(+1.75)#88 | 4.9%(+0.536)#6,445 |
| 89. | 37343 | 5.4% | 3.7%(+1.75)#89 | 4.9%(+0.530)#6,456 |
| 90. | 37115 | 5.4% | 3.7%(+1.74)#90 | 4.9%(+0.522)#6,472 |
| 91. | 38049 | 5.4% | 3.7%(+1.73)#91 | 4.9%(+0.511)#6,494 |
| 92. | 38222 | 5.4% | 3.7%(+1.72)#92 | 4.9%(+0.504)#6,513 |
| 93. | 37091 | 5.3% | 3.7%(+1.67)#93 | 4.9%(+0.454)#6,646 |
| 94. | 38469 | 5.3% | 3.7%(+1.67)#94 | 4.9%(+0.450)#6,656 |
| 95. | 37150 | 5.3% | 3.7%(+1.65)#95 | 4.9%(+0.431)#6,699 |
| 96. | 37830 | 5.3% | 3.7%(+1.63)#96 | 4.9%(+0.411)#6,743 |
| 97. | 38260 | 5.3% | 3.7%(+1.61)#97 | 4.9%(+0.392)#6,791 |
| 98. | 37618 | 5.2% | 3.7%(+1.51)#98 | 4.9%(+0.296)#7,009 |
| 99. | 37149 | 5.2% | 3.7%(+1.51)#99 | 4.9%(+0.293)#7,014 |
| 100. | 37096 | 5.1% | 3.7%(+1.47)#100 | 4.9%(+0.251)#7,103 |
Common Questions
What are the Top 10 Zip Codes with the Highest Percentage of Population with a Degree in Computers and Mathematics in Tennessee?
Top 10 Zip Codes with the Highest Percentage of Population with a Degree in Computers and Mathematics in Tennessee are:
What zip code has the Highest Percentage of Population with a Degree in Computers and Mathematics in Tennessee?
38339 has the Highest Percentage of Population with a Degree in Computers and Mathematics in Tennessee with 42.2%.
What is the Percentage of Population with a Degree in Computers and Mathematics in the State of Tennessee?
Percentage of Population with a Degree in Computers and Mathematics in Tennessee is 3.7%.
What is the Percentage of Population with a Degree in Computers and Mathematics in the United States?
Percentage of Population with a Degree in Computers and Mathematics in the United States is 4.9%.