New Hope, TN Map & Demographics
New Hope Map
New Hope Overview
$26,988
PER CAPITA INCOME
$62,159
AVG FAMILY INCOME
$47,250
AVG HOUSEHOLD INCOME
52.3%
WAGE / INCOME GAP [ % ]
47.7¢/ $1
WAGE / INCOME GAP [ $ ]
0.48
INEQUALITY / GINI INDEX
839
TOTAL POPULATION
407
MALE POPULATION
432
FEMALE POPULATION
94.21
MALES / 100 FEMALES
106.14
FEMALES / 100 MALES
47.9
MEDIAN AGE
2.8
AVG FAMILY SIZE
2.3
AVG HOUSEHOLD SIZE
418
LABOR FORCE [ PEOPLE ]
58.3%
PERCENT IN LABOR FORCE
9.8%
UNEMPLOYMENT RATE
New Hope Area Codes
Income in New Hope
Income Overview in New Hope
Per Capita Income in New Hope is $26,988, while median incomes of families and households are $62,159 and $47,250 respectively.
| Characteristic | Number | Measure |
| Per Capita Income | 839 | $26,988 |
| Median Family Income | 229 | $62,159 |
| Mean Family Income | 229 | $79,012 |
| Median Household Income | 369 | $47,250 |
| Mean Household Income | 369 | $59,954 |
| Income Deficit | 229 | $0 |
| Wage / Income Gap (%) | 839 | 52.35% |
| Wage / Income Gap ($) | 839 | 47.65¢ per $1 |
| Gini / Inequality Index | 839 | 0.48 |
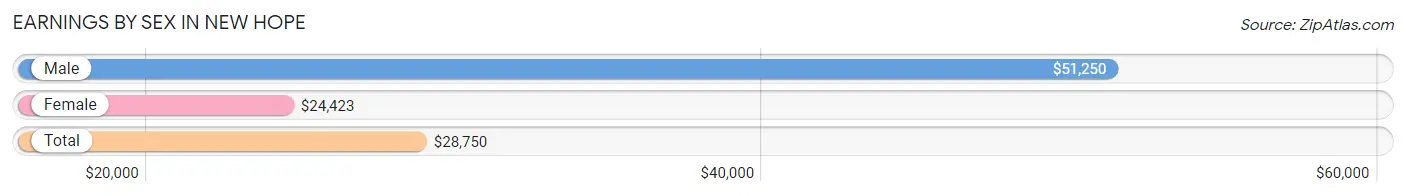
Earnings by Sex in New Hope
Average Earnings in New Hope are $28,750, $51,250 for men and $24,423 for women, a difference of 52.3%.
| Sex | Number | Average Earnings |
| Male | 181 (44.0%) | $51,250 |
| Female | 230 (56.0%) | $24,423 |
| Total | 411 (100.0%) | $28,750 |
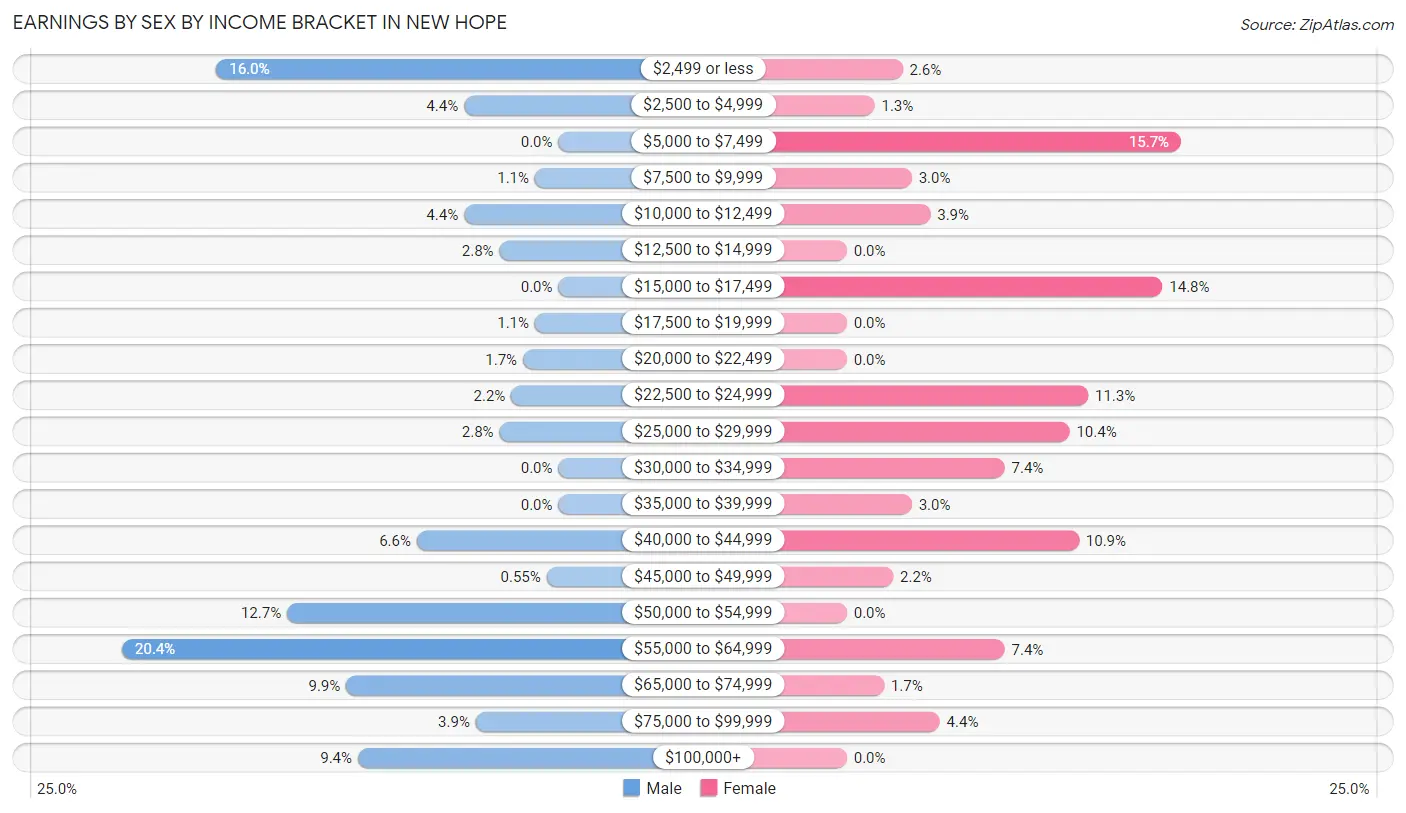
Earnings by Sex by Income Bracket in New Hope
The most common earnings brackets in New Hope are $55,000 to $64,999 for men (37 | 20.4%) and $5,000 to $7,499 for women (36 | 15.7%).
| Income | Male | Female |
| $2,499 or less | 29 (16.0%) | 6 (2.6%) |
| $2,500 to $4,999 | 8 (4.4%) | 3 (1.3%) |
| $5,000 to $7,499 | 0 (0.0%) | 36 (15.7%) |
| $7,500 to $9,999 | 2 (1.1%) | 7 (3.0%) |
| $10,000 to $12,499 | 8 (4.4%) | 9 (3.9%) |
| $12,500 to $14,999 | 5 (2.8%) | 0 (0.0%) |
| $15,000 to $17,499 | 0 (0.0%) | 34 (14.8%) |
| $17,500 to $19,999 | 2 (1.1%) | 0 (0.0%) |
| $20,000 to $22,499 | 3 (1.7%) | 0 (0.0%) |
| $22,500 to $24,999 | 4 (2.2%) | 26 (11.3%) |
| $25,000 to $29,999 | 5 (2.8%) | 24 (10.4%) |
| $30,000 to $34,999 | 0 (0.0%) | 17 (7.4%) |
| $35,000 to $39,999 | 0 (0.0%) | 7 (3.0%) |
| $40,000 to $44,999 | 12 (6.6%) | 25 (10.9%) |
| $45,000 to $49,999 | 1 (0.5%) | 5 (2.2%) |
| $50,000 to $54,999 | 23 (12.7%) | 0 (0.0%) |
| $55,000 to $64,999 | 37 (20.4%) | 17 (7.4%) |
| $65,000 to $74,999 | 18 (9.9%) | 4 (1.7%) |
| $75,000 to $99,999 | 7 (3.9%) | 10 (4.3%) |
| $100,000+ | 17 (9.4%) | 0 (0.0%) |
| Total | 181 (100.0%) | 230 (100.0%) |
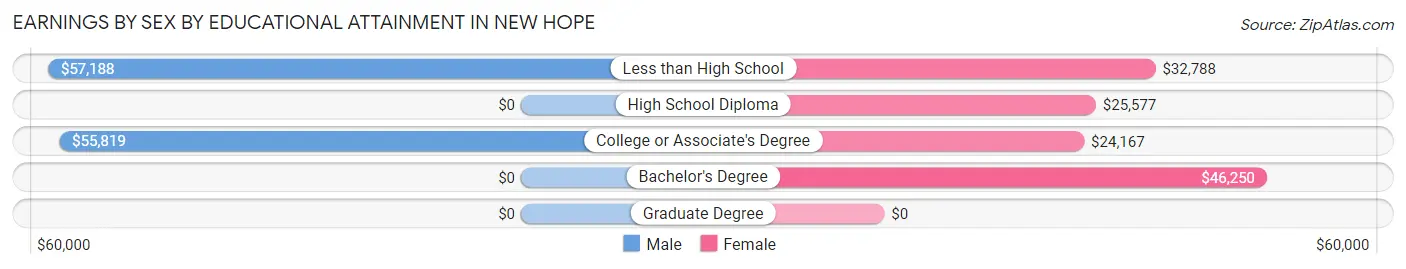
Earnings by Sex by Educational Attainment in New Hope
Average earnings in New Hope are $52,391 for men and $26,181 for women, a difference of 50.0%. Men with an educational attainment of less than high school enjoy the highest average annual earnings of $57,188, while those with college or associate's degree education earn the least with $55,819. Women with an educational attainment of bachelor's degree earn the most with the average annual earnings of $46,250, while those with college or associate's degree education have the smallest earnings of $24,167.
| Educational Attainment | Male Income | Female Income |
| Less than High School | $57,188 | $32,788 |
| High School Diploma | - | - |
| College or Associate's Degree | $55,819 | $24,167 |
| Bachelor's Degree | - | - |
| Graduate Degree | - | - |
| Total | $52,391 | $26,181 |
Family Income in New Hope
Family Income Brackets in New Hope
According to the New Hope family income data, there are 80 families falling into the $50,000 to $74,999 income range, which is the most common income bracket and makes up 34.9% of all families. Conversely, the $10,000 to $14,999 income bracket is the least frequent group with only 7 families (3.1%) belonging to this category.
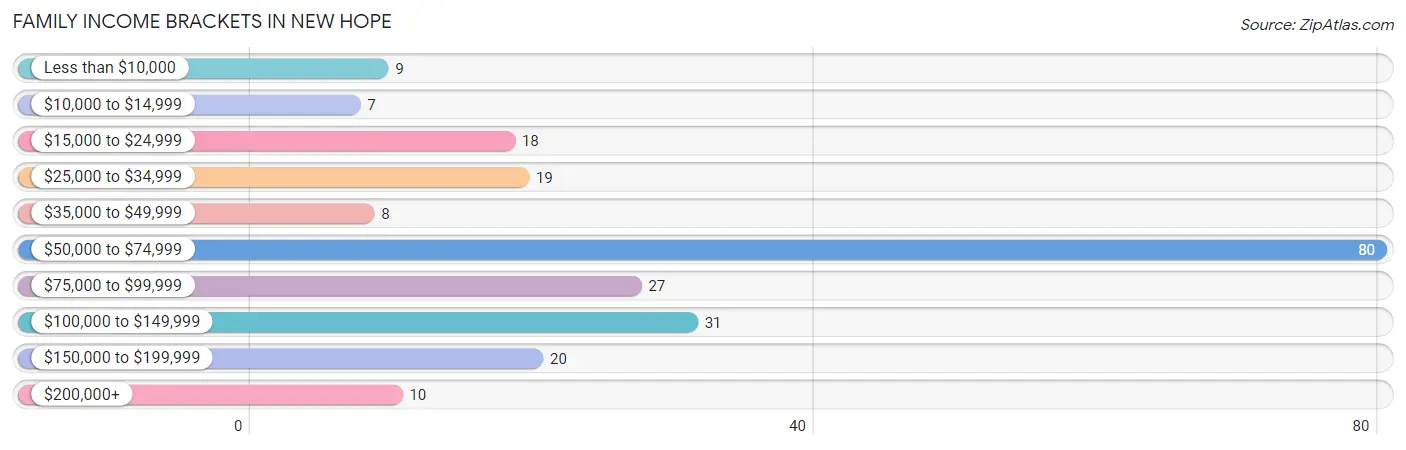
| Income Bracket | # Families | % Families |
| Less than $10,000 | 9 | 3.9% |
| $10,000 to $14,999 | 7 | 3.1% |
| $15,000 to $24,999 | 18 | 7.9% |
| $25,000 to $34,999 | 19 | 8.3% |
| $35,000 to $49,999 | 8 | 3.5% |
| $50,000 to $74,999 | 80 | 34.9% |
| $75,000 to $99,999 | 27 | 11.8% |
| $100,000 to $149,999 | 31 | 13.5% |
| $150,000 to $199,999 | 20 | 8.7% |
| $200,000+ | 10 | 4.4% |
Family Income by Famaliy Size in New Hope
2-person families (124 | 54.1%) account for the highest median family income in New Hope with $79,167 per family, while 2-person families (124 | 54.1%) have the highest median income of $39,584 per family member.
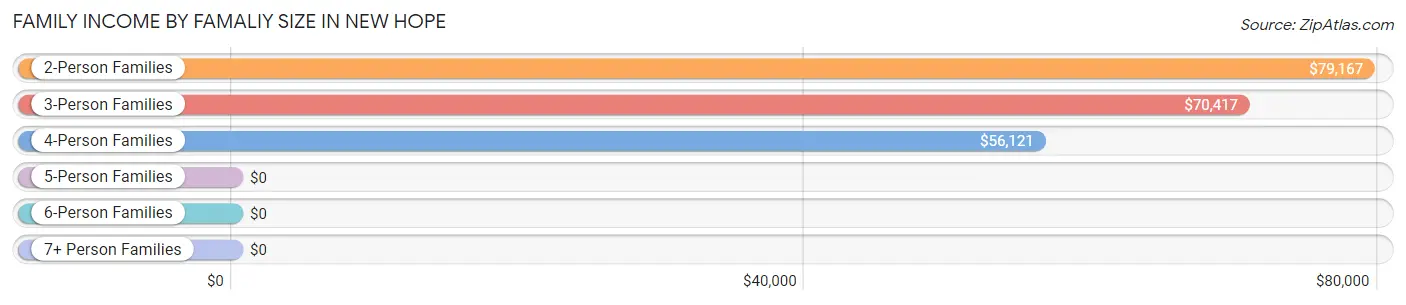
| Income Bracket | # Families | Median Income |
| 2-Person Families | 124 (54.1%) | $79,167 |
| 3-Person Families | 29 (12.7%) | $70,417 |
| 4-Person Families | 62 (27.1%) | $56,121 |
| 5-Person Families | 11 (4.8%) | $0 |
| 6-Person Families | 3 (1.3%) | $0 |
| 7+ Person Families | 0 (0.0%) | $0 |
| Total | 229 (100.0%) | $62,159 |
Family Income by Number of Earners in New Hope
The median family income in New Hope is $62,159, with families comprising 3+ earners (8) having the highest median family income of $166,875, while families with 1 earner (74) have the lowest median family income of $56,379, accounting for 3.5% and 32.3% of families, respectively.
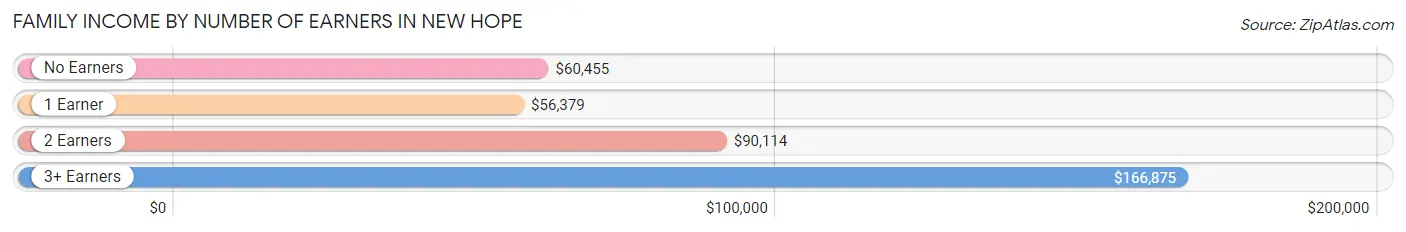
| Number of Earners | # Families | Median Income |
| No Earners | 60 (26.2%) | $60,455 |
| 1 Earner | 74 (32.3%) | $56,379 |
| 2 Earners | 87 (38.0%) | $90,114 |
| 3+ Earners | 8 (3.5%) | $166,875 |
| Total | 229 (100.0%) | $62,159 |
Household Income in New Hope
Household Income Brackets in New Hope
With 86 households falling in the category, the $50,000 to $74,999 income range is the most frequent in New Hope, accounting for 23.3% of all households. In contrast, only 7 households (1.9%) fall into the $10,000 to $14,999 income bracket, making it the least populous group.
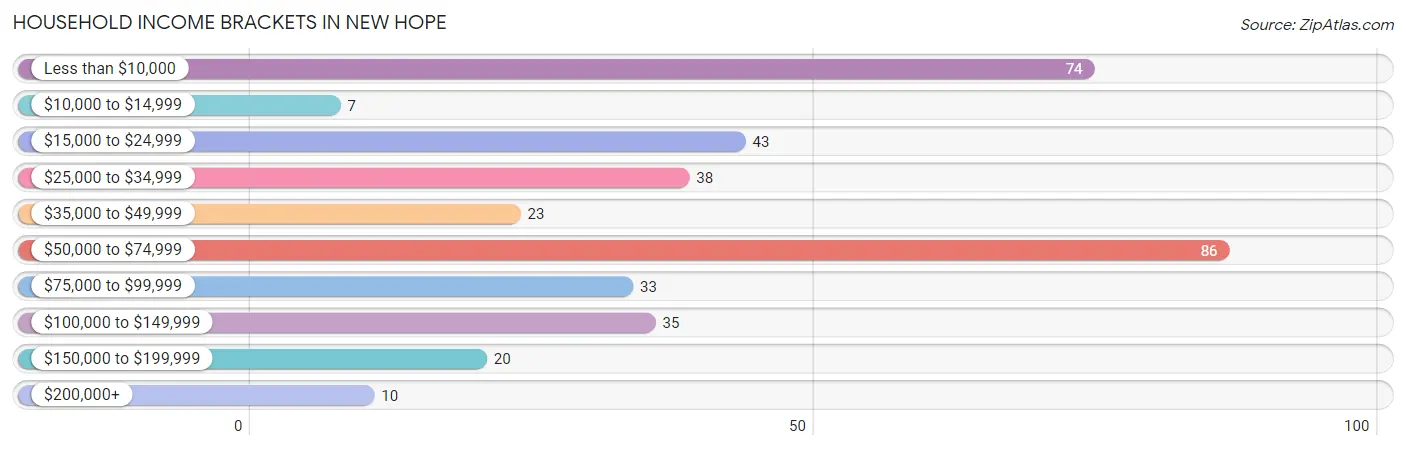
| Income Bracket | # Households | % Households |
| Less than $10,000 | 74 | 20.1% |
| $10,000 to $14,999 | 7 | 1.9% |
| $15,000 to $24,999 | 43 | 11.7% |
| $25,000 to $34,999 | 38 | 10.3% |
| $35,000 to $49,999 | 23 | 6.2% |
| $50,000 to $74,999 | 86 | 23.3% |
| $75,000 to $99,999 | 33 | 8.9% |
| $100,000 to $149,999 | 35 | 9.5% |
| $150,000 to $199,999 | 20 | 5.4% |
| $200,000+ | 10 | 2.7% |
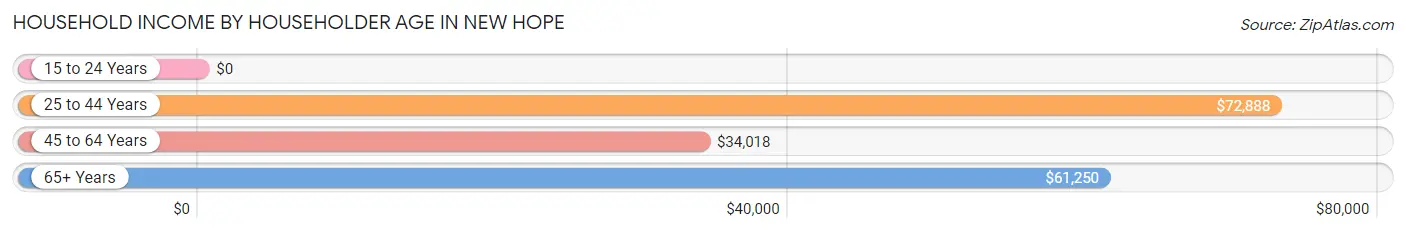
Household Income by Householder Age in New Hope
The median household income in New Hope is $47,250, with the highest median household income of $72,888 found in the 25 to 44 years age bracket for the primary householder. A total of 87 households (23.6%) fall into this category. Meanwhile, the 15 to 24 years age bracket for the primary householder has the lowest median household income of $0, with 24 households (6.5%) in this group.
| Income Bracket | # Households | Median Income |
| 15 to 24 Years | 24 (6.5%) | $0 |
| 25 to 44 Years | 87 (23.6%) | $72,888 |
| 45 to 64 Years | 135 (36.6%) | $34,018 |
| 65+ Years | 123 (33.3%) | $61,250 |
| Total | 369 (100.0%) | $47,250 |
Poverty in New Hope
Income Below Poverty by Sex and Age in New Hope
With 22.6% poverty level for males and 26.9% for females among the residents of New Hope, 15 year old males and 15 year old females are the most vulnerable to poverty, with 4 males (100.0%) and 10 females (100.0%) in their respective age groups living below the poverty level.
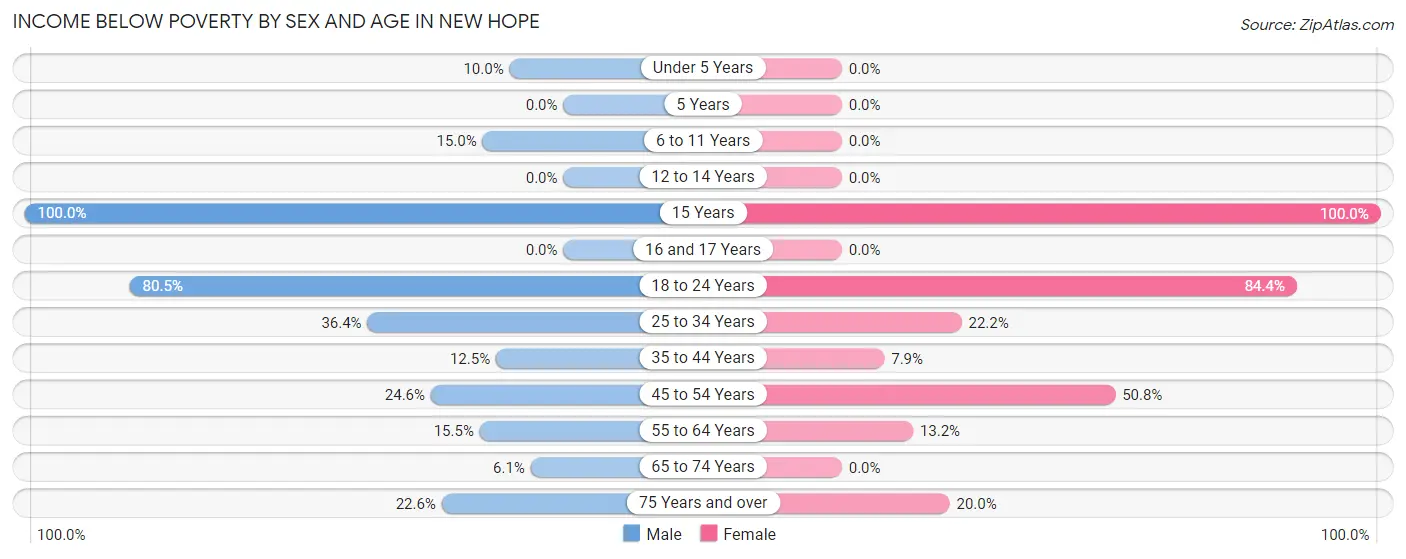
| Age Bracket | Male | Female |
| Under 5 Years | 3 (10.0%) | 0 (0.0%) |
| 5 Years | 0 (0.0%) | 0 (0.0%) |
| 6 to 11 Years | 3 (15.0%) | 0 (0.0%) |
| 12 to 14 Years | 0 (0.0%) | 0 (0.0%) |
| 15 Years | 4 (100.0%) | 10 (100.0%) |
| 16 and 17 Years | 0 (0.0%) | 0 (0.0%) |
| 18 to 24 Years | 33 (80.5%) | 38 (84.4%) |
| 25 to 34 Years | 8 (36.4%) | 16 (22.2%) |
| 35 to 44 Years | 6 (12.5%) | 3 (7.9%) |
| 45 to 54 Years | 15 (24.6%) | 34 (50.7%) |
| 55 to 64 Years | 9 (15.5%) | 7 (13.2%) |
| 65 to 74 Years | 4 (6.1%) | 0 (0.0%) |
| 75 Years and over | 7 (22.6%) | 8 (20.0%) |
| Total | 92 (22.6%) | 116 (26.9%) |
Income Above Poverty by Sex and Age in New Hope
According to the poverty statistics in New Hope, males aged 12 to 14 years and females aged under 5 years are the age groups that are most secure financially, with 100.0% of males and 100.0% of females in these age groups living above the poverty line.
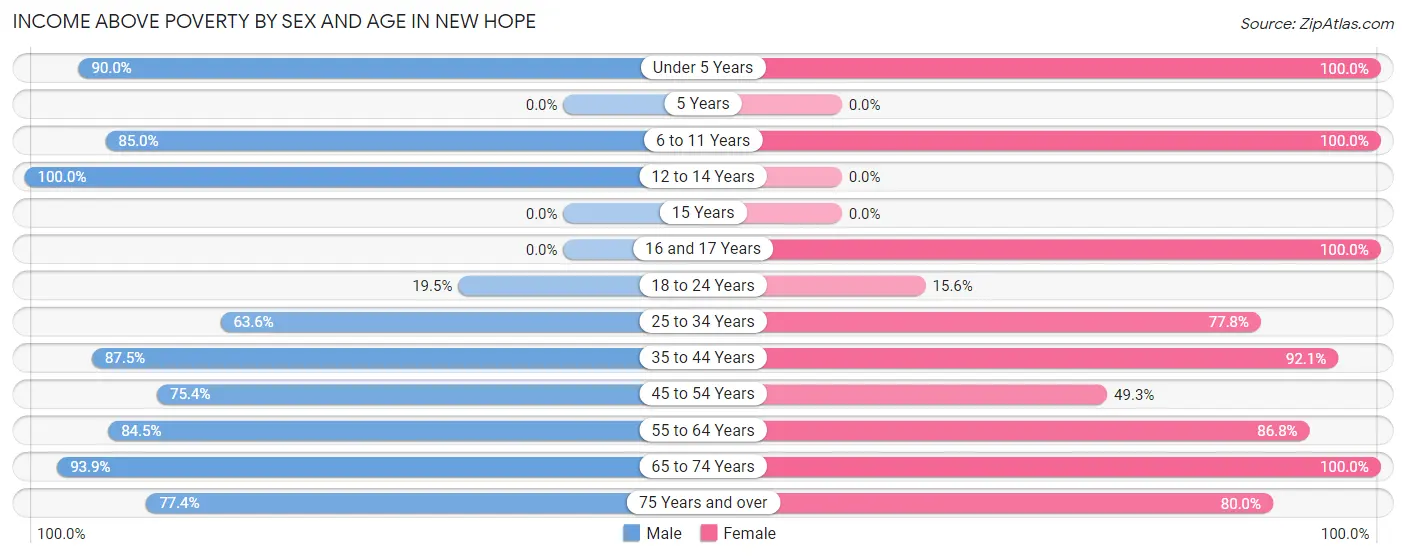
| Age Bracket | Male | Female |
| Under 5 Years | 27 (90.0%) | 18 (100.0%) |
| 5 Years | 0 (0.0%) | 0 (0.0%) |
| 6 to 11 Years | 17 (85.0%) | 14 (100.0%) |
| 12 to 14 Years | 26 (100.0%) | 0 (0.0%) |
| 15 Years | 0 (0.0%) | 0 (0.0%) |
| 16 and 17 Years | 0 (0.0%) | 5 (100.0%) |
| 18 to 24 Years | 8 (19.5%) | 7 (15.6%) |
| 25 to 34 Years | 14 (63.6%) | 56 (77.8%) |
| 35 to 44 Years | 42 (87.5%) | 35 (92.1%) |
| 45 to 54 Years | 46 (75.4%) | 33 (49.2%) |
| 55 to 64 Years | 49 (84.5%) | 46 (86.8%) |
| 65 to 74 Years | 62 (93.9%) | 70 (100.0%) |
| 75 Years and over | 24 (77.4%) | 32 (80.0%) |
| Total | 315 (77.4%) | 316 (73.2%) |
Income Below Poverty Among Married-Couple Families in New Hope
The poverty statistics for married-couple families in New Hope show that 17.8% or 29 of the total 163 families live below the poverty line. Families with 1 or 2 children have the highest poverty rate of 57.7%, comprising of 15 families. On the other hand, families with 3 or 4 children have the lowest poverty rate of 0.0%, which includes 0 families.
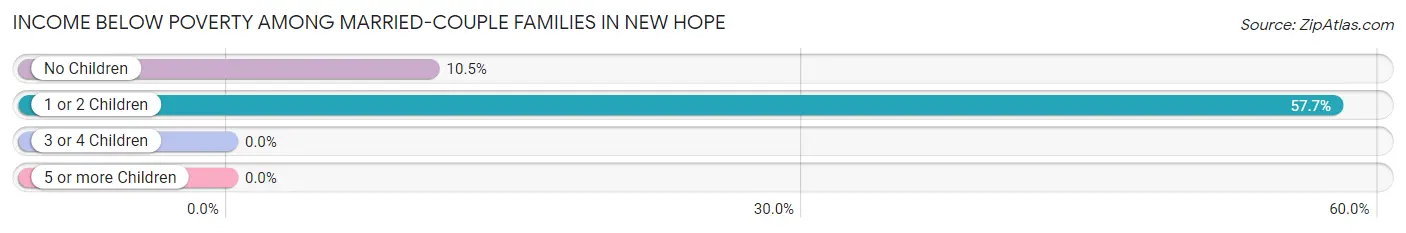
| Children | Above Poverty | Below Poverty |
| No Children | 119 (89.5%) | 14 (10.5%) |
| 1 or 2 Children | 11 (42.3%) | 15 (57.7%) |
| 3 or 4 Children | 4 (100.0%) | 0 (0.0%) |
| 5 or more Children | 0 (0.0%) | 0 (0.0%) |
| Total | 134 (82.2%) | 29 (17.8%) |
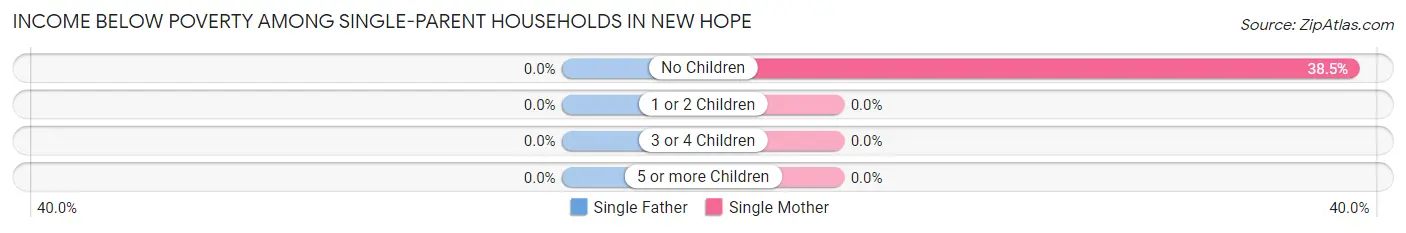
Income Below Poverty Among Single-Parent Households in New Hope
| Children | Single Father | Single Mother |
| No Children | 0 (0.0%) | 5 (38.5%) |
| 1 or 2 Children | 0 (0.0%) | 0 (0.0%) |
| 3 or 4 Children | 0 (0.0%) | 0 (0.0%) |
| 5 or more Children | 0 (0.0%) | 0 (0.0%) |
| Total | 0 (0.0%) | 5 (15.1%) |
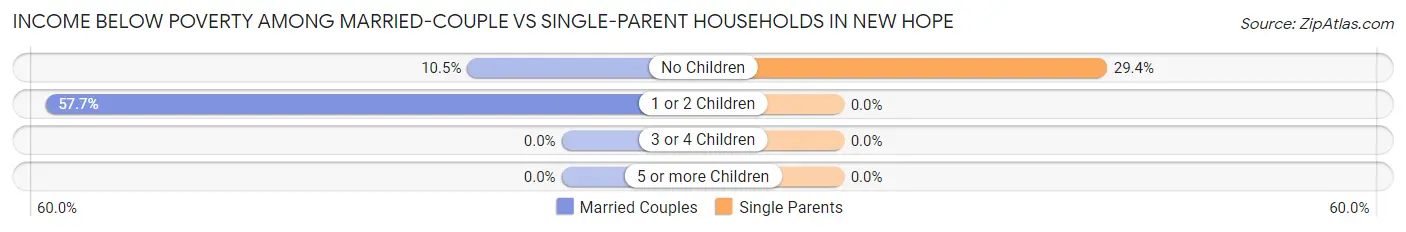
Income Below Poverty Among Married-Couple vs Single-Parent Households in New Hope
The poverty data for New Hope shows that 29 of the married-couple family households (17.8%) and 5 of the single-parent households (7.6%) are living below the poverty level. Within the married-couple family households, those with 1 or 2 children have the highest poverty rate, with 15 households (57.7%) falling below the poverty line. Among the single-parent households, those with no children have the highest poverty rate, with 5 household (29.4%) living below poverty.
| Children | Married-Couple Families | Single-Parent Households |
| No Children | 14 (10.5%) | 5 (29.4%) |
| 1 or 2 Children | 15 (57.7%) | 0 (0.0%) |
| 3 or 4 Children | 0 (0.0%) | 0 (0.0%) |
| 5 or more Children | 0 (0.0%) | 0 (0.0%) |
| Total | 29 (17.8%) | 5 (7.6%) |
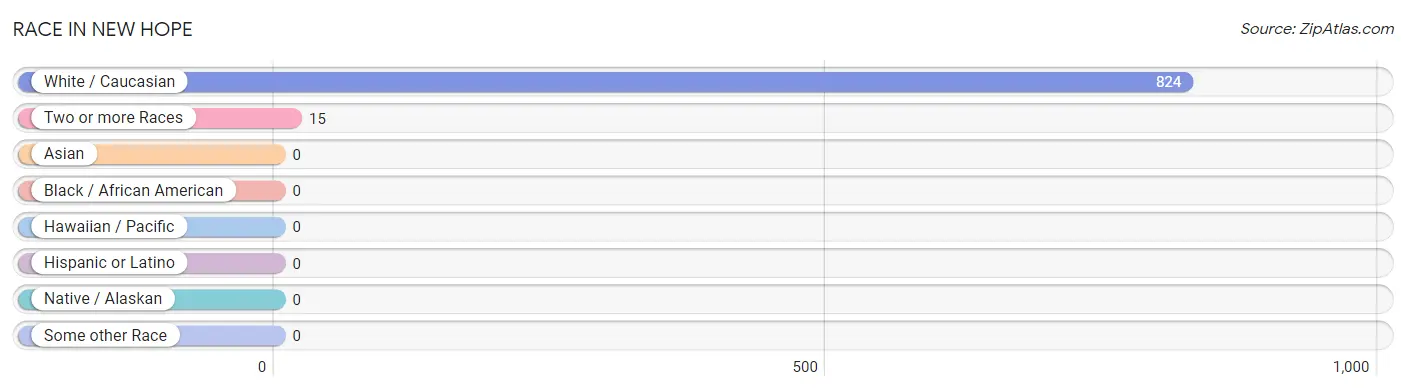
Race in New Hope
The most populous races in New Hope are White / Caucasian (824 | 98.2%), and Two or more Races (15 | 1.8%).
| Race | # Population | % Population |
| Asian | 0 | 0.0% |
| Black / African American | 0 | 0.0% |
| Hawaiian / Pacific | 0 | 0.0% |
| Hispanic or Latino | 0 | 0.0% |
| Native / Alaskan | 0 | 0.0% |
| White / Caucasian | 824 | 98.2% |
| Two or more Races | 15 | 1.8% |
| Some other Race | 0 | 0.0% |
| Total | 839 | 100.0% |
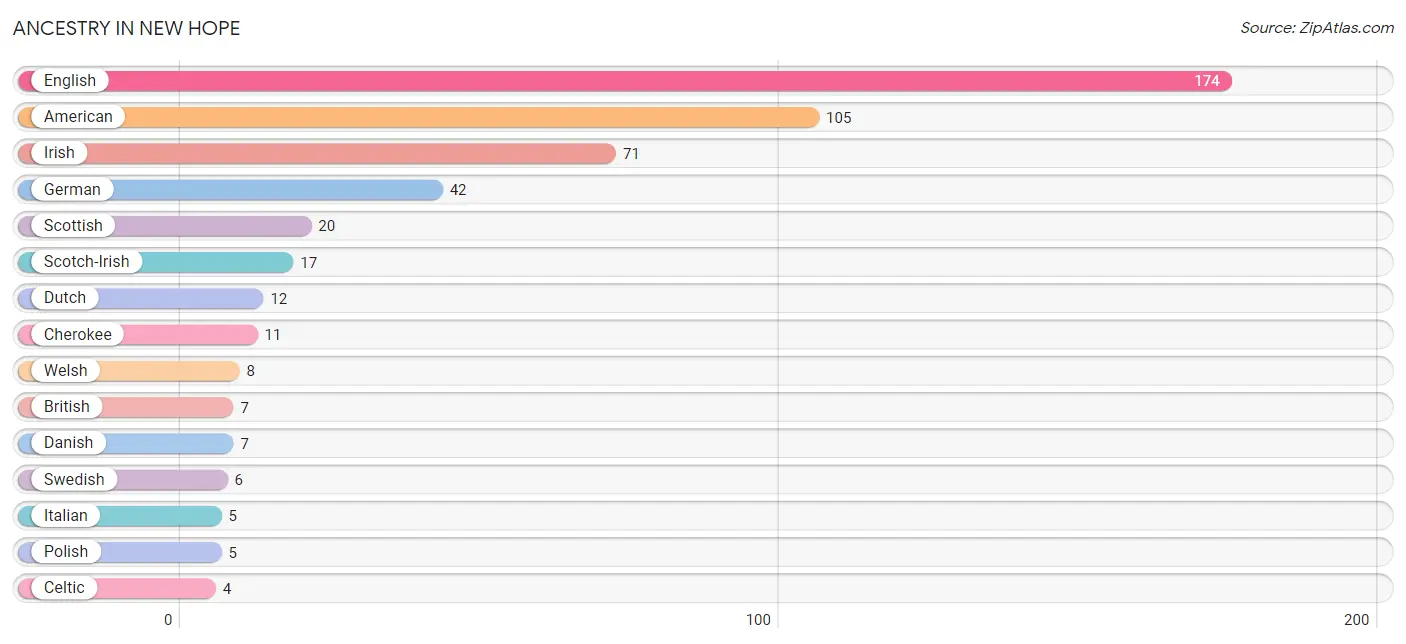
Ancestry in New Hope
The most populous ancestries reported in New Hope are English (174 | 20.7%), American (105 | 12.5%), Irish (71 | 8.5%), German (42 | 5.0%), and Scottish (20 | 2.4%), together accounting for 49.1% of all New Hope residents.
| Ancestry | # Population | % Population |
| American | 105 | 12.5% |
| British | 7 | 0.8% |
| Celtic | 4 | 0.5% |
| Cherokee | 11 | 1.3% |
| Danish | 7 | 0.8% |
| Dutch | 12 | 1.4% |
| English | 174 | 20.7% |
| European | 2 | 0.2% |
| German | 42 | 5.0% |
| Irish | 71 | 8.5% |
| Iroquois | 2 | 0.2% |
| Italian | 5 | 0.6% |
| Polish | 5 | 0.6% |
| Scotch-Irish | 17 | 2.0% |
| Scottish | 20 | 2.4% |
| Swedish | 6 | 0.7% |
| Welsh | 8 | 0.9% | View All 17 Rows |
Immigrants in New Hope

| Immigration Origin | # Population | % Population | View All 0 Rows |
Sex and Age in New Hope
Sex and Age in New Hope
The most populous age groups in New Hope are 70 to 74 Years (49 | 12.0%) for men and 30 to 34 Years (44 | 10.2%) for women.
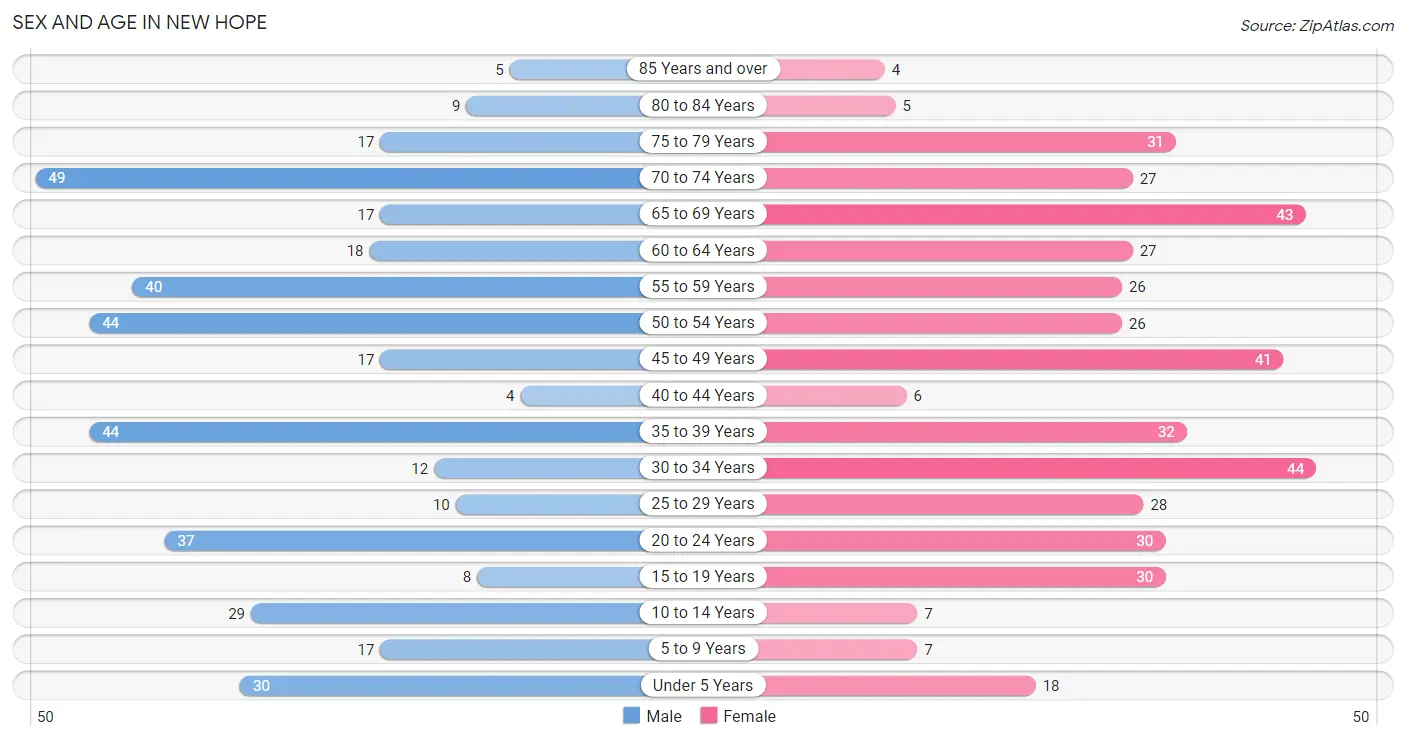
| Age Bracket | Male | Female |
| Under 5 Years | 30 (7.4%) | 18 (4.2%) |
| 5 to 9 Years | 17 (4.2%) | 7 (1.6%) |
| 10 to 14 Years | 29 (7.1%) | 7 (1.6%) |
| 15 to 19 Years | 8 (2.0%) | 30 (6.9%) |
| 20 to 24 Years | 37 (9.1%) | 30 (6.9%) |
| 25 to 29 Years | 10 (2.5%) | 28 (6.5%) |
| 30 to 34 Years | 12 (2.9%) | 44 (10.2%) |
| 35 to 39 Years | 44 (10.8%) | 32 (7.4%) |
| 40 to 44 Years | 4 (1.0%) | 6 (1.4%) |
| 45 to 49 Years | 17 (4.2%) | 41 (9.5%) |
| 50 to 54 Years | 44 (10.8%) | 26 (6.0%) |
| 55 to 59 Years | 40 (9.8%) | 26 (6.0%) |
| 60 to 64 Years | 18 (4.4%) | 27 (6.2%) |
| 65 to 69 Years | 17 (4.2%) | 43 (10.0%) |
| 70 to 74 Years | 49 (12.0%) | 27 (6.2%) |
| 75 to 79 Years | 17 (4.2%) | 31 (7.2%) |
| 80 to 84 Years | 9 (2.2%) | 5 (1.2%) |
| 85 Years and over | 5 (1.2%) | 4 (0.9%) |
| Total | 407 (100.0%) | 432 (100.0%) |
Families and Households in New Hope
Median Family Size in New Hope
The median family size in New Hope is 2.84 persons per family, with single female/mother families (33 | 14.4%) accounting for the largest median family size of 3.7 persons per family. On the other hand, single male/father families (33 | 14.4%) represent the smallest median family size with 2.21 persons per family.
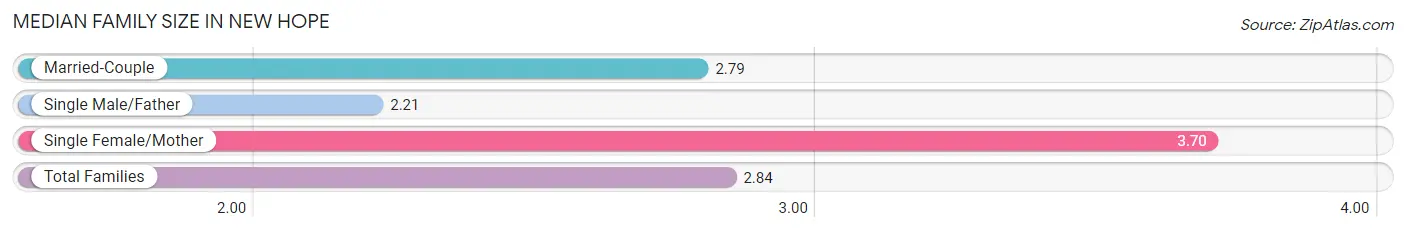
| Family Type | # Families | Family Size |
| Married-Couple | 163 (71.2%) | 2.79 |
| Single Male/Father | 33 (14.4%) | 2.21 |
| Single Female/Mother | 33 (14.4%) | 3.70 |
| Total Families | 229 (100.0%) | 2.84 |
Median Household Size in New Hope
The median household size in New Hope is 2.27 persons per household, with single female/mother households (33 | 8.9%) accounting for the largest median household size of 3.7 persons per household. non-family households (140 | 37.9%) represent the smallest median household size with 1.16 persons per household.
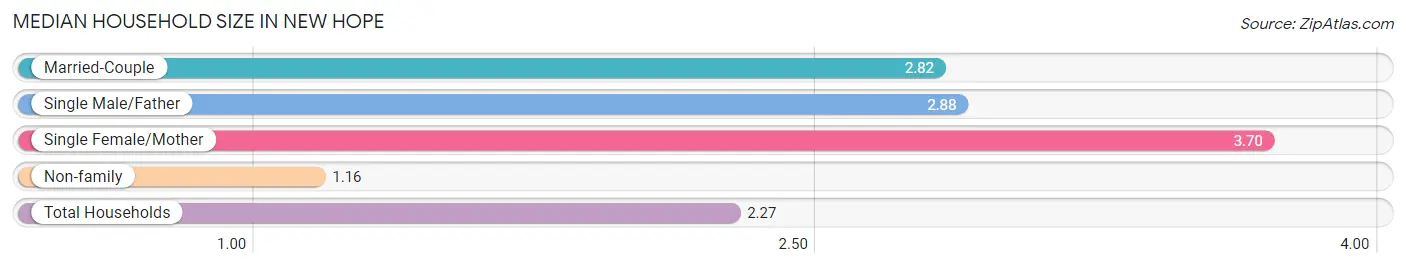
| Household Type | # Households | Household Size |
| Married-Couple | 163 (44.2%) | 2.82 |
| Single Male/Father | 33 (8.9%) | 2.88 |
| Single Female/Mother | 33 (8.9%) | 3.70 |
| Non-family | 140 (37.9%) | 1.16 |
| Total Households | 369 (100.0%) | 2.27 |
Household Size by Marriage Status in New Hope
Out of a total of 369 households in New Hope, 229 (62.1%) are family households, while 140 (37.9%) are nonfamily households. The most numerous type of family households are 2-person households, comprising 120, and the most common type of nonfamily households are 1-person households, comprising 111.
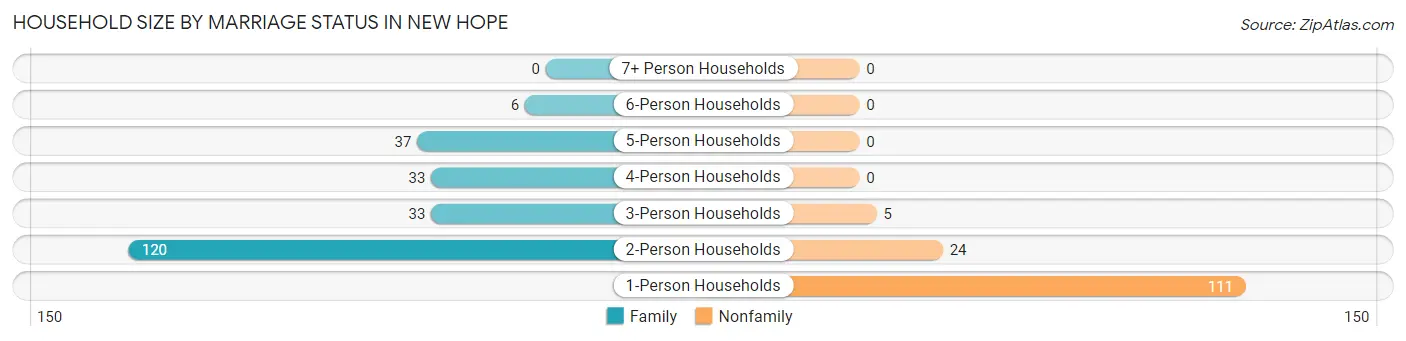
| Household Size | Family Households | Nonfamily Households |
| 1-Person Households | - | 111 (30.1%) |
| 2-Person Households | 120 (32.5%) | 24 (6.5%) |
| 3-Person Households | 33 (8.9%) | 5 (1.4%) |
| 4-Person Households | 33 (8.9%) | 0 (0.0%) |
| 5-Person Households | 37 (10.0%) | 0 (0.0%) |
| 6-Person Households | 6 (1.6%) | 0 (0.0%) |
| 7+ Person Households | 0 (0.0%) | 0 (0.0%) |
| Total | 229 (62.1%) | 140 (37.9%) |
Female Fertility in New Hope
Fertility by Age in New Hope
Average fertility rate in New Hope is 102.0 births per 1,000 women. Women in the age bracket of 35 to 50 years have the highest fertility rate with 179.0 births per 1,000 women. Women in the age bracket of 35 to 50 years acount for 68.2% of all women with births.
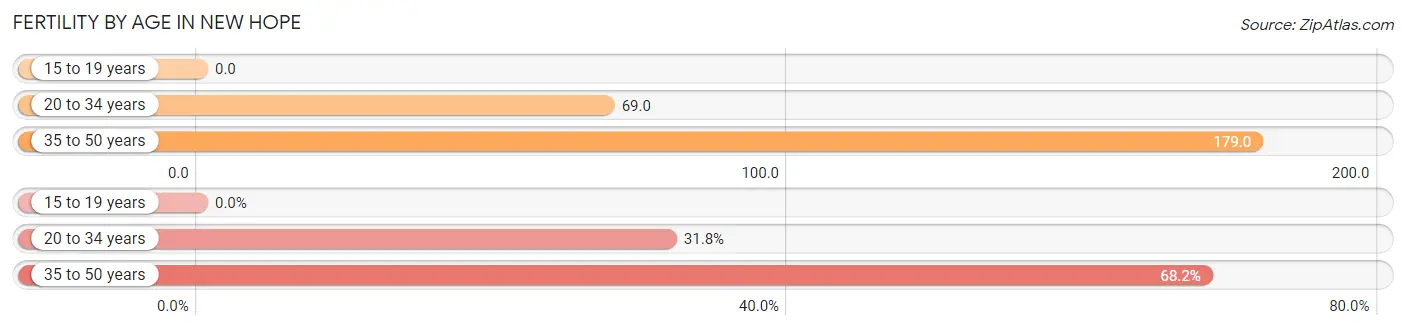
| Age Bracket | Women with Births | Births / 1,000 Women |
| 15 to 19 years | 0 (0.0%) | 0.0 |
| 20 to 34 years | 7 (31.8%) | 69.0 |
| 35 to 50 years | 15 (68.2%) | 179.0 |
| Total | 22 (100.0%) | 102.0 |
Fertility by Age by Marriage Status in New Hope
31.8% of women with births (22) in New Hope are married. The highest percentage of unmarried women with births falls into 35 to 50 years age bracket with 100.0% of them unmarried at the time of birth, while the lowest percentage of unmarried women with births belong to 20 to 34 years age bracket with 0.0% of them unmarried.
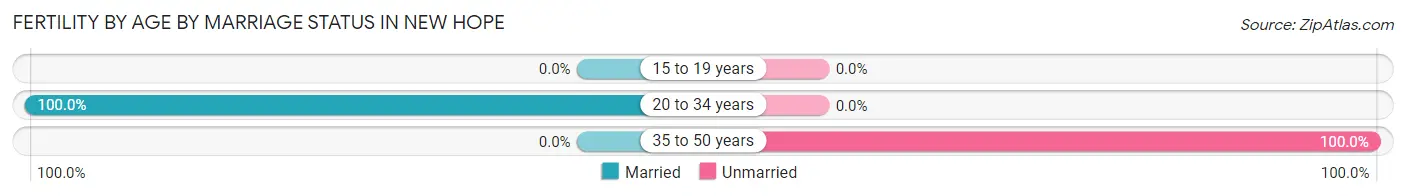
| Age Bracket | Married | Unmarried |
| 15 to 19 years | 0 (0.0%) | 0 (0.0%) |
| 20 to 34 years | 7 (100.0%) | 0 (0.0%) |
| 35 to 50 years | 0 (0.0%) | 15 (100.0%) |
| Total | 7 (31.8%) | 15 (68.2%) |
Fertility by Education in New Hope
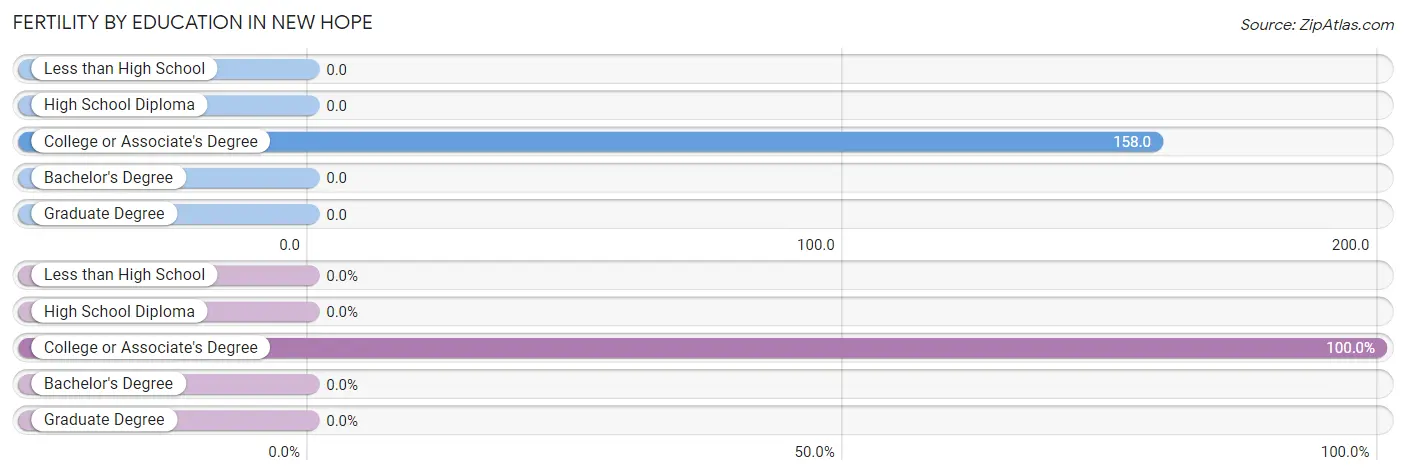
| Educational Attainment | Women with Births | Births / 1,000 Women |
| Less than High School | 0 (0.0%) | 0.0 |
| High School Diploma | 0 (0.0%) | 0.0 |
| College or Associate's Degree | 22 (100.0%) | 158.0 |
| Bachelor's Degree | 0 (0.0%) | 0.0 |
| Graduate Degree | 0 (0.0%) | 0.0 |
| Total | 22 (100.0%) | 102.0 |
Fertility by Education by Marriage Status in New Hope
68.2% of women with births in New Hope are unmarried. Women with the educational attainment of college or associate's degree are most likely to be married with 31.8% of them married at childbirth, while women with the educational attainment of college or associate's degree are least likely to be married with 68.2% of them unmarried at childbirth.
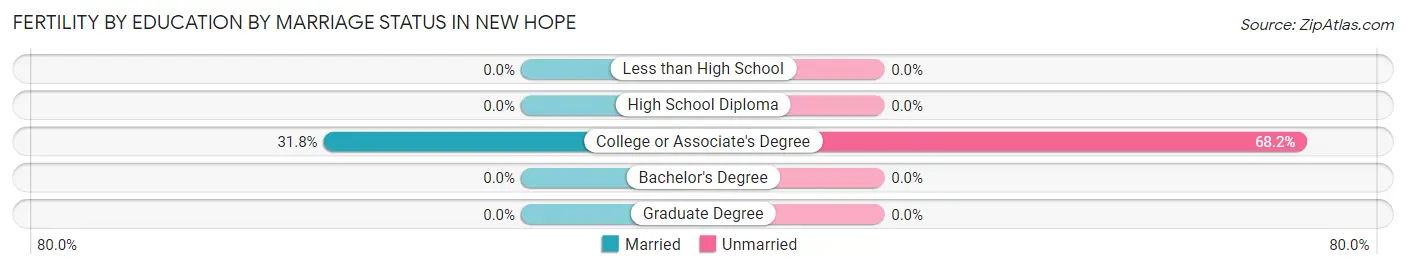
| Educational Attainment | Married | Unmarried |
| Less than High School | 0 (0.0%) | 0 (0.0%) |
| High School Diploma | 0 (0.0%) | 0 (0.0%) |
| College or Associate's Degree | 7 (31.8%) | 15 (68.2%) |
| Bachelor's Degree | 0 (0.0%) | 0 (0.0%) |
| Graduate Degree | 0 (0.0%) | 0 (0.0%) |
| Total | 7 (31.8%) | 15 (68.2%) |
Employment Characteristics in New Hope
Employment by Class of Employer in New Hope
Among the 369 employed individuals in New Hope, private company employees (311 | 84.3%), local government employees (19 | 5.1%), and self-employed (not incorporated) (13 | 3.5%) make up the most common classes of employment.
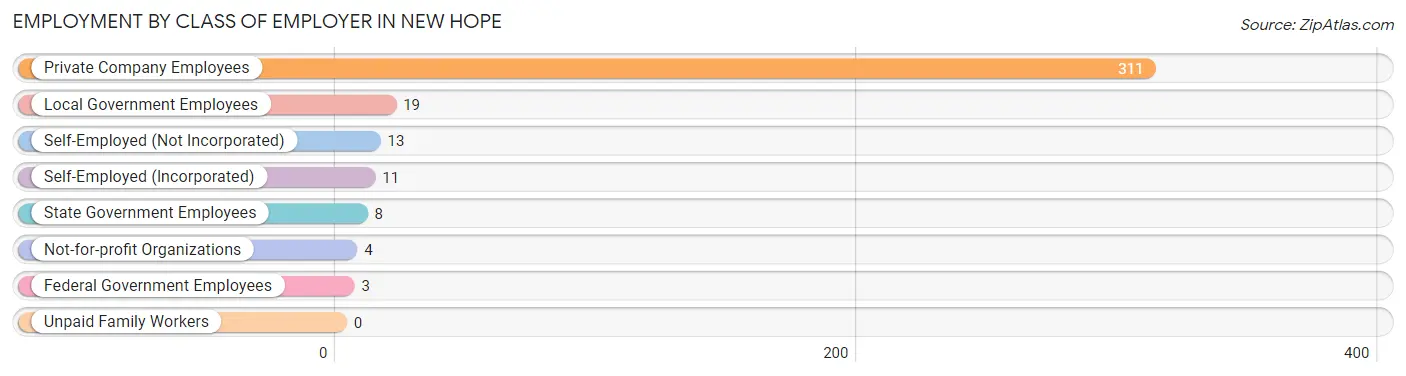
| Employer Class | # Employees | % Employees |
| Private Company Employees | 311 | 84.3% |
| Self-Employed (Incorporated) | 11 | 3.0% |
| Self-Employed (Not Incorporated) | 13 | 3.5% |
| Not-for-profit Organizations | 4 | 1.1% |
| Local Government Employees | 19 | 5.1% |
| State Government Employees | 8 | 2.2% |
| Federal Government Employees | 3 | 0.8% |
| Unpaid Family Workers | 0 | 0.0% |
| Total | 369 | 100.0% |
Employment Status by Age in New Hope
According to the labor force statistics for New Hope, out of the total population over 16 years of age (717), 58.3% or 418 individuals are in the labor force, with 9.8% or 41 of them unemployed. The age group with the highest labor force participation rate is 35 to 44 years, with 91.9% or 79 individuals in the labor force. Within the labor force, the 20 to 24 years age range has the highest percentage of unemployed individuals, with 48.0% or 24 of them being unemployed.
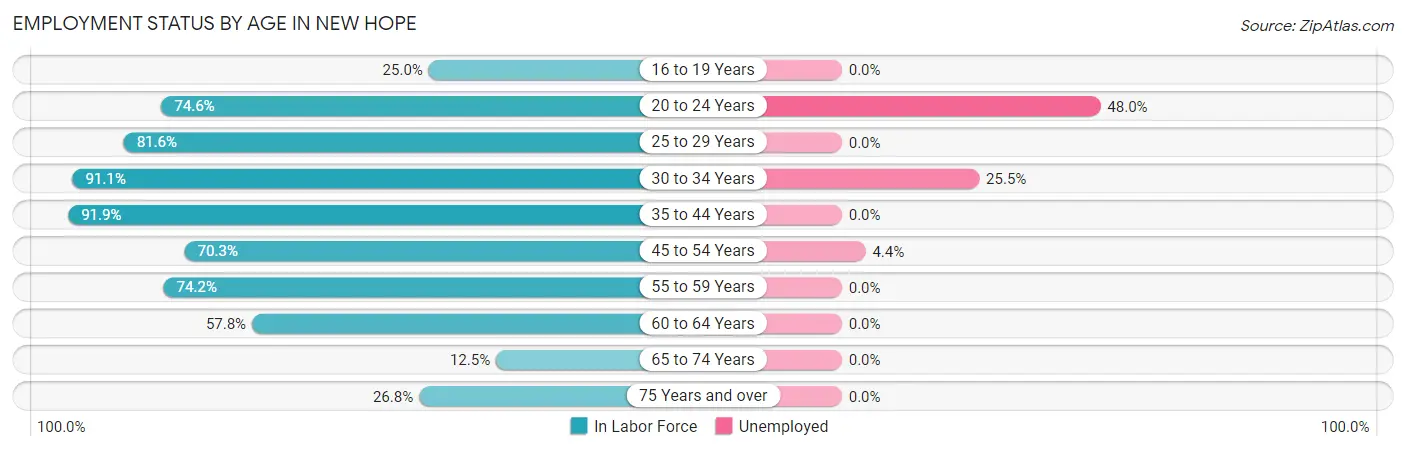
| Age Bracket | In Labor Force | Unemployed |
| 16 to 19 Years | 6 (25.0%) | 0 (0.0%) |
| 20 to 24 Years | 50 (74.6%) | 24 (48.0%) |
| 25 to 29 Years | 31 (81.6%) | 0 (0.0%) |
| 30 to 34 Years | 51 (91.1%) | 13 (25.5%) |
| 35 to 44 Years | 79 (91.9%) | 0 (0.0%) |
| 45 to 54 Years | 90 (70.3%) | 4 (4.4%) |
| 55 to 59 Years | 49 (74.2%) | 0 (0.0%) |
| 60 to 64 Years | 26 (57.8%) | 0 (0.0%) |
| 65 to 74 Years | 17 (12.5%) | 0 (0.0%) |
| 75 Years and over | 19 (26.8%) | 0 (0.0%) |
| Total | 418 (58.3%) | 41 (9.8%) |
Employment Status by Educational Attainment in New Hope
According to labor force statistics for New Hope, 77.8% of individuals (326) out of the total population between 25 and 64 years of age (419) are in the labor force, with 5.2% or 17 of them being unemployed. The group with the highest labor force participation rate are those with the educational attainment of bachelor's degree or higher, with 100.0% or 17 individuals in the labor force. Within the labor force, individuals with high school diploma education have the highest percentage of unemployment, with 7.1% or 4 of them being unemployed.
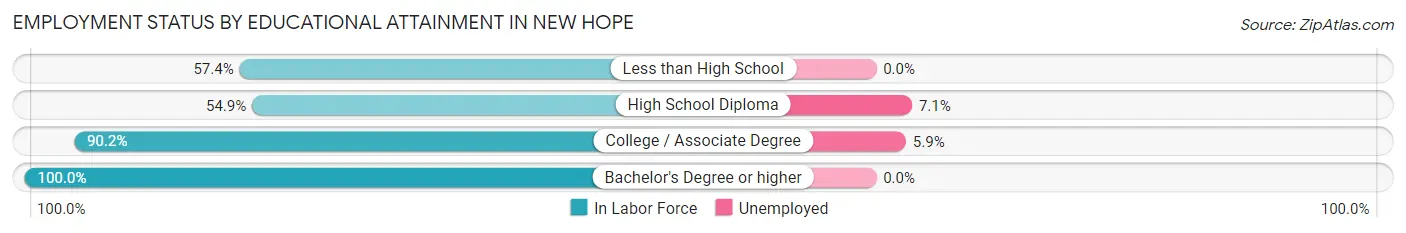
| Educational Attainment | In Labor Force | Unemployed |
| Less than High School | 31 (57.4%) | 0 (0.0%) |
| High School Diploma | 56 (54.9%) | 7 (7.1%) |
| College / Associate Degree | 222 (90.2%) | 15 (5.9%) |
| Bachelor's Degree or higher | 17 (100.0%) | 0 (0.0%) |
| Total | 326 (77.8%) | 22 (5.2%) |
Employment Occupations by Sex in New Hope
Management, Business, Science and Arts Occupations
The most common Management, Business, Science and Arts occupations in New Hope are Management (40 | 10.6%), Business & Financial (27 | 7.2%), Computers, Engineering & Science (13 | 3.5%), Community & Social Service (12 | 3.2%), and Education Instruction & Library (12 | 3.2%).
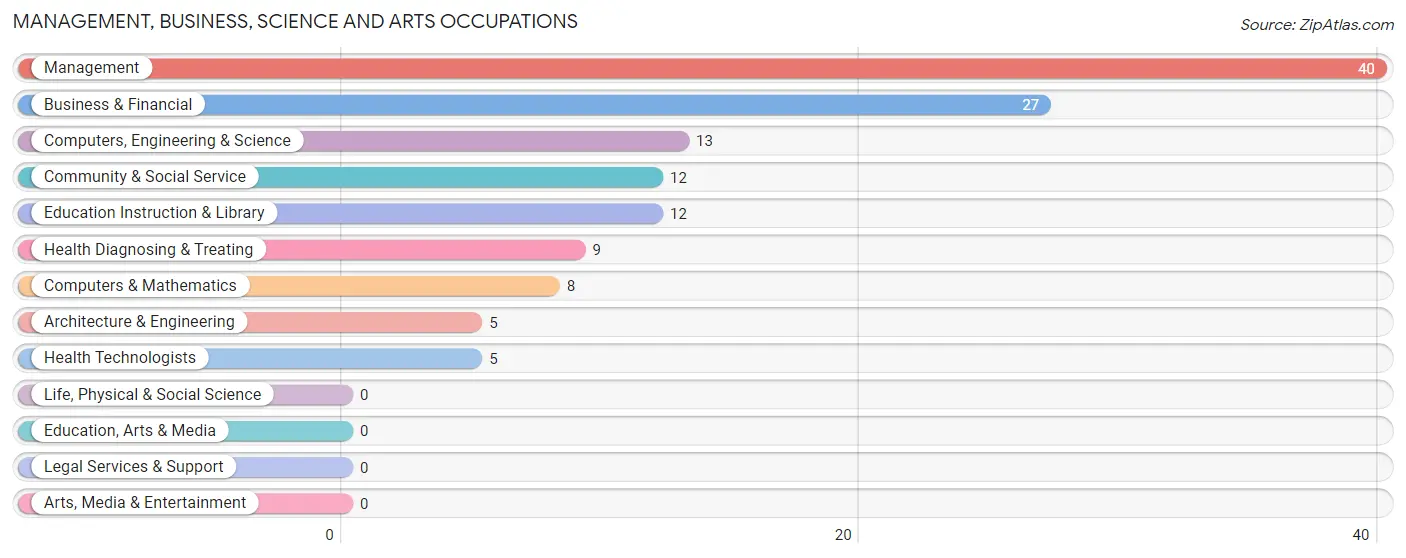
Management, Business, Science and Arts Occupations by Sex
Within the Management, Business, Science and Arts occupations in New Hope, the most male-oriented occupations are Computers, Engineering & Science (100.0%), Computers & Mathematics (100.0%), and Architecture & Engineering (100.0%), while the most female-oriented occupations are Business & Financial (100.0%), Community & Social Service (100.0%), and Education Instruction & Library (100.0%).
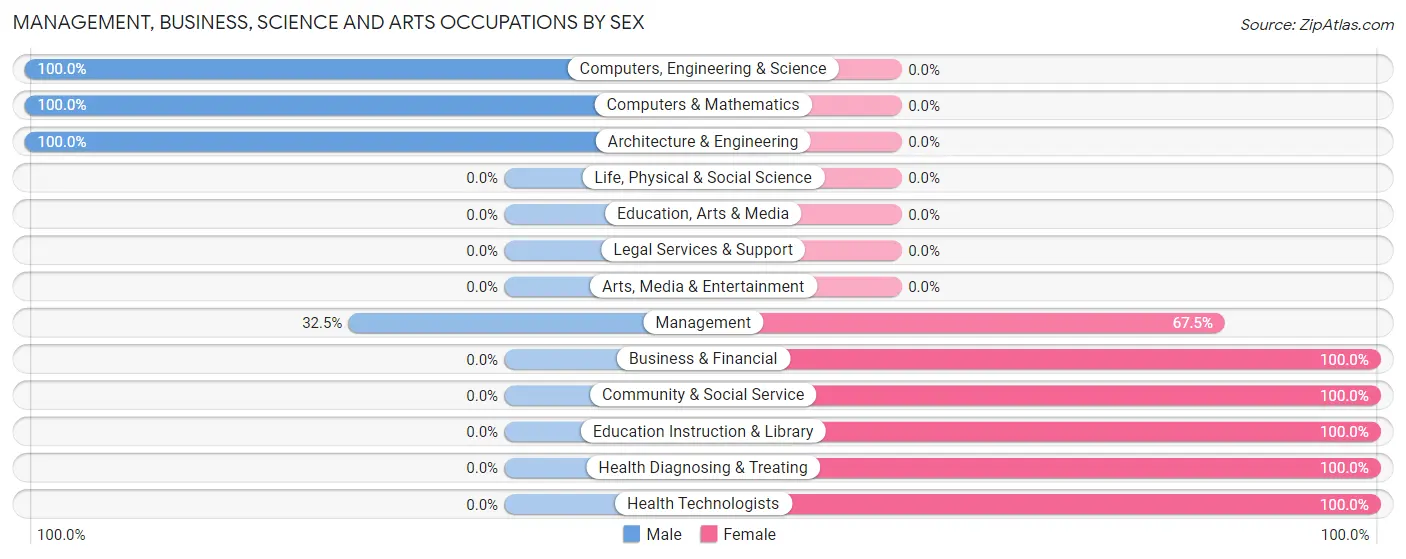
| Occupation | Male | Female |
| Management | 13 (32.5%) | 27 (67.5%) |
| Business & Financial | 0 (0.0%) | 27 (100.0%) |
| Computers, Engineering & Science | 13 (100.0%) | 0 (0.0%) |
| Computers & Mathematics | 8 (100.0%) | 0 (0.0%) |
| Architecture & Engineering | 5 (100.0%) | 0 (0.0%) |
| Life, Physical & Social Science | 0 (0.0%) | 0 (0.0%) |
| Community & Social Service | 0 (0.0%) | 12 (100.0%) |
| Education, Arts & Media | 0 (0.0%) | 0 (0.0%) |
| Legal Services & Support | 0 (0.0%) | 0 (0.0%) |
| Education Instruction & Library | 0 (0.0%) | 12 (100.0%) |
| Arts, Media & Entertainment | 0 (0.0%) | 0 (0.0%) |
| Health Diagnosing & Treating | 0 (0.0%) | 9 (100.0%) |
| Health Technologists | 0 (0.0%) | 5 (100.0%) |
| Total (Category) | 26 (25.7%) | 75 (74.3%) |
| Total (Overall) | 178 (47.2%) | 199 (52.8%) |
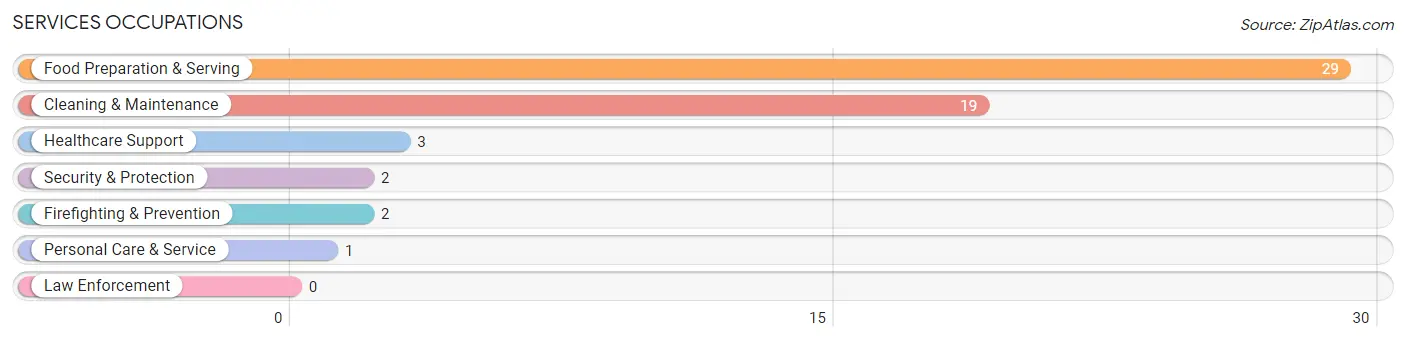
Services Occupations
The most common Services occupations in New Hope are Food Preparation & Serving (29 | 7.7%), Cleaning & Maintenance (19 | 5.0%), Healthcare Support (3 | 0.8%), Security & Protection (2 | 0.5%), and Firefighting & Prevention (2 | 0.5%).
Services Occupations by Sex
Within the Services occupations in New Hope, the most male-oriented occupations are Healthcare Support (100.0%), Security & Protection (100.0%), and Firefighting & Prevention (100.0%), while the most female-oriented occupations are Personal Care & Service (100.0%), Food Preparation & Serving (58.6%), and Cleaning & Maintenance (15.8%).
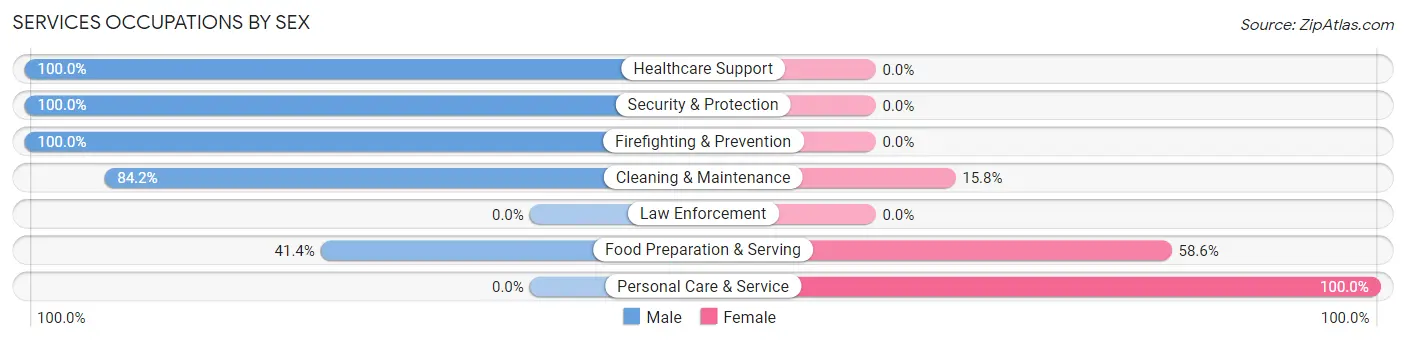
| Occupation | Male | Female |
| Healthcare Support | 3 (100.0%) | 0 (0.0%) |
| Security & Protection | 2 (100.0%) | 0 (0.0%) |
| Firefighting & Prevention | 2 (100.0%) | 0 (0.0%) |
| Law Enforcement | 0 (0.0%) | 0 (0.0%) |
| Food Preparation & Serving | 12 (41.4%) | 17 (58.6%) |
| Cleaning & Maintenance | 16 (84.2%) | 3 (15.8%) |
| Personal Care & Service | 0 (0.0%) | 1 (100.0%) |
| Total (Category) | 33 (61.1%) | 21 (38.9%) |
| Total (Overall) | 178 (47.2%) | 199 (52.8%) |
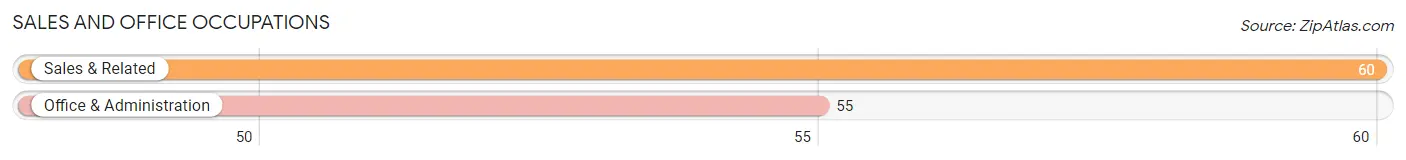
Sales and Office Occupations
The most common Sales and Office occupations in New Hope are Sales & Related (60 | 15.9%), and Office & Administration (55 | 14.6%).
Sales and Office Occupations by Sex

| Occupation | Male | Female |
| Sales & Related | 25 (41.7%) | 35 (58.3%) |
| Office & Administration | 5 (9.1%) | 50 (90.9%) |
| Total (Category) | 30 (26.1%) | 85 (73.9%) |
| Total (Overall) | 178 (47.2%) | 199 (52.8%) |
Natural Resources, Construction and Maintenance Occupations
The most common Natural Resources, Construction and Maintenance occupations in New Hope are Construction & Extraction (68 | 18.0%), and Installation, Maintenance & Repair (8 | 2.1%).
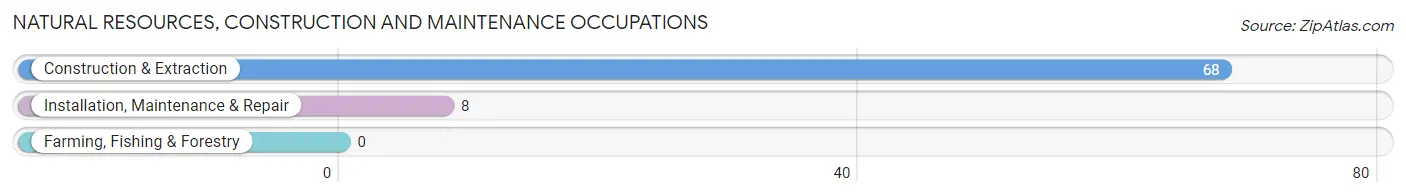
Natural Resources, Construction and Maintenance Occupations by Sex

| Occupation | Male | Female |
| Farming, Fishing & Forestry | 0 (0.0%) | 0 (0.0%) |
| Construction & Extraction | 68 (100.0%) | 0 (0.0%) |
| Installation, Maintenance & Repair | 8 (100.0%) | 0 (0.0%) |
| Total (Category) | 76 (100.0%) | 0 (0.0%) |
| Total (Overall) | 178 (47.2%) | 199 (52.8%) |
Production, Transportation and Moving Occupations
The most common Production, Transportation and Moving occupations in New Hope are Production (24 | 6.4%), Transportation (5 | 1.3%), and Material Moving (2 | 0.5%).
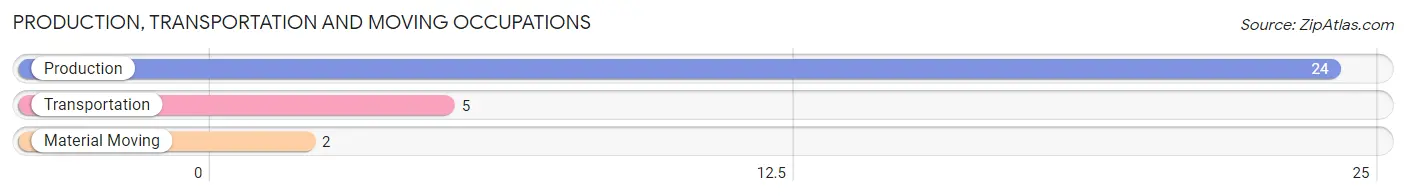
Production, Transportation and Moving Occupations by Sex
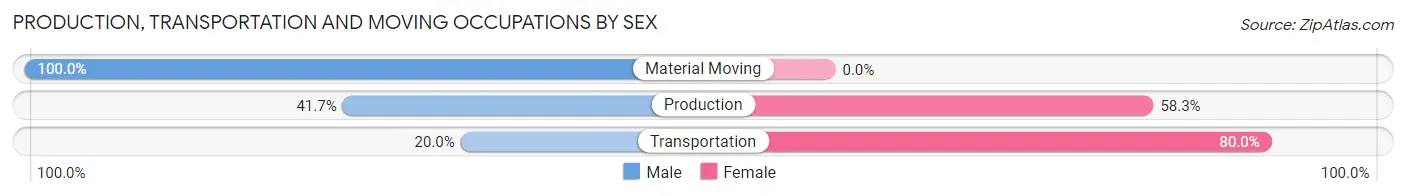
| Occupation | Male | Female |
| Production | 10 (41.7%) | 14 (58.3%) |
| Transportation | 1 (20.0%) | 4 (80.0%) |
| Material Moving | 2 (100.0%) | 0 (0.0%) |
| Total (Category) | 13 (41.9%) | 18 (58.1%) |
| Total (Overall) | 178 (47.2%) | 199 (52.8%) |
Employment Industries by Sex in New Hope
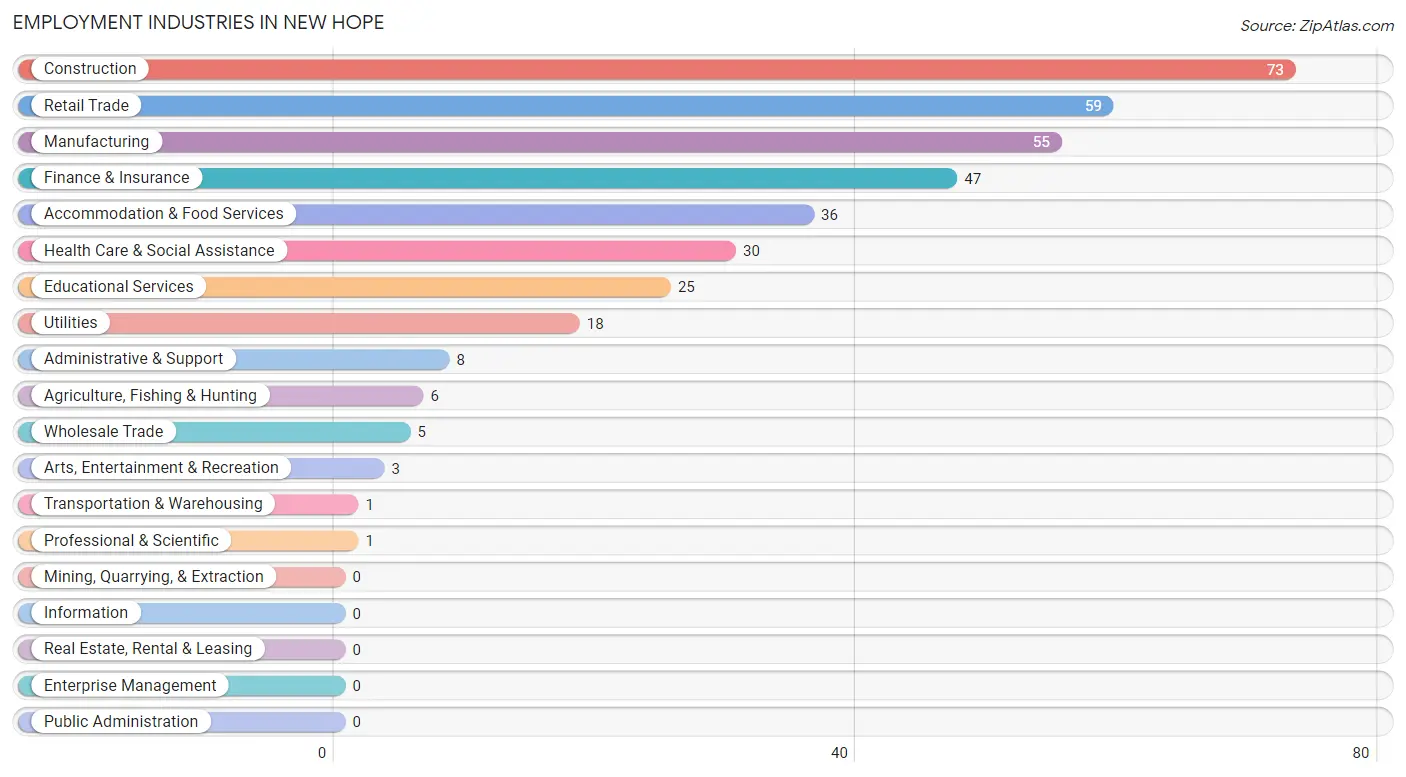
Employment Industries in New Hope
The major employment industries in New Hope include Construction (73 | 19.4%), Retail Trade (59 | 15.7%), Manufacturing (55 | 14.6%), Finance & Insurance (47 | 12.5%), and Accommodation & Food Services (36 | 9.6%).
Employment Industries by Sex in New Hope
The New Hope industries that see more men than women are Agriculture, Fishing & Hunting (100.0%), Construction (100.0%), and Wholesale Trade (100.0%), whereas the industries that tend to have a higher number of women are Professional & Scientific (100.0%), Educational Services (100.0%), and Health Care & Social Assistance (100.0%).
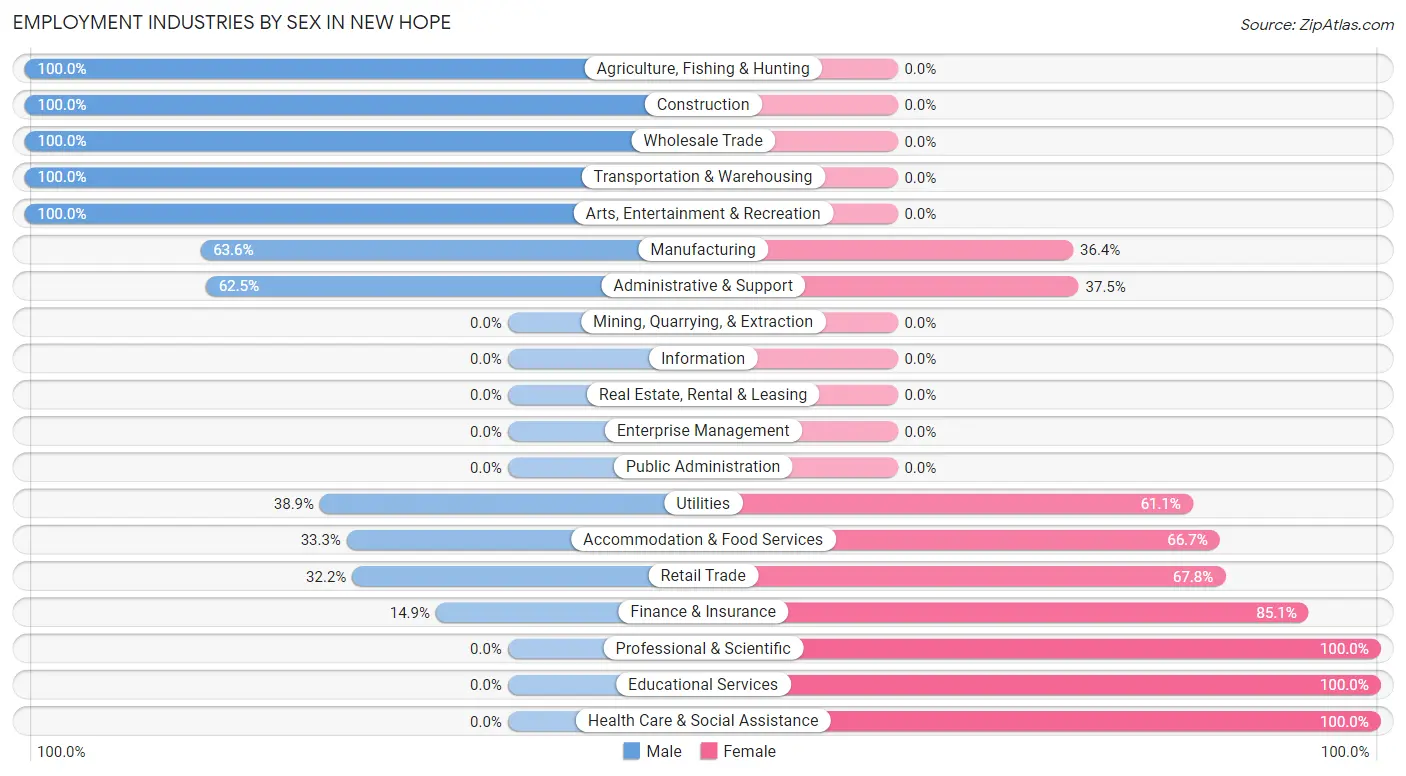
| Industry | Male | Female |
| Agriculture, Fishing & Hunting | 6 (100.0%) | 0 (0.0%) |
| Mining, Quarrying, & Extraction | 0 (0.0%) | 0 (0.0%) |
| Construction | 73 (100.0%) | 0 (0.0%) |
| Manufacturing | 35 (63.6%) | 20 (36.4%) |
| Wholesale Trade | 5 (100.0%) | 0 (0.0%) |
| Retail Trade | 19 (32.2%) | 40 (67.8%) |
| Transportation & Warehousing | 1 (100.0%) | 0 (0.0%) |
| Utilities | 7 (38.9%) | 11 (61.1%) |
| Information | 0 (0.0%) | 0 (0.0%) |
| Finance & Insurance | 7 (14.9%) | 40 (85.1%) |
| Real Estate, Rental & Leasing | 0 (0.0%) | 0 (0.0%) |
| Professional & Scientific | 0 (0.0%) | 1 (100.0%) |
| Enterprise Management | 0 (0.0%) | 0 (0.0%) |
| Administrative & Support | 5 (62.5%) | 3 (37.5%) |
| Educational Services | 0 (0.0%) | 25 (100.0%) |
| Health Care & Social Assistance | 0 (0.0%) | 30 (100.0%) |
| Arts, Entertainment & Recreation | 3 (100.0%) | 0 (0.0%) |
| Accommodation & Food Services | 12 (33.3%) | 24 (66.7%) |
| Public Administration | 0 (0.0%) | 0 (0.0%) |
| Total | 178 (47.2%) | 199 (52.8%) |
Education in New Hope
School Enrollment in New Hope
The most common levels of schooling among the 108 students in New Hope are middle school (36 | 33.3%), high school (23 | 21.3%), and college / undergraduate (22 | 20.4%).
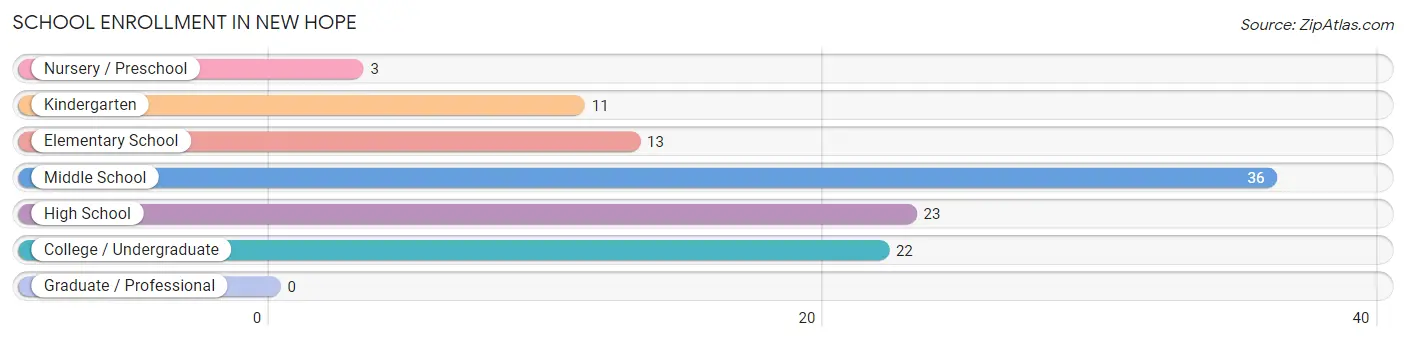
| School Level | # Students | % Students |
| Nursery / Preschool | 3 | 2.8% |
| Kindergarten | 11 | 10.2% |
| Elementary School | 13 | 12.0% |
| Middle School | 36 | 33.3% |
| High School | 23 | 21.3% |
| College / Undergraduate | 22 | 20.4% |
| Graduate / Professional | 0 | 0.0% |
| Total | 108 | 100.0% |
School Enrollment by Age by Funding Source in New Hope
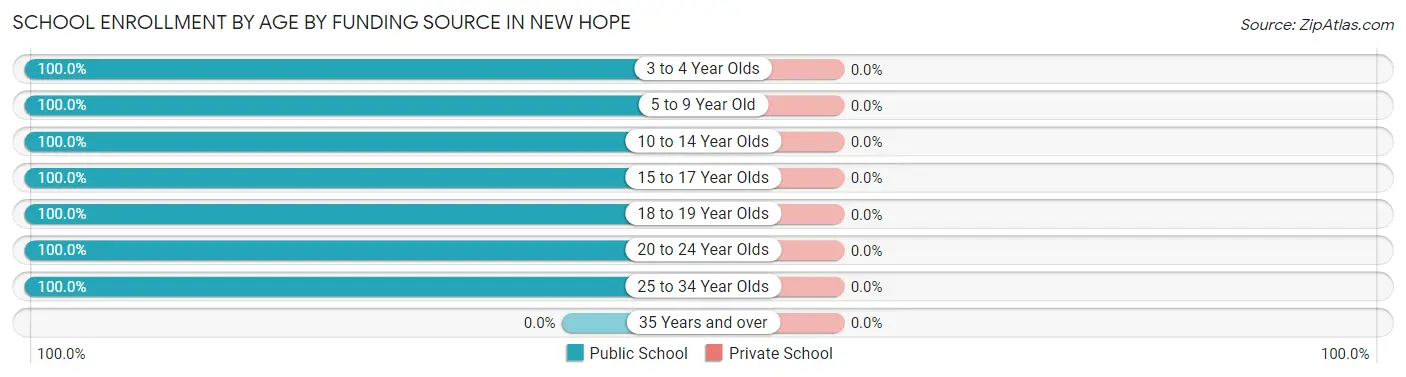
| Age Bracket | Public School | Private School |
| 3 to 4 Year Olds | 3 (100.0%) | 0 (0.0%) |
| 5 to 9 Year Old | 24 (100.0%) | 0 (0.0%) |
| 10 to 14 Year Olds | 36 (100.0%) | 0 (0.0%) |
| 15 to 17 Year Olds | 19 (100.0%) | 0 (0.0%) |
| 18 to 19 Year Olds | 19 (100.0%) | 0 (0.0%) |
| 20 to 24 Year Olds | 5 (100.0%) | 0 (0.0%) |
| 25 to 34 Year Olds | 2 (100.0%) | 0 (0.0%) |
| 35 Years and over | 0 (0.0%) | 0 (0.0%) |
| Total | 108 (100.0%) | 0 (0.0%) |
Educational Attainment by Field of Study in New Hope
Business (18 | 48.6%), bio, nature & agricultural (7 | 18.9%), science & technology (6 | 16.2%), education (5 | 13.5%), and social sciences (1 | 2.7%) are the most common fields of study among 37 individuals in New Hope who have obtained a bachelor's degree or higher.
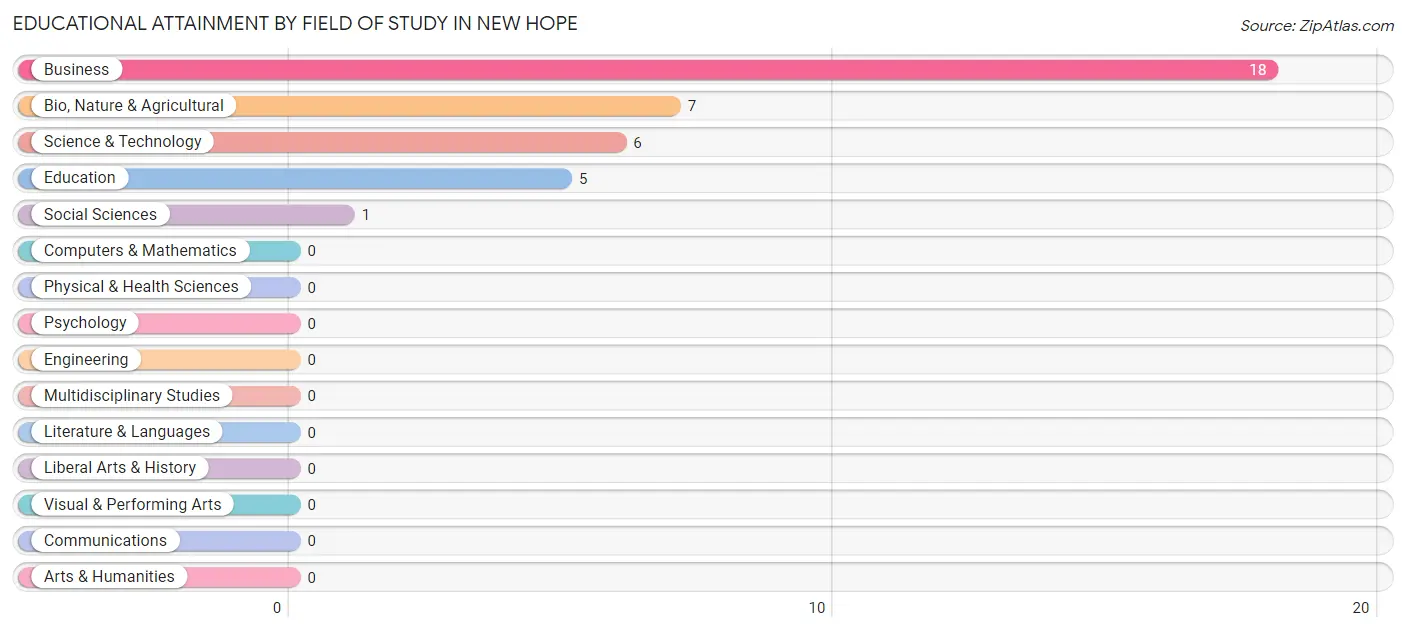
| Field of Study | # Graduates | % Graduates |
| Computers & Mathematics | 0 | 0.0% |
| Bio, Nature & Agricultural | 7 | 18.9% |
| Physical & Health Sciences | 0 | 0.0% |
| Psychology | 0 | 0.0% |
| Social Sciences | 1 | 2.7% |
| Engineering | 0 | 0.0% |
| Multidisciplinary Studies | 0 | 0.0% |
| Science & Technology | 6 | 16.2% |
| Business | 18 | 48.6% |
| Education | 5 | 13.5% |
| Literature & Languages | 0 | 0.0% |
| Liberal Arts & History | 0 | 0.0% |
| Visual & Performing Arts | 0 | 0.0% |
| Communications | 0 | 0.0% |
| Arts & Humanities | 0 | 0.0% |
| Total | 37 | 100.0% |
Transportation & Commute in New Hope
Vehicle Availability by Sex in New Hope
The most prevalent vehicle ownership categories in New Hope are males with 2 vehicles (75, accounting for 42.1%) and females with 2 vehicles (61, making up 39.3%).
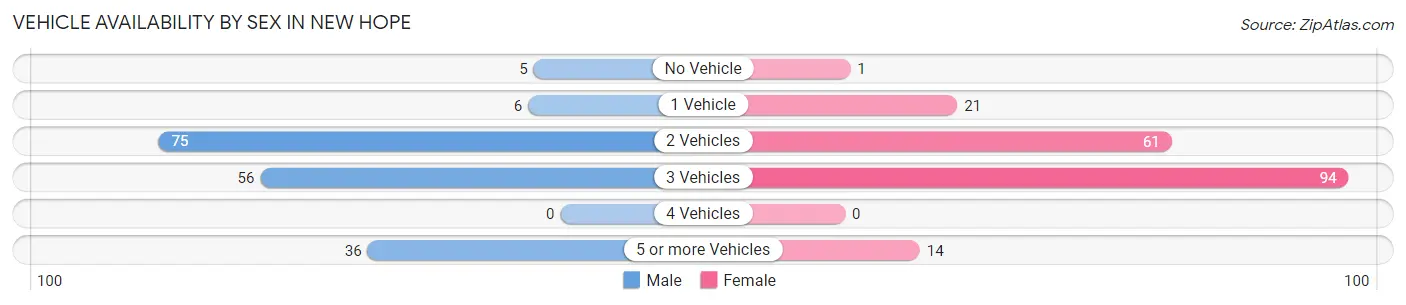
| Vehicles Available | Male | Female |
| No Vehicle | 5 (2.8%) | 1 (0.5%) |
| 1 Vehicle | 6 (3.4%) | 21 (11.0%) |
| 2 Vehicles | 75 (42.1%) | 61 (31.9%) |
| 3 Vehicles | 56 (31.5%) | 94 (49.2%) |
| 4 Vehicles | 0 (0.0%) | 0 (0.0%) |
| 5 or more Vehicles | 36 (20.2%) | 14 (7.3%) |
| Total | 178 (100.0%) | 191 (100.0%) |
Commute Time in New Hope
The most frequently occuring commute durations in New Hope are 10 to 14 minutes (114 commuters, 33.5%), 15 to 19 minutes (79 commuters, 23.2%), and 35 to 39 minutes (51 commuters, 15.0%).
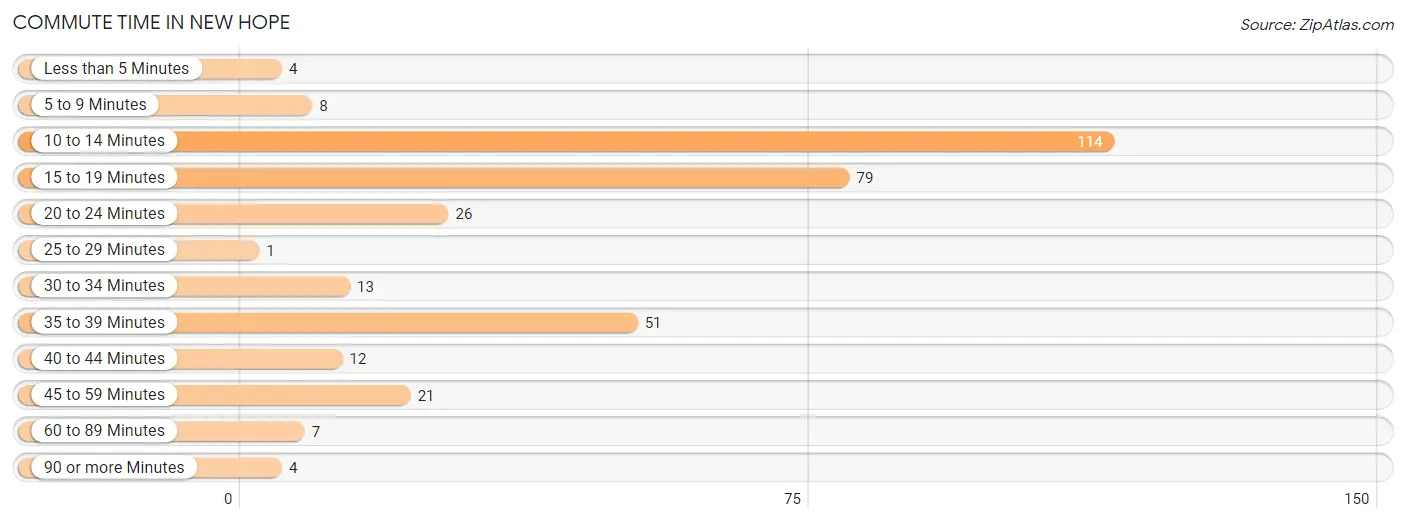
| Commute Time | # Commuters | % Commuters |
| Less than 5 Minutes | 4 | 1.2% |
| 5 to 9 Minutes | 8 | 2.4% |
| 10 to 14 Minutes | 114 | 33.5% |
| 15 to 19 Minutes | 79 | 23.2% |
| 20 to 24 Minutes | 26 | 7.6% |
| 25 to 29 Minutes | 1 | 0.3% |
| 30 to 34 Minutes | 13 | 3.8% |
| 35 to 39 Minutes | 51 | 15.0% |
| 40 to 44 Minutes | 12 | 3.5% |
| 45 to 59 Minutes | 21 | 6.2% |
| 60 to 89 Minutes | 7 | 2.1% |
| 90 or more Minutes | 4 | 1.2% |
Commute Time by Sex in New Hope
The most common commute times in New Hope are 15 to 19 minutes (50 commuters, 31.9%) for males and 10 to 14 minutes (101 commuters, 55.2%) for females.
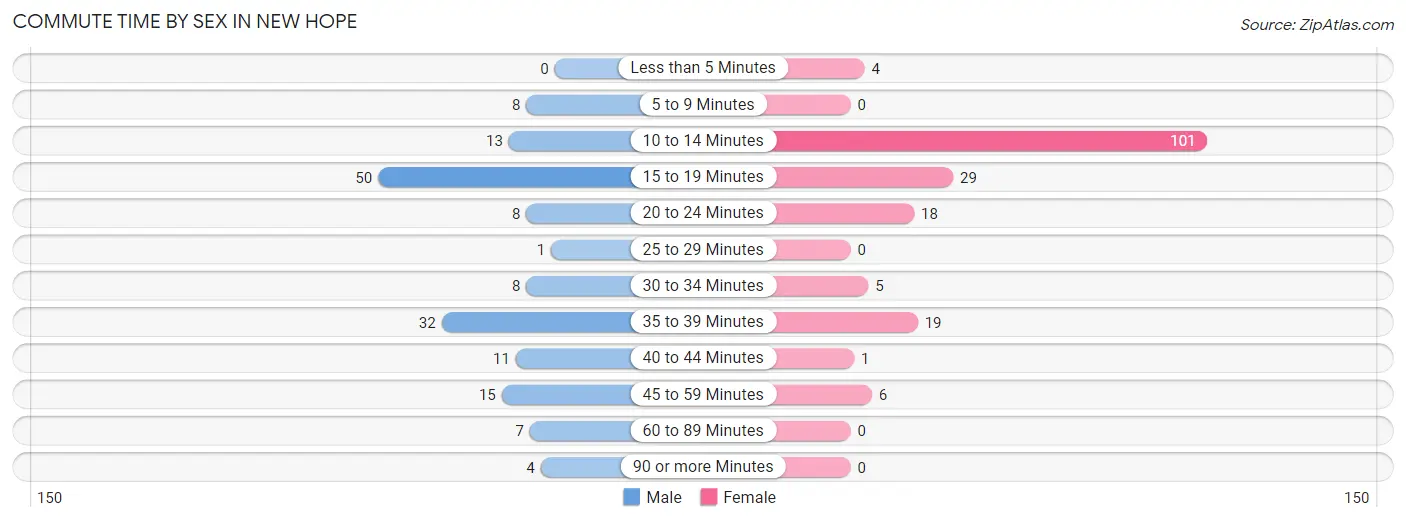
| Commute Time | Male | Female |
| Less than 5 Minutes | 0 (0.0%) | 4 (2.2%) |
| 5 to 9 Minutes | 8 (5.1%) | 0 (0.0%) |
| 10 to 14 Minutes | 13 (8.3%) | 101 (55.2%) |
| 15 to 19 Minutes | 50 (31.9%) | 29 (15.9%) |
| 20 to 24 Minutes | 8 (5.1%) | 18 (9.8%) |
| 25 to 29 Minutes | 1 (0.6%) | 0 (0.0%) |
| 30 to 34 Minutes | 8 (5.1%) | 5 (2.7%) |
| 35 to 39 Minutes | 32 (20.4%) | 19 (10.4%) |
| 40 to 44 Minutes | 11 (7.0%) | 1 (0.5%) |
| 45 to 59 Minutes | 15 (9.6%) | 6 (3.3%) |
| 60 to 89 Minutes | 7 (4.5%) | 0 (0.0%) |
| 90 or more Minutes | 4 (2.5%) | 0 (0.0%) |
Time of Departure to Work by Sex in New Hope
The most frequent times of departure to work in New Hope are 5:00 AM to 5:29 AM (47, 29.9%) for males and 7:00 AM to 7:29 AM (83, 45.4%) for females.
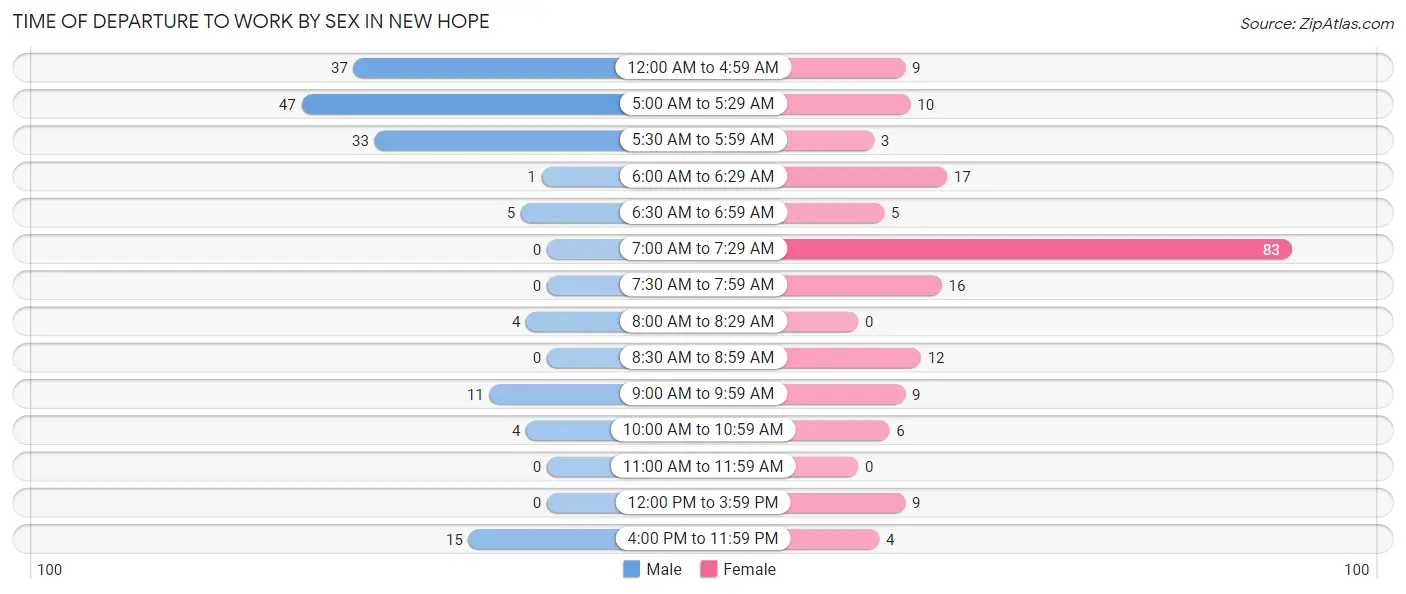
| Time of Departure | Male | Female |
| 12:00 AM to 4:59 AM | 37 (23.6%) | 9 (4.9%) |
| 5:00 AM to 5:29 AM | 47 (29.9%) | 10 (5.5%) |
| 5:30 AM to 5:59 AM | 33 (21.0%) | 3 (1.6%) |
| 6:00 AM to 6:29 AM | 1 (0.6%) | 17 (9.3%) |
| 6:30 AM to 6:59 AM | 5 (3.2%) | 5 (2.7%) |
| 7:00 AM to 7:29 AM | 0 (0.0%) | 83 (45.4%) |
| 7:30 AM to 7:59 AM | 0 (0.0%) | 16 (8.7%) |
| 8:00 AM to 8:29 AM | 4 (2.5%) | 0 (0.0%) |
| 8:30 AM to 8:59 AM | 0 (0.0%) | 12 (6.6%) |
| 9:00 AM to 9:59 AM | 11 (7.0%) | 9 (4.9%) |
| 10:00 AM to 10:59 AM | 4 (2.5%) | 6 (3.3%) |
| 11:00 AM to 11:59 AM | 0 (0.0%) | 0 (0.0%) |
| 12:00 PM to 3:59 PM | 0 (0.0%) | 9 (4.9%) |
| 4:00 PM to 11:59 PM | 15 (9.6%) | 4 (2.2%) |
| Total | 157 (100.0%) | 183 (100.0%) |
Housing Occupancy in New Hope
Occupancy by Ownership in New Hope
Of the total 369 dwellings in New Hope, owner-occupied units account for 315 (85.4%), while renter-occupied units make up 54 (14.6%).
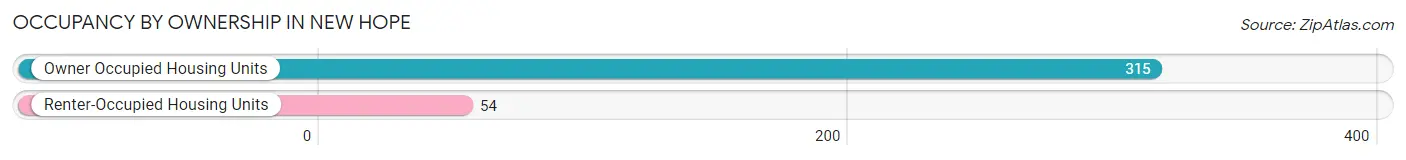
| Occupancy | # Housing Units | % Housing Units |
| Owner Occupied Housing Units | 315 | 85.4% |
| Renter-Occupied Housing Units | 54 | 14.6% |
| Total Occupied Housing Units | 369 | 100.0% |
Occupancy by Household Size in New Hope
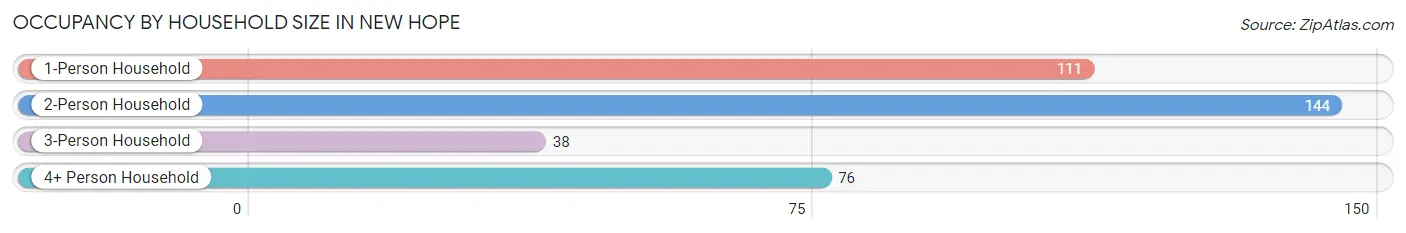
| Household Size | # Housing Units | % Housing Units |
| 1-Person Household | 111 | 30.1% |
| 2-Person Household | 144 | 39.0% |
| 3-Person Household | 38 | 10.3% |
| 4+ Person Household | 76 | 20.6% |
| Total Housing Units | 369 | 100.0% |
Occupancy by Ownership by Household Size in New Hope
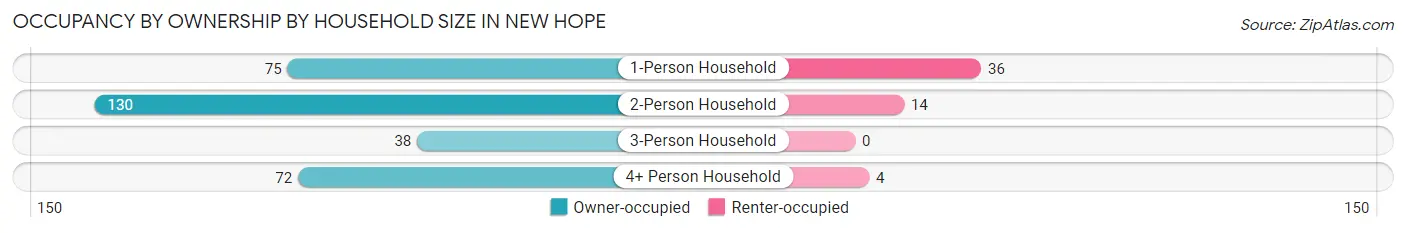
| Household Size | Owner-occupied | Renter-occupied |
| 1-Person Household | 75 (67.6%) | 36 (32.4%) |
| 2-Person Household | 130 (90.3%) | 14 (9.7%) |
| 3-Person Household | 38 (100.0%) | 0 (0.0%) |
| 4+ Person Household | 72 (94.7%) | 4 (5.3%) |
| Total Housing Units | 315 (85.4%) | 54 (14.6%) |
Occupancy by Educational Attainment in New Hope
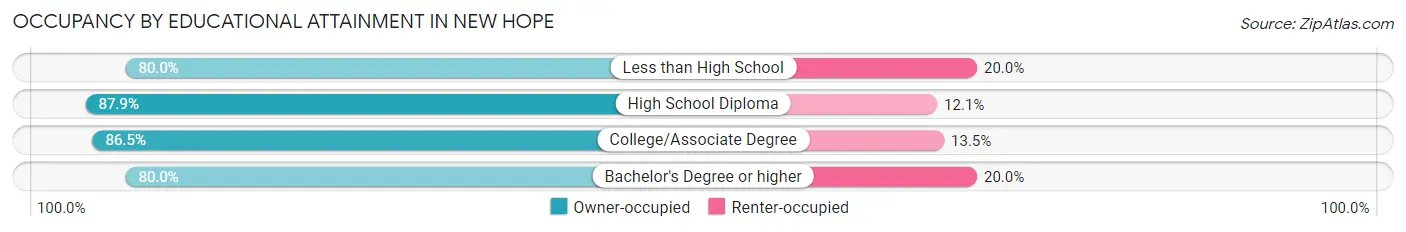
| Household Size | Owner-occupied | Renter-occupied |
| Less than High School | 48 (80.0%) | 12 (20.0%) |
| High School Diploma | 80 (87.9%) | 11 (12.1%) |
| College/Associate Degree | 167 (86.5%) | 26 (13.5%) |
| Bachelor's Degree or higher | 20 (80.0%) | 5 (20.0%) |
Occupancy by Age of Householder in New Hope
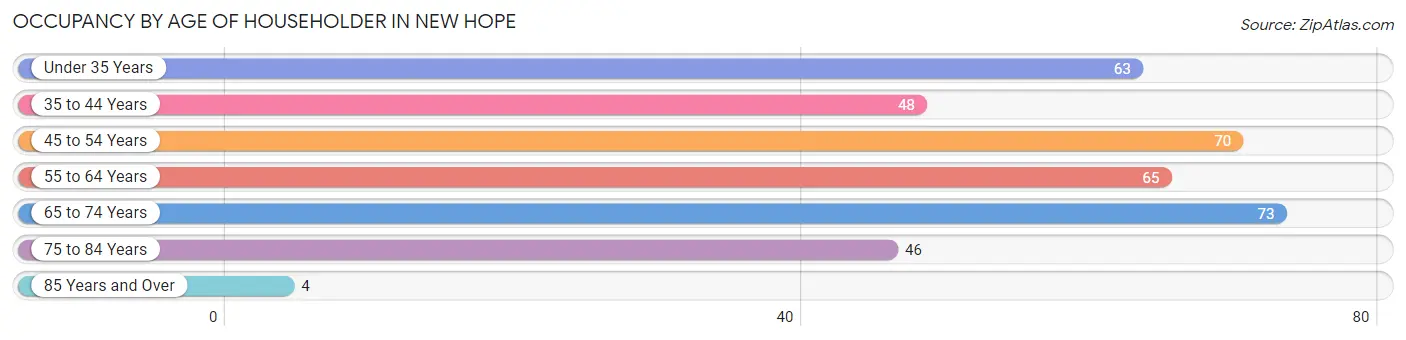
| Age Bracket | # Households | % Households |
| Under 35 Years | 63 | 17.1% |
| 35 to 44 Years | 48 | 13.0% |
| 45 to 54 Years | 70 | 19.0% |
| 55 to 64 Years | 65 | 17.6% |
| 65 to 74 Years | 73 | 19.8% |
| 75 to 84 Years | 46 | 12.5% |
| 85 Years and Over | 4 | 1.1% |
| Total | 369 | 100.0% |
Housing Finances in New Hope
Median Income by Occupancy in New Hope
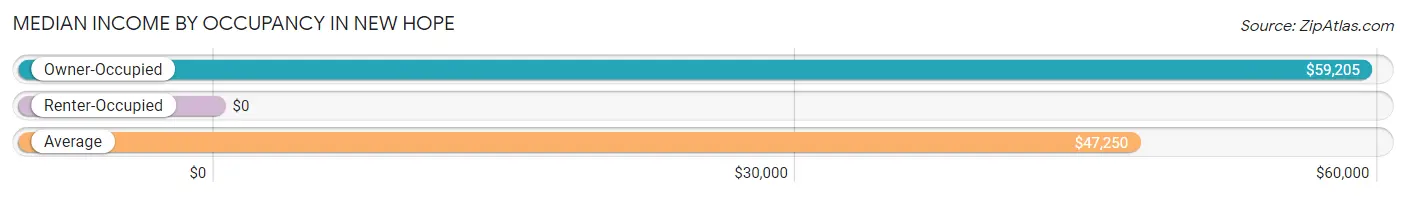
| Occupancy Type | # Households | Median Income |
| Owner-Occupied | 315 (85.4%) | $59,205 |
| Renter-Occupied | 54 (14.6%) | $0 |
| Average | 369 (100.0%) | $47,250 |
Occupancy by Householder Income Bracket in New Hope
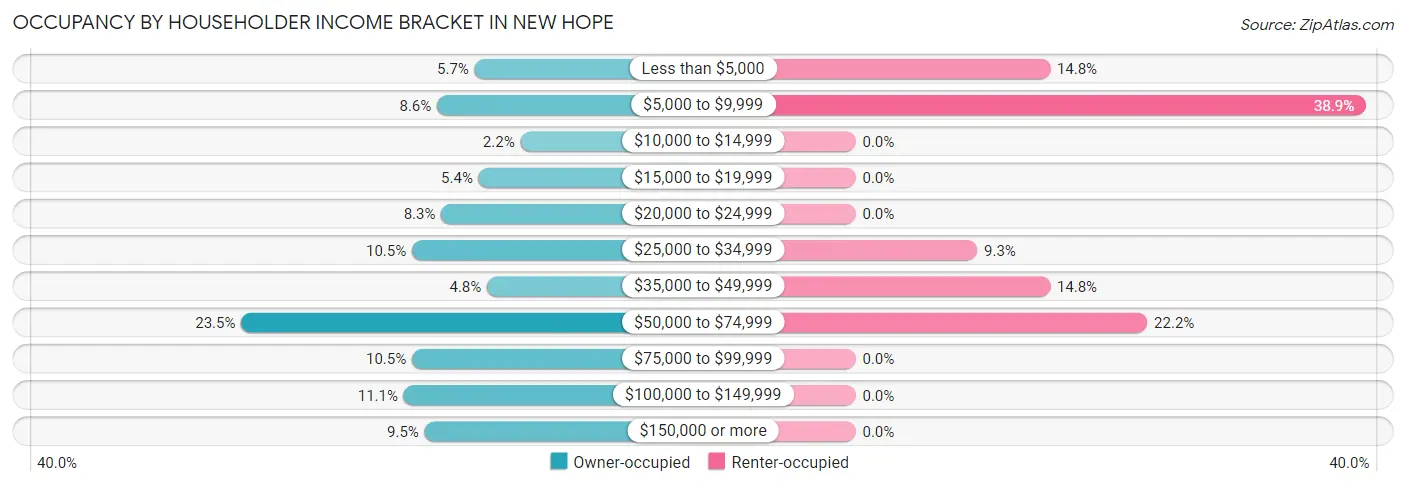
| Income Bracket | Owner-occupied | Renter-occupied |
| Less than $5,000 | 18 (5.7%) | 8 (14.8%) |
| $5,000 to $9,999 | 27 (8.6%) | 21 (38.9%) |
| $10,000 to $14,999 | 7 (2.2%) | 0 (0.0%) |
| $15,000 to $19,999 | 17 (5.4%) | 0 (0.0%) |
| $20,000 to $24,999 | 26 (8.3%) | 0 (0.0%) |
| $25,000 to $34,999 | 33 (10.5%) | 5 (9.3%) |
| $35,000 to $49,999 | 15 (4.8%) | 8 (14.8%) |
| $50,000 to $74,999 | 74 (23.5%) | 12 (22.2%) |
| $75,000 to $99,999 | 33 (10.5%) | 0 (0.0%) |
| $100,000 to $149,999 | 35 (11.1%) | 0 (0.0%) |
| $150,000 or more | 30 (9.5%) | 0 (0.0%) |
| Total | 315 (100.0%) | 54 (100.0%) |
Monthly Housing Cost Tiers in New Hope
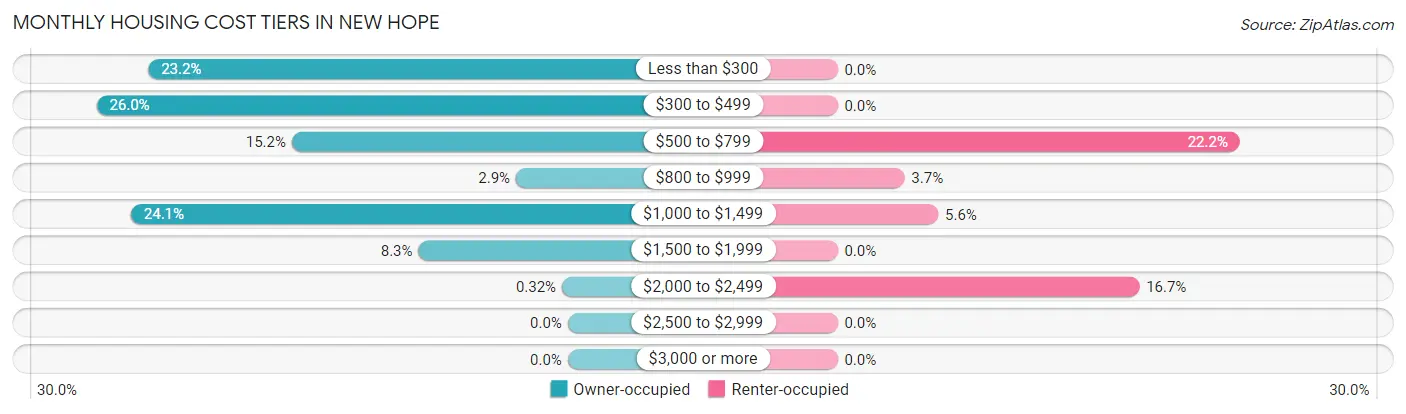
| Monthly Cost | Owner-occupied | Renter-occupied |
| Less than $300 | 73 (23.2%) | 0 (0.0%) |
| $300 to $499 | 82 (26.0%) | 0 (0.0%) |
| $500 to $799 | 48 (15.2%) | 12 (22.2%) |
| $800 to $999 | 9 (2.9%) | 2 (3.7%) |
| $1,000 to $1,499 | 76 (24.1%) | 3 (5.6%) |
| $1,500 to $1,999 | 26 (8.3%) | 0 (0.0%) |
| $2,000 to $2,499 | 1 (0.3%) | 9 (16.7%) |
| $2,500 to $2,999 | 0 (0.0%) | 0 (0.0%) |
| $3,000 or more | 0 (0.0%) | 0 (0.0%) |
| Total | 315 (100.0%) | 54 (100.0%) |
Physical Housing Characteristics in New Hope
Housing Structures in New Hope
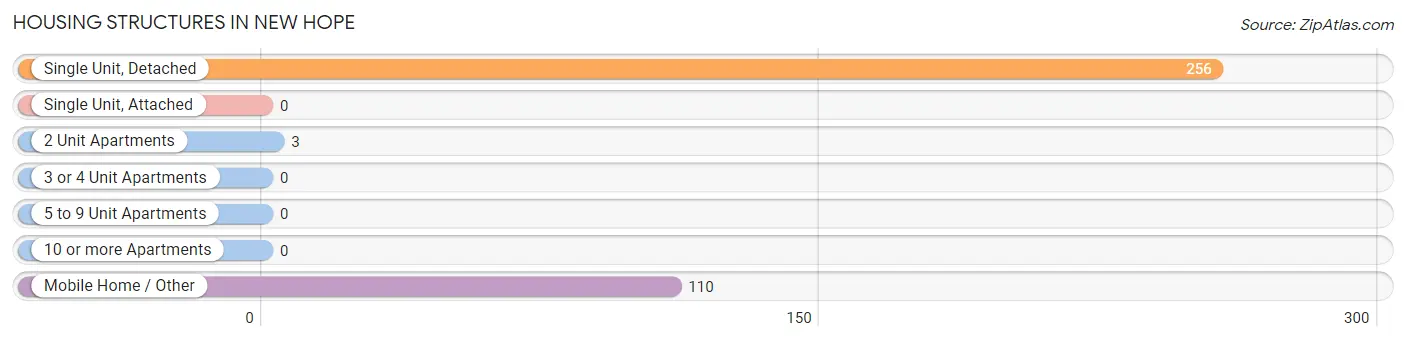
| Structure Type | # Housing Units | % Housing Units |
| Single Unit, Detached | 256 | 69.4% |
| Single Unit, Attached | 0 | 0.0% |
| 2 Unit Apartments | 3 | 0.8% |
| 3 or 4 Unit Apartments | 0 | 0.0% |
| 5 to 9 Unit Apartments | 0 | 0.0% |
| 10 or more Apartments | 0 | 0.0% |
| Mobile Home / Other | 110 | 29.8% |
| Total | 369 | 100.0% |
Housing Structures by Occupancy in New Hope
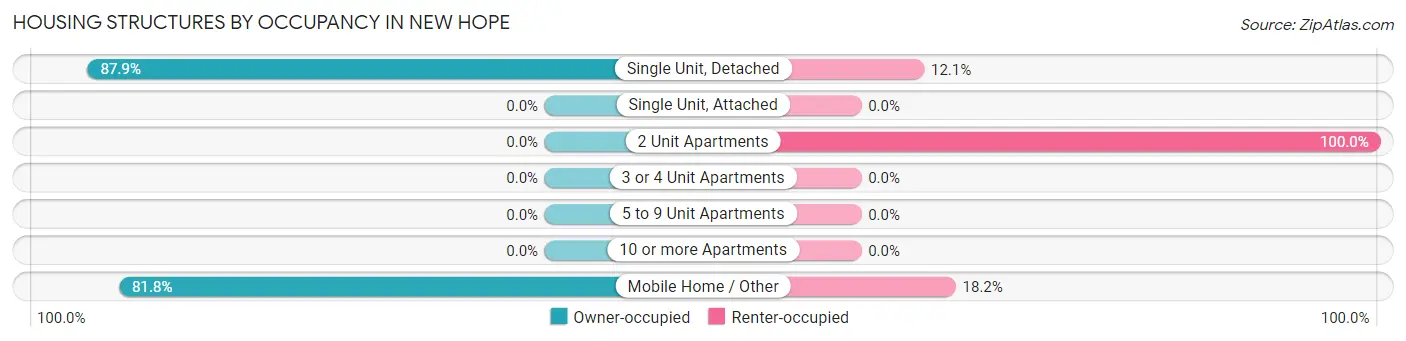
| Structure Type | Owner-occupied | Renter-occupied |
| Single Unit, Detached | 225 (87.9%) | 31 (12.1%) |
| Single Unit, Attached | 0 (0.0%) | 0 (0.0%) |
| 2 Unit Apartments | 0 (0.0%) | 3 (100.0%) |
| 3 or 4 Unit Apartments | 0 (0.0%) | 0 (0.0%) |
| 5 to 9 Unit Apartments | 0 (0.0%) | 0 (0.0%) |
| 10 or more Apartments | 0 (0.0%) | 0 (0.0%) |
| Mobile Home / Other | 90 (81.8%) | 20 (18.2%) |
| Total | 315 (85.4%) | 54 (14.6%) |
Housing Structures by Number of Rooms in New Hope
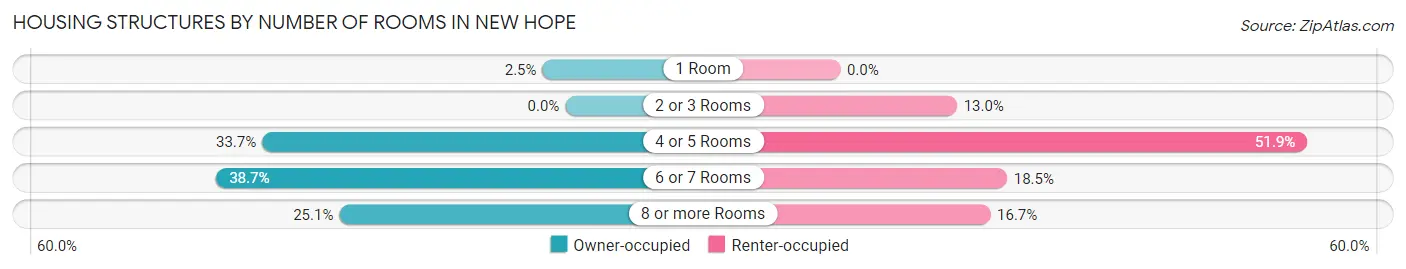
| Number of Rooms | Owner-occupied | Renter-occupied |
| 1 Room | 8 (2.5%) | 0 (0.0%) |
| 2 or 3 Rooms | 0 (0.0%) | 7 (13.0%) |
| 4 or 5 Rooms | 106 (33.7%) | 28 (51.8%) |
| 6 or 7 Rooms | 122 (38.7%) | 10 (18.5%) |
| 8 or more Rooms | 79 (25.1%) | 9 (16.7%) |
| Total | 315 (100.0%) | 54 (100.0%) |
Housing Structure by Heating Type in New Hope
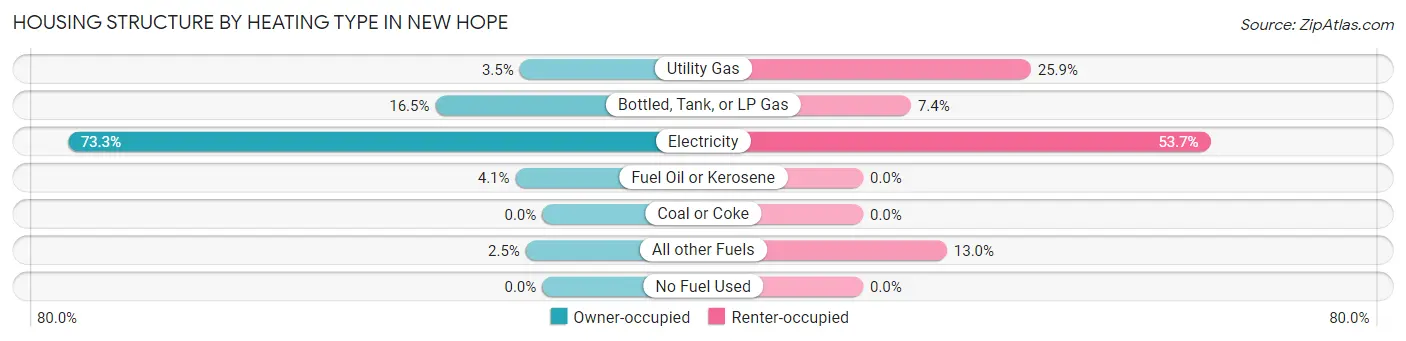
| Heating Type | Owner-occupied | Renter-occupied |
| Utility Gas | 11 (3.5%) | 14 (25.9%) |
| Bottled, Tank, or LP Gas | 52 (16.5%) | 4 (7.4%) |
| Electricity | 231 (73.3%) | 29 (53.7%) |
| Fuel Oil or Kerosene | 13 (4.1%) | 0 (0.0%) |
| Coal or Coke | 0 (0.0%) | 0 (0.0%) |
| All other Fuels | 8 (2.5%) | 7 (13.0%) |
| No Fuel Used | 0 (0.0%) | 0 (0.0%) |
| Total | 315 (100.0%) | 54 (100.0%) |
Household Vehicle Usage in New Hope
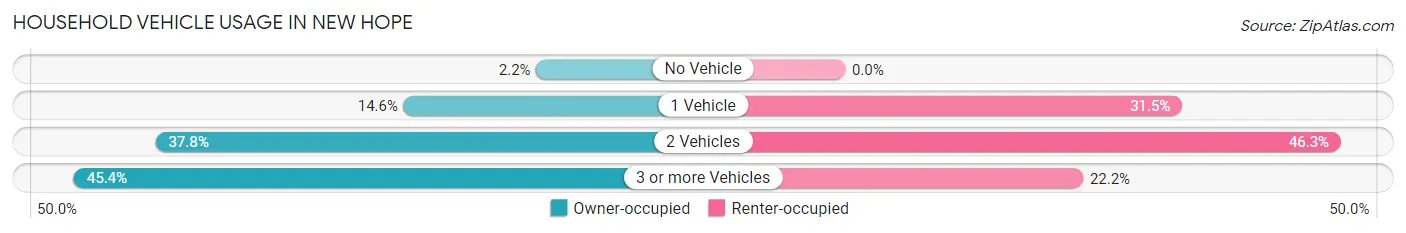
| Vehicles per Household | Owner-occupied | Renter-occupied |
| No Vehicle | 7 (2.2%) | 0 (0.0%) |
| 1 Vehicle | 46 (14.6%) | 17 (31.5%) |
| 2 Vehicles | 119 (37.8%) | 25 (46.3%) |
| 3 or more Vehicles | 143 (45.4%) | 12 (22.2%) |
| Total | 315 (100.0%) | 54 (100.0%) |
Real Estate & Mortgages in New Hope
Real Estate and Mortgage Overview in New Hope
| Characteristic | Without Mortgage | With Mortgage |
| Housing Units | 190 | 125 |
| Median Property Value | $156,300 | $122,700 |
| Median Household Income | $33,500 | $20 |
| Monthly Housing Costs | $397 | $0 |
| Real Estate Taxes | $504 | $0 |
Property Value by Mortgage Status in New Hope
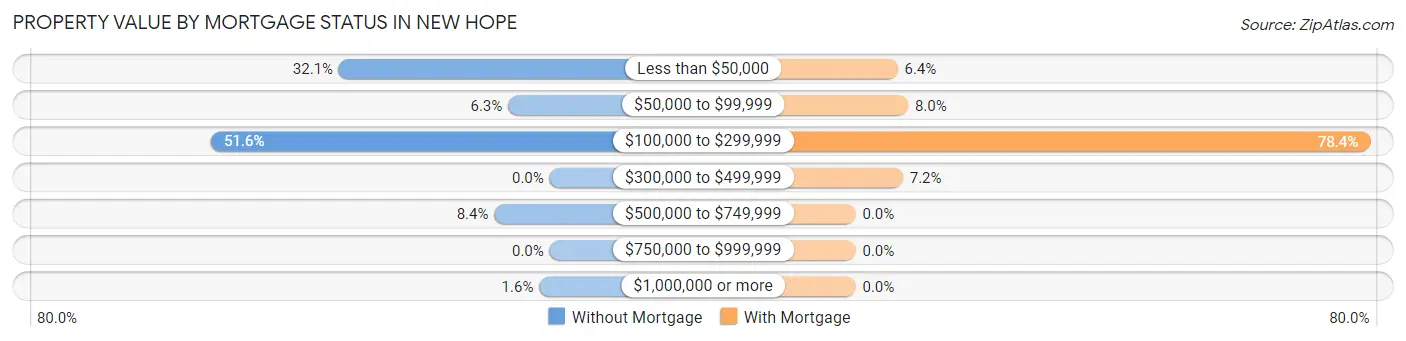
| Property Value | Without Mortgage | With Mortgage |
| Less than $50,000 | 61 (32.1%) | 8 (6.4%) |
| $50,000 to $99,999 | 12 (6.3%) | 10 (8.0%) |
| $100,000 to $299,999 | 98 (51.6%) | 98 (78.4%) |
| $300,000 to $499,999 | 0 (0.0%) | 9 (7.2%) |
| $500,000 to $749,999 | 16 (8.4%) | 0 (0.0%) |
| $750,000 to $999,999 | 0 (0.0%) | 0 (0.0%) |
| $1,000,000 or more | 3 (1.6%) | 0 (0.0%) |
| Total | 190 (100.0%) | 125 (100.0%) |
Household Income by Mortgage Status in New Hope
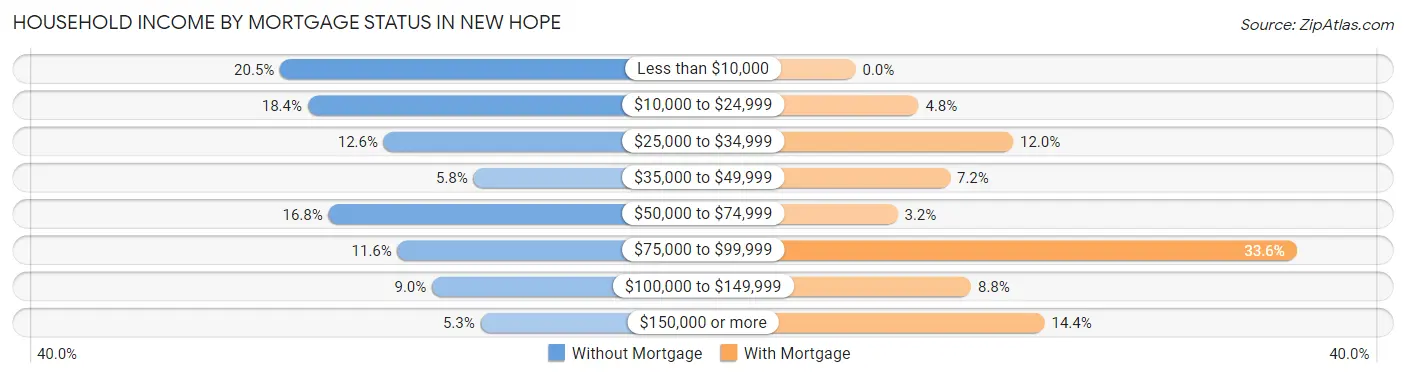
| Household Income | Without Mortgage | With Mortgage |
| Less than $10,000 | 39 (20.5%) | 0 (0.0%) |
| $10,000 to $24,999 | 35 (18.4%) | 6 (4.8%) |
| $25,000 to $34,999 | 24 (12.6%) | 15 (12.0%) |
| $35,000 to $49,999 | 11 (5.8%) | 9 (7.2%) |
| $50,000 to $74,999 | 32 (16.8%) | 4 (3.2%) |
| $75,000 to $99,999 | 22 (11.6%) | 42 (33.6%) |
| $100,000 to $149,999 | 17 (8.9%) | 11 (8.8%) |
| $150,000 or more | 10 (5.3%) | 18 (14.4%) |
| Total | 190 (100.0%) | 125 (100.0%) |
Property Value to Household Income Ratio in New Hope
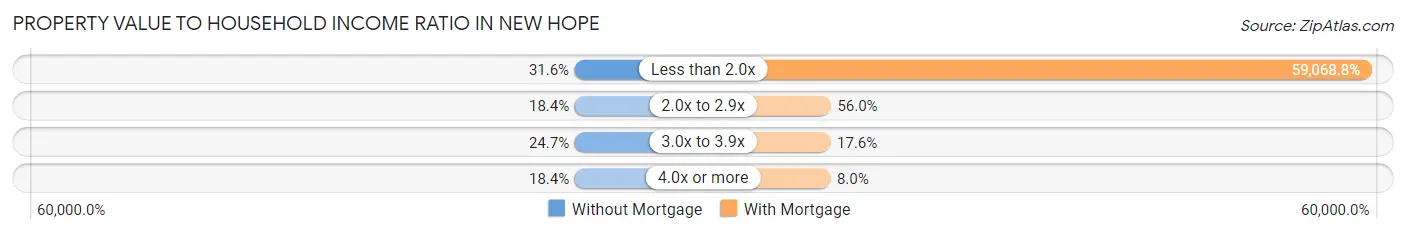
| Value-to-Income Ratio | Without Mortgage | With Mortgage |
| Less than 2.0x | 60 (31.6%) | 73,836 (59,068.8%) |
| 2.0x to 2.9x | 35 (18.4%) | 70 (56.0%) |
| 3.0x to 3.9x | 47 (24.7%) | 22 (17.6%) |
| 4.0x or more | 35 (18.4%) | 10 (8.0%) |
| Total | 190 (100.0%) | 125 (100.0%) |
Real Estate Taxes by Mortgage Status in New Hope
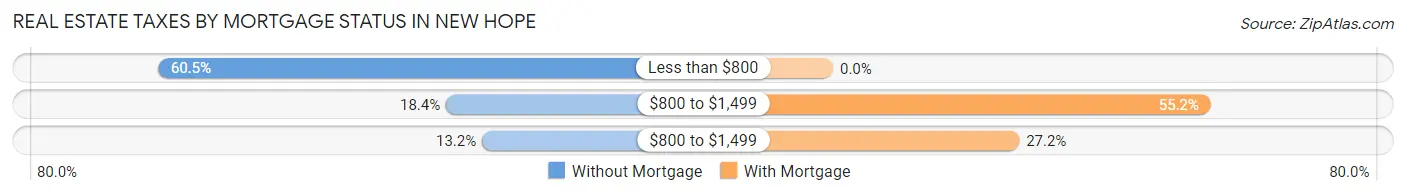
| Property Taxes | Without Mortgage | With Mortgage |
| Less than $800 | 115 (60.5%) | 0 (0.0%) |
| $800 to $1,499 | 35 (18.4%) | 69 (55.2%) |
| $800 to $1,499 | 25 (13.2%) | 34 (27.2%) |
| Total | 190 (100.0%) | 125 (100.0%) |
Health & Disability in New Hope
Health Insurance Coverage by Age in New Hope
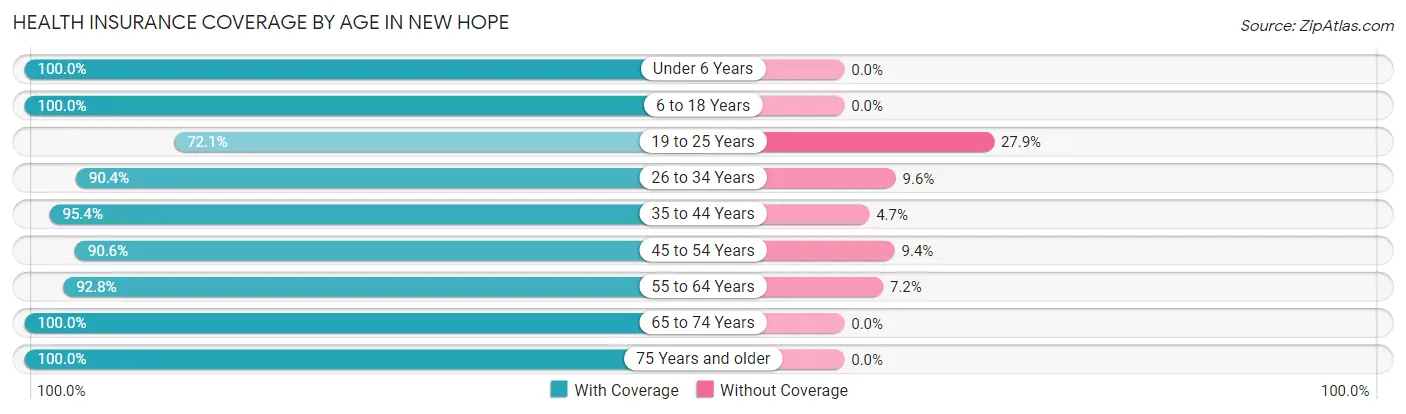
| Age Bracket | With Coverage | Without Coverage |
| Under 6 Years | 48 (100.0%) | 0 (0.0%) |
| 6 to 18 Years | 79 (100.0%) | 0 (0.0%) |
| 19 to 25 Years | 62 (72.1%) | 24 (27.9%) |
| 26 to 34 Years | 85 (90.4%) | 9 (9.6%) |
| 35 to 44 Years | 82 (95.4%) | 4 (4.6%) |
| 45 to 54 Years | 116 (90.6%) | 12 (9.4%) |
| 55 to 64 Years | 103 (92.8%) | 8 (7.2%) |
| 65 to 74 Years | 136 (100.0%) | 0 (0.0%) |
| 75 Years and older | 71 (100.0%) | 0 (0.0%) |
| Total | 782 (93.2%) | 57 (6.8%) |
Health Insurance Coverage by Citizenship Status in New Hope
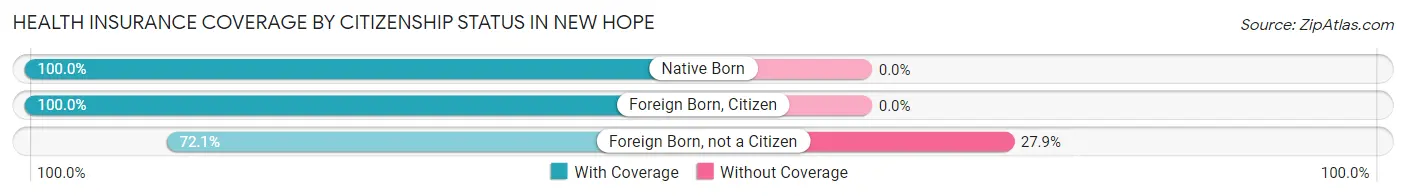
| Citizenship Status | With Coverage | Without Coverage |
| Native Born | 48 (100.0%) | 0 (0.0%) |
| Foreign Born, Citizen | 79 (100.0%) | 0 (0.0%) |
| Foreign Born, not a Citizen | 62 (72.1%) | 24 (27.9%) |
Health Insurance Coverage by Household Income in New Hope
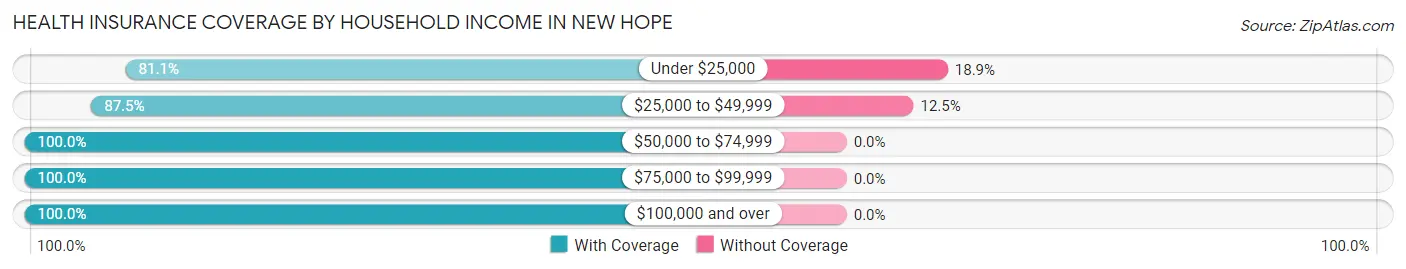
| Household Income | With Coverage | Without Coverage |
| Under $25,000 | 184 (81.1%) | 43 (18.9%) |
| $25,000 to $49,999 | 98 (87.5%) | 14 (12.5%) |
| $50,000 to $74,999 | 243 (100.0%) | 0 (0.0%) |
| $75,000 to $99,999 | 71 (100.0%) | 0 (0.0%) |
| $100,000 and over | 186 (100.0%) | 0 (0.0%) |
Public vs Private Health Insurance Coverage by Age in New Hope
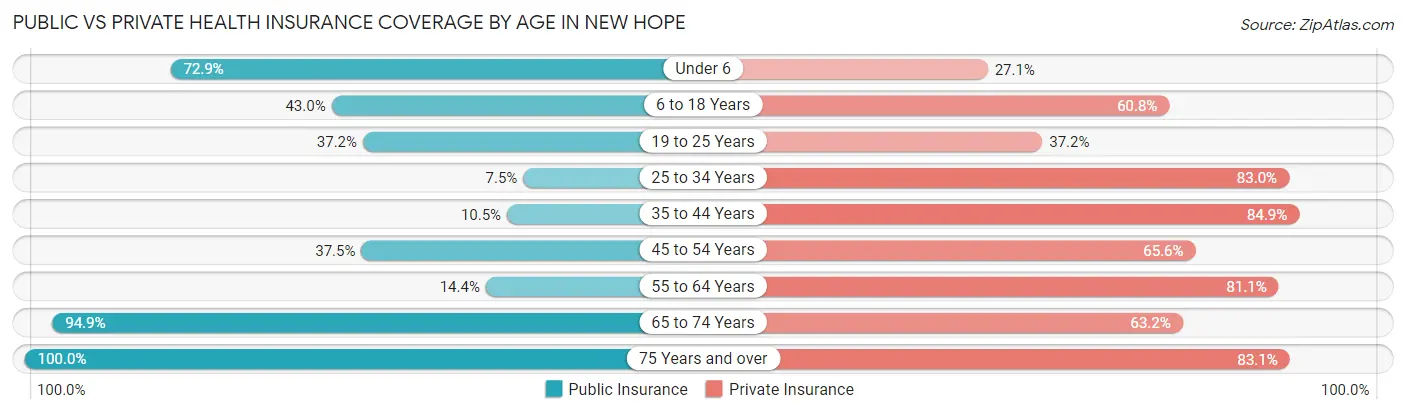
| Age Bracket | Public Insurance | Private Insurance |
| Under 6 | 35 (72.9%) | 13 (27.1%) |
| 6 to 18 Years | 34 (43.0%) | 48 (60.8%) |
| 19 to 25 Years | 32 (37.2%) | 32 (37.2%) |
| 25 to 34 Years | 7 (7.4%) | 78 (83.0%) |
| 35 to 44 Years | 9 (10.5%) | 73 (84.9%) |
| 45 to 54 Years | 48 (37.5%) | 84 (65.6%) |
| 55 to 64 Years | 16 (14.4%) | 90 (81.1%) |
| 65 to 74 Years | 129 (94.9%) | 86 (63.2%) |
| 75 Years and over | 71 (100.0%) | 59 (83.1%) |
| Total | 381 (45.4%) | 563 (67.1%) |
Disability Status by Sex by Age in New Hope
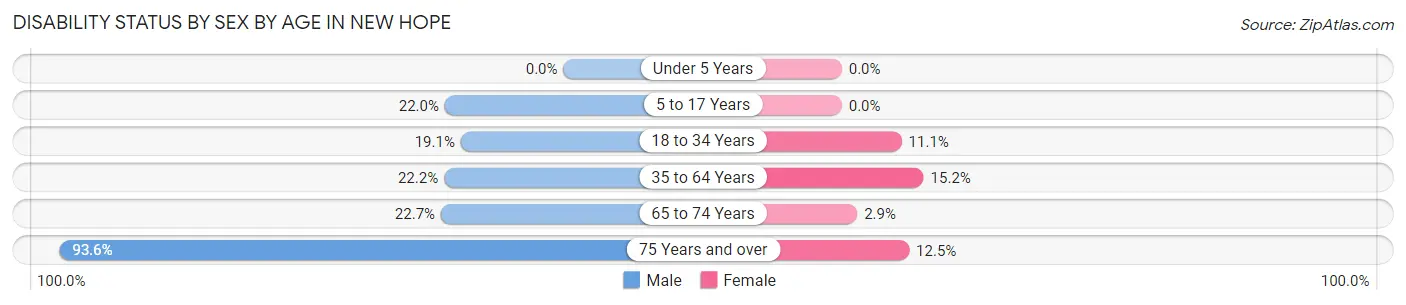
| Age Bracket | Male | Female |
| Under 5 Years | 0 (0.0%) | 0 (0.0%) |
| 5 to 17 Years | 11 (22.0%) | 0 (0.0%) |
| 18 to 34 Years | 12 (19.1%) | 13 (11.1%) |
| 35 to 64 Years | 37 (22.2%) | 24 (15.2%) |
| 65 to 74 Years | 15 (22.7%) | 2 (2.9%) |
| 75 Years and over | 29 (93.5%) | 5 (12.5%) |
Disability Class by Sex by Age in New Hope
Disability Class: Hearing Difficulty
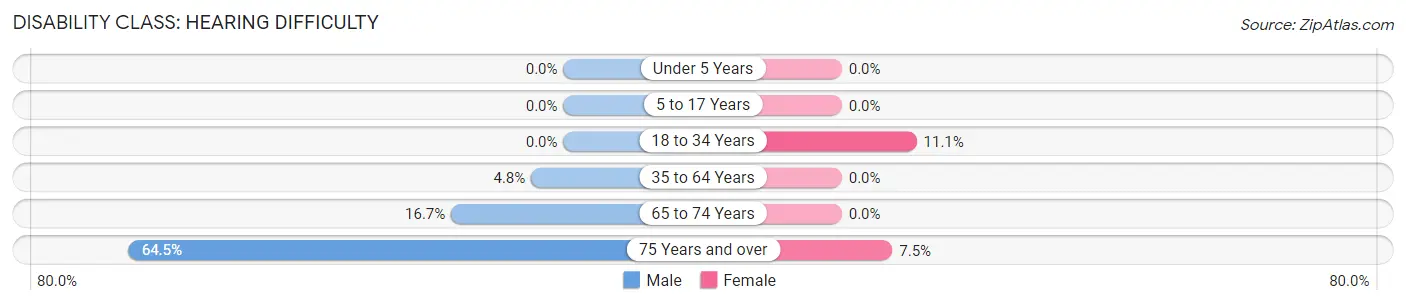
| Age Bracket | Male | Female |
| Under 5 Years | 0 (0.0%) | 0 (0.0%) |
| 5 to 17 Years | 0 (0.0%) | 0 (0.0%) |
| 18 to 34 Years | 0 (0.0%) | 13 (11.1%) |
| 35 to 64 Years | 8 (4.8%) | 0 (0.0%) |
| 65 to 74 Years | 11 (16.7%) | 0 (0.0%) |
| 75 Years and over | 20 (64.5%) | 3 (7.5%) |
Disability Class: Vision Difficulty
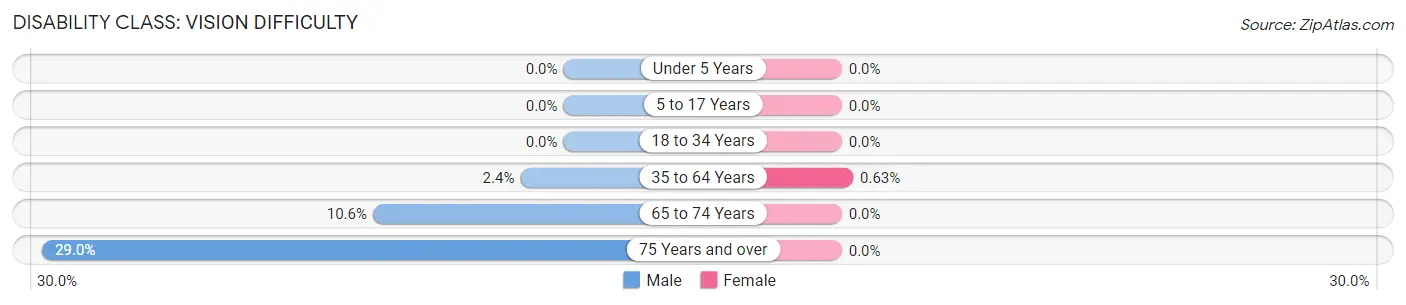
| Age Bracket | Male | Female |
| Under 5 Years | 0 (0.0%) | 0 (0.0%) |
| 5 to 17 Years | 0 (0.0%) | 0 (0.0%) |
| 18 to 34 Years | 0 (0.0%) | 0 (0.0%) |
| 35 to 64 Years | 4 (2.4%) | 1 (0.6%) |
| 65 to 74 Years | 7 (10.6%) | 0 (0.0%) |
| 75 Years and over | 9 (29.0%) | 0 (0.0%) |
Disability Class: Cognitive Difficulty
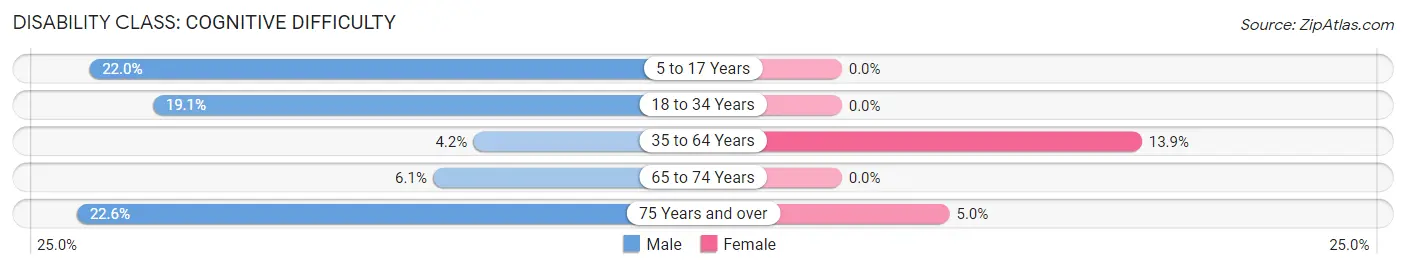
| Age Bracket | Male | Female |
| 5 to 17 Years | 11 (22.0%) | 0 (0.0%) |
| 18 to 34 Years | 12 (19.1%) | 0 (0.0%) |
| 35 to 64 Years | 7 (4.2%) | 22 (13.9%) |
| 65 to 74 Years | 4 (6.1%) | 0 (0.0%) |
| 75 Years and over | 7 (22.6%) | 2 (5.0%) |
Disability Class: Ambulatory Difficulty
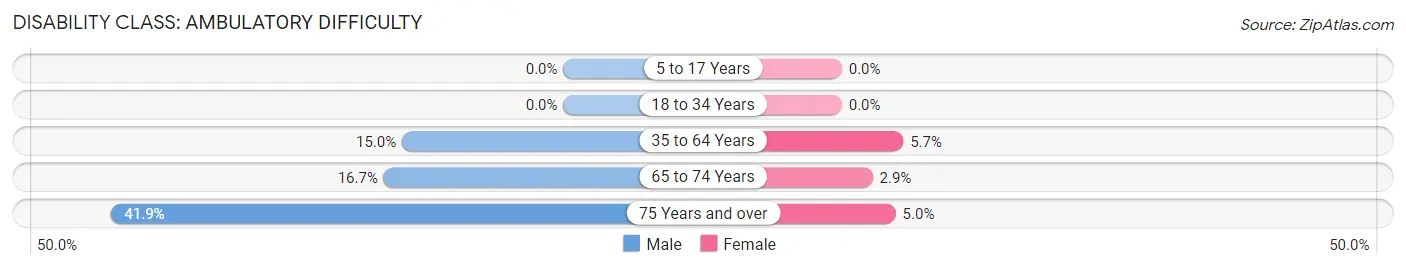
| Age Bracket | Male | Female |
| 5 to 17 Years | 0 (0.0%) | 0 (0.0%) |
| 18 to 34 Years | 0 (0.0%) | 0 (0.0%) |
| 35 to 64 Years | 25 (15.0%) | 9 (5.7%) |
| 65 to 74 Years | 11 (16.7%) | 2 (2.9%) |
| 75 Years and over | 13 (41.9%) | 2 (5.0%) |
Disability Class: Self-Care Difficulty
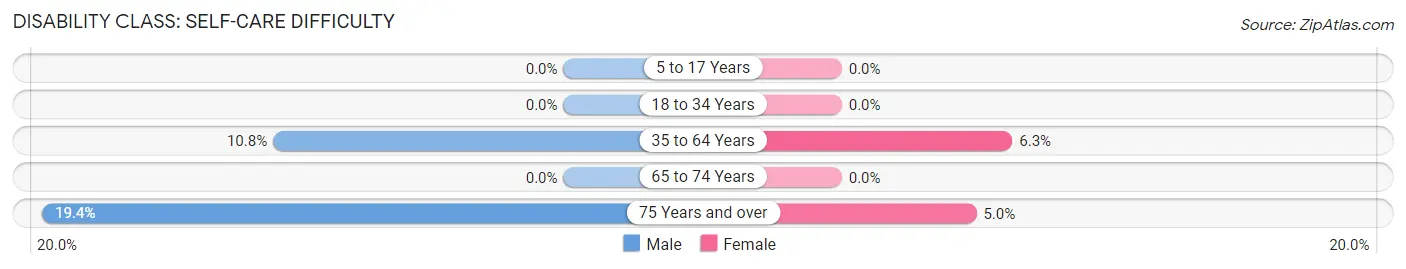
| Age Bracket | Male | Female |
| 5 to 17 Years | 0 (0.0%) | 0 (0.0%) |
| 18 to 34 Years | 0 (0.0%) | 0 (0.0%) |
| 35 to 64 Years | 18 (10.8%) | 10 (6.3%) |
| 65 to 74 Years | 0 (0.0%) | 0 (0.0%) |
| 75 Years and over | 6 (19.4%) | 2 (5.0%) |
Technology Access in New Hope
Computing Device Access in New Hope
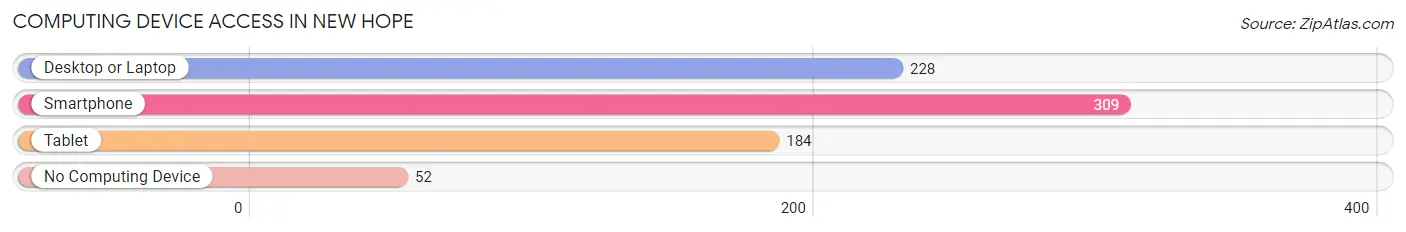
| Device Type | # Households | % Households |
| Desktop or Laptop | 228 | 61.8% |
| Smartphone | 309 | 83.7% |
| Tablet | 184 | 49.9% |
| No Computing Device | 52 | 14.1% |
| Total | 369 | 100.0% |
Internet Access in New Hope
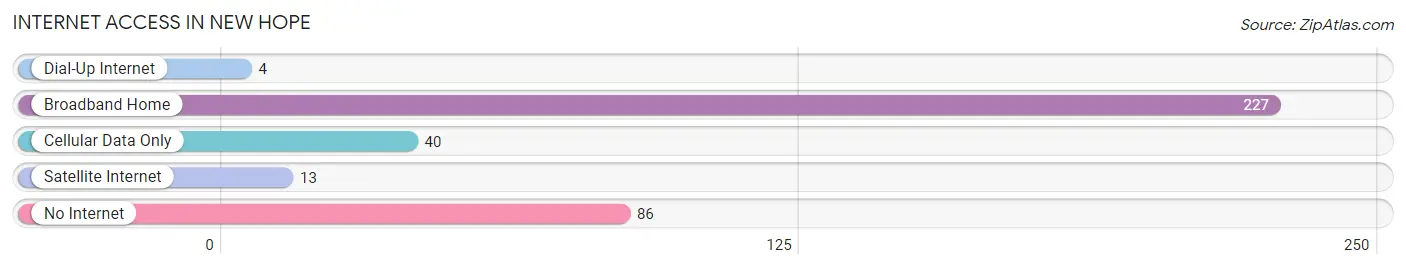
| Internet Type | # Households | % Households |
| Dial-Up Internet | 4 | 1.1% |
| Broadband Home | 227 | 61.5% |
| Cellular Data Only | 40 | 10.8% |
| Satellite Internet | 13 | 3.5% |
| No Internet | 86 | 23.3% |
| Total | 369 | 100.0% |
New Hope Summary
History
New Hope, Tennessee is a small town located in the northwest corner of the state, in the foothills of the Appalachian Mountains. It was first settled in the early 1800s by a group of settlers from North Carolina. The town was originally called “New Hope” because the settlers were hoping for a better life in the new land. The town was officially incorporated in 1845.
The town was a small farming community for many years, but in the late 1800s, the railroad came through and the town began to grow. The railroad brought new businesses and industries to the area, and the population began to increase. The town was also home to several churches, schools, and other businesses.
In the early 1900s, the town was a popular tourist destination, with many people coming to visit the nearby mountains and lakes. The town was also home to several resorts and hotels.
In the 1950s, the town began to decline as the railroad stopped running and the population began to move away. The town was nearly abandoned by the 1970s, but in the 1980s, the town began to experience a resurgence. New businesses and industries began to move into the area, and the population began to increase once again.
Today, New Hope is a small town with a population of just over 1,000 people. The town is still home to several churches, schools, and businesses, and is a popular tourist destination.
Geography
New Hope is located in the northwest corner of Tennessee, in the foothills of the Appalachian Mountains. The town is situated on the banks of the New Hope River, which flows through the town and into the nearby Tennessee River. The town is surrounded by rolling hills and forests, and is home to several lakes and streams.
The climate in New Hope is mild, with hot summers and cold winters. The average temperature in the summer is around 80 degrees Fahrenheit, and the average temperature in the winter is around 40 degrees Fahrenheit.
Economy
The economy of New Hope is largely based on tourism and agriculture. The town is home to several resorts and hotels, as well as several farms and ranches. The town is also home to several small businesses, including restaurants, shops, and other services.
The town is also home to several manufacturing companies, including a furniture factory and a paper mill. The town is also home to several churches, schools, and other businesses.
Demographics
As of the 2010 census, the population of New Hope was 1,072. The population is mostly white (94.3%), with a small percentage of African Americans (3.2%) and other races (2.5%). The median household income is $37,500, and the median age is 41.
The town is home to several churches, including Baptist, Methodist, and Presbyterian. The town is also home to several schools, including a public elementary school and a private high school.
Conclusion
New Hope, Tennessee is a small town located in the northwest corner of the state, in the foothills of the Appalachian Mountains. The town was first settled in the early 1800s, and was officially incorporated in 1845. The town was a popular tourist destination in the early 1900s, but declined in the 1950s. In the 1980s, the town began to experience a resurgence, and today is a small town with a population of just over 1,000 people. The economy of New Hope is largely based on tourism and agriculture, and the town is home to several churches, schools, and businesses.
Common Questions
What is Per Capita Income in New Hope?
Per Capita income in New Hope is $26,988.
What is the Median Family Income in New Hope?
Median Family Income in New Hope is $62,159.
What is the Median Household income in New Hope?
Median Household Income in New Hope is $47,250.
What is Income or Wage Gap in New Hope?
Income or Wage Gap in New Hope is 52.3%.
Women in New Hope earn 47.7 cents for every dollar earned by a man.
What is Inequality or Gini Index in New Hope?
Inequality or Gini Index in New Hope is 0.48.
What is the Total Population of New Hope?
Total Population of New Hope is 839.
What is the Total Male Population of New Hope?
Total Male Population of New Hope is 407.
What is the Total Female Population of New Hope?
Total Female Population of New Hope is 432.
What is the Ratio of Males per 100 Females in New Hope?
There are 94.21 Males per 100 Females in New Hope.
What is the Ratio of Females per 100 Males in New Hope?
There are 106.14 Females per 100 Males in New Hope.
What is the Median Population Age in New Hope?
Median Population Age in New Hope is 47.9 Years.
What is the Average Family Size in New Hope
Average Family Size in New Hope is 2.8 People.
What is the Average Household Size in New Hope
Average Household Size in New Hope is 2.3 People.
How Large is the Labor Force in New Hope?
There are 418 People in the Labor Forcein in New Hope.
What is the Percentage of People in the Labor Force in New Hope?
58.3% of People are in the Labor Force in New Hope.
What is the Unemployment Rate in New Hope?
Unemployment Rate in New Hope is 9.8%.