Zip Codes with the Lowest Poverty Level Among Children Under the Age of 5 in Tennessee
RELATED REPORTS & OPTIONS
Lowest Poverty | Child 0-5
Tennessee
Compare Zip Codes
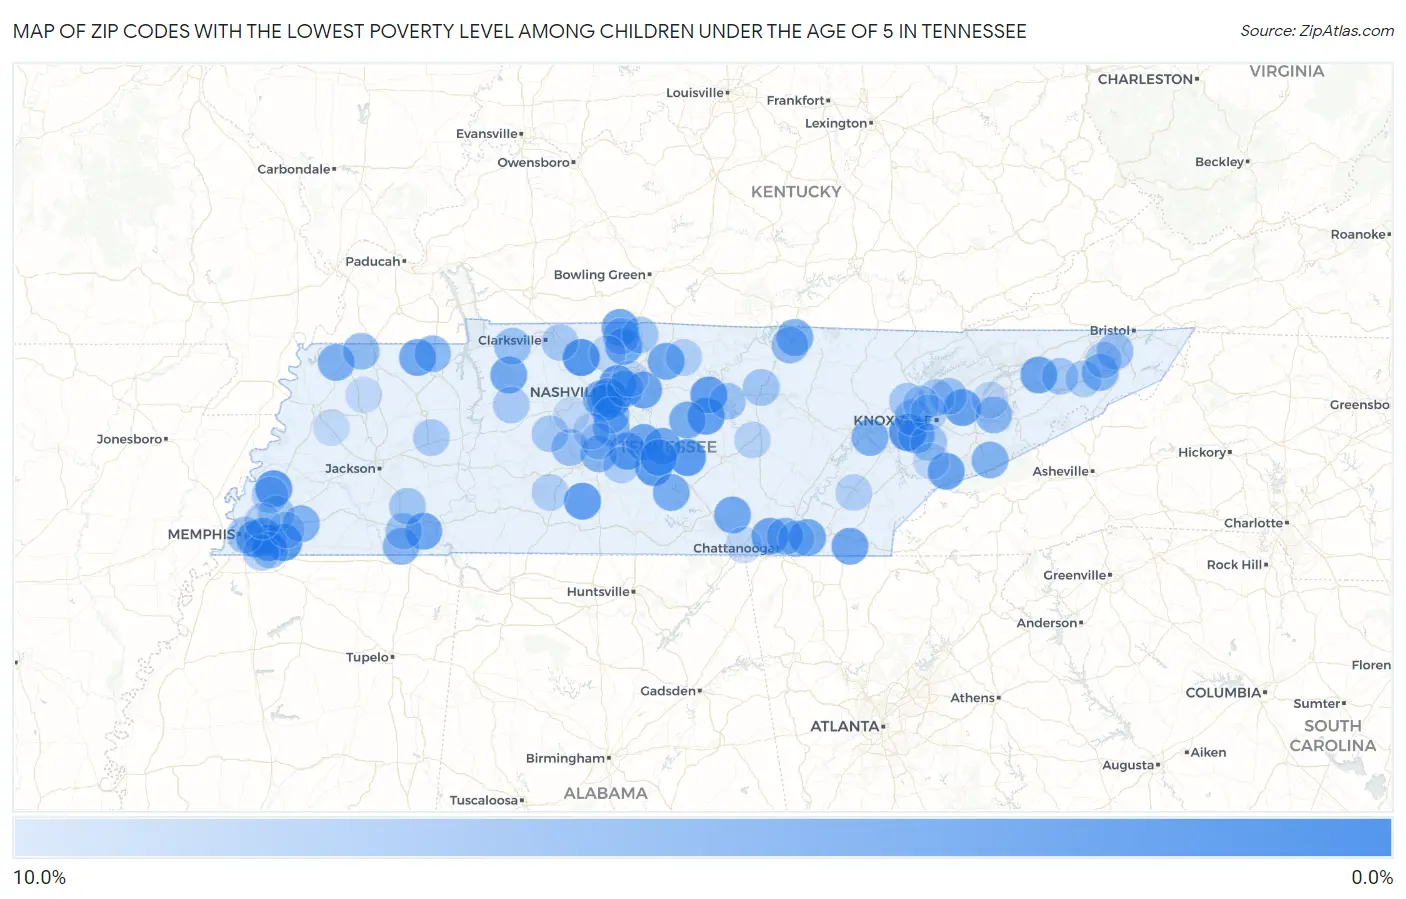
Map of Zip Codes with the Lowest Poverty Level Among Children Under the Age of 5 in Tennessee
10.0%
0.0%
Zip Codes with the Lowest Poverty Level Among Children Under the Age of 5 in Tennessee
| Zip Code | Child Poverty | vs State | vs National | |
| 1. | 37934 | 0.21% | 21.4%(-21.2)#1 | 18.1%(-17.9)#10 |
| 2. | 37146 | 0.26% | 21.4%(-21.1)#2 | 18.1%(-17.8)#13 |
| 3. | 38017 | 0.56% | 21.4%(-20.8)#3 | 18.1%(-17.5)#80 |
| 4. | 37026 | 0.63% | 21.4%(-20.8)#4 | 18.1%(-17.4)#101 |
| 5. | 38011 | 0.87% | 21.4%(-20.5)#5 | 18.1%(-17.2)#216 |
| 6. | 37020 | 0.90% | 21.4%(-20.5)#6 | 18.1%(-17.2)#229 |
| 7. | 37216 | 0.99% | 21.4%(-20.4)#7 | 18.1%(-17.1)#272 |
| 8. | 38472 | 1.2% | 21.4%(-20.2)#8 | 18.1%(-16.9)#363 |
| 9. | 37095 | 1.2% | 21.4%(-20.2)#9 | 18.1%(-16.8)#389 |
| 10. | 38567 | 1.3% | 21.4%(-20.1)#10 | 18.1%(-16.7)#431 |
| 11. | 37204 | 1.4% | 21.4%(-20.0)#11 | 18.1%(-16.6)#492 |
| 12. | 37871 | 1.5% | 21.4%(-19.9)#12 | 18.1%(-16.5)#542 |
| 13. | 38117 | 1.6% | 21.4%(-19.8)#13 | 18.1%(-16.5)#596 |
| 14. | 38120 | 1.7% | 21.4%(-19.7)#14 | 18.1%(-16.4)#621 |
| 15. | 37060 | 1.7% | 21.4%(-19.7)#15 | 18.1%(-16.3)#663 |
| 16. | 37405 | 2.0% | 21.4%(-19.4)#16 | 18.1%(-16.0)#850 |
| 17. | 37711 | 2.1% | 21.4%(-19.3)#17 | 18.1%(-16.0)#884 |
| 18. | 37122 | 2.1% | 21.4%(-19.3)#18 | 18.1%(-15.9)#917 |
| 19. | 37882 | 2.2% | 21.4%(-19.2)#19 | 18.1%(-15.9)#950 |
| 20. | 38379 | 2.2% | 21.4%(-19.2)#20 | 18.1%(-15.9)#965 |
| 21. | 37128 | 2.3% | 21.4%(-19.1)#21 | 18.1%(-15.8)#1,020 |
| 22. | 37362 | 2.3% | 21.4%(-19.0)#22 | 18.1%(-15.7)#1,055 |
| 23. | 37141 | 2.4% | 21.4%(-19.0)#23 | 18.1%(-15.7)#1,061 |
| 24. | 37031 | 2.4% | 21.4%(-19.0)#24 | 18.1%(-15.7)#1,064 |
| 25. | 37127 | 2.4% | 21.4%(-19.0)#25 | 18.1%(-15.7)#1,076 |
| 26. | 37363 | 2.4% | 21.4%(-19.0)#26 | 18.1%(-15.7)#1,089 |
| 27. | 37387 | 2.4% | 21.4%(-19.0)#27 | 18.1%(-15.7)#1,093 |
| 28. | 37061 | 2.4% | 21.4%(-19.0)#28 | 18.1%(-15.7)#1,095 |
| 29. | 38224 | 2.5% | 21.4%(-18.9)#29 | 18.1%(-15.5)#1,188 |
| 30. | 37188 | 2.6% | 21.4%(-18.8)#30 | 18.1%(-15.5)#1,223 |
| 31. | 37205 | 2.6% | 21.4%(-18.8)#31 | 18.1%(-15.4)#1,239 |
| 32. | 37037 | 2.6% | 21.4%(-18.7)#32 | 18.1%(-15.4)#1,256 |
| 33. | 38138 | 2.7% | 21.4%(-18.7)#33 | 18.1%(-15.4)#1,276 |
| 34. | 37212 | 2.7% | 21.4%(-18.7)#34 | 18.1%(-15.4)#1,290 |
| 35. | 37016 | 3.0% | 21.4%(-18.4)#35 | 18.1%(-15.0)#1,522 |
| 36. | 37360 | 3.2% | 21.4%(-18.2)#36 | 18.1%(-14.9)#1,627 |
| 37. | 37067 | 3.2% | 21.4%(-18.2)#37 | 18.1%(-14.9)#1,640 |
| 38. | 38549 | 3.2% | 21.4%(-18.2)#38 | 18.1%(-14.8)#1,650 |
| 39. | 38260 | 3.4% | 21.4%(-18.0)#39 | 18.1%(-14.6)#1,777 |
| 40. | 37763 | 3.5% | 21.4%(-17.9)#40 | 18.1%(-14.6)#1,812 |
| 41. | 38060 | 3.8% | 21.4%(-17.6)#41 | 18.1%(-14.2)#2,043 |
| 42. | 37415 | 3.8% | 21.4%(-17.6)#42 | 18.1%(-14.2)#2,047 |
| 43. | 37922 | 3.8% | 21.4%(-17.5)#43 | 18.1%(-14.2)#2,052 |
| 44. | 37738 | 3.9% | 21.4%(-17.5)#44 | 18.1%(-14.1)#2,106 |
| 45. | 37659 | 3.9% | 21.4%(-17.4)#45 | 18.1%(-14.1)#2,124 |
| 46. | 37174 | 4.1% | 21.4%(-17.3)#46 | 18.1%(-13.9)#2,279 |
| 47. | 38367 | 4.2% | 21.4%(-17.2)#47 | 18.1%(-13.9)#2,299 |
| 48. | 37215 | 4.3% | 21.4%(-17.1)#48 | 18.1%(-13.8)#2,408 |
| 49. | 38251 | 4.6% | 21.4%(-16.8)#49 | 18.1%(-13.5)#2,631 |
| 50. | 37725 | 4.9% | 21.4%(-16.5)#50 | 18.1%(-13.2)#2,793 |
| 51. | 38573 | 4.9% | 21.4%(-16.5)#51 | 18.1%(-13.2)#2,817 |
| 52. | 37027 | 5.0% | 21.4%(-16.4)#52 | 18.1%(-13.1)#2,885 |
| 53. | 38257 | 5.0% | 21.4%(-16.4)#53 | 18.1%(-13.0)#2,920 |
| 54. | 37049 | 5.3% | 21.4%(-16.1)#54 | 18.1%(-12.8)#3,066 |
| 55. | 37214 | 5.5% | 21.4%(-15.9)#55 | 18.1%(-12.6)#3,245 |
| 56. | 38482 | 5.6% | 21.4%(-15.8)#56 | 18.1%(-12.5)#3,284 |
| 57. | 37686 | 5.6% | 21.4%(-15.8)#57 | 18.1%(-12.5)#3,311 |
| 58. | 37079 | 5.8% | 21.4%(-15.6)#58 | 18.1%(-12.3)#3,426 |
| 59. | 38125 | 5.9% | 21.4%(-15.5)#59 | 18.1%(-12.1)#3,543 |
| 60. | 38375 | 6.0% | 21.4%(-15.4)#60 | 18.1%(-12.0)#3,620 |
| 61. | 38582 | 6.0% | 21.4%(-15.3)#61 | 18.1%(-12.0)#3,623 |
| 62. | 37721 | 6.1% | 21.4%(-15.3)#62 | 18.1%(-12.0)#3,632 |
| 63. | 37931 | 6.1% | 21.4%(-15.3)#63 | 18.1%(-12.0)#3,635 |
| 64. | 38506 | 6.2% | 21.4%(-15.2)#64 | 18.1%(-11.9)#3,728 |
| 65. | 37745 | 6.2% | 21.4%(-15.2)#65 | 18.1%(-11.8)#3,751 |
| 66. | 37148 | 6.3% | 21.4%(-15.1)#66 | 18.1%(-11.8)#3,790 |
| 67. | 38334 | 6.4% | 21.4%(-15.0)#67 | 18.1%(-11.7)#3,883 |
| 68. | 37701 | 6.4% | 21.4%(-15.0)#68 | 18.1%(-11.6)#3,895 |
| 69. | 38104 | 6.5% | 21.4%(-14.9)#69 | 18.1%(-11.6)#3,922 |
| 70. | 37716 | 6.6% | 21.4%(-14.8)#70 | 18.1%(-11.5)#3,992 |
| 71. | 38002 | 6.6% | 21.4%(-14.8)#71 | 18.1%(-11.5)#4,001 |
| 72. | 37043 | 6.7% | 21.4%(-14.7)#72 | 18.1%(-11.4)#4,027 |
| 73. | 37098 | 6.7% | 21.4%(-14.7)#73 | 18.1%(-11.4)#4,029 |
| 74. | 37938 | 6.7% | 21.4%(-14.7)#74 | 18.1%(-11.4)#4,063 |
| 75. | 38390 | 6.9% | 21.4%(-14.5)#75 | 18.1%(-11.2)#4,209 |
| 76. | 37101 | 6.9% | 21.4%(-14.4)#76 | 18.1%(-11.1)#4,253 |
| 77. | 38004 | 7.1% | 21.4%(-14.3)#77 | 18.1%(-11.0)#4,343 |
| 78. | 37681 | 7.2% | 21.4%(-14.2)#78 | 18.1%(-10.9)#4,409 |
| 79. | 37615 | 7.2% | 21.4%(-14.2)#79 | 18.1%(-10.9)#4,411 |
| 80. | 38141 | 7.2% | 21.4%(-14.2)#80 | 18.1%(-10.9)#4,412 |
| 81. | 37179 | 7.2% | 21.4%(-14.2)#81 | 18.1%(-10.9)#4,415 |
| 82. | 37034 | 7.2% | 21.4%(-14.2)#82 | 18.1%(-10.9)#4,428 |
| 83. | 38028 | 7.3% | 21.4%(-14.1)#83 | 18.1%(-10.8)#4,457 |
| 84. | 37416 | 7.3% | 21.4%(-14.1)#84 | 18.1%(-10.7)#4,495 |
| 85. | 37074 | 7.4% | 21.4%(-13.9)#85 | 18.1%(-10.6)#4,574 |
| 86. | 38483 | 7.5% | 21.4%(-13.9)#86 | 18.1%(-10.6)#4,583 |
| 87. | 37849 | 7.5% | 21.4%(-13.9)#87 | 18.1%(-10.6)#4,586 |
| 88. | 37303 | 7.5% | 21.4%(-13.8)#88 | 18.1%(-10.5)#4,628 |
| 89. | 38559 | 7.7% | 21.4%(-13.7)#89 | 18.1%(-10.3)#4,765 |
| 90. | 38135 | 7.8% | 21.4%(-13.6)#90 | 18.1%(-10.3)#4,792 |
| 91. | 37912 | 7.8% | 21.4%(-13.5)#91 | 18.1%(-10.2)#4,822 |
| 92. | 37760 | 8.3% | 21.4%(-13.1)#92 | 18.1%(-9.81)#5,076 |
| 93. | 37064 | 8.3% | 21.4%(-13.1)#93 | 18.1%(-9.76)#5,101 |
| 94. | 37347 | 8.6% | 21.4%(-12.8)#94 | 18.1%(-9.49)#5,311 |
| 95. | 37073 | 8.6% | 21.4%(-12.8)#95 | 18.1%(-9.43)#5,359 |
| 96. | 37803 | 8.7% | 21.4%(-12.7)#96 | 18.1%(-9.37)#5,387 |
| 97. | 37138 | 8.7% | 21.4%(-12.7)#97 | 18.1%(-9.35)#5,412 |
| 98. | 37062 | 8.7% | 21.4%(-12.6)#98 | 18.1%(-9.31)#5,441 |
| 99. | 38369 | 8.8% | 21.4%(-12.6)#99 | 18.1%(-9.26)#5,476 |
| 100. | 38034 | 8.8% | 21.4%(-12.6)#100 | 18.1%(-9.25)#5,484 |
Common Questions
What are the Top 10 Zip Codes with the Lowest Poverty Level Among Children Under the Age of 5 in Tennessee?
Top 10 Zip Codes with the Lowest Poverty Level Among Children Under the Age of 5 in Tennessee are:
What zip code has the Lowest Poverty Level Among Children Under the Age of 5 in Tennessee?
37934 has the Lowest Poverty Level Among Children Under the Age of 5 in Tennessee with 0.21%.
What is the Poverty Level Among Children Under the Age of 5 in the State of Tennessee?
Poverty Level Among Children Under the Age of 5 in Tennessee is 21.4%.
What is the Poverty Level Among Children Under the Age of 5 in the United States?
Poverty Level Among Children Under the Age of 5 in the United States is 18.1%.