Selma, OR Map & Demographics
Selma Map
Selma Overview
$31,308
PER CAPITA INCOME
$42,418
AVG FAMILY INCOME
$42,319
AVG HOUSEHOLD INCOME
0.52
INEQUALITY / GINI INDEX
892
TOTAL POPULATION
425
MALE POPULATION
467
FEMALE POPULATION
91.01
MALES / 100 FEMALES
109.88
FEMALES / 100 MALES
36.6
MEDIAN AGE
3.1
AVG FAMILY SIZE
2.7
AVG HOUSEHOLD SIZE
348
LABOR FORCE [ PEOPLE ]
48.2%
PERCENT IN LABOR FORCE
4.3%
UNEMPLOYMENT RATE
Selma Zip Codes
Selma Area Codes
Income in Selma
Income Overview in Selma
Per Capita Income in Selma is $31,308, while median incomes of families and households are $42,418 and $42,319 respectively.
| Characteristic | Number | Measure |
| Per Capita Income | 892 | $31,308 |
| Median Family Income | 259 | $42,418 |
| Mean Family Income | 259 | $99,797 |
| Median Household Income | 331 | $42,319 |
| Mean Household Income | 331 | $85,884 |
| Income Deficit | 259 | $0 |
| Wage / Income Gap (%) | 892 | 0.00% |
| Wage / Income Gap ($) | 892 | 100.00¢ per $1 |
| Gini / Inequality Index | 892 | 0.52 |
Earnings by Sex in Selma
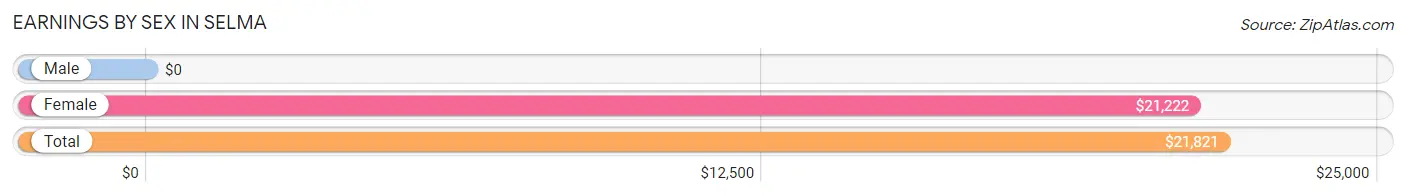
| Sex | Number | Average Earnings |
| Male | 204 (57.3%) | $0 |
| Female | 152 (42.7%) | $21,222 |
| Total | 356 (100.0%) | $21,821 |
Earnings by Sex by Income Bracket in Selma
The most common earnings brackets in Selma are $20,000 to $22,499 for men (96 | 47.1%) and $20,000 to $22,499 for women (88 | 57.9%).
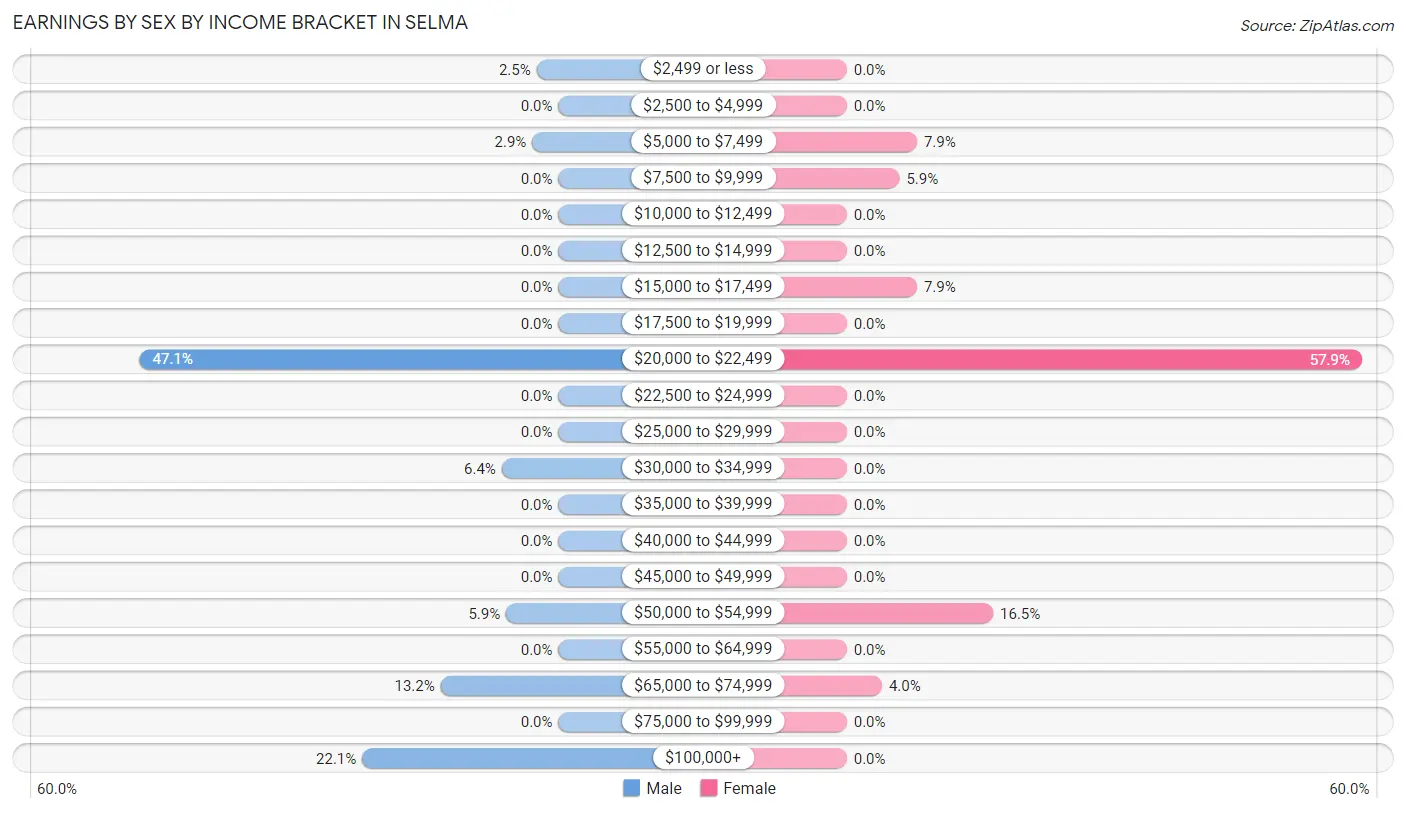
| Income | Male | Female |
| $2,499 or less | 5 (2.5%) | 0 (0.0%) |
| $2,500 to $4,999 | 0 (0.0%) | 0 (0.0%) |
| $5,000 to $7,499 | 6 (2.9%) | 12 (7.9%) |
| $7,500 to $9,999 | 0 (0.0%) | 9 (5.9%) |
| $10,000 to $12,499 | 0 (0.0%) | 0 (0.0%) |
| $12,500 to $14,999 | 0 (0.0%) | 0 (0.0%) |
| $15,000 to $17,499 | 0 (0.0%) | 12 (7.9%) |
| $17,500 to $19,999 | 0 (0.0%) | 0 (0.0%) |
| $20,000 to $22,499 | 96 (47.1%) | 88 (57.9%) |
| $22,500 to $24,999 | 0 (0.0%) | 0 (0.0%) |
| $25,000 to $29,999 | 0 (0.0%) | 0 (0.0%) |
| $30,000 to $34,999 | 13 (6.4%) | 0 (0.0%) |
| $35,000 to $39,999 | 0 (0.0%) | 0 (0.0%) |
| $40,000 to $44,999 | 0 (0.0%) | 0 (0.0%) |
| $45,000 to $49,999 | 0 (0.0%) | 0 (0.0%) |
| $50,000 to $54,999 | 12 (5.9%) | 25 (16.5%) |
| $55,000 to $64,999 | 0 (0.0%) | 0 (0.0%) |
| $65,000 to $74,999 | 27 (13.2%) | 6 (4.0%) |
| $75,000 to $99,999 | 0 (0.0%) | 0 (0.0%) |
| $100,000+ | 45 (22.1%) | 0 (0.0%) |
| Total | 204 (100.0%) | 152 (100.0%) |
Earnings by Sex by Educational Attainment in Selma
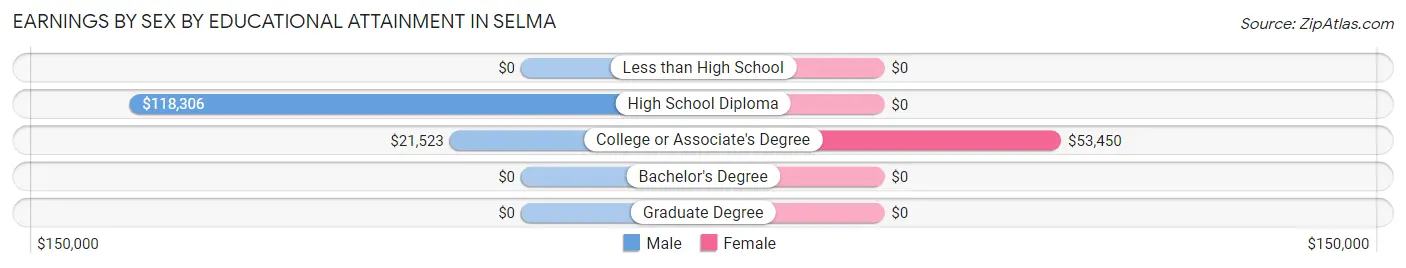
| Educational Attainment | Male Income | Female Income |
| Less than High School | - | - |
| High School Diploma | $118,306 | $0 |
| College or Associate's Degree | $21,523 | $53,450 |
| Bachelor's Degree | - | - |
| Graduate Degree | - | - |
| Total | - | - |
Family Income in Selma
Family Income Brackets in Selma
According to the Selma family income data, there are 105 families falling into the $35,000 to $49,999 income range, which is the most common income bracket and makes up 40.5% of all families.
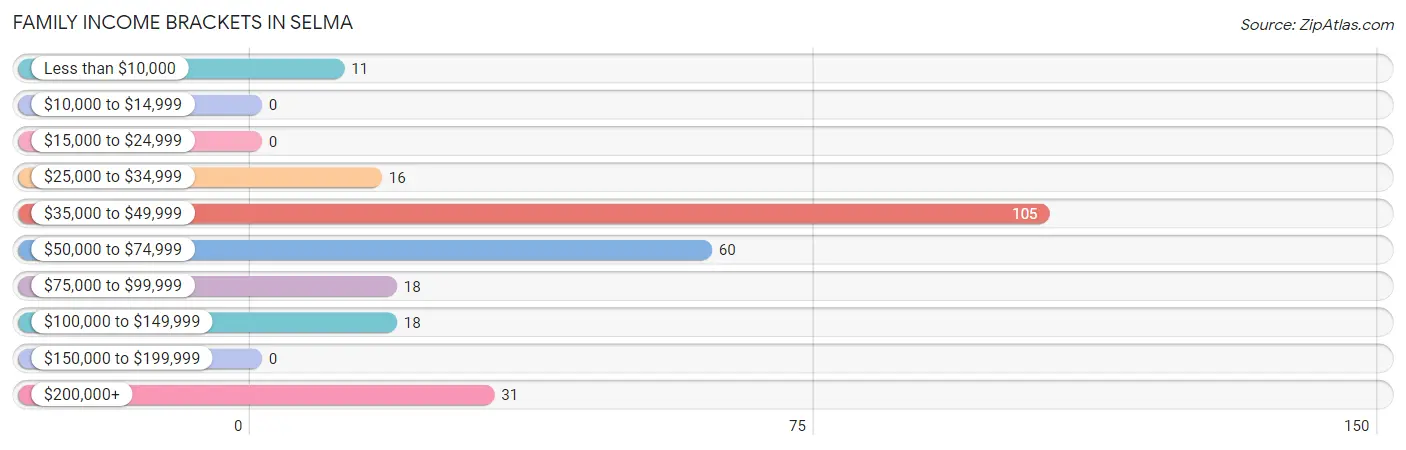
| Income Bracket | # Families | % Families |
| Less than $10,000 | 11 | 4.2% |
| $10,000 to $14,999 | 0 | 0.0% |
| $15,000 to $24,999 | 0 | 0.0% |
| $25,000 to $34,999 | 16 | 6.2% |
| $35,000 to $49,999 | 105 | 40.5% |
| $50,000 to $74,999 | 60 | 23.2% |
| $75,000 to $99,999 | 18 | 6.9% |
| $100,000 to $149,999 | 18 | 6.9% |
| $150,000 to $199,999 | 0 | 0.0% |
| $200,000+ | 31 | 12.0% |
Family Income by Famaliy Size in Selma
4-person families (126 | 48.6%) account for the highest median family income in Selma with $41,711 per family, while 4-person families (126 | 48.6%) have the highest median income of $10,428 per family member.

| Income Bracket | # Families | Median Income |
| 2-Person Families | 111 (42.9%) | $0 |
| 3-Person Families | 10 (3.9%) | $0 |
| 4-Person Families | 126 (48.6%) | $41,711 |
| 5-Person Families | 0 (0.0%) | $0 |
| 6-Person Families | 0 (0.0%) | $0 |
| 7+ Person Families | 12 (4.6%) | $0 |
| Total | 259 (100.0%) | $42,418 |
Family Income by Number of Earners in Selma
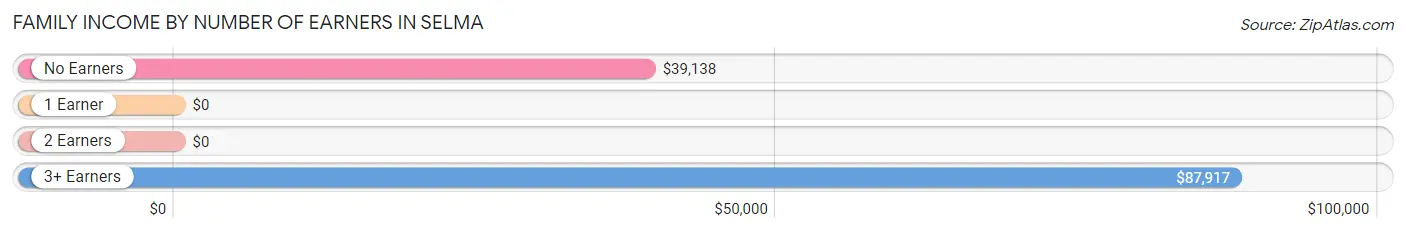
| Number of Earners | # Families | Median Income |
| No Earners | 82 (31.7%) | $39,138 |
| 1 Earner | 73 (28.2%) | $0 |
| 2 Earners | 76 (29.3%) | $0 |
| 3+ Earners | 28 (10.8%) | $87,917 |
| Total | 259 (100.0%) | $42,418 |
Household Income in Selma
Household Income Brackets in Selma
With 105 households falling in the category, the $35,000 to $49,999 income range is the most frequent in Selma, accounting for 31.7% of all households.
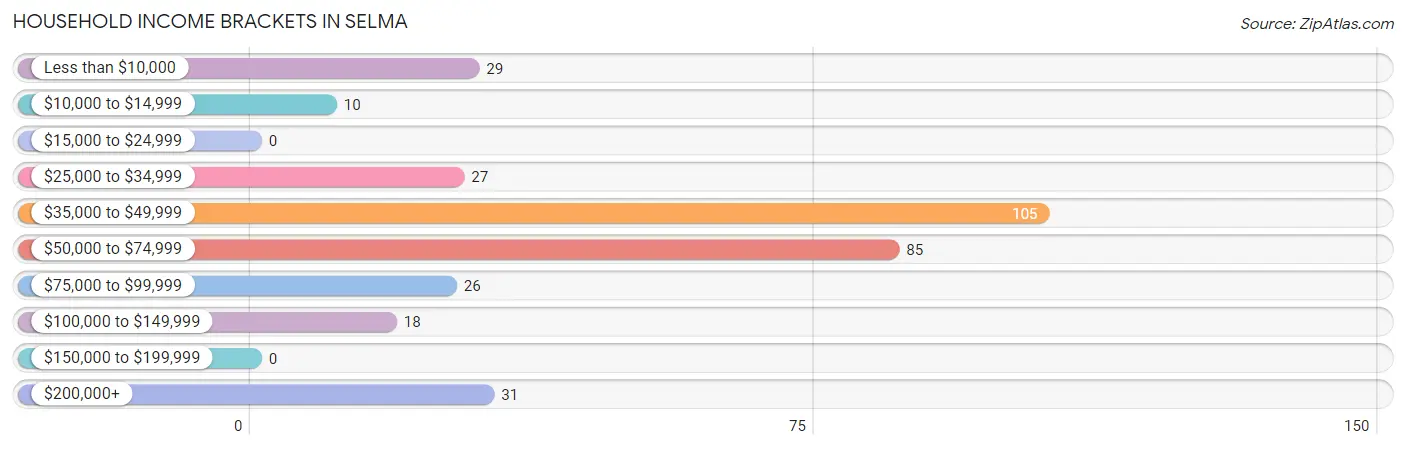
| Income Bracket | # Households | % Households |
| Less than $10,000 | 29 | 8.8% |
| $10,000 to $14,999 | 10 | 3.0% |
| $15,000 to $24,999 | 0 | 0.0% |
| $25,000 to $34,999 | 27 | 8.2% |
| $35,000 to $49,999 | 105 | 31.7% |
| $50,000 to $74,999 | 85 | 25.7% |
| $75,000 to $99,999 | 26 | 7.9% |
| $100,000 to $149,999 | 18 | 5.4% |
| $150,000 to $199,999 | 0 | 0.0% |
| $200,000+ | 31 | 9.4% |
Household Income by Householder Age in Selma
The median household income in Selma is $42,319, with the highest median household income of $41,891 found in the 25 to 44 years age bracket for the primary householder. A total of 115 households (34.7%) fall into this category.
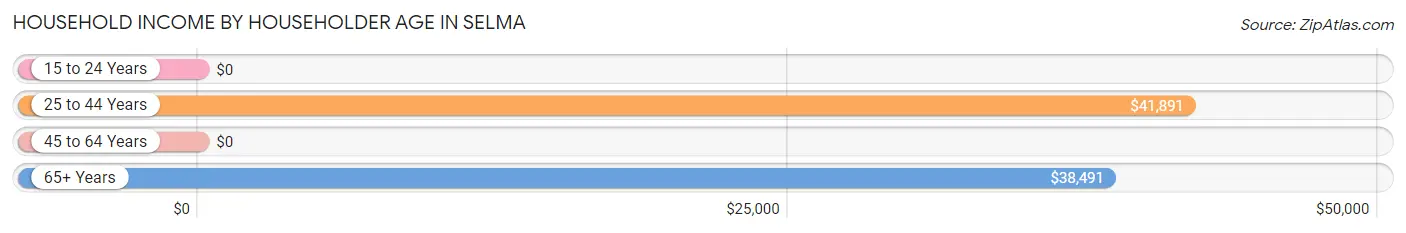
| Income Bracket | # Households | Median Income |
| 15 to 24 Years | 0 (0.0%) | $0 |
| 25 to 44 Years | 115 (34.7%) | $41,891 |
| 45 to 64 Years | 103 (31.1%) | $0 |
| 65+ Years | 113 (34.1%) | $38,491 |
| Total | 331 (100.0%) | $42,319 |
Poverty in Selma
Income Below Poverty by Sex and Age in Selma
With 15.1% poverty level for males and 7.1% for females among the residents of Selma, 45 to 54 year old males and 55 to 64 year old females are the most vulnerable to poverty, with 13 males (59.1%) and 21 females (24.1%) in their respective age groups living below the poverty level.
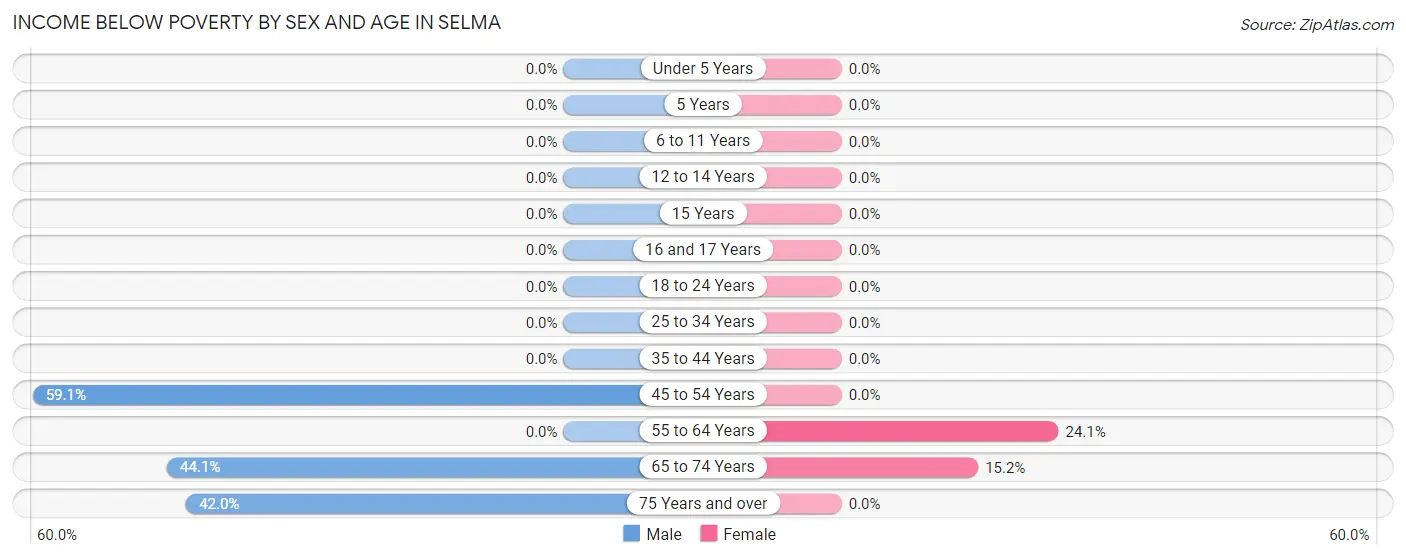
| Age Bracket | Male | Female |
| Under 5 Years | 0 (0.0%) | 0 (0.0%) |
| 5 Years | 0 (0.0%) | 0 (0.0%) |
| 6 to 11 Years | 0 (0.0%) | 0 (0.0%) |
| 12 to 14 Years | 0 (0.0%) | 0 (0.0%) |
| 15 Years | 0 (0.0%) | 0 (0.0%) |
| 16 and 17 Years | 0 (0.0%) | 0 (0.0%) |
| 18 to 24 Years | 0 (0.0%) | 0 (0.0%) |
| 25 to 34 Years | 0 (0.0%) | 0 (0.0%) |
| 35 to 44 Years | 0 (0.0%) | 0 (0.0%) |
| 45 to 54 Years | 13 (59.1%) | 0 (0.0%) |
| 55 to 64 Years | 0 (0.0%) | 21 (24.1%) |
| 65 to 74 Years | 30 (44.1%) | 12 (15.2%) |
| 75 Years and over | 21 (42.0%) | 0 (0.0%) |
| Total | 64 (15.1%) | 33 (7.1%) |
Income Above Poverty by Sex and Age in Selma
According to the poverty statistics in Selma, males aged 6 to 11 years and females aged under 5 years are the age groups that are most secure financially, with 100.0% of males and 100.0% of females in these age groups living above the poverty line.
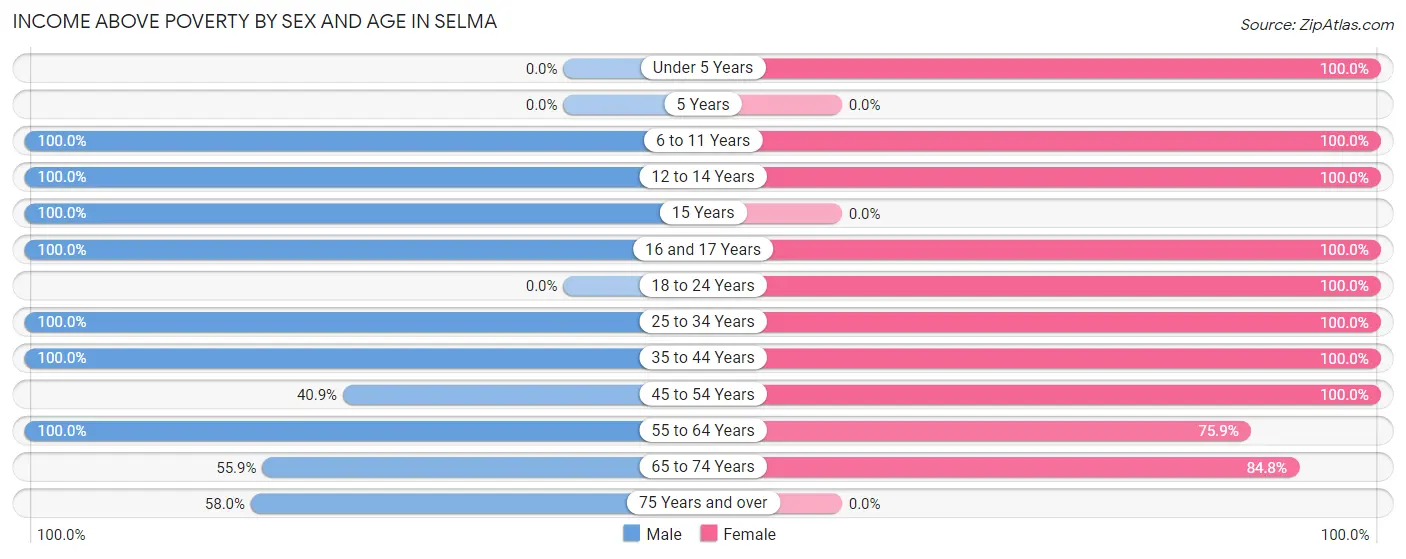
| Age Bracket | Male | Female |
| Under 5 Years | 0 (0.0%) | 28 (100.0%) |
| 5 Years | 0 (0.0%) | 0 (0.0%) |
| 6 to 11 Years | 12 (100.0%) | 50 (100.0%) |
| 12 to 14 Years | 24 (100.0%) | 44 (100.0%) |
| 15 Years | 11 (100.0%) | 0 (0.0%) |
| 16 and 17 Years | 26 (100.0%) | 23 (100.0%) |
| 18 to 24 Years | 0 (0.0%) | 9 (100.0%) |
| 25 to 34 Years | 19 (100.0%) | 114 (100.0%) |
| 35 to 44 Years | 136 (100.0%) | 18 (100.0%) |
| 45 to 54 Years | 9 (40.9%) | 12 (100.0%) |
| 55 to 64 Years | 57 (100.0%) | 66 (75.9%) |
| 65 to 74 Years | 38 (55.9%) | 67 (84.8%) |
| 75 Years and over | 29 (58.0%) | 0 (0.0%) |
| Total | 361 (84.9%) | 431 (92.9%) |
Income Below Poverty Among Married-Couple Families in Selma
The poverty statistics for married-couple families in Selma show that 9.8% or 22 of the total 225 families live below the poverty line. Families with no children have the highest poverty rate of 20.0%, comprising of 22 families. On the other hand, families with 1 or 2 children have the lowest poverty rate of 0.0%, which includes 0 families.
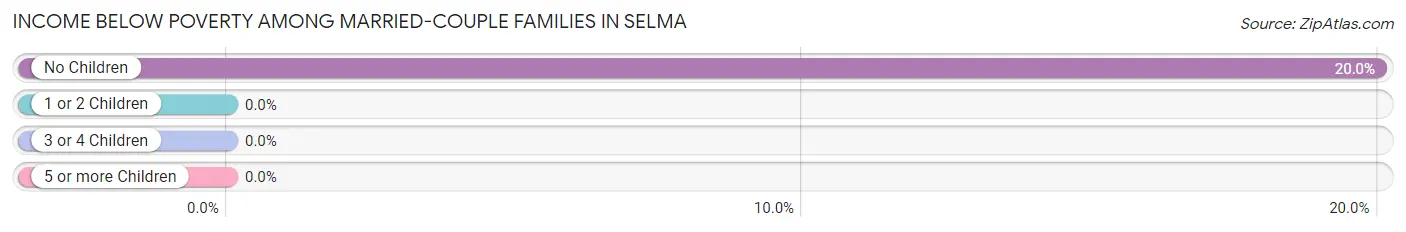
| Children | Above Poverty | Below Poverty |
| No Children | 88 (80.0%) | 22 (20.0%) |
| 1 or 2 Children | 103 (100.0%) | 0 (0.0%) |
| 3 or 4 Children | 0 (0.0%) | 0 (0.0%) |
| 5 or more Children | 12 (100.0%) | 0 (0.0%) |
| Total | 203 (90.2%) | 22 (9.8%) |
Income Below Poverty Among Single-Parent Households in Selma
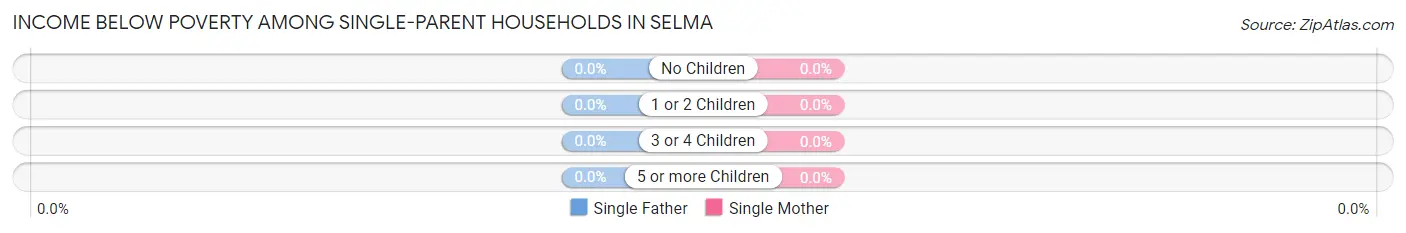
| Children | Single Father | Single Mother |
| No Children | 0 (0.0%) | 0 (0.0%) |
| 1 or 2 Children | 0 (0.0%) | 0 (0.0%) |
| 3 or 4 Children | 0 (0.0%) | 0 (0.0%) |
| 5 or more Children | 0 (0.0%) | 0 (0.0%) |
| Total | 0 (0.0%) | 0 (0.0%) |
Income Below Poverty Among Married-Couple vs Single-Parent Households in Selma
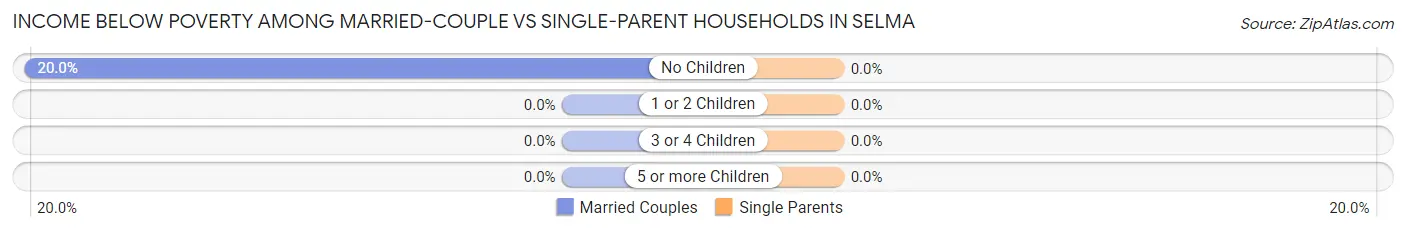
| Children | Married-Couple Families | Single-Parent Households |
| No Children | 22 (20.0%) | 0 (0.0%) |
| 1 or 2 Children | 0 (0.0%) | 0 (0.0%) |
| 3 or 4 Children | 0 (0.0%) | 0 (0.0%) |
| 5 or more Children | 0 (0.0%) | 0 (0.0%) |
| Total | 22 (9.8%) | 0 (0.0%) |
Race in Selma
The most populous races in Selma are White / Caucasian (855 | 95.9%), Two or more Races (37 | 4.2%), and Hispanic or Latino (11 | 1.2%).
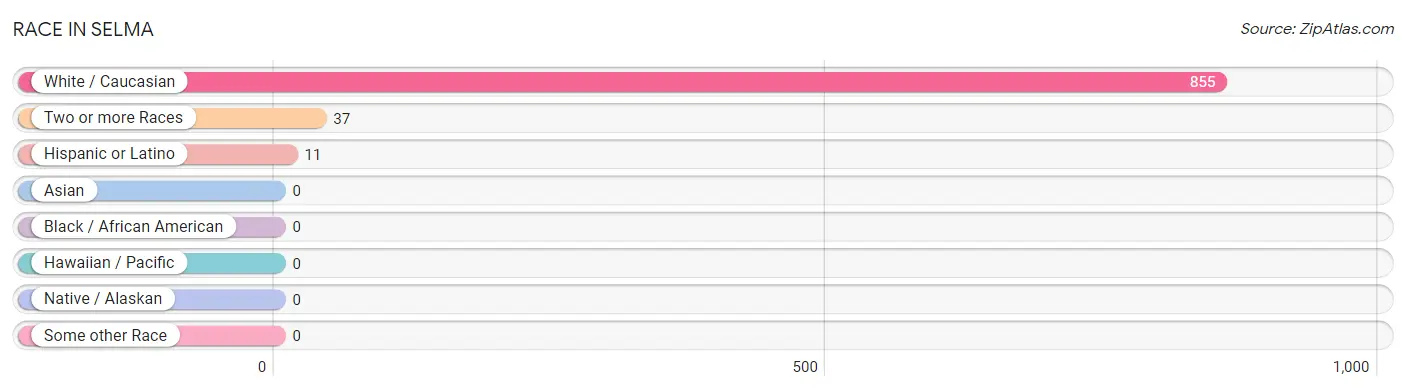
| Race | # Population | % Population |
| Asian | 0 | 0.0% |
| Black / African American | 0 | 0.0% |
| Hawaiian / Pacific | 0 | 0.0% |
| Hispanic or Latino | 11 | 1.2% |
| Native / Alaskan | 0 | 0.0% |
| White / Caucasian | 855 | 95.9% |
| Two or more Races | 37 | 4.2% |
| Some other Race | 0 | 0.0% |
| Total | 892 | 100.0% |
Ancestry in Selma
The most populous ancestries reported in Selma are German (245 | 27.5%), English (182 | 20.4%), Scottish (97 | 10.9%), Irish (91 | 10.2%), and Norwegian (51 | 5.7%), together accounting for 74.7% of all Selma residents.
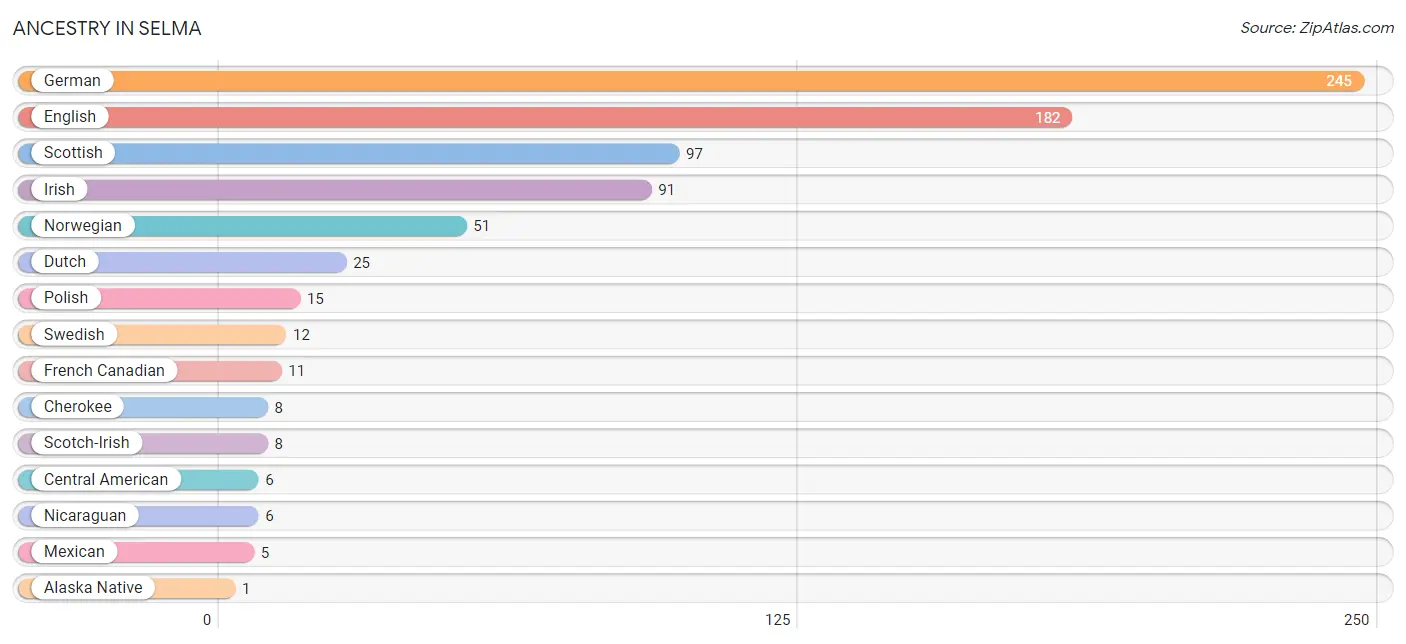
| Ancestry | # Population | % Population |
| Alaska Native | 1 | 0.1% |
| Central American | 6 | 0.7% |
| Cherokee | 8 | 0.9% |
| Dutch | 25 | 2.8% |
| English | 182 | 20.4% |
| French Canadian | 11 | 1.2% |
| German | 245 | 27.5% |
| Irish | 91 | 10.2% |
| Mexican | 5 | 0.6% |
| Nicaraguan | 6 | 0.7% |
| Norwegian | 51 | 5.7% |
| Polish | 15 | 1.7% |
| Scotch-Irish | 8 | 0.9% |
| Scottish | 97 | 10.9% |
| Swedish | 12 | 1.3% | View All 15 Rows |
Immigrants in Selma
The most numerous immigrant groups reported in Selma came from Europe (12 | 1.3%), Germany (12 | 1.3%), Western Europe (12 | 1.3%), Central America (6 | 0.7%), and Latin America (6 | 0.7%), together accounting for 5.4% of all Selma residents.
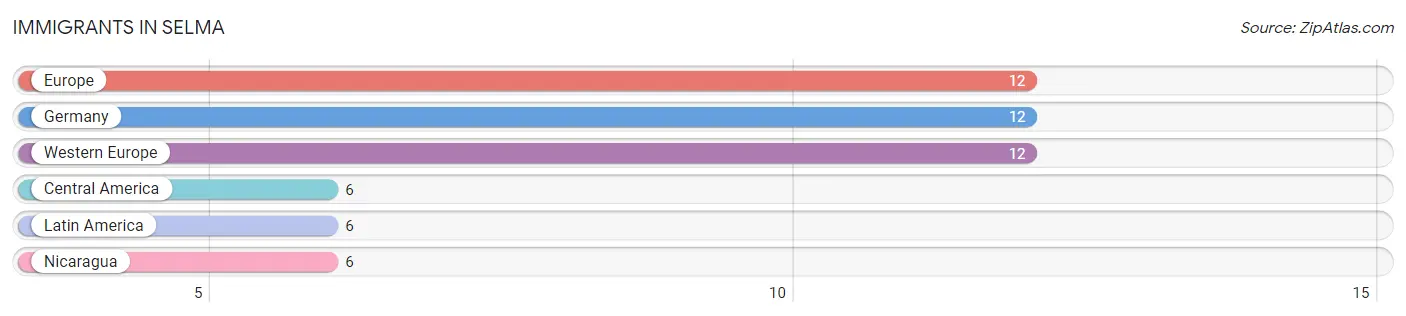
| Immigration Origin | # Population | % Population |
| Central America | 6 | 0.7% |
| Europe | 12 | 1.3% |
| Germany | 12 | 1.3% |
| Latin America | 6 | 0.7% |
| Nicaragua | 6 | 0.7% |
| Western Europe | 12 | 1.3% | View All 6 Rows |
Sex and Age in Selma
Sex and Age in Selma
The most populous age groups in Selma are 35 to 39 Years (136 | 32.0%) for men and 30 to 34 Years (114 | 24.4%) for women.
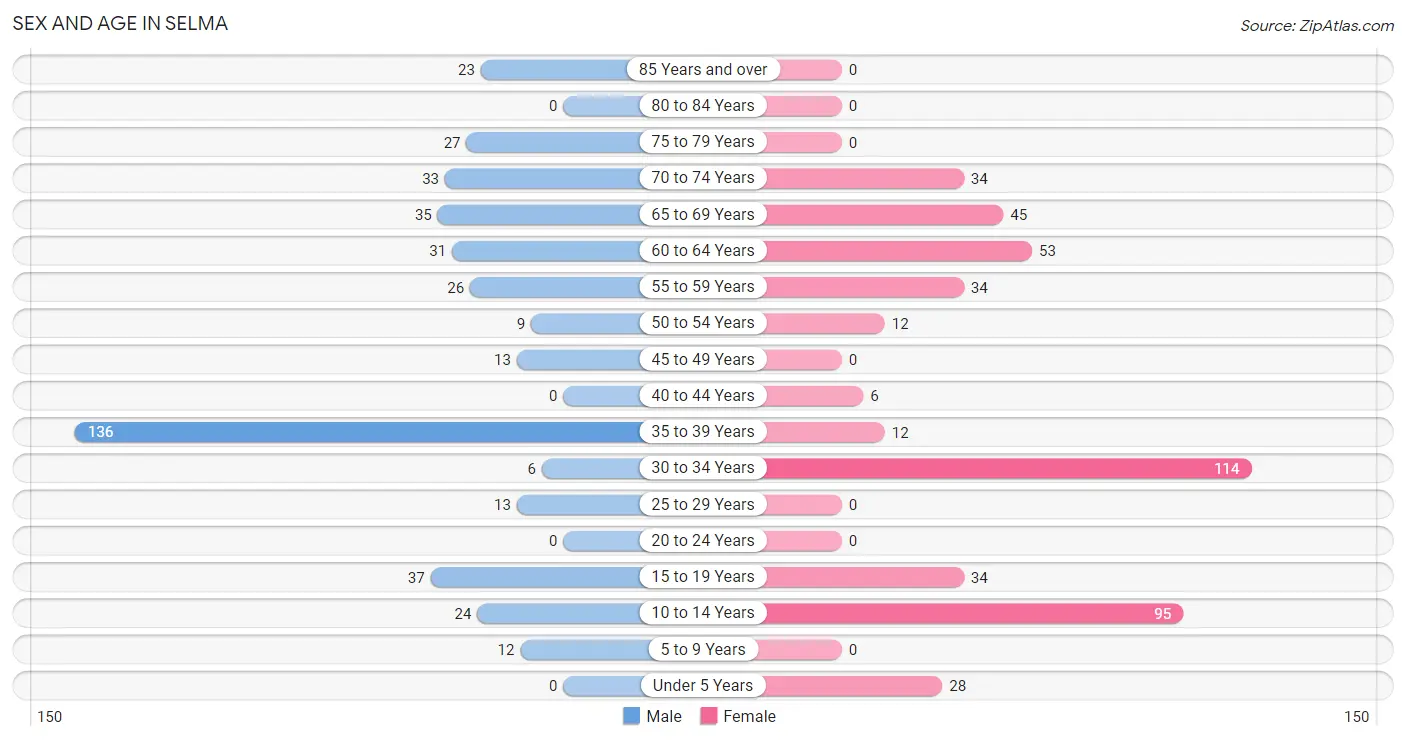
| Age Bracket | Male | Female |
| Under 5 Years | 0 (0.0%) | 28 (6.0%) |
| 5 to 9 Years | 12 (2.8%) | 0 (0.0%) |
| 10 to 14 Years | 24 (5.7%) | 95 (20.3%) |
| 15 to 19 Years | 37 (8.7%) | 34 (7.3%) |
| 20 to 24 Years | 0 (0.0%) | 0 (0.0%) |
| 25 to 29 Years | 13 (3.1%) | 0 (0.0%) |
| 30 to 34 Years | 6 (1.4%) | 114 (24.4%) |
| 35 to 39 Years | 136 (32.0%) | 12 (2.6%) |
| 40 to 44 Years | 0 (0.0%) | 6 (1.3%) |
| 45 to 49 Years | 13 (3.1%) | 0 (0.0%) |
| 50 to 54 Years | 9 (2.1%) | 12 (2.6%) |
| 55 to 59 Years | 26 (6.1%) | 34 (7.3%) |
| 60 to 64 Years | 31 (7.3%) | 53 (11.4%) |
| 65 to 69 Years | 35 (8.2%) | 45 (9.6%) |
| 70 to 74 Years | 33 (7.8%) | 34 (7.3%) |
| 75 to 79 Years | 27 (6.4%) | 0 (0.0%) |
| 80 to 84 Years | 0 (0.0%) | 0 (0.0%) |
| 85 Years and over | 23 (5.4%) | 0 (0.0%) |
| Total | 425 (100.0%) | 467 (100.0%) |
Families and Households in Selma
Median Family Size in Selma
The median family size in Selma is 3.15 persons per family, with married-couple families (225 | 86.9%) accounting for the largest median family size of 3.35 persons per family. On the other hand, single female/mother families (29 | 11.2%) represent the smallest median family size with 1.79 persons per family.
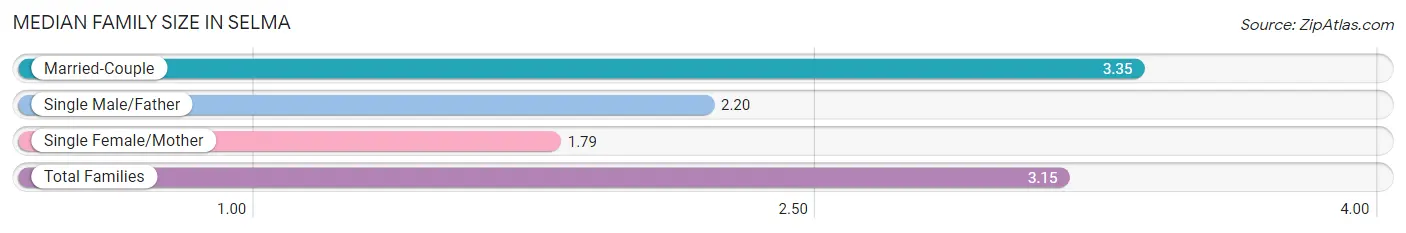
| Family Type | # Families | Family Size |
| Married-Couple | 225 (86.9%) | 3.35 |
| Single Male/Father | 5 (1.9%) | 2.20 |
| Single Female/Mother | 29 (11.2%) | 1.79 |
| Total Families | 259 (100.0%) | 3.15 |
Median Household Size in Selma
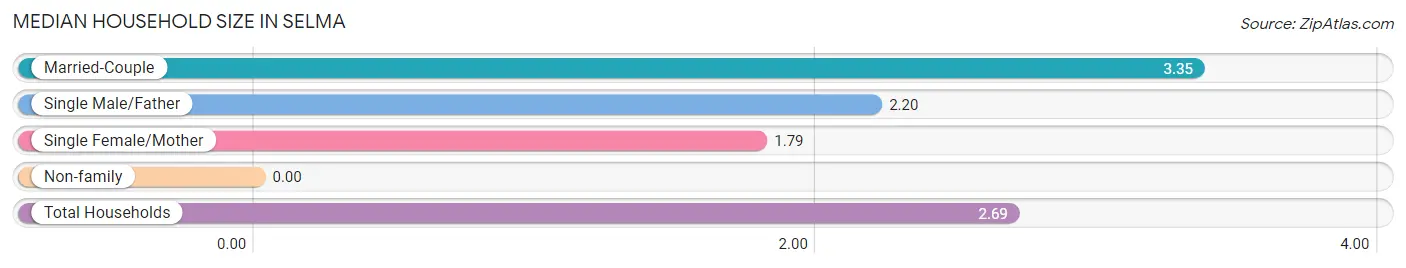
| Household Type | # Households | Household Size |
| Married-Couple | 225 (68.0%) | 3.35 |
| Single Male/Father | 5 (1.5%) | 2.20 |
| Single Female/Mother | 29 (8.8%) | 1.79 |
| Non-family | 72 (21.7%) | - |
| Total Households | 331 (100.0%) | 2.69 |
Household Size by Marriage Status in Selma
Out of a total of 331 households in Selma, 259 (78.2%) are family households, while 72 (21.7%) are nonfamily households. The most numerous type of family households are 4-person households, comprising 126, and the most common type of nonfamily households are 1-person households, comprising 72.
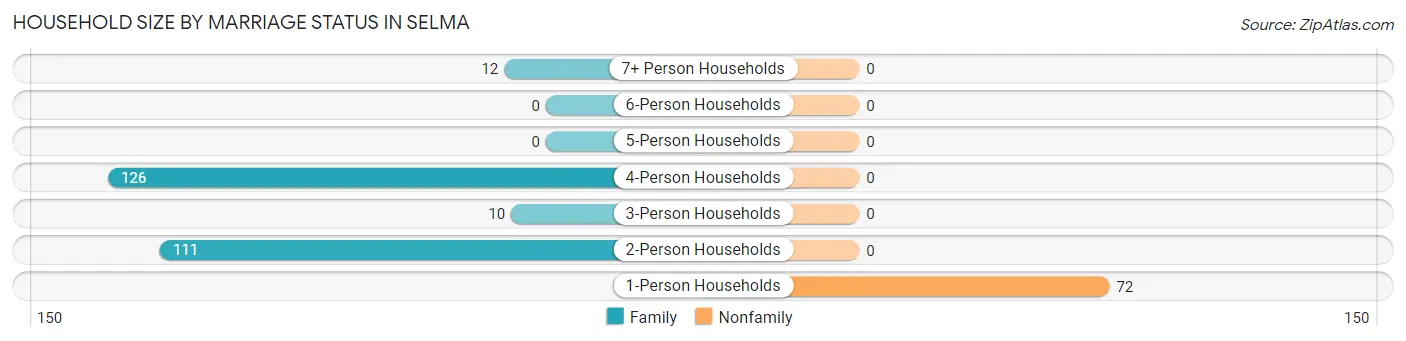
| Household Size | Family Households | Nonfamily Households |
| 1-Person Households | - | 72 (21.7%) |
| 2-Person Households | 111 (33.5%) | 0 (0.0%) |
| 3-Person Households | 10 (3.0%) | 0 (0.0%) |
| 4-Person Households | 126 (38.1%) | 0 (0.0%) |
| 5-Person Households | 0 (0.0%) | 0 (0.0%) |
| 6-Person Households | 0 (0.0%) | 0 (0.0%) |
| 7+ Person Households | 12 (3.6%) | 0 (0.0%) |
| Total | 259 (78.2%) | 72 (21.7%) |
Female Fertility in Selma
Fertility by Age in Selma
Average fertility rate in Selma is 229.0 births per 1,000 women. Women in the age bracket of 20 to 34 years have the highest fertility rate with 333.0 births per 1,000 women. Women in the age bracket of 20 to 34 years acount for 100.0% of all women with births.
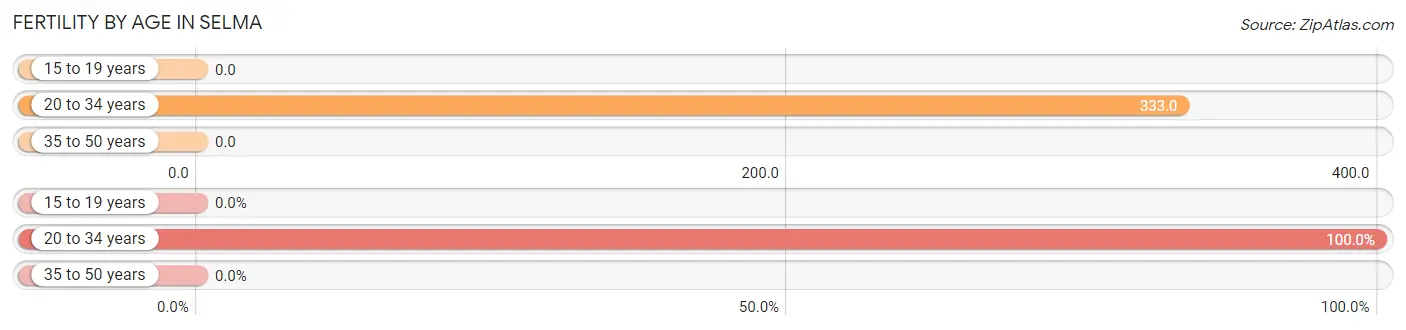
| Age Bracket | Women with Births | Births / 1,000 Women |
| 15 to 19 years | 0 (0.0%) | 0.0 |
| 20 to 34 years | 38 (100.0%) | 333.0 |
| 35 to 50 years | 0 (0.0%) | 0.0 |
| Total | 38 (100.0%) | 229.0 |
Fertility by Age by Marriage Status in Selma
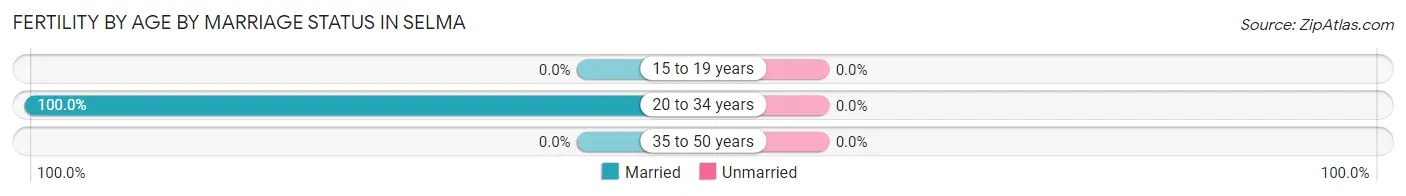
| Age Bracket | Married | Unmarried |
| 15 to 19 years | 0 (0.0%) | 0 (0.0%) |
| 20 to 34 years | 38 (100.0%) | 0 (0.0%) |
| 35 to 50 years | 0 (0.0%) | 0 (0.0%) |
| Total | 38 (100.0%) | 0 (0.0%) |
Fertility by Education in Selma
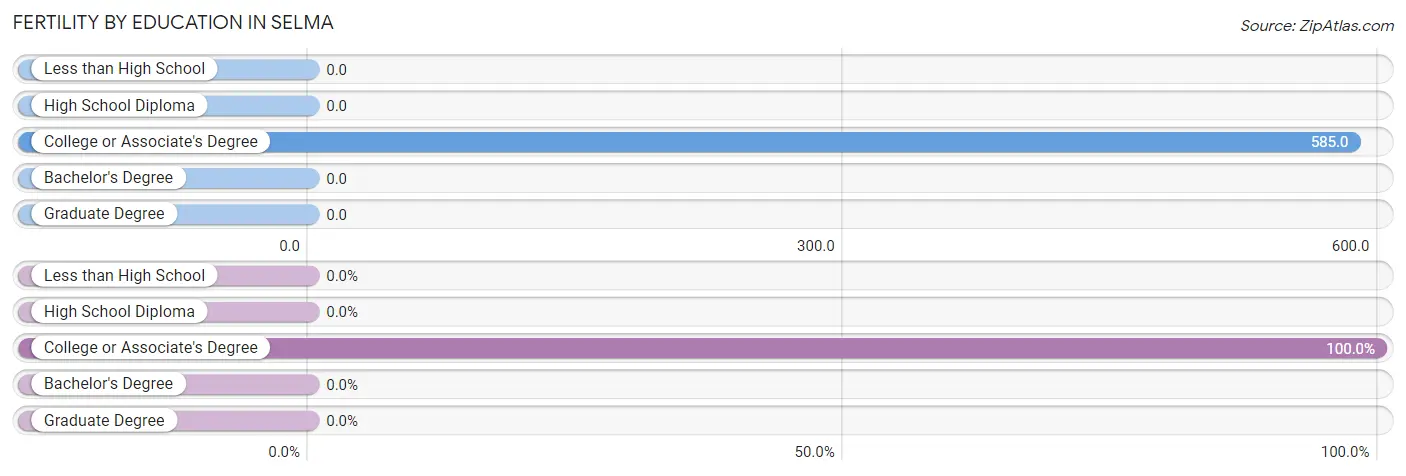
| Educational Attainment | Women with Births | Births / 1,000 Women |
| Less than High School | 0 (0.0%) | 0.0 |
| High School Diploma | 0 (0.0%) | 0.0 |
| College or Associate's Degree | 38 (100.0%) | 585.0 |
| Bachelor's Degree | 0 (0.0%) | 0.0 |
| Graduate Degree | 0 (0.0%) | 0.0 |
| Total | 38 (100.0%) | 229.0 |
Fertility by Education by Marriage Status in Selma
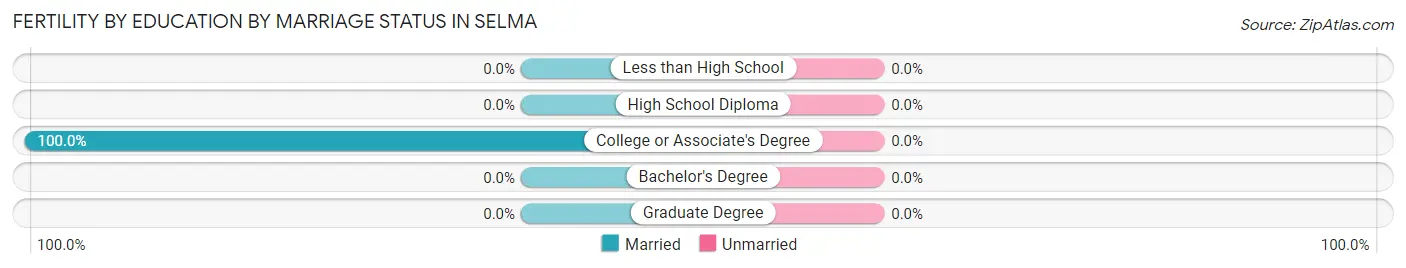
| Educational Attainment | Married | Unmarried |
| Less than High School | 0 (0.0%) | 0 (0.0%) |
| High School Diploma | 0 (0.0%) | 0 (0.0%) |
| College or Associate's Degree | 38 (100.0%) | 0 (0.0%) |
| Bachelor's Degree | 0 (0.0%) | 0 (0.0%) |
| Graduate Degree | 0 (0.0%) | 0 (0.0%) |
| Total | 38 (100.0%) | 0 (0.0%) |
Employment Characteristics in Selma
Employment by Class of Employer in Selma
Among the 321 employed individuals in Selma, local government employees (194 | 60.4%), private company employees (102 | 31.8%), and not-for-profit organizations (25 | 7.8%) make up the most common classes of employment.
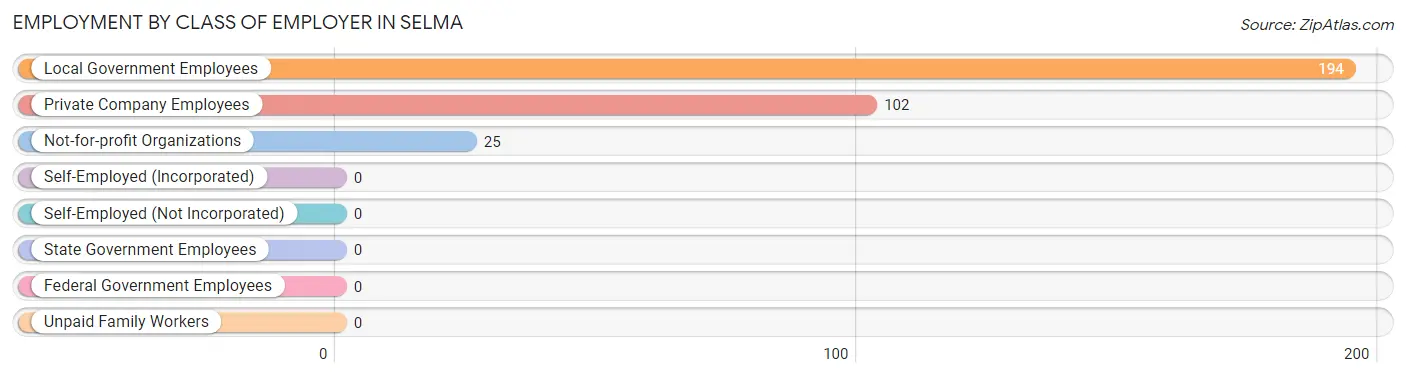
| Employer Class | # Employees | % Employees |
| Private Company Employees | 102 | 31.8% |
| Self-Employed (Incorporated) | 0 | 0.0% |
| Self-Employed (Not Incorporated) | 0 | 0.0% |
| Not-for-profit Organizations | 25 | 7.8% |
| Local Government Employees | 194 | 60.4% |
| State Government Employees | 0 | 0.0% |
| Federal Government Employees | 0 | 0.0% |
| Unpaid Family Workers | 0 | 0.0% |
| Total | 321 | 100.0% |
Employment Status by Age in Selma
According to the labor force statistics for Selma, out of the total population over 16 years of age (722), 48.2% or 348 individuals are in the labor force, with 4.3% or 15 of them unemployed. The age group with the highest labor force participation rate is 35 to 44 years, with 100.0% or 154 individuals in the labor force. Within the labor force, the 45 to 54 years age range has the highest percentage of unemployed individuals, with 42.9% or 9 of them being unemployed.
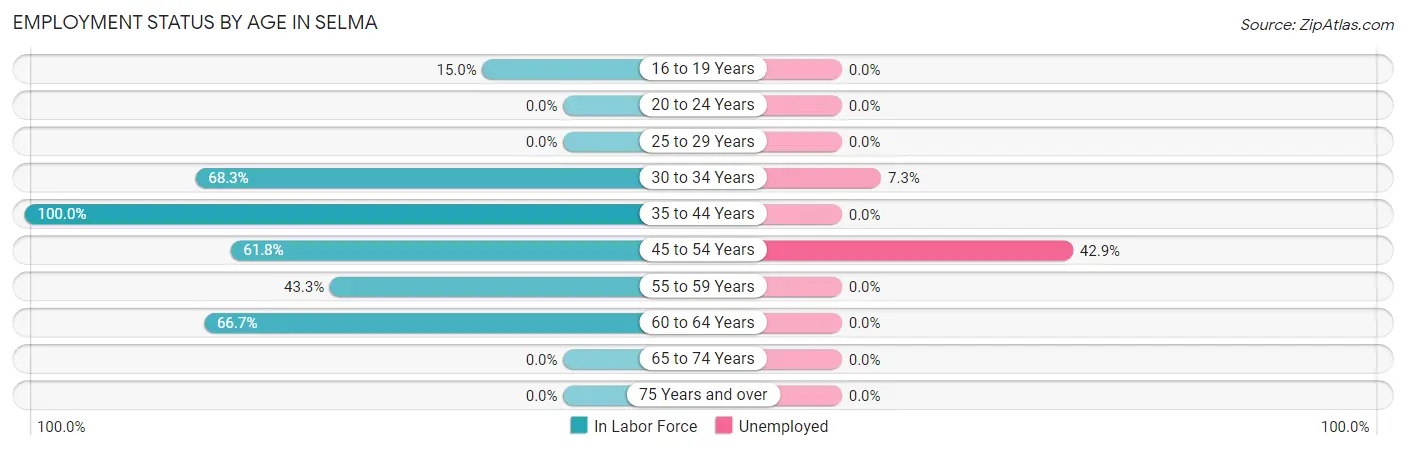
| Age Bracket | In Labor Force | Unemployed |
| 16 to 19 Years | 9 (15.0%) | 0 (0.0%) |
| 20 to 24 Years | 0 (0.0%) | 0 (0.0%) |
| 25 to 29 Years | 0 (0.0%) | 0 (0.0%) |
| 30 to 34 Years | 82 (68.3%) | 6 (7.3%) |
| 35 to 44 Years | 154 (100.0%) | 0 (0.0%) |
| 45 to 54 Years | 21 (61.8%) | 9 (42.9%) |
| 55 to 59 Years | 26 (43.3%) | 0 (0.0%) |
| 60 to 64 Years | 56 (66.7%) | 0 (0.0%) |
| 65 to 74 Years | 0 (0.0%) | 0 (0.0%) |
| 75 Years and over | 0 (0.0%) | 0 (0.0%) |
| Total | 348 (48.2%) | 15 (4.3%) |
Employment Status by Educational Attainment in Selma
According to labor force statistics for Selma, 72.9% of individuals (339) out of the total population between 25 and 64 years of age (465) are in the labor force, with 4.4% or 15 of them being unemployed. The group with the highest labor force participation rate are those with the educational attainment of high school diploma, with 84.9% or 146 individuals in the labor force. Within the labor force, individuals with college / associate degree education have the highest percentage of unemployment, with 8.3% or 15 of them being unemployed.
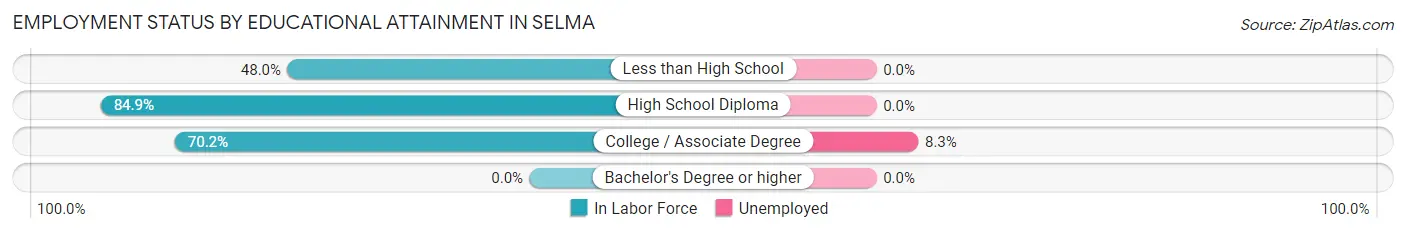
| Educational Attainment | In Labor Force | Unemployed |
| Less than High School | 12 (48.0%) | 0 (0.0%) |
| High School Diploma | 146 (84.9%) | 0 (0.0%) |
| College / Associate Degree | 181 (70.2%) | 21 (8.3%) |
| Bachelor's Degree or higher | 0 (0.0%) | 0 (0.0%) |
| Total | 339 (72.9%) | 20 (4.4%) |
Employment Occupations by Sex in Selma
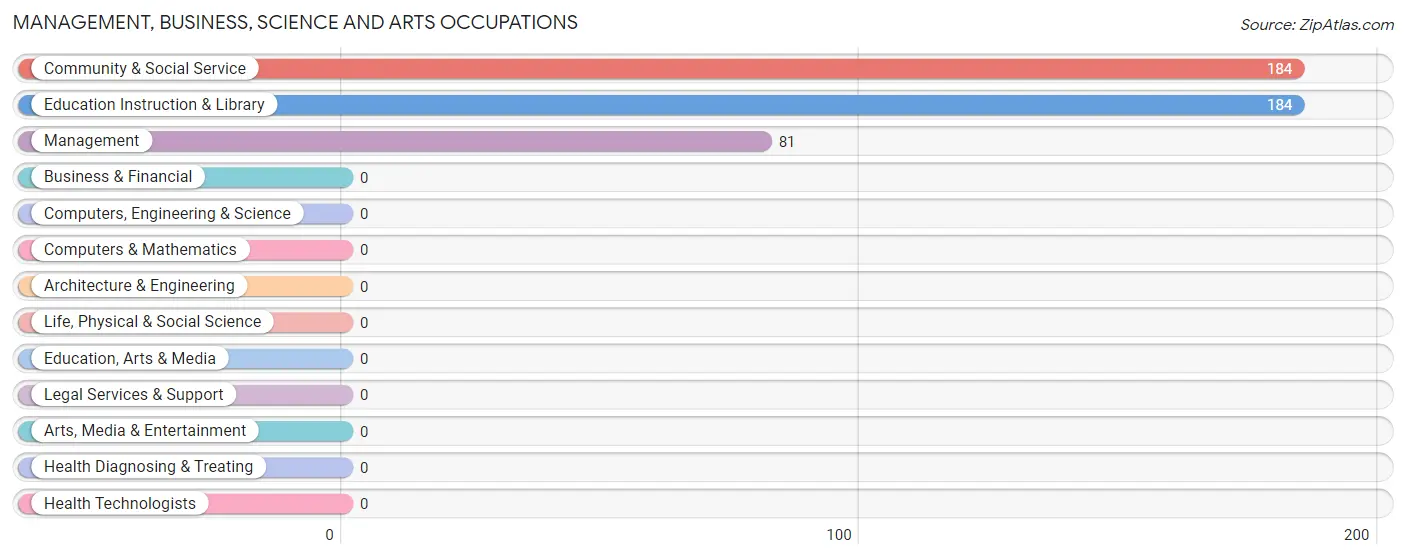
Management, Business, Science and Arts Occupations
The most common Management, Business, Science and Arts occupations in Selma are Community & Social Service (184 | 55.3%), Education Instruction & Library (184 | 55.3%), and Management (81 | 24.3%).
Management, Business, Science and Arts Occupations by Sex
Within the Management, Business, Science and Arts occupations in Selma, the most male-oriented occupations are Management (69.1%), Community & Social Service (52.2%), and Education Instruction & Library (52.2%), while the most female-oriented occupations are Community & Social Service (47.8%), Education Instruction & Library (47.8%), and Management (30.9%).
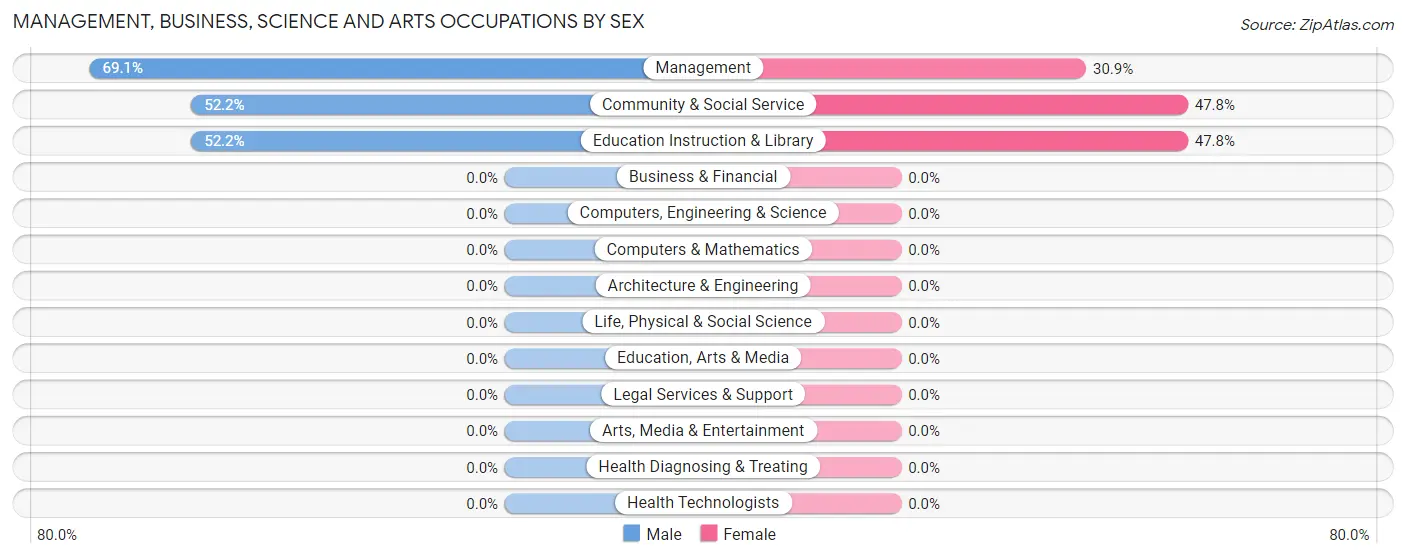
| Occupation | Male | Female |
| Management | 56 (69.1%) | 25 (30.9%) |
| Business & Financial | 0 (0.0%) | 0 (0.0%) |
| Computers, Engineering & Science | 0 (0.0%) | 0 (0.0%) |
| Computers & Mathematics | 0 (0.0%) | 0 (0.0%) |
| Architecture & Engineering | 0 (0.0%) | 0 (0.0%) |
| Life, Physical & Social Science | 0 (0.0%) | 0 (0.0%) |
| Community & Social Service | 96 (52.2%) | 88 (47.8%) |
| Education, Arts & Media | 0 (0.0%) | 0 (0.0%) |
| Legal Services & Support | 0 (0.0%) | 0 (0.0%) |
| Education Instruction & Library | 96 (52.2%) | 88 (47.8%) |
| Arts, Media & Entertainment | 0 (0.0%) | 0 (0.0%) |
| Health Diagnosing & Treating | 0 (0.0%) | 0 (0.0%) |
| Health Technologists | 0 (0.0%) | 0 (0.0%) |
| Total (Category) | 152 (57.4%) | 113 (42.6%) |
| Total (Overall) | 193 (58.0%) | 140 (42.0%) |
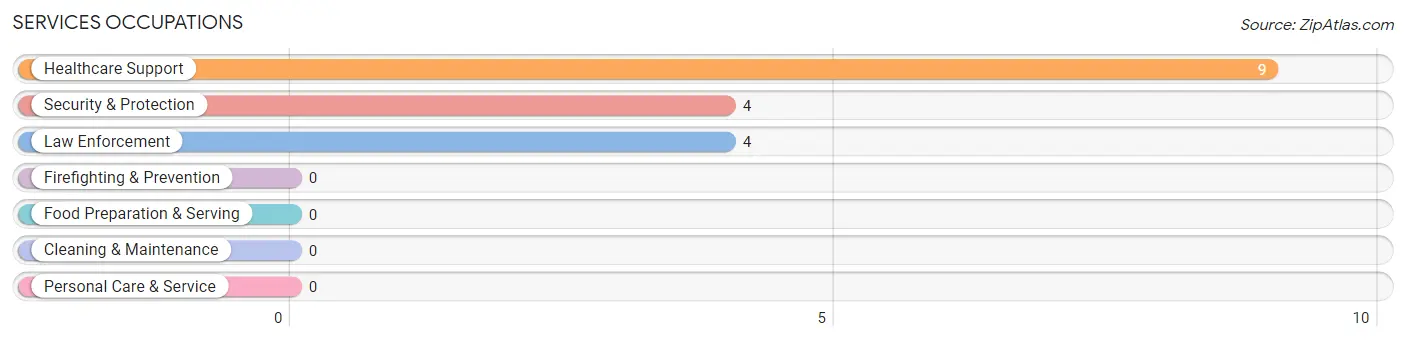
Services Occupations
The most common Services occupations in Selma are Healthcare Support (9 | 2.7%), Security & Protection (4 | 1.2%), and Law Enforcement (4 | 1.2%).
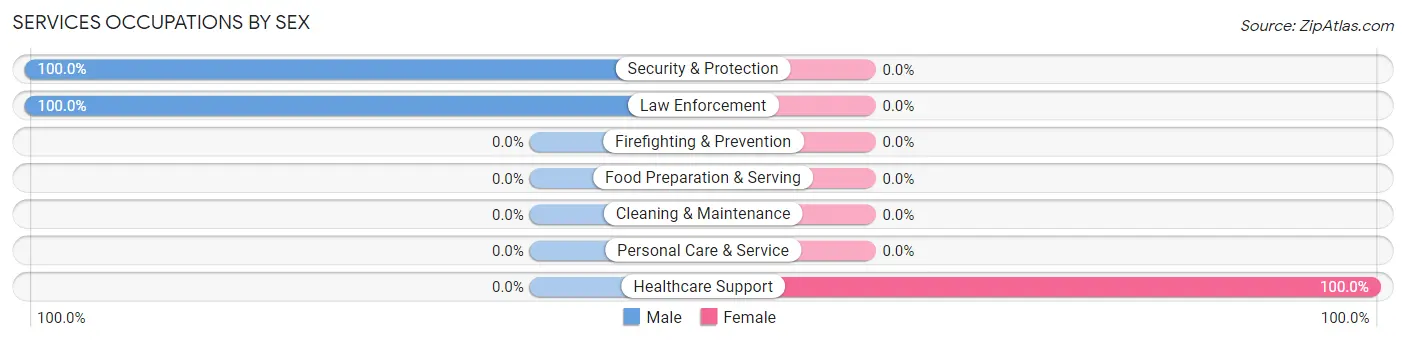
Services Occupations by Sex
| Occupation | Male | Female |
| Healthcare Support | 0 (0.0%) | 9 (100.0%) |
| Security & Protection | 4 (100.0%) | 0 (0.0%) |
| Firefighting & Prevention | 0 (0.0%) | 0 (0.0%) |
| Law Enforcement | 4 (100.0%) | 0 (0.0%) |
| Food Preparation & Serving | 0 (0.0%) | 0 (0.0%) |
| Cleaning & Maintenance | 0 (0.0%) | 0 (0.0%) |
| Personal Care & Service | 0 (0.0%) | 0 (0.0%) |
| Total (Category) | 4 (30.8%) | 9 (69.2%) |
| Total (Overall) | 193 (58.0%) | 140 (42.0%) |
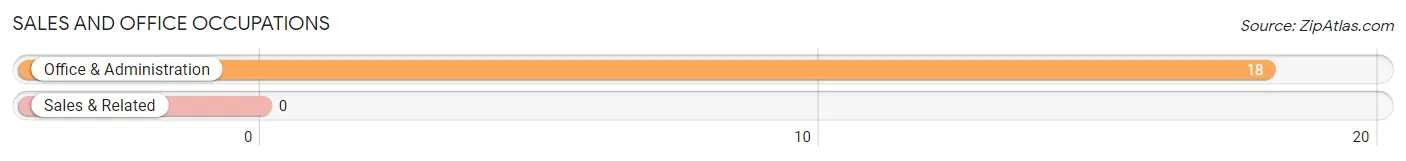
Sales and Office Occupations
The most common Sales and Office occupations in Selma are , and Office & Administration (18 | 5.4%).
Sales and Office Occupations by Sex
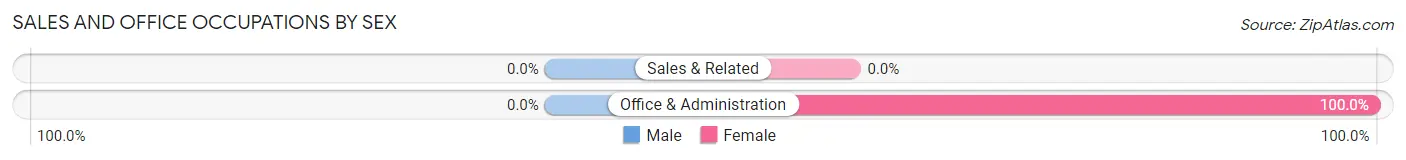
| Occupation | Male | Female |
| Sales & Related | 0 (0.0%) | 0 (0.0%) |
| Office & Administration | 0 (0.0%) | 18 (100.0%) |
| Total (Category) | 0 (0.0%) | 18 (100.0%) |
| Total (Overall) | 193 (58.0%) | 140 (42.0%) |
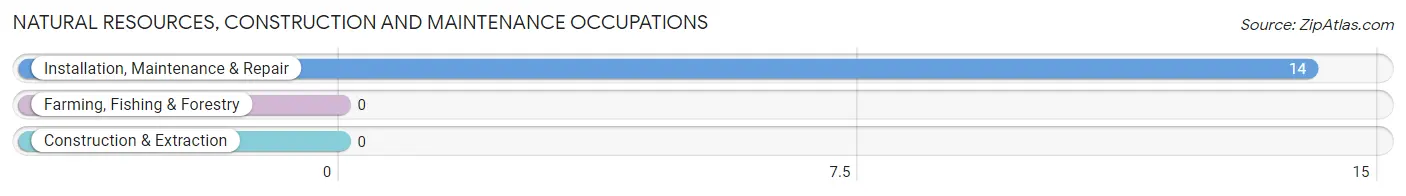
Natural Resources, Construction and Maintenance Occupations
The most common Natural Resources, Construction and Maintenance occupations in Selma are , and Installation, Maintenance & Repair (14 | 4.2%).
Natural Resources, Construction and Maintenance Occupations by Sex
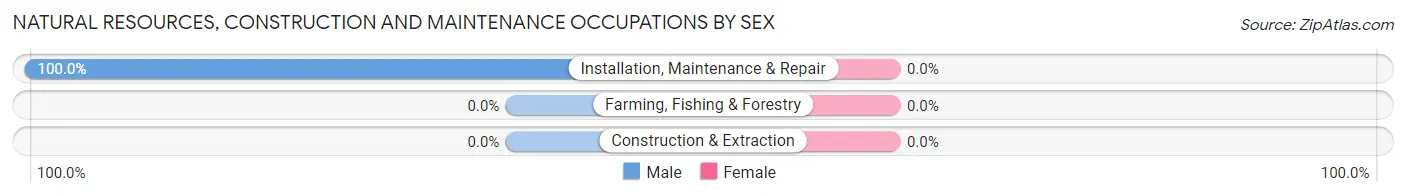
| Occupation | Male | Female |
| Farming, Fishing & Forestry | 0 (0.0%) | 0 (0.0%) |
| Construction & Extraction | 0 (0.0%) | 0 (0.0%) |
| Installation, Maintenance & Repair | 14 (100.0%) | 0 (0.0%) |
| Total (Category) | 14 (100.0%) | 0 (0.0%) |
| Total (Overall) | 193 (58.0%) | 140 (42.0%) |
Production, Transportation and Moving Occupations
The most common Production, Transportation and Moving occupations in Selma are , and Production (23 | 6.9%).
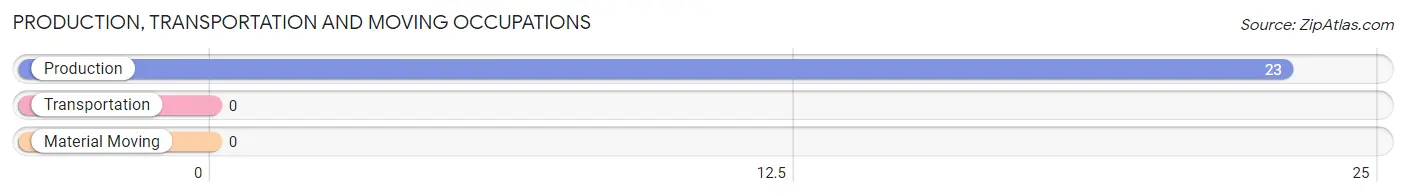
Production, Transportation and Moving Occupations by Sex
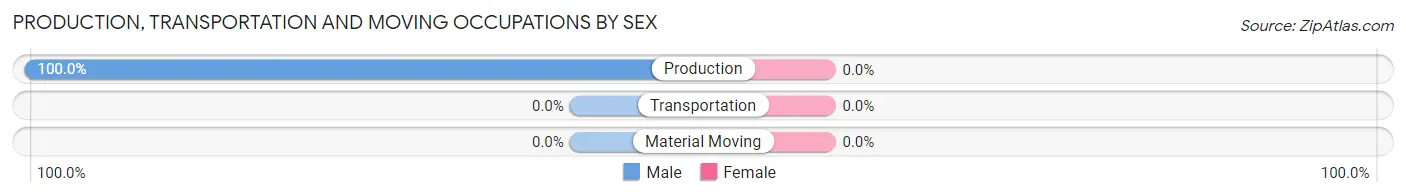
| Occupation | Male | Female |
| Production | 23 (100.0%) | 0 (0.0%) |
| Transportation | 0 (0.0%) | 0 (0.0%) |
| Material Moving | 0 (0.0%) | 0 (0.0%) |
| Total (Category) | 23 (100.0%) | 0 (0.0%) |
| Total (Overall) | 193 (58.0%) | 140 (42.0%) |
Employment Industries by Sex in Selma
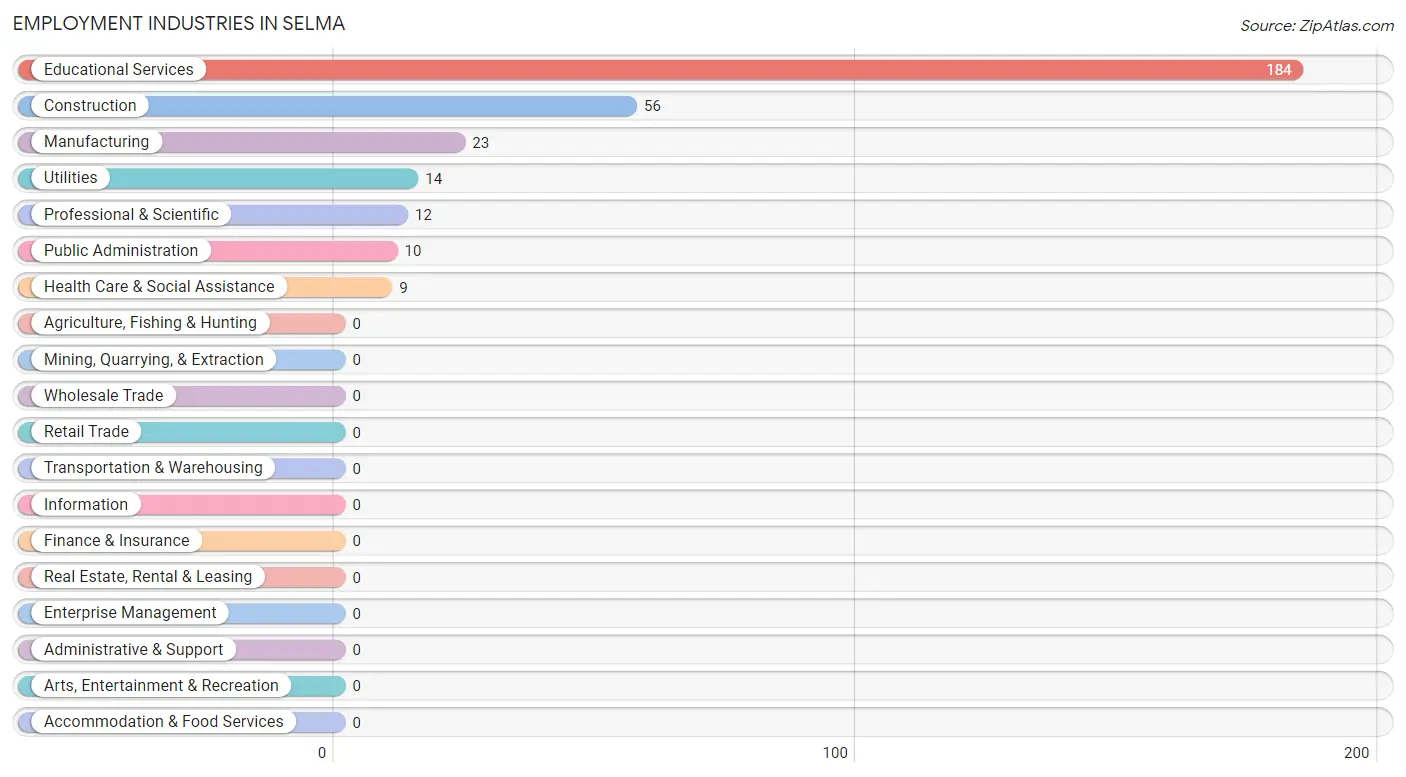
Employment Industries in Selma
The major employment industries in Selma include Educational Services (184 | 55.3%), Construction (56 | 16.8%), Manufacturing (23 | 6.9%), Utilities (14 | 4.2%), and Professional & Scientific (12 | 3.6%).
Employment Industries by Sex in Selma
The Selma industries that see more men than women are Construction (100.0%), Manufacturing (100.0%), and Utilities (100.0%), whereas the industries that tend to have a higher number of women are Professional & Scientific (100.0%), Health Care & Social Assistance (100.0%), and Public Administration (60.0%).
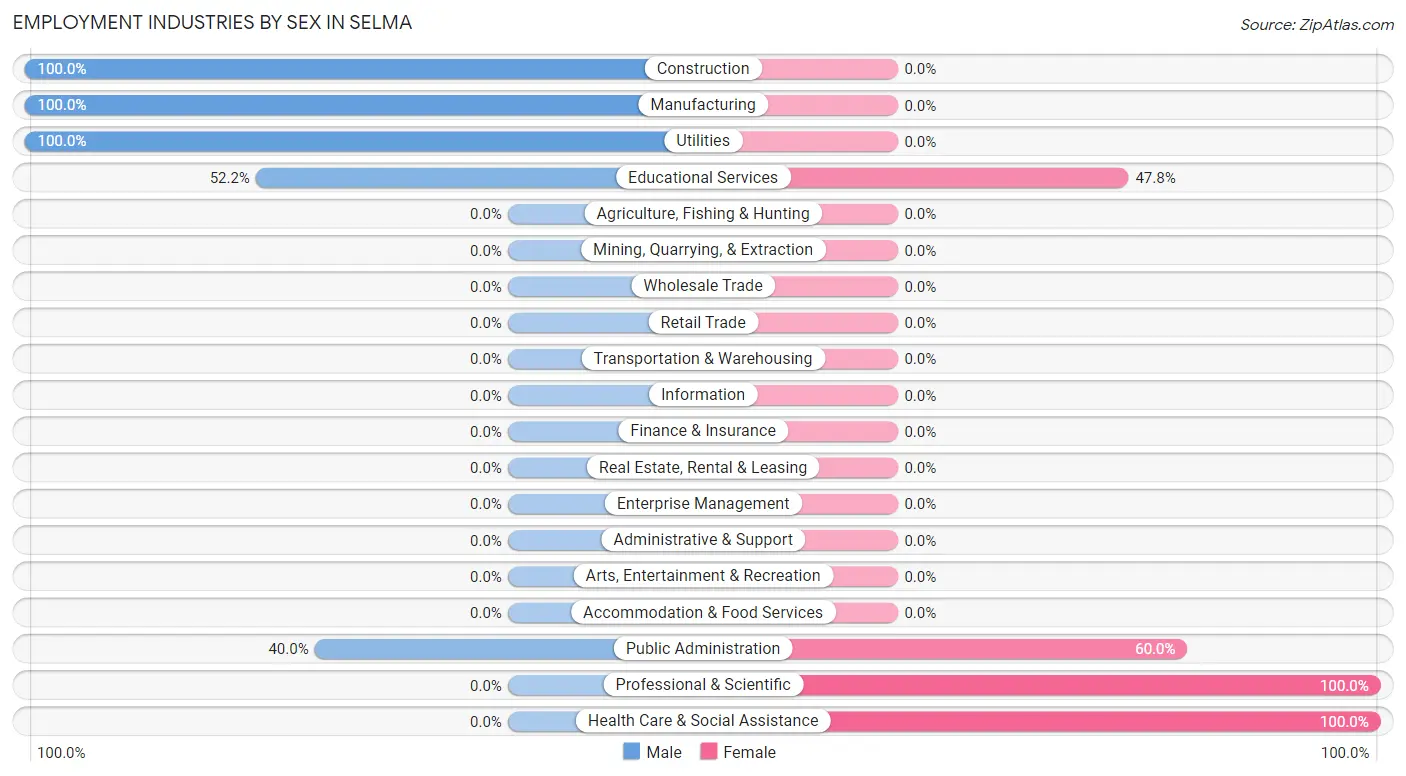
| Industry | Male | Female |
| Agriculture, Fishing & Hunting | 0 (0.0%) | 0 (0.0%) |
| Mining, Quarrying, & Extraction | 0 (0.0%) | 0 (0.0%) |
| Construction | 56 (100.0%) | 0 (0.0%) |
| Manufacturing | 23 (100.0%) | 0 (0.0%) |
| Wholesale Trade | 0 (0.0%) | 0 (0.0%) |
| Retail Trade | 0 (0.0%) | 0 (0.0%) |
| Transportation & Warehousing | 0 (0.0%) | 0 (0.0%) |
| Utilities | 14 (100.0%) | 0 (0.0%) |
| Information | 0 (0.0%) | 0 (0.0%) |
| Finance & Insurance | 0 (0.0%) | 0 (0.0%) |
| Real Estate, Rental & Leasing | 0 (0.0%) | 0 (0.0%) |
| Professional & Scientific | 0 (0.0%) | 12 (100.0%) |
| Enterprise Management | 0 (0.0%) | 0 (0.0%) |
| Administrative & Support | 0 (0.0%) | 0 (0.0%) |
| Educational Services | 96 (52.2%) | 88 (47.8%) |
| Health Care & Social Assistance | 0 (0.0%) | 9 (100.0%) |
| Arts, Entertainment & Recreation | 0 (0.0%) | 0 (0.0%) |
| Accommodation & Food Services | 0 (0.0%) | 0 (0.0%) |
| Public Administration | 4 (40.0%) | 6 (60.0%) |
| Total | 193 (58.0%) | 140 (42.0%) |
Education in Selma
School Enrollment in Selma
The most common levels of schooling among the 193 students in Selma are middle school (119 | 61.7%), high school (62 | 32.1%), and elementary school (12 | 6.2%).
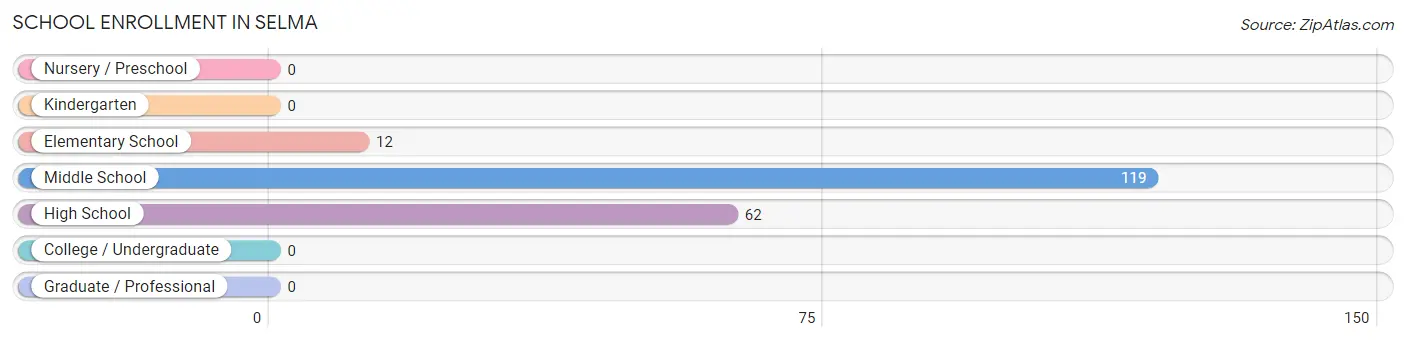
| School Level | # Students | % Students |
| Nursery / Preschool | 0 | 0.0% |
| Kindergarten | 0 | 0.0% |
| Elementary School | 12 | 6.2% |
| Middle School | 119 | 61.7% |
| High School | 62 | 32.1% |
| College / Undergraduate | 0 | 0.0% |
| Graduate / Professional | 0 | 0.0% |
| Total | 193 | 100.0% |
School Enrollment by Age by Funding Source in Selma
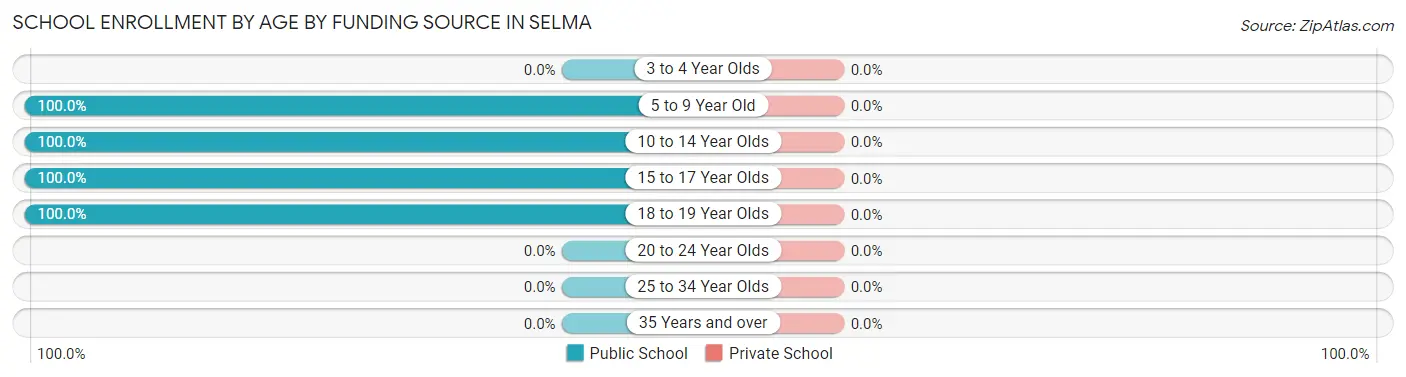
| Age Bracket | Public School | Private School |
| 3 to 4 Year Olds | 0 (0.0%) | 0 (0.0%) |
| 5 to 9 Year Old | 12 (100.0%) | 0 (0.0%) |
| 10 to 14 Year Olds | 119 (100.0%) | 0 (0.0%) |
| 15 to 17 Year Olds | 61 (100.0%) | 0 (0.0%) |
| 18 to 19 Year Olds | 1 (100.0%) | 0 (0.0%) |
| 20 to 24 Year Olds | 0 (0.0%) | 0 (0.0%) |
| 25 to 34 Year Olds | 0 (0.0%) | 0 (0.0%) |
| 35 Years and over | 0 (0.0%) | 0 (0.0%) |
| Total | 193 (100.0%) | 0 (0.0%) |
Educational Attainment by Field of Study in Selma
Bio, nature & agricultural (15 | 60.0%), and psychology (10 | 40.0%) are the most common fields of study among 25 individuals in Selma who have obtained a bachelor's degree or higher.
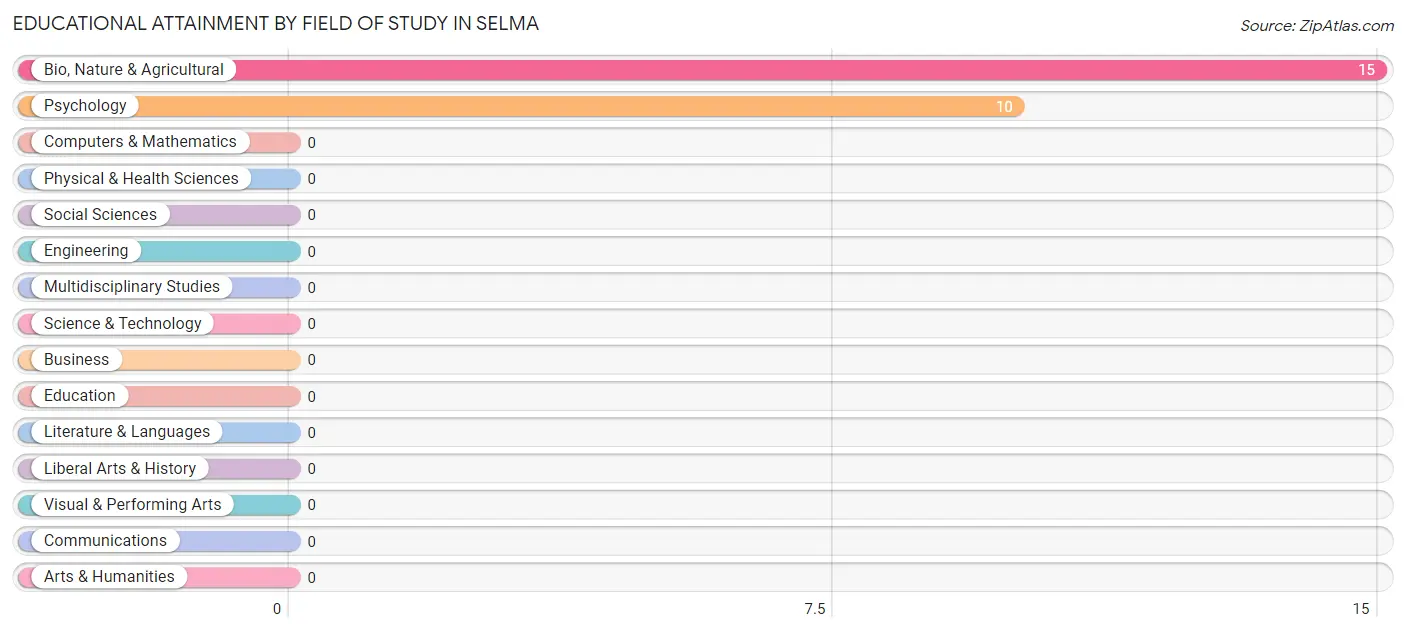
| Field of Study | # Graduates | % Graduates |
| Computers & Mathematics | 0 | 0.0% |
| Bio, Nature & Agricultural | 15 | 60.0% |
| Physical & Health Sciences | 0 | 0.0% |
| Psychology | 10 | 40.0% |
| Social Sciences | 0 | 0.0% |
| Engineering | 0 | 0.0% |
| Multidisciplinary Studies | 0 | 0.0% |
| Science & Technology | 0 | 0.0% |
| Business | 0 | 0.0% |
| Education | 0 | 0.0% |
| Literature & Languages | 0 | 0.0% |
| Liberal Arts & History | 0 | 0.0% |
| Visual & Performing Arts | 0 | 0.0% |
| Communications | 0 | 0.0% |
| Arts & Humanities | 0 | 0.0% |
| Total | 25 | 100.0% |
Transportation & Commute in Selma
Vehicle Availability by Sex in Selma
The most prevalent vehicle ownership categories in Selma are males with 4 vehicles (139, accounting for 72.0%) and females with 4 vehicles (85, making up 108.6%).
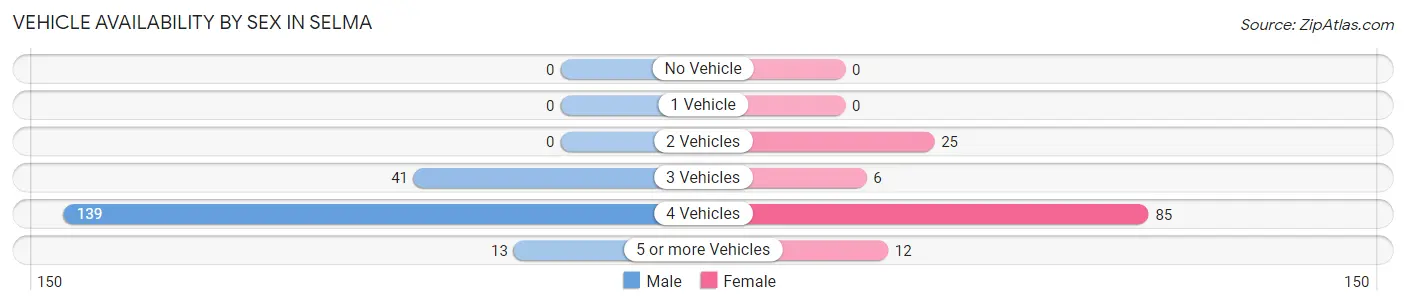
| Vehicles Available | Male | Female |
| No Vehicle | 0 (0.0%) | 0 (0.0%) |
| 1 Vehicle | 0 (0.0%) | 0 (0.0%) |
| 2 Vehicles | 0 (0.0%) | 25 (19.5%) |
| 3 Vehicles | 41 (21.2%) | 6 (4.7%) |
| 4 Vehicles | 139 (72.0%) | 85 (66.4%) |
| 5 or more Vehicles | 13 (6.7%) | 12 (9.4%) |
| Total | 193 (100.0%) | 128 (100.0%) |
Commute Time in Selma
The most frequently occuring commute durations in Selma are 15 to 19 minutes (209 commuters, 65.1%), 60 to 89 minutes (50 commuters, 15.6%), and 45 to 59 minutes (31 commuters, 9.7%).
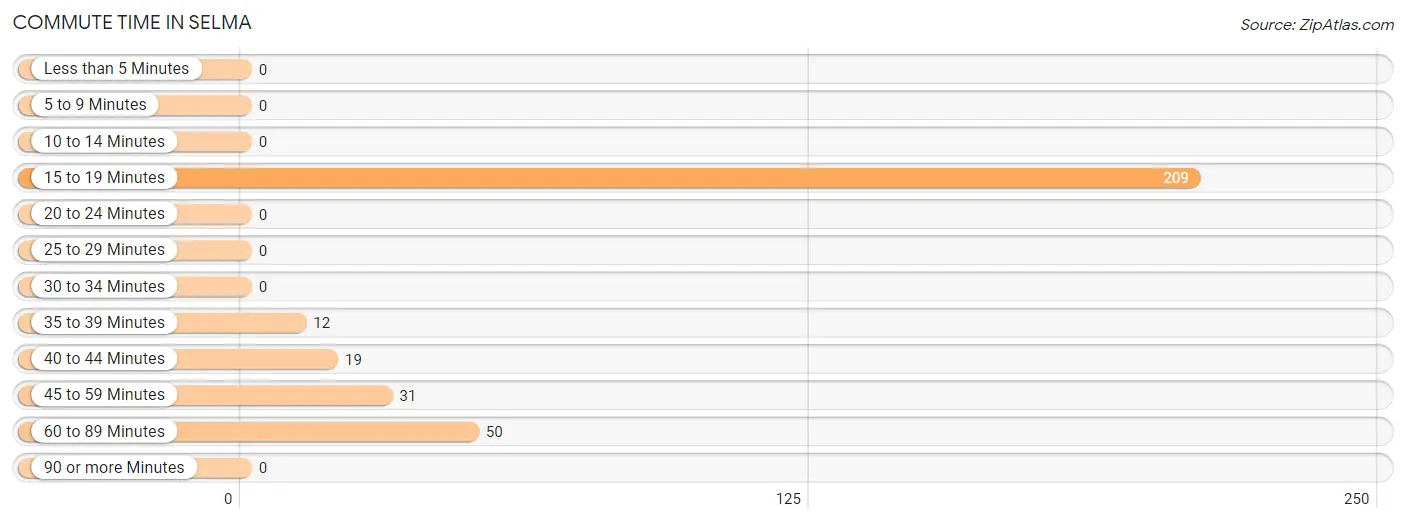
| Commute Time | # Commuters | % Commuters |
| Less than 5 Minutes | 0 | 0.0% |
| 5 to 9 Minutes | 0 | 0.0% |
| 10 to 14 Minutes | 0 | 0.0% |
| 15 to 19 Minutes | 209 | 65.1% |
| 20 to 24 Minutes | 0 | 0.0% |
| 25 to 29 Minutes | 0 | 0.0% |
| 30 to 34 Minutes | 0 | 0.0% |
| 35 to 39 Minutes | 12 | 3.7% |
| 40 to 44 Minutes | 19 | 5.9% |
| 45 to 59 Minutes | 31 | 9.7% |
| 60 to 89 Minutes | 50 | 15.6% |
| 90 or more Minutes | 0 | 0.0% |
Commute Time by Sex in Selma
The most common commute times in Selma are 15 to 19 minutes (96 commuters, 49.7%) for males and 15 to 19 minutes (113 commuters, 88.3%) for females.
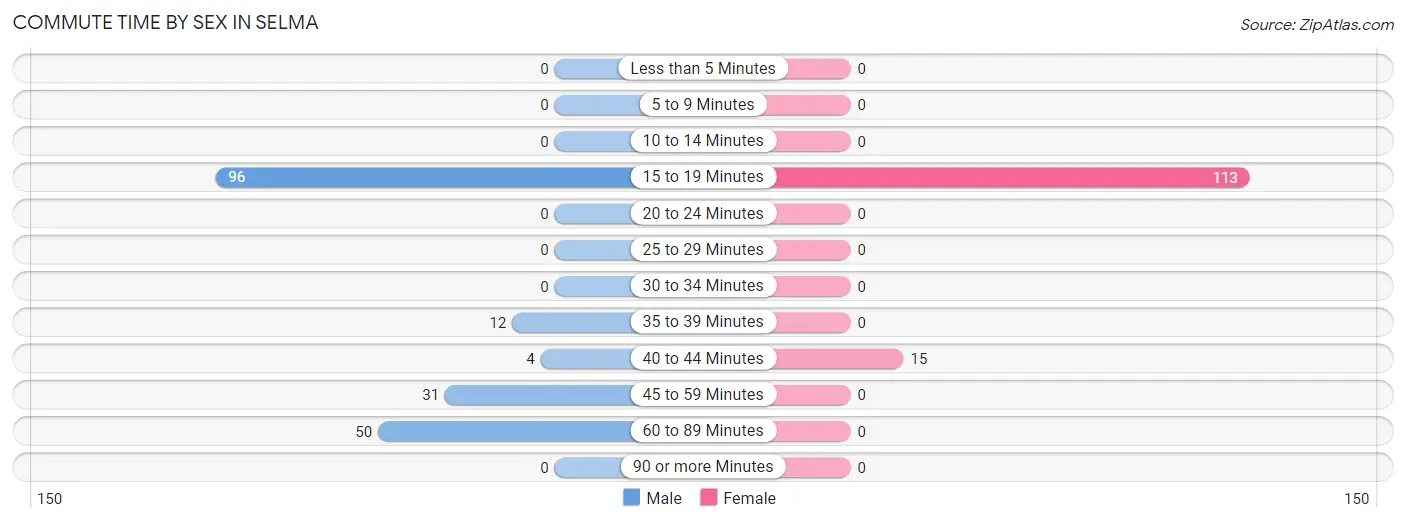
| Commute Time | Male | Female |
| Less than 5 Minutes | 0 (0.0%) | 0 (0.0%) |
| 5 to 9 Minutes | 0 (0.0%) | 0 (0.0%) |
| 10 to 14 Minutes | 0 (0.0%) | 0 (0.0%) |
| 15 to 19 Minutes | 96 (49.7%) | 113 (88.3%) |
| 20 to 24 Minutes | 0 (0.0%) | 0 (0.0%) |
| 25 to 29 Minutes | 0 (0.0%) | 0 (0.0%) |
| 30 to 34 Minutes | 0 (0.0%) | 0 (0.0%) |
| 35 to 39 Minutes | 12 (6.2%) | 0 (0.0%) |
| 40 to 44 Minutes | 4 (2.1%) | 15 (11.7%) |
| 45 to 59 Minutes | 31 (16.1%) | 0 (0.0%) |
| 60 to 89 Minutes | 50 (25.9%) | 0 (0.0%) |
| 90 or more Minutes | 0 (0.0%) | 0 (0.0%) |
Time of Departure to Work by Sex in Selma
The most frequent times of departure to work in Selma are 6:30 AM to 6:59 AM (96, 49.7%) for males and 7:30 AM to 7:59 AM (88, 68.8%) for females.
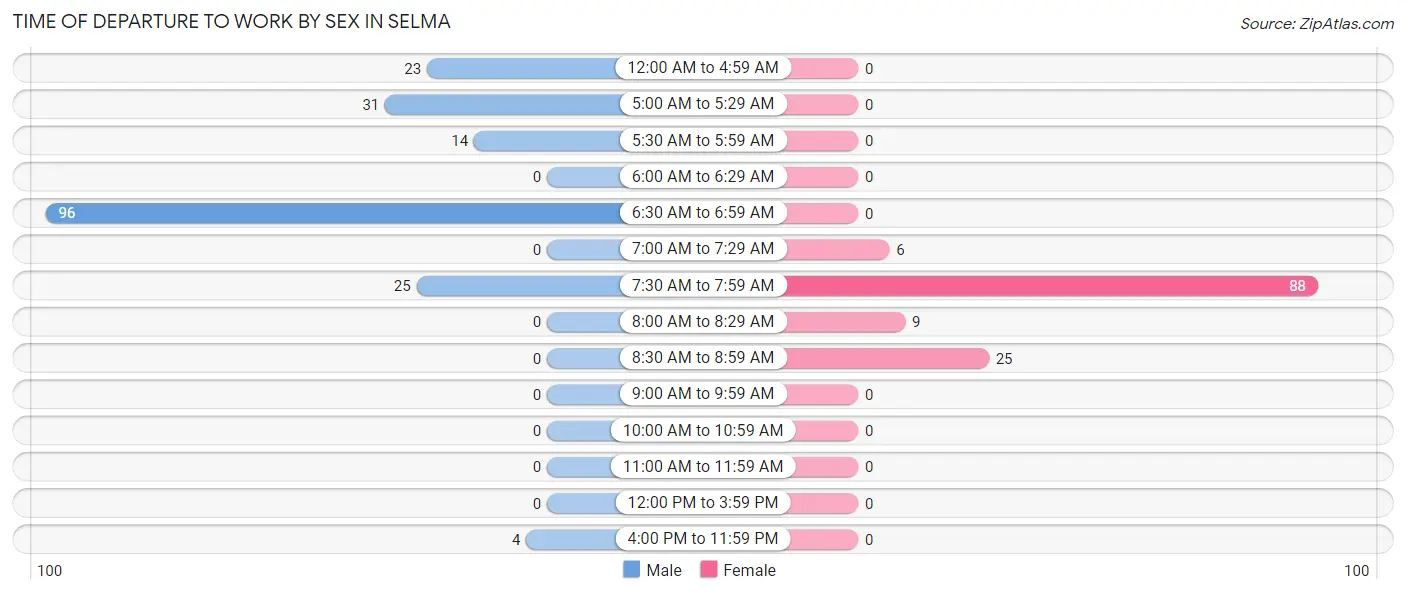
| Time of Departure | Male | Female |
| 12:00 AM to 4:59 AM | 23 (11.9%) | 0 (0.0%) |
| 5:00 AM to 5:29 AM | 31 (16.1%) | 0 (0.0%) |
| 5:30 AM to 5:59 AM | 14 (7.2%) | 0 (0.0%) |
| 6:00 AM to 6:29 AM | 0 (0.0%) | 0 (0.0%) |
| 6:30 AM to 6:59 AM | 96 (49.7%) | 0 (0.0%) |
| 7:00 AM to 7:29 AM | 0 (0.0%) | 6 (4.7%) |
| 7:30 AM to 7:59 AM | 25 (13.0%) | 88 (68.8%) |
| 8:00 AM to 8:29 AM | 0 (0.0%) | 9 (7.0%) |
| 8:30 AM to 8:59 AM | 0 (0.0%) | 25 (19.5%) |
| 9:00 AM to 9:59 AM | 0 (0.0%) | 0 (0.0%) |
| 10:00 AM to 10:59 AM | 0 (0.0%) | 0 (0.0%) |
| 11:00 AM to 11:59 AM | 0 (0.0%) | 0 (0.0%) |
| 12:00 PM to 3:59 PM | 0 (0.0%) | 0 (0.0%) |
| 4:00 PM to 11:59 PM | 4 (2.1%) | 0 (0.0%) |
| Total | 193 (100.0%) | 128 (100.0%) |
Housing Occupancy in Selma
Occupancy by Ownership in Selma
Of the total 331 dwellings in Selma, owner-occupied units account for 294 (88.8%), while renter-occupied units make up 37 (11.2%).
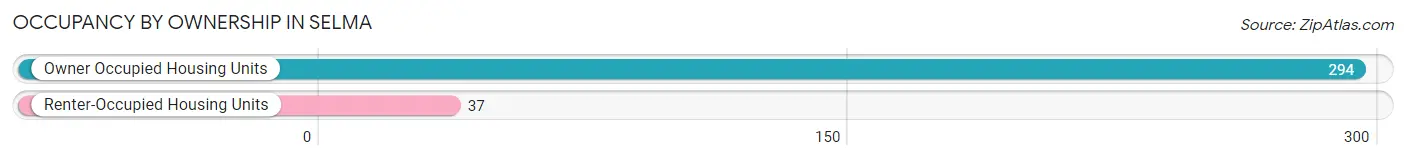
| Occupancy | # Housing Units | % Housing Units |
| Owner Occupied Housing Units | 294 | 88.8% |
| Renter-Occupied Housing Units | 37 | 11.2% |
| Total Occupied Housing Units | 331 | 100.0% |
Occupancy by Household Size in Selma
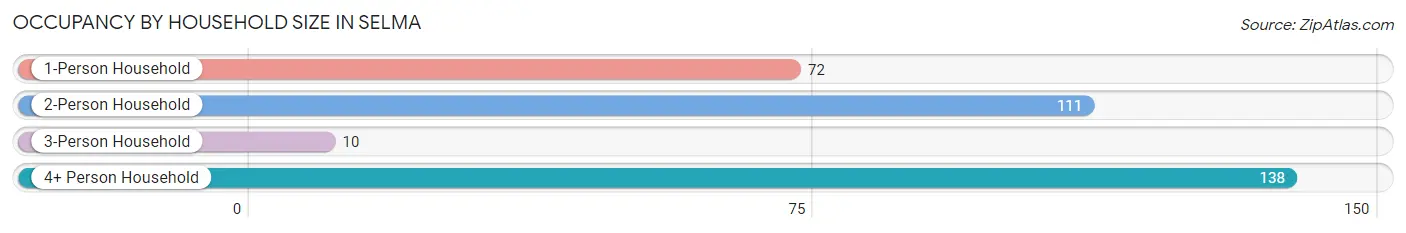
| Household Size | # Housing Units | % Housing Units |
| 1-Person Household | 72 | 21.7% |
| 2-Person Household | 111 | 33.5% |
| 3-Person Household | 10 | 3.0% |
| 4+ Person Household | 138 | 41.7% |
| Total Housing Units | 331 | 100.0% |
Occupancy by Ownership by Household Size in Selma
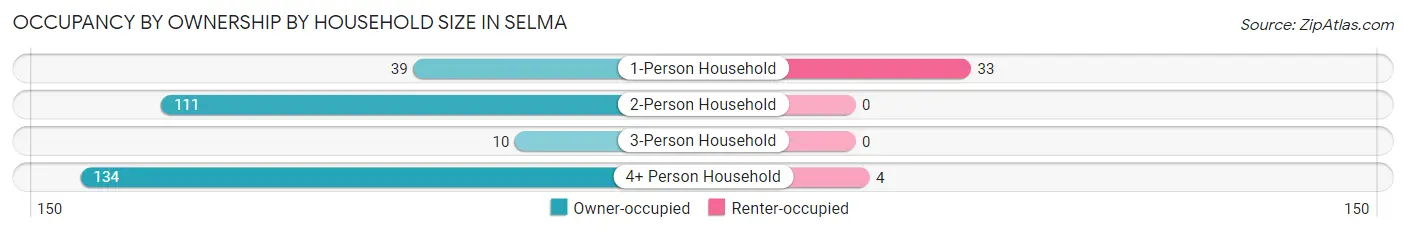
| Household Size | Owner-occupied | Renter-occupied |
| 1-Person Household | 39 (54.2%) | 33 (45.8%) |
| 2-Person Household | 111 (100.0%) | 0 (0.0%) |
| 3-Person Household | 10 (100.0%) | 0 (0.0%) |
| 4+ Person Household | 134 (97.1%) | 4 (2.9%) |
| Total Housing Units | 294 (88.8%) | 37 (11.2%) |
Occupancy by Educational Attainment in Selma
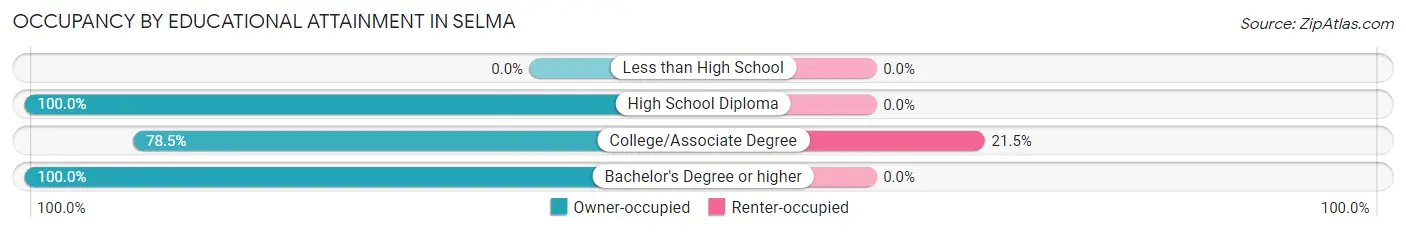
| Household Size | Owner-occupied | Renter-occupied |
| Less than High School | 0 (0.0%) | 0 (0.0%) |
| High School Diploma | 144 (100.0%) | 0 (0.0%) |
| College/Associate Degree | 135 (78.5%) | 37 (21.5%) |
| Bachelor's Degree or higher | 15 (100.0%) | 0 (0.0%) |
Occupancy by Age of Householder in Selma
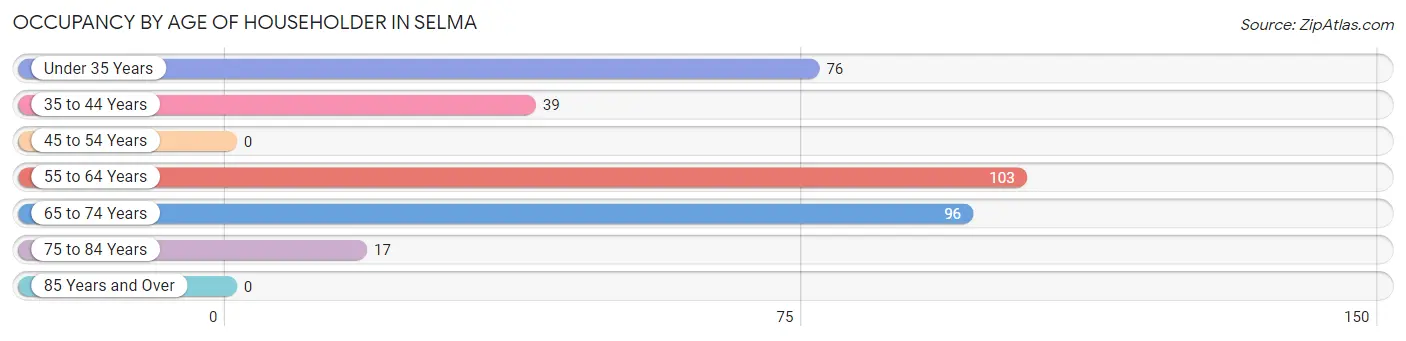
| Age Bracket | # Households | % Households |
| Under 35 Years | 76 | 23.0% |
| 35 to 44 Years | 39 | 11.8% |
| 45 to 54 Years | 0 | 0.0% |
| 55 to 64 Years | 103 | 31.1% |
| 65 to 74 Years | 96 | 29.0% |
| 75 to 84 Years | 17 | 5.1% |
| 85 Years and Over | 0 | 0.0% |
| Total | 331 | 100.0% |
Housing Finances in Selma
Median Income by Occupancy in Selma
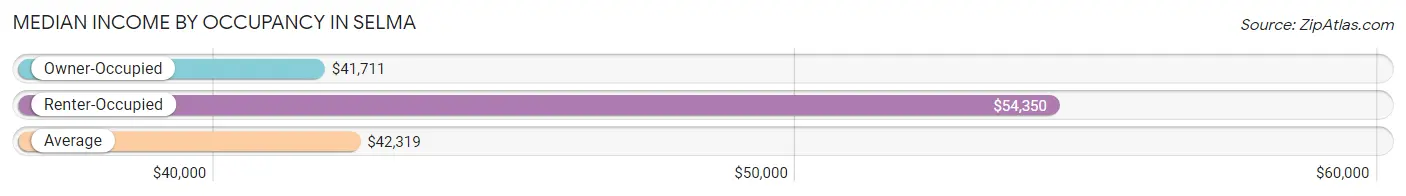
| Occupancy Type | # Households | Median Income |
| Owner-Occupied | 294 (88.8%) | $41,711 |
| Renter-Occupied | 37 (11.2%) | $54,350 |
| Average | 331 (100.0%) | $42,319 |
Occupancy by Householder Income Bracket in Selma
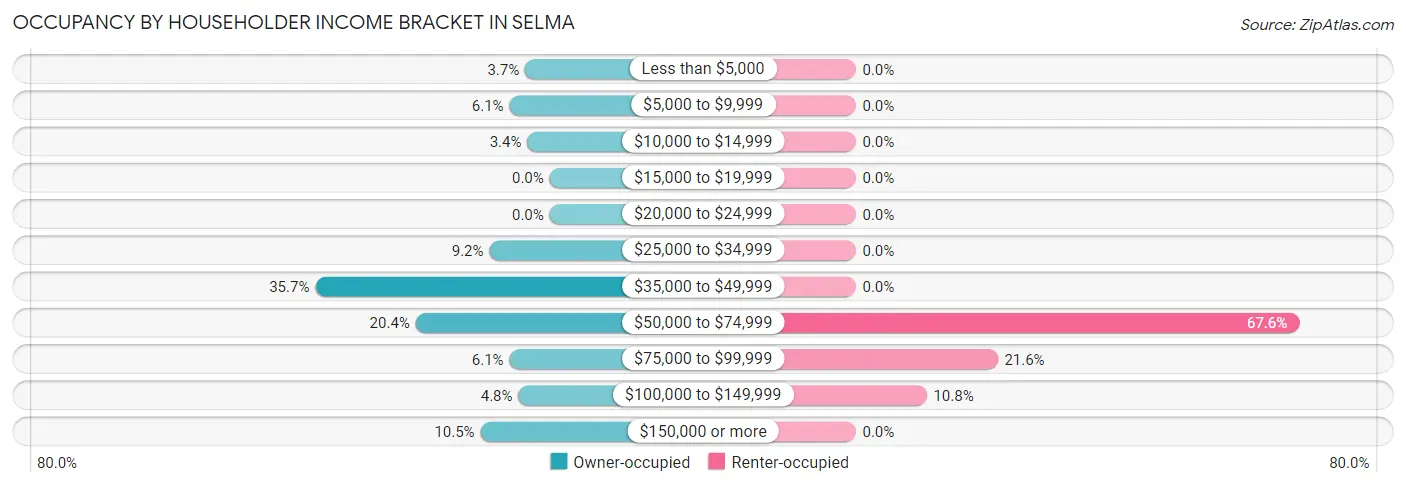
| Income Bracket | Owner-occupied | Renter-occupied |
| Less than $5,000 | 11 (3.7%) | 0 (0.0%) |
| $5,000 to $9,999 | 18 (6.1%) | 0 (0.0%) |
| $10,000 to $14,999 | 10 (3.4%) | 0 (0.0%) |
| $15,000 to $19,999 | 0 (0.0%) | 0 (0.0%) |
| $20,000 to $24,999 | 0 (0.0%) | 0 (0.0%) |
| $25,000 to $34,999 | 27 (9.2%) | 0 (0.0%) |
| $35,000 to $49,999 | 105 (35.7%) | 0 (0.0%) |
| $50,000 to $74,999 | 60 (20.4%) | 25 (67.6%) |
| $75,000 to $99,999 | 18 (6.1%) | 8 (21.6%) |
| $100,000 to $149,999 | 14 (4.8%) | 4 (10.8%) |
| $150,000 or more | 31 (10.5%) | 0 (0.0%) |
| Total | 294 (100.0%) | 37 (100.0%) |
Monthly Housing Cost Tiers in Selma
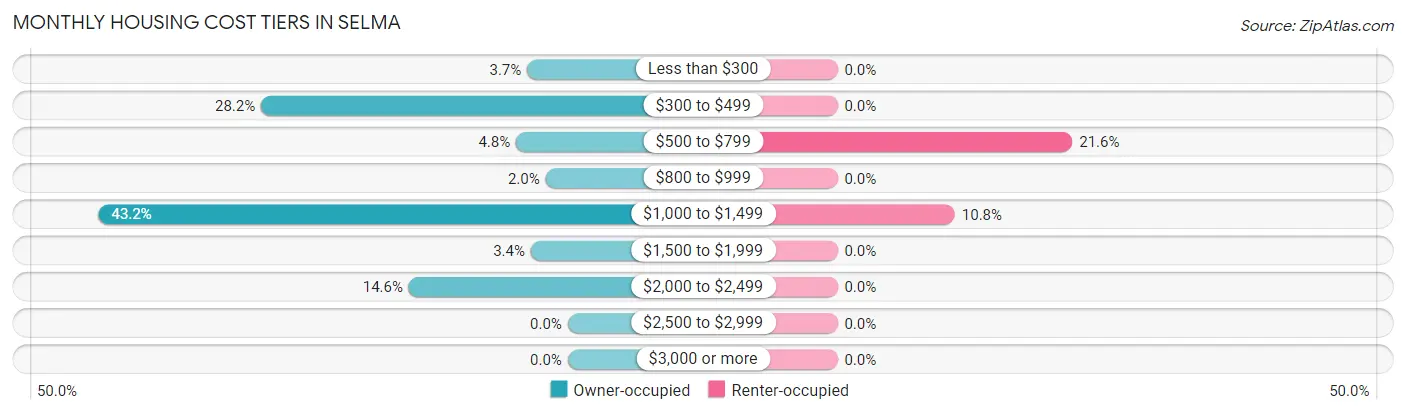
| Monthly Cost | Owner-occupied | Renter-occupied |
| Less than $300 | 11 (3.7%) | 0 (0.0%) |
| $300 to $499 | 83 (28.2%) | 0 (0.0%) |
| $500 to $799 | 14 (4.8%) | 8 (21.6%) |
| $800 to $999 | 6 (2.0%) | 0 (0.0%) |
| $1,000 to $1,499 | 127 (43.2%) | 4 (10.8%) |
| $1,500 to $1,999 | 10 (3.4%) | 0 (0.0%) |
| $2,000 to $2,499 | 43 (14.6%) | 0 (0.0%) |
| $2,500 to $2,999 | 0 (0.0%) | 0 (0.0%) |
| $3,000 or more | 0 (0.0%) | 0 (0.0%) |
| Total | 294 (100.0%) | 37 (100.0%) |
Physical Housing Characteristics in Selma
Housing Structures in Selma
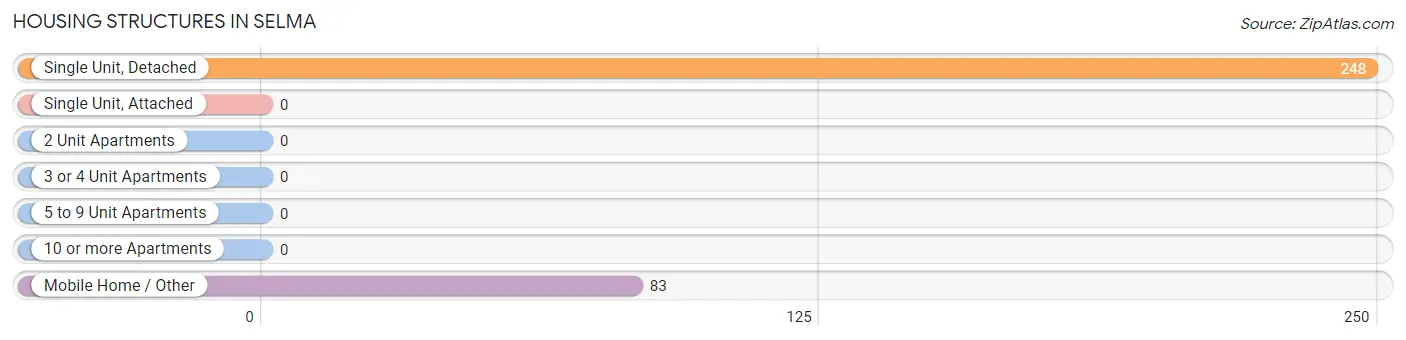
| Structure Type | # Housing Units | % Housing Units |
| Single Unit, Detached | 248 | 74.9% |
| Single Unit, Attached | 0 | 0.0% |
| 2 Unit Apartments | 0 | 0.0% |
| 3 or 4 Unit Apartments | 0 | 0.0% |
| 5 to 9 Unit Apartments | 0 | 0.0% |
| 10 or more Apartments | 0 | 0.0% |
| Mobile Home / Other | 83 | 25.1% |
| Total | 331 | 100.0% |
Housing Structures by Occupancy in Selma
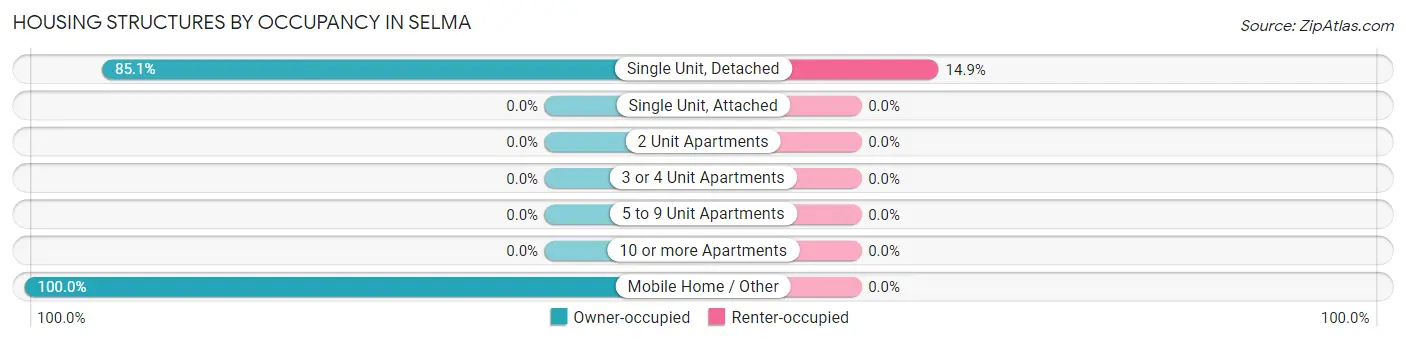
| Structure Type | Owner-occupied | Renter-occupied |
| Single Unit, Detached | 211 (85.1%) | 37 (14.9%) |
| Single Unit, Attached | 0 (0.0%) | 0 (0.0%) |
| 2 Unit Apartments | 0 (0.0%) | 0 (0.0%) |
| 3 or 4 Unit Apartments | 0 (0.0%) | 0 (0.0%) |
| 5 to 9 Unit Apartments | 0 (0.0%) | 0 (0.0%) |
| 10 or more Apartments | 0 (0.0%) | 0 (0.0%) |
| Mobile Home / Other | 83 (100.0%) | 0 (0.0%) |
| Total | 294 (88.8%) | 37 (11.2%) |
Housing Structures by Number of Rooms in Selma
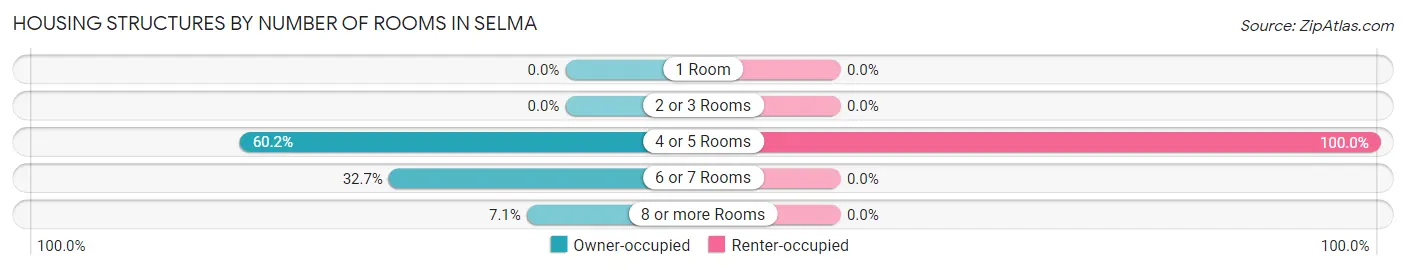
| Number of Rooms | Owner-occupied | Renter-occupied |
| 1 Room | 0 (0.0%) | 0 (0.0%) |
| 2 or 3 Rooms | 0 (0.0%) | 0 (0.0%) |
| 4 or 5 Rooms | 177 (60.2%) | 37 (100.0%) |
| 6 or 7 Rooms | 96 (32.7%) | 0 (0.0%) |
| 8 or more Rooms | 21 (7.1%) | 0 (0.0%) |
| Total | 294 (100.0%) | 37 (100.0%) |
Housing Structure by Heating Type in Selma
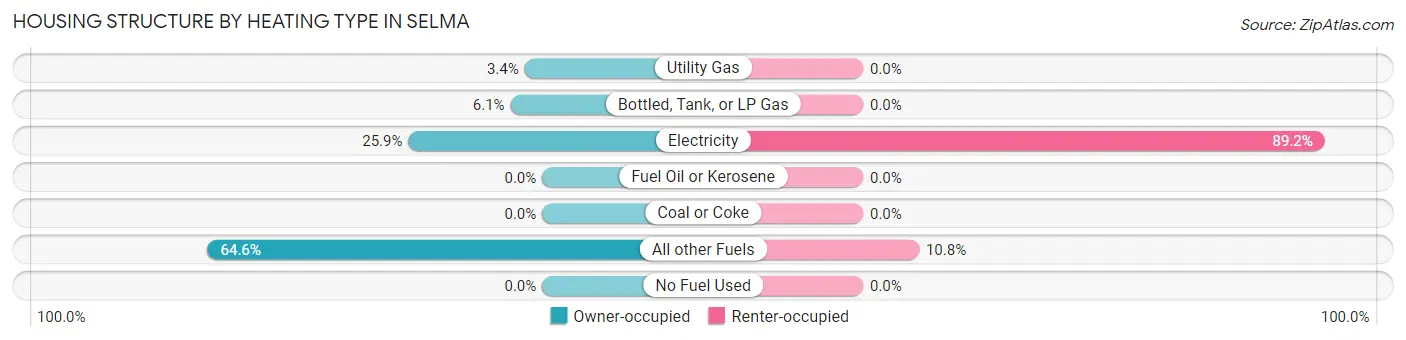
| Heating Type | Owner-occupied | Renter-occupied |
| Utility Gas | 10 (3.4%) | 0 (0.0%) |
| Bottled, Tank, or LP Gas | 18 (6.1%) | 0 (0.0%) |
| Electricity | 76 (25.9%) | 33 (89.2%) |
| Fuel Oil or Kerosene | 0 (0.0%) | 0 (0.0%) |
| Coal or Coke | 0 (0.0%) | 0 (0.0%) |
| All other Fuels | 190 (64.6%) | 4 (10.8%) |
| No Fuel Used | 0 (0.0%) | 0 (0.0%) |
| Total | 294 (100.0%) | 37 (100.0%) |
Household Vehicle Usage in Selma
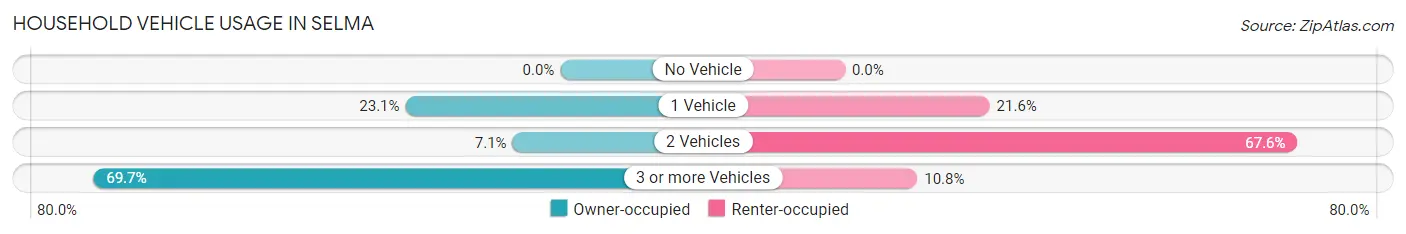
| Vehicles per Household | Owner-occupied | Renter-occupied |
| No Vehicle | 0 (0.0%) | 0 (0.0%) |
| 1 Vehicle | 68 (23.1%) | 8 (21.6%) |
| 2 Vehicles | 21 (7.1%) | 25 (67.6%) |
| 3 or more Vehicles | 205 (69.7%) | 4 (10.8%) |
| Total | 294 (100.0%) | 37 (100.0%) |
Real Estate & Mortgages in Selma
Real Estate and Mortgage Overview in Selma
| Characteristic | Without Mortgage | With Mortgage |
| Housing Units | 124 | 170 |
| Median Property Value | $286,500 | $242,900 |
| Median Household Income | $38,534 | $31 |
| Monthly Housing Costs | $397 | $0 |
| Real Estate Taxes | $2,080 | $0 |
Property Value by Mortgage Status in Selma
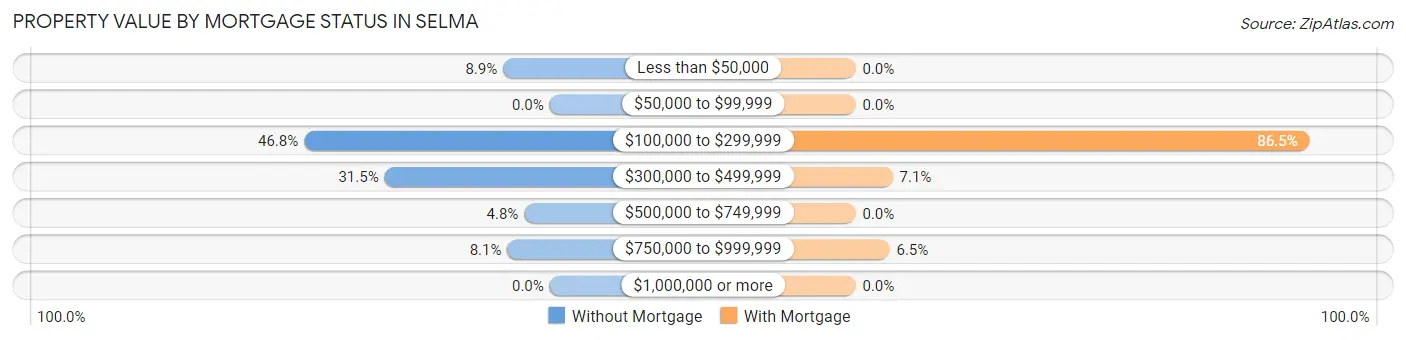
| Property Value | Without Mortgage | With Mortgage |
| Less than $50,000 | 11 (8.9%) | 0 (0.0%) |
| $50,000 to $99,999 | 0 (0.0%) | 0 (0.0%) |
| $100,000 to $299,999 | 58 (46.8%) | 147 (86.5%) |
| $300,000 to $499,999 | 39 (31.5%) | 12 (7.1%) |
| $500,000 to $749,999 | 6 (4.8%) | 0 (0.0%) |
| $750,000 to $999,999 | 10 (8.1%) | 11 (6.5%) |
| $1,000,000 or more | 0 (0.0%) | 0 (0.0%) |
| Total | 124 (100.0%) | 170 (100.0%) |
Household Income by Mortgage Status in Selma
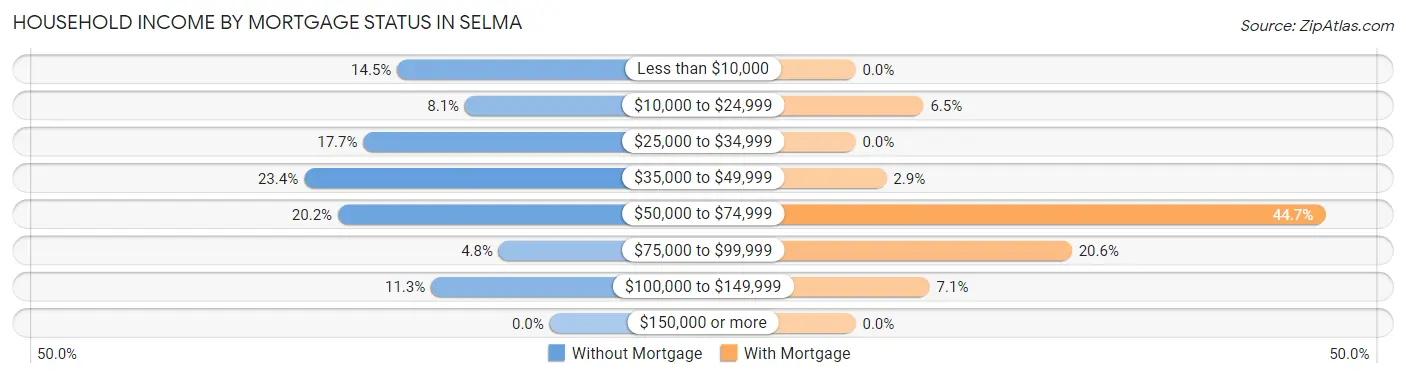
| Household Income | Without Mortgage | With Mortgage |
| Less than $10,000 | 18 (14.5%) | 0 (0.0%) |
| $10,000 to $24,999 | 10 (8.1%) | 11 (6.5%) |
| $25,000 to $34,999 | 22 (17.7%) | 0 (0.0%) |
| $35,000 to $49,999 | 29 (23.4%) | 5 (2.9%) |
| $50,000 to $74,999 | 25 (20.2%) | 76 (44.7%) |
| $75,000 to $99,999 | 6 (4.8%) | 35 (20.6%) |
| $100,000 to $149,999 | 14 (11.3%) | 12 (7.1%) |
| $150,000 or more | 0 (0.0%) | 0 (0.0%) |
| Total | 124 (100.0%) | 170 (100.0%) |
Property Value to Household Income Ratio in Selma
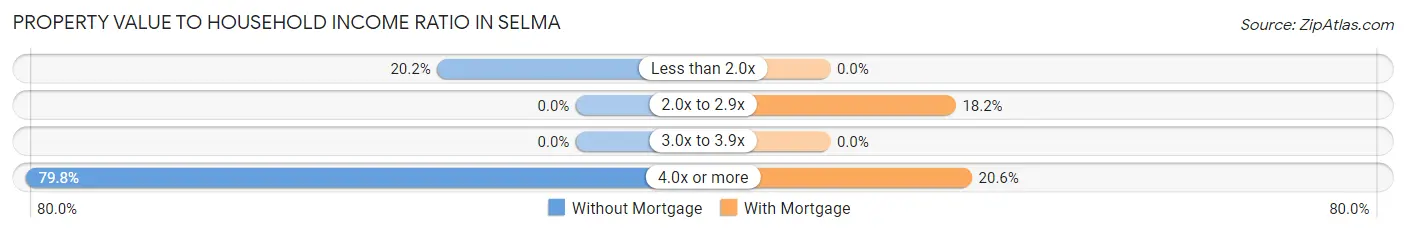
| Value-to-Income Ratio | Without Mortgage | With Mortgage |
| Less than 2.0x | 25 (20.2%) | 0 (0.0%) |
| 2.0x to 2.9x | 0 (0.0%) | 31 (18.2%) |
| 3.0x to 3.9x | 0 (0.0%) | 0 (0.0%) |
| 4.0x or more | 99 (79.8%) | 35 (20.6%) |
| Total | 124 (100.0%) | 170 (100.0%) |
Real Estate Taxes by Mortgage Status in Selma
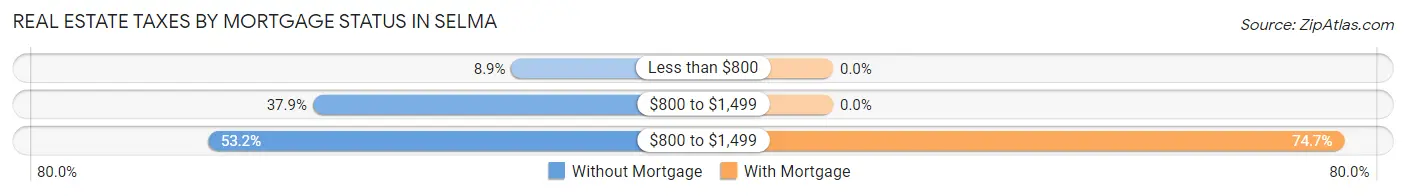
| Property Taxes | Without Mortgage | With Mortgage |
| Less than $800 | 11 (8.9%) | 0 (0.0%) |
| $800 to $1,499 | 47 (37.9%) | 0 (0.0%) |
| $800 to $1,499 | 66 (53.2%) | 127 (74.7%) |
| Total | 124 (100.0%) | 170 (100.0%) |
Health & Disability in Selma
Health Insurance Coverage by Age in Selma
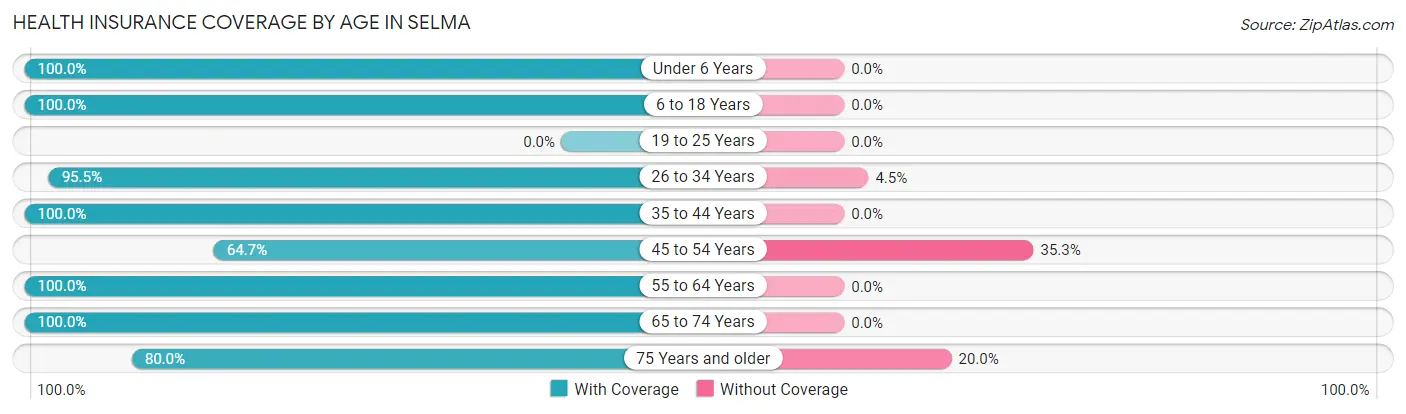
| Age Bracket | With Coverage | Without Coverage |
| Under 6 Years | 28 (100.0%) | 0 (0.0%) |
| 6 to 18 Years | 199 (100.0%) | 0 (0.0%) |
| 19 to 25 Years | 0 (0.0%) | 0 (0.0%) |
| 26 to 34 Years | 127 (95.5%) | 6 (4.5%) |
| 35 to 44 Years | 154 (100.0%) | 0 (0.0%) |
| 45 to 54 Years | 22 (64.7%) | 12 (35.3%) |
| 55 to 64 Years | 144 (100.0%) | 0 (0.0%) |
| 65 to 74 Years | 147 (100.0%) | 0 (0.0%) |
| 75 Years and older | 40 (80.0%) | 10 (20.0%) |
| Total | 861 (96.9%) | 28 (3.2%) |
Health Insurance Coverage by Citizenship Status in Selma
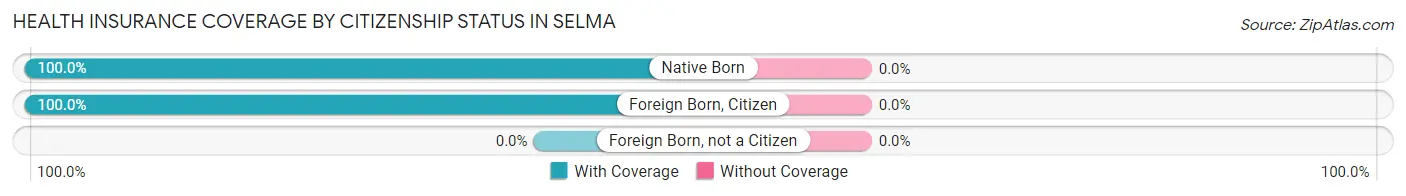
| Citizenship Status | With Coverage | Without Coverage |
| Native Born | 28 (100.0%) | 0 (0.0%) |
| Foreign Born, Citizen | 199 (100.0%) | 0 (0.0%) |
| Foreign Born, not a Citizen | 0 (0.0%) | 0 (0.0%) |
Health Insurance Coverage by Household Income in Selma
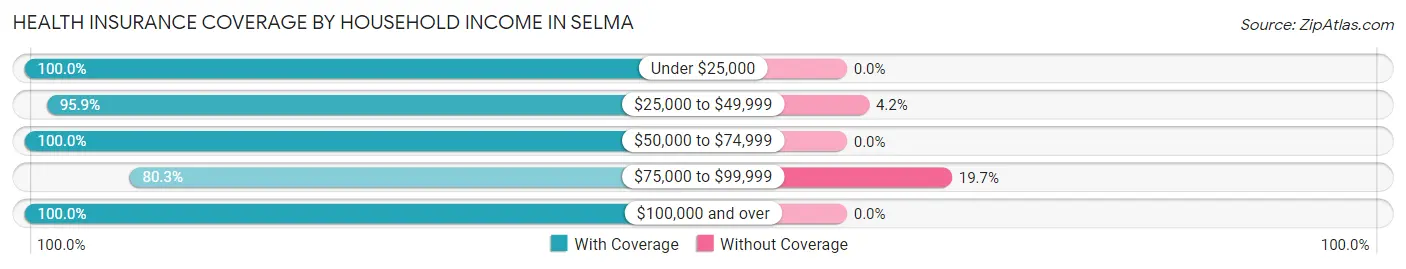
| Household Income | With Coverage | Without Coverage |
| Under $25,000 | 51 (100.0%) | 0 (0.0%) |
| $25,000 to $49,999 | 370 (95.9%) | 16 (4.2%) |
| $50,000 to $74,999 | 283 (100.0%) | 0 (0.0%) |
| $75,000 to $99,999 | 49 (80.3%) | 12 (19.7%) |
| $100,000 and over | 108 (100.0%) | 0 (0.0%) |
Public vs Private Health Insurance Coverage by Age in Selma
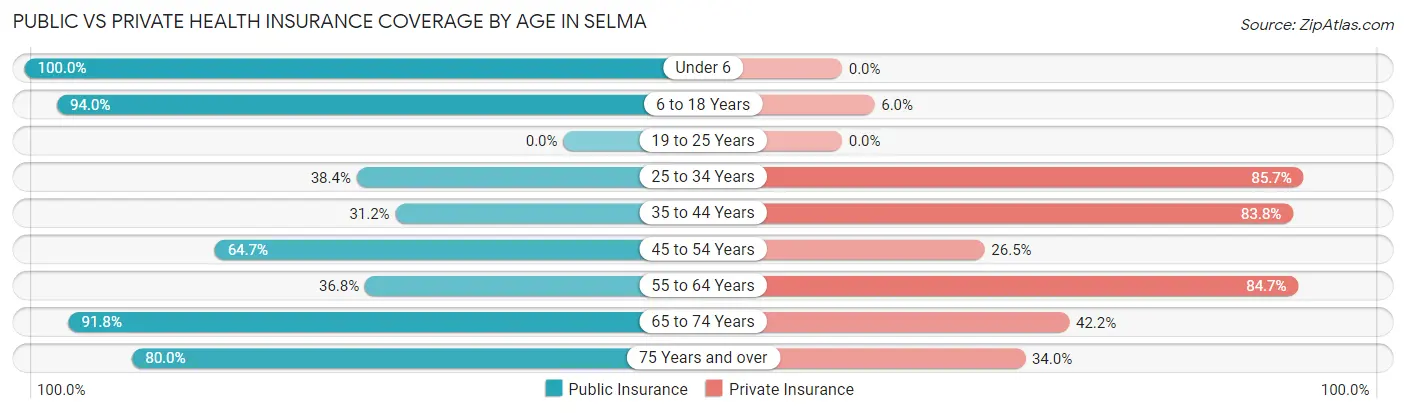
| Age Bracket | Public Insurance | Private Insurance |
| Under 6 | 28 (100.0%) | 0 (0.0%) |
| 6 to 18 Years | 187 (94.0%) | 12 (6.0%) |
| 19 to 25 Years | 0 (0.0%) | 0 (0.0%) |
| 25 to 34 Years | 51 (38.4%) | 114 (85.7%) |
| 35 to 44 Years | 48 (31.2%) | 129 (83.8%) |
| 45 to 54 Years | 22 (64.7%) | 9 (26.5%) |
| 55 to 64 Years | 53 (36.8%) | 122 (84.7%) |
| 65 to 74 Years | 135 (91.8%) | 62 (42.2%) |
| 75 Years and over | 40 (80.0%) | 17 (34.0%) |
| Total | 564 (63.4%) | 465 (52.3%) |
Disability Status by Sex by Age in Selma
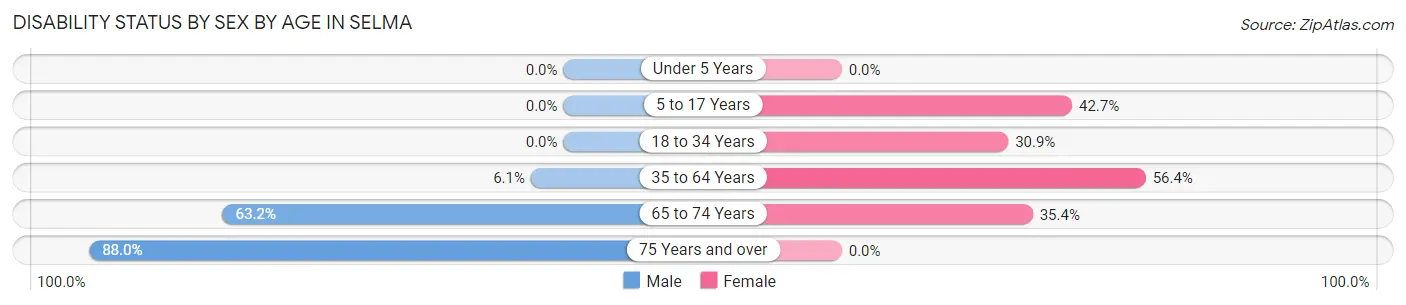
| Age Bracket | Male | Female |
| Under 5 Years | 0 (0.0%) | 0 (0.0%) |
| 5 to 17 Years | 0 (0.0%) | 50 (42.7%) |
| 18 to 34 Years | 0 (0.0%) | 38 (30.9%) |
| 35 to 64 Years | 13 (6.0%) | 66 (56.4%) |
| 65 to 74 Years | 43 (63.2%) | 28 (35.4%) |
| 75 Years and over | 44 (88.0%) | 0 (0.0%) |
Disability Class by Sex by Age in Selma
Disability Class: Hearing Difficulty
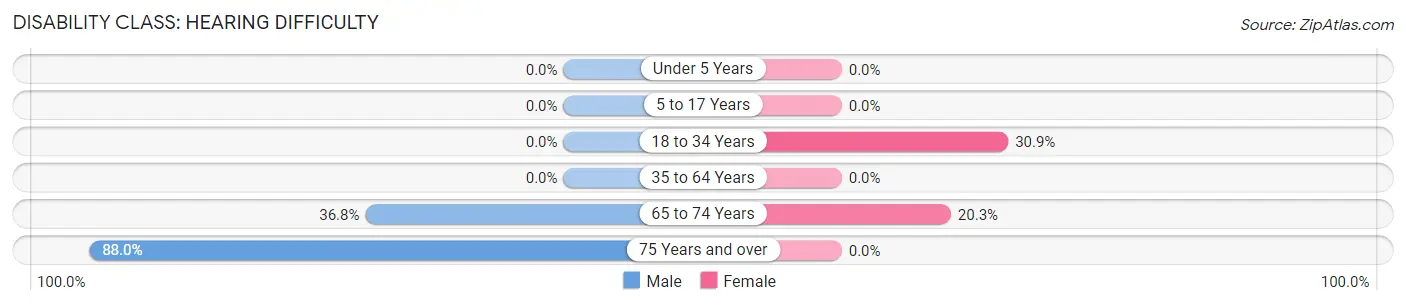
| Age Bracket | Male | Female |
| Under 5 Years | 0 (0.0%) | 0 (0.0%) |
| 5 to 17 Years | 0 (0.0%) | 0 (0.0%) |
| 18 to 34 Years | 0 (0.0%) | 38 (30.9%) |
| 35 to 64 Years | 0 (0.0%) | 0 (0.0%) |
| 65 to 74 Years | 25 (36.8%) | 16 (20.3%) |
| 75 Years and over | 44 (88.0%) | 0 (0.0%) |
Disability Class: Vision Difficulty
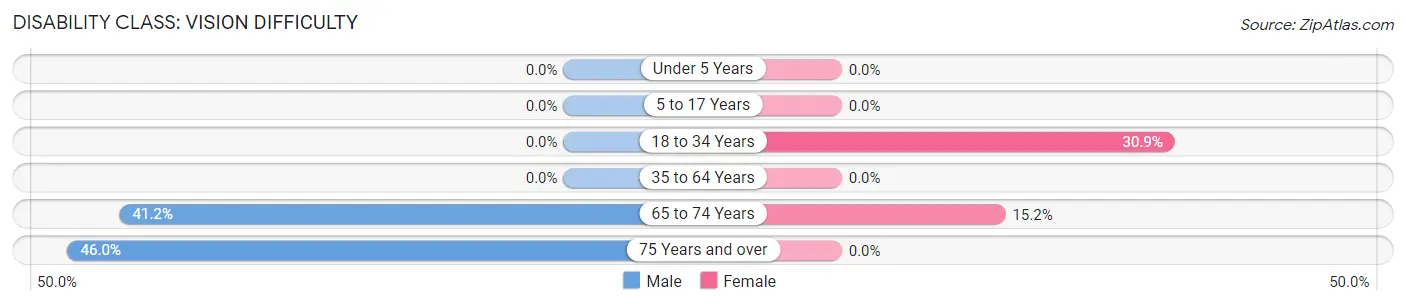
| Age Bracket | Male | Female |
| Under 5 Years | 0 (0.0%) | 0 (0.0%) |
| 5 to 17 Years | 0 (0.0%) | 0 (0.0%) |
| 18 to 34 Years | 0 (0.0%) | 38 (30.9%) |
| 35 to 64 Years | 0 (0.0%) | 0 (0.0%) |
| 65 to 74 Years | 28 (41.2%) | 12 (15.2%) |
| 75 Years and over | 23 (46.0%) | 0 (0.0%) |
Disability Class: Cognitive Difficulty
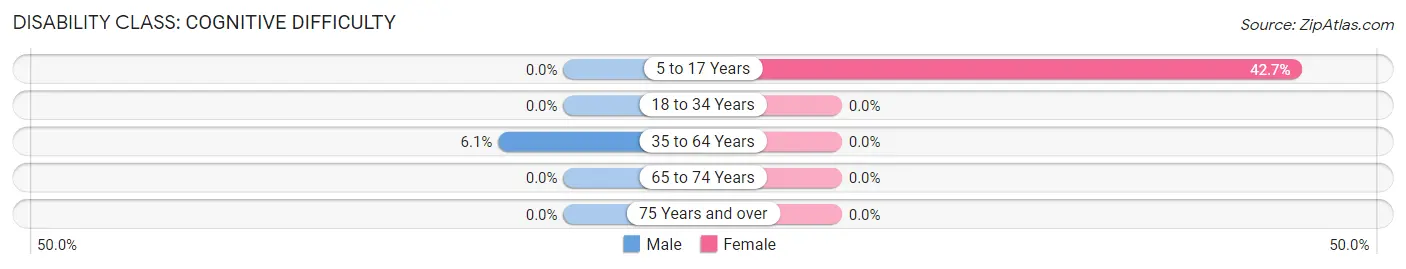
| Age Bracket | Male | Female |
| 5 to 17 Years | 0 (0.0%) | 50 (42.7%) |
| 18 to 34 Years | 0 (0.0%) | 0 (0.0%) |
| 35 to 64 Years | 13 (6.0%) | 0 (0.0%) |
| 65 to 74 Years | 0 (0.0%) | 0 (0.0%) |
| 75 Years and over | 0 (0.0%) | 0 (0.0%) |
Disability Class: Ambulatory Difficulty
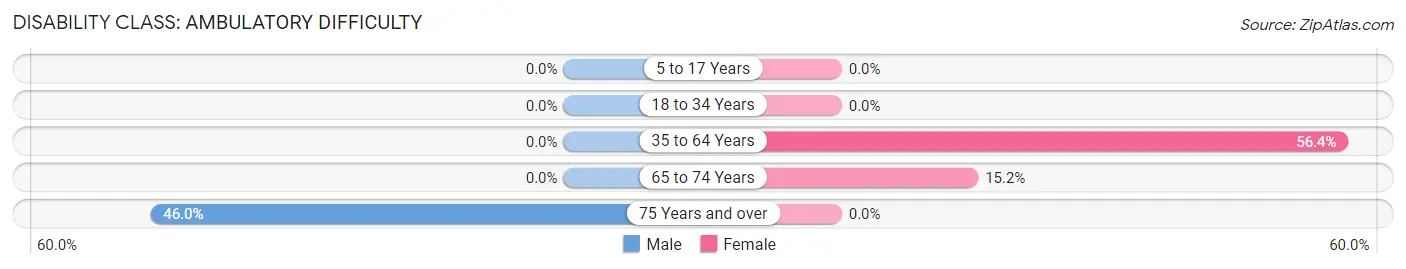
| Age Bracket | Male | Female |
| 5 to 17 Years | 0 (0.0%) | 0 (0.0%) |
| 18 to 34 Years | 0 (0.0%) | 0 (0.0%) |
| 35 to 64 Years | 0 (0.0%) | 66 (56.4%) |
| 65 to 74 Years | 0 (0.0%) | 12 (15.2%) |
| 75 Years and over | 23 (46.0%) | 0 (0.0%) |
Disability Class: Self-Care Difficulty
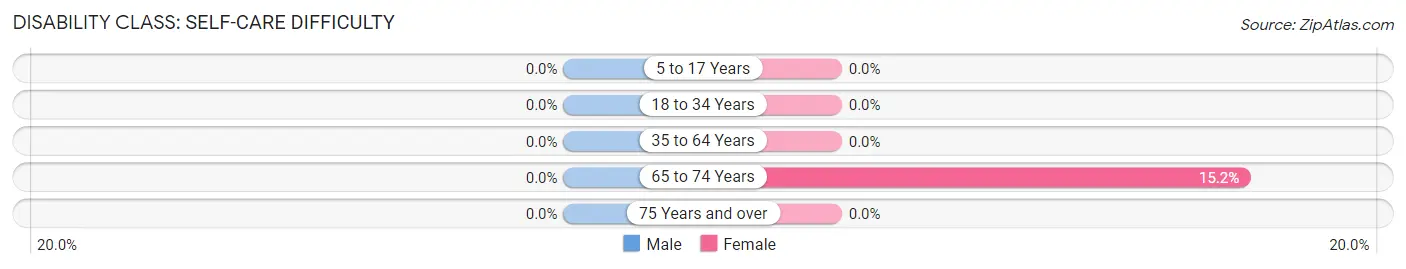
| Age Bracket | Male | Female |
| 5 to 17 Years | 0 (0.0%) | 0 (0.0%) |
| 18 to 34 Years | 0 (0.0%) | 0 (0.0%) |
| 35 to 64 Years | 0 (0.0%) | 0 (0.0%) |
| 65 to 74 Years | 0 (0.0%) | 12 (15.2%) |
| 75 Years and over | 0 (0.0%) | 0 (0.0%) |
Technology Access in Selma
Computing Device Access in Selma
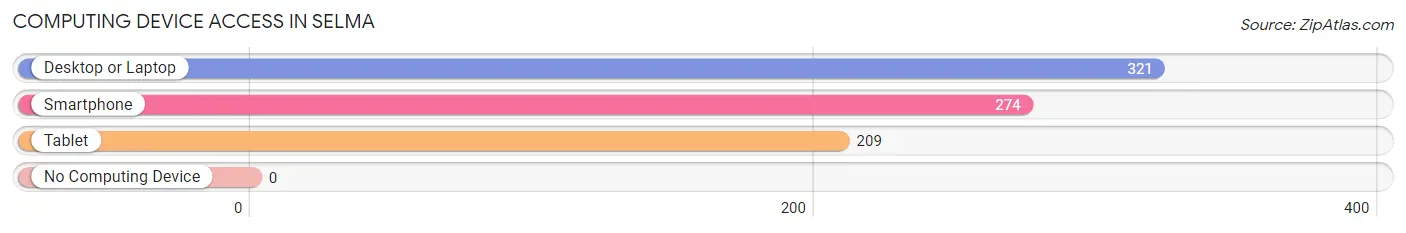
| Device Type | # Households | % Households |
| Desktop or Laptop | 321 | 97.0% |
| Smartphone | 274 | 82.8% |
| Tablet | 209 | 63.1% |
| No Computing Device | 0 | 0.0% |
| Total | 331 | 100.0% |
Internet Access in Selma
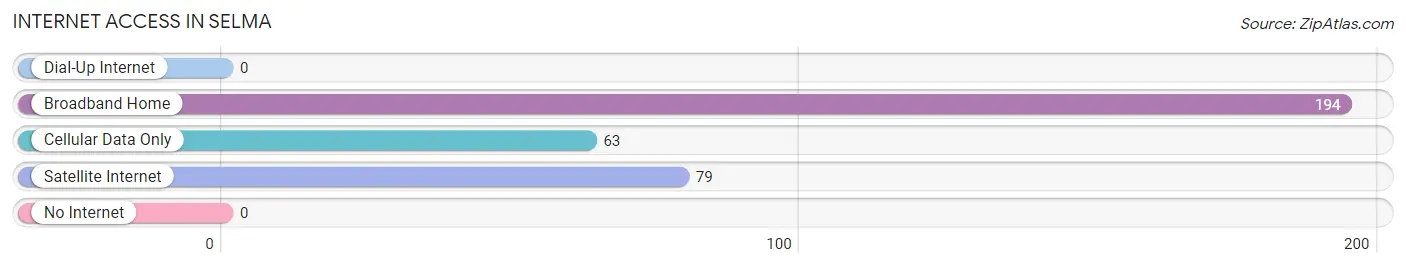
| Internet Type | # Households | % Households |
| Dial-Up Internet | 0 | 0.0% |
| Broadband Home | 194 | 58.6% |
| Cellular Data Only | 63 | 19.0% |
| Satellite Internet | 79 | 23.9% |
| No Internet | 0 | 0.0% |
| Total | 331 | 100.0% |
Selma Summary
Selma, Oregon is a small unincorporated community located in Josephine County, Oregon. It is situated in the foothills of the Siskiyou Mountains, approximately 10 miles east of Grants Pass. The population of Selma was estimated to be around 1,000 in 2020.
History
The area that is now Selma was first settled in the late 1800s by miners and loggers. The town was originally known as “Selma Station” and was a stop on the Oregon and California Railroad. The town was officially incorporated in 1891 and was named after Selma, Alabama, which was the site of a major battle during the Civil War.
In the early 1900s, Selma was a bustling logging and mining town. The town was home to several sawmills, a brickyard, and a large lumber mill. The town also had a hotel, a general store, and a post office.
In the 1950s, the logging industry began to decline and the town’s population began to dwindle. In the 1970s, the town was revitalized by the opening of the nearby Applegate Lake. The lake provided recreational opportunities for the town and brought in new residents.
Geography
Selma is located in the foothills of the Siskiyou Mountains in southwestern Oregon. The town is situated at an elevation of 1,890 feet and is surrounded by the Applegate River and Applegate Lake. The town is located approximately 10 miles east of Grants Pass and is accessible via Highway 199.
The climate in Selma is mild and temperate. The average high temperature in the summer is around 85 degrees Fahrenheit and the average low temperature in the winter is around 35 degrees Fahrenheit. The area receives an average of 35 inches of precipitation per year.
Economy
Selma’s economy is largely based on tourism and recreation. The town is home to several campgrounds, RV parks, and resorts. The nearby Applegate Lake is a popular destination for fishing, boating, and swimming. The town also has several restaurants, bars, and shops.
The town is also home to several small businesses, including a lumber mill, a sawmill, and a brickyard. The town also has a post office and a general store.
Demographics
The population of Selma was estimated to be around 1,000 in 2020. The town is predominantly white, with approximately 95% of the population identifying as Caucasian. The median household income in Selma is around $45,000 per year. The town has a low unemployment rate and a high rate of homeownership.
Common Questions
What is Per Capita Income in Selma?
Per Capita income in Selma is $31,308.
What is the Median Family Income in Selma?
Median Family Income in Selma is $42,418.
What is the Median Household income in Selma?
Median Household Income in Selma is $42,319.
What is Inequality or Gini Index in Selma?
Inequality or Gini Index in Selma is 0.52.
What is the Total Population of Selma?
Total Population of Selma is 892.
What is the Total Male Population of Selma?
Total Male Population of Selma is 425.
What is the Total Female Population of Selma?
Total Female Population of Selma is 467.
What is the Ratio of Males per 100 Females in Selma?
There are 91.01 Males per 100 Females in Selma.
What is the Ratio of Females per 100 Males in Selma?
There are 109.88 Females per 100 Males in Selma.
What is the Median Population Age in Selma?
Median Population Age in Selma is 36.6 Years.
What is the Average Family Size in Selma
Average Family Size in Selma is 3.1 People.
What is the Average Household Size in Selma
Average Household Size in Selma is 2.7 People.
How Large is the Labor Force in Selma?
There are 348 People in the Labor Forcein in Selma.
What is the Percentage of People in the Labor Force in Selma?
48.2% of People are in the Labor Force in Selma.
What is the Unemployment Rate in Selma?
Unemployment Rate in Selma is 4.3%.