Zip Codes with the Highest Percentage of Families with Income Below $10,000 in Oregon
RELATED REPORTS & OPTIONS
Family Income | $0-10k
Oregon
Compare Zip Codes
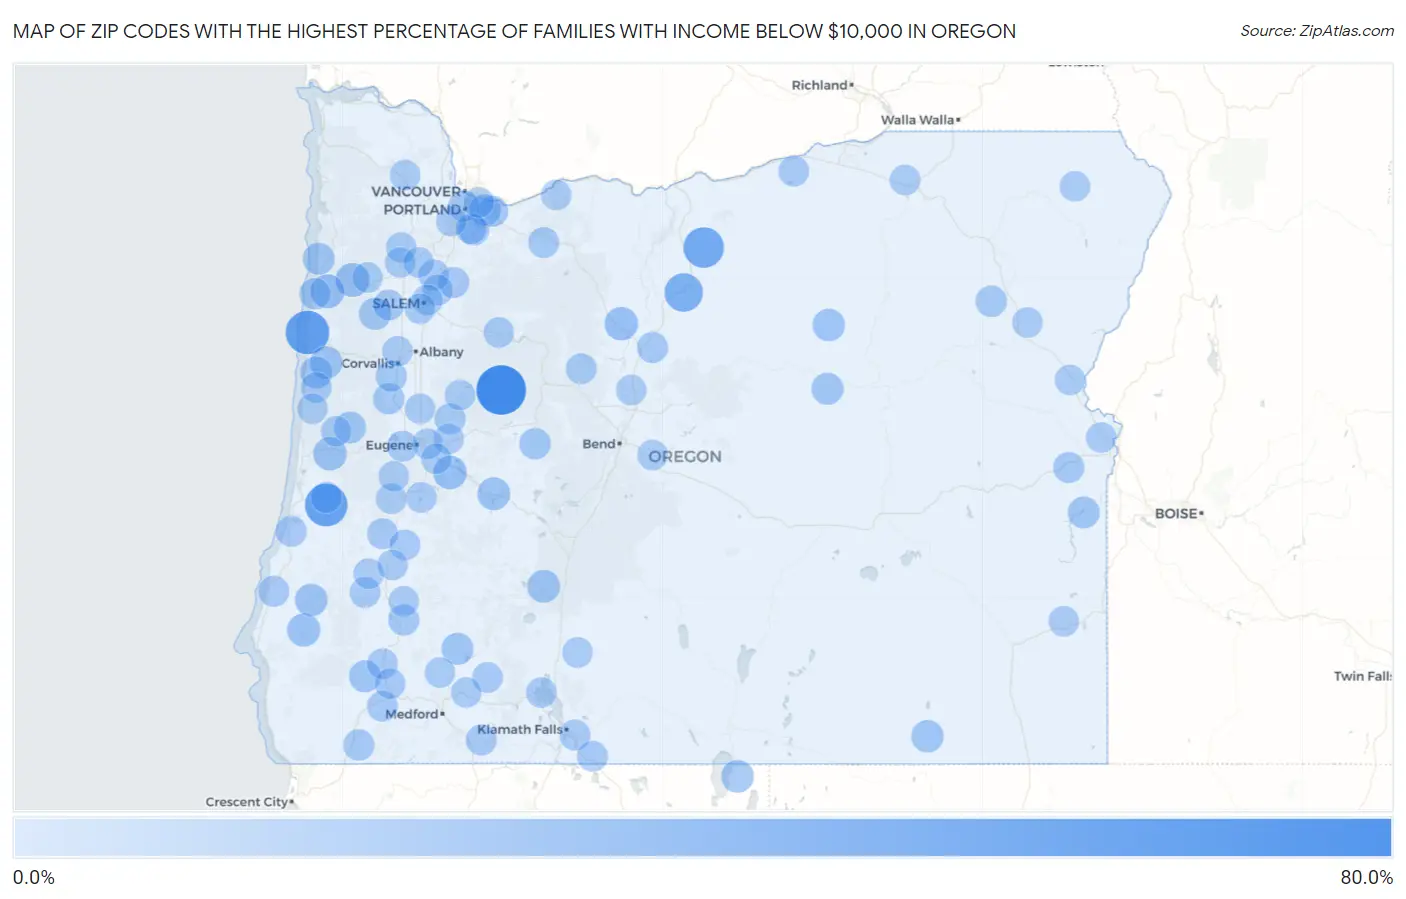
Map of Zip Codes with the Highest Percentage of Families with Income Below $10,000 in Oregon
0.0%
80.0%
Zip Codes with the Highest Percentage of Families with Income Below $10,000 in Oregon
| Zip Code | Families with Income < $10k | vs State | vs National | |
| 1. | 97329 | 76.0% | 2.7%(+73.3)#1 | 3.1%(+72.9)#19 |
| 2. | 97369 | 53.2% | 2.7%(+50.5)#2 | 3.1%(+50.1)#54 |
| 3. | 97473 | 49.2% | 2.7%(+46.5)#3 | 3.1%(+46.1)#69 |
| 4. | 97033 | 41.3% | 2.7%(+38.6)#4 | 3.1%(+38.2)#99 |
| 5. | 97057 | 33.3% | 2.7%(+30.6)#5 | 3.1%(+30.2)#161 |
| 6. | 97347 | 16.8% | 2.7%(+14.1)#6 | 3.1%(+13.7)#684 |
| 7. | 97368 | 16.3% | 2.7%(+13.6)#7 | 3.1%(+13.2)#725 |
| 8. | 97431 | 15.1% | 2.7%(+12.4)#8 | 3.1%(+12.0)#852 |
| 9. | 97761 | 14.9% | 2.7%(+12.2)#9 | 3.1%(+11.8)#871 |
| 10. | 97453 | 14.3% | 2.7%(+11.6)#10 | 3.1%(+11.2)#941 |
| 11. | 97466 | 13.5% | 2.7%(+10.8)#11 | 3.1%(+10.4)#1,050 |
| 12. | 97463 | 12.4% | 2.7%(+9.70)#12 | 3.1%(+9.30)#1,240 |
| 13. | 97731 | 12.2% | 2.7%(+9.50)#13 | 3.1%(+9.10)#1,293 |
| 14. | 97458 | 11.7% | 2.7%(+9.00)#14 | 3.1%(+8.60)#1,395 |
| 15. | 97635 | 11.6% | 2.7%(+8.90)#15 | 3.1%(+8.50)#1,439 |
| 16. | 97391 | 11.2% | 2.7%(+8.50)#16 | 3.1%(+8.10)#1,535 |
| 17. | 97710 | 11.1% | 2.7%(+8.40)#17 | 3.1%(+8.00)#1,581 |
| 18. | 97864 | 10.9% | 2.7%(+8.20)#18 | 3.1%(+7.80)#1,638 |
| 19. | 97376 | 9.8% | 2.7%(+7.10)#19 | 3.1%(+6.70)#2,013 |
| 20. | 97825 | 9.8% | 2.7%(+7.10)#20 | 3.1%(+6.70)#2,019 |
| 21. | 97344 | 9.5% | 2.7%(+6.80)#21 | 3.1%(+6.40)#2,130 |
| 22. | 97532 | 9.2% | 2.7%(+6.50)#22 | 3.1%(+6.10)#2,271 |
| 23. | 97913 | 9.1% | 2.7%(+6.40)#23 | 3.1%(+6.00)#2,311 |
| 24. | 97135 | 9.1% | 2.7%(+6.40)#24 | 3.1%(+6.00)#2,327 |
| 25. | 97541 | 9.1% | 2.7%(+6.40)#25 | 3.1%(+6.00)#2,328 |
| 26. | 97430 | 8.7% | 2.7%(+6.00)#26 | 3.1%(+5.60)#2,550 |
| 27. | 97413 | 7.4% | 2.7%(+4.70)#27 | 3.1%(+4.30)#3,377 |
| 28. | 97233 | 7.3% | 2.7%(+4.60)#28 | 3.1%(+4.20)#3,395 |
| 29. | 97833 | 7.1% | 2.7%(+4.40)#29 | 3.1%(+4.00)#3,603 |
| 30. | 97364 | 6.8% | 2.7%(+4.10)#30 | 3.1%(+3.70)#3,872 |
| 31. | 97456 | 6.7% | 2.7%(+4.00)#31 | 3.1%(+3.60)#3,943 |
| 32. | 97333 | 6.5% | 2.7%(+3.80)#32 | 3.1%(+3.40)#4,111 |
| 33. | 97523 | 6.4% | 2.7%(+3.70)#33 | 3.1%(+3.30)#4,239 |
| 34. | 97417 | 6.4% | 2.7%(+3.70)#34 | 3.1%(+3.30)#4,256 |
| 35. | 97467 | 5.9% | 2.7%(+3.20)#35 | 3.1%(+2.80)#4,820 |
| 36. | 97918 | 5.8% | 2.7%(+3.10)#36 | 3.1%(+2.70)#4,951 |
| 37. | 97067 | 5.8% | 2.7%(+3.10)#37 | 3.1%(+2.70)#4,967 |
| 38. | 97030 | 5.7% | 2.7%(+3.00)#38 | 3.1%(+2.60)#5,014 |
| 39. | 97741 | 5.7% | 2.7%(+3.00)#39 | 3.1%(+2.60)#5,047 |
| 40. | 97603 | 5.6% | 2.7%(+2.90)#40 | 3.1%(+2.50)#5,152 |
| 41. | 97027 | 5.6% | 2.7%(+2.90)#41 | 3.1%(+2.50)#5,189 |
| 42. | 97362 | 5.6% | 2.7%(+2.90)#42 | 3.1%(+2.50)#5,219 |
| 43. | 97209 | 5.5% | 2.7%(+2.80)#43 | 3.1%(+2.40)#5,328 |
| 44. | 97459 | 5.5% | 2.7%(+2.80)#44 | 3.1%(+2.40)#5,338 |
| 45. | 97026 | 5.5% | 2.7%(+2.80)#45 | 3.1%(+2.40)#5,373 |
| 46. | 97411 | 5.4% | 2.7%(+2.70)#46 | 3.1%(+2.30)#5,497 |
| 47. | 97520 | 5.2% | 2.7%(+2.50)#47 | 3.1%(+2.10)#5,770 |
| 48. | 97338 | 5.2% | 2.7%(+2.50)#48 | 3.1%(+2.10)#5,776 |
| 49. | 97305 | 5.1% | 2.7%(+2.40)#49 | 3.1%(+2.00)#5,917 |
| 50. | 97454 | 5.1% | 2.7%(+2.40)#50 | 3.1%(+2.00)#6,041 |
| 51. | 97462 | 5.0% | 2.7%(+2.30)#51 | 3.1%(+1.90)#6,169 |
| 52. | 97481 | 4.9% | 2.7%(+2.20)#52 | 3.1%(+1.80)#6,392 |
| 53. | 97402 | 4.8% | 2.7%(+2.10)#53 | 3.1%(+1.70)#6,416 |
| 54. | 97394 | 4.8% | 2.7%(+2.10)#54 | 3.1%(+1.70)#6,509 |
| 55. | 97633 | 4.8% | 2.7%(+2.10)#55 | 3.1%(+1.70)#6,554 |
| 56. | 97267 | 4.7% | 2.7%(+2.00)#56 | 3.1%(+1.60)#6,627 |
| 57. | 97818 | 4.7% | 2.7%(+2.00)#57 | 3.1%(+1.60)#6,701 |
| 58. | 97497 | 4.7% | 2.7%(+2.00)#58 | 3.1%(+1.60)#6,764 |
| 59. | 97527 | 4.6% | 2.7%(+1.90)#59 | 3.1%(+1.50)#6,807 |
| 60. | 97526 | 4.6% | 2.7%(+1.90)#60 | 3.1%(+1.50)#6,810 |
| 61. | 97730 | 4.6% | 2.7%(+1.90)#61 | 3.1%(+1.50)#6,974 |
| 62. | 97479 | 4.5% | 2.7%(+1.80)#62 | 3.1%(+1.40)#7,050 |
| 63. | 97522 | 4.5% | 2.7%(+1.80)#63 | 3.1%(+1.40)#7,163 |
| 64. | 97701 | 4.4% | 2.7%(+1.70)#64 | 3.1%(+1.30)#7,212 |
| 65. | 97424 | 4.3% | 2.7%(+1.60)#65 | 3.1%(+1.20)#7,455 |
| 66. | 97760 | 4.2% | 2.7%(+1.50)#66 | 3.1%(+1.10)#7,741 |
| 67. | 97435 | 4.2% | 2.7%(+1.50)#67 | 3.1%(+1.10)#7,783 |
| 68. | 97301 | 4.1% | 2.7%(+1.40)#68 | 3.1%(+1.000)#7,866 |
| 69. | 97330 | 4.1% | 2.7%(+1.40)#69 | 3.1%(+1.000)#7,875 |
| 70. | 97801 | 4.1% | 2.7%(+1.40)#70 | 3.1%(+1.000)#7,916 |
| 71. | 97111 | 4.1% | 2.7%(+1.40)#71 | 3.1%(+1.000)#8,010 |
| 72. | 97014 | 4.1% | 2.7%(+1.40)#72 | 3.1%(+1.000)#8,063 |
| 73. | 97109 | 4.1% | 2.7%(+1.40)#73 | 3.1%(+1.000)#8,093 |
| 74. | 97478 | 4.0% | 2.7%(+1.30)#74 | 3.1%(+0.900)#8,131 |
| 75. | 97220 | 4.0% | 2.7%(+1.30)#75 | 3.1%(+0.900)#8,161 |
| 76. | 97914 | 4.0% | 2.7%(+1.30)#76 | 3.1%(+0.900)#8,186 |
| 77. | 97480 | 4.0% | 2.7%(+1.30)#77 | 3.1%(+0.900)#8,355 |
| 78. | 97477 | 3.9% | 2.7%(+1.20)#78 | 3.1%(+0.800)#8,394 |
| 79. | 97471 | 3.9% | 2.7%(+1.20)#79 | 3.1%(+0.800)#8,407 |
| 80. | 97386 | 3.9% | 2.7%(+1.20)#80 | 3.1%(+0.800)#8,463 |
| 81. | 97495 | 3.9% | 2.7%(+1.20)#81 | 3.1%(+0.800)#8,578 |
| 82. | 97910 | 3.9% | 2.7%(+1.20)#82 | 3.1%(+0.800)#8,616 |
| 83. | 97128 | 3.8% | 2.7%(+1.10)#83 | 3.1%(+0.700)#8,654 |
| 84. | 97601 | 3.8% | 2.7%(+1.10)#84 | 3.1%(+0.700)#8,695 |
| 85. | 97624 | 3.8% | 2.7%(+1.10)#85 | 3.1%(+0.700)#8,810 |
| 86. | 97396 | 3.8% | 2.7%(+1.10)#86 | 3.1%(+0.700)#8,816 |
| 87. | 97814 | 3.7% | 2.7%(+1.00)#87 | 3.1%(+0.600)#9,026 |
| 88. | 97446 | 3.7% | 2.7%(+1.00)#88 | 3.1%(+0.600)#9,076 |
| 89. | 97828 | 3.7% | 2.7%(+1.00)#89 | 3.1%(+0.600)#9,103 |
| 90. | 97498 | 3.7% | 2.7%(+1.00)#90 | 3.1%(+0.600)#9,133 |
| 91. | 97346 | 3.7% | 2.7%(+1.00)#91 | 3.1%(+0.600)#9,171 |
| 92. | 97907 | 3.7% | 2.7%(+1.00)#92 | 3.1%(+0.600)#9,180 |
| 93. | 97223 | 3.6% | 2.7%(+0.900)#93 | 3.1%(+0.500)#9,215 |
| 94. | 97302 | 3.6% | 2.7%(+0.900)#94 | 3.1%(+0.500)#9,228 |
| 95. | 97503 | 3.6% | 2.7%(+0.900)#95 | 3.1%(+0.500)#9,292 |
| 96. | 97457 | 3.6% | 2.7%(+0.900)#96 | 3.1%(+0.500)#9,313 |
| 97. | 97114 | 3.6% | 2.7%(+0.900)#97 | 3.1%(+0.500)#9,348 |
| 98. | 97455 | 3.6% | 2.7%(+0.900)#98 | 3.1%(+0.500)#9,391 |
| 99. | 97451 | 3.6% | 2.7%(+0.900)#99 | 3.1%(+0.500)#9,451 |
| 100. | 97524 | 3.5% | 2.7%(+0.800)#100 | 3.1%(+0.400)#9,563 |
Common Questions
What are the Top 10 Zip Codes with the Highest Percentage of Families with Income Below $10,000 in Oregon?
Top 10 Zip Codes with the Highest Percentage of Families with Income Below $10,000 in Oregon are:
What zip code has the Highest Percentage of Families with Income Below $10,000 in Oregon?
97329 has the Highest Percentage of Families with Income Below $10,000 in Oregon with 76.0%.
What is the Percentage of Families with Income Below $10,000 in the State of Oregon?
Percentage of Families with Income Below $10,000 in Oregon is 2.7%.
What is the Percentage of Families with Income Below $10,000 in the United States?
Percentage of Families with Income Below $10,000 in the United States is 3.1%.