Paisley, OR Map & Demographics
Paisley Map
Paisley Overview
$20,842
PER CAPITA INCOME
$61,750
AVG FAMILY INCOME
$44,609
AVG HOUSEHOLD INCOME
0.32
INEQUALITY / GINI INDEX
283
TOTAL POPULATION
142
MALE POPULATION
141
FEMALE POPULATION
100.71
MALES / 100 FEMALES
99.30
FEMALES / 100 MALES
29.6
MEDIAN AGE
3.7
AVG FAMILY SIZE
2.4
AVG HOUSEHOLD SIZE
114
LABOR FORCE [ PEOPLE ]
56.7%
PERCENT IN LABOR FORCE
8.8%
UNEMPLOYMENT RATE
Paisley Zip Codes
Paisley Area Codes
Income in Paisley
Income Overview in Paisley
Per Capita Income in Paisley is $20,842, while median incomes of families and households are $61,750 and $44,609 respectively.
| Characteristic | Number | Measure |
| Per Capita Income | 283 | $20,842 |
| Median Family Income | 60 | $61,750 |
| Mean Family Income | 60 | $60,623 |
| Median Household Income | 115 | $44,609 |
| Mean Household Income | 115 | $48,435 |
| Income Deficit | 60 | $0 |
| Wage / Income Gap (%) | 283 | 0.00% |
| Wage / Income Gap ($) | 283 | 100.00¢ per $1 |
| Gini / Inequality Index | 283 | 0.32 |
Earnings by Sex in Paisley
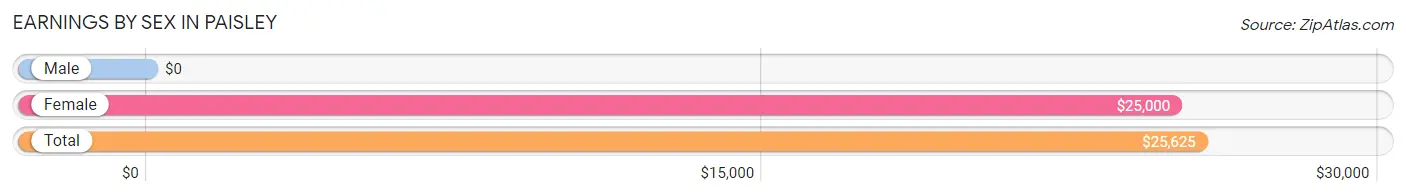
| Sex | Number | Average Earnings |
| Male | 73 (55.7%) | $0 |
| Female | 58 (44.3%) | $25,000 |
| Total | 131 (100.0%) | $25,625 |
Earnings by Sex by Income Bracket in Paisley
The most common earnings brackets in Paisley are $55,000 to $64,999 for men (15 | 20.5%) and $25,000 to $29,999 for women (8 | 13.8%).
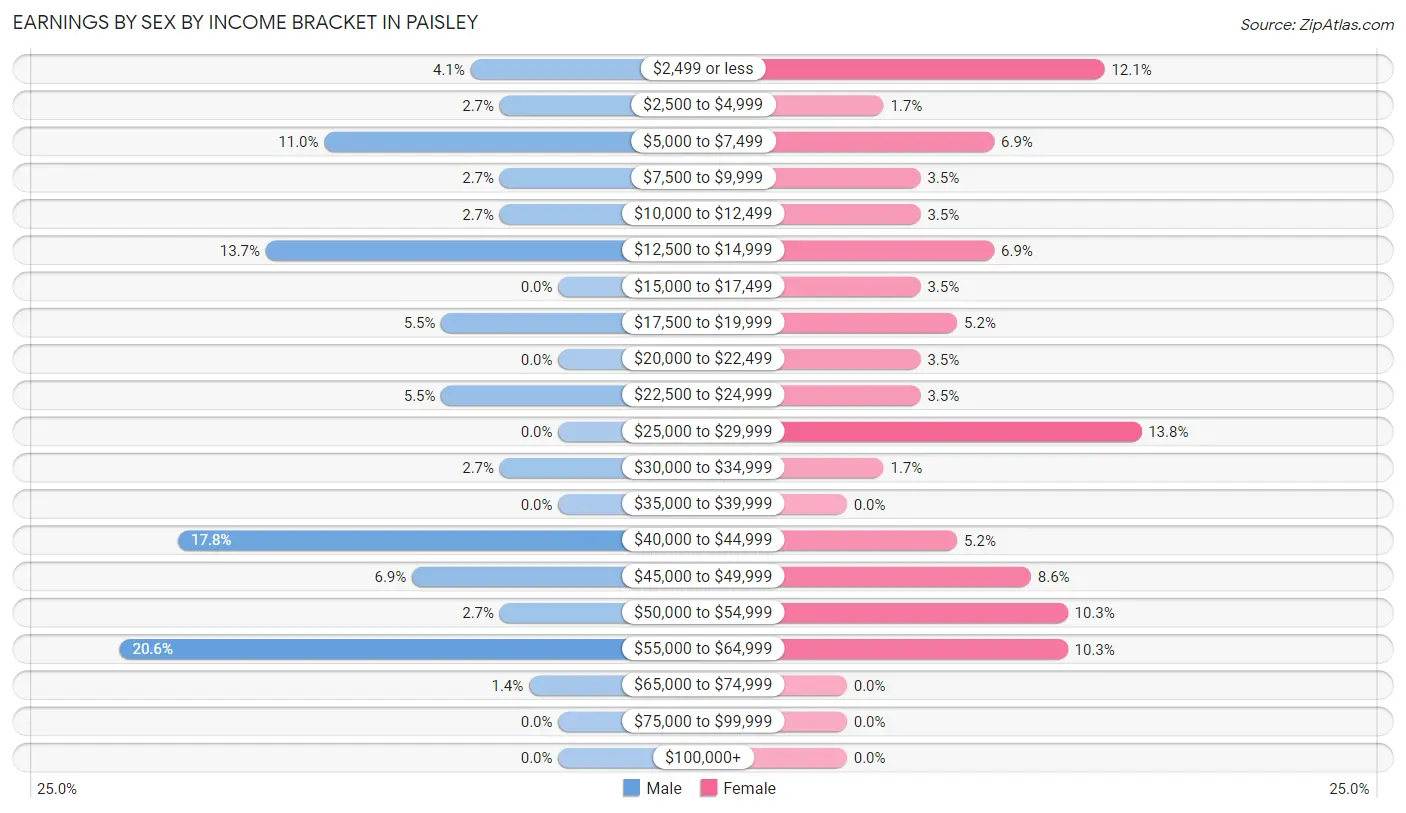
| Income | Male | Female |
| $2,499 or less | 3 (4.1%) | 7 (12.1%) |
| $2,500 to $4,999 | 2 (2.7%) | 1 (1.7%) |
| $5,000 to $7,499 | 8 (11.0%) | 4 (6.9%) |
| $7,500 to $9,999 | 2 (2.7%) | 2 (3.5%) |
| $10,000 to $12,499 | 2 (2.7%) | 2 (3.5%) |
| $12,500 to $14,999 | 10 (13.7%) | 4 (6.9%) |
| $15,000 to $17,499 | 0 (0.0%) | 2 (3.5%) |
| $17,500 to $19,999 | 4 (5.5%) | 3 (5.2%) |
| $20,000 to $22,499 | 0 (0.0%) | 2 (3.5%) |
| $22,500 to $24,999 | 4 (5.5%) | 2 (3.5%) |
| $25,000 to $29,999 | 0 (0.0%) | 8 (13.8%) |
| $30,000 to $34,999 | 2 (2.7%) | 1 (1.7%) |
| $35,000 to $39,999 | 0 (0.0%) | 0 (0.0%) |
| $40,000 to $44,999 | 13 (17.8%) | 3 (5.2%) |
| $45,000 to $49,999 | 5 (6.9%) | 5 (8.6%) |
| $50,000 to $54,999 | 2 (2.7%) | 6 (10.3%) |
| $55,000 to $64,999 | 15 (20.5%) | 6 (10.3%) |
| $65,000 to $74,999 | 1 (1.4%) | 0 (0.0%) |
| $75,000 to $99,999 | 0 (0.0%) | 0 (0.0%) |
| $100,000+ | 0 (0.0%) | 0 (0.0%) |
| Total | 73 (100.0%) | 58 (100.0%) |
Earnings by Sex by Educational Attainment in Paisley
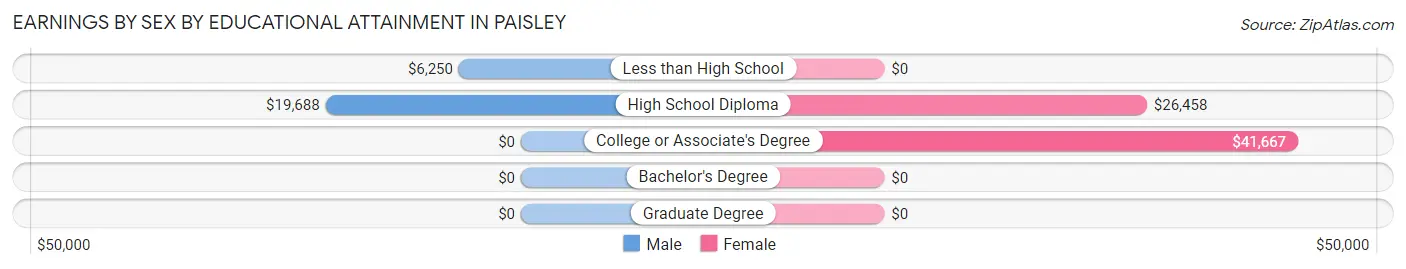
| Educational Attainment | Male Income | Female Income |
| Less than High School | $6,250 | $0 |
| High School Diploma | $19,688 | $26,458 |
| College or Associate's Degree | - | - |
| Bachelor's Degree | - | - |
| Graduate Degree | - | - |
| Total | - | - |
Family Income in Paisley
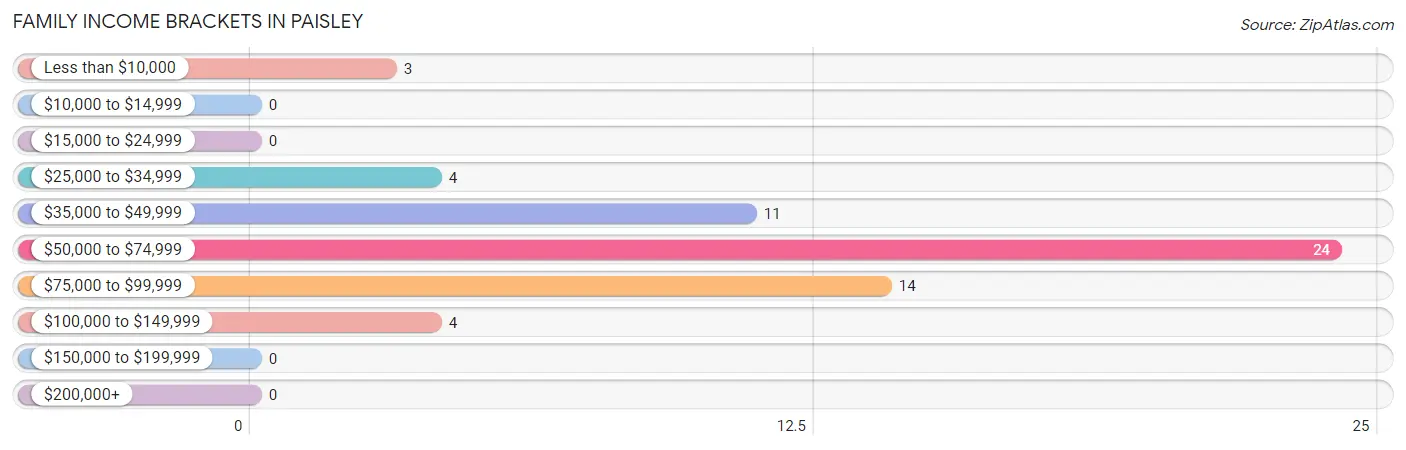
Family Income Brackets in Paisley
According to the Paisley family income data, there are 24 families falling into the $50,000 to $74,999 income range, which is the most common income bracket and makes up 40.0% of all families.
| Income Bracket | # Families | % Families |
| Less than $10,000 | 3 | 5.0% |
| $10,000 to $14,999 | 0 | 0.0% |
| $15,000 to $24,999 | 0 | 0.0% |
| $25,000 to $34,999 | 4 | 6.7% |
| $35,000 to $49,999 | 11 | 18.3% |
| $50,000 to $74,999 | 24 | 40.0% |
| $75,000 to $99,999 | 14 | 23.3% |
| $100,000 to $149,999 | 4 | 6.7% |
| $150,000 to $199,999 | 0 | 0.0% |
| $200,000+ | 0 | 0.0% |
Family Income by Famaliy Size in Paisley
4-person families (12 | 20.0%) account for the highest median family income in Paisley with $65,833 per family, while 2-person families (20 | 33.3%) have the highest median income of $21,875 per family member.
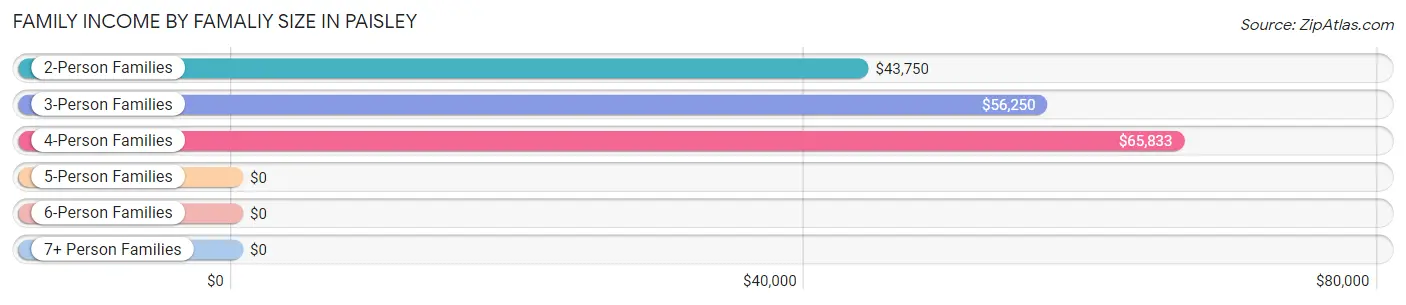
| Income Bracket | # Families | Median Income |
| 2-Person Families | 20 (33.3%) | $43,750 |
| 3-Person Families | 12 (20.0%) | $56,250 |
| 4-Person Families | 12 (20.0%) | $65,833 |
| 5-Person Families | 10 (16.7%) | $0 |
| 6-Person Families | 6 (10.0%) | $0 |
| 7+ Person Families | 0 (0.0%) | $0 |
| Total | 60 (100.0%) | $61,750 |
Family Income by Number of Earners in Paisley
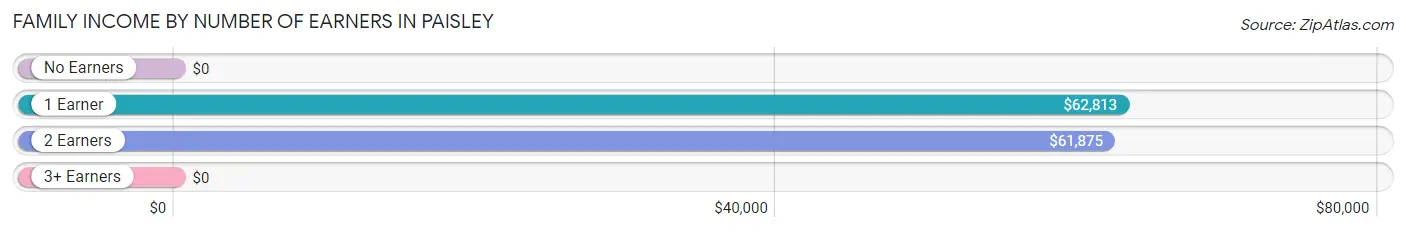
| Number of Earners | # Families | Median Income |
| No Earners | 5 (8.3%) | $0 |
| 1 Earner | 25 (41.7%) | $62,813 |
| 2 Earners | 29 (48.3%) | $61,875 |
| 3+ Earners | 1 (1.7%) | $0 |
| Total | 60 (100.0%) | $61,750 |
Household Income in Paisley
Household Income Brackets in Paisley
With 34 households falling in the category, the $50,000 to $74,999 income range is the most frequent in Paisley, accounting for 29.6% of all households.
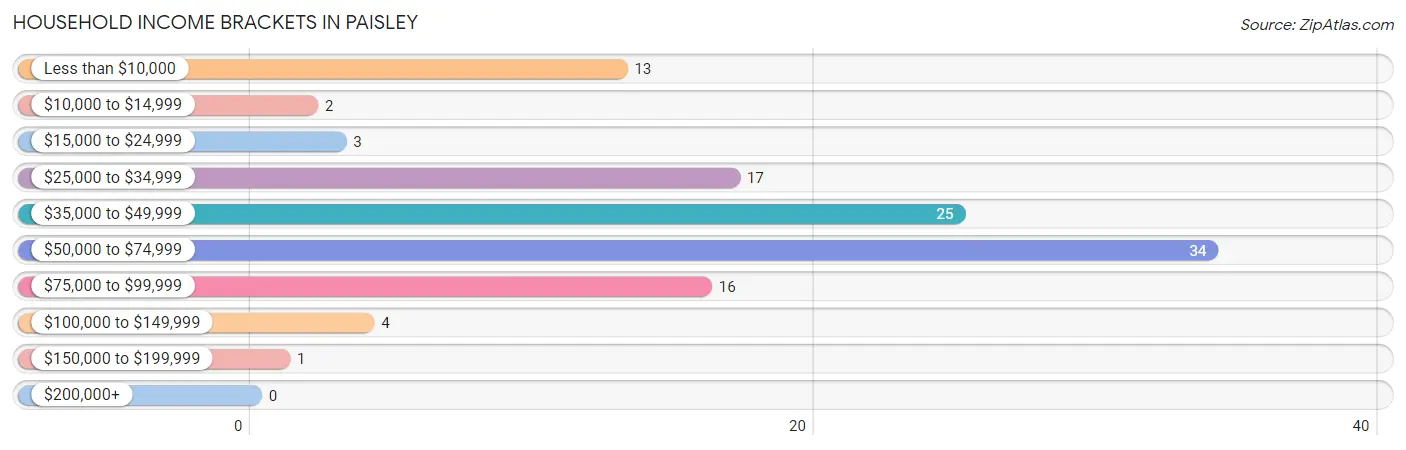
| Income Bracket | # Households | % Households |
| Less than $10,000 | 13 | 11.3% |
| $10,000 to $14,999 | 2 | 1.7% |
| $15,000 to $24,999 | 3 | 2.6% |
| $25,000 to $34,999 | 17 | 14.8% |
| $35,000 to $49,999 | 25 | 21.7% |
| $50,000 to $74,999 | 34 | 29.6% |
| $75,000 to $99,999 | 16 | 13.9% |
| $100,000 to $149,999 | 4 | 3.5% |
| $150,000 to $199,999 | 1 | 0.9% |
| $200,000+ | 0 | 0.0% |
Household Income by Householder Age in Paisley
The median household income in Paisley is $44,609, with the highest median household income of $64,375 found in the 15 to 24 years age bracket for the primary householder. A total of 10 households (8.7%) fall into this category. Meanwhile, the 45 to 64 years age bracket for the primary householder has the lowest median household income of $36,250, with 34 households (29.6%) in this group.
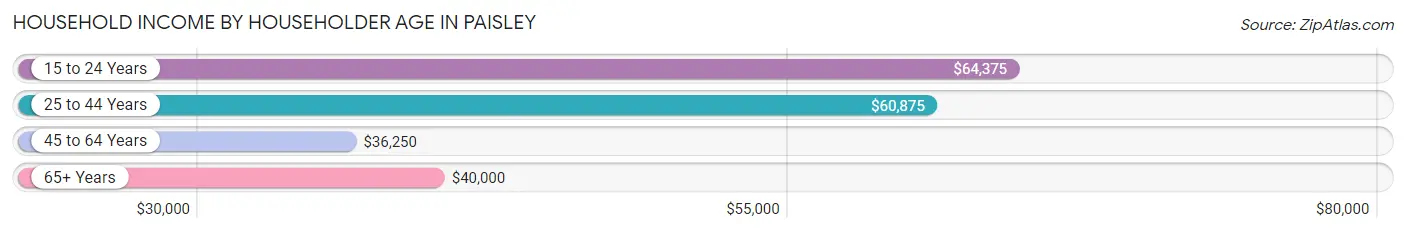
| Income Bracket | # Households | Median Income |
| 15 to 24 Years | 10 (8.7%) | $64,375 |
| 25 to 44 Years | 31 (27.0%) | $60,875 |
| 45 to 64 Years | 34 (29.6%) | $36,250 |
| 65+ Years | 40 (34.8%) | $40,000 |
| Total | 115 (100.0%) | $44,609 |
Poverty in Paisley
Income Below Poverty by Sex and Age in Paisley
With 13.4% poverty level for males and 9.9% for females among the residents of Paisley, 25 to 34 year old males and 45 to 54 year old females are the most vulnerable to poverty, with 8 males (44.4%) and 2 females (40.0%) in their respective age groups living below the poverty level.
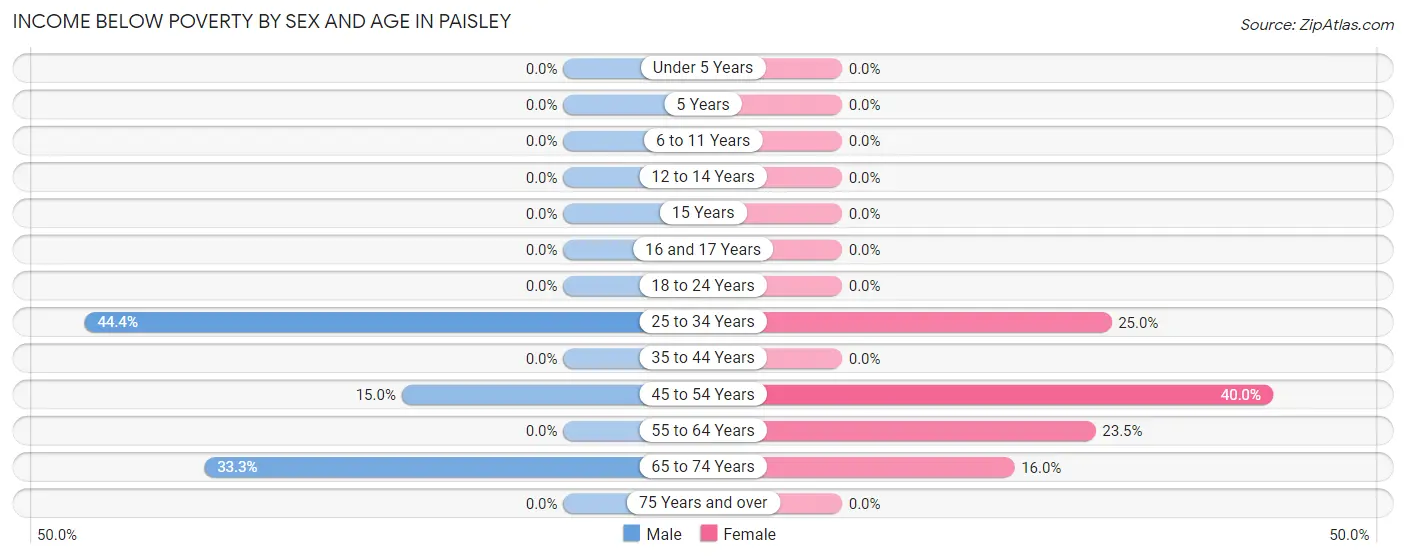
| Age Bracket | Male | Female |
| Under 5 Years | 0 (0.0%) | 0 (0.0%) |
| 5 Years | 0 (0.0%) | 0 (0.0%) |
| 6 to 11 Years | 0 (0.0%) | 0 (0.0%) |
| 12 to 14 Years | 0 (0.0%) | 0 (0.0%) |
| 15 Years | 0 (0.0%) | 0 (0.0%) |
| 16 and 17 Years | 0 (0.0%) | 0 (0.0%) |
| 18 to 24 Years | 0 (0.0%) | 0 (0.0%) |
| 25 to 34 Years | 8 (44.4%) | 4 (25.0%) |
| 35 to 44 Years | 0 (0.0%) | 0 (0.0%) |
| 45 to 54 Years | 3 (15.0%) | 2 (40.0%) |
| 55 to 64 Years | 0 (0.0%) | 4 (23.5%) |
| 65 to 74 Years | 8 (33.3%) | 4 (16.0%) |
| 75 Years and over | 0 (0.0%) | 0 (0.0%) |
| Total | 19 (13.4%) | 14 (9.9%) |
Income Above Poverty by Sex and Age in Paisley
According to the poverty statistics in Paisley, males aged under 5 years and females aged under 5 years are the age groups that are most secure financially, with 100.0% of males and 100.0% of females in these age groups living above the poverty line.
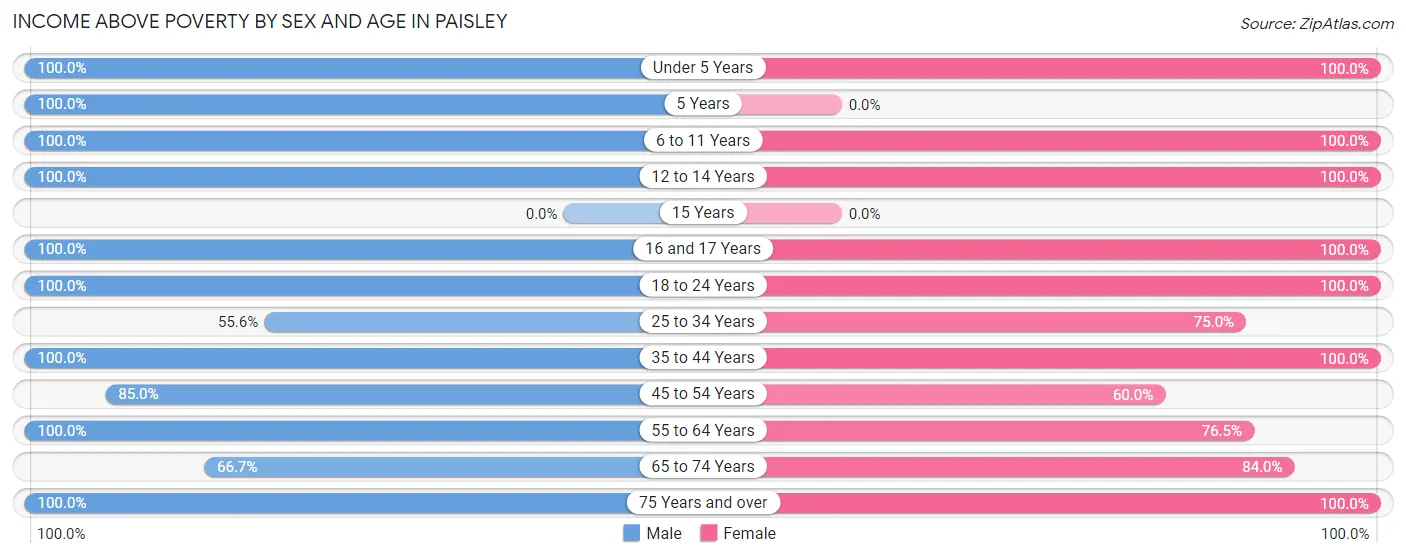
| Age Bracket | Male | Female |
| Under 5 Years | 12 (100.0%) | 12 (100.0%) |
| 5 Years | 4 (100.0%) | 0 (0.0%) |
| 6 to 11 Years | 18 (100.0%) | 18 (100.0%) |
| 12 to 14 Years | 9 (100.0%) | 9 (100.0%) |
| 15 Years | 0 (0.0%) | 0 (0.0%) |
| 16 and 17 Years | 1 (100.0%) | 1 (100.0%) |
| 18 to 24 Years | 20 (100.0%) | 17 (100.0%) |
| 25 to 34 Years | 10 (55.6%) | 12 (75.0%) |
| 35 to 44 Years | 10 (100.0%) | 13 (100.0%) |
| 45 to 54 Years | 17 (85.0%) | 3 (60.0%) |
| 55 to 64 Years | 4 (100.0%) | 13 (76.5%) |
| 65 to 74 Years | 16 (66.7%) | 21 (84.0%) |
| 75 Years and over | 2 (100.0%) | 8 (100.0%) |
| Total | 123 (86.6%) | 127 (90.1%) |
Income Below Poverty Among Married-Couple Families in Paisley
The poverty statistics for married-couple families in Paisley show that 2.1% or 1 of the total 47 families live below the poverty line. Families with no children have the highest poverty rate of 5.0%, comprising of 1 families. On the other hand, families with 1 or 2 children have the lowest poverty rate of 0.0%, which includes 0 families.
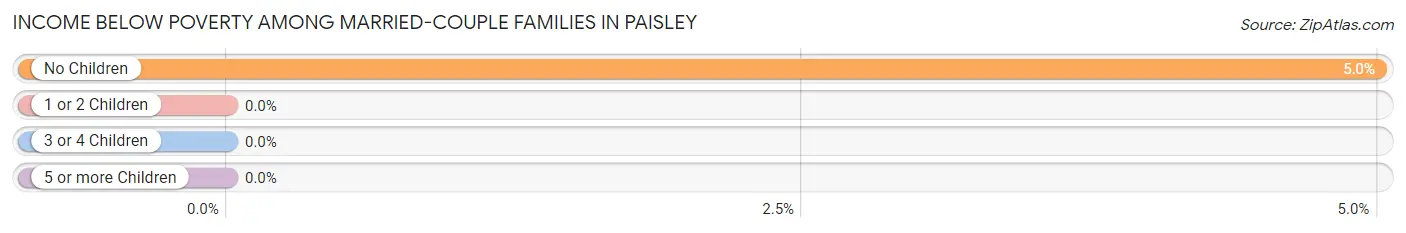
| Children | Above Poverty | Below Poverty |
| No Children | 19 (95.0%) | 1 (5.0%) |
| 1 or 2 Children | 16 (100.0%) | 0 (0.0%) |
| 3 or 4 Children | 11 (100.0%) | 0 (0.0%) |
| 5 or more Children | 0 (0.0%) | 0 (0.0%) |
| Total | 46 (97.9%) | 1 (2.1%) |
Income Below Poverty Among Single-Parent Households in Paisley
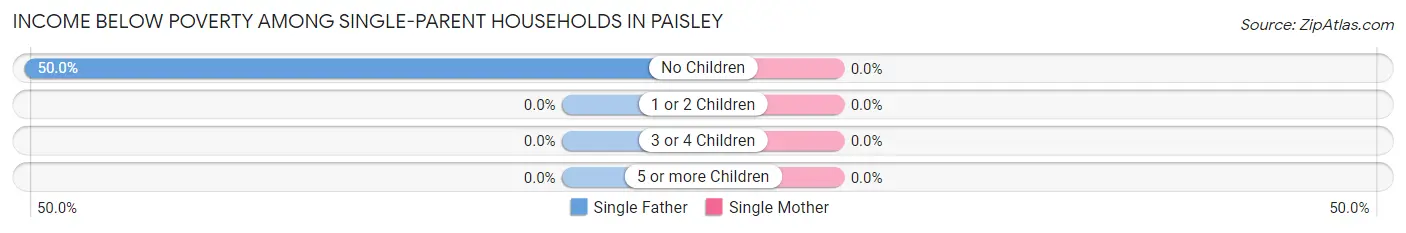
| Children | Single Father | Single Mother |
| No Children | 2 (50.0%) | 0 (0.0%) |
| 1 or 2 Children | 0 (0.0%) | 0 (0.0%) |
| 3 or 4 Children | 0 (0.0%) | 0 (0.0%) |
| 5 or more Children | 0 (0.0%) | 0 (0.0%) |
| Total | 2 (50.0%) | 0 (0.0%) |
Income Below Poverty Among Married-Couple vs Single-Parent Households in Paisley
The poverty data for Paisley shows that 1 of the married-couple family households (2.1%) and 2 of the single-parent households (15.4%) are living below the poverty level. Within the married-couple family households, those with no children have the highest poverty rate, with 1 households (5.0%) falling below the poverty line. Among the single-parent households, those with no children have the highest poverty rate, with 2 household (50.0%) living below poverty.
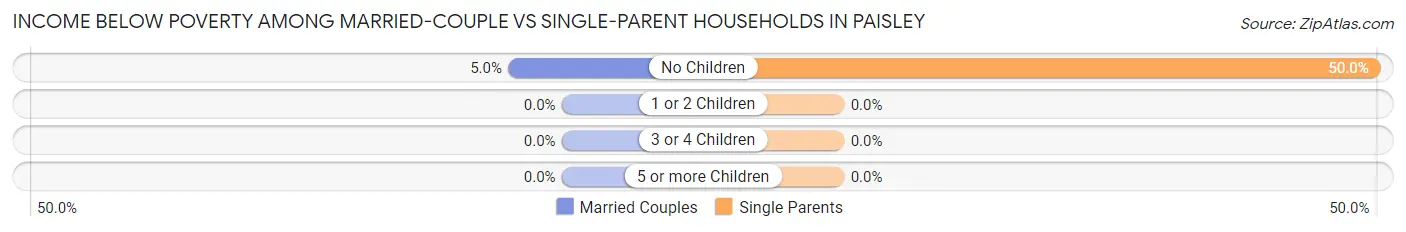
| Children | Married-Couple Families | Single-Parent Households |
| No Children | 1 (5.0%) | 2 (50.0%) |
| 1 or 2 Children | 0 (0.0%) | 0 (0.0%) |
| 3 or 4 Children | 0 (0.0%) | 0 (0.0%) |
| 5 or more Children | 0 (0.0%) | 0 (0.0%) |
| Total | 1 (2.1%) | 2 (15.4%) |
Race in Paisley
The most populous races in Paisley are White / Caucasian (278 | 98.2%), Hispanic or Latino (5 | 1.8%), and Two or more Races (5 | 1.8%).
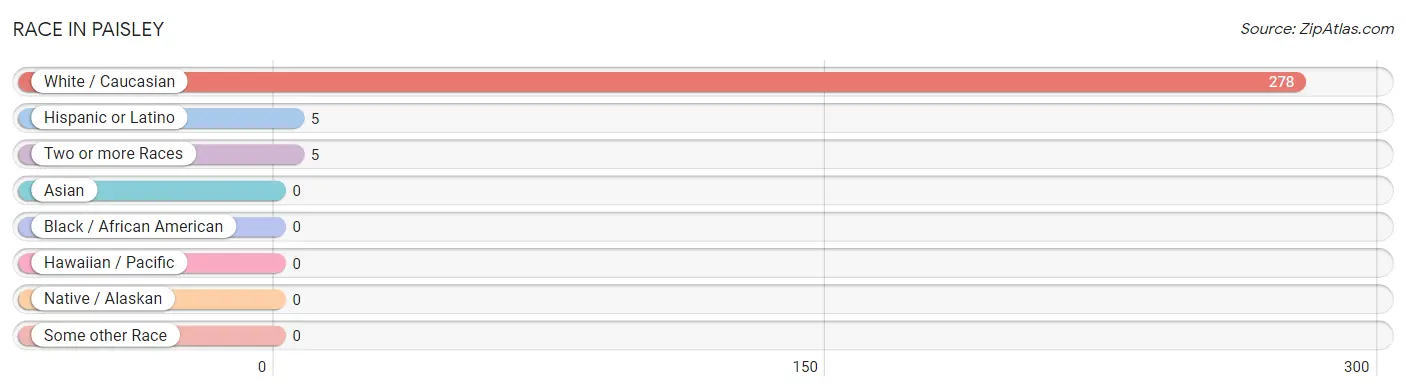
| Race | # Population | % Population |
| Asian | 0 | 0.0% |
| Black / African American | 0 | 0.0% |
| Hawaiian / Pacific | 0 | 0.0% |
| Hispanic or Latino | 5 | 1.8% |
| Native / Alaskan | 0 | 0.0% |
| White / Caucasian | 278 | 98.2% |
| Two or more Races | 5 | 1.8% |
| Some other Race | 0 | 0.0% |
| Total | 283 | 100.0% |
Ancestry in Paisley
The most populous ancestries reported in Paisley are German (90 | 31.8%), Irish (54 | 19.1%), English (20 | 7.1%), Russian (17 | 6.0%), and European (15 | 5.3%), together accounting for 69.3% of all Paisley residents.
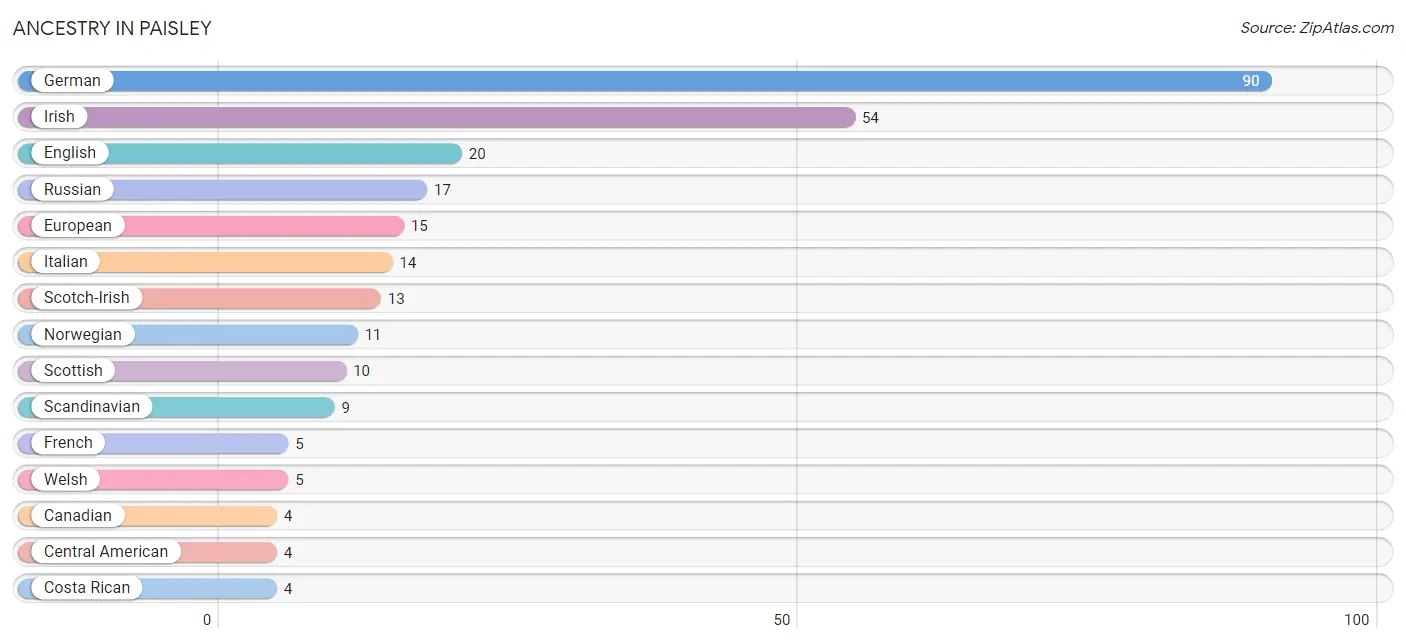
| Ancestry | # Population | % Population |
| American | 2 | 0.7% |
| Basque | 3 | 1.1% |
| Canadian | 4 | 1.4% |
| Central American | 4 | 1.4% |
| Costa Rican | 4 | 1.4% |
| Dutch | 4 | 1.4% |
| English | 20 | 7.1% |
| European | 15 | 5.3% |
| French | 5 | 1.8% |
| German | 90 | 31.8% |
| Irish | 54 | 19.1% |
| Italian | 14 | 5.0% |
| Northern European | 4 | 1.4% |
| Norwegian | 11 | 3.9% |
| Polish | 2 | 0.7% |
| Russian | 17 | 6.0% |
| Scandinavian | 9 | 3.2% |
| Scotch-Irish | 13 | 4.6% |
| Scottish | 10 | 3.5% |
| Spanish | 1 | 0.4% |
| Swedish | 3 | 1.1% |
| Swiss | 2 | 0.7% |
| Welsh | 5 | 1.8% | View All 23 Rows |
Immigrants in Paisley
The most numerous immigrant groups reported in Paisley came from , and Canada (4 | 1.4%), together accounting for 1.4% of all Paisley residents.

| Immigration Origin | # Population | % Population |
| Canada | 4 | 1.4% | View All 1 Rows |
Sex and Age in Paisley
Sex and Age in Paisley
The most populous age groups in Paisley are 5 to 9 Years (22 | 15.5%) for men and 65 to 69 Years (18 | 12.8%) for women.
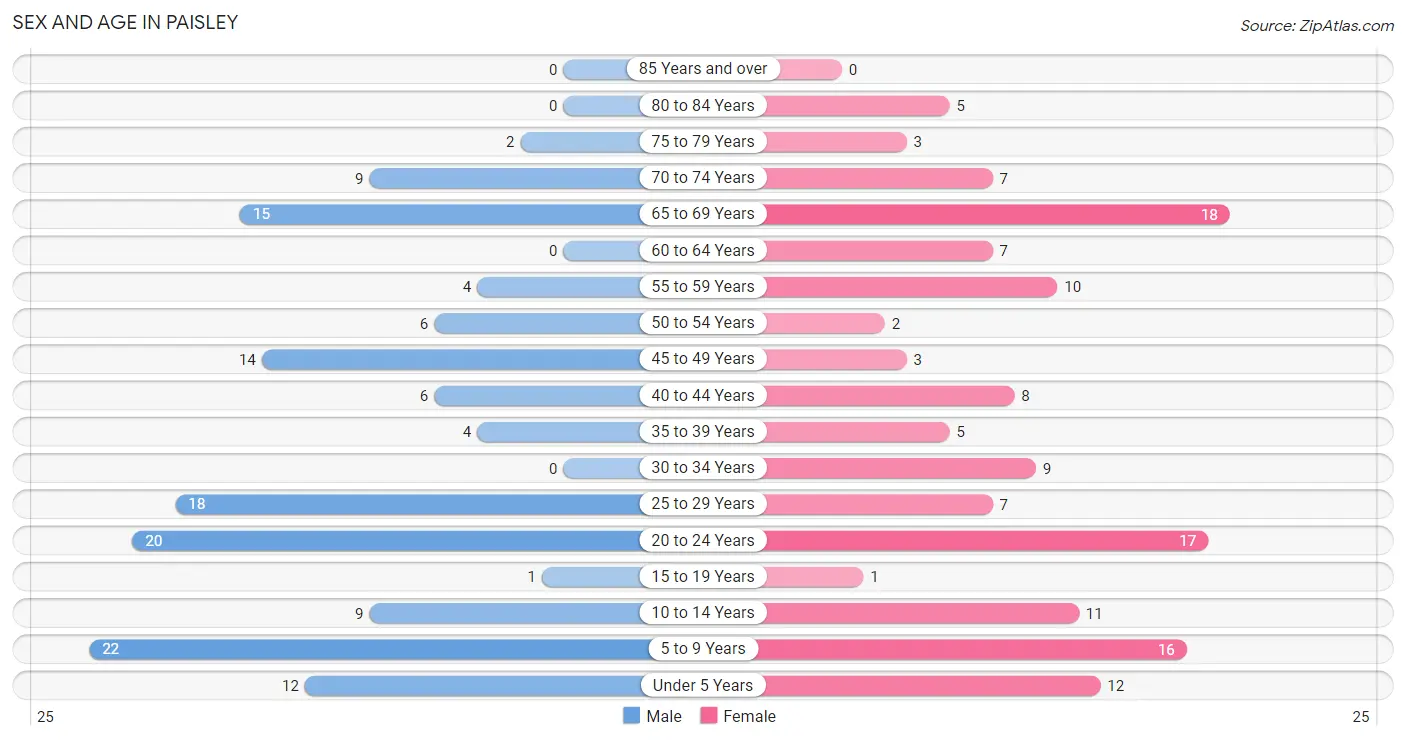
| Age Bracket | Male | Female |
| Under 5 Years | 12 (8.5%) | 12 (8.5%) |
| 5 to 9 Years | 22 (15.5%) | 16 (11.4%) |
| 10 to 14 Years | 9 (6.3%) | 11 (7.8%) |
| 15 to 19 Years | 1 (0.7%) | 1 (0.7%) |
| 20 to 24 Years | 20 (14.1%) | 17 (12.1%) |
| 25 to 29 Years | 18 (12.7%) | 7 (5.0%) |
| 30 to 34 Years | 0 (0.0%) | 9 (6.4%) |
| 35 to 39 Years | 4 (2.8%) | 5 (3.5%) |
| 40 to 44 Years | 6 (4.2%) | 8 (5.7%) |
| 45 to 49 Years | 14 (9.9%) | 3 (2.1%) |
| 50 to 54 Years | 6 (4.2%) | 2 (1.4%) |
| 55 to 59 Years | 4 (2.8%) | 10 (7.1%) |
| 60 to 64 Years | 0 (0.0%) | 7 (5.0%) |
| 65 to 69 Years | 15 (10.6%) | 18 (12.8%) |
| 70 to 74 Years | 9 (6.3%) | 7 (5.0%) |
| 75 to 79 Years | 2 (1.4%) | 3 (2.1%) |
| 80 to 84 Years | 0 (0.0%) | 5 (3.5%) |
| 85 Years and over | 0 (0.0%) | 0 (0.0%) |
| Total | 142 (100.0%) | 141 (100.0%) |
Families and Households in Paisley
Median Family Size in Paisley
The median family size in Paisley is 3.68 persons per family, with single female/mother families (9 | 15.0%) accounting for the largest median family size of 5.33 persons per family. On the other hand, married-couple families (47 | 78.3%) represent the smallest median family size with 3.30 persons per family.
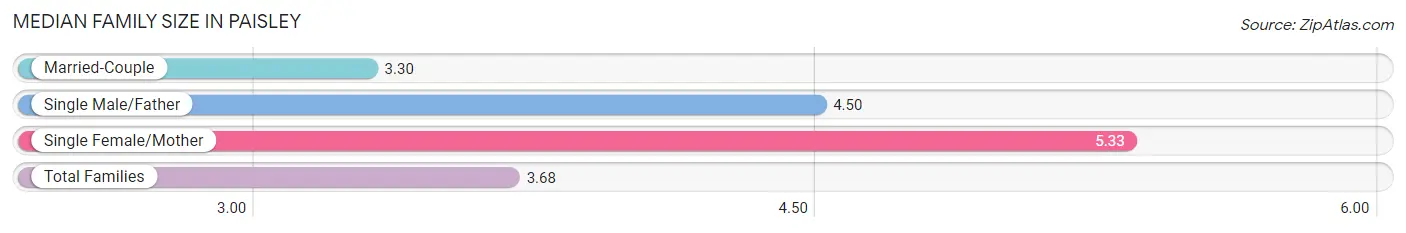
| Family Type | # Families | Family Size |
| Married-Couple | 47 (78.3%) | 3.30 |
| Single Male/Father | 4 (6.7%) | 4.50 |
| Single Female/Mother | 9 (15.0%) | 5.33 |
| Total Families | 60 (100.0%) | 3.68 |
Median Household Size in Paisley
The median household size in Paisley is 2.43 persons per household, with single female/mother households (9 | 7.8%) accounting for the largest median household size of 5.33 persons per household. non-family households (55 | 47.8%) represent the smallest median household size with 1.05 persons per household.
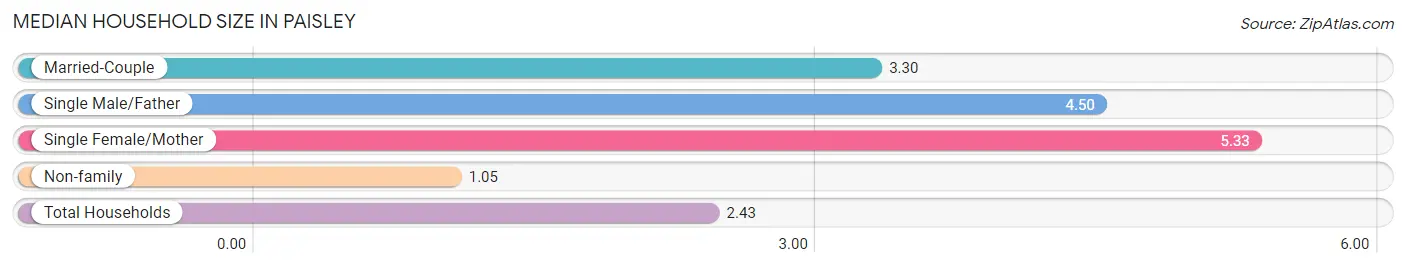
| Household Type | # Households | Household Size |
| Married-Couple | 47 (40.9%) | 3.30 |
| Single Male/Father | 4 (3.5%) | 4.50 |
| Single Female/Mother | 9 (7.8%) | 5.33 |
| Non-family | 55 (47.8%) | 1.05 |
| Total Households | 115 (100.0%) | 2.43 |
Household Size by Marriage Status in Paisley
Out of a total of 115 households in Paisley, 60 (52.2%) are family households, while 55 (47.8%) are nonfamily households. The most numerous type of family households are 2-person households, comprising 20, and the most common type of nonfamily households are 1-person households, comprising 52.
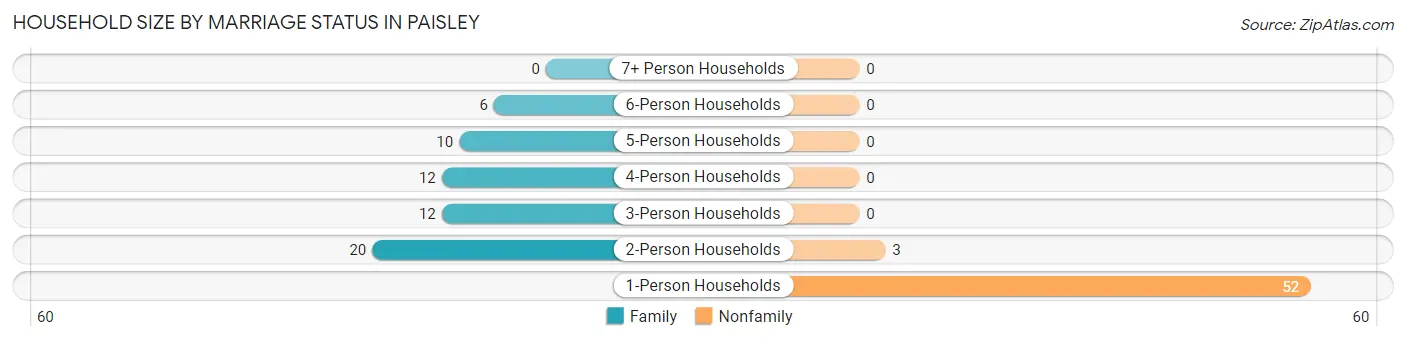
| Household Size | Family Households | Nonfamily Households |
| 1-Person Households | - | 52 (45.2%) |
| 2-Person Households | 20 (17.4%) | 3 (2.6%) |
| 3-Person Households | 12 (10.4%) | 0 (0.0%) |
| 4-Person Households | 12 (10.4%) | 0 (0.0%) |
| 5-Person Households | 10 (8.7%) | 0 (0.0%) |
| 6-Person Households | 6 (5.2%) | 0 (0.0%) |
| 7+ Person Households | 0 (0.0%) | 0 (0.0%) |
| Total | 60 (52.2%) | 55 (47.8%) |
Female Fertility in Paisley
Fertility by Age in Paisley
Average fertility rate in Paisley is 340.0 births per 1,000 women. Women in the age bracket of 20 to 34 years have the highest fertility rate with 515.0 births per 1,000 women. Women in the age bracket of 20 to 34 years acount for 100.0% of all women with births.
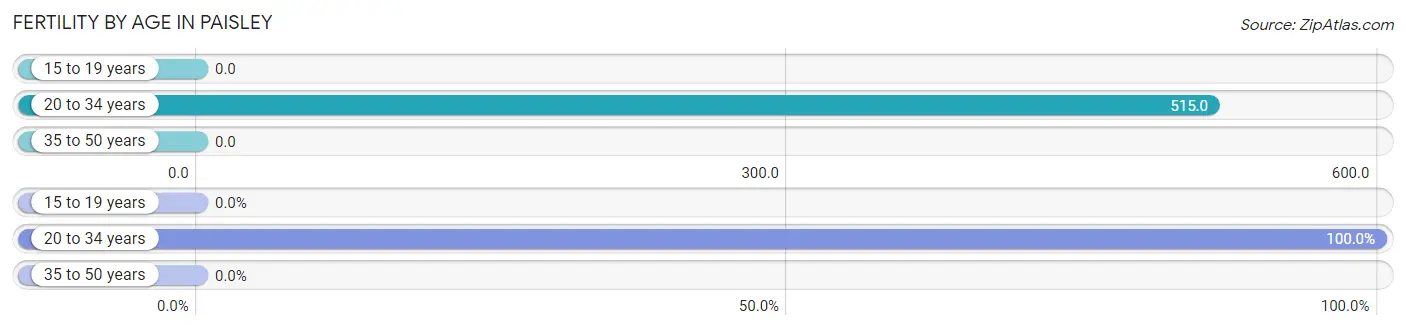
| Age Bracket | Women with Births | Births / 1,000 Women |
| 15 to 19 years | 0 (0.0%) | 0.0 |
| 20 to 34 years | 17 (100.0%) | 515.0 |
| 35 to 50 years | 0 (0.0%) | 0.0 |
| Total | 17 (100.0%) | 340.0 |
Fertility by Age by Marriage Status in Paisley
88.2% of women with births (17) in Paisley are married. The highest percentage of unmarried women with births falls into 20 to 34 years age bracket with 11.8% of them unmarried at the time of birth, while the lowest percentage of unmarried women with births belong to 20 to 34 years age bracket with 11.8% of them unmarried.
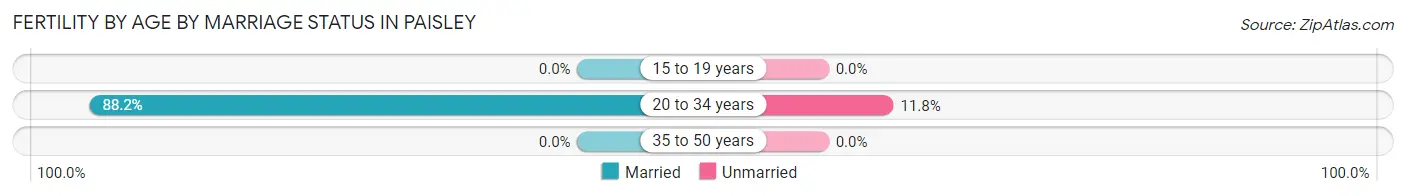
| Age Bracket | Married | Unmarried |
| 15 to 19 years | 0 (0.0%) | 0 (0.0%) |
| 20 to 34 years | 15 (88.2%) | 2 (11.8%) |
| 35 to 50 years | 0 (0.0%) | 0 (0.0%) |
| Total | 15 (88.2%) | 2 (11.8%) |
Fertility by Education in Paisley
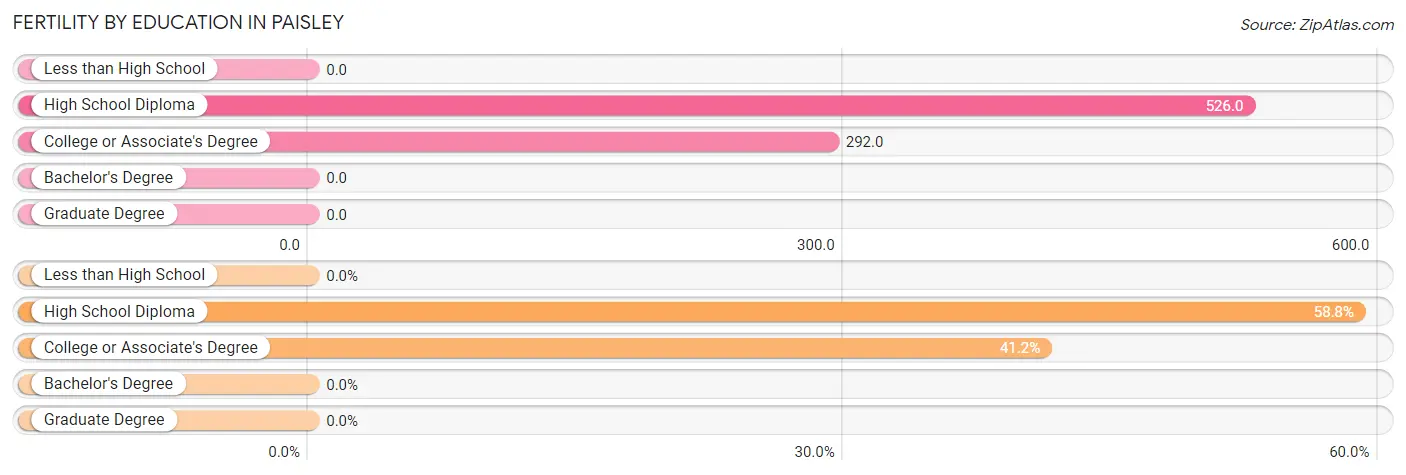
| Educational Attainment | Women with Births | Births / 1,000 Women |
| Less than High School | 0 (0.0%) | 0.0 |
| High School Diploma | 10 (58.8%) | 526.0 |
| College or Associate's Degree | 7 (41.2%) | 292.0 |
| Bachelor's Degree | 0 (0.0%) | 0.0 |
| Graduate Degree | 0 (0.0%) | 0.0 |
| Total | 17 (100.0%) | 340.0 |
Fertility by Education by Marriage Status in Paisley
11.8% of women with births in Paisley are unmarried. Women with the educational attainment of college or associate's degree are most likely to be married with 100.0% of them married at childbirth, while women with the educational attainment of high school diploma are least likely to be married with 20.0% of them unmarried at childbirth.
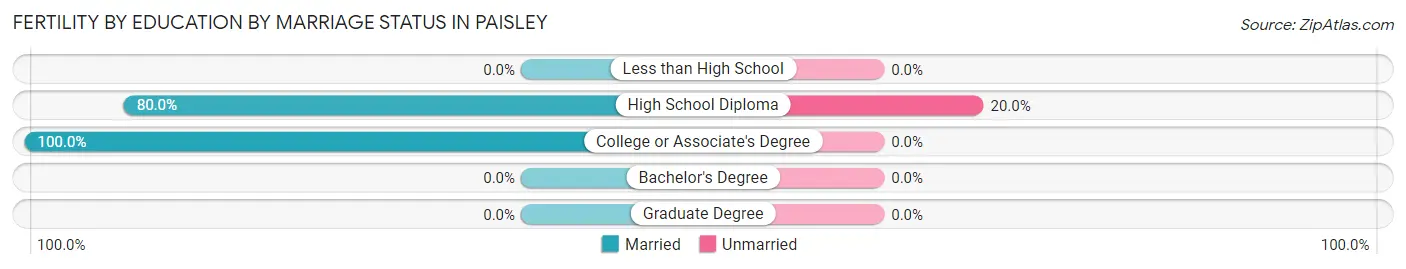
| Educational Attainment | Married | Unmarried |
| Less than High School | 0 (0.0%) | 0 (0.0%) |
| High School Diploma | 8 (80.0%) | 2 (20.0%) |
| College or Associate's Degree | 7 (100.0%) | 0 (0.0%) |
| Bachelor's Degree | 0 (0.0%) | 0 (0.0%) |
| Graduate Degree | 0 (0.0%) | 0 (0.0%) |
| Total | 15 (88.2%) | 2 (11.8%) |
Employment Characteristics in Paisley
Employment by Class of Employer in Paisley
Among the 102 employed individuals in Paisley, private company employees (52 | 51.0%), self-employed (not incorporated) (18 | 17.6%), and federal government employees (11 | 10.8%) make up the most common classes of employment.
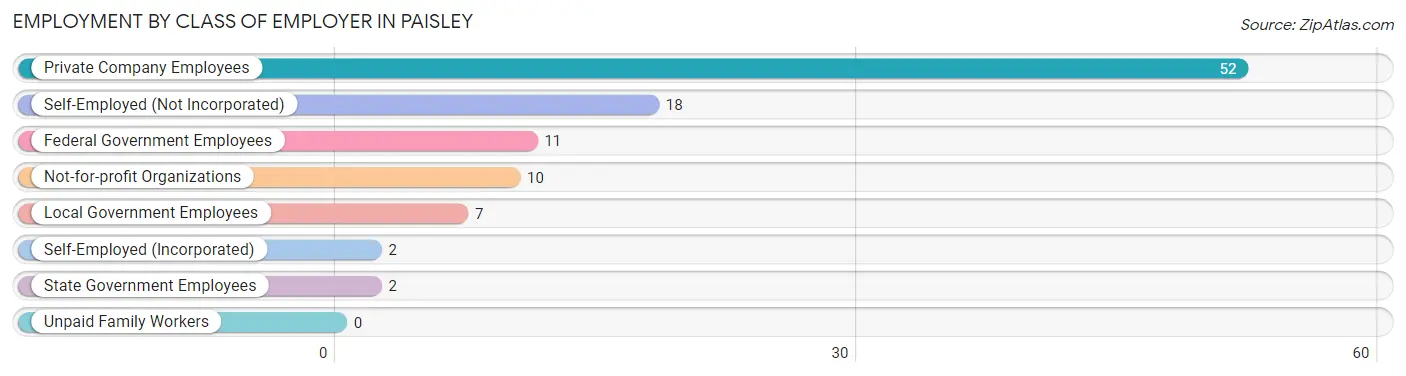
| Employer Class | # Employees | % Employees |
| Private Company Employees | 52 | 51.0% |
| Self-Employed (Incorporated) | 2 | 2.0% |
| Self-Employed (Not Incorporated) | 18 | 17.6% |
| Not-for-profit Organizations | 10 | 9.8% |
| Local Government Employees | 7 | 6.9% |
| State Government Employees | 2 | 2.0% |
| Federal Government Employees | 11 | 10.8% |
| Unpaid Family Workers | 0 | 0.0% |
| Total | 102 | 100.0% |
Employment Status by Age in Paisley
According to the labor force statistics for Paisley, out of the total population over 16 years of age (201), 56.7% or 114 individuals are in the labor force, with 8.8% or 10 of them unemployed. The age group with the highest labor force participation rate is 30 to 34 years, with 100.0% or 9 individuals in the labor force. Within the labor force, the 25 to 29 years age range has the highest percentage of unemployed individuals, with 76.9% or 10 of them being unemployed.
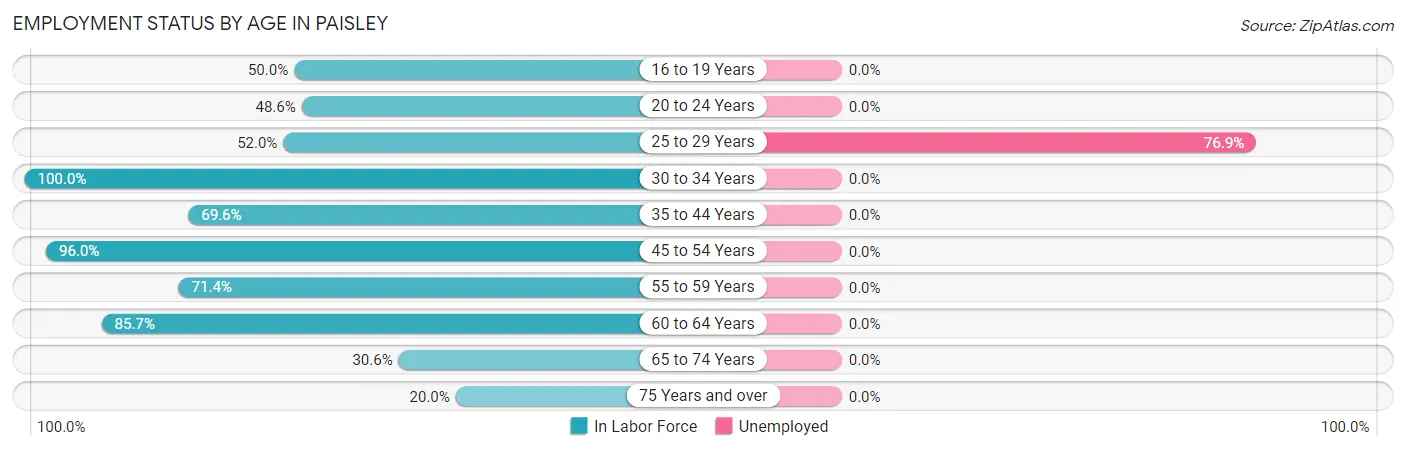
| Age Bracket | In Labor Force | Unemployed |
| 16 to 19 Years | 1 (50.0%) | 0 (0.0%) |
| 20 to 24 Years | 18 (48.6%) | 0 (0.0%) |
| 25 to 29 Years | 13 (52.0%) | 10 (76.9%) |
| 30 to 34 Years | 9 (100.0%) | 0 (0.0%) |
| 35 to 44 Years | 16 (69.6%) | 0 (0.0%) |
| 45 to 54 Years | 24 (96.0%) | 0 (0.0%) |
| 55 to 59 Years | 10 (71.4%) | 0 (0.0%) |
| 60 to 64 Years | 6 (85.7%) | 0 (0.0%) |
| 65 to 74 Years | 15 (30.6%) | 0 (0.0%) |
| 75 Years and over | 2 (20.0%) | 0 (0.0%) |
| Total | 114 (56.7%) | 10 (8.8%) |
Employment Status by Educational Attainment in Paisley
According to labor force statistics for Paisley, 75.7% of individuals (78) out of the total population between 25 and 64 years of age (103) are in the labor force, with 12.8% or 10 of them being unemployed. The group with the highest labor force participation rate are those with the educational attainment of high school diploma, with 92.6% or 25 individuals in the labor force. Within the labor force, individuals with college / associate degree education have the highest percentage of unemployment, with 31.3% or 10 of them being unemployed.
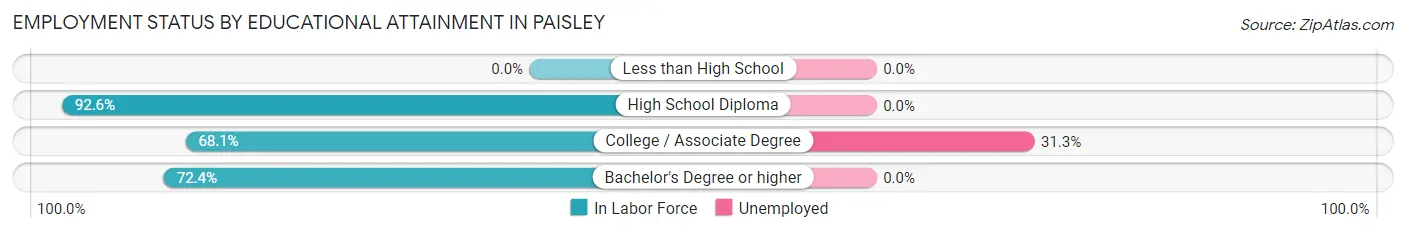
| Educational Attainment | In Labor Force | Unemployed |
| Less than High School | 0 (0.0%) | 0 (0.0%) |
| High School Diploma | 25 (92.6%) | 0 (0.0%) |
| College / Associate Degree | 32 (68.1%) | 15 (31.3%) |
| Bachelor's Degree or higher | 21 (72.4%) | 0 (0.0%) |
| Total | 78 (75.7%) | 13 (12.8%) |
Employment Occupations by Sex in Paisley
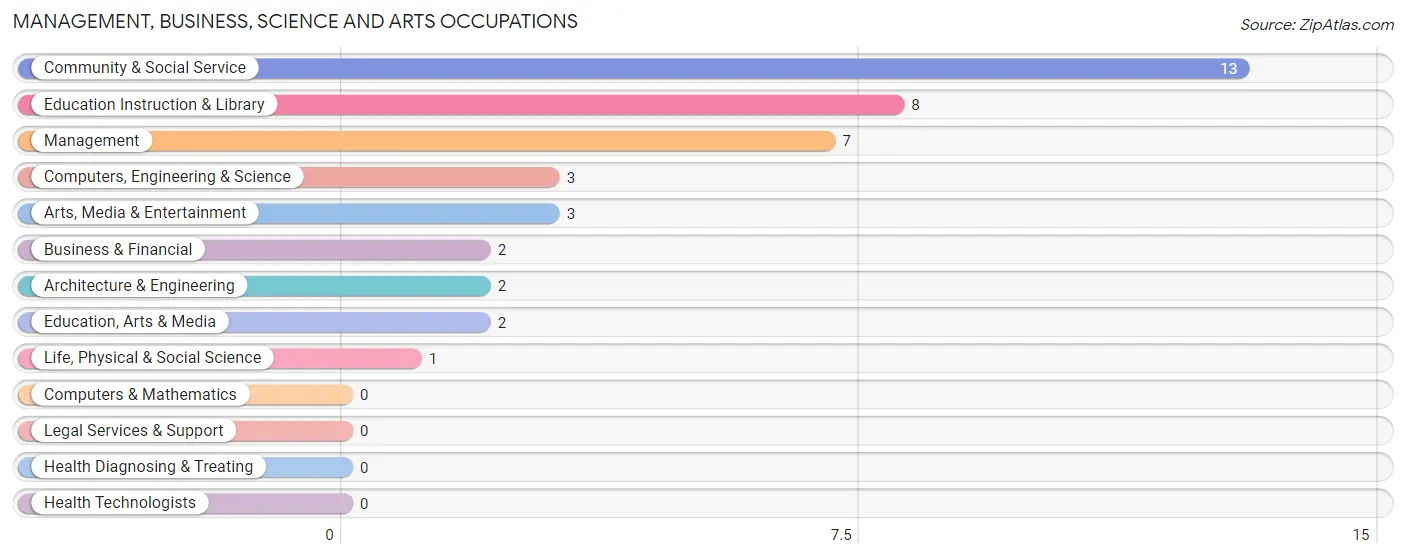
Management, Business, Science and Arts Occupations
The most common Management, Business, Science and Arts occupations in Paisley are Community & Social Service (13 | 12.5%), Education Instruction & Library (8 | 7.7%), Management (7 | 6.7%), Computers, Engineering & Science (3 | 2.9%), and Arts, Media & Entertainment (3 | 2.9%).
Management, Business, Science and Arts Occupations by Sex
Within the Management, Business, Science and Arts occupations in Paisley, the most male-oriented occupations are Management (100.0%), Architecture & Engineering (100.0%), and Education, Arts & Media (100.0%), while the most female-oriented occupations are Business & Financial (100.0%), Life, Physical & Social Science (100.0%), and Arts, Media & Entertainment (100.0%).
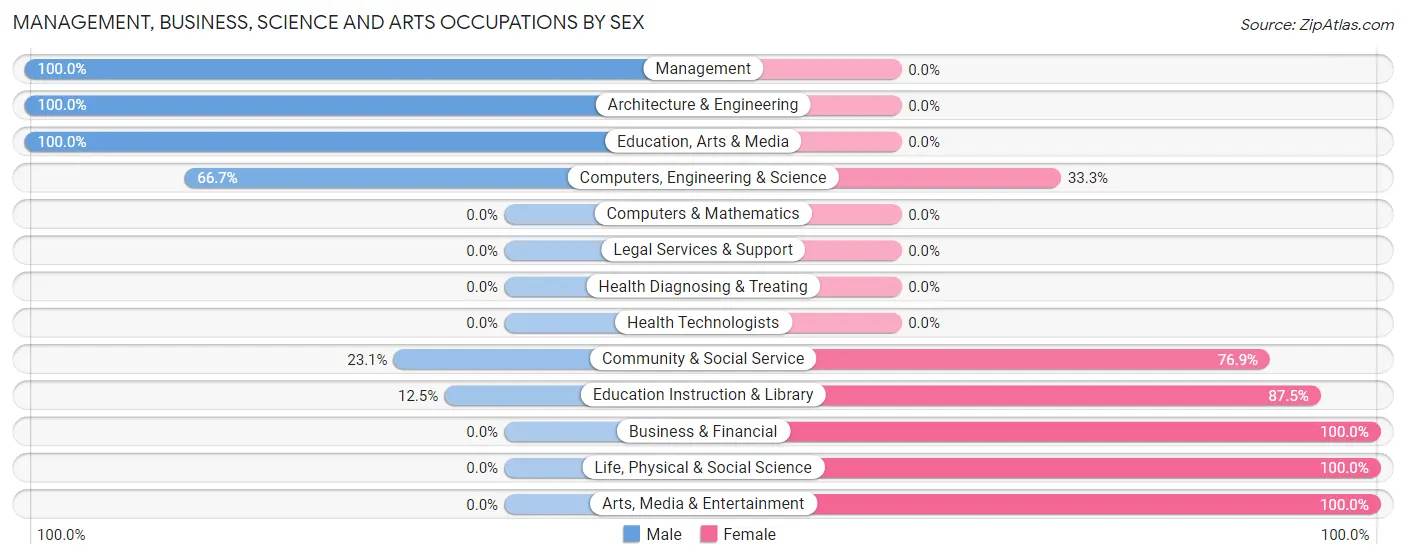
| Occupation | Male | Female |
| Management | 7 (100.0%) | 0 (0.0%) |
| Business & Financial | 0 (0.0%) | 2 (100.0%) |
| Computers, Engineering & Science | 2 (66.7%) | 1 (33.3%) |
| Computers & Mathematics | 0 (0.0%) | 0 (0.0%) |
| Architecture & Engineering | 2 (100.0%) | 0 (0.0%) |
| Life, Physical & Social Science | 0 (0.0%) | 1 (100.0%) |
| Community & Social Service | 3 (23.1%) | 10 (76.9%) |
| Education, Arts & Media | 2 (100.0%) | 0 (0.0%) |
| Legal Services & Support | 0 (0.0%) | 0 (0.0%) |
| Education Instruction & Library | 1 (12.5%) | 7 (87.5%) |
| Arts, Media & Entertainment | 0 (0.0%) | 3 (100.0%) |
| Health Diagnosing & Treating | 0 (0.0%) | 0 (0.0%) |
| Health Technologists | 0 (0.0%) | 0 (0.0%) |
| Total (Category) | 12 (48.0%) | 13 (52.0%) |
| Total (Overall) | 61 (58.7%) | 43 (41.3%) |
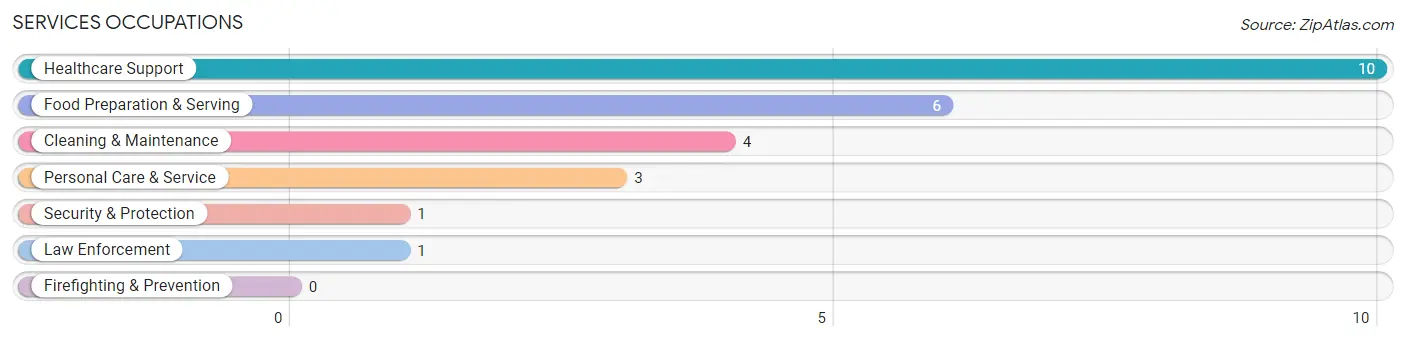
Services Occupations
The most common Services occupations in Paisley are Healthcare Support (10 | 9.6%), Food Preparation & Serving (6 | 5.8%), Cleaning & Maintenance (4 | 3.8%), Personal Care & Service (3 | 2.9%), and Security & Protection (1 | 1.0%).
Services Occupations by Sex
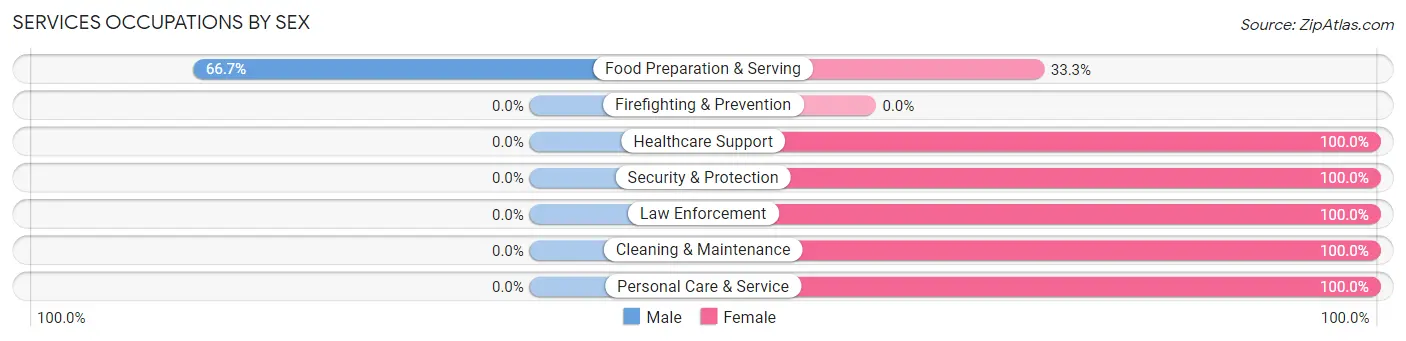
| Occupation | Male | Female |
| Healthcare Support | 0 (0.0%) | 10 (100.0%) |
| Security & Protection | 0 (0.0%) | 1 (100.0%) |
| Firefighting & Prevention | 0 (0.0%) | 0 (0.0%) |
| Law Enforcement | 0 (0.0%) | 1 (100.0%) |
| Food Preparation & Serving | 4 (66.7%) | 2 (33.3%) |
| Cleaning & Maintenance | 0 (0.0%) | 4 (100.0%) |
| Personal Care & Service | 0 (0.0%) | 3 (100.0%) |
| Total (Category) | 4 (16.7%) | 20 (83.3%) |
| Total (Overall) | 61 (58.7%) | 43 (41.3%) |
Sales and Office Occupations
The most common Sales and Office occupations in Paisley are , and Sales & Related (10 | 9.6%).
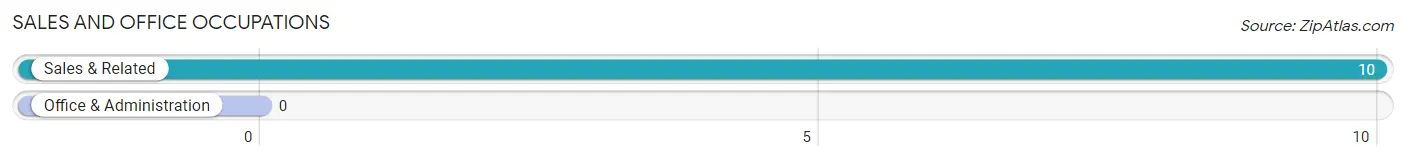
Sales and Office Occupations by Sex
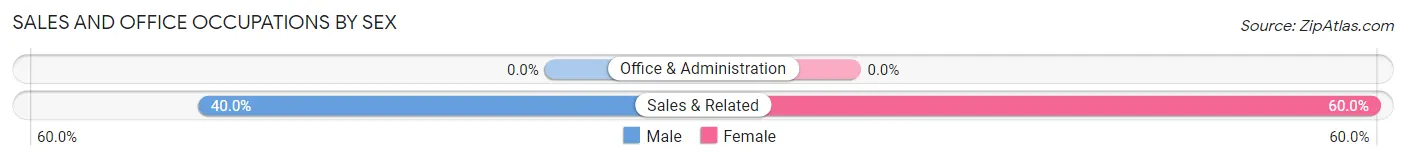
| Occupation | Male | Female |
| Sales & Related | 4 (40.0%) | 6 (60.0%) |
| Office & Administration | 0 (0.0%) | 0 (0.0%) |
| Total (Category) | 4 (40.0%) | 6 (60.0%) |
| Total (Overall) | 61 (58.7%) | 43 (41.3%) |
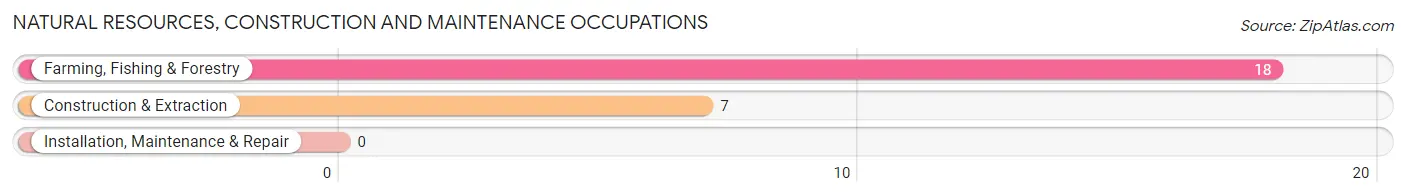
Natural Resources, Construction and Maintenance Occupations
The most common Natural Resources, Construction and Maintenance occupations in Paisley are Farming, Fishing & Forestry (18 | 17.3%), and Construction & Extraction (7 | 6.7%).
Natural Resources, Construction and Maintenance Occupations by Sex
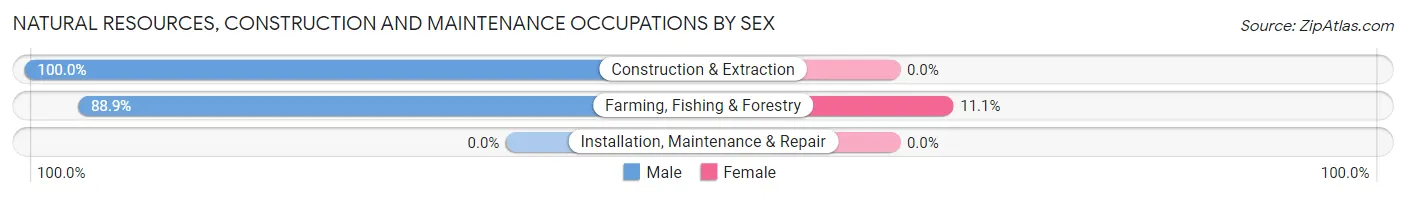
| Occupation | Male | Female |
| Farming, Fishing & Forestry | 16 (88.9%) | 2 (11.1%) |
| Construction & Extraction | 7 (100.0%) | 0 (0.0%) |
| Installation, Maintenance & Repair | 0 (0.0%) | 0 (0.0%) |
| Total (Category) | 23 (92.0%) | 2 (8.0%) |
| Total (Overall) | 61 (58.7%) | 43 (41.3%) |
Production, Transportation and Moving Occupations
The most common Production, Transportation and Moving occupations in Paisley are Transportation (12 | 11.5%), Production (4 | 3.8%), and Material Moving (4 | 3.8%).
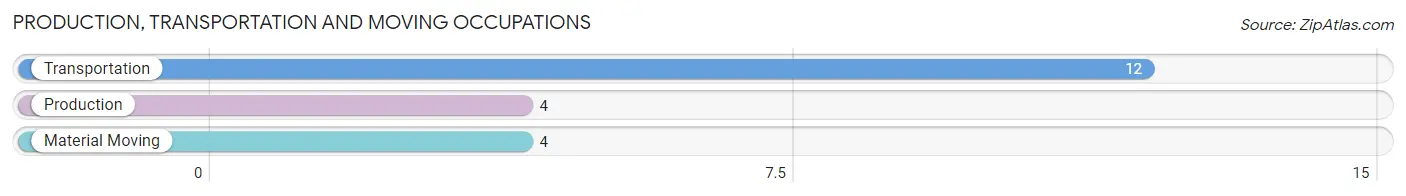
Production, Transportation and Moving Occupations by Sex
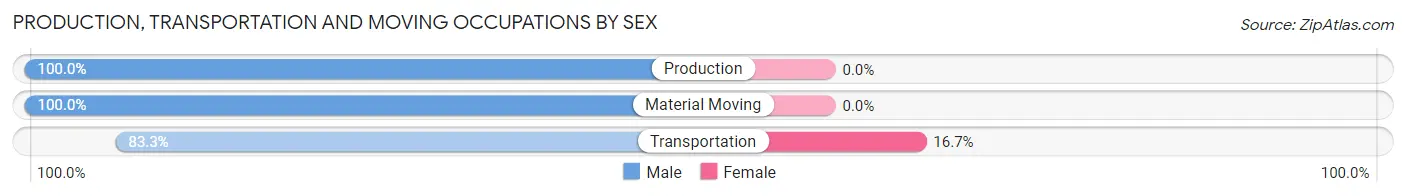
| Occupation | Male | Female |
| Production | 4 (100.0%) | 0 (0.0%) |
| Transportation | 10 (83.3%) | 2 (16.7%) |
| Material Moving | 4 (100.0%) | 0 (0.0%) |
| Total (Category) | 18 (90.0%) | 2 (10.0%) |
| Total (Overall) | 61 (58.7%) | 43 (41.3%) |
Employment Industries by Sex in Paisley
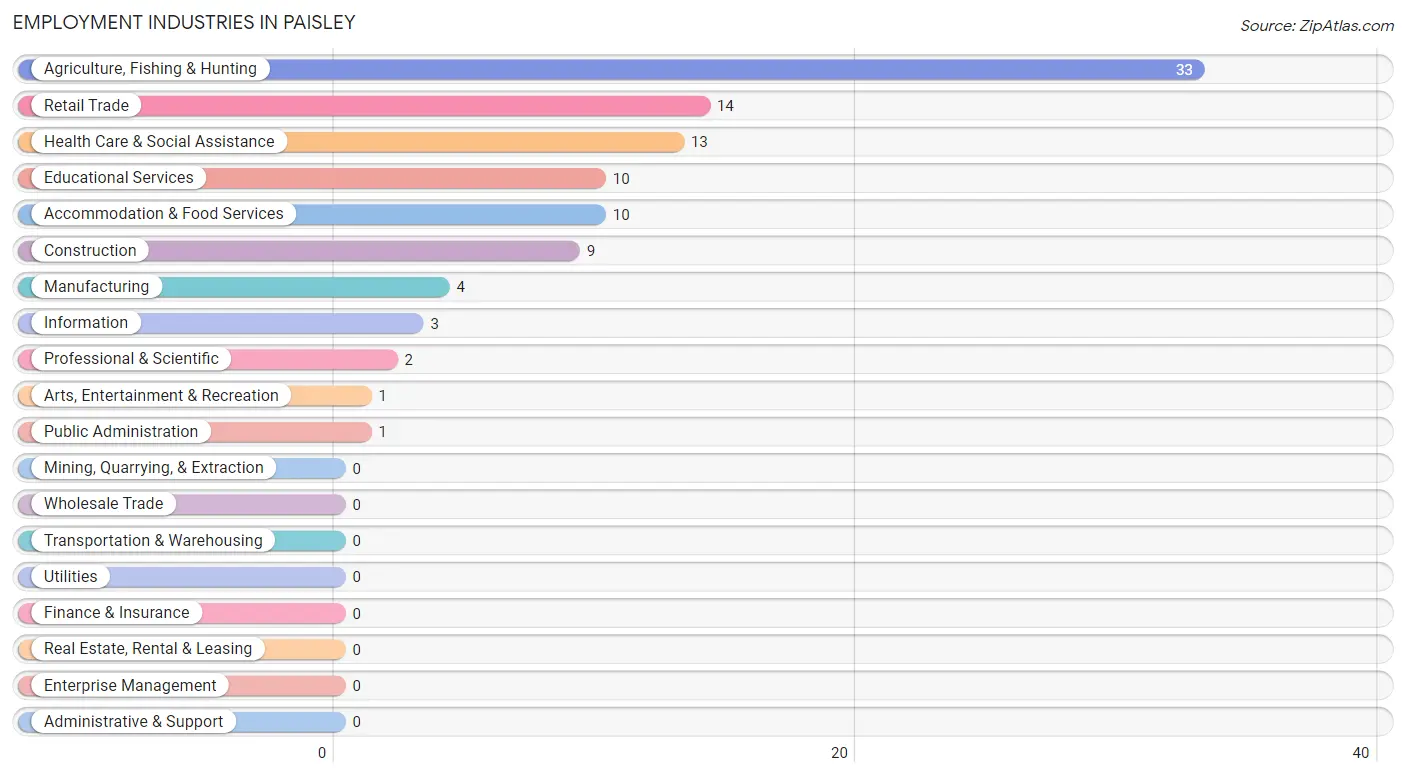
Employment Industries in Paisley
The major employment industries in Paisley include Agriculture, Fishing & Hunting (33 | 31.7%), Retail Trade (14 | 13.5%), Health Care & Social Assistance (13 | 12.5%), Educational Services (10 | 9.6%), and Accommodation & Food Services (10 | 9.6%).
Employment Industries by Sex in Paisley
The Paisley industries that see more men than women are Construction (100.0%), Manufacturing (100.0%), and Professional & Scientific (100.0%), whereas the industries that tend to have a higher number of women are Information (100.0%), Health Care & Social Assistance (100.0%), and Arts, Entertainment & Recreation (100.0%).
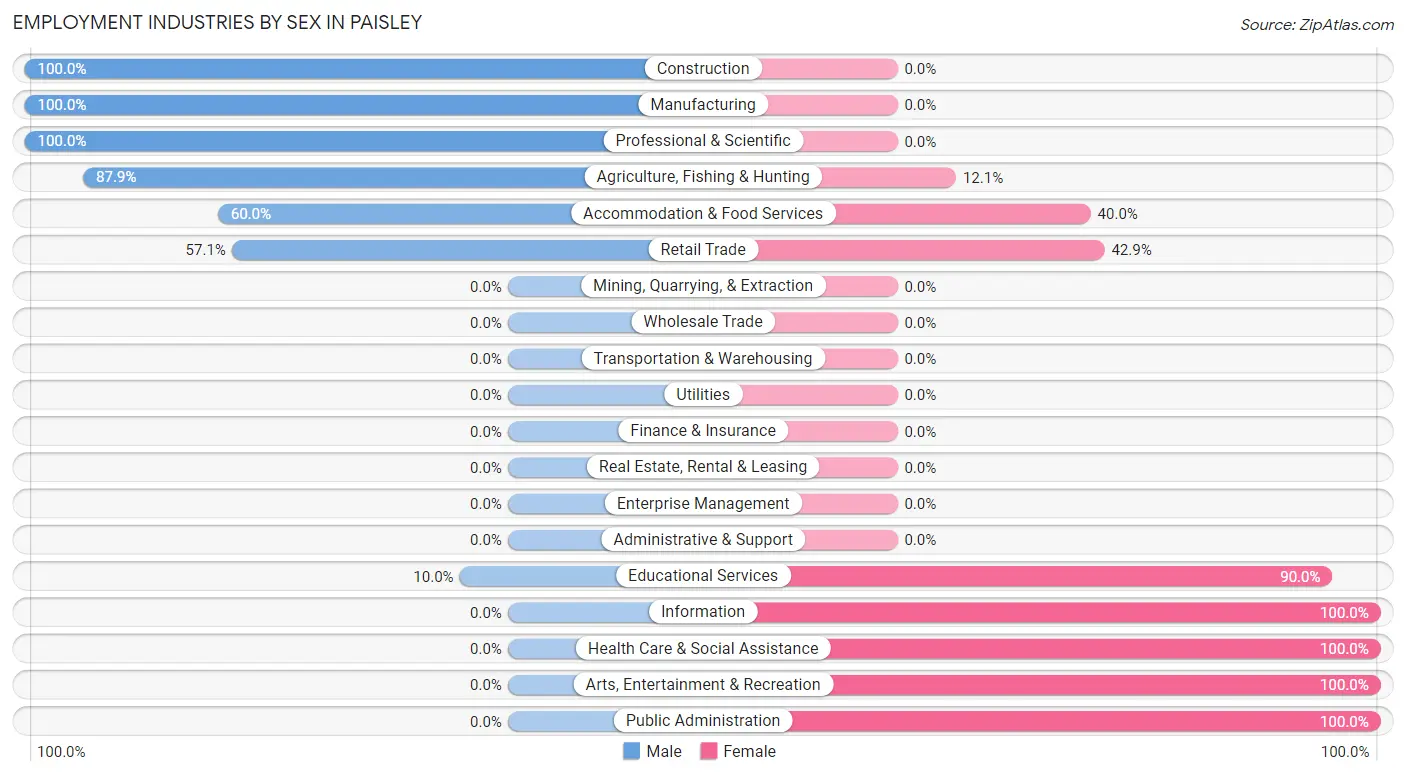
| Industry | Male | Female |
| Agriculture, Fishing & Hunting | 29 (87.9%) | 4 (12.1%) |
| Mining, Quarrying, & Extraction | 0 (0.0%) | 0 (0.0%) |
| Construction | 9 (100.0%) | 0 (0.0%) |
| Manufacturing | 4 (100.0%) | 0 (0.0%) |
| Wholesale Trade | 0 (0.0%) | 0 (0.0%) |
| Retail Trade | 8 (57.1%) | 6 (42.9%) |
| Transportation & Warehousing | 0 (0.0%) | 0 (0.0%) |
| Utilities | 0 (0.0%) | 0 (0.0%) |
| Information | 0 (0.0%) | 3 (100.0%) |
| Finance & Insurance | 0 (0.0%) | 0 (0.0%) |
| Real Estate, Rental & Leasing | 0 (0.0%) | 0 (0.0%) |
| Professional & Scientific | 2 (100.0%) | 0 (0.0%) |
| Enterprise Management | 0 (0.0%) | 0 (0.0%) |
| Administrative & Support | 0 (0.0%) | 0 (0.0%) |
| Educational Services | 1 (10.0%) | 9 (90.0%) |
| Health Care & Social Assistance | 0 (0.0%) | 13 (100.0%) |
| Arts, Entertainment & Recreation | 0 (0.0%) | 1 (100.0%) |
| Accommodation & Food Services | 6 (60.0%) | 4 (40.0%) |
| Public Administration | 0 (0.0%) | 1 (100.0%) |
| Total | 61 (58.7%) | 43 (41.3%) |
Education in Paisley
School Enrollment in Paisley
The most common levels of schooling among the 68 students in Paisley are elementary school (29 | 42.6%), middle school (25 | 36.8%), and graduate / professional (8 | 11.8%).
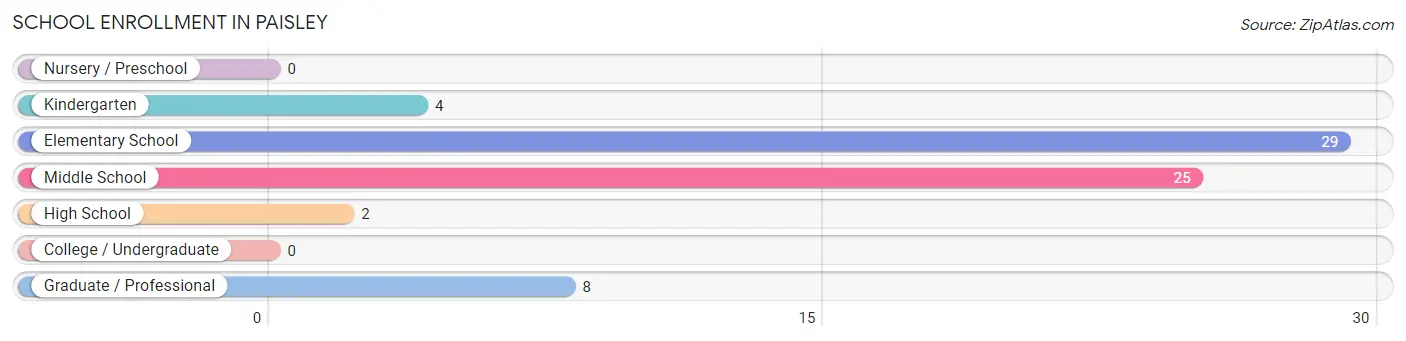
| School Level | # Students | % Students |
| Nursery / Preschool | 0 | 0.0% |
| Kindergarten | 4 | 5.9% |
| Elementary School | 29 | 42.6% |
| Middle School | 25 | 36.8% |
| High School | 2 | 2.9% |
| College / Undergraduate | 0 | 0.0% |
| Graduate / Professional | 8 | 11.8% |
| Total | 68 | 100.0% |
School Enrollment by Age by Funding Source in Paisley
Out of a total of 68 students who are enrolled in schools in Paisley, 22 (32.4%) attend a private institution, while the remaining 46 (67.6%) are enrolled in public schools. The age group of 15 to 17 year olds has the highest likelihood of being enrolled in private schools, with 1 (50.0% in the age bracket) enrolled. Conversely, the age group of 25 to 34 year olds has the lowest likelihood of being enrolled in a private school, with 8 (100.0% in the age bracket) attending a public institution.
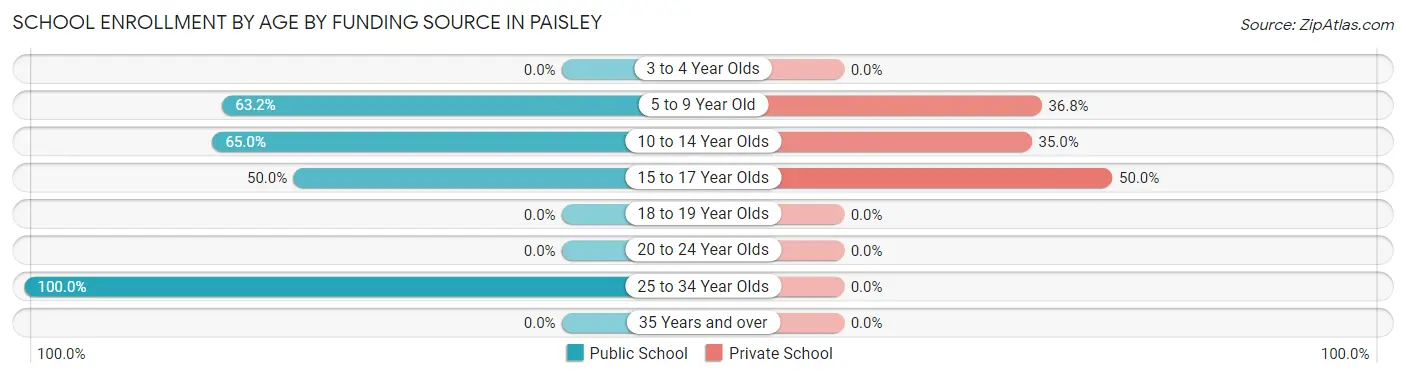
| Age Bracket | Public School | Private School |
| 3 to 4 Year Olds | 0 (0.0%) | 0 (0.0%) |
| 5 to 9 Year Old | 24 (63.2%) | 14 (36.8%) |
| 10 to 14 Year Olds | 13 (65.0%) | 7 (35.0%) |
| 15 to 17 Year Olds | 1 (50.0%) | 1 (50.0%) |
| 18 to 19 Year Olds | 0 (0.0%) | 0 (0.0%) |
| 20 to 24 Year Olds | 0 (0.0%) | 0 (0.0%) |
| 25 to 34 Year Olds | 8 (100.0%) | 0 (0.0%) |
| 35 Years and over | 0 (0.0%) | 0 (0.0%) |
| Total | 46 (67.6%) | 22 (32.4%) |
Educational Attainment by Field of Study in Paisley
Bio, nature & agricultural (24 | 48.0%), liberal arts & history (11 | 22.0%), physical & health sciences (4 | 8.0%), social sciences (3 | 6.0%), and literature & languages (2 | 4.0%) are the most common fields of study among 50 individuals in Paisley who have obtained a bachelor's degree or higher.
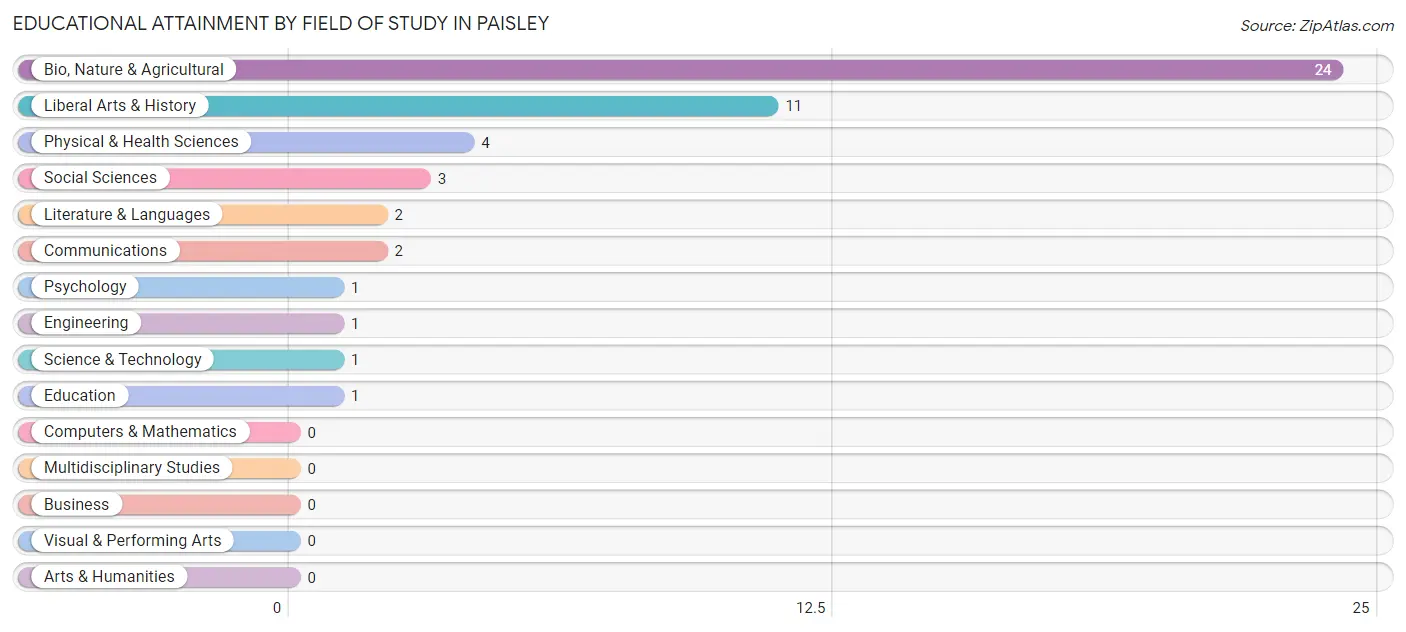
| Field of Study | # Graduates | % Graduates |
| Computers & Mathematics | 0 | 0.0% |
| Bio, Nature & Agricultural | 24 | 48.0% |
| Physical & Health Sciences | 4 | 8.0% |
| Psychology | 1 | 2.0% |
| Social Sciences | 3 | 6.0% |
| Engineering | 1 | 2.0% |
| Multidisciplinary Studies | 0 | 0.0% |
| Science & Technology | 1 | 2.0% |
| Business | 0 | 0.0% |
| Education | 1 | 2.0% |
| Literature & Languages | 2 | 4.0% |
| Liberal Arts & History | 11 | 22.0% |
| Visual & Performing Arts | 0 | 0.0% |
| Communications | 2 | 4.0% |
| Arts & Humanities | 0 | 0.0% |
| Total | 50 | 100.0% |
Transportation & Commute in Paisley
Vehicle Availability by Sex in Paisley
The most prevalent vehicle ownership categories in Paisley are males with 1 vehicle (24, accounting for 39.3%) and females with 1 vehicle (14, making up 58.5%).
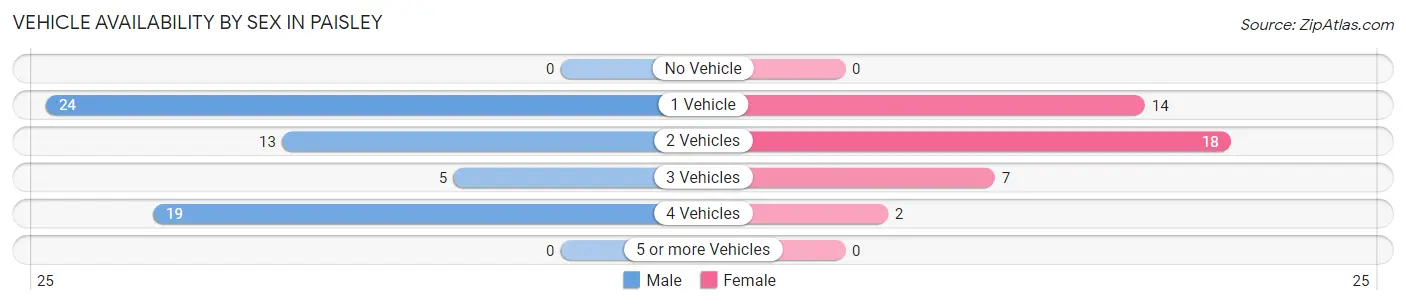
| Vehicles Available | Male | Female |
| No Vehicle | 0 (0.0%) | 0 (0.0%) |
| 1 Vehicle | 24 (39.3%) | 14 (34.2%) |
| 2 Vehicles | 13 (21.3%) | 18 (43.9%) |
| 3 Vehicles | 5 (8.2%) | 7 (17.1%) |
| 4 Vehicles | 19 (31.1%) | 2 (4.9%) |
| 5 or more Vehicles | 0 (0.0%) | 0 (0.0%) |
| Total | 61 (100.0%) | 41 (100.0%) |
Commute Time in Paisley
The most frequently occuring commute durations in Paisley are 5 to 9 minutes (24 commuters, 27.0%), less than 5 minutes (18 commuters, 20.2%), and 20 to 24 minutes (12 commuters, 13.5%).
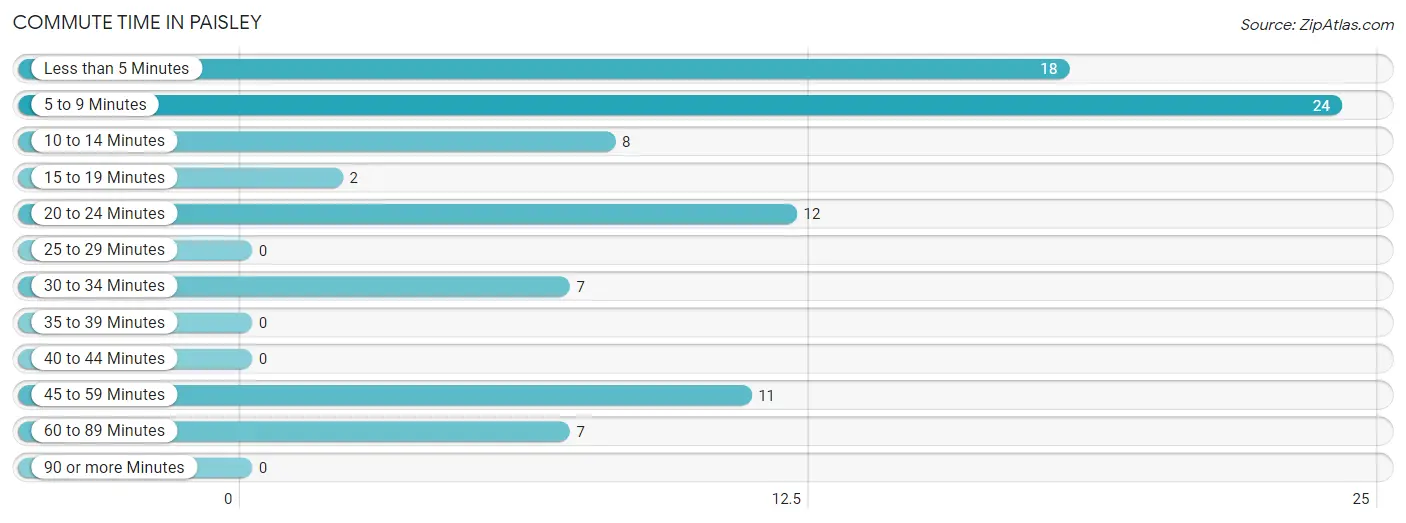
| Commute Time | # Commuters | % Commuters |
| Less than 5 Minutes | 18 | 20.2% |
| 5 to 9 Minutes | 24 | 27.0% |
| 10 to 14 Minutes | 8 | 9.0% |
| 15 to 19 Minutes | 2 | 2.2% |
| 20 to 24 Minutes | 12 | 13.5% |
| 25 to 29 Minutes | 0 | 0.0% |
| 30 to 34 Minutes | 7 | 7.9% |
| 35 to 39 Minutes | 0 | 0.0% |
| 40 to 44 Minutes | 0 | 0.0% |
| 45 to 59 Minutes | 11 | 12.4% |
| 60 to 89 Minutes | 7 | 7.9% |
| 90 or more Minutes | 0 | 0.0% |
Commute Time by Sex in Paisley
The most common commute times in Paisley are 5 to 9 minutes (16 commuters, 31.4%) for males and less than 5 minutes (12 commuters, 31.6%) for females.
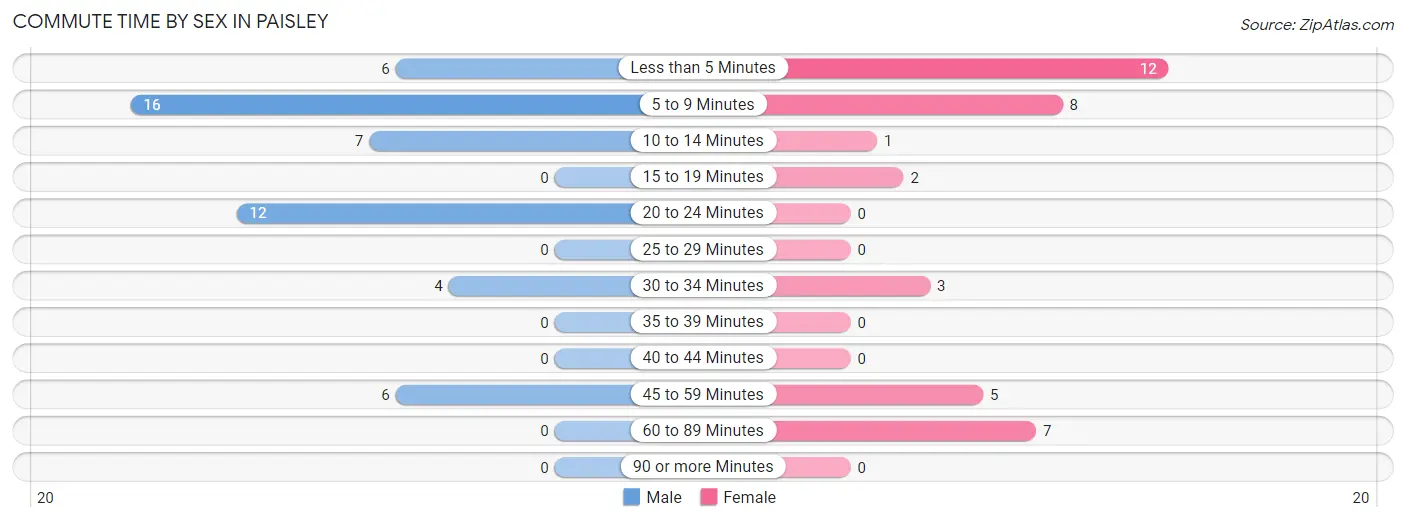
| Commute Time | Male | Female |
| Less than 5 Minutes | 6 (11.8%) | 12 (31.6%) |
| 5 to 9 Minutes | 16 (31.4%) | 8 (21.0%) |
| 10 to 14 Minutes | 7 (13.7%) | 1 (2.6%) |
| 15 to 19 Minutes | 0 (0.0%) | 2 (5.3%) |
| 20 to 24 Minutes | 12 (23.5%) | 0 (0.0%) |
| 25 to 29 Minutes | 0 (0.0%) | 0 (0.0%) |
| 30 to 34 Minutes | 4 (7.8%) | 3 (7.9%) |
| 35 to 39 Minutes | 0 (0.0%) | 0 (0.0%) |
| 40 to 44 Minutes | 0 (0.0%) | 0 (0.0%) |
| 45 to 59 Minutes | 6 (11.8%) | 5 (13.2%) |
| 60 to 89 Minutes | 0 (0.0%) | 7 (18.4%) |
| 90 or more Minutes | 0 (0.0%) | 0 (0.0%) |
Time of Departure to Work by Sex in Paisley
The most frequent times of departure to work in Paisley are 5:30 AM to 5:59 AM (15, 29.4%) for males and 6:30 AM to 6:59 AM (11, 28.9%) for females.
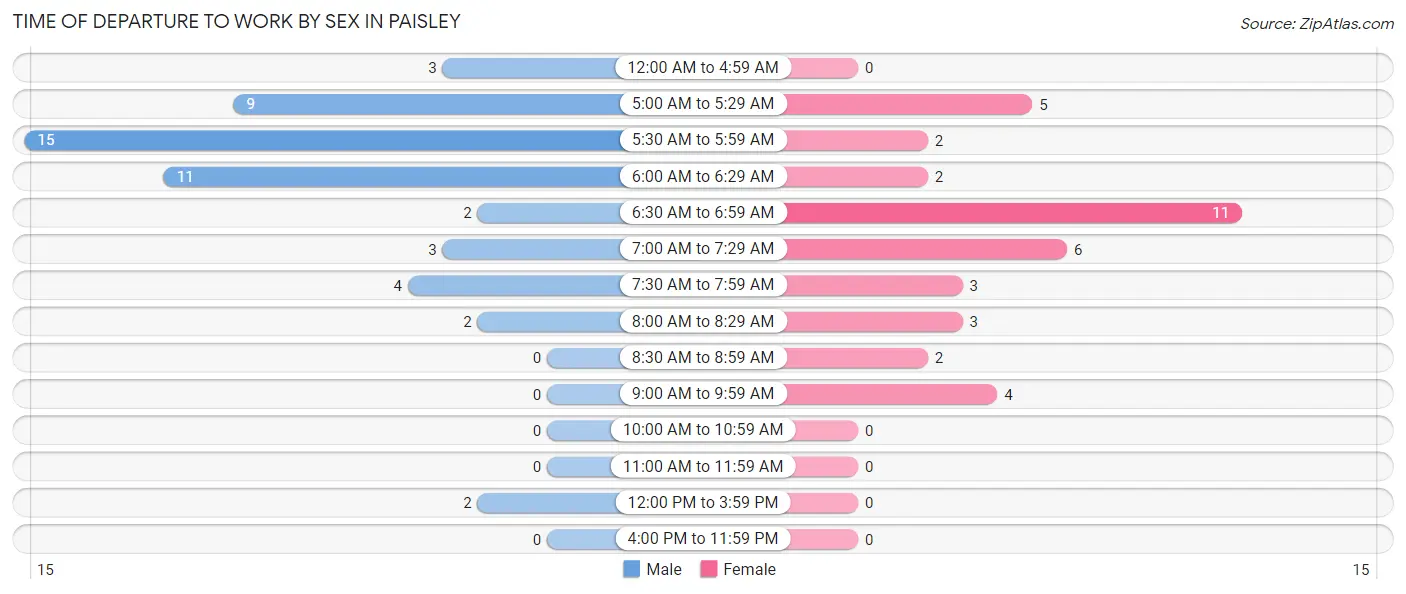
| Time of Departure | Male | Female |
| 12:00 AM to 4:59 AM | 3 (5.9%) | 0 (0.0%) |
| 5:00 AM to 5:29 AM | 9 (17.6%) | 5 (13.2%) |
| 5:30 AM to 5:59 AM | 15 (29.4%) | 2 (5.3%) |
| 6:00 AM to 6:29 AM | 11 (21.6%) | 2 (5.3%) |
| 6:30 AM to 6:59 AM | 2 (3.9%) | 11 (28.9%) |
| 7:00 AM to 7:29 AM | 3 (5.9%) | 6 (15.8%) |
| 7:30 AM to 7:59 AM | 4 (7.8%) | 3 (7.9%) |
| 8:00 AM to 8:29 AM | 2 (3.9%) | 3 (7.9%) |
| 8:30 AM to 8:59 AM | 0 (0.0%) | 2 (5.3%) |
| 9:00 AM to 9:59 AM | 0 (0.0%) | 4 (10.5%) |
| 10:00 AM to 10:59 AM | 0 (0.0%) | 0 (0.0%) |
| 11:00 AM to 11:59 AM | 0 (0.0%) | 0 (0.0%) |
| 12:00 PM to 3:59 PM | 2 (3.9%) | 0 (0.0%) |
| 4:00 PM to 11:59 PM | 0 (0.0%) | 0 (0.0%) |
| Total | 51 (100.0%) | 38 (100.0%) |
Housing Occupancy in Paisley
Occupancy by Ownership in Paisley
Of the total 115 dwellings in Paisley, owner-occupied units account for 51 (44.4%), while renter-occupied units make up 64 (55.6%).
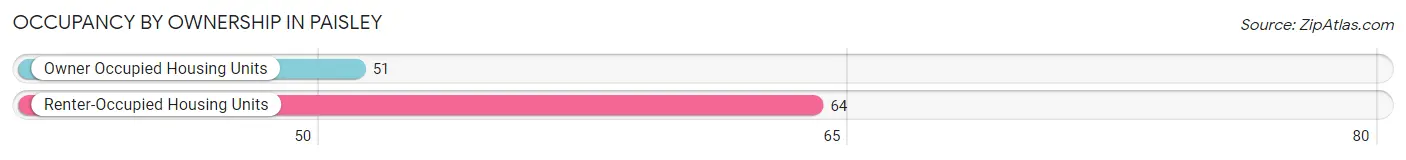
| Occupancy | # Housing Units | % Housing Units |
| Owner Occupied Housing Units | 51 | 44.4% |
| Renter-Occupied Housing Units | 64 | 55.6% |
| Total Occupied Housing Units | 115 | 100.0% |
Occupancy by Household Size in Paisley
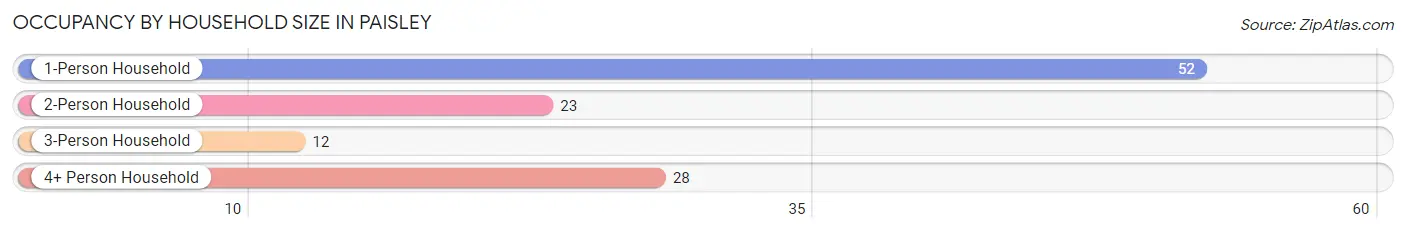
| Household Size | # Housing Units | % Housing Units |
| 1-Person Household | 52 | 45.2% |
| 2-Person Household | 23 | 20.0% |
| 3-Person Household | 12 | 10.4% |
| 4+ Person Household | 28 | 24.3% |
| Total Housing Units | 115 | 100.0% |
Occupancy by Ownership by Household Size in Paisley
| Household Size | Owner-occupied | Renter-occupied |
| 1-Person Household | 18 (34.6%) | 34 (65.4%) |
| 2-Person Household | 21 (91.3%) | 2 (8.7%) |
| 3-Person Household | 4 (33.3%) | 8 (66.7%) |
| 4+ Person Household | 8 (28.6%) | 20 (71.4%) |
| Total Housing Units | 51 (44.4%) | 64 (55.6%) |
Occupancy by Educational Attainment in Paisley
| Household Size | Owner-occupied | Renter-occupied |
| Less than High School | 4 (40.0%) | 6 (60.0%) |
| High School Diploma | 12 (35.3%) | 22 (64.7%) |
| College/Associate Degree | 24 (52.2%) | 22 (47.8%) |
| Bachelor's Degree or higher | 11 (44.0%) | 14 (56.0%) |
Occupancy by Age of Householder in Paisley
| Age Bracket | # Households | % Households |
| Under 35 Years | 24 | 20.9% |
| 35 to 44 Years | 17 | 14.8% |
| 45 to 54 Years | 19 | 16.5% |
| 55 to 64 Years | 15 | 13.0% |
| 65 to 74 Years | 30 | 26.1% |
| 75 to 84 Years | 10 | 8.7% |
| 85 Years and Over | 0 | 0.0% |
| Total | 115 | 100.0% |
Housing Finances in Paisley
Median Income by Occupancy in Paisley
| Occupancy Type | # Households | Median Income |
| Owner-Occupied | 51 (44.4%) | $53,250 |
| Renter-Occupied | 64 (55.6%) | $43,594 |
| Average | 115 (100.0%) | $44,609 |
Occupancy by Householder Income Bracket in Paisley
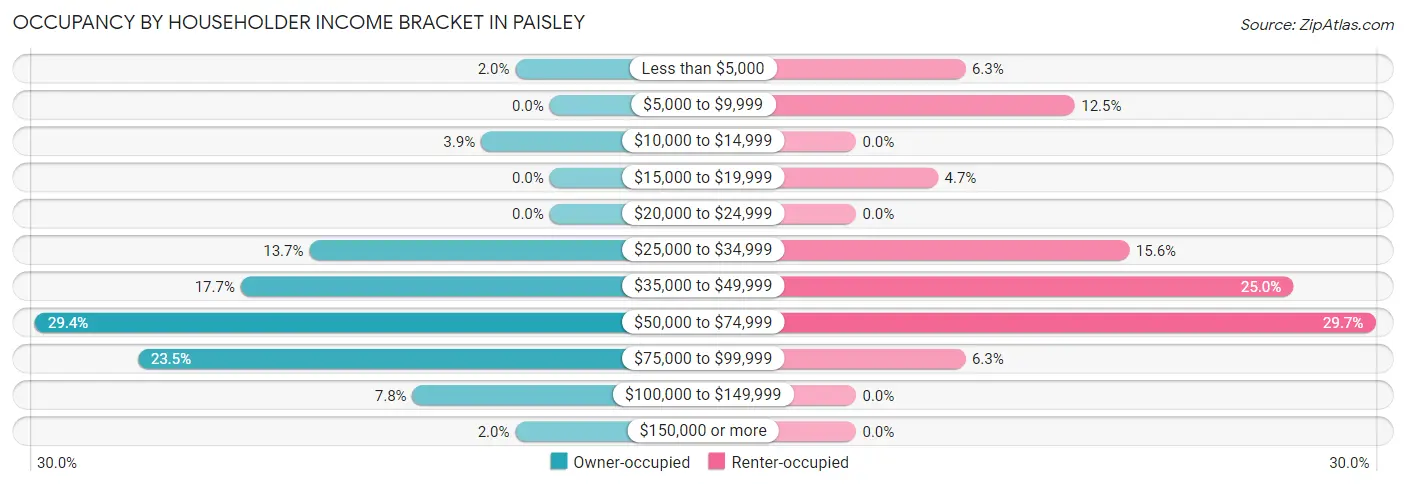
| Income Bracket | Owner-occupied | Renter-occupied |
| Less than $5,000 | 1 (2.0%) | 4 (6.2%) |
| $5,000 to $9,999 | 0 (0.0%) | 8 (12.5%) |
| $10,000 to $14,999 | 2 (3.9%) | 0 (0.0%) |
| $15,000 to $19,999 | 0 (0.0%) | 3 (4.7%) |
| $20,000 to $24,999 | 0 (0.0%) | 0 (0.0%) |
| $25,000 to $34,999 | 7 (13.7%) | 10 (15.6%) |
| $35,000 to $49,999 | 9 (17.6%) | 16 (25.0%) |
| $50,000 to $74,999 | 15 (29.4%) | 19 (29.7%) |
| $75,000 to $99,999 | 12 (23.5%) | 4 (6.2%) |
| $100,000 to $149,999 | 4 (7.8%) | 0 (0.0%) |
| $150,000 or more | 1 (2.0%) | 0 (0.0%) |
| Total | 51 (100.0%) | 64 (100.0%) |
Monthly Housing Cost Tiers in Paisley
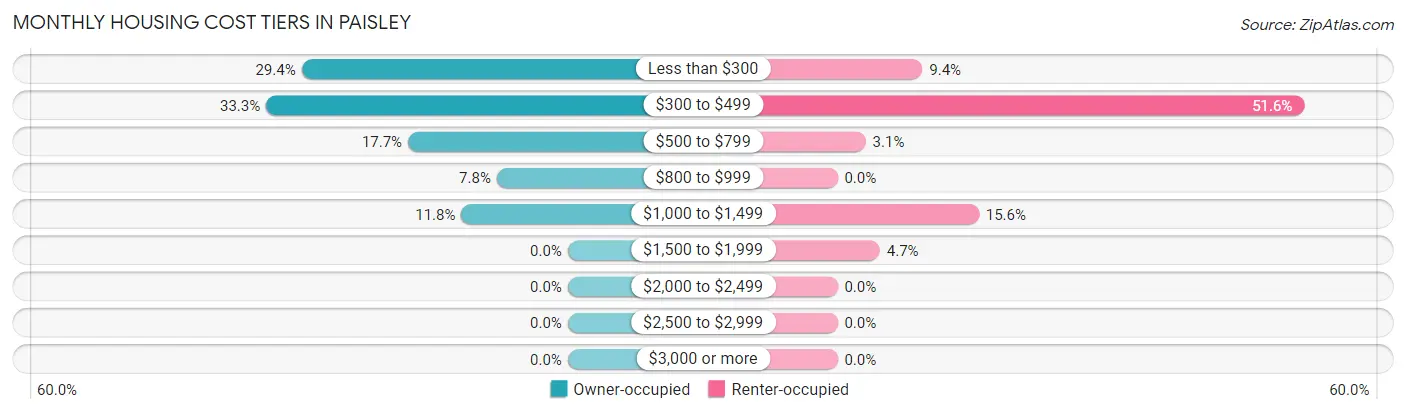
| Monthly Cost | Owner-occupied | Renter-occupied |
| Less than $300 | 15 (29.4%) | 6 (9.4%) |
| $300 to $499 | 17 (33.3%) | 33 (51.6%) |
| $500 to $799 | 9 (17.6%) | 2 (3.1%) |
| $800 to $999 | 4 (7.8%) | 0 (0.0%) |
| $1,000 to $1,499 | 6 (11.8%) | 10 (15.6%) |
| $1,500 to $1,999 | 0 (0.0%) | 3 (4.7%) |
| $2,000 to $2,499 | 0 (0.0%) | 0 (0.0%) |
| $2,500 to $2,999 | 0 (0.0%) | 0 (0.0%) |
| $3,000 or more | 0 (0.0%) | 0 (0.0%) |
| Total | 51 (100.0%) | 64 (100.0%) |
Physical Housing Characteristics in Paisley
Housing Structures in Paisley
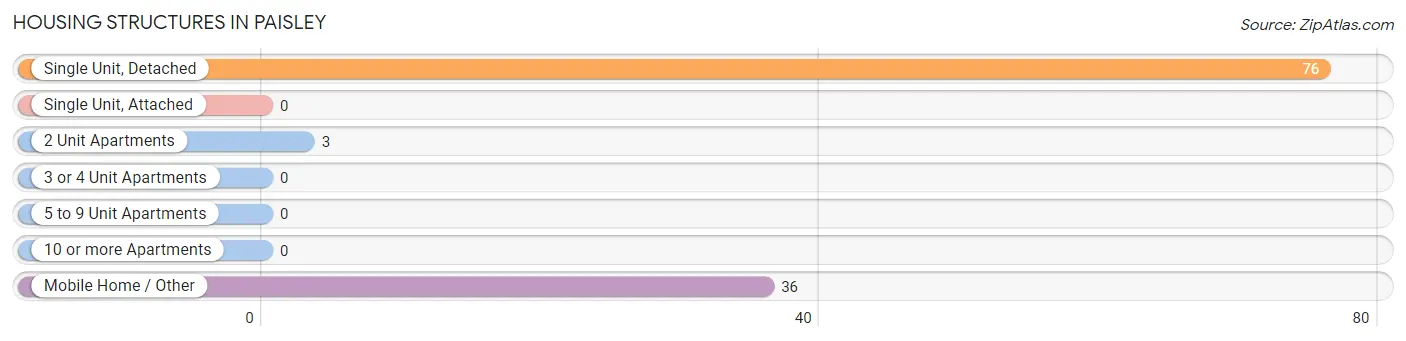
| Structure Type | # Housing Units | % Housing Units |
| Single Unit, Detached | 76 | 66.1% |
| Single Unit, Attached | 0 | 0.0% |
| 2 Unit Apartments | 3 | 2.6% |
| 3 or 4 Unit Apartments | 0 | 0.0% |
| 5 to 9 Unit Apartments | 0 | 0.0% |
| 10 or more Apartments | 0 | 0.0% |
| Mobile Home / Other | 36 | 31.3% |
| Total | 115 | 100.0% |
Housing Structures by Occupancy in Paisley
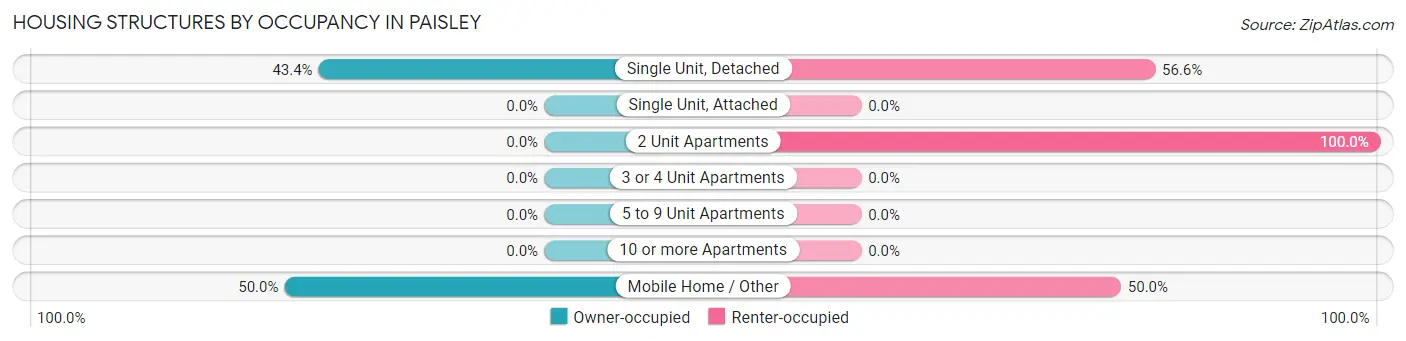
| Structure Type | Owner-occupied | Renter-occupied |
| Single Unit, Detached | 33 (43.4%) | 43 (56.6%) |
| Single Unit, Attached | 0 (0.0%) | 0 (0.0%) |
| 2 Unit Apartments | 0 (0.0%) | 3 (100.0%) |
| 3 or 4 Unit Apartments | 0 (0.0%) | 0 (0.0%) |
| 5 to 9 Unit Apartments | 0 (0.0%) | 0 (0.0%) |
| 10 or more Apartments | 0 (0.0%) | 0 (0.0%) |
| Mobile Home / Other | 18 (50.0%) | 18 (50.0%) |
| Total | 51 (44.4%) | 64 (55.6%) |
Housing Structures by Number of Rooms in Paisley
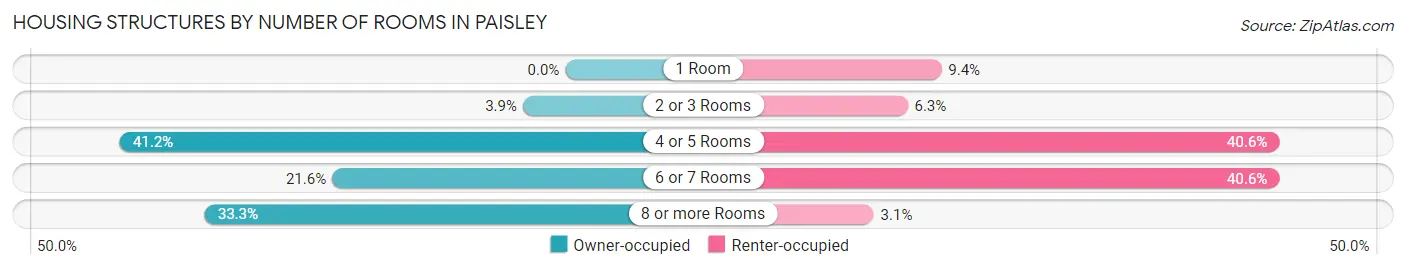
| Number of Rooms | Owner-occupied | Renter-occupied |
| 1 Room | 0 (0.0%) | 6 (9.4%) |
| 2 or 3 Rooms | 2 (3.9%) | 4 (6.2%) |
| 4 or 5 Rooms | 21 (41.2%) | 26 (40.6%) |
| 6 or 7 Rooms | 11 (21.6%) | 26 (40.6%) |
| 8 or more Rooms | 17 (33.3%) | 2 (3.1%) |
| Total | 51 (100.0%) | 64 (100.0%) |
Housing Structure by Heating Type in Paisley
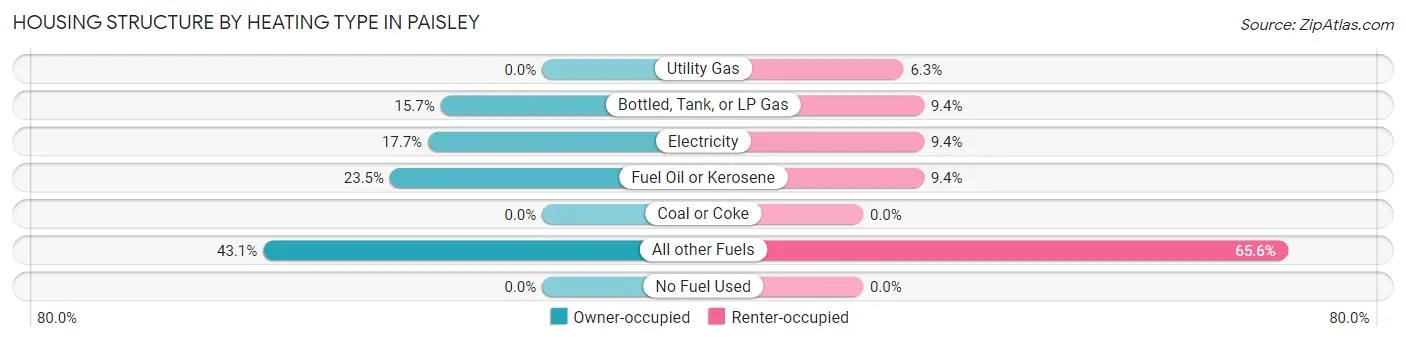
| Heating Type | Owner-occupied | Renter-occupied |
| Utility Gas | 0 (0.0%) | 4 (6.2%) |
| Bottled, Tank, or LP Gas | 8 (15.7%) | 6 (9.4%) |
| Electricity | 9 (17.6%) | 6 (9.4%) |
| Fuel Oil or Kerosene | 12 (23.5%) | 6 (9.4%) |
| Coal or Coke | 0 (0.0%) | 0 (0.0%) |
| All other Fuels | 22 (43.1%) | 42 (65.6%) |
| No Fuel Used | 0 (0.0%) | 0 (0.0%) |
| Total | 51 (100.0%) | 64 (100.0%) |
Household Vehicle Usage in Paisley
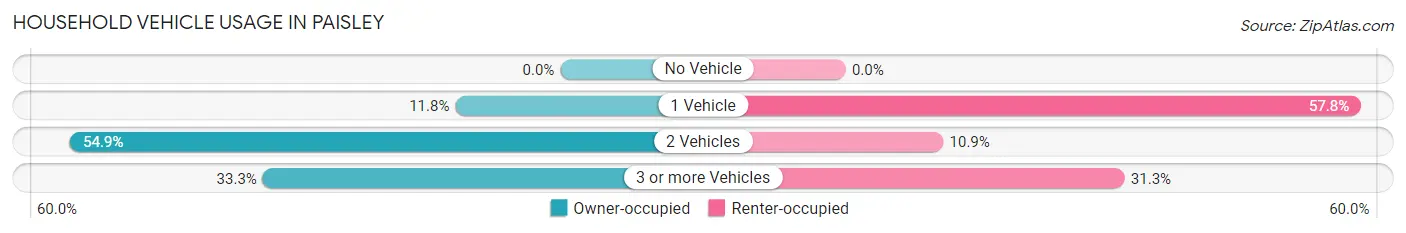
| Vehicles per Household | Owner-occupied | Renter-occupied |
| No Vehicle | 0 (0.0%) | 0 (0.0%) |
| 1 Vehicle | 6 (11.8%) | 37 (57.8%) |
| 2 Vehicles | 28 (54.9%) | 7 (10.9%) |
| 3 or more Vehicles | 17 (33.3%) | 20 (31.2%) |
| Total | 51 (100.0%) | 64 (100.0%) |
Real Estate & Mortgages in Paisley
Real Estate and Mortgage Overview in Paisley
| Characteristic | Without Mortgage | With Mortgage |
| Housing Units | 36 | 15 |
| Median Property Value | $98,600 | $218,800 |
| Median Household Income | $53,125 | $0 |
| Monthly Housing Costs | $338 | $0 |
| Real Estate Taxes | $1,050 | $0 |
Property Value by Mortgage Status in Paisley
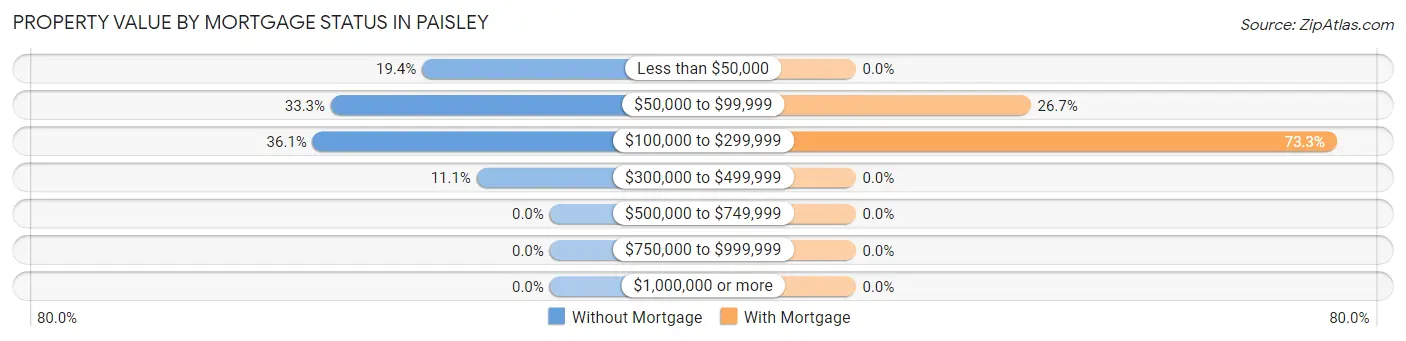
| Property Value | Without Mortgage | With Mortgage |
| Less than $50,000 | 7 (19.4%) | 0 (0.0%) |
| $50,000 to $99,999 | 12 (33.3%) | 4 (26.7%) |
| $100,000 to $299,999 | 13 (36.1%) | 11 (73.3%) |
| $300,000 to $499,999 | 4 (11.1%) | 0 (0.0%) |
| $500,000 to $749,999 | 0 (0.0%) | 0 (0.0%) |
| $750,000 to $999,999 | 0 (0.0%) | 0 (0.0%) |
| $1,000,000 or more | 0 (0.0%) | 0 (0.0%) |
| Total | 36 (100.0%) | 15 (100.0%) |
Household Income by Mortgage Status in Paisley
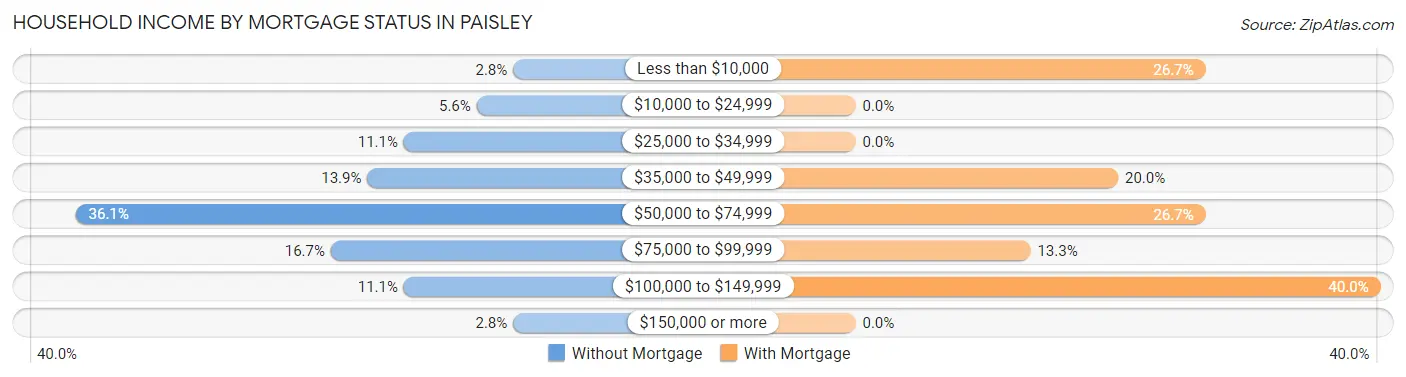
| Household Income | Without Mortgage | With Mortgage |
| Less than $10,000 | 1 (2.8%) | 4 (26.7%) |
| $10,000 to $24,999 | 2 (5.6%) | 0 (0.0%) |
| $25,000 to $34,999 | 4 (11.1%) | 0 (0.0%) |
| $35,000 to $49,999 | 5 (13.9%) | 3 (20.0%) |
| $50,000 to $74,999 | 13 (36.1%) | 4 (26.7%) |
| $75,000 to $99,999 | 6 (16.7%) | 2 (13.3%) |
| $100,000 to $149,999 | 4 (11.1%) | 6 (40.0%) |
| $150,000 or more | 1 (2.8%) | 0 (0.0%) |
| Total | 36 (100.0%) | 15 (100.0%) |
Property Value to Household Income Ratio in Paisley
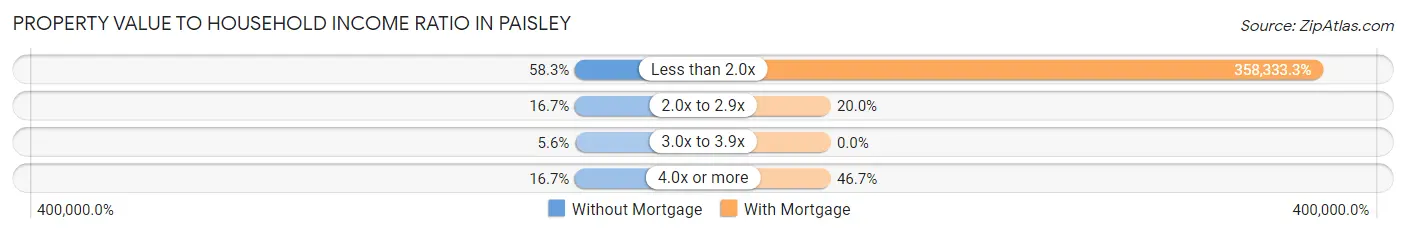
| Value-to-Income Ratio | Without Mortgage | With Mortgage |
| Less than 2.0x | 21 (58.3%) | 53,750 (358,333.3%) |
| 2.0x to 2.9x | 6 (16.7%) | 3 (20.0%) |
| 3.0x to 3.9x | 2 (5.6%) | 0 (0.0%) |
| 4.0x or more | 6 (16.7%) | 7 (46.7%) |
| Total | 36 (100.0%) | 15 (100.0%) |
Real Estate Taxes by Mortgage Status in Paisley
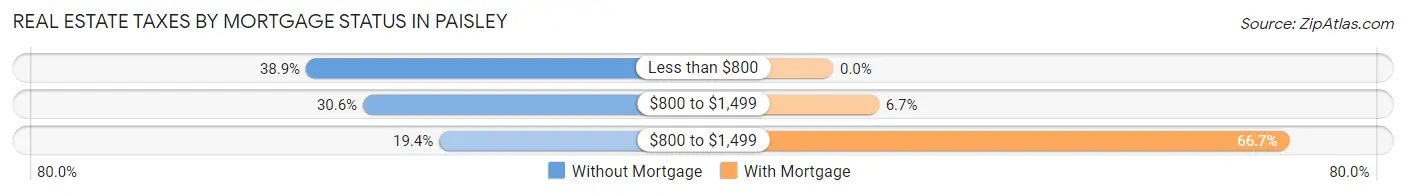
| Property Taxes | Without Mortgage | With Mortgage |
| Less than $800 | 14 (38.9%) | 0 (0.0%) |
| $800 to $1,499 | 11 (30.6%) | 1 (6.7%) |
| $800 to $1,499 | 7 (19.4%) | 10 (66.7%) |
| Total | 36 (100.0%) | 15 (100.0%) |
Health & Disability in Paisley
Health Insurance Coverage by Age in Paisley
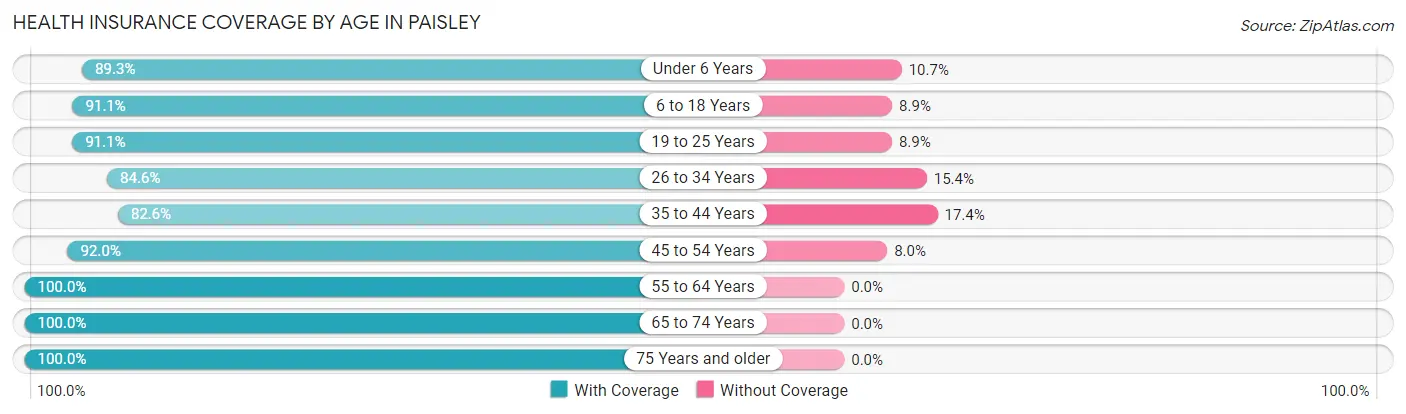
| Age Bracket | With Coverage | Without Coverage |
| Under 6 Years | 25 (89.3%) | 3 (10.7%) |
| 6 to 18 Years | 51 (91.1%) | 5 (8.9%) |
| 19 to 25 Years | 41 (91.1%) | 4 (8.9%) |
| 26 to 34 Years | 22 (84.6%) | 4 (15.4%) |
| 35 to 44 Years | 19 (82.6%) | 4 (17.4%) |
| 45 to 54 Years | 23 (92.0%) | 2 (8.0%) |
| 55 to 64 Years | 21 (100.0%) | 0 (0.0%) |
| 65 to 74 Years | 49 (100.0%) | 0 (0.0%) |
| 75 Years and older | 10 (100.0%) | 0 (0.0%) |
| Total | 261 (92.2%) | 22 (7.8%) |
Health Insurance Coverage by Citizenship Status in Paisley
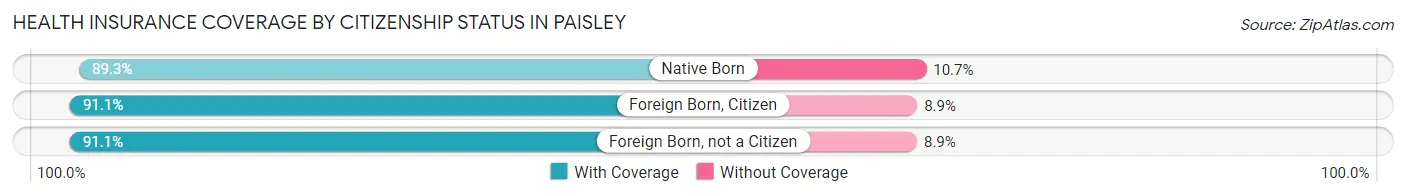
| Citizenship Status | With Coverage | Without Coverage |
| Native Born | 25 (89.3%) | 3 (10.7%) |
| Foreign Born, Citizen | 51 (91.1%) | 5 (8.9%) |
| Foreign Born, not a Citizen | 41 (91.1%) | 4 (8.9%) |
Health Insurance Coverage by Household Income in Paisley
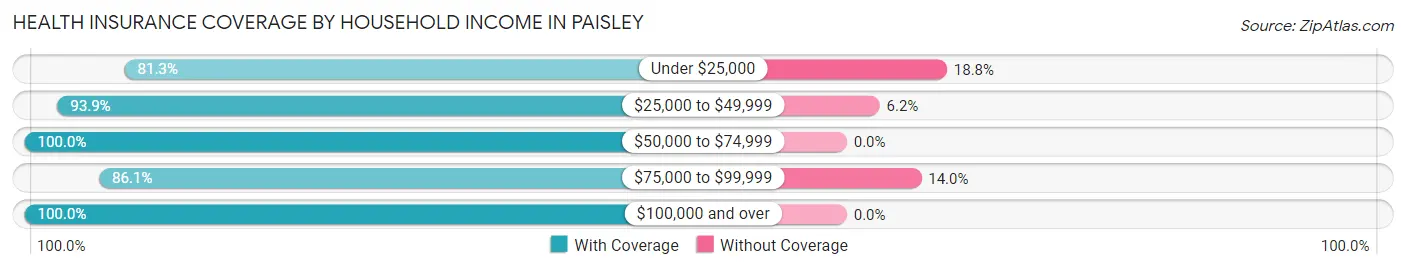
| Household Income | With Coverage | Without Coverage |
| Under $25,000 | 26 (81.2%) | 6 (18.8%) |
| $25,000 to $49,999 | 61 (93.9%) | 4 (6.1%) |
| $50,000 to $74,999 | 87 (100.0%) | 0 (0.0%) |
| $75,000 to $99,999 | 74 (86.1%) | 12 (14.0%) |
| $100,000 and over | 9 (100.0%) | 0 (0.0%) |
Public vs Private Health Insurance Coverage by Age in Paisley
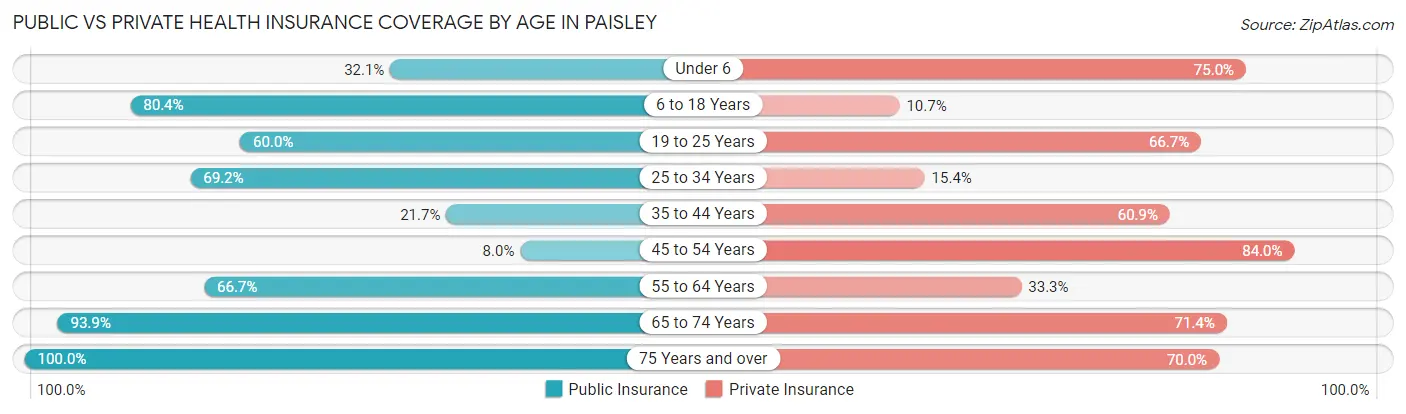
| Age Bracket | Public Insurance | Private Insurance |
| Under 6 | 9 (32.1%) | 21 (75.0%) |
| 6 to 18 Years | 45 (80.4%) | 6 (10.7%) |
| 19 to 25 Years | 27 (60.0%) | 30 (66.7%) |
| 25 to 34 Years | 18 (69.2%) | 4 (15.4%) |
| 35 to 44 Years | 5 (21.7%) | 14 (60.9%) |
| 45 to 54 Years | 2 (8.0%) | 21 (84.0%) |
| 55 to 64 Years | 14 (66.7%) | 7 (33.3%) |
| 65 to 74 Years | 46 (93.9%) | 35 (71.4%) |
| 75 Years and over | 10 (100.0%) | 7 (70.0%) |
| Total | 176 (62.2%) | 145 (51.2%) |
Disability Status by Sex by Age in Paisley
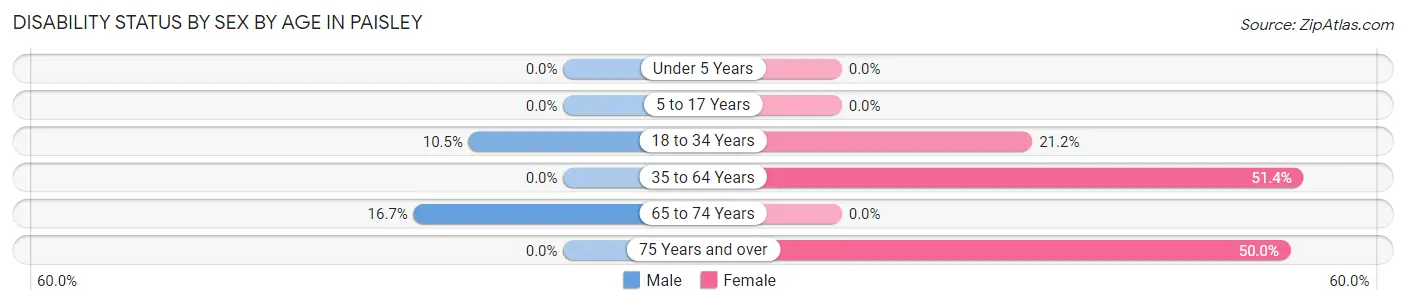
| Age Bracket | Male | Female |
| Under 5 Years | 0 (0.0%) | 0 (0.0%) |
| 5 to 17 Years | 0 (0.0%) | 0 (0.0%) |
| 18 to 34 Years | 4 (10.5%) | 7 (21.2%) |
| 35 to 64 Years | 0 (0.0%) | 18 (51.4%) |
| 65 to 74 Years | 4 (16.7%) | 0 (0.0%) |
| 75 Years and over | 0 (0.0%) | 4 (50.0%) |
Disability Class by Sex by Age in Paisley
Disability Class: Hearing Difficulty
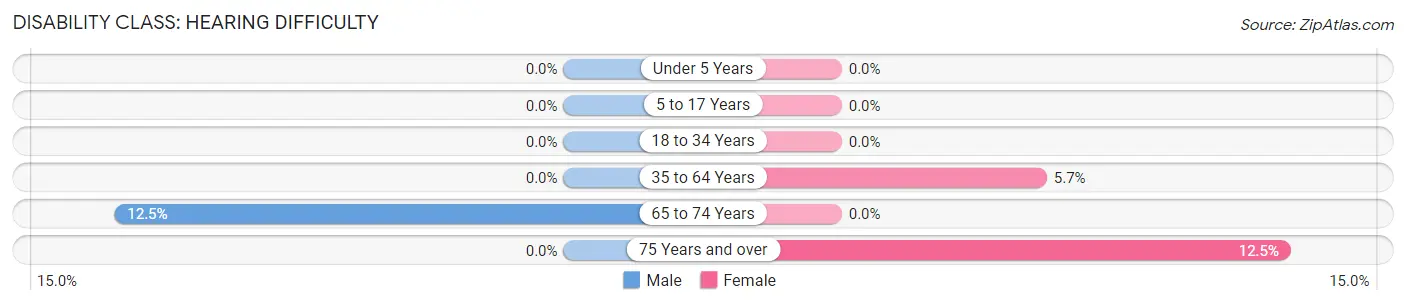
| Age Bracket | Male | Female |
| Under 5 Years | 0 (0.0%) | 0 (0.0%) |
| 5 to 17 Years | 0 (0.0%) | 0 (0.0%) |
| 18 to 34 Years | 0 (0.0%) | 0 (0.0%) |
| 35 to 64 Years | 0 (0.0%) | 2 (5.7%) |
| 65 to 74 Years | 3 (12.5%) | 0 (0.0%) |
| 75 Years and over | 0 (0.0%) | 1 (12.5%) |
Disability Class: Vision Difficulty
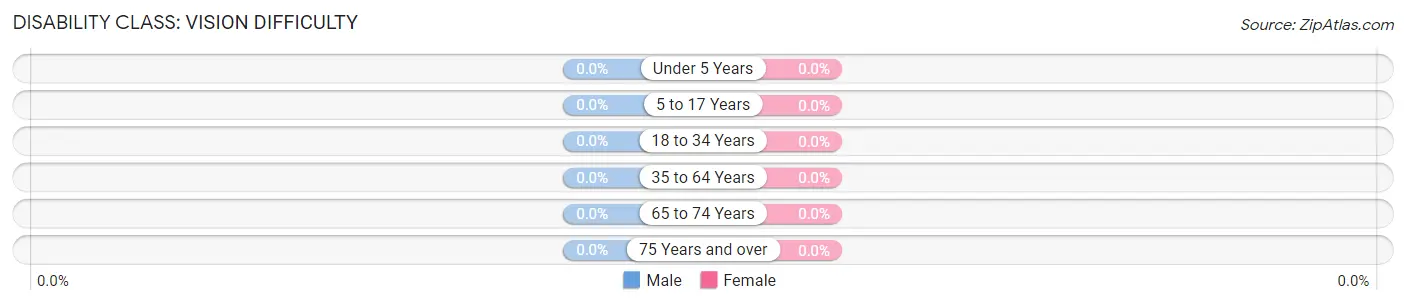
| Age Bracket | Male | Female |
| Under 5 Years | 0 (0.0%) | 0 (0.0%) |
| 5 to 17 Years | 0 (0.0%) | 0 (0.0%) |
| 18 to 34 Years | 0 (0.0%) | 0 (0.0%) |
| 35 to 64 Years | 0 (0.0%) | 0 (0.0%) |
| 65 to 74 Years | 0 (0.0%) | 0 (0.0%) |
| 75 Years and over | 0 (0.0%) | 0 (0.0%) |
Disability Class: Cognitive Difficulty
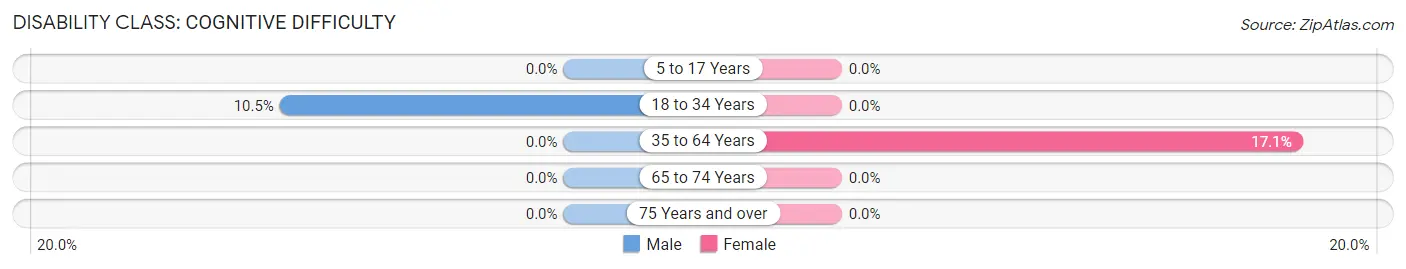
| Age Bracket | Male | Female |
| 5 to 17 Years | 0 (0.0%) | 0 (0.0%) |
| 18 to 34 Years | 4 (10.5%) | 0 (0.0%) |
| 35 to 64 Years | 0 (0.0%) | 6 (17.1%) |
| 65 to 74 Years | 0 (0.0%) | 0 (0.0%) |
| 75 Years and over | 0 (0.0%) | 0 (0.0%) |
Disability Class: Ambulatory Difficulty
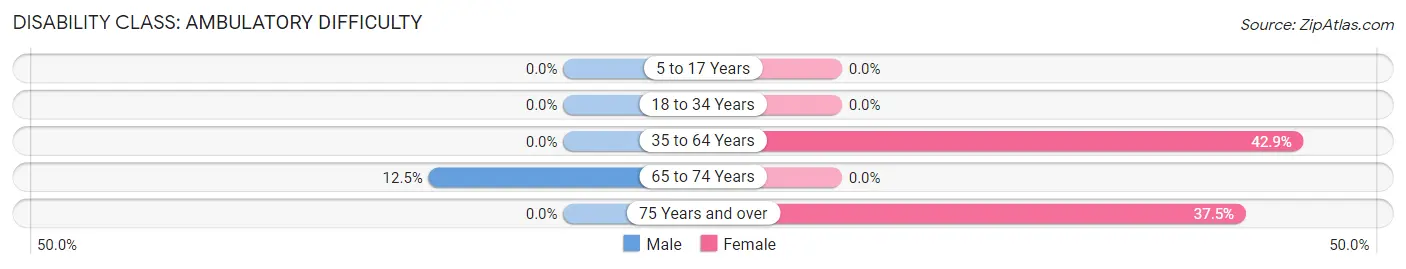
| Age Bracket | Male | Female |
| 5 to 17 Years | 0 (0.0%) | 0 (0.0%) |
| 18 to 34 Years | 0 (0.0%) | 0 (0.0%) |
| 35 to 64 Years | 0 (0.0%) | 15 (42.9%) |
| 65 to 74 Years | 3 (12.5%) | 0 (0.0%) |
| 75 Years and over | 0 (0.0%) | 3 (37.5%) |
Disability Class: Self-Care Difficulty
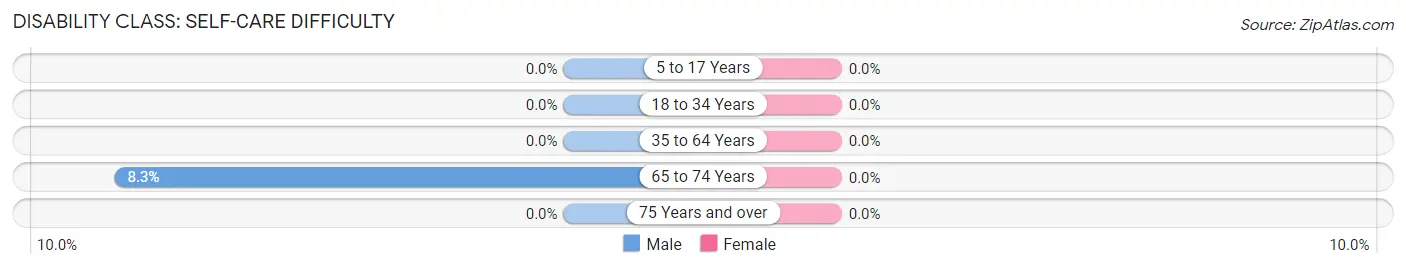
| Age Bracket | Male | Female |
| 5 to 17 Years | 0 (0.0%) | 0 (0.0%) |
| 18 to 34 Years | 0 (0.0%) | 0 (0.0%) |
| 35 to 64 Years | 0 (0.0%) | 0 (0.0%) |
| 65 to 74 Years | 2 (8.3%) | 0 (0.0%) |
| 75 Years and over | 0 (0.0%) | 0 (0.0%) |
Technology Access in Paisley
Computing Device Access in Paisley
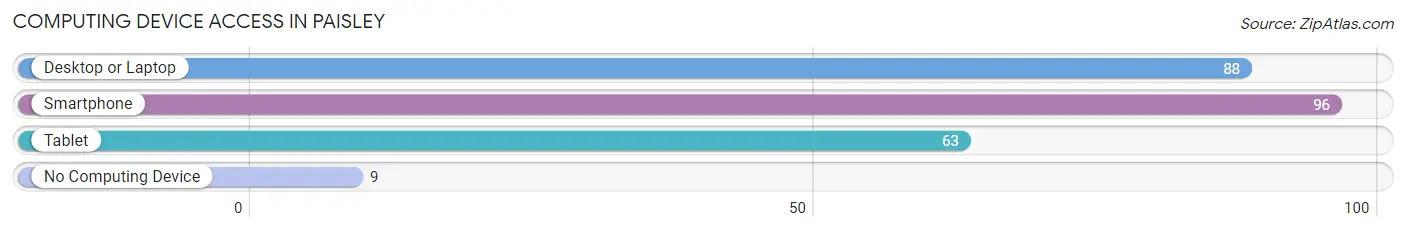
| Device Type | # Households | % Households |
| Desktop or Laptop | 88 | 76.5% |
| Smartphone | 96 | 83.5% |
| Tablet | 63 | 54.8% |
| No Computing Device | 9 | 7.8% |
| Total | 115 | 100.0% |
Internet Access in Paisley
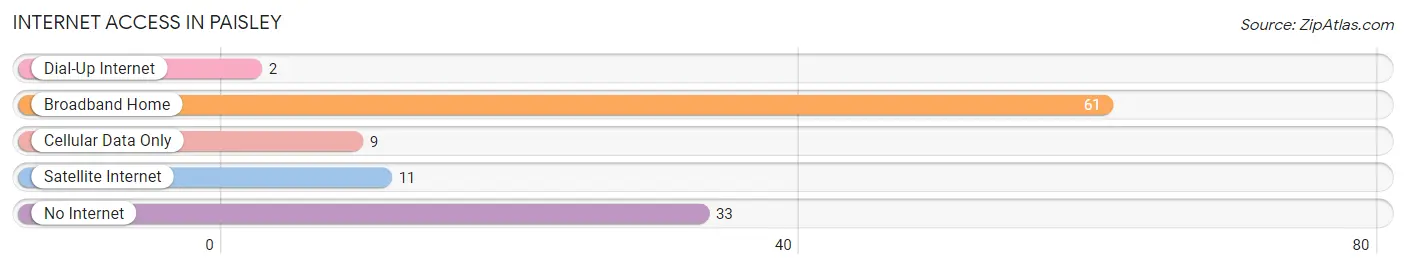
| Internet Type | # Households | % Households |
| Dial-Up Internet | 2 | 1.7% |
| Broadband Home | 61 | 53.0% |
| Cellular Data Only | 9 | 7.8% |
| Satellite Internet | 11 | 9.6% |
| No Internet | 33 | 28.7% |
| Total | 115 | 100.0% |
Paisley Summary
Paisley, Oregon is a small rural community located in Lake County, Oregon. It is situated in the high desert of the Great Basin, at an elevation of 4,000 feet. The town is located on the banks of the Summer Lake, a large alkali lake that is the largest natural lake in Oregon. The population of Paisley was estimated to be around 200 people in 2020.
History
Paisley was founded in 1872 by a group of settlers from the Midwest. The town was named after the Paisley pattern, which was popular at the time. The settlers were attracted to the area due to its abundance of natural resources, including timber, water, and minerals. The town quickly grew and by the early 1900s, it had become a bustling community with a population of over 1,000 people.
The town was an important stop on the Oregon Trail, and it was also a major hub for the cattle industry. In the early 1900s, the town was home to several large ranches, including the Paisley Ranch, which was one of the largest in the state.
The town experienced a period of decline in the mid-1900s, as the cattle industry declined and the timber industry moved away. However, the town has experienced a resurgence in recent years, as it has become a popular destination for outdoor recreation.
Geography
Paisley is located in the high desert of the Great Basin, at an elevation of 4,000 feet. The town is situated on the banks of the Summer Lake, a large alkali lake that is the largest natural lake in Oregon. The town is surrounded by the Fremont-Winema National Forest, which provides a variety of outdoor activities, including camping, fishing, and hiking.
The climate in Paisley is semi-arid, with hot summers and cold winters. The average annual temperature is around 50 degrees Fahrenheit, and the average annual precipitation is around 10 inches.
Economy
The economy of Paisley is largely based on tourism and outdoor recreation. The town is home to several popular tourist attractions, including the Paisley Ranch, which is a popular destination for horseback riding and camping. The town is also home to several wineries, which attract visitors from all over the region.
The town is also home to several small businesses, including restaurants, shops, and galleries. The town is also home to a small airport, which provides access to the surrounding area.
Demographics
The population of Paisley was estimated to be around 200 people in 2020. The town is predominantly white, with a small Hispanic population. The median household income is around $35,000, and the median home value is around $150,000. The town has a low unemployment rate, and the poverty rate is below the national average.
Common Questions
What is Per Capita Income in Paisley?
Per Capita income in Paisley is $20,842.
What is the Median Family Income in Paisley?
Median Family Income in Paisley is $61,750.
What is the Median Household income in Paisley?
Median Household Income in Paisley is $44,609.
What is Inequality or Gini Index in Paisley?
Inequality or Gini Index in Paisley is 0.32.
What is the Total Population of Paisley?
Total Population of Paisley is 283.
What is the Total Male Population of Paisley?
Total Male Population of Paisley is 142.
What is the Total Female Population of Paisley?
Total Female Population of Paisley is 141.
What is the Ratio of Males per 100 Females in Paisley?
There are 100.71 Males per 100 Females in Paisley.
What is the Ratio of Females per 100 Males in Paisley?
There are 99.30 Females per 100 Males in Paisley.
What is the Median Population Age in Paisley?
Median Population Age in Paisley is 29.6 Years.
What is the Average Family Size in Paisley
Average Family Size in Paisley is 3.7 People.
What is the Average Household Size in Paisley
Average Household Size in Paisley is 2.4 People.
How Large is the Labor Force in Paisley?
There are 114 People in the Labor Forcein in Paisley.
What is the Percentage of People in the Labor Force in Paisley?
56.7% of People are in the Labor Force in Paisley.
What is the Unemployment Rate in Paisley?
Unemployment Rate in Paisley is 8.8%.