Lacomb, OR Map & Demographics
Lacomb Map
Lacomb Overview
$27,787
PER CAPITA INCOME
$71,853
AVG FAMILY INCOME
$71,494
AVG HOUSEHOLD INCOME
0.28
INEQUALITY / GINI INDEX
685
TOTAL POPULATION
371
MALE POPULATION
314
FEMALE POPULATION
118.15
MALES / 100 FEMALES
84.64
FEMALES / 100 MALES
62.8
MEDIAN AGE
2.7
AVG FAMILY SIZE
2.2
AVG HOUSEHOLD SIZE
432
LABOR FORCE [ PEOPLE ]
68.4%
PERCENT IN LABOR FORCE
11.1%
UNEMPLOYMENT RATE
Income in Lacomb
Income Overview in Lacomb
Per Capita Income in Lacomb is $27,787, while median incomes of families and households are $71,853 and $71,494 respectively.
| Characteristic | Number | Measure |
| Per Capita Income | 685 | $27,787 |
| Median Family Income | 207 | $71,853 |
| Mean Family Income | 207 | $68,405 |
| Median Household Income | 302 | $71,494 |
| Mean Household Income | 302 | $61,384 |
| Income Deficit | 207 | $0 |
| Wage / Income Gap (%) | 685 | 0.00% |
| Wage / Income Gap ($) | 685 | 100.00¢ per $1 |
| Gini / Inequality Index | 685 | 0.28 |
Earnings by Sex in Lacomb
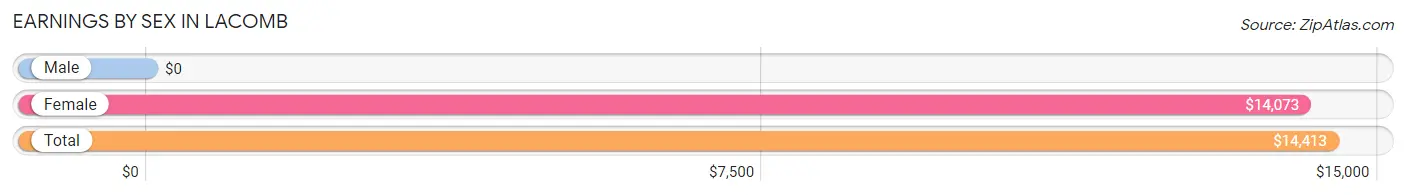
| Sex | Number | Average Earnings |
| Male | 239 (62.1%) | $0 |
| Female | 146 (37.9%) | $14,073 |
| Total | 385 (100.0%) | $14,413 |
Earnings by Sex by Income Bracket in Lacomb
The most common earnings brackets in Lacomb are $12,500 to $14,999 for men (109 | 45.6%) and $12,500 to $14,999 for women (89 | 61.0%).
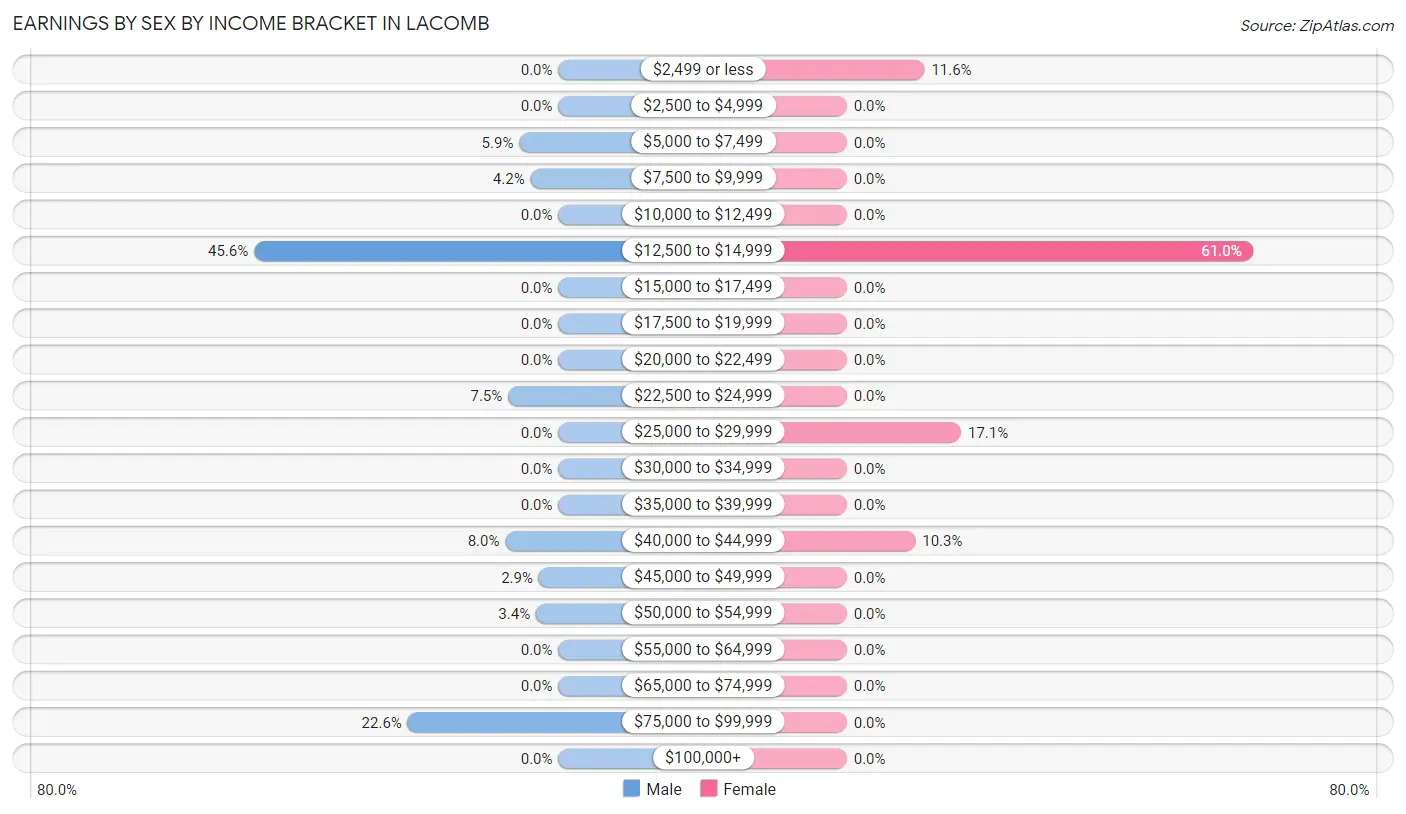
| Income | Male | Female |
| $2,499 or less | 0 (0.0%) | 17 (11.6%) |
| $2,500 to $4,999 | 0 (0.0%) | 0 (0.0%) |
| $5,000 to $7,499 | 14 (5.9%) | 0 (0.0%) |
| $7,500 to $9,999 | 10 (4.2%) | 0 (0.0%) |
| $10,000 to $12,499 | 0 (0.0%) | 0 (0.0%) |
| $12,500 to $14,999 | 109 (45.6%) | 89 (61.0%) |
| $15,000 to $17,499 | 0 (0.0%) | 0 (0.0%) |
| $17,500 to $19,999 | 0 (0.0%) | 0 (0.0%) |
| $20,000 to $22,499 | 0 (0.0%) | 0 (0.0%) |
| $22,500 to $24,999 | 18 (7.5%) | 0 (0.0%) |
| $25,000 to $29,999 | 0 (0.0%) | 25 (17.1%) |
| $30,000 to $34,999 | 0 (0.0%) | 0 (0.0%) |
| $35,000 to $39,999 | 0 (0.0%) | 0 (0.0%) |
| $40,000 to $44,999 | 19 (8.0%) | 15 (10.3%) |
| $45,000 to $49,999 | 7 (2.9%) | 0 (0.0%) |
| $50,000 to $54,999 | 8 (3.4%) | 0 (0.0%) |
| $55,000 to $64,999 | 0 (0.0%) | 0 (0.0%) |
| $65,000 to $74,999 | 0 (0.0%) | 0 (0.0%) |
| $75,000 to $99,999 | 54 (22.6%) | 0 (0.0%) |
| $100,000+ | 0 (0.0%) | 0 (0.0%) |
| Total | 239 (100.0%) | 146 (100.0%) |
Earnings by Sex by Educational Attainment in Lacomb
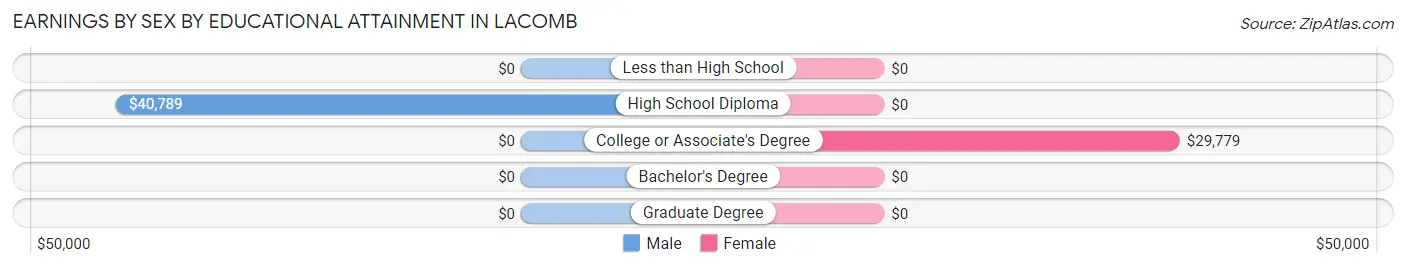
| Educational Attainment | Male Income | Female Income |
| Less than High School | - | - |
| High School Diploma | $40,789 | $0 |
| College or Associate's Degree | - | - |
| Bachelor's Degree | - | - |
| Graduate Degree | - | - |
| Total | - | - |
Family Income in Lacomb
Family Income Brackets in Lacomb
According to the Lacomb family income data, there are 89 families falling into the $50,000 to $74,999 income range, which is the most common income bracket and makes up 43.0% of all families.
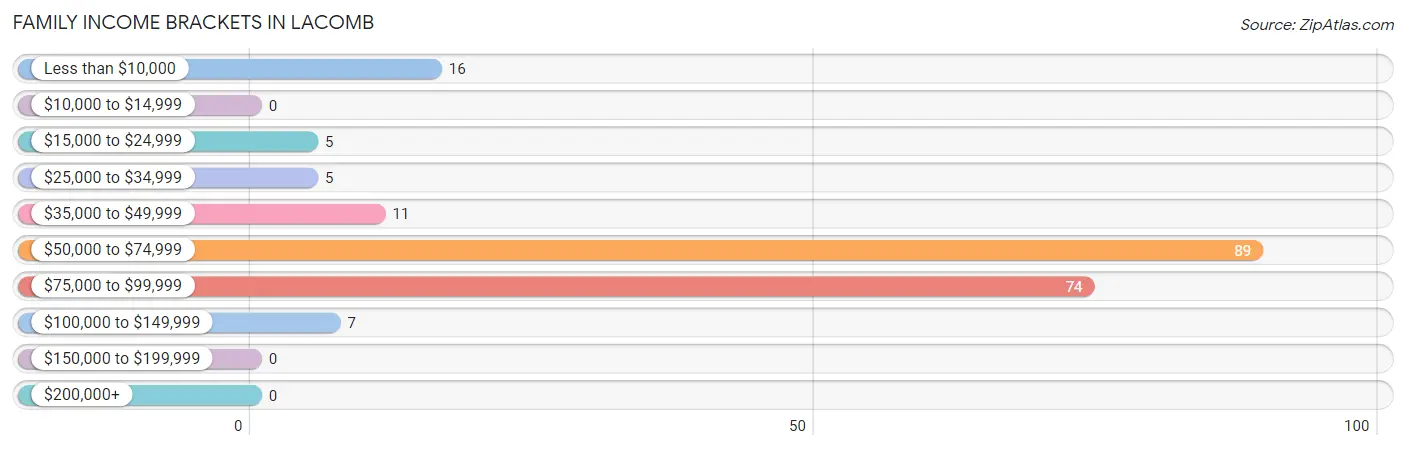
| Income Bracket | # Families | % Families |
| Less than $10,000 | 16 | 7.7% |
| $10,000 to $14,999 | 0 | 0.0% |
| $15,000 to $24,999 | 5 | 2.4% |
| $25,000 to $34,999 | 5 | 2.4% |
| $35,000 to $49,999 | 11 | 5.3% |
| $50,000 to $74,999 | 89 | 43.0% |
| $75,000 to $99,999 | 74 | 35.7% |
| $100,000 to $149,999 | 7 | 3.4% |
| $150,000 to $199,999 | 0 | 0.0% |
| $200,000+ | 0 | 0.0% |
Family Income by Famaliy Size in Lacomb
2-person families (146 | 70.5%) account for the highest median family income in Lacomb with $71,437 per family, while 2-person families (146 | 70.5%) have the highest median income of $35,718 per family member.
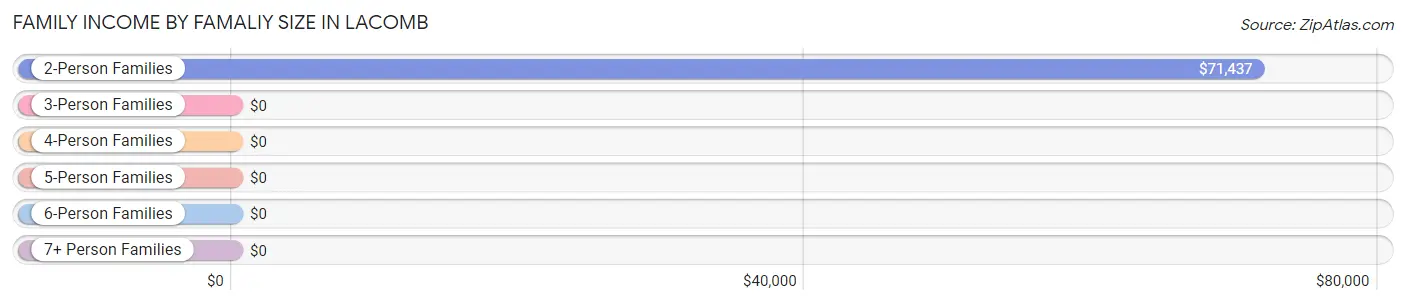
| Income Bracket | # Families | Median Income |
| 2-Person Families | 146 (70.5%) | $71,437 |
| 3-Person Families | 8 (3.9%) | $0 |
| 4-Person Families | 41 (19.8%) | $0 |
| 5-Person Families | 12 (5.8%) | $0 |
| 6-Person Families | 0 (0.0%) | $0 |
| 7+ Person Families | 0 (0.0%) | $0 |
| Total | 207 (100.0%) | $71,853 |
Family Income by Number of Earners in Lacomb
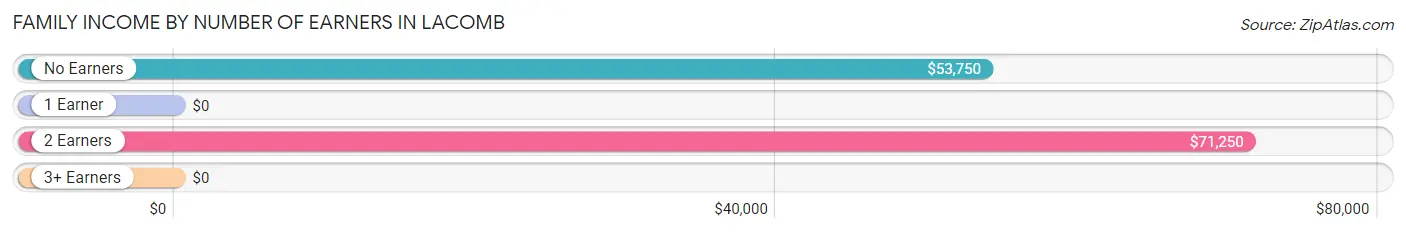
| Number of Earners | # Families | Median Income |
| No Earners | 44 (21.3%) | $53,750 |
| 1 Earner | 19 (9.2%) | $0 |
| 2 Earners | 119 (57.5%) | $71,250 |
| 3+ Earners | 25 (12.1%) | $0 |
| Total | 207 (100.0%) | $71,853 |
Household Income in Lacomb
Household Income Brackets in Lacomb
With 94 households falling in the category, the $75,000 to $99,999 income range is the most frequent in Lacomb, accounting for 31.1% of all households.
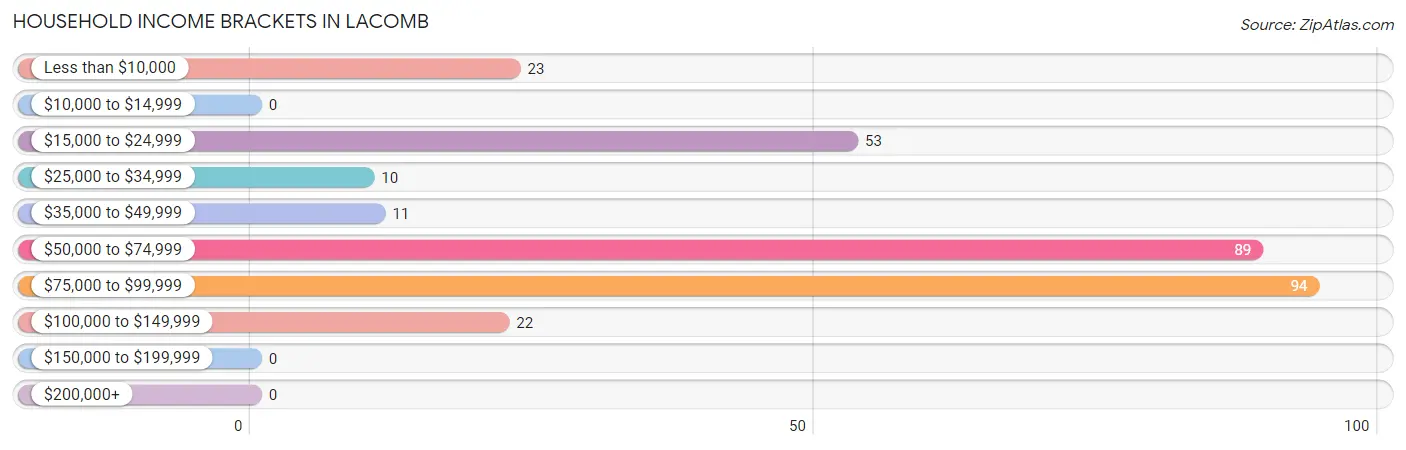
| Income Bracket | # Households | % Households |
| Less than $10,000 | 23 | 7.6% |
| $10,000 to $14,999 | 0 | 0.0% |
| $15,000 to $24,999 | 53 | 17.5% |
| $25,000 to $34,999 | 10 | 3.3% |
| $35,000 to $49,999 | 11 | 3.6% |
| $50,000 to $74,999 | 89 | 29.5% |
| $75,000 to $99,999 | 94 | 31.1% |
| $100,000 to $149,999 | 22 | 7.3% |
| $150,000 to $199,999 | 0 | 0.0% |
| $200,000+ | 0 | 0.0% |
Household Income by Householder Age in Lacomb
The median household income in Lacomb is $71,494, with the highest median household income of $71,049 found in the 65+ years age bracket for the primary householder. A total of 143 households (47.3%) fall into this category.
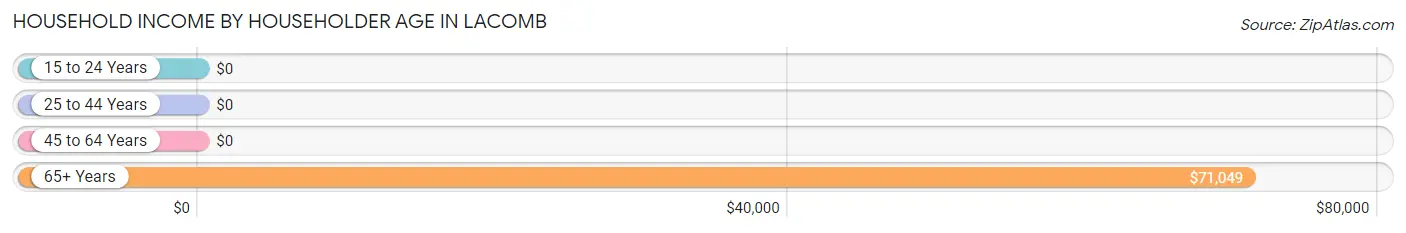
| Income Bracket | # Households | Median Income |
| 15 to 24 Years | 0 (0.0%) | $0 |
| 25 to 44 Years | 39 (12.9%) | $0 |
| 45 to 64 Years | 120 (39.7%) | $0 |
| 65+ Years | 143 (47.3%) | $71,049 |
| Total | 302 (100.0%) | $71,494 |
Poverty in Lacomb
Income Below Poverty by Sex and Age in Lacomb
With 12.0% poverty level for males and 21.1% for females among the residents of Lacomb, under 5 year old males and 16 and 17 year old females are the most vulnerable to poverty, with 16 males (69.6%) and 37 females (100.0%) in their respective age groups living below the poverty level.
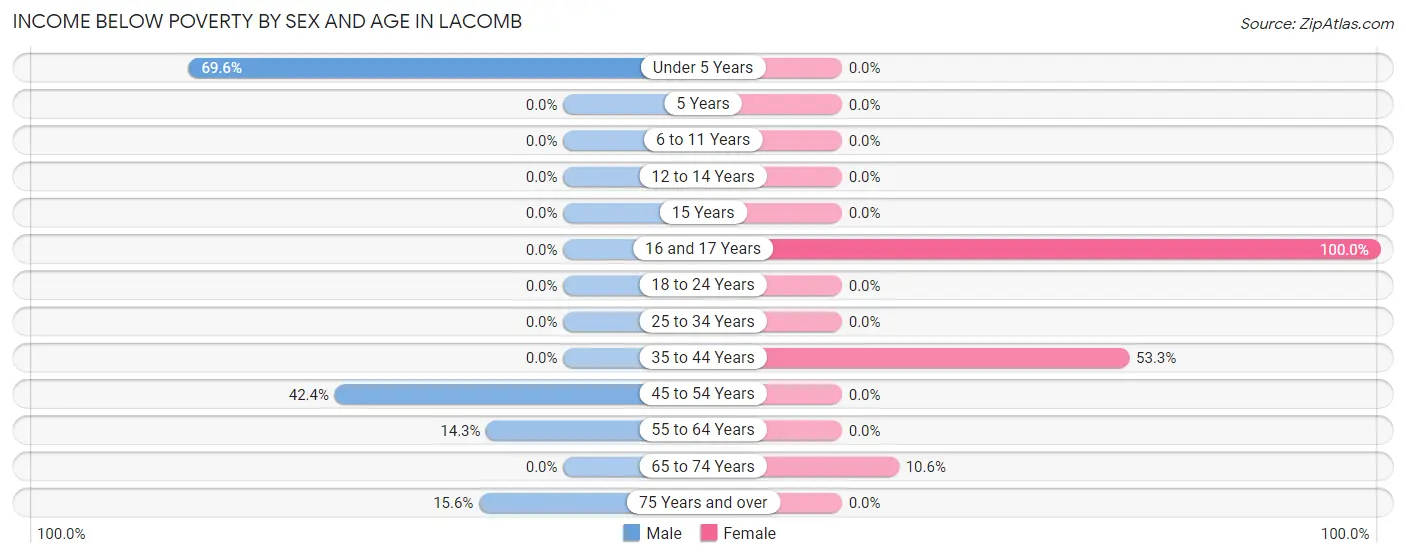
| Age Bracket | Male | Female |
| Under 5 Years | 16 (69.6%) | 0 (0.0%) |
| 5 Years | 0 (0.0%) | 0 (0.0%) |
| 6 to 11 Years | 0 (0.0%) | 0 (0.0%) |
| 12 to 14 Years | 0 (0.0%) | 0 (0.0%) |
| 15 Years | 0 (0.0%) | 0 (0.0%) |
| 16 and 17 Years | 0 (0.0%) | 37 (100.0%) |
| 18 to 24 Years | 0 (0.0%) | 0 (0.0%) |
| 25 to 34 Years | 0 (0.0%) | 0 (0.0%) |
| 35 to 44 Years | 0 (0.0%) | 16 (53.3%) |
| 45 to 54 Years | 14 (42.4%) | 0 (0.0%) |
| 55 to 64 Years | 9 (14.3%) | 0 (0.0%) |
| 65 to 74 Years | 0 (0.0%) | 13 (10.6%) |
| 75 Years and over | 5 (15.6%) | 0 (0.0%) |
| Total | 44 (12.0%) | 66 (21.1%) |
Income Above Poverty by Sex and Age in Lacomb
According to the poverty statistics in Lacomb, males aged 12 to 14 years and females aged 25 to 34 years are the age groups that are most secure financially, with 100.0% of males and 100.0% of females in these age groups living above the poverty line.
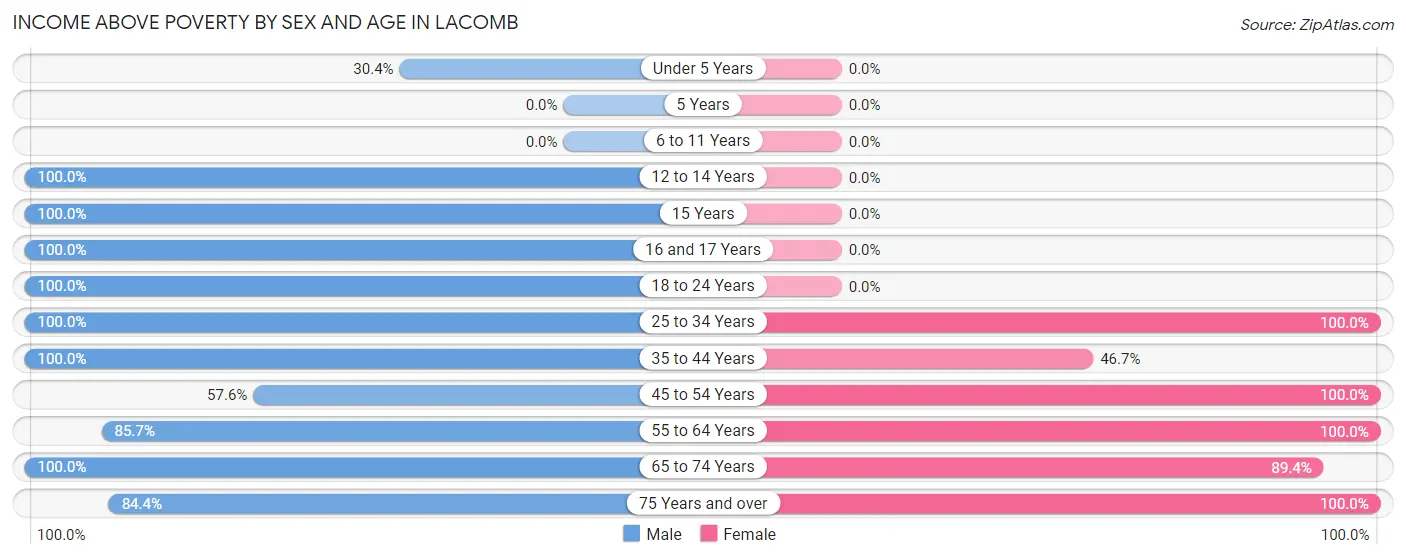
| Age Bracket | Male | Female |
| Under 5 Years | 7 (30.4%) | 0 (0.0%) |
| 5 Years | 0 (0.0%) | 0 (0.0%) |
| 6 to 11 Years | 0 (0.0%) | 0 (0.0%) |
| 12 to 14 Years | 16 (100.0%) | 0 (0.0%) |
| 15 Years | 14 (100.0%) | 0 (0.0%) |
| 16 and 17 Years | 10 (100.0%) | 0 (0.0%) |
| 18 to 24 Years | 39 (100.0%) | 0 (0.0%) |
| 25 to 34 Years | 18 (100.0%) | 17 (100.0%) |
| 35 to 44 Years | 15 (100.0%) | 14 (46.7%) |
| 45 to 54 Years | 19 (57.6%) | 7 (100.0%) |
| 55 to 64 Years | 54 (85.7%) | 87 (100.0%) |
| 65 to 74 Years | 104 (100.0%) | 110 (89.4%) |
| 75 Years and over | 27 (84.4%) | 12 (100.0%) |
| Total | 323 (88.0%) | 247 (78.9%) |
Income Below Poverty Among Married-Couple Families in Lacomb
The poverty statistics for married-couple families in Lacomb show that 10.5% or 21 of the total 200 families live below the poverty line. Families with 1 or 2 children have the highest poverty rate of 44.4%, comprising of 16 families. On the other hand, families with no children have the lowest poverty rate of 3.0%, which includes 5 families.
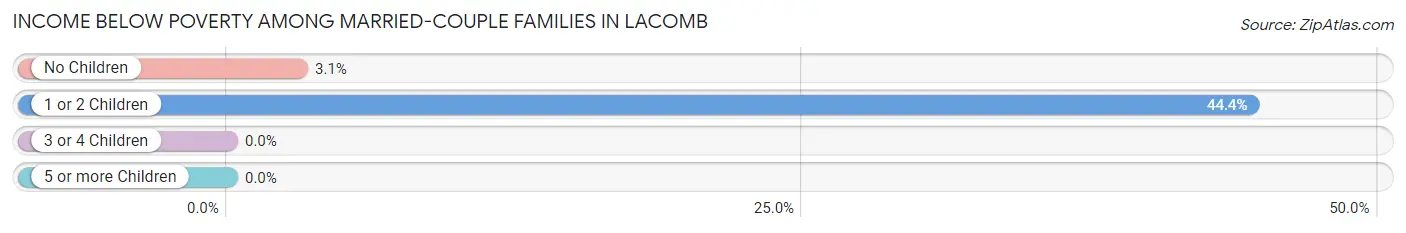
| Children | Above Poverty | Below Poverty |
| No Children | 159 (97.0%) | 5 (3.0%) |
| 1 or 2 Children | 20 (55.6%) | 16 (44.4%) |
| 3 or 4 Children | 0 (0.0%) | 0 (0.0%) |
| 5 or more Children | 0 (0.0%) | 0 (0.0%) |
| Total | 179 (89.5%) | 21 (10.5%) |
Income Below Poverty Among Single-Parent Households in Lacomb
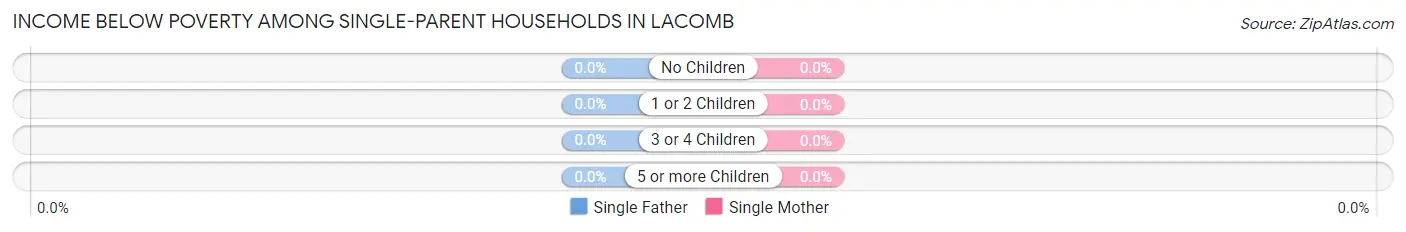
| Children | Single Father | Single Mother |
| No Children | 0 (0.0%) | 0 (0.0%) |
| 1 or 2 Children | 0 (0.0%) | 0 (0.0%) |
| 3 or 4 Children | 0 (0.0%) | 0 (0.0%) |
| 5 or more Children | 0 (0.0%) | 0 (0.0%) |
| Total | 0 (0.0%) | 0 (0.0%) |
Income Below Poverty Among Married-Couple vs Single-Parent Households in Lacomb
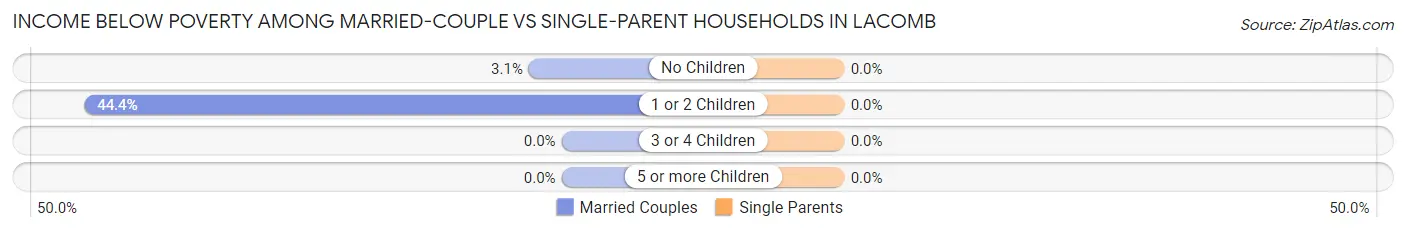
| Children | Married-Couple Families | Single-Parent Households |
| No Children | 5 (3.0%) | 0 (0.0%) |
| 1 or 2 Children | 16 (44.4%) | 0 (0.0%) |
| 3 or 4 Children | 0 (0.0%) | 0 (0.0%) |
| 5 or more Children | 0 (0.0%) | 0 (0.0%) |
| Total | 21 (10.5%) | 0 (0.0%) |
Race in Lacomb
The most populous races in Lacomb are White / Caucasian (581 | 84.8%), and Two or more Races (104 | 15.2%).
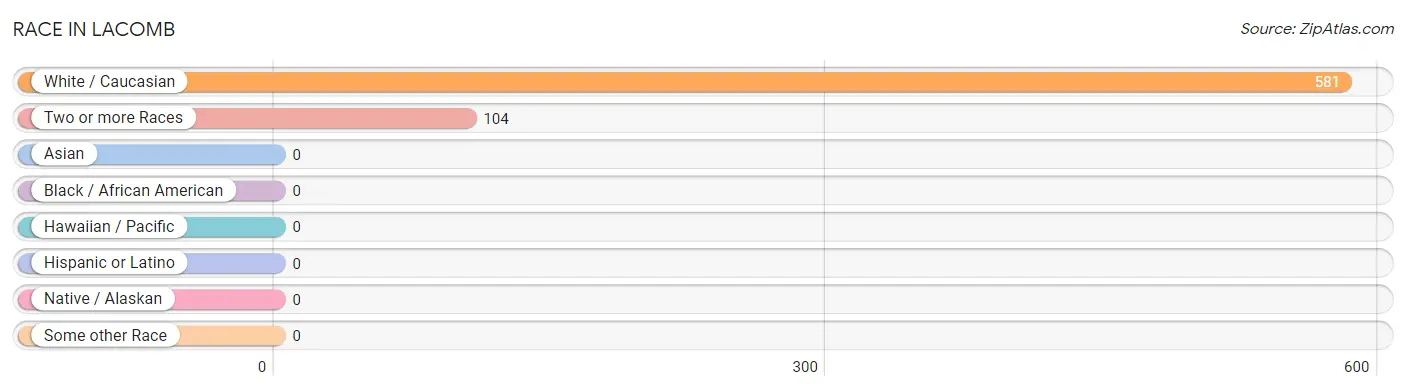
| Race | # Population | % Population |
| Asian | 0 | 0.0% |
| Black / African American | 0 | 0.0% |
| Hawaiian / Pacific | 0 | 0.0% |
| Hispanic or Latino | 0 | 0.0% |
| Native / Alaskan | 0 | 0.0% |
| White / Caucasian | 581 | 84.8% |
| Two or more Races | 104 | 15.2% |
| Some other Race | 0 | 0.0% |
| Total | 685 | 100.0% |
Ancestry in Lacomb
The most populous ancestries reported in Lacomb are Irish (331 | 48.3%), German (276 | 40.3%), Scottish (59 | 8.6%), Cherokee (55 | 8.0%), and French (51 | 7.4%), together accounting for 112.7% of all Lacomb residents.
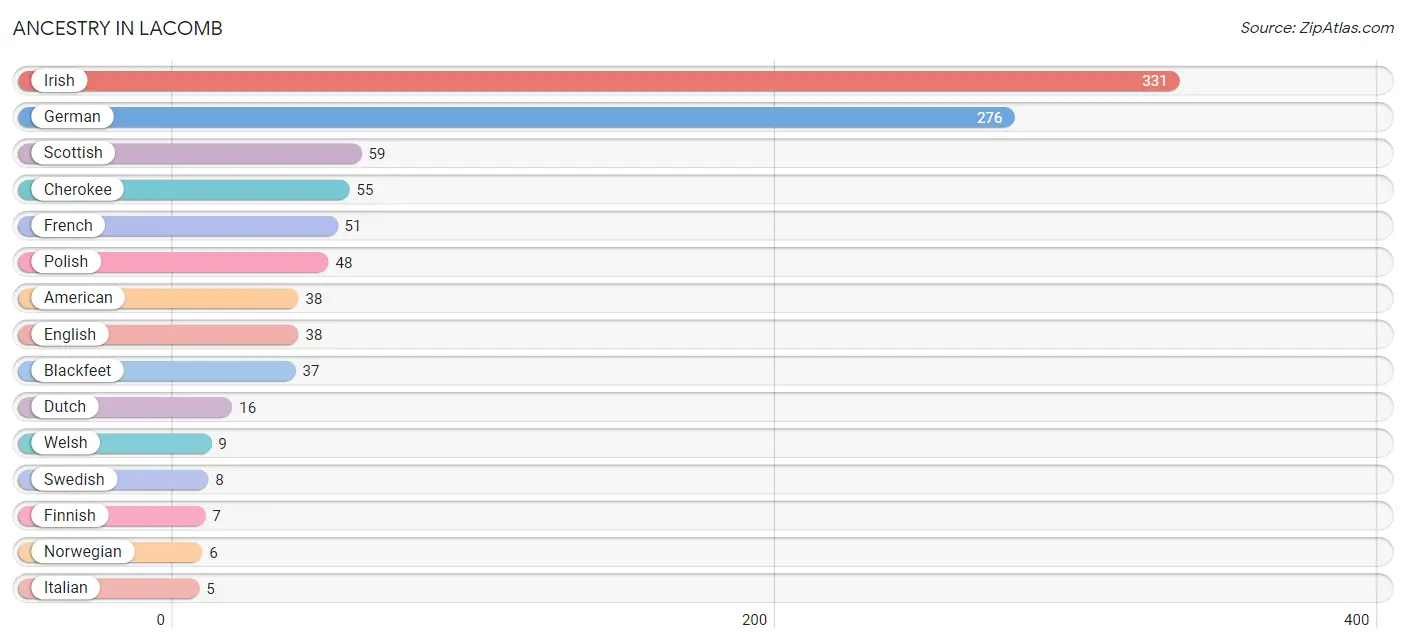
| Ancestry | # Population | % Population |
| American | 38 | 5.6% |
| Blackfeet | 37 | 5.4% |
| Cherokee | 55 | 8.0% |
| Dutch | 16 | 2.3% |
| English | 38 | 5.6% |
| Finnish | 7 | 1.0% |
| French | 51 | 7.4% |
| German | 276 | 40.3% |
| Irish | 331 | 48.3% |
| Italian | 5 | 0.7% |
| Norwegian | 6 | 0.9% |
| Polish | 48 | 7.0% |
| Scottish | 59 | 8.6% |
| Swedish | 8 | 1.2% |
| Welsh | 9 | 1.3% | View All 15 Rows |
Immigrants in Lacomb
The most numerous immigrant groups reported in Lacomb came from Armenia (1 | 0.2%), Asia (1 | 0.2%), and Western Asia (1 | 0.2%), together accounting for 0.5% of all Lacomb residents.
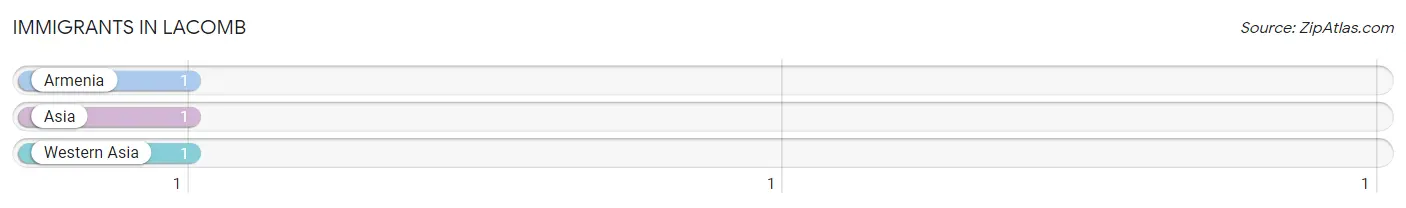
| Immigration Origin | # Population | % Population |
| Armenia | 1 | 0.2% |
| Asia | 1 | 0.2% |
| Western Asia | 1 | 0.2% | View All 3 Rows |
Sex and Age in Lacomb
Sex and Age in Lacomb
The most populous age groups in Lacomb are 65 to 69 Years (104 | 28.0%) for men and 65 to 69 Years (111 | 35.3%) for women.
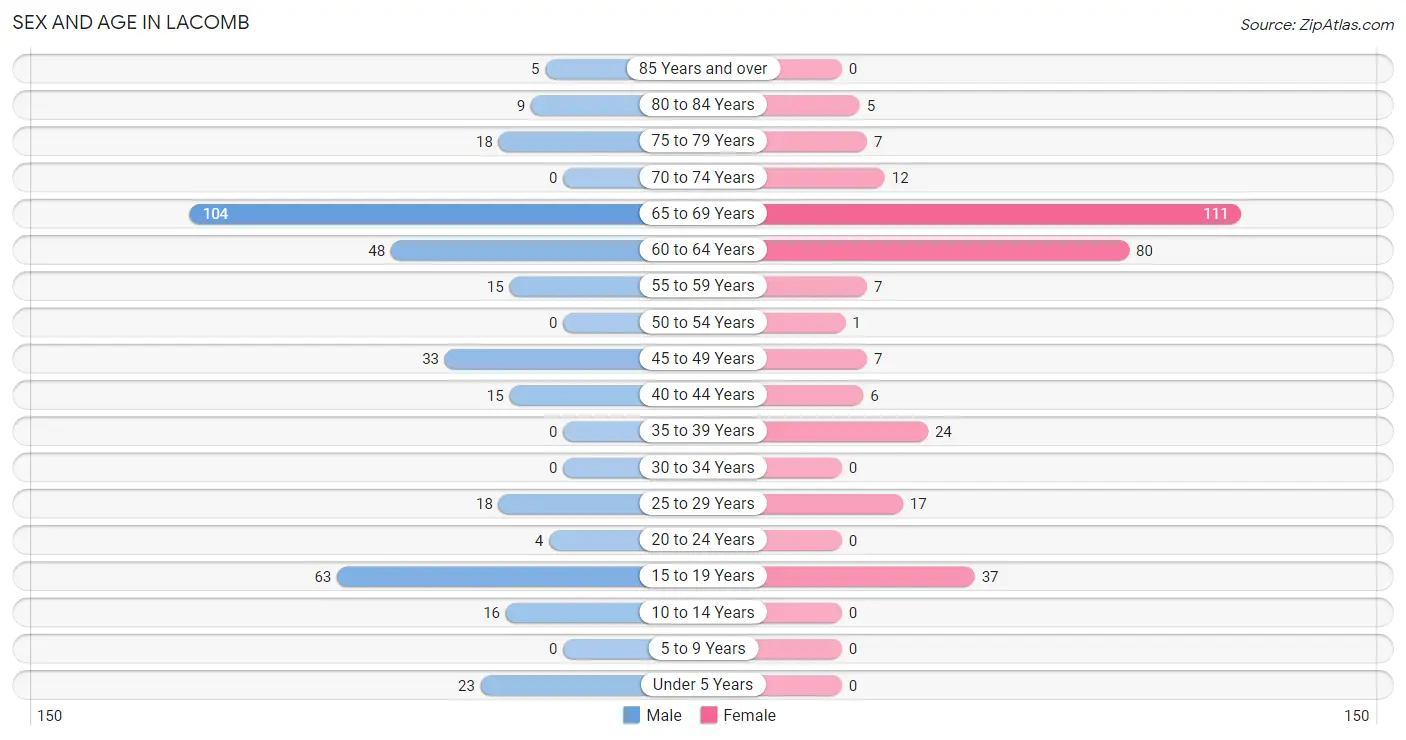
| Age Bracket | Male | Female |
| Under 5 Years | 23 (6.2%) | 0 (0.0%) |
| 5 to 9 Years | 0 (0.0%) | 0 (0.0%) |
| 10 to 14 Years | 16 (4.3%) | 0 (0.0%) |
| 15 to 19 Years | 63 (17.0%) | 37 (11.8%) |
| 20 to 24 Years | 4 (1.1%) | 0 (0.0%) |
| 25 to 29 Years | 18 (4.9%) | 17 (5.4%) |
| 30 to 34 Years | 0 (0.0%) | 0 (0.0%) |
| 35 to 39 Years | 0 (0.0%) | 24 (7.6%) |
| 40 to 44 Years | 15 (4.0%) | 6 (1.9%) |
| 45 to 49 Years | 33 (8.9%) | 7 (2.2%) |
| 50 to 54 Years | 0 (0.0%) | 1 (0.3%) |
| 55 to 59 Years | 15 (4.0%) | 7 (2.2%) |
| 60 to 64 Years | 48 (12.9%) | 80 (25.5%) |
| 65 to 69 Years | 104 (28.0%) | 111 (35.3%) |
| 70 to 74 Years | 0 (0.0%) | 12 (3.8%) |
| 75 to 79 Years | 18 (4.9%) | 7 (2.2%) |
| 80 to 84 Years | 9 (2.4%) | 5 (1.6%) |
| 85 Years and over | 5 (1.3%) | 0 (0.0%) |
| Total | 371 (100.0%) | 314 (100.0%) |
Families and Households in Lacomb
Median Family Size in Lacomb
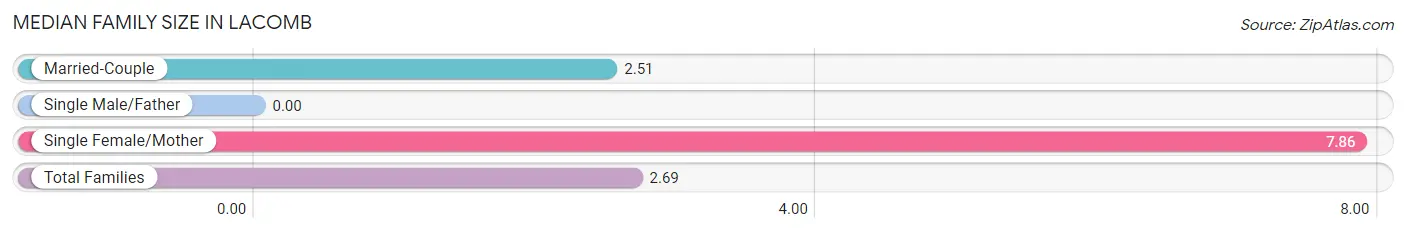
| Family Type | # Families | Family Size |
| Married-Couple | 200 (96.6%) | 2.51 |
| Single Male/Father | 0 (0.0%) | - |
| Single Female/Mother | 7 (3.4%) | 7.86 |
| Total Families | 207 (100.0%) | 2.69 |
Median Household Size in Lacomb
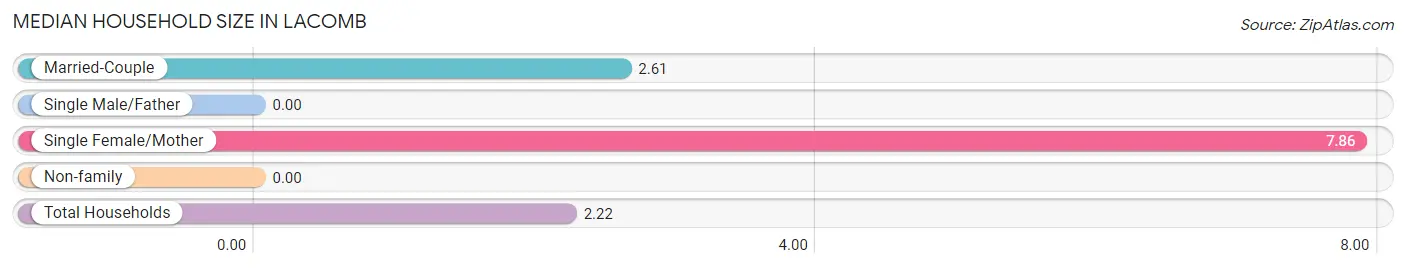
| Household Type | # Households | Household Size |
| Married-Couple | 200 (66.2%) | 2.61 |
| Single Male/Father | 0 (0.0%) | - |
| Single Female/Mother | 7 (2.3%) | 7.86 |
| Non-family | 95 (31.5%) | - |
| Total Households | 302 (100.0%) | 2.22 |
Household Size by Marriage Status in Lacomb
Out of a total of 302 households in Lacomb, 207 (68.5%) are family households, while 95 (31.5%) are nonfamily households. The most numerous type of family households are 2-person households, comprising 146, and the most common type of nonfamily households are 1-person households, comprising 95.
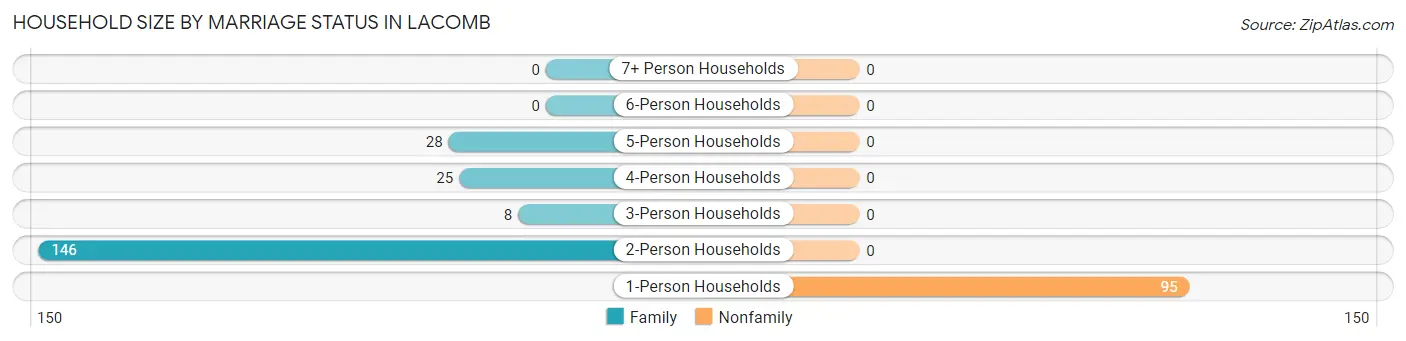
| Household Size | Family Households | Nonfamily Households |
| 1-Person Households | - | 95 (31.5%) |
| 2-Person Households | 146 (48.3%) | 0 (0.0%) |
| 3-Person Households | 8 (2.6%) | 0 (0.0%) |
| 4-Person Households | 25 (8.3%) | 0 (0.0%) |
| 5-Person Households | 28 (9.3%) | 0 (0.0%) |
| 6-Person Households | 0 (0.0%) | 0 (0.0%) |
| 7+ Person Households | 0 (0.0%) | 0 (0.0%) |
| Total | 207 (68.5%) | 95 (31.5%) |
Female Fertility in Lacomb
Fertility by Age in Lacomb
| Age Bracket | Women with Births | Births / 1,000 Women |
| 15 to 19 years | 0 (0.0%) | 0.0 |
| 20 to 34 years | 0 (0.0%) | 0.0 |
| 35 to 50 years | 0 (0.0%) | 0.0 |
| Total | 0 (0.0%) | 0.0 |
Fertility by Age by Marriage Status in Lacomb
| Age Bracket | Married | Unmarried |
| 15 to 19 years | 0 (0.0%) | 0 (0.0%) |
| 20 to 34 years | 0 (0.0%) | 0 (0.0%) |
| 35 to 50 years | 0 (0.0%) | 0 (0.0%) |
| Total | 0 (0.0%) | 0 (0.0%) |
Fertility by Education in Lacomb
| Educational Attainment | Women with Births | Births / 1,000 Women |
| Less than High School | 0 (0.0%) | 0.0 |
| High School Diploma | 0 (0.0%) | 0.0 |
| College or Associate's Degree | 0 (0.0%) | 0.0 |
| Bachelor's Degree | 0 (0.0%) | 0.0 |
| Graduate Degree | 0 (0.0%) | 0.0 |
| Total | 0 (0.0%) | 0.0 |
Fertility by Education by Marriage Status in Lacomb
| Educational Attainment | Married | Unmarried |
| Less than High School | 0 (0.0%) | 0 (0.0%) |
| High School Diploma | 0 (0.0%) | 0 (0.0%) |
| College or Associate's Degree | 0 (0.0%) | 0 (0.0%) |
| Bachelor's Degree | 0 (0.0%) | 0 (0.0%) |
| Graduate Degree | 0 (0.0%) | 0 (0.0%) |
| Total | 0 (0.0%) | 0 (0.0%) |
Employment Characteristics in Lacomb
Employment by Class of Employer in Lacomb
Among the 384 employed individuals in Lacomb, self-employed (not incorporated) (206 | 53.6%), private company employees (162 | 42.2%), and not-for-profit organizations (8 | 2.1%) make up the most common classes of employment.
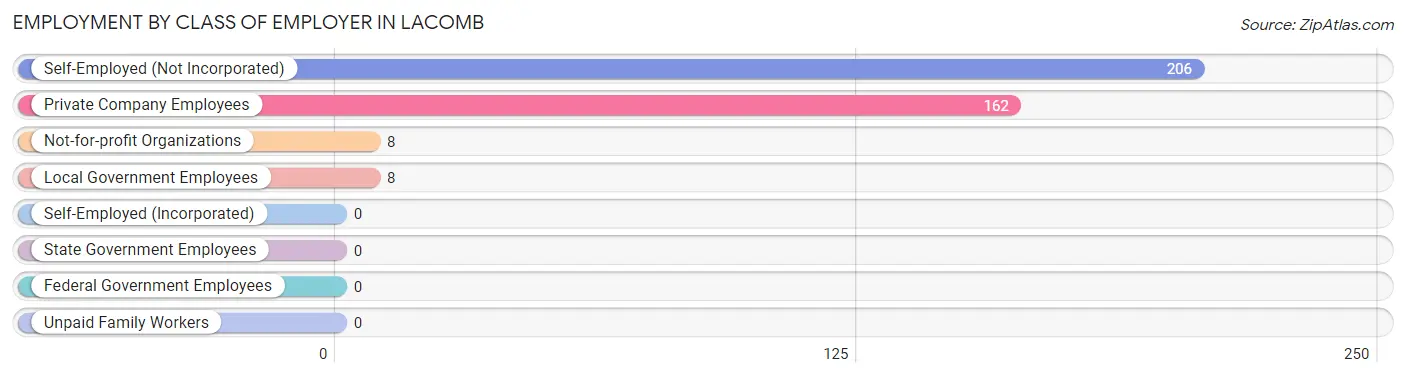
| Employer Class | # Employees | % Employees |
| Private Company Employees | 162 | 42.2% |
| Self-Employed (Incorporated) | 0 | 0.0% |
| Self-Employed (Not Incorporated) | 206 | 53.6% |
| Not-for-profit Organizations | 8 | 2.1% |
| Local Government Employees | 8 | 2.1% |
| State Government Employees | 0 | 0.0% |
| Federal Government Employees | 0 | 0.0% |
| Unpaid Family Workers | 0 | 0.0% |
| Total | 384 | 100.0% |
Employment Status by Age in Lacomb
According to the labor force statistics for Lacomb, out of the total population over 16 years of age (632), 68.4% or 432 individuals are in the labor force, with 11.1% or 48 of them unemployed. The age group with the highest labor force participation rate is 25 to 29 years, with 100.0% or 35 individuals in the labor force. Within the labor force, the 60 to 64 years age range has the highest percentage of unemployed individuals, with 50.5% or 48 of them being unemployed.
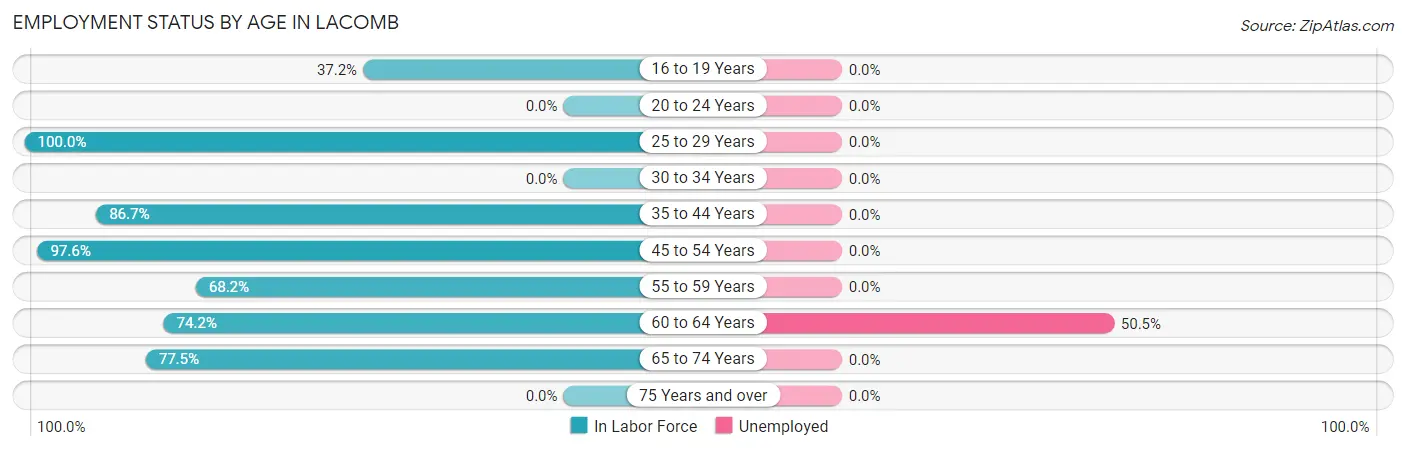
| Age Bracket | In Labor Force | Unemployed |
| 16 to 19 Years | 32 (37.2%) | 0 (0.0%) |
| 20 to 24 Years | 0 (0.0%) | 0 (0.0%) |
| 25 to 29 Years | 35 (100.0%) | 0 (0.0%) |
| 30 to 34 Years | 0 (0.0%) | 0 (0.0%) |
| 35 to 44 Years | 39 (86.7%) | 0 (0.0%) |
| 45 to 54 Years | 40 (97.6%) | 0 (0.0%) |
| 55 to 59 Years | 15 (68.2%) | 0 (0.0%) |
| 60 to 64 Years | 95 (74.2%) | 48 (50.5%) |
| 65 to 74 Years | 176 (77.5%) | 0 (0.0%) |
| 75 Years and over | 0 (0.0%) | 0 (0.0%) |
| Total | 432 (68.4%) | 48 (11.1%) |
Employment Status by Educational Attainment in Lacomb
According to labor force statistics for Lacomb, 82.7% of individuals (224) out of the total population between 25 and 64 years of age (271) are in the labor force, with 21.4% or 48 of them being unemployed. The group with the highest labor force participation rate are those with the educational attainment of bachelor's degree or higher, with 100.0% or 16 individuals in the labor force. Within the labor force, individuals with less than high school education have the highest percentage of unemployment, with 100.0% or 48 of them being unemployed.
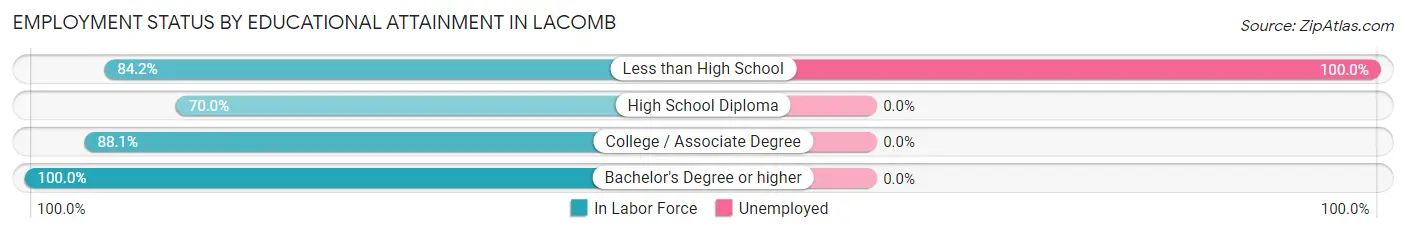
| Educational Attainment | In Labor Force | Unemployed |
| Less than High School | 48 (84.2%) | 57 (100.0%) |
| High School Diploma | 56 (70.0%) | 0 (0.0%) |
| College / Associate Degree | 104 (88.1%) | 0 (0.0%) |
| Bachelor's Degree or higher | 16 (100.0%) | 0 (0.0%) |
| Total | 224 (82.7%) | 58 (21.4%) |
Employment Occupations by Sex in Lacomb
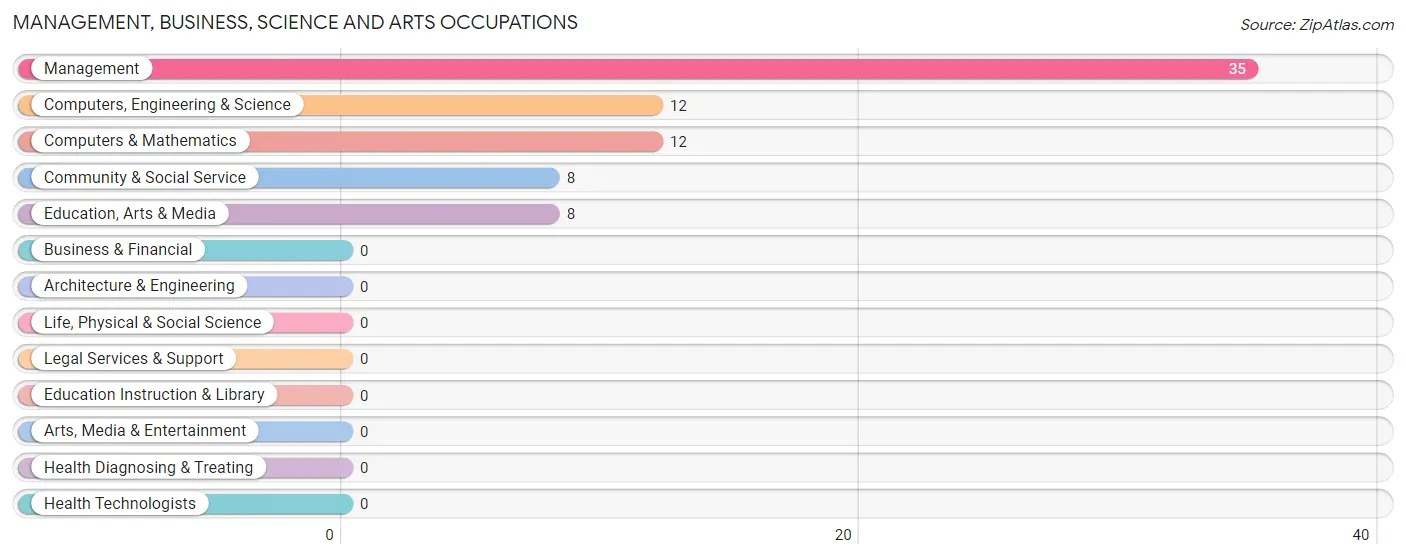
Management, Business, Science and Arts Occupations
The most common Management, Business, Science and Arts occupations in Lacomb are Management (35 | 9.1%), Computers, Engineering & Science (12 | 3.1%), Computers & Mathematics (12 | 3.1%), Community & Social Service (8 | 2.1%), and Education, Arts & Media (8 | 2.1%).
Management, Business, Science and Arts Occupations by Sex
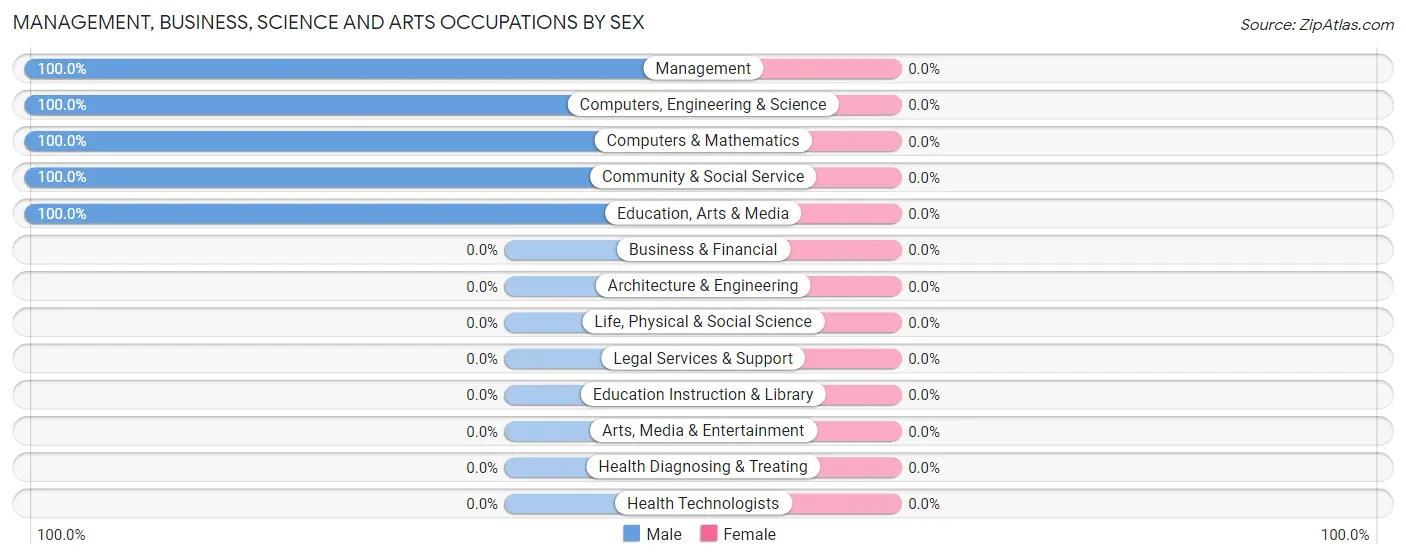
| Occupation | Male | Female |
| Management | 35 (100.0%) | 0 (0.0%) |
| Business & Financial | 0 (0.0%) | 0 (0.0%) |
| Computers, Engineering & Science | 12 (100.0%) | 0 (0.0%) |
| Computers & Mathematics | 12 (100.0%) | 0 (0.0%) |
| Architecture & Engineering | 0 (0.0%) | 0 (0.0%) |
| Life, Physical & Social Science | 0 (0.0%) | 0 (0.0%) |
| Community & Social Service | 8 (100.0%) | 0 (0.0%) |
| Education, Arts & Media | 8 (100.0%) | 0 (0.0%) |
| Legal Services & Support | 0 (0.0%) | 0 (0.0%) |
| Education Instruction & Library | 0 (0.0%) | 0 (0.0%) |
| Arts, Media & Entertainment | 0 (0.0%) | 0 (0.0%) |
| Health Diagnosing & Treating | 0 (0.0%) | 0 (0.0%) |
| Health Technologists | 0 (0.0%) | 0 (0.0%) |
| Total (Category) | 55 (100.0%) | 0 (0.0%) |
| Total (Overall) | 239 (62.2%) | 145 (37.8%) |
Services Occupations
The most common Services occupations in Lacomb are , and Healthcare Support (7 | 1.8%).
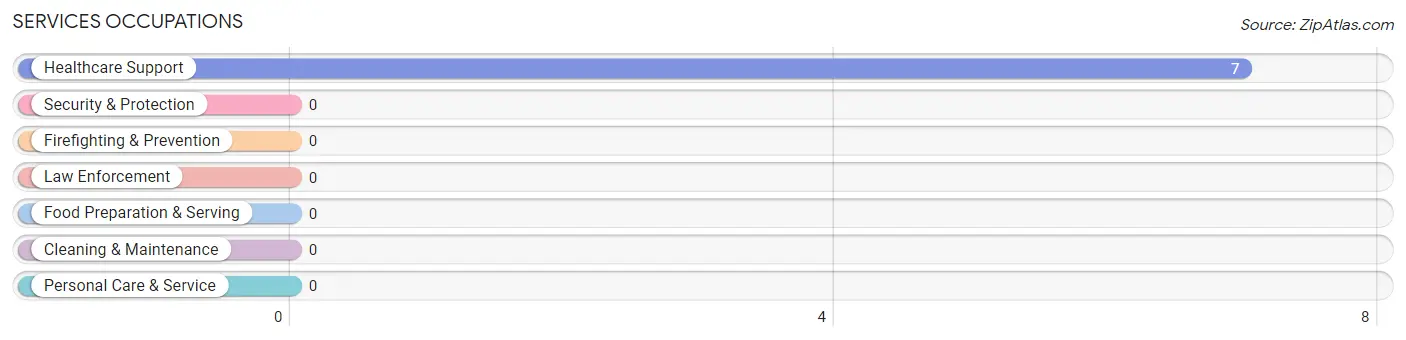
Services Occupations by Sex
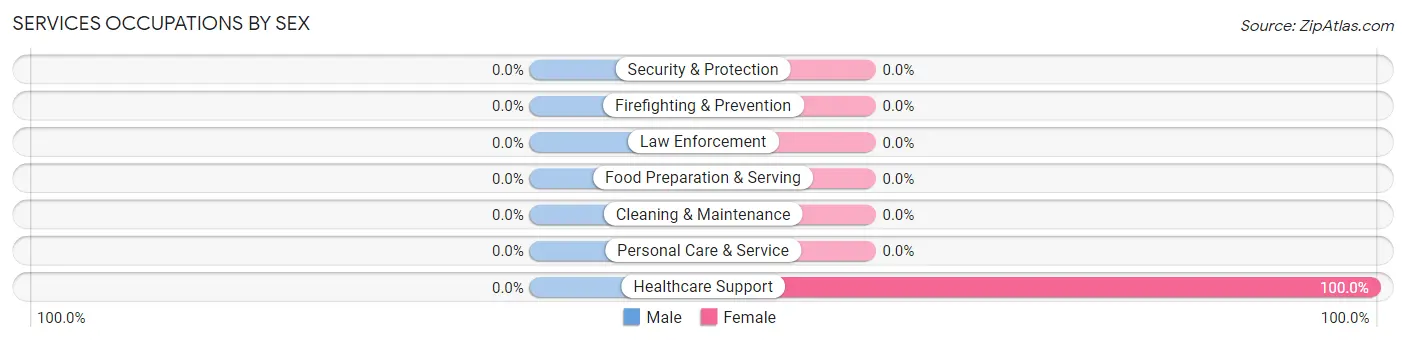
| Occupation | Male | Female |
| Healthcare Support | 0 (0.0%) | 7 (100.0%) |
| Security & Protection | 0 (0.0%) | 0 (0.0%) |
| Firefighting & Prevention | 0 (0.0%) | 0 (0.0%) |
| Law Enforcement | 0 (0.0%) | 0 (0.0%) |
| Food Preparation & Serving | 0 (0.0%) | 0 (0.0%) |
| Cleaning & Maintenance | 0 (0.0%) | 0 (0.0%) |
| Personal Care & Service | 0 (0.0%) | 0 (0.0%) |
| Total (Category) | 0 (0.0%) | 7 (100.0%) |
| Total (Overall) | 239 (62.2%) | 145 (37.8%) |
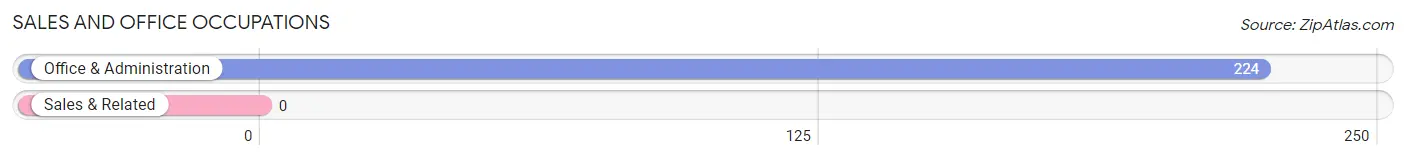
Sales and Office Occupations
The most common Sales and Office occupations in Lacomb are , and Office & Administration (224 | 58.3%).
Sales and Office Occupations by Sex
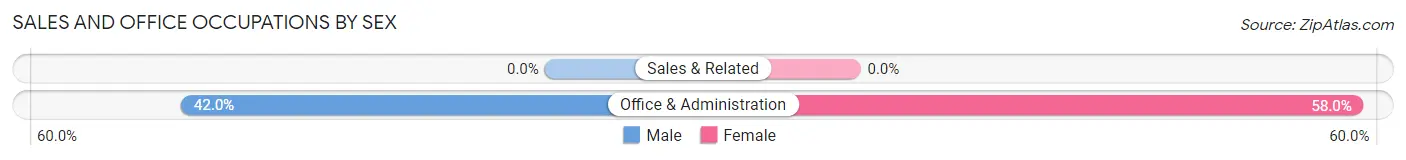
| Occupation | Male | Female |
| Sales & Related | 0 (0.0%) | 0 (0.0%) |
| Office & Administration | 94 (42.0%) | 130 (58.0%) |
| Total (Category) | 94 (42.0%) | 130 (58.0%) |
| Total (Overall) | 239 (62.2%) | 145 (37.8%) |
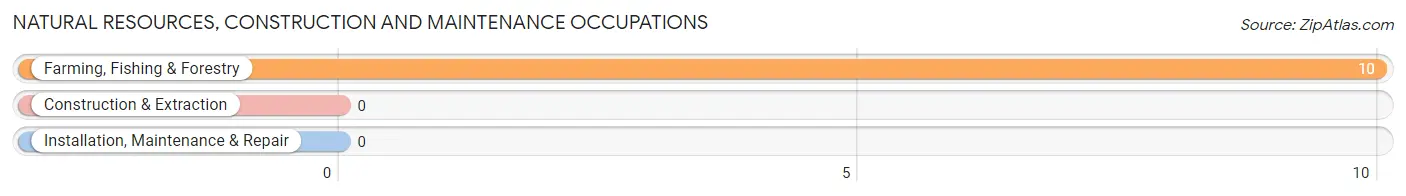
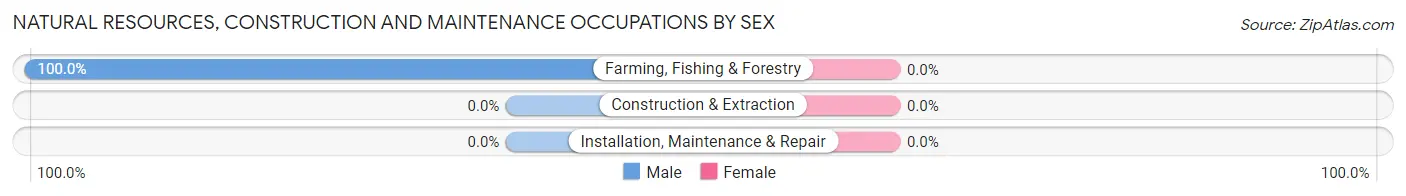
Natural Resources, Construction and Maintenance Occupations
The most common Natural Resources, Construction and Maintenance occupations in Lacomb are , and Farming, Fishing & Forestry (10 | 2.6%).
Natural Resources, Construction and Maintenance Occupations by Sex
| Occupation | Male | Female |
| Farming, Fishing & Forestry | 10 (100.0%) | 0 (0.0%) |
| Construction & Extraction | 0 (0.0%) | 0 (0.0%) |
| Installation, Maintenance & Repair | 0 (0.0%) | 0 (0.0%) |
| Total (Category) | 10 (100.0%) | 0 (0.0%) |
| Total (Overall) | 239 (62.2%) | 145 (37.8%) |
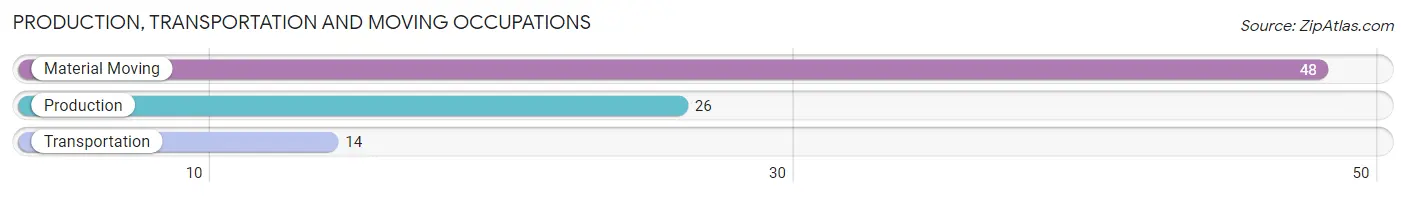
Production, Transportation and Moving Occupations
The most common Production, Transportation and Moving occupations in Lacomb are Material Moving (48 | 12.5%), Production (26 | 6.8%), and Transportation (14 | 3.6%).
Production, Transportation and Moving Occupations by Sex
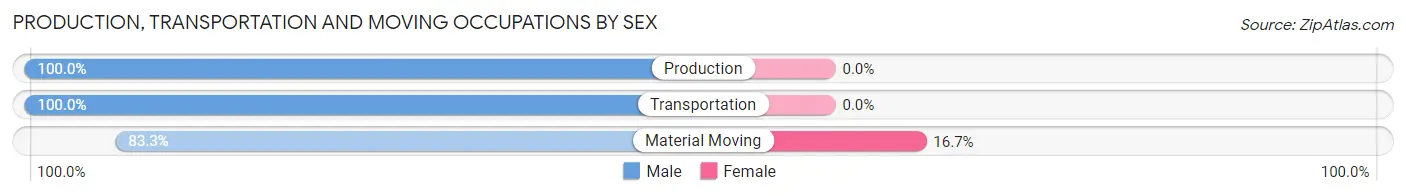
| Occupation | Male | Female |
| Production | 26 (100.0%) | 0 (0.0%) |
| Transportation | 14 (100.0%) | 0 (0.0%) |
| Material Moving | 40 (83.3%) | 8 (16.7%) |
| Total (Category) | 80 (90.9%) | 8 (9.1%) |
| Total (Overall) | 239 (62.2%) | 145 (37.8%) |
Employment Industries by Sex in Lacomb
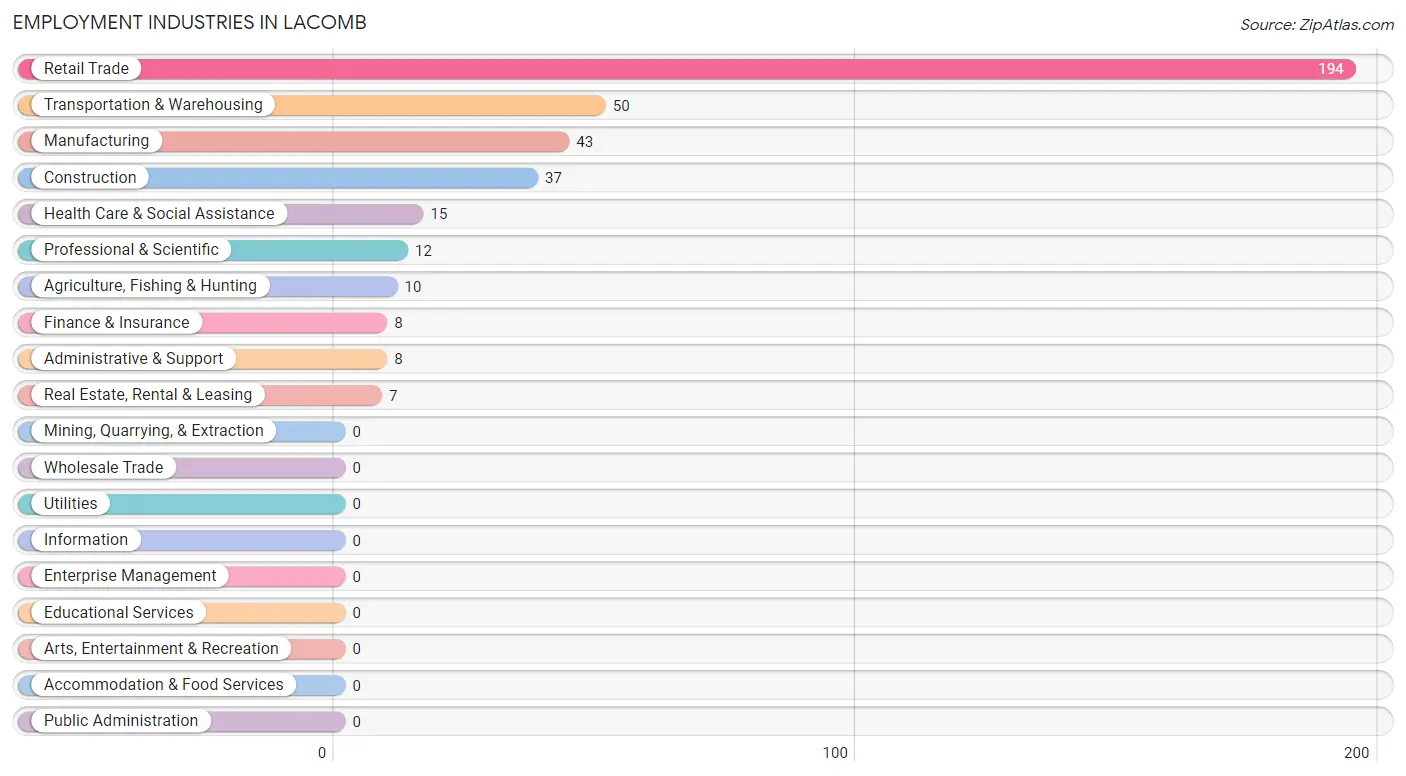
Employment Industries in Lacomb
The major employment industries in Lacomb include Retail Trade (194 | 50.5%), Transportation & Warehousing (50 | 13.0%), Manufacturing (43 | 11.2%), Construction (37 | 9.6%), and Health Care & Social Assistance (15 | 3.9%).
Employment Industries by Sex in Lacomb
The Lacomb industries that see more men than women are Agriculture, Fishing & Hunting (100.0%), Construction (100.0%), and Real Estate, Rental & Leasing (100.0%), whereas the industries that tend to have a higher number of women are Finance & Insurance (100.0%), Administrative & Support (100.0%), and Health Care & Social Assistance (46.7%).
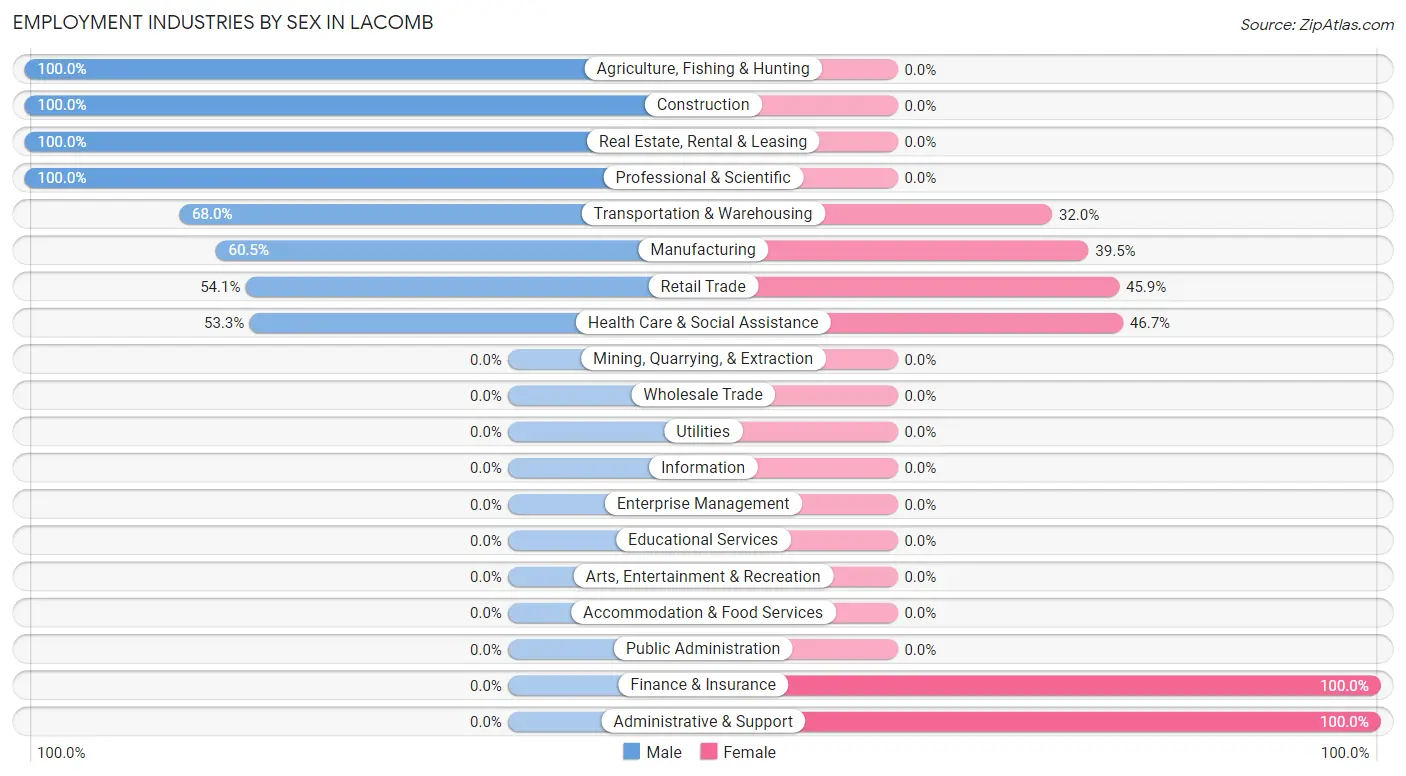
| Industry | Male | Female |
| Agriculture, Fishing & Hunting | 10 (100.0%) | 0 (0.0%) |
| Mining, Quarrying, & Extraction | 0 (0.0%) | 0 (0.0%) |
| Construction | 37 (100.0%) | 0 (0.0%) |
| Manufacturing | 26 (60.5%) | 17 (39.5%) |
| Wholesale Trade | 0 (0.0%) | 0 (0.0%) |
| Retail Trade | 105 (54.1%) | 89 (45.9%) |
| Transportation & Warehousing | 34 (68.0%) | 16 (32.0%) |
| Utilities | 0 (0.0%) | 0 (0.0%) |
| Information | 0 (0.0%) | 0 (0.0%) |
| Finance & Insurance | 0 (0.0%) | 8 (100.0%) |
| Real Estate, Rental & Leasing | 7 (100.0%) | 0 (0.0%) |
| Professional & Scientific | 12 (100.0%) | 0 (0.0%) |
| Enterprise Management | 0 (0.0%) | 0 (0.0%) |
| Administrative & Support | 0 (0.0%) | 8 (100.0%) |
| Educational Services | 0 (0.0%) | 0 (0.0%) |
| Health Care & Social Assistance | 8 (53.3%) | 7 (46.7%) |
| Arts, Entertainment & Recreation | 0 (0.0%) | 0 (0.0%) |
| Accommodation & Food Services | 0 (0.0%) | 0 (0.0%) |
| Public Administration | 0 (0.0%) | 0 (0.0%) |
| Total | 239 (62.2%) | 145 (37.8%) |
Education in Lacomb
School Enrollment in Lacomb
The most common levels of schooling among the 112 students in Lacomb are high school (77 | 68.8%), and college / undergraduate (35 | 31.2%).
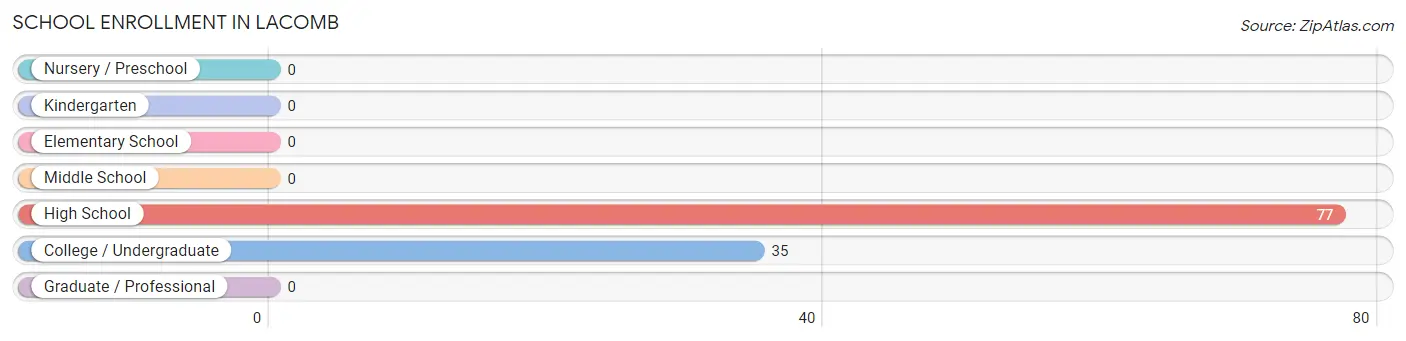
| School Level | # Students | % Students |
| Nursery / Preschool | 0 | 0.0% |
| Kindergarten | 0 | 0.0% |
| Elementary School | 0 | 0.0% |
| Middle School | 0 | 0.0% |
| High School | 77 | 68.8% |
| College / Undergraduate | 35 | 31.2% |
| Graduate / Professional | 0 | 0.0% |
| Total | 112 | 100.0% |
School Enrollment by Age by Funding Source in Lacomb
Out of a total of 112 students who are enrolled in schools in Lacomb, 94 (83.9%) attend a private institution, while the remaining 18 (16.1%) are enrolled in public schools. The age group of 10 to 14 year olds has the highest likelihood of being enrolled in private schools, with 16 (100.0% in the age bracket) enrolled. Conversely, the age group of 25 to 34 year olds has the lowest likelihood of being enrolled in a private school, with 18 (100.0% in the age bracket) attending a public institution.
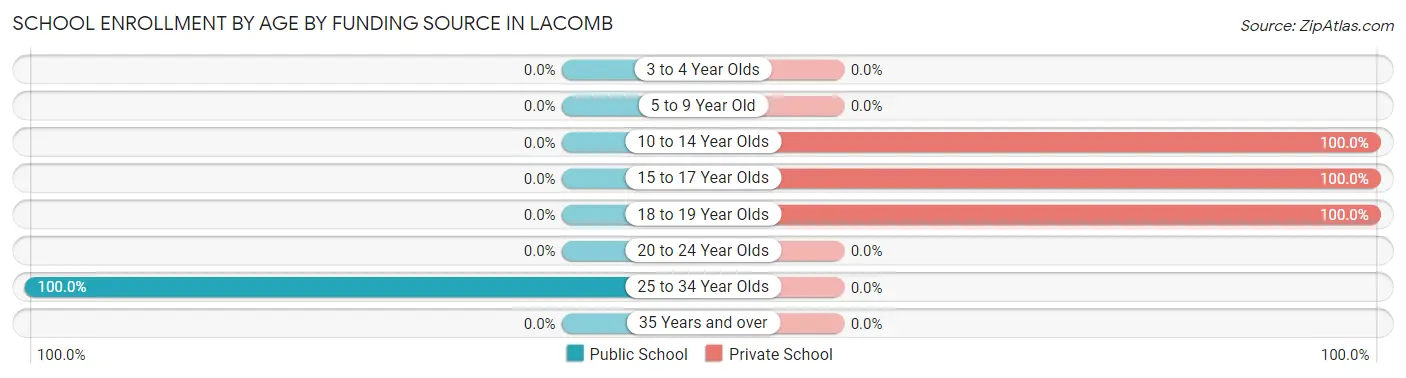
| Age Bracket | Public School | Private School |
| 3 to 4 Year Olds | 0 (0.0%) | 0 (0.0%) |
| 5 to 9 Year Old | 0 (0.0%) | 0 (0.0%) |
| 10 to 14 Year Olds | 0 (0.0%) | 16 (100.0%) |
| 15 to 17 Year Olds | 0 (0.0%) | 61 (100.0%) |
| 18 to 19 Year Olds | 0 (0.0%) | 17 (100.0%) |
| 20 to 24 Year Olds | 0 (0.0%) | 0 (0.0%) |
| 25 to 34 Year Olds | 18 (100.0%) | 0 (0.0%) |
| 35 Years and over | 0 (0.0%) | 0 (0.0%) |
| Total | 18 (16.1%) | 94 (83.9%) |
Educational Attainment by Field of Study in Lacomb
Bio, nature & agricultural (16 | 84.2%), and education (3 | 15.8%) are the most common fields of study among 19 individuals in Lacomb who have obtained a bachelor's degree or higher.
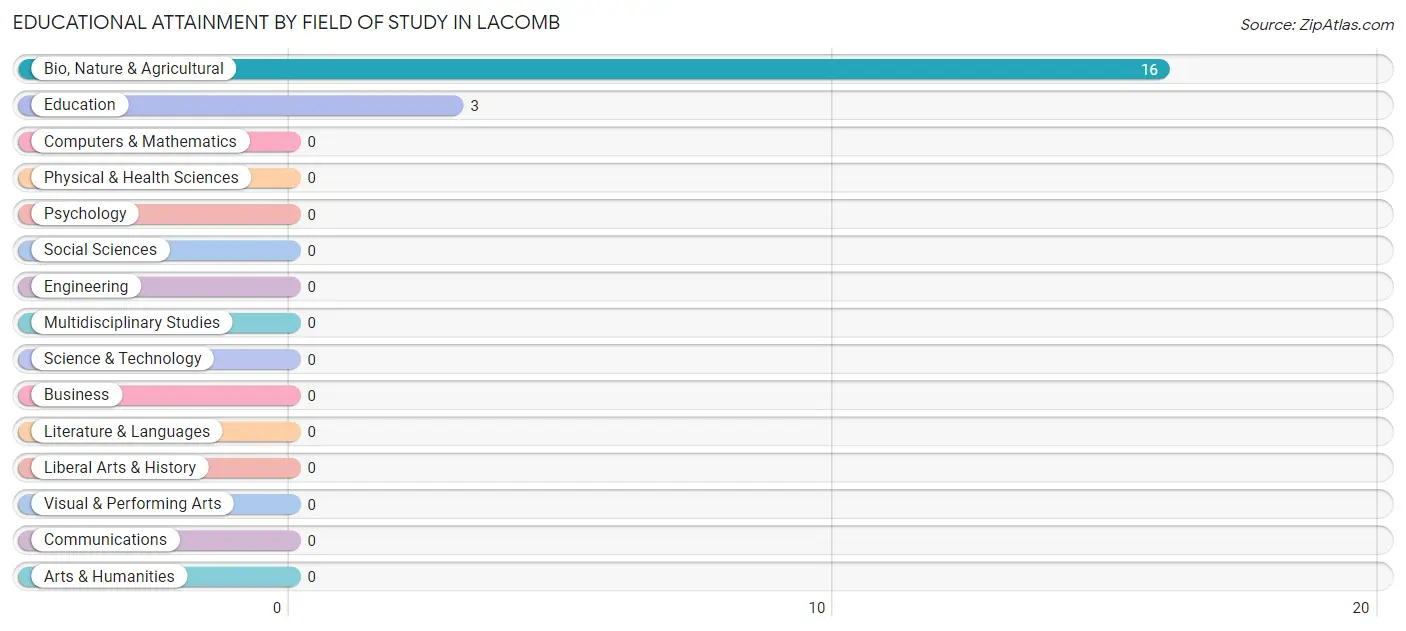
| Field of Study | # Graduates | % Graduates |
| Computers & Mathematics | 0 | 0.0% |
| Bio, Nature & Agricultural | 16 | 84.2% |
| Physical & Health Sciences | 0 | 0.0% |
| Psychology | 0 | 0.0% |
| Social Sciences | 0 | 0.0% |
| Engineering | 0 | 0.0% |
| Multidisciplinary Studies | 0 | 0.0% |
| Science & Technology | 0 | 0.0% |
| Business | 0 | 0.0% |
| Education | 3 | 15.8% |
| Literature & Languages | 0 | 0.0% |
| Liberal Arts & History | 0 | 0.0% |
| Visual & Performing Arts | 0 | 0.0% |
| Communications | 0 | 0.0% |
| Arts & Humanities | 0 | 0.0% |
| Total | 19 | 100.0% |
Transportation & Commute in Lacomb
Vehicle Availability by Sex in Lacomb
The most prevalent vehicle ownership categories in Lacomb are males with 3 vehicles (110, accounting for 46.0%) and females with 3 vehicles (97, making up 75.9%).
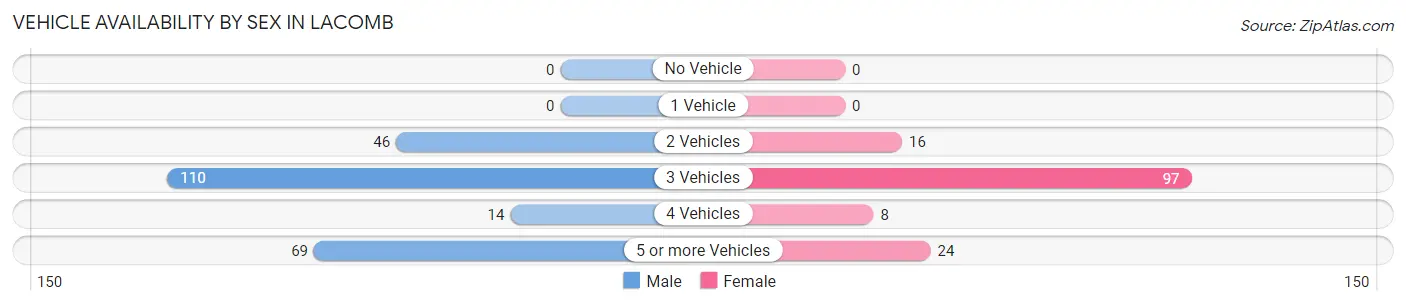
| Vehicles Available | Male | Female |
| No Vehicle | 0 (0.0%) | 0 (0.0%) |
| 1 Vehicle | 0 (0.0%) | 0 (0.0%) |
| 2 Vehicles | 46 (19.3%) | 16 (11.0%) |
| 3 Vehicles | 110 (46.0%) | 97 (66.9%) |
| 4 Vehicles | 14 (5.9%) | 8 (5.5%) |
| 5 or more Vehicles | 69 (28.9%) | 24 (16.6%) |
| Total | 239 (100.0%) | 145 (100.0%) |
Commute Time in Lacomb
The most frequently occuring commute durations in Lacomb are 5 to 9 minutes (176 commuters, 50.9%), 45 to 59 minutes (64 commuters, 18.5%), and 20 to 24 minutes (31 commuters, 9.0%).
| Commute Time | # Commuters | % Commuters |
| Less than 5 Minutes | 22 | 6.4% |
| 5 to 9 Minutes | 176 | 50.9% |
| 10 to 14 Minutes | 0 | 0.0% |
| 15 to 19 Minutes | 0 | 0.0% |
| 20 to 24 Minutes | 31 | 9.0% |
| 25 to 29 Minutes | 7 | 2.0% |
| 30 to 34 Minutes | 7 | 2.0% |
| 35 to 39 Minutes | 0 | 0.0% |
| 40 to 44 Minutes | 0 | 0.0% |
| 45 to 59 Minutes | 64 | 18.5% |
| 60 to 89 Minutes | 24 | 6.9% |
| 90 or more Minutes | 15 | 4.3% |
Commute Time by Sex in Lacomb
The most common commute times in Lacomb are 5 to 9 minutes (87 commuters, 41.6%) for males and 5 to 9 minutes (89 commuters, 65.0%) for females.
| Commute Time | Male | Female |
| Less than 5 Minutes | 22 (10.5%) | 0 (0.0%) |
| 5 to 9 Minutes | 87 (41.6%) | 89 (65.0%) |
| 10 to 14 Minutes | 0 (0.0%) | 0 (0.0%) |
| 15 to 19 Minutes | 0 (0.0%) | 0 (0.0%) |
| 20 to 24 Minutes | 14 (6.7%) | 17 (12.4%) |
| 25 to 29 Minutes | 7 (3.4%) | 0 (0.0%) |
| 30 to 34 Minutes | 7 (3.4%) | 0 (0.0%) |
| 35 to 39 Minutes | 0 (0.0%) | 0 (0.0%) |
| 40 to 44 Minutes | 0 (0.0%) | 0 (0.0%) |
| 45 to 59 Minutes | 49 (23.4%) | 15 (11.0%) |
| 60 to 89 Minutes | 8 (3.8%) | 16 (11.7%) |
| 90 or more Minutes | 15 (7.2%) | 0 (0.0%) |
Time of Departure to Work by Sex in Lacomb
The most frequent times of departure to work in Lacomb are 6:30 AM to 6:59 AM (87, 41.6%) for males and 12:00 PM to 3:59 PM (97, 70.8%) for females.
| Time of Departure | Male | Female |
| 12:00 AM to 4:59 AM | 25 (12.0%) | 0 (0.0%) |
| 5:00 AM to 5:29 AM | 7 (3.4%) | 0 (0.0%) |
| 5:30 AM to 5:59 AM | 0 (0.0%) | 0 (0.0%) |
| 6:00 AM to 6:29 AM | 34 (16.3%) | 0 (0.0%) |
| 6:30 AM to 6:59 AM | 87 (41.6%) | 0 (0.0%) |
| 7:00 AM to 7:29 AM | 22 (10.5%) | 0 (0.0%) |
| 7:30 AM to 7:59 AM | 0 (0.0%) | 17 (12.4%) |
| 8:00 AM to 8:29 AM | 34 (16.3%) | 16 (11.7%) |
| 8:30 AM to 8:59 AM | 0 (0.0%) | 0 (0.0%) |
| 9:00 AM to 9:59 AM | 0 (0.0%) | 7 (5.1%) |
| 10:00 AM to 10:59 AM | 0 (0.0%) | 0 (0.0%) |
| 11:00 AM to 11:59 AM | 0 (0.0%) | 0 (0.0%) |
| 12:00 PM to 3:59 PM | 0 (0.0%) | 97 (70.8%) |
| 4:00 PM to 11:59 PM | 0 (0.0%) | 0 (0.0%) |
| Total | 209 (100.0%) | 137 (100.0%) |
Housing Occupancy in Lacomb
Occupancy by Ownership in Lacomb
Of the total 302 dwellings in Lacomb, owner-occupied units account for 284 (94.0%), while renter-occupied units make up 18 (6.0%).
| Occupancy | # Housing Units | % Housing Units |
| Owner Occupied Housing Units | 284 | 94.0% |
| Renter-Occupied Housing Units | 18 | 6.0% |
| Total Occupied Housing Units | 302 | 100.0% |
Occupancy by Household Size in Lacomb
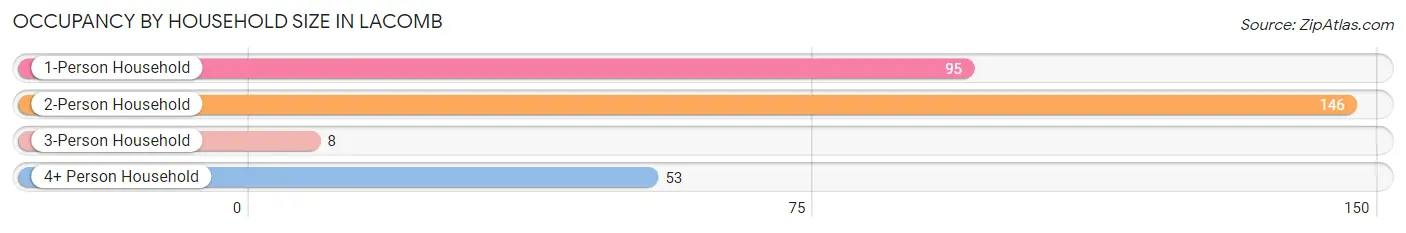
| Household Size | # Housing Units | % Housing Units |
| 1-Person Household | 95 | 31.5% |
| 2-Person Household | 146 | 48.3% |
| 3-Person Household | 8 | 2.6% |
| 4+ Person Household | 53 | 17.5% |
| Total Housing Units | 302 | 100.0% |
Occupancy by Ownership by Household Size in Lacomb
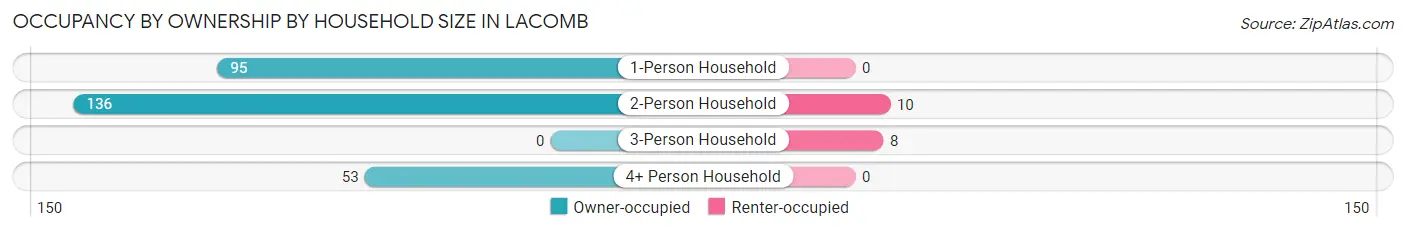
| Household Size | Owner-occupied | Renter-occupied |
| 1-Person Household | 95 (100.0%) | 0 (0.0%) |
| 2-Person Household | 136 (93.1%) | 10 (6.9%) |
| 3-Person Household | 0 (0.0%) | 8 (100.0%) |
| 4+ Person Household | 53 (100.0%) | 0 (0.0%) |
| Total Housing Units | 284 (94.0%) | 18 (6.0%) |
Occupancy by Educational Attainment in Lacomb
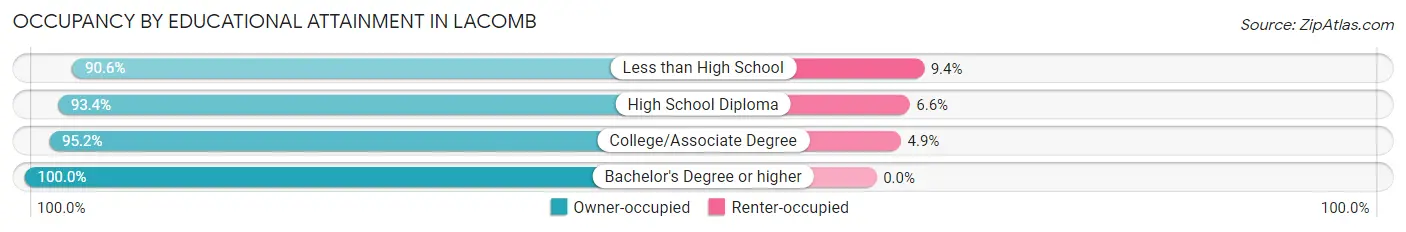
| Household Size | Owner-occupied | Renter-occupied |
| Less than High School | 48 (90.6%) | 5 (9.4%) |
| High School Diploma | 71 (93.4%) | 5 (6.6%) |
| College/Associate Degree | 157 (95.2%) | 8 (4.9%) |
| Bachelor's Degree or higher | 8 (100.0%) | 0 (0.0%) |
Occupancy by Age of Householder in Lacomb
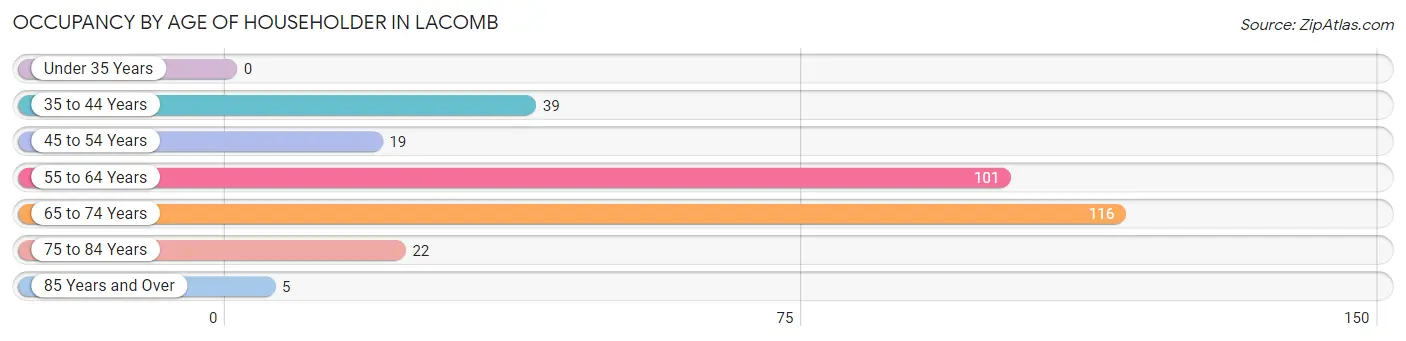
| Age Bracket | # Households | % Households |
| Under 35 Years | 0 | 0.0% |
| 35 to 44 Years | 39 | 12.9% |
| 45 to 54 Years | 19 | 6.3% |
| 55 to 64 Years | 101 | 33.4% |
| 65 to 74 Years | 116 | 38.4% |
| 75 to 84 Years | 22 | 7.3% |
| 85 Years and Over | 5 | 1.7% |
| Total | 302 | 100.0% |
Housing Finances in Lacomb
Median Income by Occupancy in Lacomb
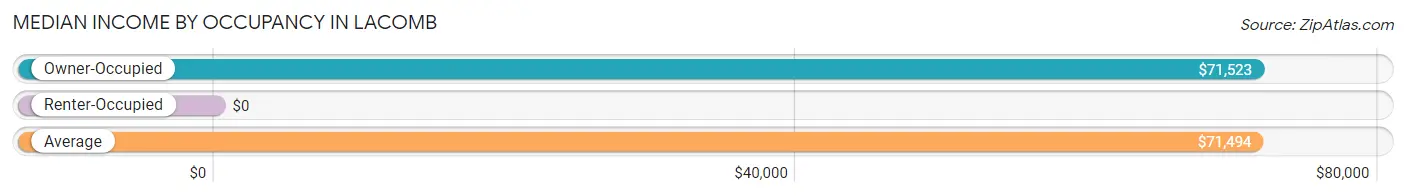
| Occupancy Type | # Households | Median Income |
| Owner-Occupied | 284 (94.0%) | $71,523 |
| Renter-Occupied | 18 (6.0%) | $0 |
| Average | 302 (100.0%) | $71,494 |
Occupancy by Householder Income Bracket in Lacomb
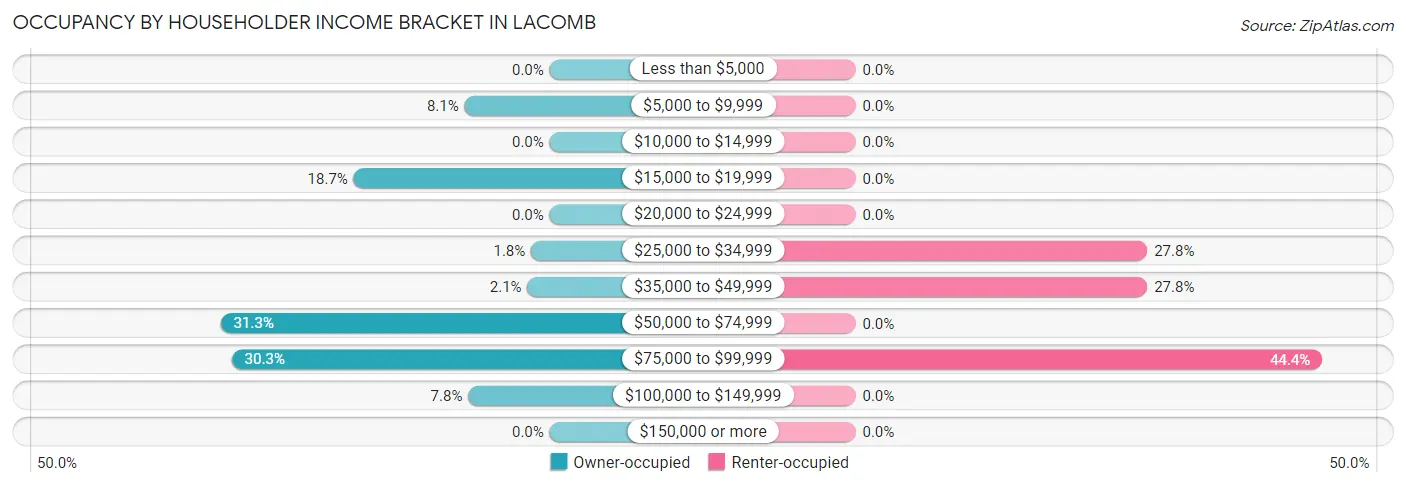
| Income Bracket | Owner-occupied | Renter-occupied |
| Less than $5,000 | 0 (0.0%) | 0 (0.0%) |
| $5,000 to $9,999 | 23 (8.1%) | 0 (0.0%) |
| $10,000 to $14,999 | 0 (0.0%) | 0 (0.0%) |
| $15,000 to $19,999 | 53 (18.7%) | 0 (0.0%) |
| $20,000 to $24,999 | 0 (0.0%) | 0 (0.0%) |
| $25,000 to $34,999 | 5 (1.8%) | 5 (27.8%) |
| $35,000 to $49,999 | 6 (2.1%) | 5 (27.8%) |
| $50,000 to $74,999 | 89 (31.3%) | 0 (0.0%) |
| $75,000 to $99,999 | 86 (30.3%) | 8 (44.4%) |
| $100,000 to $149,999 | 22 (7.7%) | 0 (0.0%) |
| $150,000 or more | 0 (0.0%) | 0 (0.0%) |
| Total | 284 (100.0%) | 18 (100.0%) |
Monthly Housing Cost Tiers in Lacomb
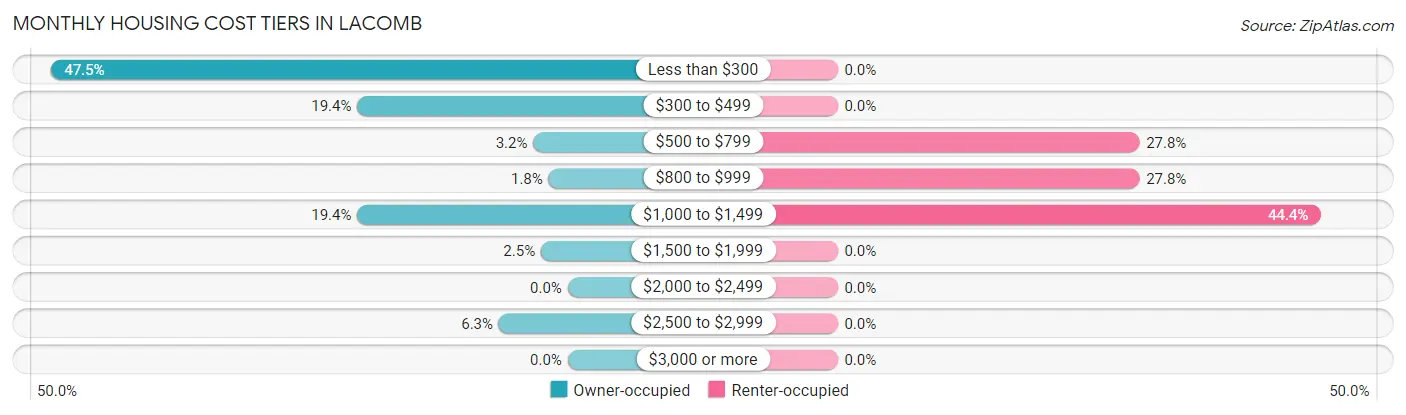
| Monthly Cost | Owner-occupied | Renter-occupied |
| Less than $300 | 135 (47.5%) | 0 (0.0%) |
| $300 to $499 | 55 (19.4%) | 0 (0.0%) |
| $500 to $799 | 9 (3.2%) | 5 (27.8%) |
| $800 to $999 | 5 (1.8%) | 5 (27.8%) |
| $1,000 to $1,499 | 55 (19.4%) | 8 (44.4%) |
| $1,500 to $1,999 | 7 (2.5%) | 0 (0.0%) |
| $2,000 to $2,499 | 0 (0.0%) | 0 (0.0%) |
| $2,500 to $2,999 | 18 (6.3%) | 0 (0.0%) |
| $3,000 or more | 0 (0.0%) | 0 (0.0%) |
| Total | 284 (100.0%) | 18 (100.0%) |
Physical Housing Characteristics in Lacomb
Housing Structures in Lacomb

| Structure Type | # Housing Units | % Housing Units |
| Single Unit, Detached | 69 | 22.9% |
| Single Unit, Attached | 0 | 0.0% |
| 2 Unit Apartments | 0 | 0.0% |
| 3 or 4 Unit Apartments | 0 | 0.0% |
| 5 to 9 Unit Apartments | 0 | 0.0% |
| 10 or more Apartments | 0 | 0.0% |
| Mobile Home / Other | 233 | 77.1% |
| Total | 302 | 100.0% |
Housing Structures by Occupancy in Lacomb
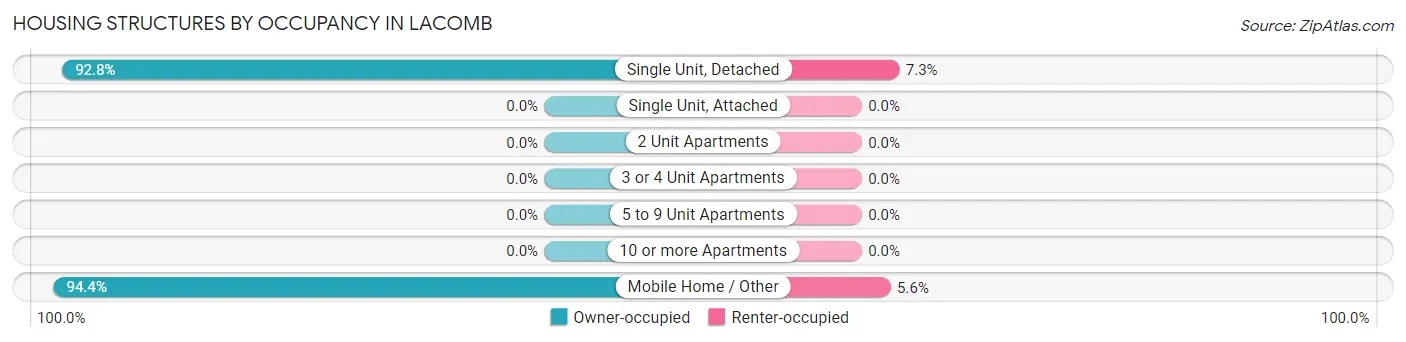
| Structure Type | Owner-occupied | Renter-occupied |
| Single Unit, Detached | 64 (92.7%) | 5 (7.2%) |
| Single Unit, Attached | 0 (0.0%) | 0 (0.0%) |
| 2 Unit Apartments | 0 (0.0%) | 0 (0.0%) |
| 3 or 4 Unit Apartments | 0 (0.0%) | 0 (0.0%) |
| 5 to 9 Unit Apartments | 0 (0.0%) | 0 (0.0%) |
| 10 or more Apartments | 0 (0.0%) | 0 (0.0%) |
| Mobile Home / Other | 220 (94.4%) | 13 (5.6%) |
| Total | 284 (94.0%) | 18 (6.0%) |
Housing Structures by Number of Rooms in Lacomb
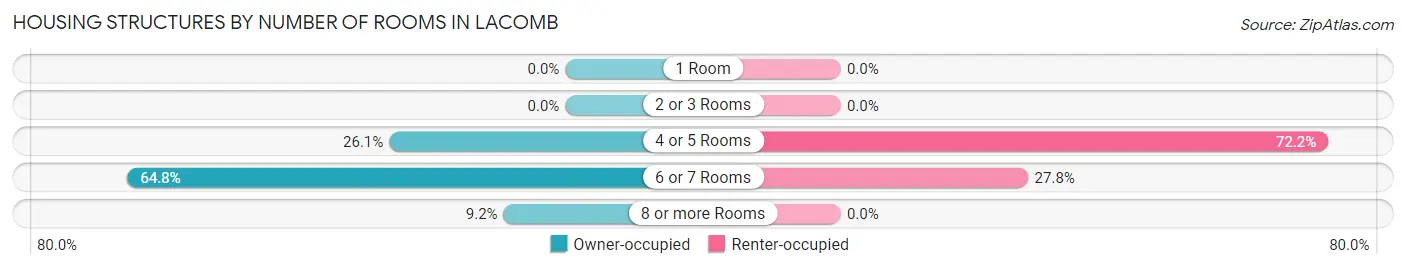
| Number of Rooms | Owner-occupied | Renter-occupied |
| 1 Room | 0 (0.0%) | 0 (0.0%) |
| 2 or 3 Rooms | 0 (0.0%) | 0 (0.0%) |
| 4 or 5 Rooms | 74 (26.1%) | 13 (72.2%) |
| 6 or 7 Rooms | 184 (64.8%) | 5 (27.8%) |
| 8 or more Rooms | 26 (9.1%) | 0 (0.0%) |
| Total | 284 (100.0%) | 18 (100.0%) |
Housing Structure by Heating Type in Lacomb
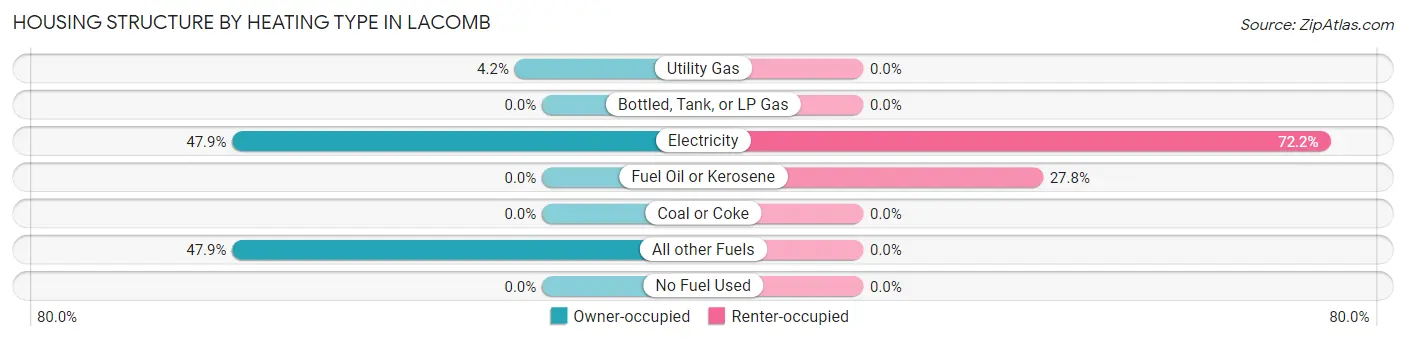
| Heating Type | Owner-occupied | Renter-occupied |
| Utility Gas | 12 (4.2%) | 0 (0.0%) |
| Bottled, Tank, or LP Gas | 0 (0.0%) | 0 (0.0%) |
| Electricity | 136 (47.9%) | 13 (72.2%) |
| Fuel Oil or Kerosene | 0 (0.0%) | 5 (27.8%) |
| Coal or Coke | 0 (0.0%) | 0 (0.0%) |
| All other Fuels | 136 (47.9%) | 0 (0.0%) |
| No Fuel Used | 0 (0.0%) | 0 (0.0%) |
| Total | 284 (100.0%) | 18 (100.0%) |
Household Vehicle Usage in Lacomb
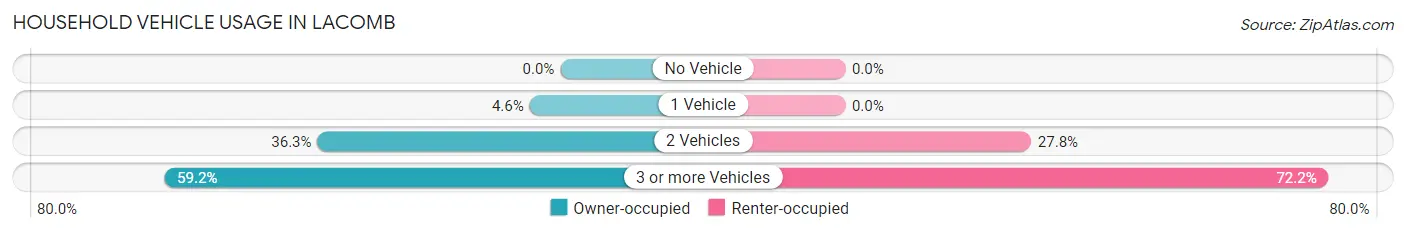
| Vehicles per Household | Owner-occupied | Renter-occupied |
| No Vehicle | 0 (0.0%) | 0 (0.0%) |
| 1 Vehicle | 13 (4.6%) | 0 (0.0%) |
| 2 Vehicles | 103 (36.3%) | 5 (27.8%) |
| 3 or more Vehicles | 168 (59.2%) | 13 (72.2%) |
| Total | 284 (100.0%) | 18 (100.0%) |
Real Estate & Mortgages in Lacomb
Real Estate and Mortgage Overview in Lacomb
| Characteristic | Without Mortgage | With Mortgage |
| Housing Units | 204 | 80 |
| Median Property Value | - | - |
| Median Household Income | - | - |
| Monthly Housing Costs | $266 | $0 |
| Real Estate Taxes | $778 | $0 |
Property Value by Mortgage Status in Lacomb
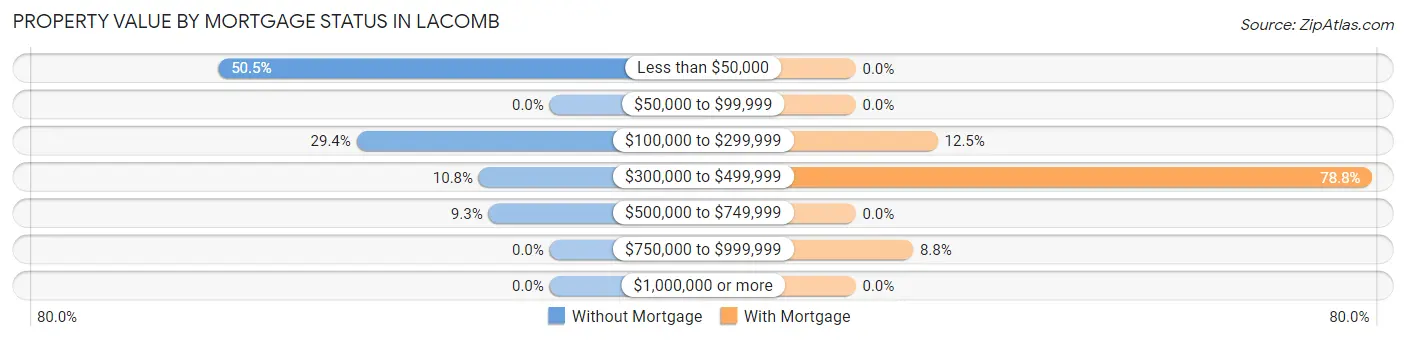
| Property Value | Without Mortgage | With Mortgage |
| Less than $50,000 | 103 (50.5%) | 0 (0.0%) |
| $50,000 to $99,999 | 0 (0.0%) | 0 (0.0%) |
| $100,000 to $299,999 | 60 (29.4%) | 10 (12.5%) |
| $300,000 to $499,999 | 22 (10.8%) | 63 (78.7%) |
| $500,000 to $749,999 | 19 (9.3%) | 0 (0.0%) |
| $750,000 to $999,999 | 0 (0.0%) | 7 (8.7%) |
| $1,000,000 or more | 0 (0.0%) | 0 (0.0%) |
| Total | 204 (100.0%) | 80 (100.0%) |
Household Income by Mortgage Status in Lacomb
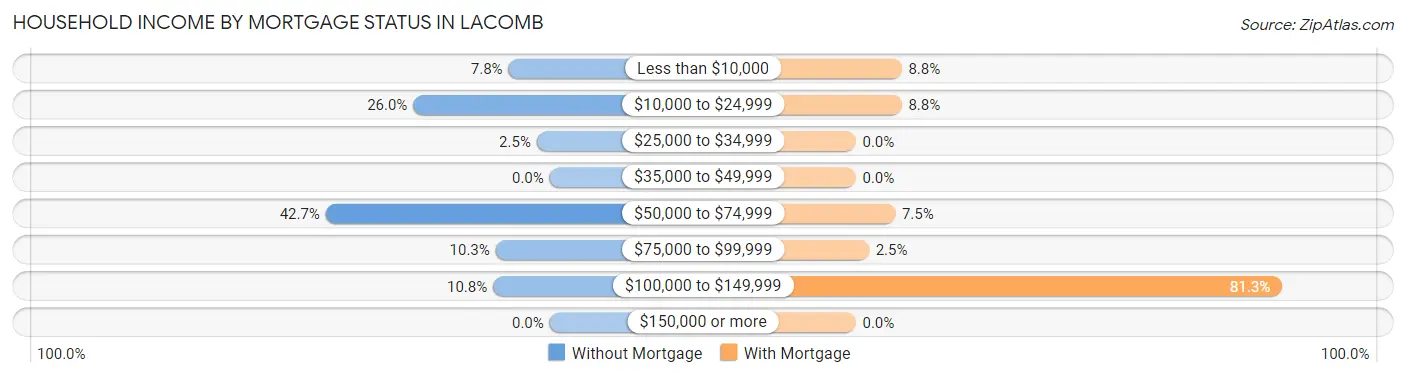
| Household Income | Without Mortgage | With Mortgage |
| Less than $10,000 | 16 (7.8%) | 7 (8.7%) |
| $10,000 to $24,999 | 53 (26.0%) | 7 (8.7%) |
| $25,000 to $34,999 | 5 (2.5%) | 0 (0.0%) |
| $35,000 to $49,999 | 0 (0.0%) | 0 (0.0%) |
| $50,000 to $74,999 | 87 (42.6%) | 6 (7.5%) |
| $75,000 to $99,999 | 21 (10.3%) | 2 (2.5%) |
| $100,000 to $149,999 | 22 (10.8%) | 65 (81.2%) |
| $150,000 or more | 0 (0.0%) | 0 (0.0%) |
| Total | 204 (100.0%) | 80 (100.0%) |
Property Value to Household Income Ratio in Lacomb
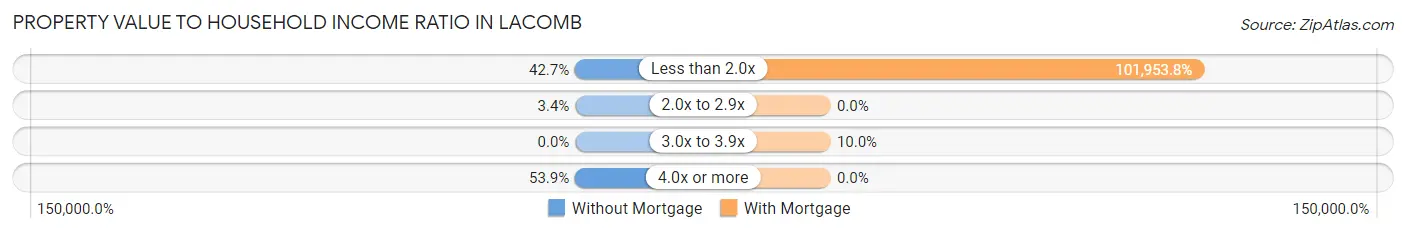
| Value-to-Income Ratio | Without Mortgage | With Mortgage |
| Less than 2.0x | 87 (42.6%) | 81,563 (101,953.8%) |
| 2.0x to 2.9x | 7 (3.4%) | 0 (0.0%) |
| 3.0x to 3.9x | 0 (0.0%) | 8 (10.0%) |
| 4.0x or more | 110 (53.9%) | 0 (0.0%) |
| Total | 204 (100.0%) | 80 (100.0%) |
Real Estate Taxes by Mortgage Status in Lacomb
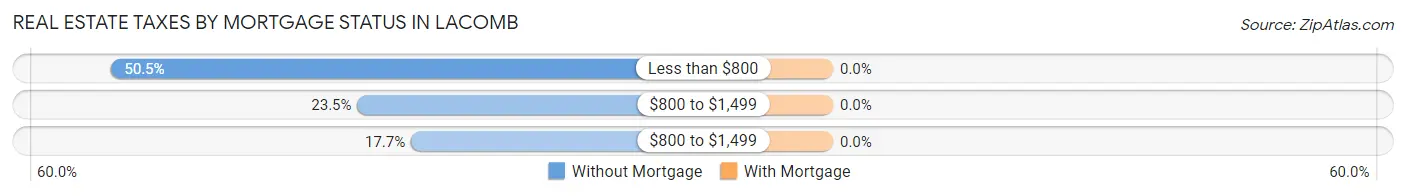
| Property Taxes | Without Mortgage | With Mortgage |
| Less than $800 | 103 (50.5%) | 0 (0.0%) |
| $800 to $1,499 | 48 (23.5%) | 0 (0.0%) |
| $800 to $1,499 | 36 (17.6%) | 0 (0.0%) |
| Total | 204 (100.0%) | 80 (100.0%) |
Health & Disability in Lacomb
Health Insurance Coverage by Age in Lacomb
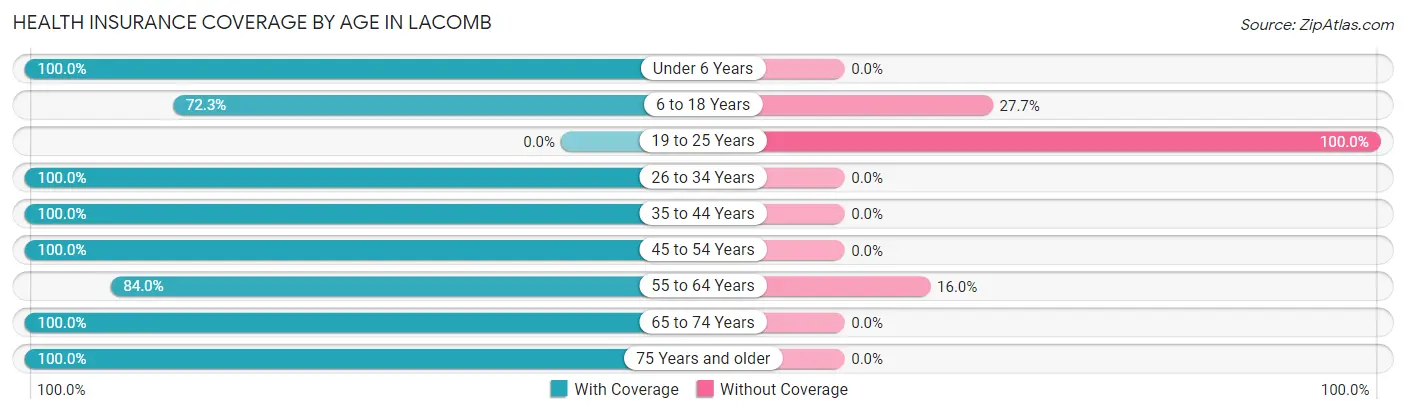
| Age Bracket | With Coverage | Without Coverage |
| Under 6 Years | 23 (100.0%) | 0 (0.0%) |
| 6 to 18 Years | 68 (72.3%) | 26 (27.7%) |
| 19 to 25 Years | 0 (0.0%) | 22 (100.0%) |
| 26 to 34 Years | 35 (100.0%) | 0 (0.0%) |
| 35 to 44 Years | 45 (100.0%) | 0 (0.0%) |
| 45 to 54 Years | 40 (100.0%) | 0 (0.0%) |
| 55 to 64 Years | 126 (84.0%) | 24 (16.0%) |
| 65 to 74 Years | 227 (100.0%) | 0 (0.0%) |
| 75 Years and older | 44 (100.0%) | 0 (0.0%) |
| Total | 608 (89.4%) | 72 (10.6%) |
Health Insurance Coverage by Citizenship Status in Lacomb
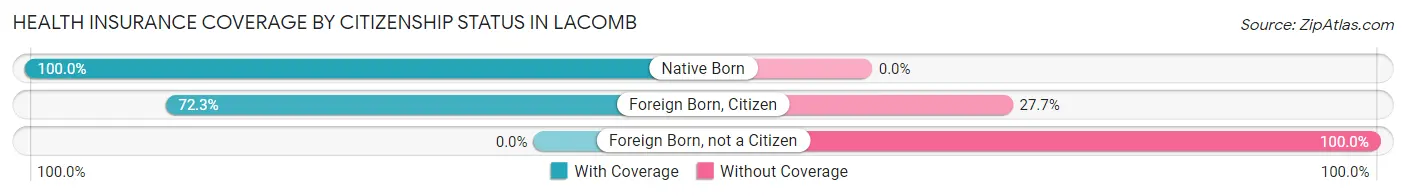
| Citizenship Status | With Coverage | Without Coverage |
| Native Born | 23 (100.0%) | 0 (0.0%) |
| Foreign Born, Citizen | 68 (72.3%) | 26 (27.7%) |
| Foreign Born, not a Citizen | 0 (0.0%) | 22 (100.0%) |
Health Insurance Coverage by Household Income in Lacomb
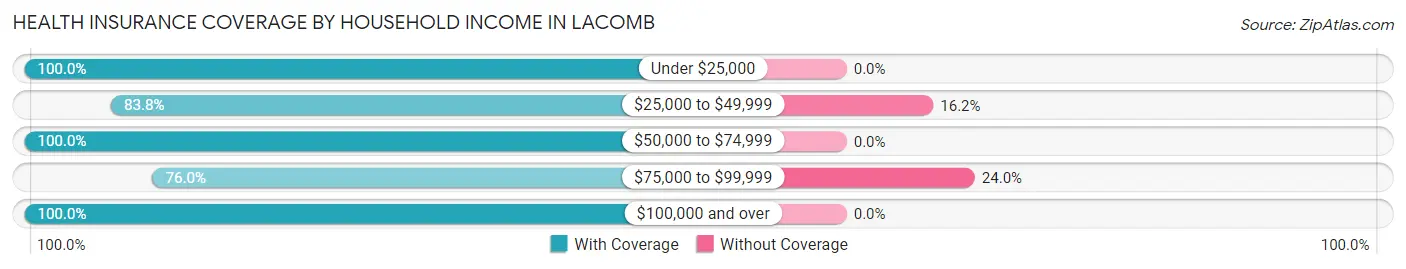
| Household Income | With Coverage | Without Coverage |
| Under $25,000 | 149 (100.0%) | 0 (0.0%) |
| $25,000 to $49,999 | 31 (83.8%) | 6 (16.2%) |
| $50,000 to $74,999 | 181 (100.0%) | 0 (0.0%) |
| $75,000 to $99,999 | 209 (76.0%) | 66 (24.0%) |
| $100,000 and over | 29 (100.0%) | 0 (0.0%) |
Public vs Private Health Insurance Coverage by Age in Lacomb
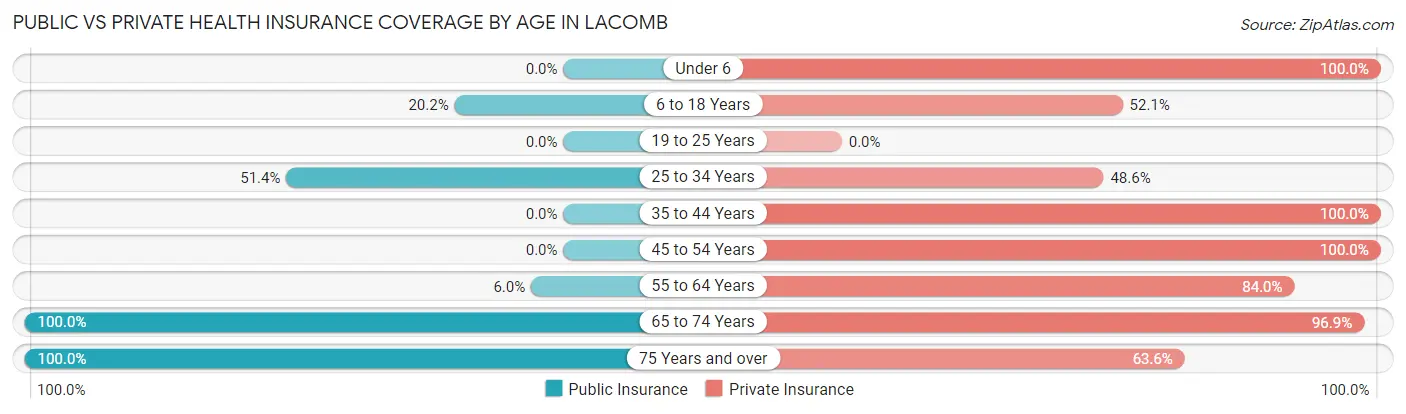
| Age Bracket | Public Insurance | Private Insurance |
| Under 6 | 0 (0.0%) | 23 (100.0%) |
| 6 to 18 Years | 19 (20.2%) | 49 (52.1%) |
| 19 to 25 Years | 0 (0.0%) | 0 (0.0%) |
| 25 to 34 Years | 18 (51.4%) | 17 (48.6%) |
| 35 to 44 Years | 0 (0.0%) | 45 (100.0%) |
| 45 to 54 Years | 0 (0.0%) | 40 (100.0%) |
| 55 to 64 Years | 9 (6.0%) | 126 (84.0%) |
| 65 to 74 Years | 227 (100.0%) | 220 (96.9%) |
| 75 Years and over | 44 (100.0%) | 28 (63.6%) |
| Total | 317 (46.6%) | 548 (80.6%) |
Disability Status by Sex by Age in Lacomb
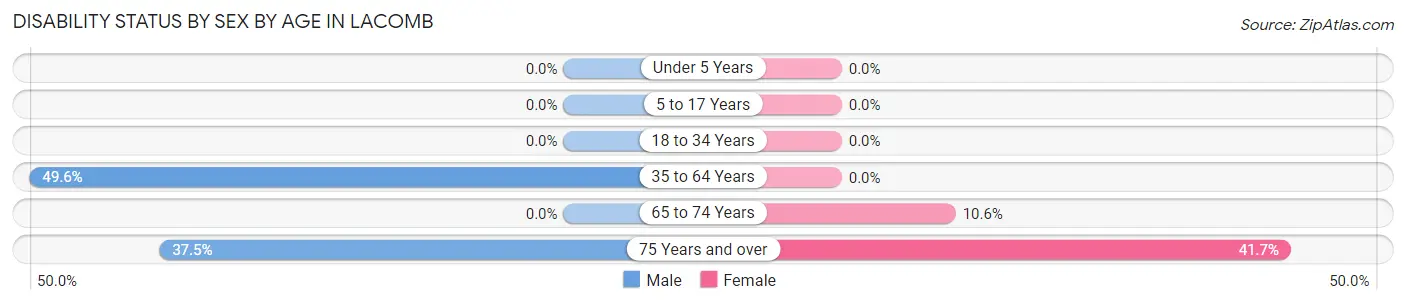
| Age Bracket | Male | Female |
| Under 5 Years | 0 (0.0%) | 0 (0.0%) |
| 5 to 17 Years | 0 (0.0%) | 0 (0.0%) |
| 18 to 34 Years | 0 (0.0%) | 0 (0.0%) |
| 35 to 64 Years | 55 (49.5%) | 0 (0.0%) |
| 65 to 74 Years | 0 (0.0%) | 13 (10.6%) |
| 75 Years and over | 12 (37.5%) | 5 (41.7%) |
Disability Class by Sex by Age in Lacomb
Disability Class: Hearing Difficulty
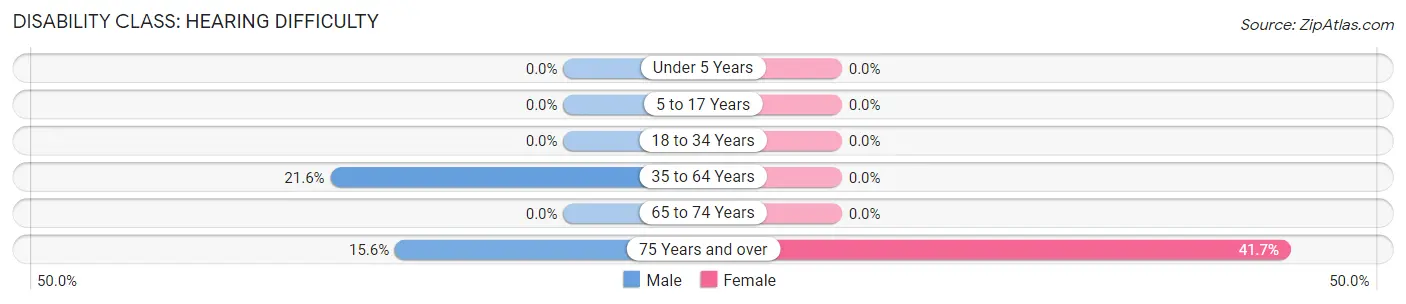
| Age Bracket | Male | Female |
| Under 5 Years | 0 (0.0%) | 0 (0.0%) |
| 5 to 17 Years | 0 (0.0%) | 0 (0.0%) |
| 18 to 34 Years | 0 (0.0%) | 0 (0.0%) |
| 35 to 64 Years | 24 (21.6%) | 0 (0.0%) |
| 65 to 74 Years | 0 (0.0%) | 0 (0.0%) |
| 75 Years and over | 5 (15.6%) | 5 (41.7%) |
Disability Class: Vision Difficulty
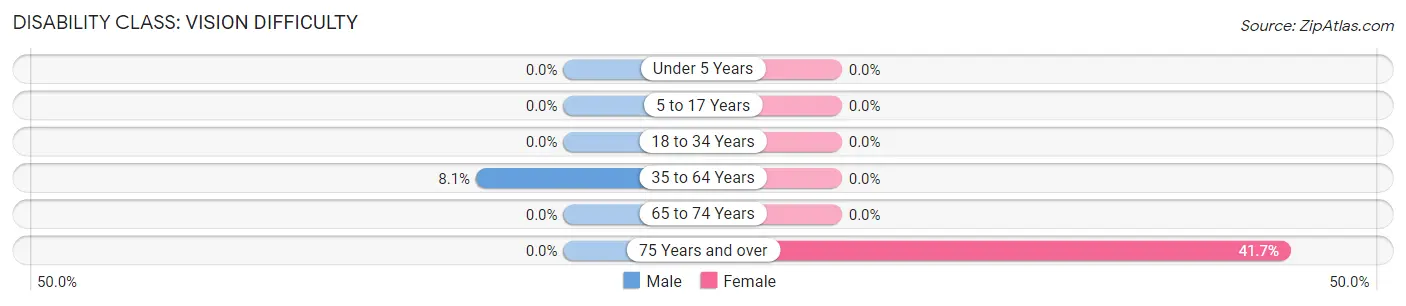
| Age Bracket | Male | Female |
| Under 5 Years | 0 (0.0%) | 0 (0.0%) |
| 5 to 17 Years | 0 (0.0%) | 0 (0.0%) |
| 18 to 34 Years | 0 (0.0%) | 0 (0.0%) |
| 35 to 64 Years | 9 (8.1%) | 0 (0.0%) |
| 65 to 74 Years | 0 (0.0%) | 0 (0.0%) |
| 75 Years and over | 0 (0.0%) | 5 (41.7%) |
Disability Class: Cognitive Difficulty
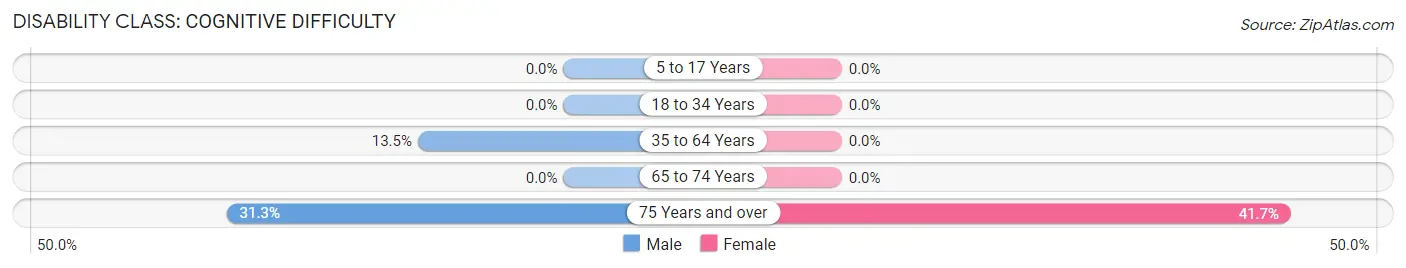
| Age Bracket | Male | Female |
| 5 to 17 Years | 0 (0.0%) | 0 (0.0%) |
| 18 to 34 Years | 0 (0.0%) | 0 (0.0%) |
| 35 to 64 Years | 15 (13.5%) | 0 (0.0%) |
| 65 to 74 Years | 0 (0.0%) | 0 (0.0%) |
| 75 Years and over | 10 (31.2%) | 5 (41.7%) |
Disability Class: Ambulatory Difficulty
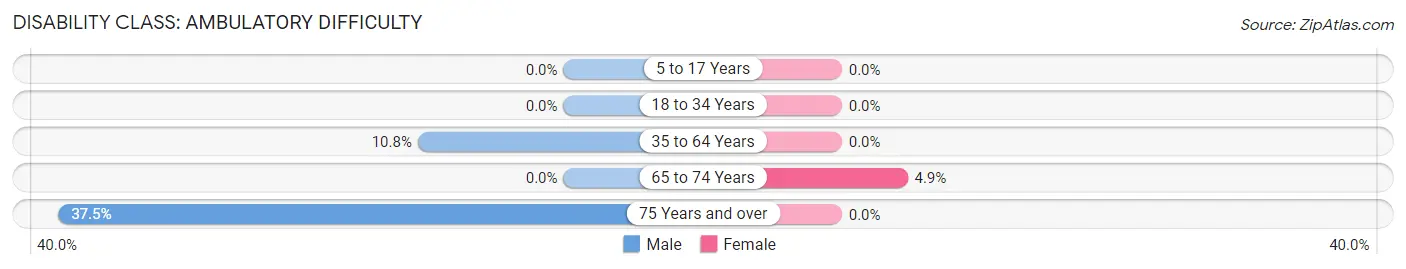
| Age Bracket | Male | Female |
| 5 to 17 Years | 0 (0.0%) | 0 (0.0%) |
| 18 to 34 Years | 0 (0.0%) | 0 (0.0%) |
| 35 to 64 Years | 12 (10.8%) | 0 (0.0%) |
| 65 to 74 Years | 0 (0.0%) | 6 (4.9%) |
| 75 Years and over | 12 (37.5%) | 0 (0.0%) |
Disability Class: Self-Care Difficulty
| Age Bracket | Male | Female |
| 5 to 17 Years | 0 (0.0%) | 0 (0.0%) |
| 18 to 34 Years | 0 (0.0%) | 0 (0.0%) |
| 35 to 64 Years | 12 (10.8%) | 0 (0.0%) |
| 65 to 74 Years | 0 (0.0%) | 13 (10.6%) |
| 75 Years and over | 5 (15.6%) | 0 (0.0%) |
Technology Access in Lacomb
Computing Device Access in Lacomb
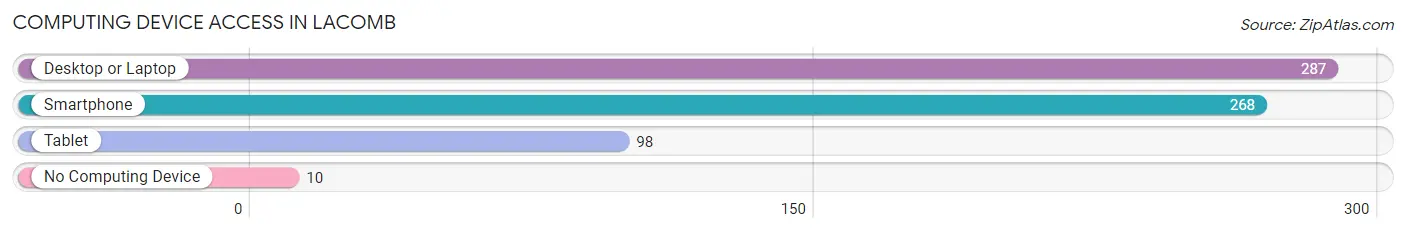
| Device Type | # Households | % Households |
| Desktop or Laptop | 287 | 95.0% |
| Smartphone | 268 | 88.7% |
| Tablet | 98 | 32.5% |
| No Computing Device | 10 | 3.3% |
| Total | 302 | 100.0% |
Internet Access in Lacomb
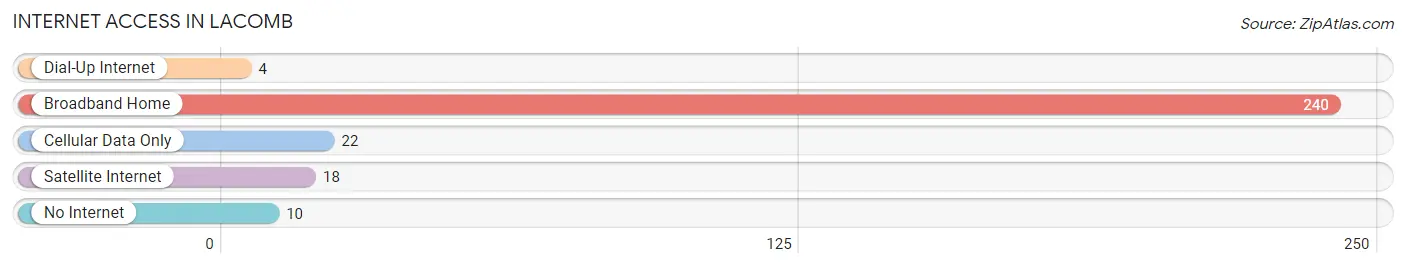
| Internet Type | # Households | % Households |
| Dial-Up Internet | 4 | 1.3% |
| Broadband Home | 240 | 79.5% |
| Cellular Data Only | 22 | 7.3% |
| Satellite Internet | 18 | 6.0% |
| No Internet | 10 | 3.3% |
| Total | 302 | 100.0% |
Lacomb Summary
Lacomb is an unincorporated community in Linn County, Oregon, United States. It is located on Oregon Route 228, about 8 miles (13 km) east of Lebanon. The community is named after the Lacomb family, who settled in the area in the late 19th century.
History
The Lacomb area was first settled in the late 19th century by the Lacomb family. The family was originally from France and had immigrated to the United States in the late 1800s. The family established a homestead in the area and began farming. The community was officially established in 1891 when the post office was established.
The community grew slowly over the years, but remained a small rural community. In the early 20th century, the community was home to a general store, a blacksmith shop, a school, and a few other businesses. The school was closed in the 1950s and the post office was closed in the 1970s.
Geography
Lacomb is located in the foothills of the Cascade Mountains in western Oregon. The community is situated in the Willamette Valley, about 8 miles (13 km) east of Lebanon. The area is characterized by rolling hills and open fields. The nearby Calapooia River provides a source of water for the area.
Economy
The economy of Lacomb is largely based on agriculture. The area is home to several farms and ranches, which produce a variety of crops and livestock. The area is also home to several wineries and vineyards, which produce a variety of wines.
Demographics
As of the 2010 census, the population of Lacomb was 1,093. The population is largely white (94.3%) and the median age is 44. The median household income is $45,000 and the median home value is $179,000.
Conclusion
Lacomb is a small rural community in western Oregon. The community was established in the late 19th century by the Lacomb family and has grown slowly over the years. The economy of the area is largely based on agriculture, with several farms and ranches in the area. The population of the area is largely white and the median age is 44.
Common Questions
What is Per Capita Income in Lacomb?
Per Capita income in Lacomb is $27,787.
What is the Median Family Income in Lacomb?
Median Family Income in Lacomb is $71,853.
What is the Median Household income in Lacomb?
Median Household Income in Lacomb is $71,494.
What is Inequality or Gini Index in Lacomb?
Inequality or Gini Index in Lacomb is 0.28.
What is the Total Population of Lacomb?
Total Population of Lacomb is 685.
What is the Total Male Population of Lacomb?
Total Male Population of Lacomb is 371.
What is the Total Female Population of Lacomb?
Total Female Population of Lacomb is 314.
What is the Ratio of Males per 100 Females in Lacomb?
There are 118.15 Males per 100 Females in Lacomb.
What is the Ratio of Females per 100 Males in Lacomb?
There are 84.64 Females per 100 Males in Lacomb.
What is the Median Population Age in Lacomb?
Median Population Age in Lacomb is 62.8 Years.
What is the Average Family Size in Lacomb
Average Family Size in Lacomb is 2.7 People.
What is the Average Household Size in Lacomb
Average Household Size in Lacomb is 2.2 People.
How Large is the Labor Force in Lacomb?
There are 432 People in the Labor Forcein in Lacomb.
What is the Percentage of People in the Labor Force in Lacomb?
68.4% of People are in the Labor Force in Lacomb.
What is the Unemployment Rate in Lacomb?
Unemployment Rate in Lacomb is 11.1%.