Zip Codes with the Highest Percentage of Population Employed in Legal Services & Support in Beaverton, OR
RELATED REPORTS & OPTIONS
Legal Services & Support
Beaverton
Compare Zip Codes
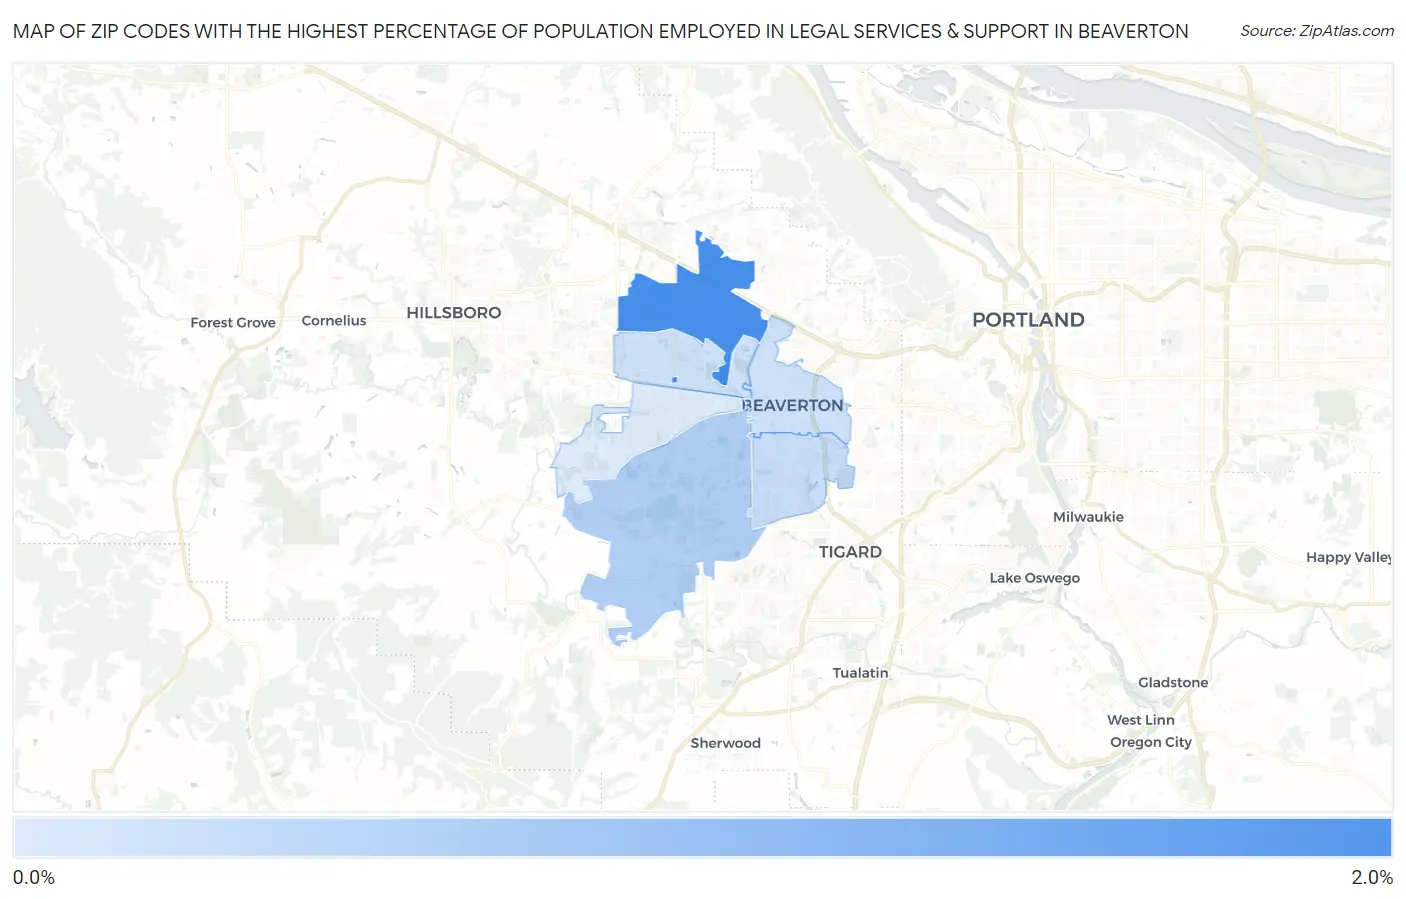
Map of Zip Codes with the Highest Percentage of Population Employed in Legal Services & Support in Beaverton
0.36%
1.8%
Zip Codes with the Highest Percentage of Population Employed in Legal Services & Support in Beaverton, OR
| Zip Code | % Employed | vs State | vs National | |
| 1. | 97006 | 1.8% | 1.1%(+0.708)#46 | 1.2%(+0.625)#3,983 |
| 2. | 97007 | 0.80% | 1.1%(-0.304)#122 | 1.2%(-0.387)#9,473 |
| 3. | 97008 | 0.56% | 1.1%(-0.541)#153 | 1.2%(-0.624)#11,940 |
| 4. | 97005 | 0.49% | 1.1%(-0.607)#164 | 1.2%(-0.690)#12,713 |
| 5. | 97003 | 0.48% | 1.1%(-0.618)#165 | 1.2%(-0.702)#12,853 |
| 6. | 97078 | 0.36% | 1.1%(-0.744)#175 | 1.2%(-0.827)#14,372 |
1
Common Questions
What are the Top 5 Zip Codes with the Highest Percentage of Population Employed in Legal Services & Support in Beaverton, OR?
Top 5 Zip Codes with the Highest Percentage of Population Employed in Legal Services & Support in Beaverton, OR are:
What zip code has the Highest Percentage of Population Employed in Legal Services & Support in Beaverton, OR?
97006 has the Highest Percentage of Population Employed in Legal Services & Support in Beaverton, OR with 1.8%.
What is the Percentage of Population Employed in Legal Services & Support in Beaverton, OR?
Percentage of Population Employed in Legal Services & Support in Beaverton is 0.80%.
What is the Percentage of Population Employed in Legal Services & Support in Oregon?
Percentage of Population Employed in Legal Services & Support in Oregon is 1.1%.
What is the Percentage of Population Employed in Legal Services & Support in the United States?
Percentage of Population Employed in Legal Services & Support in the United States is 1.2%.