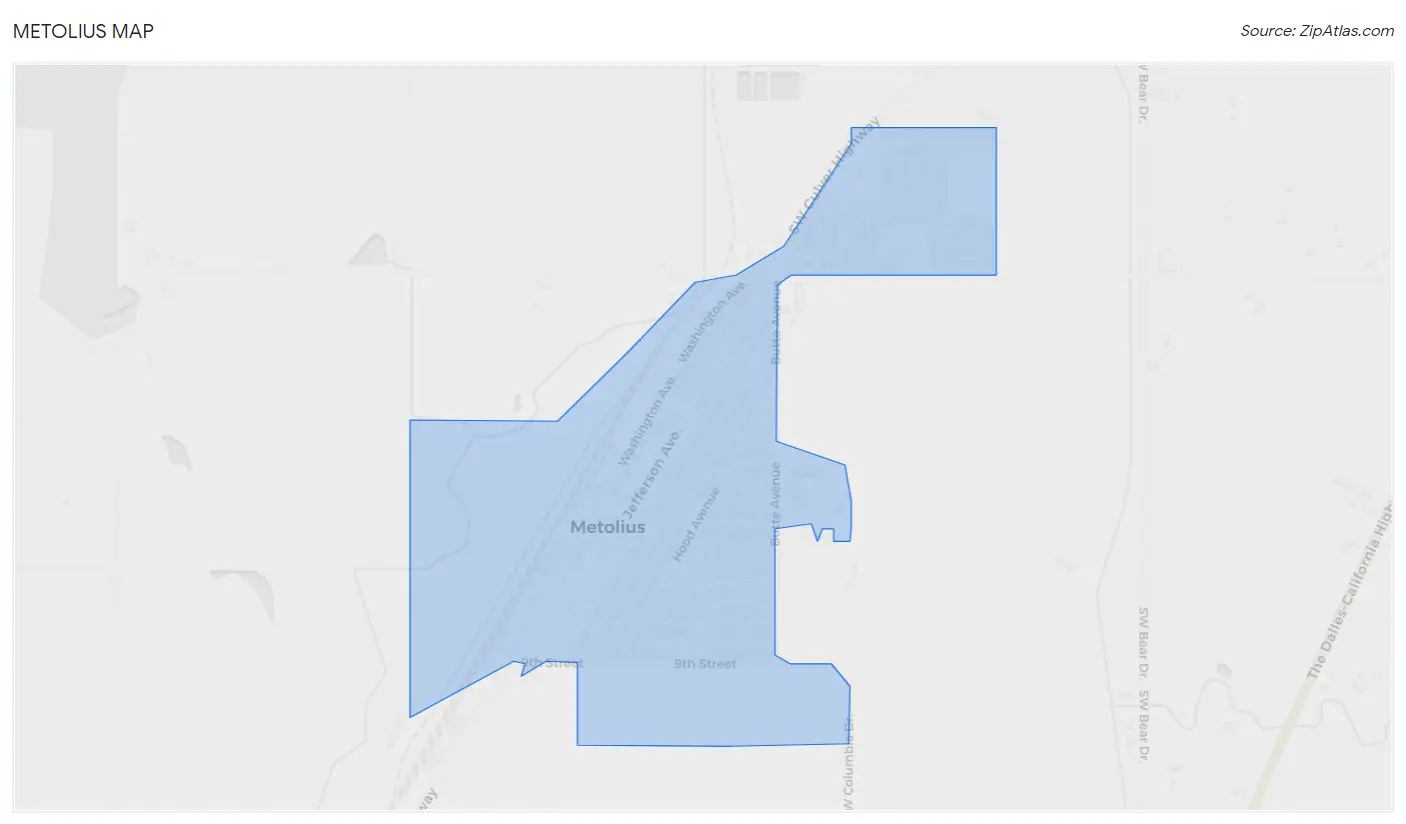
Metolius, OR Map & Demographics
Metolius Map
Metolius Overview
$27,290
PER CAPITA INCOME
$68,654
AVG FAMILY INCOME
$68,382
AVG HOUSEHOLD INCOME
42.0%
WAGE / INCOME GAP [ % ]
58.0¢/ $1
WAGE / INCOME GAP [ $ ]
0.39
INEQUALITY / GINI INDEX
921
TOTAL POPULATION
504
MALE POPULATION
417
FEMALE POPULATION
120.86
MALES / 100 FEMALES
82.74
FEMALES / 100 MALES
36.6
MEDIAN AGE
3.1
AVG FAMILY SIZE
2.8
AVG HOUSEHOLD SIZE
436
LABOR FORCE [ PEOPLE ]
63.5%
PERCENT IN LABOR FORCE
3.4%
UNEMPLOYMENT RATE
Metolius Area Codes
Income in Metolius
Income Overview in Metolius
Per Capita Income in Metolius is $27,290, while median incomes of families and households are $68,654 and $68,382 respectively.
| Characteristic | Number | Measure |
| Per Capita Income | 921 | $27,290 |
| Median Family Income | 234 | $68,654 |
| Mean Family Income | 234 | $79,694 |
| Median Household Income | 334 | $68,382 |
| Mean Household Income | 334 | $77,726 |
| Income Deficit | 234 | $0 |
| Wage / Income Gap (%) | 921 | 41.95% |
| Wage / Income Gap ($) | 921 | 58.05¢ per $1 |
| Gini / Inequality Index | 921 | 0.39 |
Earnings by Sex in Metolius
Average Earnings in Metolius are $37,713, $40,750 for men and $23,654 for women, a difference of 41.9%.
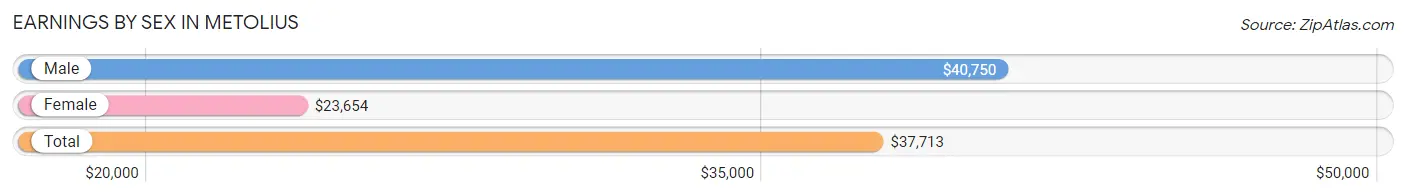
| Sex | Number | Average Earnings |
| Male | 305 (61.9%) | $40,750 |
| Female | 188 (38.1%) | $23,654 |
| Total | 493 (100.0%) | $37,713 |
Earnings by Sex by Income Bracket in Metolius
The most common earnings brackets in Metolius are $35,000 to $39,999 for men (46 | 15.1%) and $2,499 or less for women (23 | 12.2%).
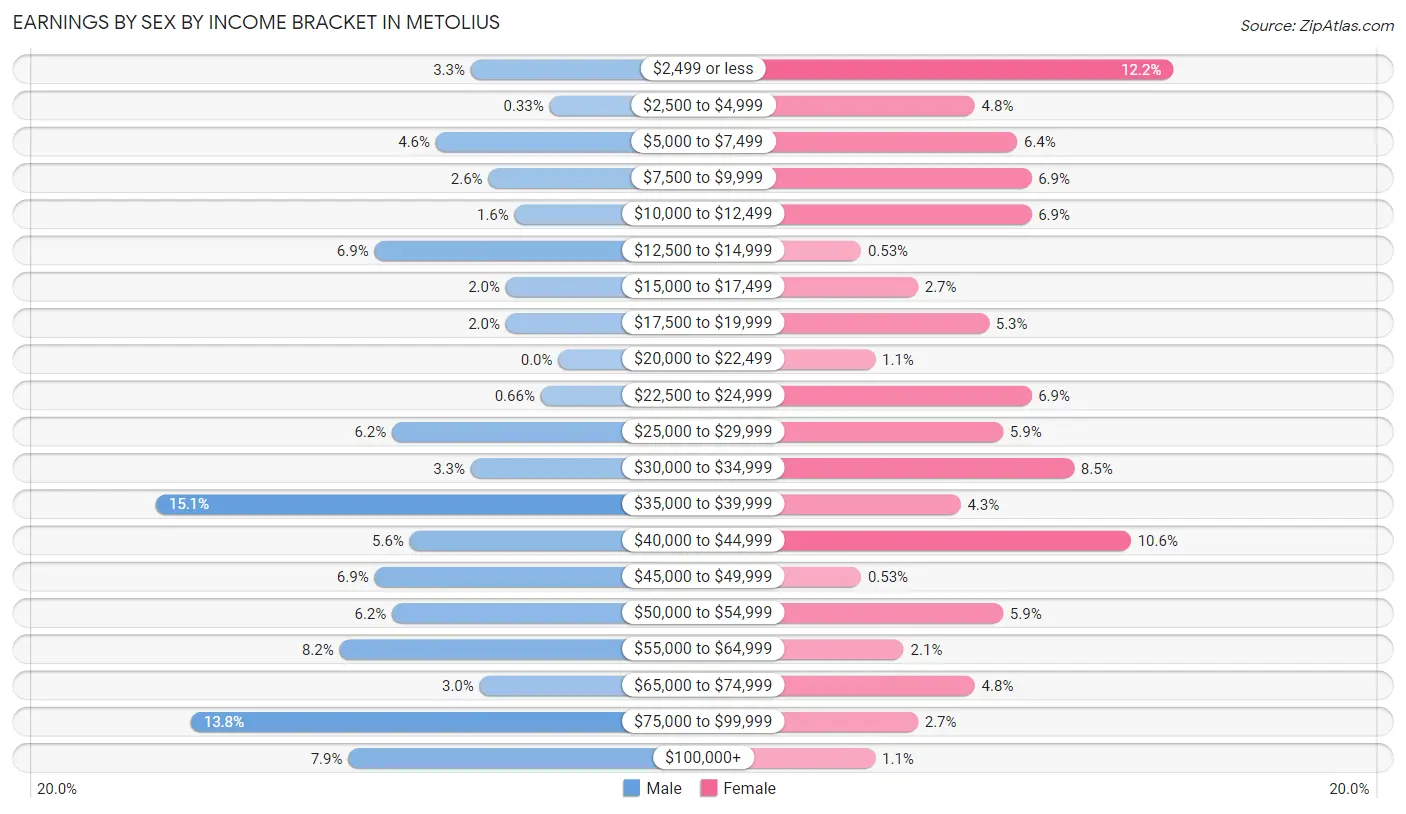
| Income | Male | Female |
| $2,499 or less | 10 (3.3%) | 23 (12.2%) |
| $2,500 to $4,999 | 1 (0.3%) | 9 (4.8%) |
| $5,000 to $7,499 | 14 (4.6%) | 12 (6.4%) |
| $7,500 to $9,999 | 8 (2.6%) | 13 (6.9%) |
| $10,000 to $12,499 | 5 (1.6%) | 13 (6.9%) |
| $12,500 to $14,999 | 21 (6.9%) | 1 (0.5%) |
| $15,000 to $17,499 | 6 (2.0%) | 5 (2.7%) |
| $17,500 to $19,999 | 6 (2.0%) | 10 (5.3%) |
| $20,000 to $22,499 | 0 (0.0%) | 2 (1.1%) |
| $22,500 to $24,999 | 2 (0.7%) | 13 (6.9%) |
| $25,000 to $29,999 | 19 (6.2%) | 11 (5.9%) |
| $30,000 to $34,999 | 10 (3.3%) | 16 (8.5%) |
| $35,000 to $39,999 | 46 (15.1%) | 8 (4.3%) |
| $40,000 to $44,999 | 17 (5.6%) | 20 (10.6%) |
| $45,000 to $49,999 | 21 (6.9%) | 1 (0.5%) |
| $50,000 to $54,999 | 19 (6.2%) | 11 (5.9%) |
| $55,000 to $64,999 | 25 (8.2%) | 4 (2.1%) |
| $65,000 to $74,999 | 9 (2.9%) | 9 (4.8%) |
| $75,000 to $99,999 | 42 (13.8%) | 5 (2.7%) |
| $100,000+ | 24 (7.9%) | 2 (1.1%) |
| Total | 305 (100.0%) | 188 (100.0%) |
Earnings by Sex by Educational Attainment in Metolius
Average earnings in Metolius are $45,568 for men and $25,000 for women, a difference of 45.1%. Men with an educational attainment of graduate degree enjoy the highest average annual earnings of $115,625, while those with high school diploma education earn the least with $38,854. Women with an educational attainment of graduate degree earn the most with the average annual earnings of $54,375, while those with college or associate's degree education have the smallest earnings of $21,875.
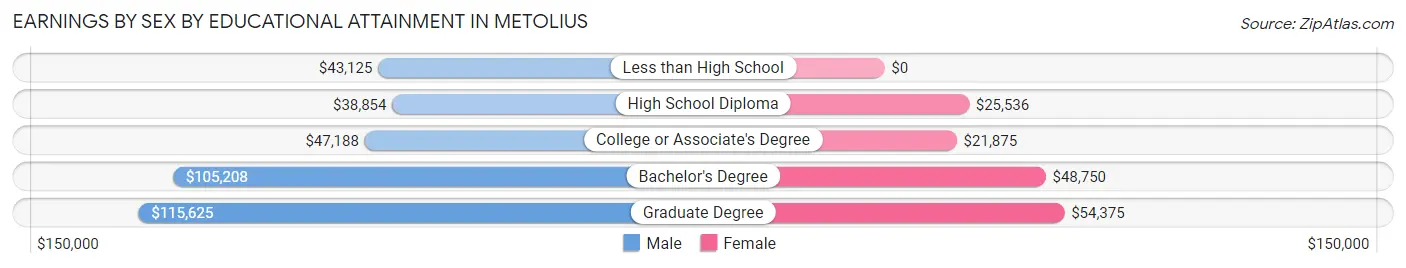
| Educational Attainment | Male Income | Female Income |
| Less than High School | $43,125 | $0 |
| High School Diploma | $38,854 | $25,536 |
| College or Associate's Degree | $47,188 | $21,875 |
| Bachelor's Degree | $105,208 | $48,750 |
| Graduate Degree | $115,625 | $54,375 |
| Total | $45,568 | $25,000 |
Family Income in Metolius
Family Income Brackets in Metolius
According to the Metolius family income data, there are 53 families falling into the $35,000 to $49,999 income range, which is the most common income bracket and makes up 22.7% of all families. Conversely, the less than $10,000 income bracket is the least frequent group with only 6 families (2.6%) belonging to this category.
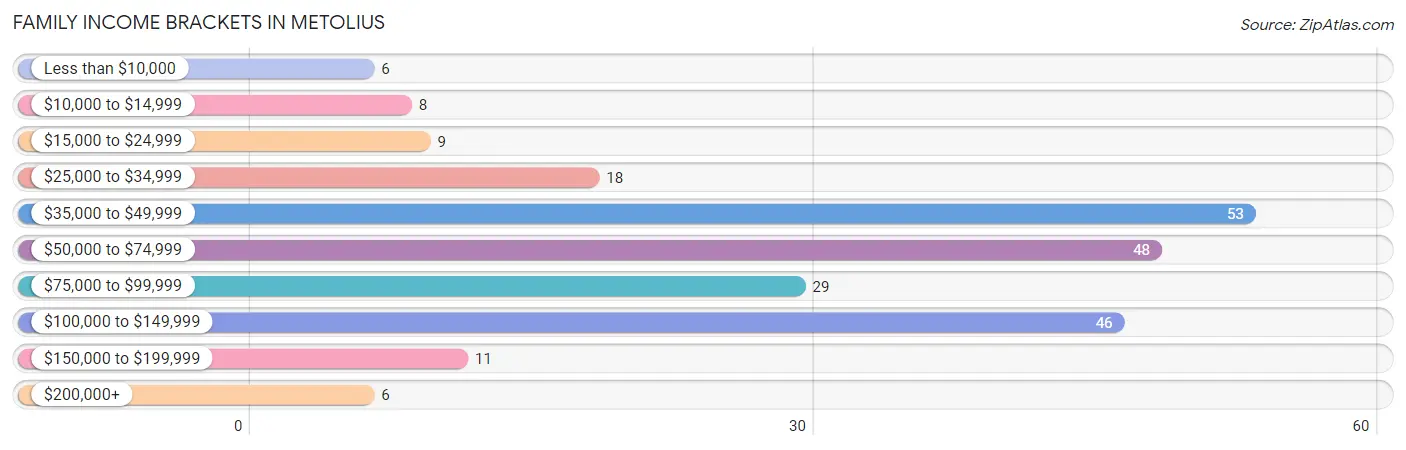
| Income Bracket | # Families | % Families |
| Less than $10,000 | 6 | 2.6% |
| $10,000 to $14,999 | 8 | 3.4% |
| $15,000 to $24,999 | 9 | 3.8% |
| $25,000 to $34,999 | 18 | 7.7% |
| $35,000 to $49,999 | 53 | 22.6% |
| $50,000 to $74,999 | 48 | 20.5% |
| $75,000 to $99,999 | 29 | 12.4% |
| $100,000 to $149,999 | 46 | 19.7% |
| $150,000 to $199,999 | 11 | 4.7% |
| $200,000+ | 6 | 2.6% |
Family Income by Famaliy Size in Metolius
3-person families (25 | 10.7%) account for the highest median family income in Metolius with $136,250 per family, while 3-person families (25 | 10.7%) have the highest median income of $45,417 per family member.
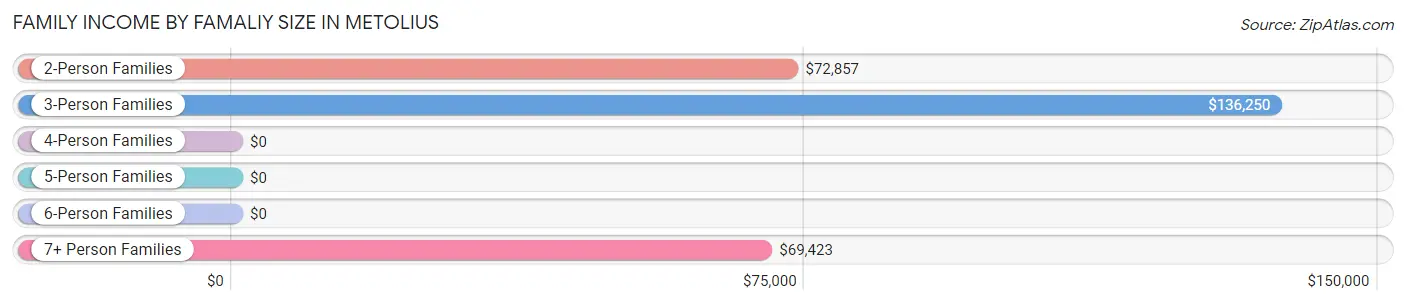
| Income Bracket | # Families | Median Income |
| 2-Person Families | 118 (50.4%) | $72,857 |
| 3-Person Families | 25 (10.7%) | $136,250 |
| 4-Person Families | 28 (12.0%) | $0 |
| 5-Person Families | 14 (6.0%) | $0 |
| 6-Person Families | 29 (12.4%) | $0 |
| 7+ Person Families | 20 (8.6%) | $69,423 |
| Total | 234 (100.0%) | $68,654 |
Family Income by Number of Earners in Metolius
The median family income in Metolius is $68,654, with families comprising 3+ earners (21) having the highest median family income of $112,188, while families with no earners (18) have the lowest median family income of $37,500, accounting for 9.0% and 7.7% of families, respectively.
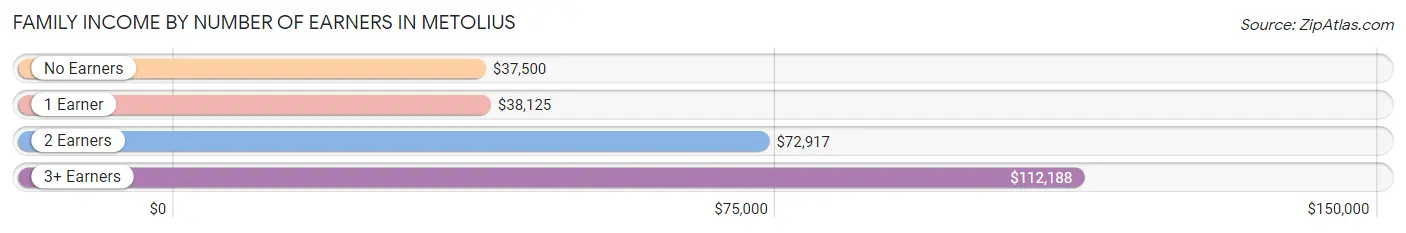
| Number of Earners | # Families | Median Income |
| No Earners | 18 (7.7%) | $37,500 |
| 1 Earner | 72 (30.8%) | $38,125 |
| 2 Earners | 123 (52.6%) | $72,917 |
| 3+ Earners | 21 (9.0%) | $112,188 |
| Total | 234 (100.0%) | $68,654 |
Household Income in Metolius
Household Income Brackets in Metolius
With 66 households falling in the category, the $35,000 to $49,999 income range is the most frequent in Metolius, accounting for 19.8% of all households. In contrast, only 6 households (1.8%) fall into the less than $10,000 income bracket, making it the least populous group.
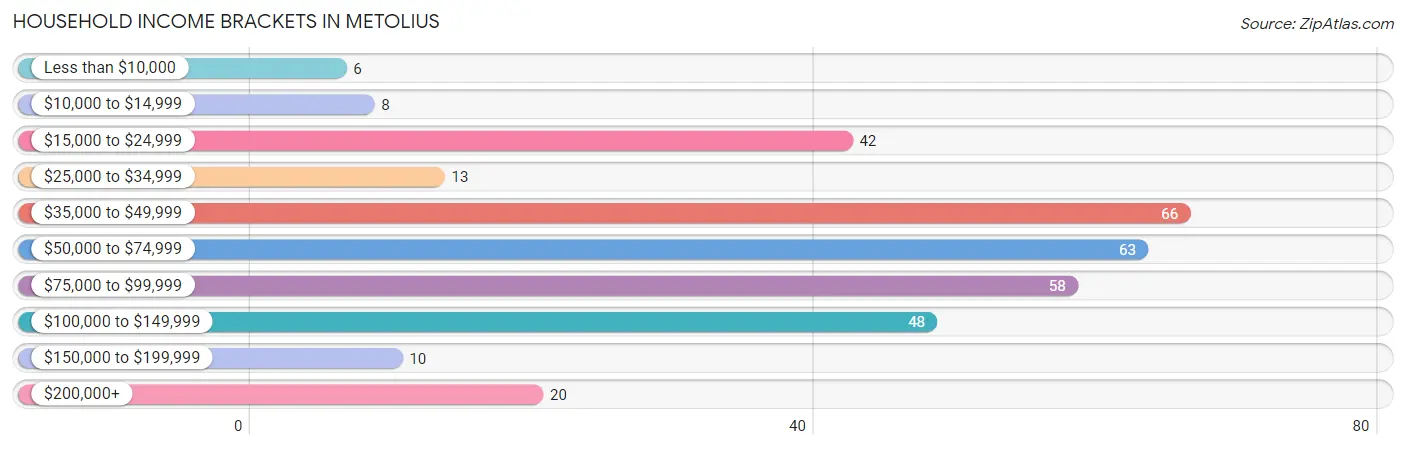
| Income Bracket | # Households | % Households |
| Less than $10,000 | 6 | 1.8% |
| $10,000 to $14,999 | 8 | 2.4% |
| $15,000 to $24,999 | 42 | 12.6% |
| $25,000 to $34,999 | 13 | 3.9% |
| $35,000 to $49,999 | 66 | 19.8% |
| $50,000 to $74,999 | 63 | 18.9% |
| $75,000 to $99,999 | 58 | 17.4% |
| $100,000 to $149,999 | 48 | 14.4% |
| $150,000 to $199,999 | 10 | 3.0% |
| $200,000+ | 20 | 6.0% |
Household Income by Householder Age in Metolius
The median household income in Metolius is $68,382, with the highest median household income of $73,194 found in the 45 to 64 years age bracket for the primary householder. A total of 137 households (41.0%) fall into this category. Meanwhile, the 15 to 24 years age bracket for the primary householder has the lowest median household income of $0, with 6 households (1.8%) in this group.
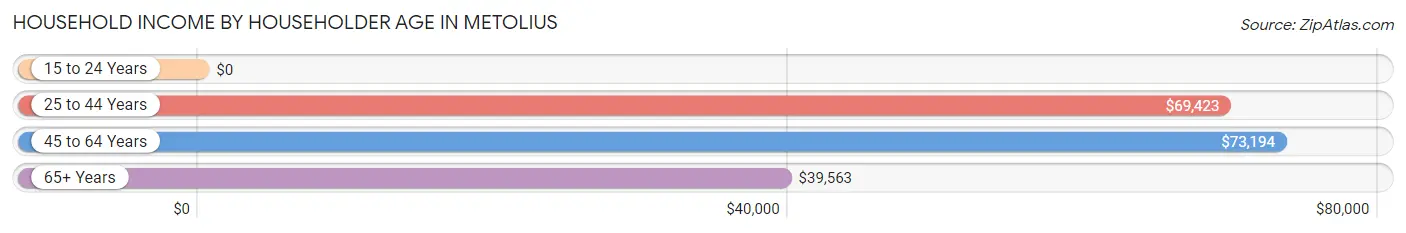
| Income Bracket | # Households | Median Income |
| 15 to 24 Years | 6 (1.8%) | $0 |
| 25 to 44 Years | 106 (31.7%) | $69,423 |
| 45 to 64 Years | 137 (41.0%) | $73,194 |
| 65+ Years | 85 (25.5%) | $39,563 |
| Total | 334 (100.0%) | $68,382 |
Poverty in Metolius
Income Below Poverty by Sex and Age in Metolius
With 7.1% poverty level for males and 27.6% for females among the residents of Metolius, under 5 year old males and 15 year old females are the most vulnerable to poverty, with 10 males (55.6%) and 1 females (100.0%) in their respective age groups living below the poverty level.
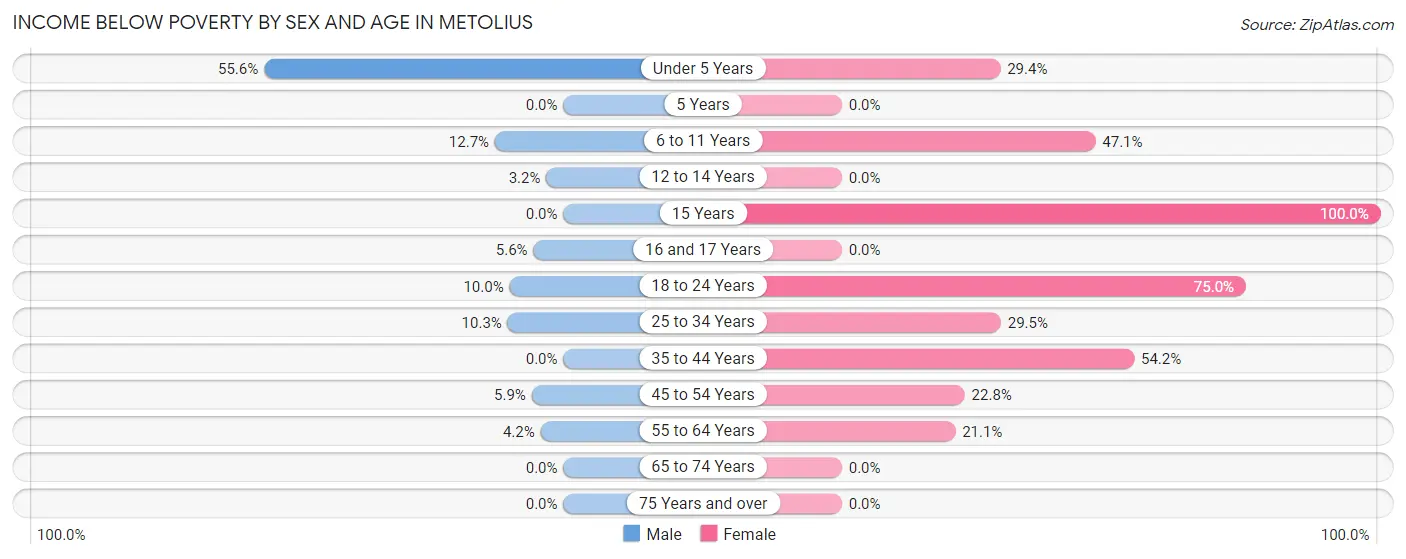
| Age Bracket | Male | Female |
| Under 5 Years | 10 (55.6%) | 5 (29.4%) |
| 5 Years | 0 (0.0%) | 0 (0.0%) |
| 6 to 11 Years | 8 (12.7%) | 16 (47.1%) |
| 12 to 14 Years | 2 (3.2%) | 0 (0.0%) |
| 15 Years | 0 (0.0%) | 1 (100.0%) |
| 16 and 17 Years | 1 (5.6%) | 0 (0.0%) |
| 18 to 24 Years | 3 (10.0%) | 18 (75.0%) |
| 25 to 34 Years | 6 (10.3%) | 18 (29.5%) |
| 35 to 44 Years | 0 (0.0%) | 32 (54.2%) |
| 45 to 54 Years | 3 (5.9%) | 13 (22.8%) |
| 55 to 64 Years | 3 (4.2%) | 12 (21.0%) |
| 65 to 74 Years | 0 (0.0%) | 0 (0.0%) |
| 75 Years and over | 0 (0.0%) | 0 (0.0%) |
| Total | 36 (7.1%) | 115 (27.6%) |
Income Above Poverty by Sex and Age in Metolius
According to the poverty statistics in Metolius, males aged 5 years and females aged 5 years are the age groups that are most secure financially, with 100.0% of males and 100.0% of females in these age groups living above the poverty line.
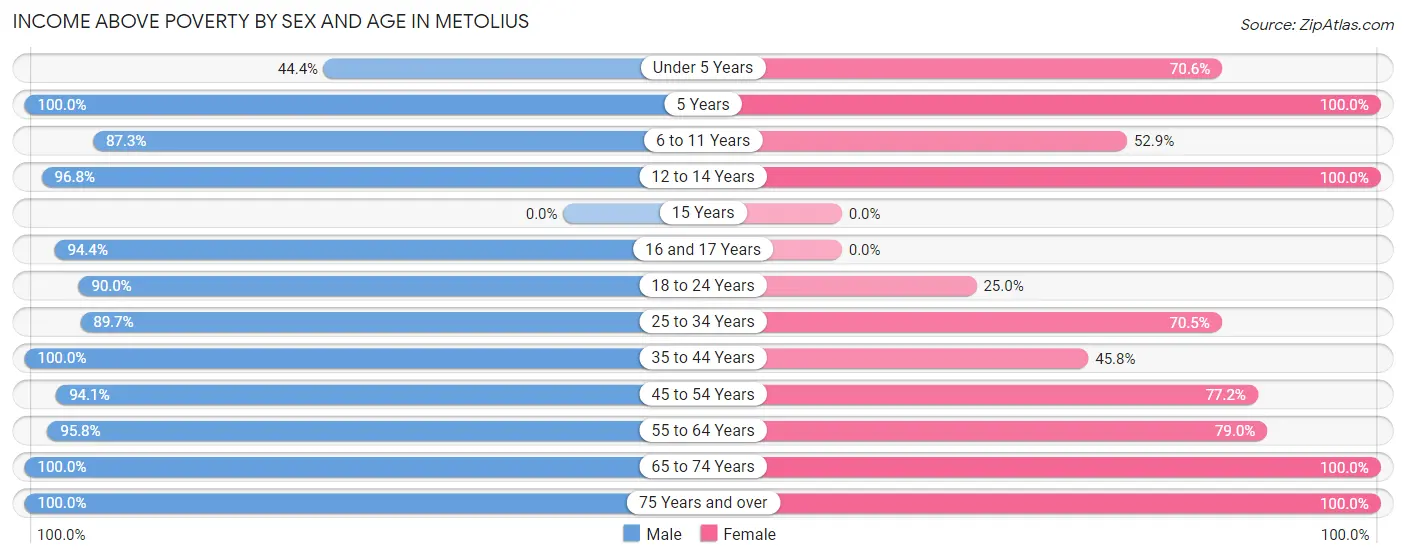
| Age Bracket | Male | Female |
| Under 5 Years | 8 (44.4%) | 12 (70.6%) |
| 5 Years | 2 (100.0%) | 3 (100.0%) |
| 6 to 11 Years | 55 (87.3%) | 18 (52.9%) |
| 12 to 14 Years | 61 (96.8%) | 33 (100.0%) |
| 15 Years | 0 (0.0%) | 0 (0.0%) |
| 16 and 17 Years | 17 (94.4%) | 0 (0.0%) |
| 18 to 24 Years | 27 (90.0%) | 6 (25.0%) |
| 25 to 34 Years | 52 (89.7%) | 43 (70.5%) |
| 35 to 44 Years | 82 (100.0%) | 27 (45.8%) |
| 45 to 54 Years | 48 (94.1%) | 44 (77.2%) |
| 55 to 64 Years | 68 (95.8%) | 45 (78.9%) |
| 65 to 74 Years | 39 (100.0%) | 49 (100.0%) |
| 75 Years and over | 9 (100.0%) | 22 (100.0%) |
| Total | 468 (92.9%) | 302 (72.4%) |
Income Below Poverty Among Married-Couple Families in Metolius
The poverty statistics for married-couple families in Metolius show that 4.4% or 6 of the total 136 families live below the poverty line. Families with 1 or 2 children have the highest poverty rate of 18.8%, comprising of 3 families. On the other hand, families with 3 or 4 children have the lowest poverty rate of 0.0%, which includes 0 families.
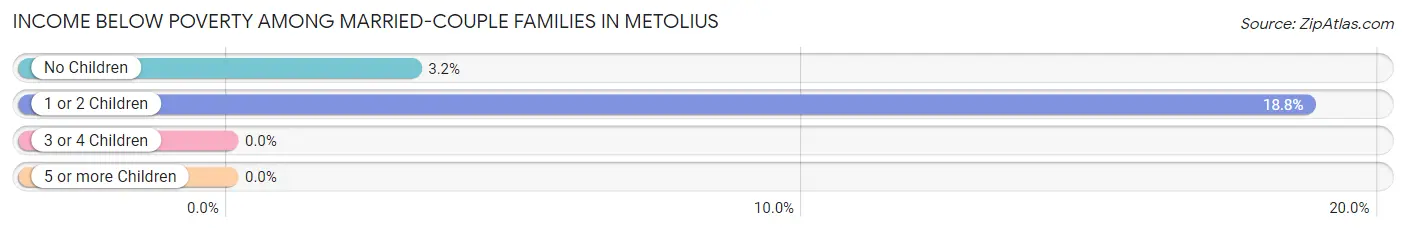
| Children | Above Poverty | Below Poverty |
| No Children | 91 (96.8%) | 3 (3.2%) |
| 1 or 2 Children | 13 (81.2%) | 3 (18.8%) |
| 3 or 4 Children | 13 (100.0%) | 0 (0.0%) |
| 5 or more Children | 13 (100.0%) | 0 (0.0%) |
| Total | 130 (95.6%) | 6 (4.4%) |
Income Below Poverty Among Single-Parent Households in Metolius
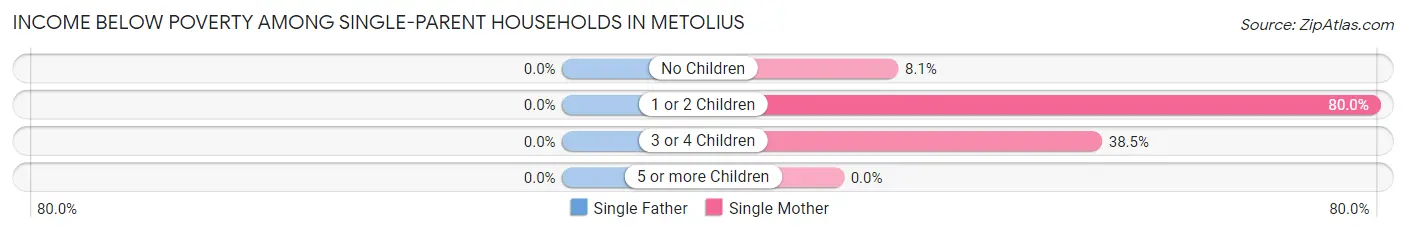
| Children | Single Father | Single Mother |
| No Children | 0 (0.0%) | 3 (8.1%) |
| 1 or 2 Children | 0 (0.0%) | 8 (80.0%) |
| 3 or 4 Children | 0 (0.0%) | 5 (38.5%) |
| 5 or more Children | 0 (0.0%) | 0 (0.0%) |
| Total | 0 (0.0%) | 16 (26.7%) |
Income Below Poverty Among Married-Couple vs Single-Parent Households in Metolius
The poverty data for Metolius shows that 6 of the married-couple family households (4.4%) and 16 of the single-parent households (16.3%) are living below the poverty level. Within the married-couple family households, those with 1 or 2 children have the highest poverty rate, with 3 households (18.8%) falling below the poverty line. Among the single-parent households, those with 1 or 2 children have the highest poverty rate, with 8 household (66.7%) living below poverty.
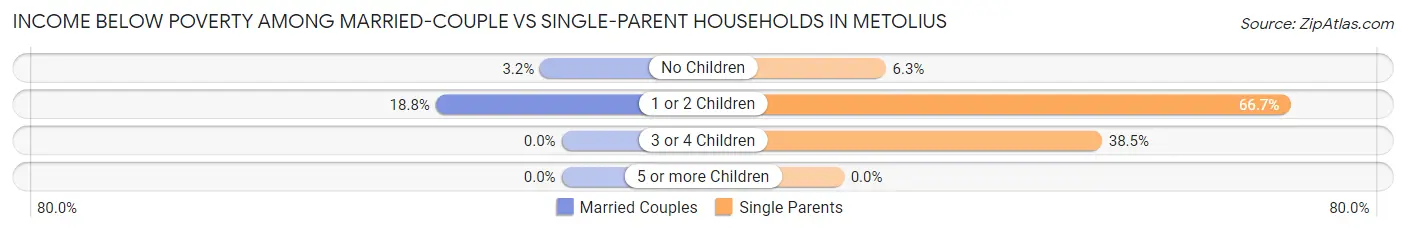
| Children | Married-Couple Families | Single-Parent Households |
| No Children | 3 (3.2%) | 3 (6.2%) |
| 1 or 2 Children | 3 (18.8%) | 8 (66.7%) |
| 3 or 4 Children | 0 (0.0%) | 5 (38.5%) |
| 5 or more Children | 0 (0.0%) | 0 (0.0%) |
| Total | 6 (4.4%) | 16 (16.3%) |
Race in Metolius
The most populous races in Metolius are White / Caucasian (736 | 79.9%), Hispanic or Latino (356 | 38.7%), and Some other Race (89 | 9.7%).
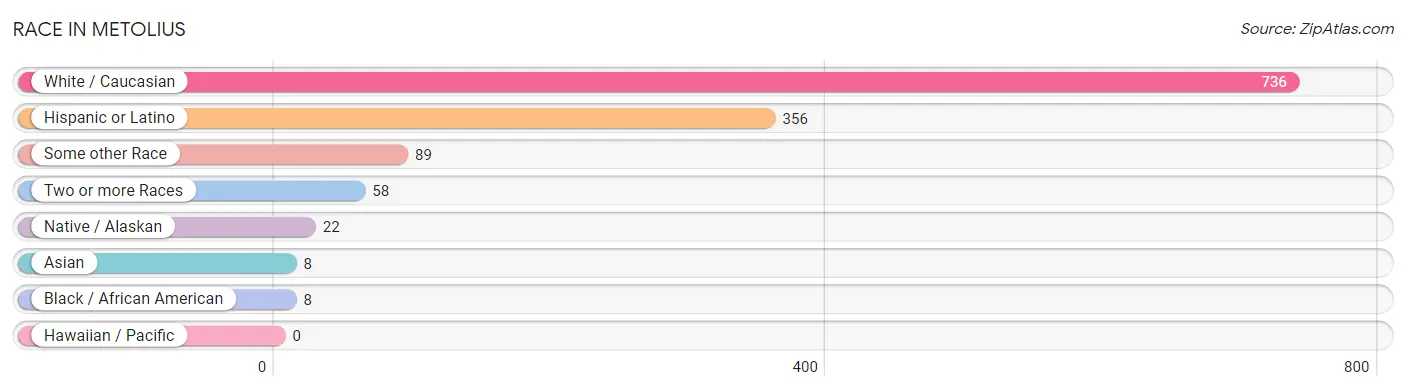
| Race | # Population | % Population |
| Asian | 8 | 0.9% |
| Black / African American | 8 | 0.9% |
| Hawaiian / Pacific | 0 | 0.0% |
| Hispanic or Latino | 356 | 38.7% |
| Native / Alaskan | 22 | 2.4% |
| White / Caucasian | 736 | 79.9% |
| Two or more Races | 58 | 6.3% |
| Some other Race | 89 | 9.7% |
| Total | 921 | 100.0% |
Ancestry in Metolius
The most populous ancestries reported in Metolius are Mexican (341 | 37.0%), English (85 | 9.2%), German (79 | 8.6%), Irish (73 | 7.9%), and Swedish (23 | 2.5%), together accounting for 65.3% of all Metolius residents.
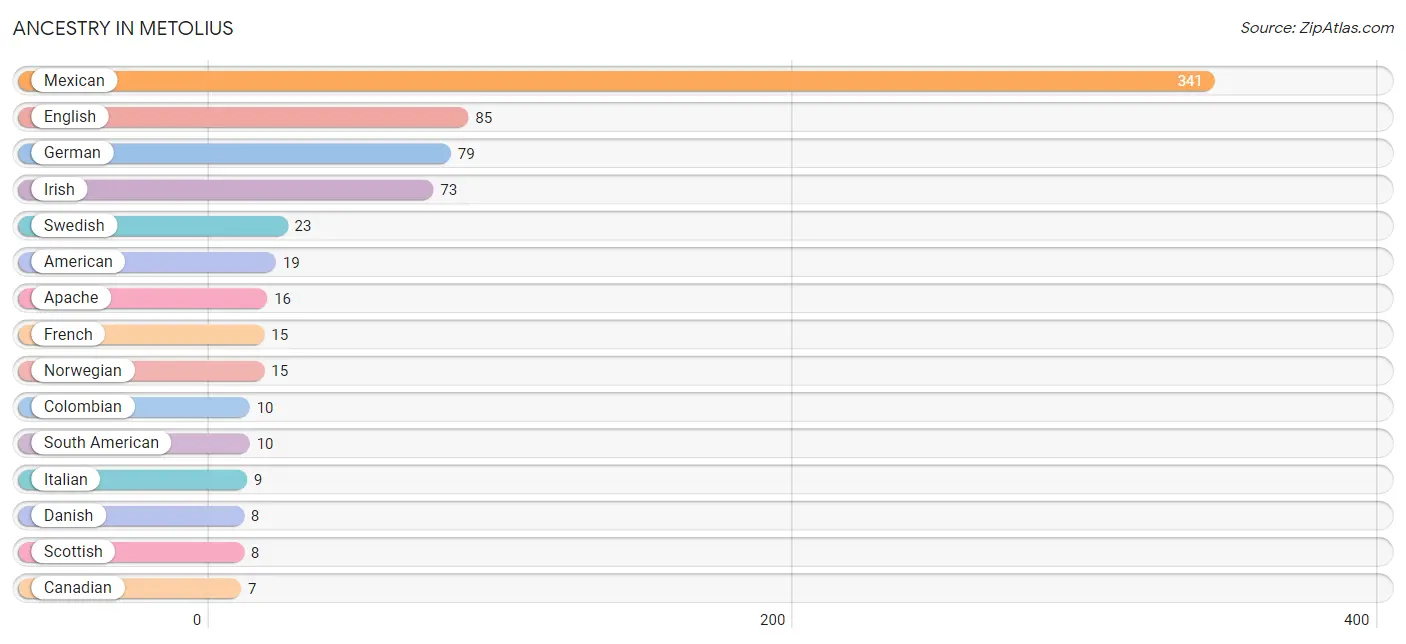
| Ancestry | # Population | % Population |
| American | 19 | 2.1% |
| Apache | 16 | 1.7% |
| Blackfeet | 4 | 0.4% |
| British | 4 | 0.4% |
| Canadian | 7 | 0.8% |
| Central American | 3 | 0.3% |
| Colombian | 10 | 1.1% |
| Cuban | 2 | 0.2% |
| Czech | 2 | 0.2% |
| Danish | 8 | 0.9% |
| Dutch | 2 | 0.2% |
| English | 85 | 9.2% |
| European | 4 | 0.4% |
| Finnish | 1 | 0.1% |
| French | 15 | 1.6% |
| French Canadian | 2 | 0.2% |
| German | 79 | 8.6% |
| Inupiat | 5 | 0.5% |
| Irish | 73 | 7.9% |
| Italian | 9 | 1.0% |
| Korean | 7 | 0.8% |
| Mexican | 341 | 37.0% |
| Northern European | 2 | 0.2% |
| Norwegian | 15 | 1.6% |
| Polish | 1 | 0.1% |
| Portuguese | 1 | 0.1% |
| Salvadoran | 3 | 0.3% |
| Scandinavian | 2 | 0.2% |
| Scotch-Irish | 3 | 0.3% |
| Scottish | 8 | 0.9% |
| Sioux | 6 | 0.6% |
| South American | 10 | 1.1% |
| Swedish | 23 | 2.5% |
| Swiss | 2 | 0.2% |
| Welsh | 1 | 0.1% | View All 35 Rows |
Immigrants in Metolius
The most numerous immigrant groups reported in Metolius came from Latin America (87 | 9.5%), Central America (85 | 9.2%), Mexico (82 | 8.9%), Asia (8 | 0.9%), and Philippines (6 | 0.6%), together accounting for 29.1% of all Metolius residents.
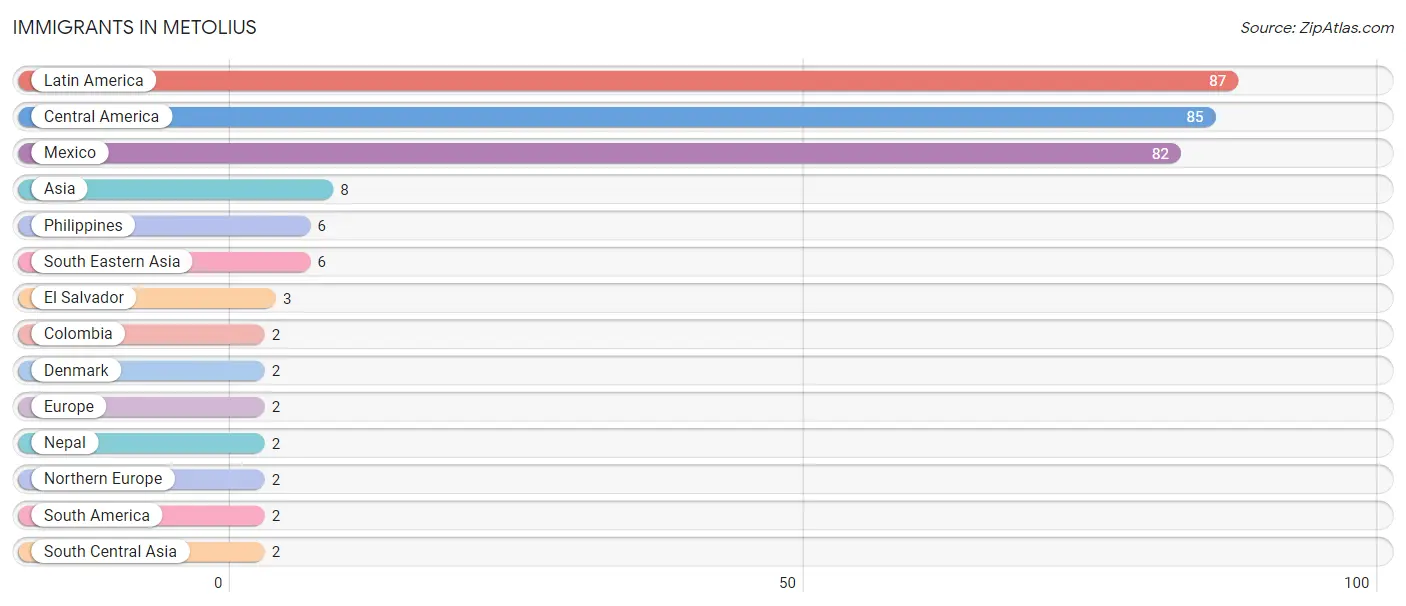
| Immigration Origin | # Population | % Population |
| Asia | 8 | 0.9% |
| Central America | 85 | 9.2% |
| Colombia | 2 | 0.2% |
| Denmark | 2 | 0.2% |
| El Salvador | 3 | 0.3% |
| Europe | 2 | 0.2% |
| Latin America | 87 | 9.5% |
| Mexico | 82 | 8.9% |
| Nepal | 2 | 0.2% |
| Northern Europe | 2 | 0.2% |
| Philippines | 6 | 0.6% |
| South America | 2 | 0.2% |
| South Central Asia | 2 | 0.2% |
| South Eastern Asia | 6 | 0.6% | View All 14 Rows |
Sex and Age in Metolius
Sex and Age in Metolius
The most populous age groups in Metolius are 10 to 14 Years (110 | 21.8%) for men and 35 to 39 Years (52 | 12.5%) for women.
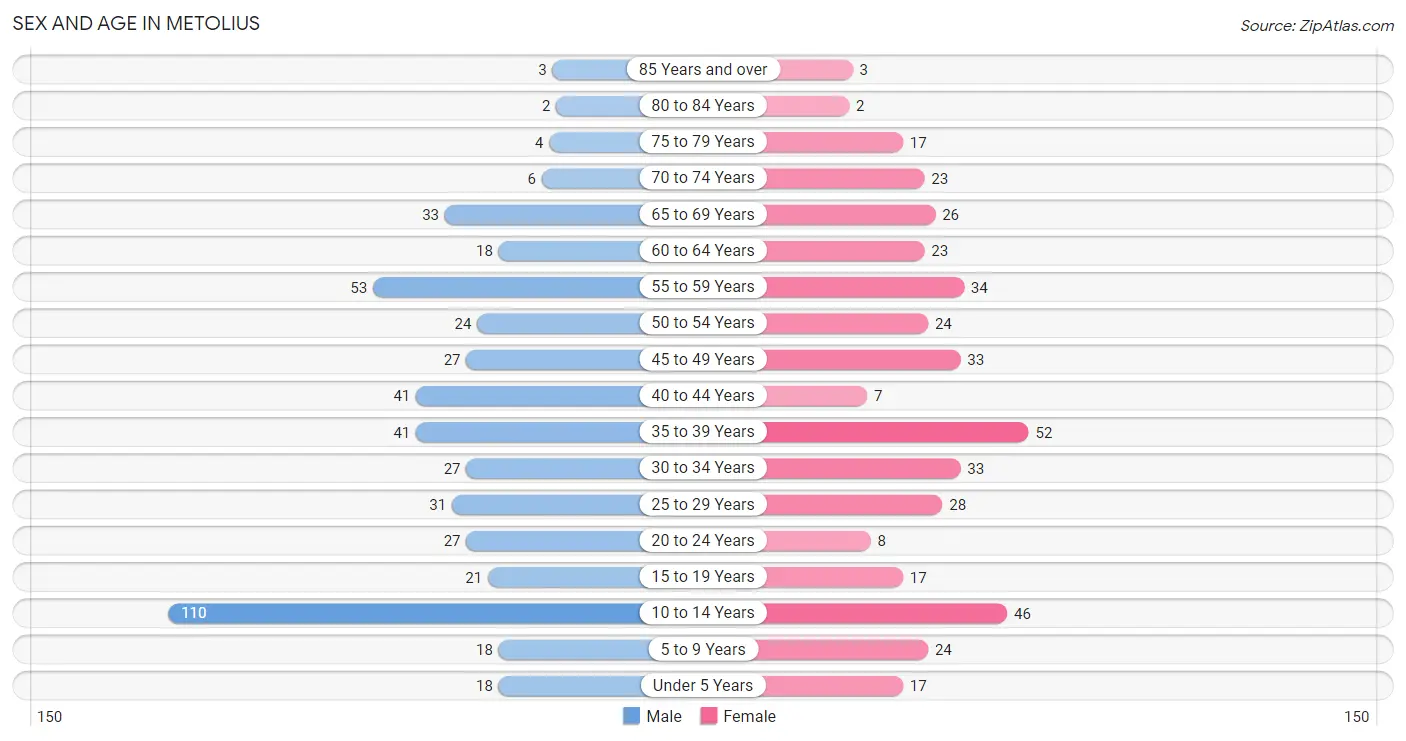
| Age Bracket | Male | Female |
| Under 5 Years | 18 (3.6%) | 17 (4.1%) |
| 5 to 9 Years | 18 (3.6%) | 24 (5.8%) |
| 10 to 14 Years | 110 (21.8%) | 46 (11.0%) |
| 15 to 19 Years | 21 (4.2%) | 17 (4.1%) |
| 20 to 24 Years | 27 (5.4%) | 8 (1.9%) |
| 25 to 29 Years | 31 (6.1%) | 28 (6.7%) |
| 30 to 34 Years | 27 (5.4%) | 33 (7.9%) |
| 35 to 39 Years | 41 (8.1%) | 52 (12.5%) |
| 40 to 44 Years | 41 (8.1%) | 7 (1.7%) |
| 45 to 49 Years | 27 (5.4%) | 33 (7.9%) |
| 50 to 54 Years | 24 (4.8%) | 24 (5.8%) |
| 55 to 59 Years | 53 (10.5%) | 34 (8.2%) |
| 60 to 64 Years | 18 (3.6%) | 23 (5.5%) |
| 65 to 69 Years | 33 (6.6%) | 26 (6.2%) |
| 70 to 74 Years | 6 (1.2%) | 23 (5.5%) |
| 75 to 79 Years | 4 (0.8%) | 17 (4.1%) |
| 80 to 84 Years | 2 (0.4%) | 2 (0.5%) |
| 85 Years and over | 3 (0.6%) | 3 (0.7%) |
| Total | 504 (100.0%) | 417 (100.0%) |
Families and Households in Metolius
Median Family Size in Metolius
The median family size in Metolius is 3.06 persons per family, with single male/father families (38 | 16.2%) accounting for the largest median family size of 3.89 persons per family. On the other hand, married-couple families (136 | 58.1%) represent the smallest median family size with 2.87 persons per family.
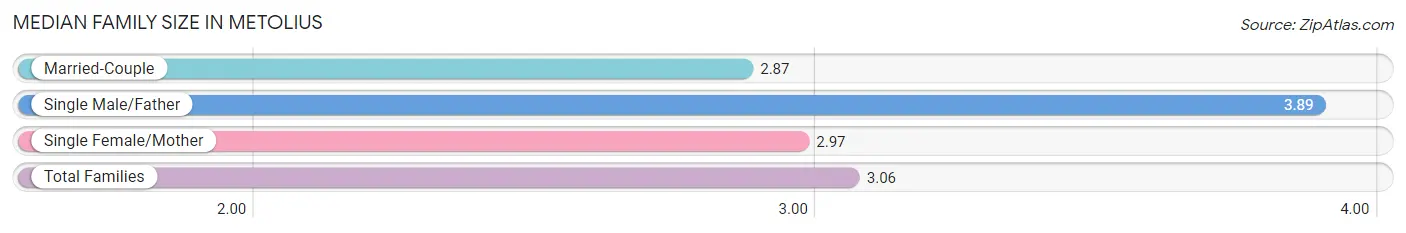
| Family Type | # Families | Family Size |
| Married-Couple | 136 (58.1%) | 2.87 |
| Single Male/Father | 38 (16.2%) | 3.89 |
| Single Female/Mother | 60 (25.6%) | 2.97 |
| Total Families | 234 (100.0%) | 3.06 |
Median Household Size in Metolius
The median household size in Metolius is 2.76 persons per household, with single male/father households (38 | 11.4%) accounting for the largest median household size of 4.76 persons per household. non-family households (100 | 29.9%) represent the smallest median household size with 1.27 persons per household.
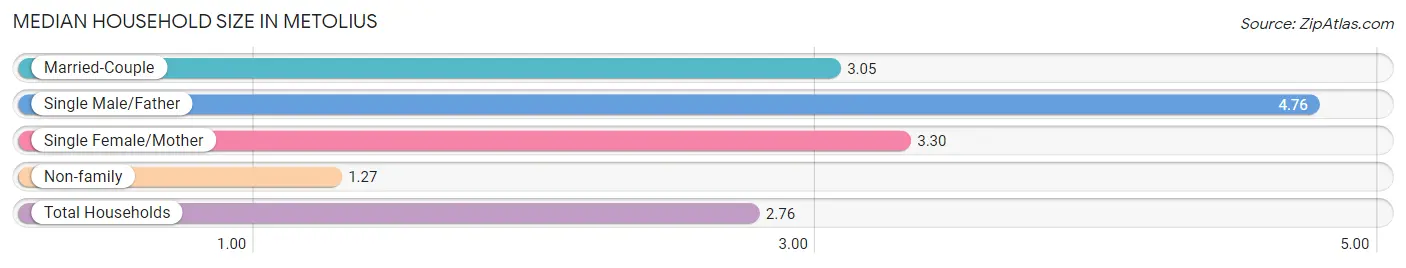
| Household Type | # Households | Household Size |
| Married-Couple | 136 (40.7%) | 3.05 |
| Single Male/Father | 38 (11.4%) | 4.76 |
| Single Female/Mother | 60 (18.0%) | 3.30 |
| Non-family | 100 (29.9%) | 1.27 |
| Total Households | 334 (100.0%) | 2.76 |
Household Size by Marriage Status in Metolius
Out of a total of 334 households in Metolius, 234 (70.1%) are family households, while 100 (29.9%) are nonfamily households. The most numerous type of family households are 2-person households, comprising 115, and the most common type of nonfamily households are 1-person households, comprising 66.
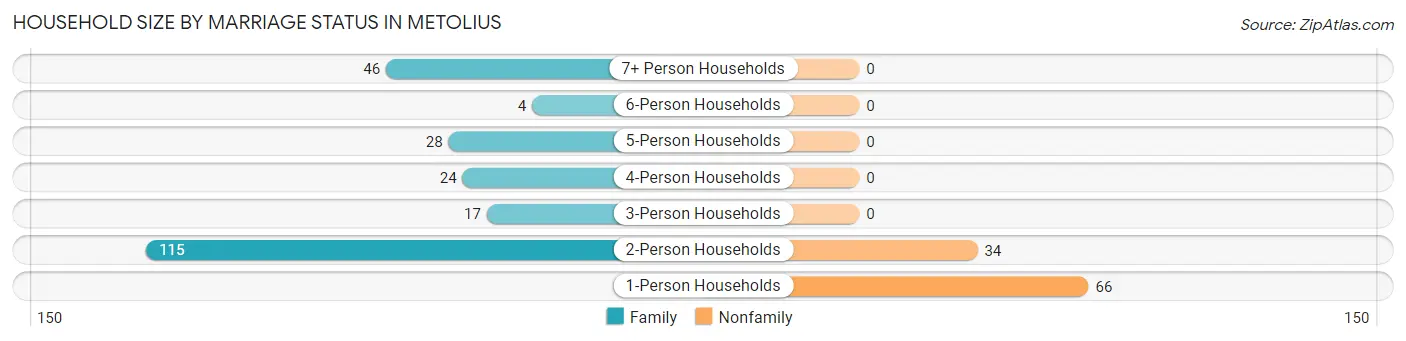
| Household Size | Family Households | Nonfamily Households |
| 1-Person Households | - | 66 (19.8%) |
| 2-Person Households | 115 (34.4%) | 34 (10.2%) |
| 3-Person Households | 17 (5.1%) | 0 (0.0%) |
| 4-Person Households | 24 (7.2%) | 0 (0.0%) |
| 5-Person Households | 28 (8.4%) | 0 (0.0%) |
| 6-Person Households | 4 (1.2%) | 0 (0.0%) |
| 7+ Person Households | 46 (13.8%) | 0 (0.0%) |
| Total | 234 (70.1%) | 100 (29.9%) |
Female Fertility in Metolius
Fertility by Age in Metolius
Average fertility rate in Metolius is 101.0 births per 1,000 women. Women in the age bracket of 20 to 34 years have the highest fertility rate with 261.0 births per 1,000 women. Women in the age bracket of 20 to 34 years acount for 100.0% of all women with births.
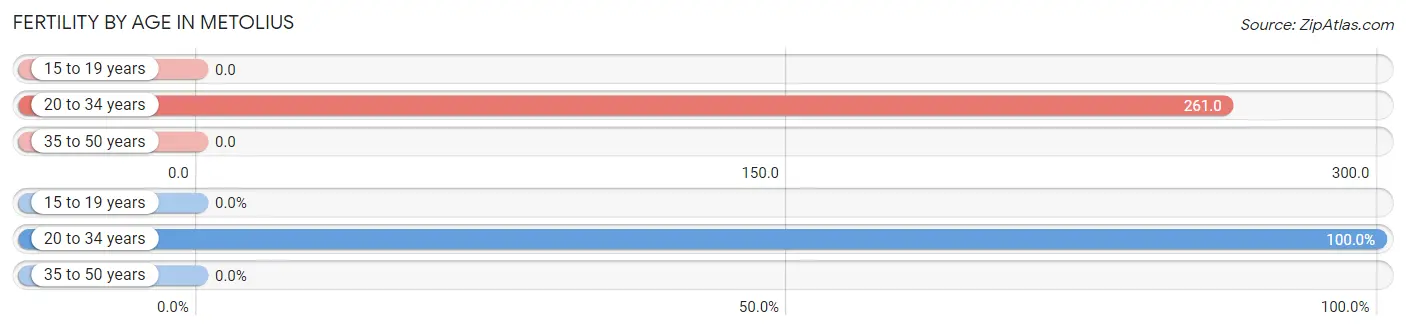
| Age Bracket | Women with Births | Births / 1,000 Women |
| 15 to 19 years | 0 (0.0%) | 0.0 |
| 20 to 34 years | 18 (100.0%) | 261.0 |
| 35 to 50 years | 0 (0.0%) | 0.0 |
| Total | 18 (100.0%) | 101.0 |
Fertility by Age by Marriage Status in Metolius
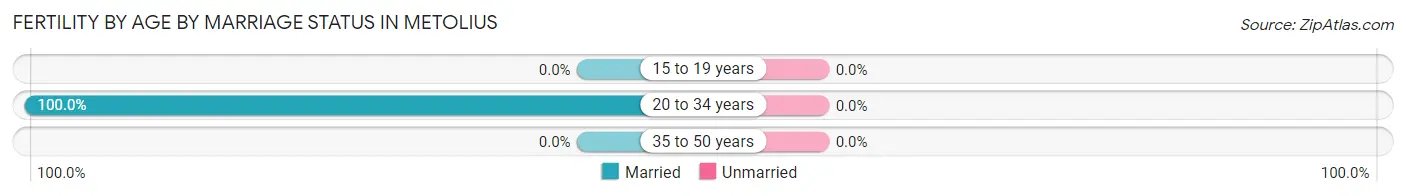
| Age Bracket | Married | Unmarried |
| 15 to 19 years | 0 (0.0%) | 0 (0.0%) |
| 20 to 34 years | 18 (100.0%) | 0 (0.0%) |
| 35 to 50 years | 0 (0.0%) | 0 (0.0%) |
| Total | 18 (100.0%) | 0 (0.0%) |
Fertility by Education in Metolius
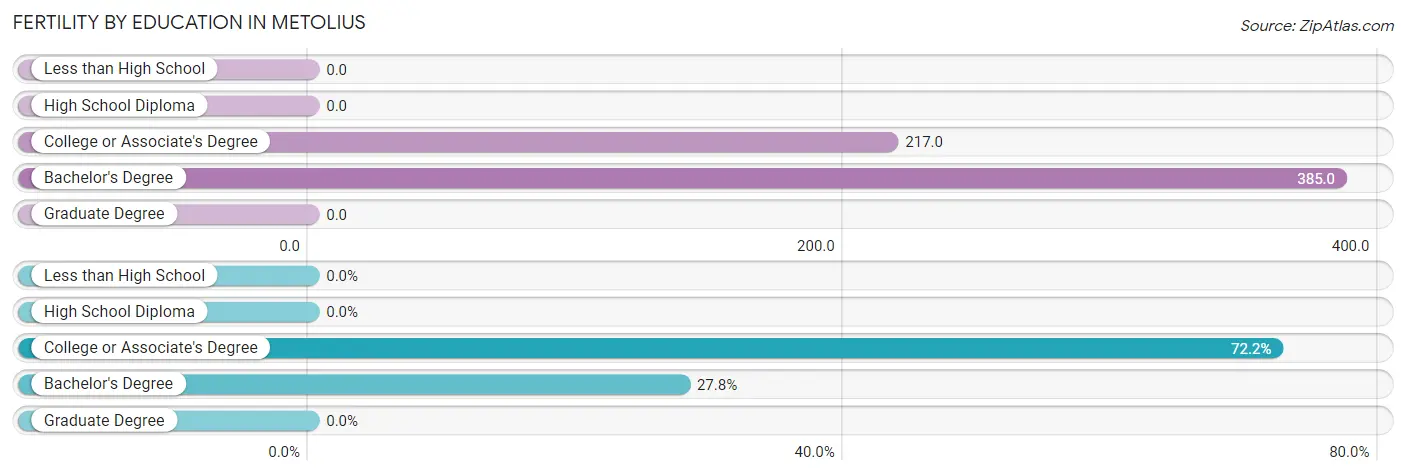
| Educational Attainment | Women with Births | Births / 1,000 Women |
| Less than High School | 0 (0.0%) | 0.0 |
| High School Diploma | 0 (0.0%) | 0.0 |
| College or Associate's Degree | 13 (72.2%) | 217.0 |
| Bachelor's Degree | 5 (27.8%) | 385.0 |
| Graduate Degree | 0 (0.0%) | 0.0 |
| Total | 18 (100.0%) | 101.0 |
Fertility by Education by Marriage Status in Metolius
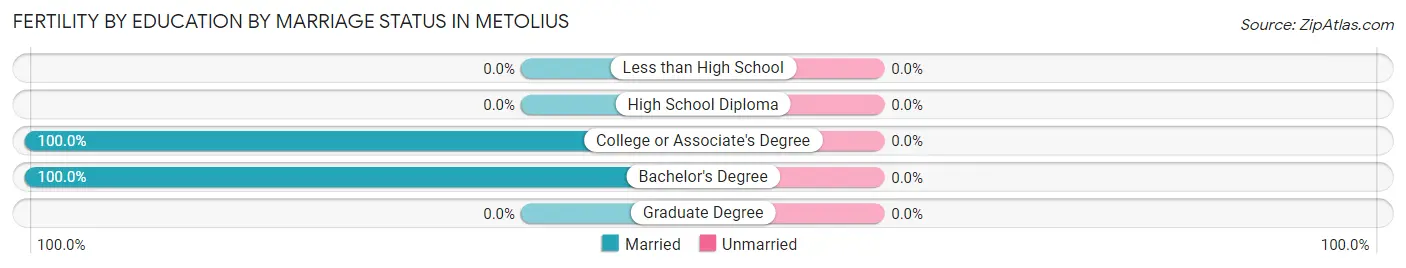
| Educational Attainment | Married | Unmarried |
| Less than High School | 0 (0.0%) | 0 (0.0%) |
| High School Diploma | 0 (0.0%) | 0 (0.0%) |
| College or Associate's Degree | 13 (100.0%) | 0 (0.0%) |
| Bachelor's Degree | 5 (100.0%) | 0 (0.0%) |
| Graduate Degree | 0 (0.0%) | 0 (0.0%) |
| Total | 18 (100.0%) | 0 (0.0%) |
Employment Characteristics in Metolius
Employment by Class of Employer in Metolius
Among the 408 employed individuals in Metolius, private company employees (274 | 67.2%), not-for-profit organizations (53 | 13.0%), and self-employed (not incorporated) (44 | 10.8%) make up the most common classes of employment.
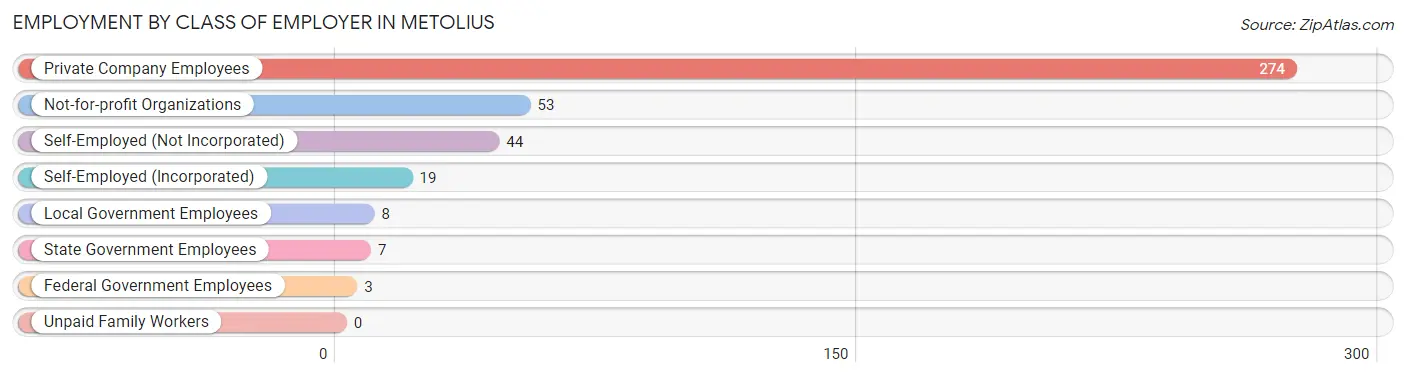
| Employer Class | # Employees | % Employees |
| Private Company Employees | 274 | 67.2% |
| Self-Employed (Incorporated) | 19 | 4.7% |
| Self-Employed (Not Incorporated) | 44 | 10.8% |
| Not-for-profit Organizations | 53 | 13.0% |
| Local Government Employees | 8 | 2.0% |
| State Government Employees | 7 | 1.7% |
| Federal Government Employees | 3 | 0.7% |
| Unpaid Family Workers | 0 | 0.0% |
| Total | 408 | 100.0% |
Employment Status by Age in Metolius
According to the labor force statistics for Metolius, out of the total population over 16 years of age (687), 63.5% or 436 individuals are in the labor force, with 3.4% or 15 of them unemployed. The age group with the highest labor force participation rate is 55 to 59 years, with 93.1% or 81 individuals in the labor force. Within the labor force, the 20 to 24 years age range has the highest percentage of unemployed individuals, with 11.1% or 3 of them being unemployed.
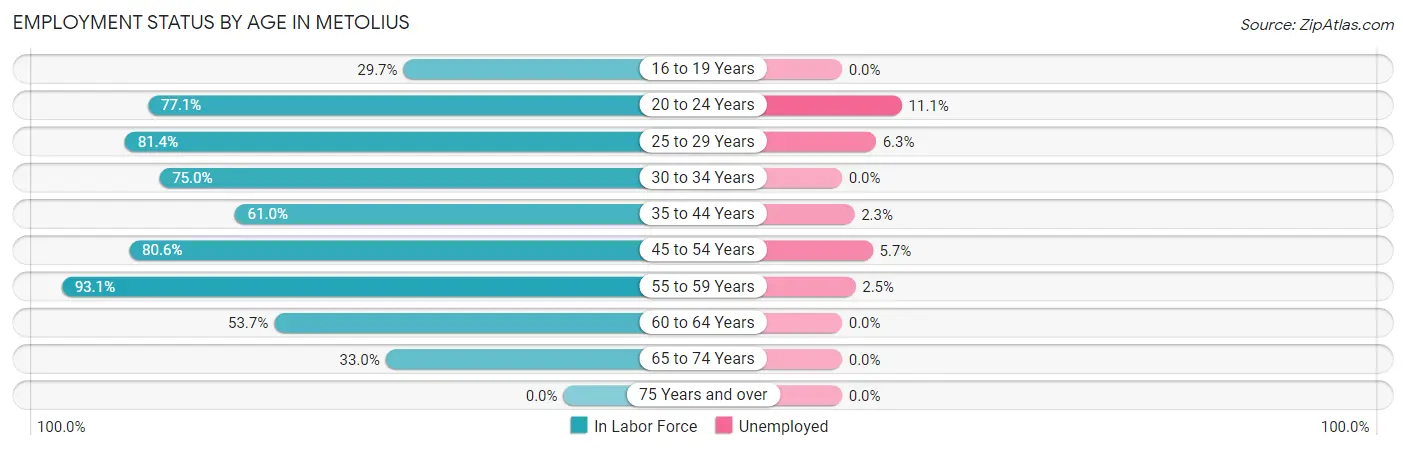
| Age Bracket | In Labor Force | Unemployed |
| 16 to 19 Years | 11 (29.7%) | 0 (0.0%) |
| 20 to 24 Years | 27 (77.1%) | 3 (11.1%) |
| 25 to 29 Years | 48 (81.4%) | 3 (6.3%) |
| 30 to 34 Years | 45 (75.0%) | 0 (0.0%) |
| 35 to 44 Years | 86 (61.0%) | 2 (2.3%) |
| 45 to 54 Years | 87 (80.6%) | 5 (5.7%) |
| 55 to 59 Years | 81 (93.1%) | 2 (2.5%) |
| 60 to 64 Years | 22 (53.7%) | 0 (0.0%) |
| 65 to 74 Years | 29 (33.0%) | 0 (0.0%) |
| 75 Years and over | 0 (0.0%) | 0 (0.0%) |
| Total | 436 (63.5%) | 15 (3.4%) |
Employment Status by Educational Attainment in Metolius
According to labor force statistics for Metolius, 74.4% of individuals (369) out of the total population between 25 and 64 years of age (496) are in the labor force, with 3.3% or 12 of them being unemployed. The group with the highest labor force participation rate are those with the educational attainment of bachelor's degree or higher, with 86.0% or 37 individuals in the labor force. Within the labor force, individuals with less than high school education have the highest percentage of unemployment, with 8.3% or 7 of them being unemployed.
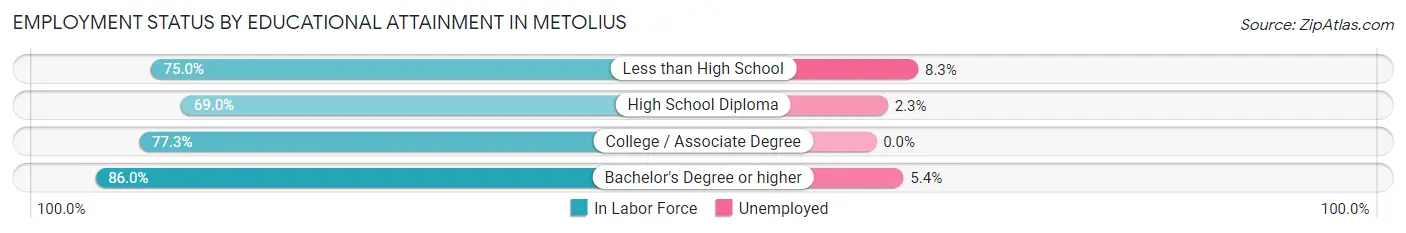
| Educational Attainment | In Labor Force | Unemployed |
| Less than High School | 84 (75.0%) | 9 (8.3%) |
| High School Diploma | 129 (69.0%) | 4 (2.3%) |
| College / Associate Degree | 119 (77.3%) | 0 (0.0%) |
| Bachelor's Degree or higher | 37 (86.0%) | 2 (5.4%) |
| Total | 369 (74.4%) | 16 (3.3%) |
Employment Occupations by Sex in Metolius
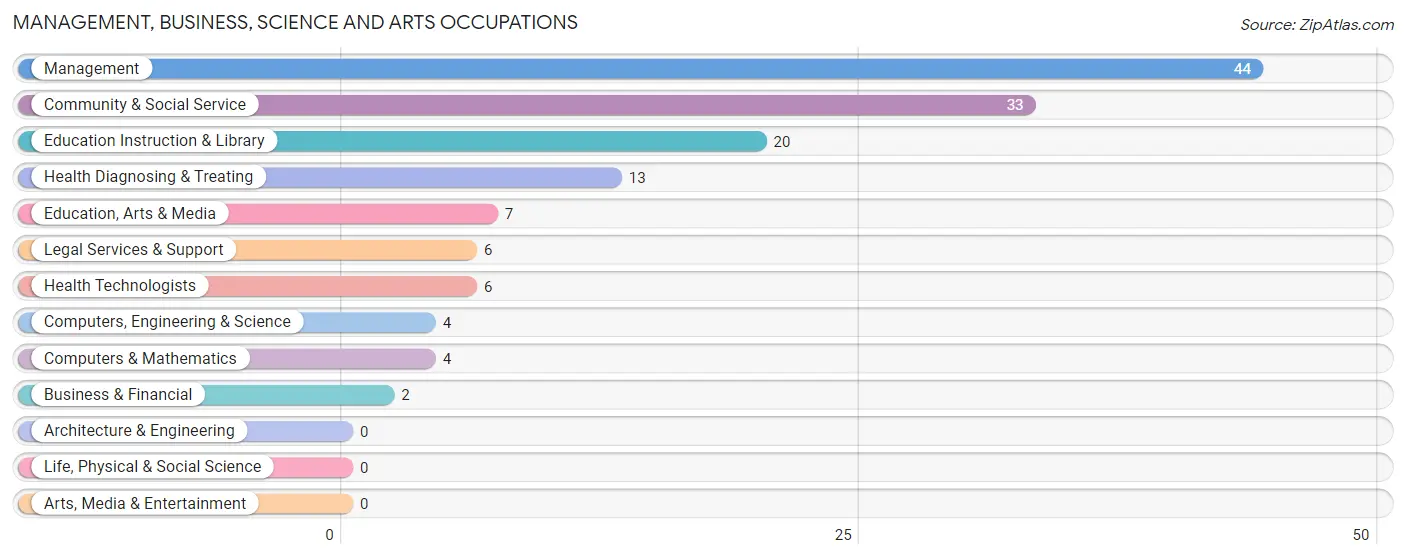
Management, Business, Science and Arts Occupations
The most common Management, Business, Science and Arts occupations in Metolius are Management (44 | 10.4%), Community & Social Service (33 | 7.8%), Education Instruction & Library (20 | 4.8%), Health Diagnosing & Treating (13 | 3.1%), and Education, Arts & Media (7 | 1.7%).
Management, Business, Science and Arts Occupations by Sex
Within the Management, Business, Science and Arts occupations in Metolius, the most male-oriented occupations are Business & Financial (100.0%), Management (88.6%), and Health Technologists (66.7%), while the most female-oriented occupations are Legal Services & Support (100.0%), Education Instruction & Library (100.0%), and Community & Social Service (90.9%).
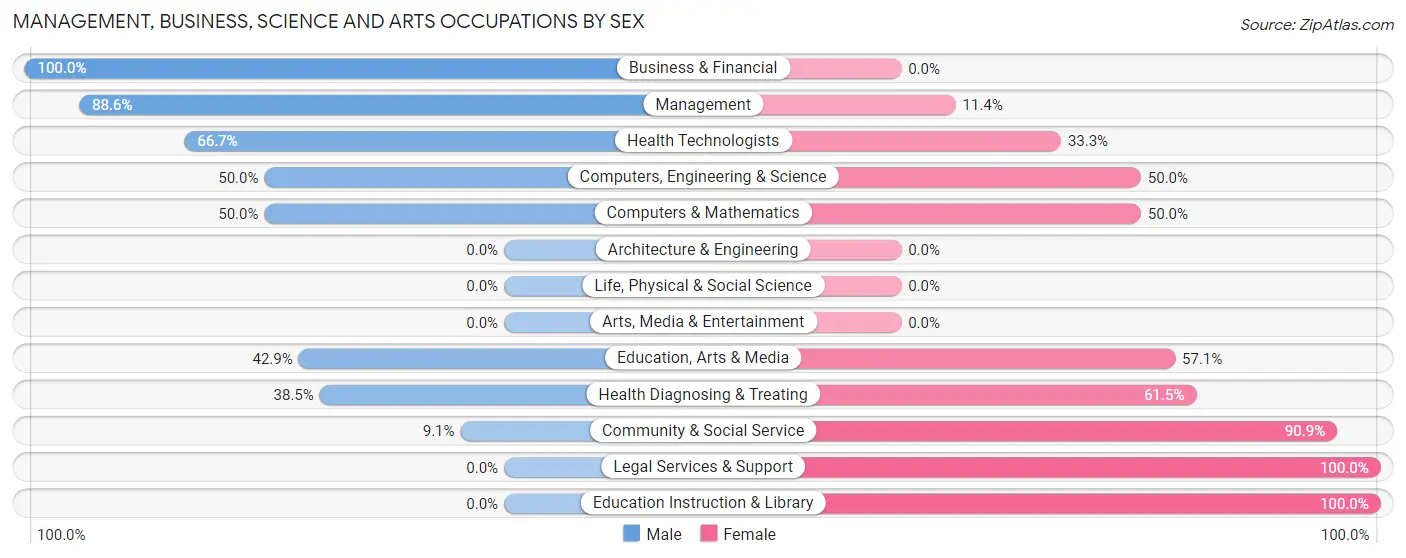
| Occupation | Male | Female |
| Management | 39 (88.6%) | 5 (11.4%) |
| Business & Financial | 2 (100.0%) | 0 (0.0%) |
| Computers, Engineering & Science | 2 (50.0%) | 2 (50.0%) |
| Computers & Mathematics | 2 (50.0%) | 2 (50.0%) |
| Architecture & Engineering | 0 (0.0%) | 0 (0.0%) |
| Life, Physical & Social Science | 0 (0.0%) | 0 (0.0%) |
| Community & Social Service | 3 (9.1%) | 30 (90.9%) |
| Education, Arts & Media | 3 (42.9%) | 4 (57.1%) |
| Legal Services & Support | 0 (0.0%) | 6 (100.0%) |
| Education Instruction & Library | 0 (0.0%) | 20 (100.0%) |
| Arts, Media & Entertainment | 0 (0.0%) | 0 (0.0%) |
| Health Diagnosing & Treating | 5 (38.5%) | 8 (61.5%) |
| Health Technologists | 4 (66.7%) | 2 (33.3%) |
| Total (Category) | 51 (53.1%) | 45 (46.9%) |
| Total (Overall) | 265 (62.9%) | 156 (37.0%) |
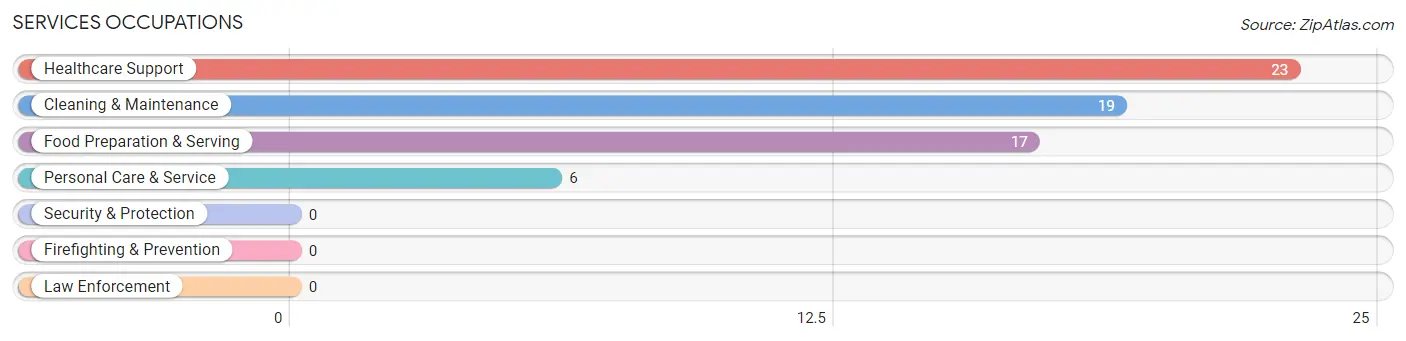
Services Occupations
The most common Services occupations in Metolius are Healthcare Support (23 | 5.5%), Cleaning & Maintenance (19 | 4.5%), Food Preparation & Serving (17 | 4.0%), and Personal Care & Service (6 | 1.4%).
Services Occupations by Sex
Within the Services occupations in Metolius, the most male-oriented occupations are Food Preparation & Serving (41.2%), Cleaning & Maintenance (21.0%), and Healthcare Support (8.7%), while the most female-oriented occupations are Personal Care & Service (100.0%), Healthcare Support (91.3%), and Cleaning & Maintenance (78.9%).
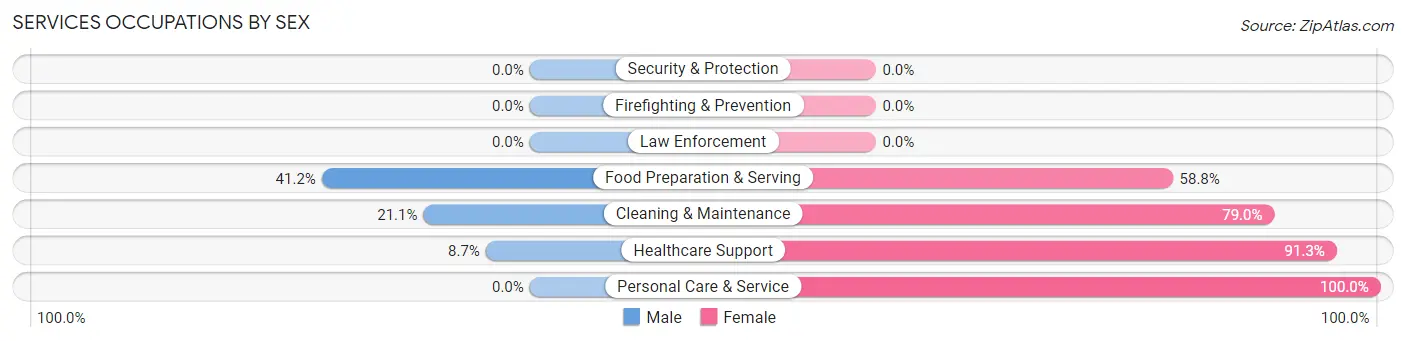
| Occupation | Male | Female |
| Healthcare Support | 2 (8.7%) | 21 (91.3%) |
| Security & Protection | 0 (0.0%) | 0 (0.0%) |
| Firefighting & Prevention | 0 (0.0%) | 0 (0.0%) |
| Law Enforcement | 0 (0.0%) | 0 (0.0%) |
| Food Preparation & Serving | 7 (41.2%) | 10 (58.8%) |
| Cleaning & Maintenance | 4 (21.0%) | 15 (78.9%) |
| Personal Care & Service | 0 (0.0%) | 6 (100.0%) |
| Total (Category) | 13 (20.0%) | 52 (80.0%) |
| Total (Overall) | 265 (62.9%) | 156 (37.0%) |
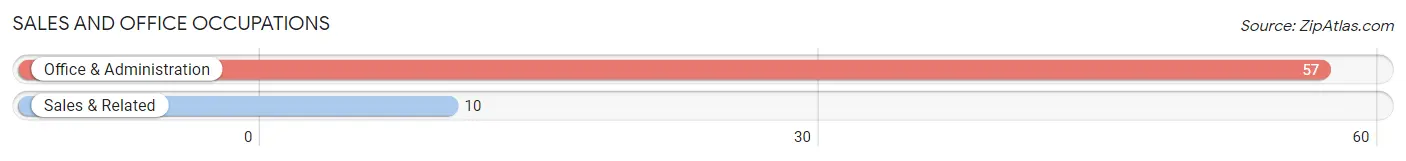
Sales and Office Occupations
The most common Sales and Office occupations in Metolius are Office & Administration (57 | 13.5%), and Sales & Related (10 | 2.4%).
Sales and Office Occupations by Sex
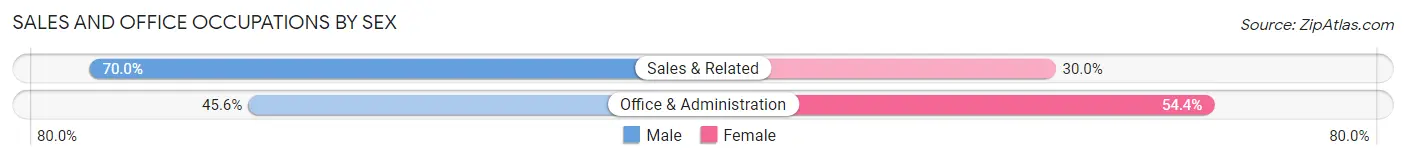
| Occupation | Male | Female |
| Sales & Related | 7 (70.0%) | 3 (30.0%) |
| Office & Administration | 26 (45.6%) | 31 (54.4%) |
| Total (Category) | 33 (49.2%) | 34 (50.7%) |
| Total (Overall) | 265 (62.9%) | 156 (37.0%) |
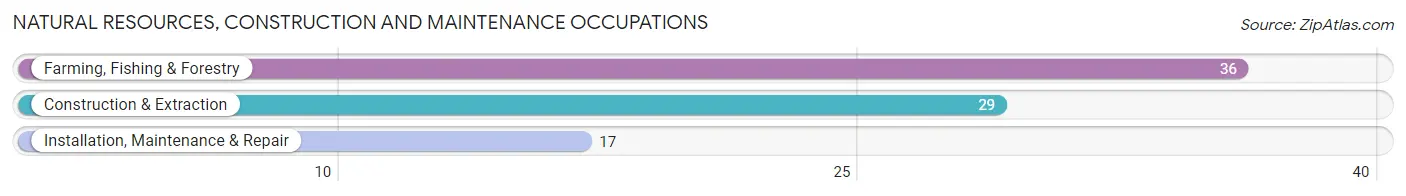
Natural Resources, Construction and Maintenance Occupations
The most common Natural Resources, Construction and Maintenance occupations in Metolius are Farming, Fishing & Forestry (36 | 8.6%), Construction & Extraction (29 | 6.9%), and Installation, Maintenance & Repair (17 | 4.0%).
Natural Resources, Construction and Maintenance Occupations by Sex
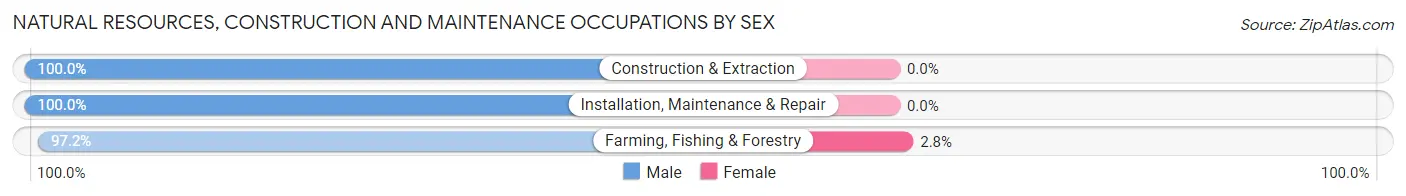
| Occupation | Male | Female |
| Farming, Fishing & Forestry | 35 (97.2%) | 1 (2.8%) |
| Construction & Extraction | 29 (100.0%) | 0 (0.0%) |
| Installation, Maintenance & Repair | 17 (100.0%) | 0 (0.0%) |
| Total (Category) | 81 (98.8%) | 1 (1.2%) |
| Total (Overall) | 265 (62.9%) | 156 (37.0%) |
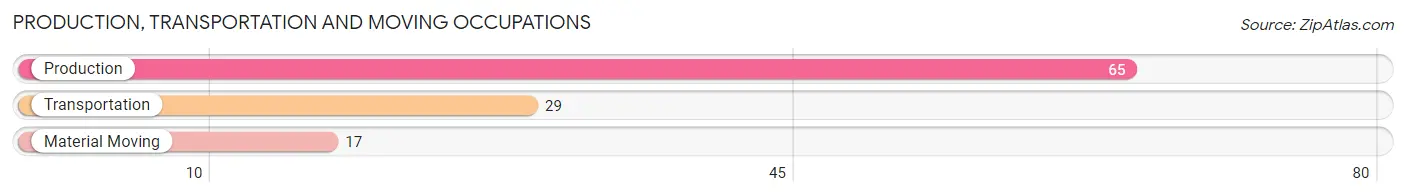
Production, Transportation and Moving Occupations
The most common Production, Transportation and Moving occupations in Metolius are Production (65 | 15.4%), Transportation (29 | 6.9%), and Material Moving (17 | 4.0%).
Production, Transportation and Moving Occupations by Sex
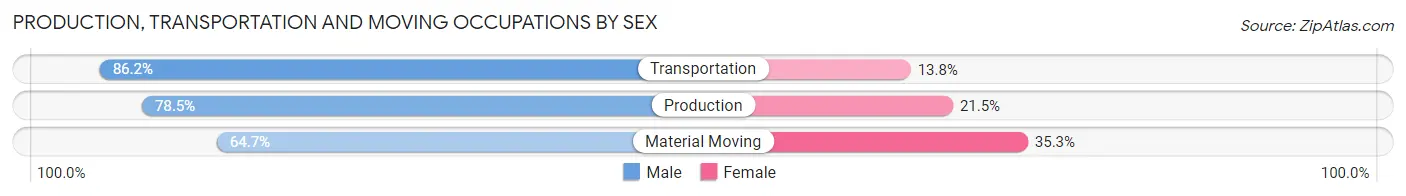
| Occupation | Male | Female |
| Production | 51 (78.5%) | 14 (21.5%) |
| Transportation | 25 (86.2%) | 4 (13.8%) |
| Material Moving | 11 (64.7%) | 6 (35.3%) |
| Total (Category) | 87 (78.4%) | 24 (21.6%) |
| Total (Overall) | 265 (62.9%) | 156 (37.0%) |
Employment Industries by Sex in Metolius
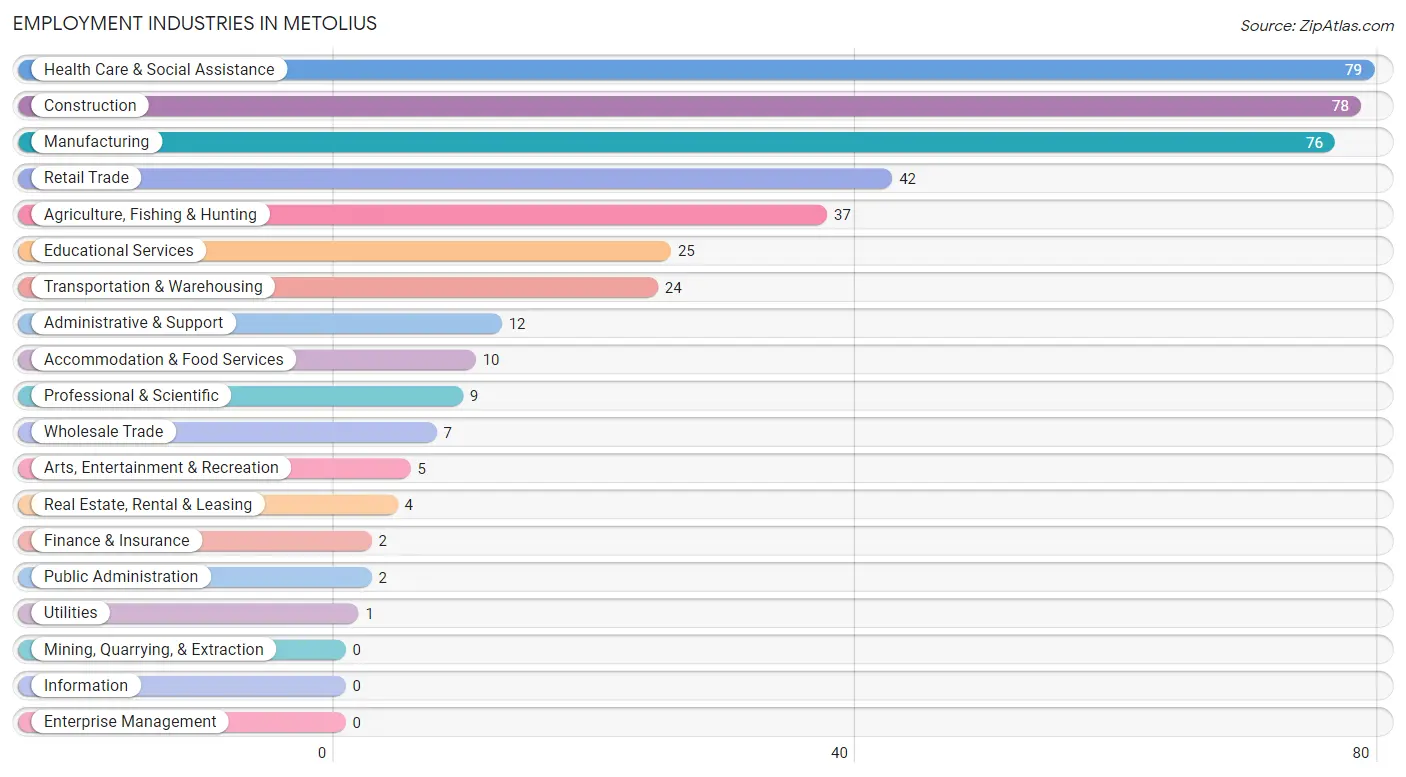
Employment Industries in Metolius
The major employment industries in Metolius include Health Care & Social Assistance (79 | 18.8%), Construction (78 | 18.5%), Manufacturing (76 | 18.0%), Retail Trade (42 | 10.0%), and Agriculture, Fishing & Hunting (37 | 8.8%).
Employment Industries by Sex in Metolius
The Metolius industries that see more men than women are Transportation & Warehousing (100.0%), Utilities (100.0%), and Finance & Insurance (100.0%), whereas the industries that tend to have a higher number of women are Professional & Scientific (100.0%), Educational Services (100.0%), and Arts, Entertainment & Recreation (100.0%).
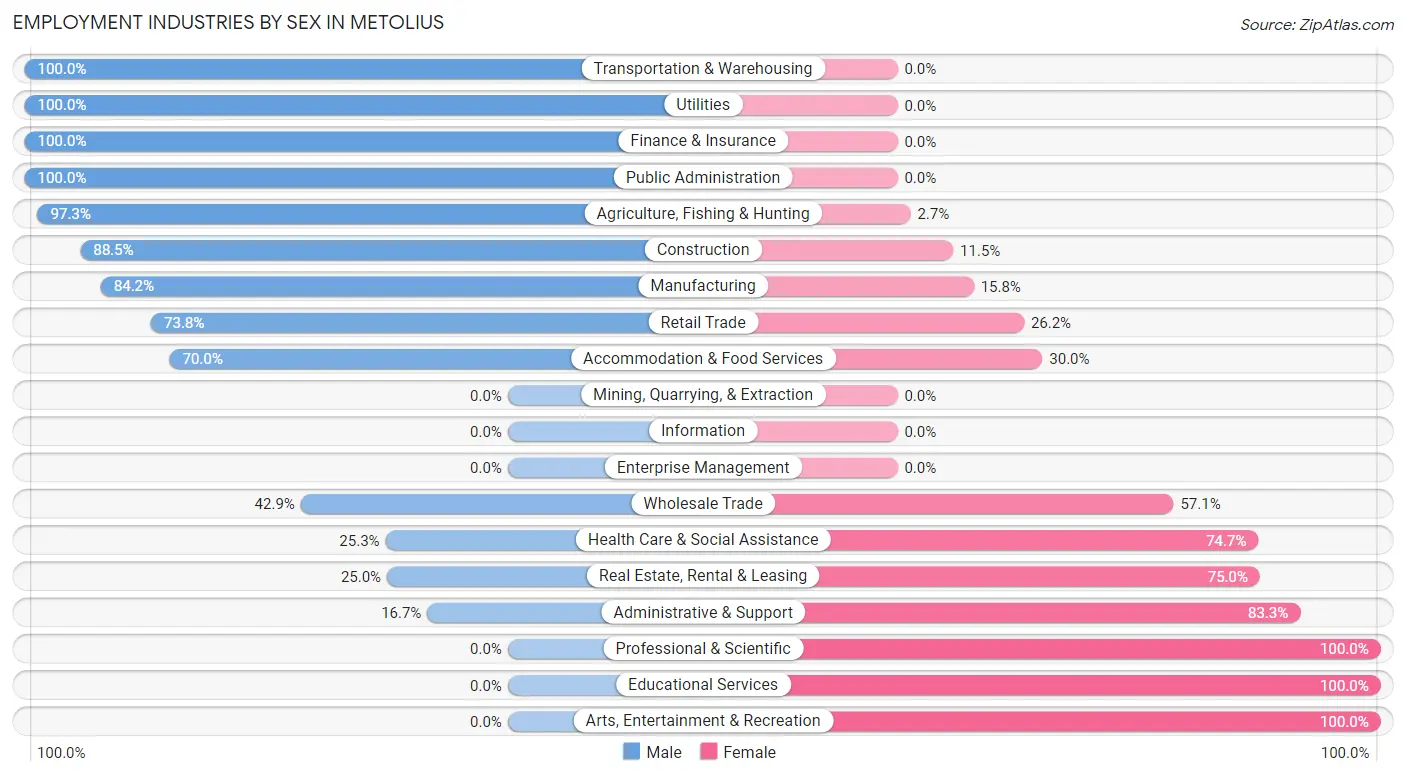
| Industry | Male | Female |
| Agriculture, Fishing & Hunting | 36 (97.3%) | 1 (2.7%) |
| Mining, Quarrying, & Extraction | 0 (0.0%) | 0 (0.0%) |
| Construction | 69 (88.5%) | 9 (11.5%) |
| Manufacturing | 64 (84.2%) | 12 (15.8%) |
| Wholesale Trade | 3 (42.9%) | 4 (57.1%) |
| Retail Trade | 31 (73.8%) | 11 (26.2%) |
| Transportation & Warehousing | 24 (100.0%) | 0 (0.0%) |
| Utilities | 1 (100.0%) | 0 (0.0%) |
| Information | 0 (0.0%) | 0 (0.0%) |
| Finance & Insurance | 2 (100.0%) | 0 (0.0%) |
| Real Estate, Rental & Leasing | 1 (25.0%) | 3 (75.0%) |
| Professional & Scientific | 0 (0.0%) | 9 (100.0%) |
| Enterprise Management | 0 (0.0%) | 0 (0.0%) |
| Administrative & Support | 2 (16.7%) | 10 (83.3%) |
| Educational Services | 0 (0.0%) | 25 (100.0%) |
| Health Care & Social Assistance | 20 (25.3%) | 59 (74.7%) |
| Arts, Entertainment & Recreation | 0 (0.0%) | 5 (100.0%) |
| Accommodation & Food Services | 7 (70.0%) | 3 (30.0%) |
| Public Administration | 2 (100.0%) | 0 (0.0%) |
| Total | 265 (62.9%) | 156 (37.0%) |
Education in Metolius
School Enrollment in Metolius
The most common levels of schooling among the 286 students in Metolius are middle school (103 | 36.0%), high school (78 | 27.3%), and elementary school (59 | 20.6%).
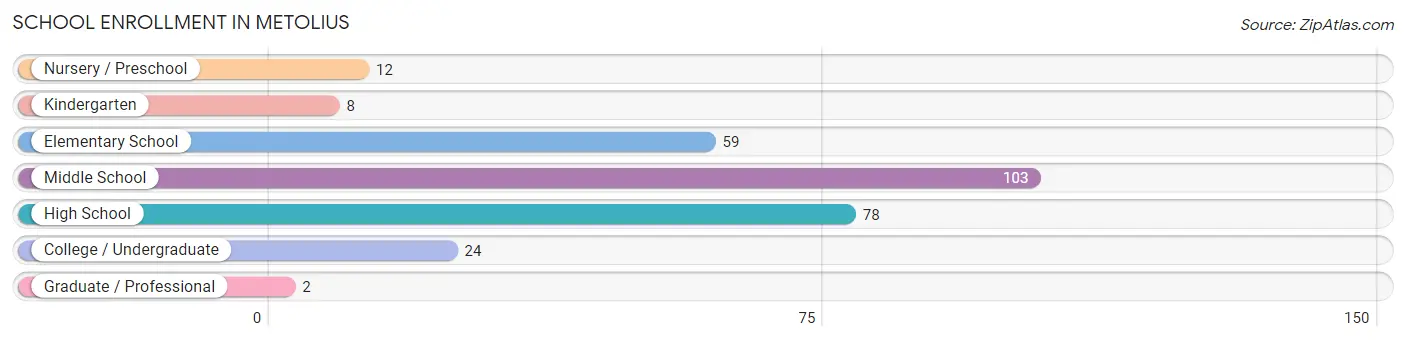
| School Level | # Students | % Students |
| Nursery / Preschool | 12 | 4.2% |
| Kindergarten | 8 | 2.8% |
| Elementary School | 59 | 20.6% |
| Middle School | 103 | 36.0% |
| High School | 78 | 27.3% |
| College / Undergraduate | 24 | 8.4% |
| Graduate / Professional | 2 | 0.7% |
| Total | 286 | 100.0% |
School Enrollment by Age by Funding Source in Metolius
Out of a total of 286 students who are enrolled in schools in Metolius, 7 (2.4%) attend a private institution, while the remaining 279 (97.6%) are enrolled in public schools. The age group of 25 to 34 year olds has the highest likelihood of being enrolled in private schools, with 2 (20.0% in the age bracket) enrolled. Conversely, the age group of 3 to 4 year olds has the lowest likelihood of being enrolled in a private school, with 10 (100.0% in the age bracket) attending a public institution.
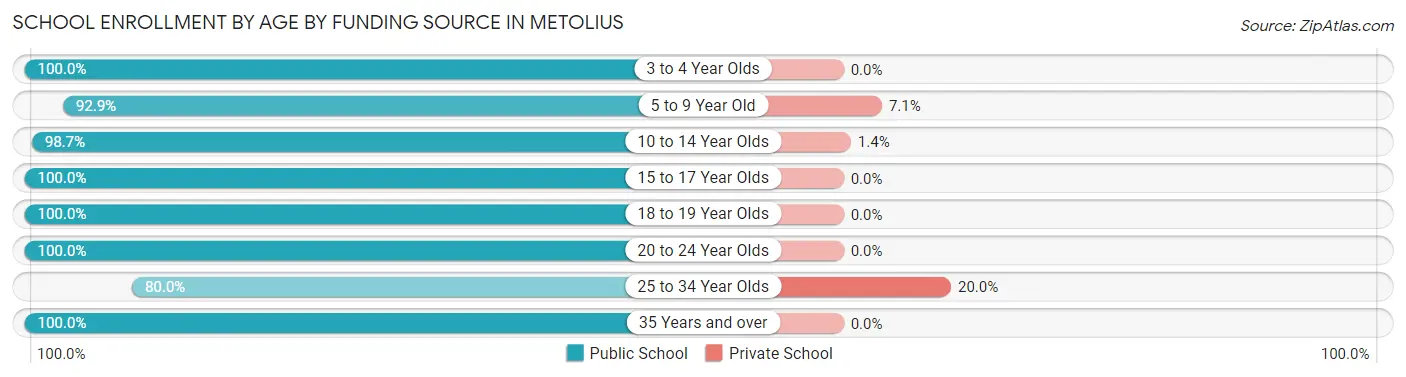
| Age Bracket | Public School | Private School |
| 3 to 4 Year Olds | 10 (100.0%) | 0 (0.0%) |
| 5 to 9 Year Old | 39 (92.9%) | 3 (7.1%) |
| 10 to 14 Year Olds | 146 (98.7%) | 2 (1.3%) |
| 15 to 17 Year Olds | 19 (100.0%) | 0 (0.0%) |
| 18 to 19 Year Olds | 16 (100.0%) | 0 (0.0%) |
| 20 to 24 Year Olds | 12 (100.0%) | 0 (0.0%) |
| 25 to 34 Year Olds | 8 (80.0%) | 2 (20.0%) |
| 35 Years and over | 29 (100.0%) | 0 (0.0%) |
| Total | 279 (97.6%) | 7 (2.4%) |
Educational Attainment by Field of Study in Metolius
Science & technology (11 | 15.1%), business (11 | 15.1%), social sciences (10 | 13.7%), arts & humanities (9 | 12.3%), and psychology (8 | 11.0%) are the most common fields of study among 73 individuals in Metolius who have obtained a bachelor's degree or higher.
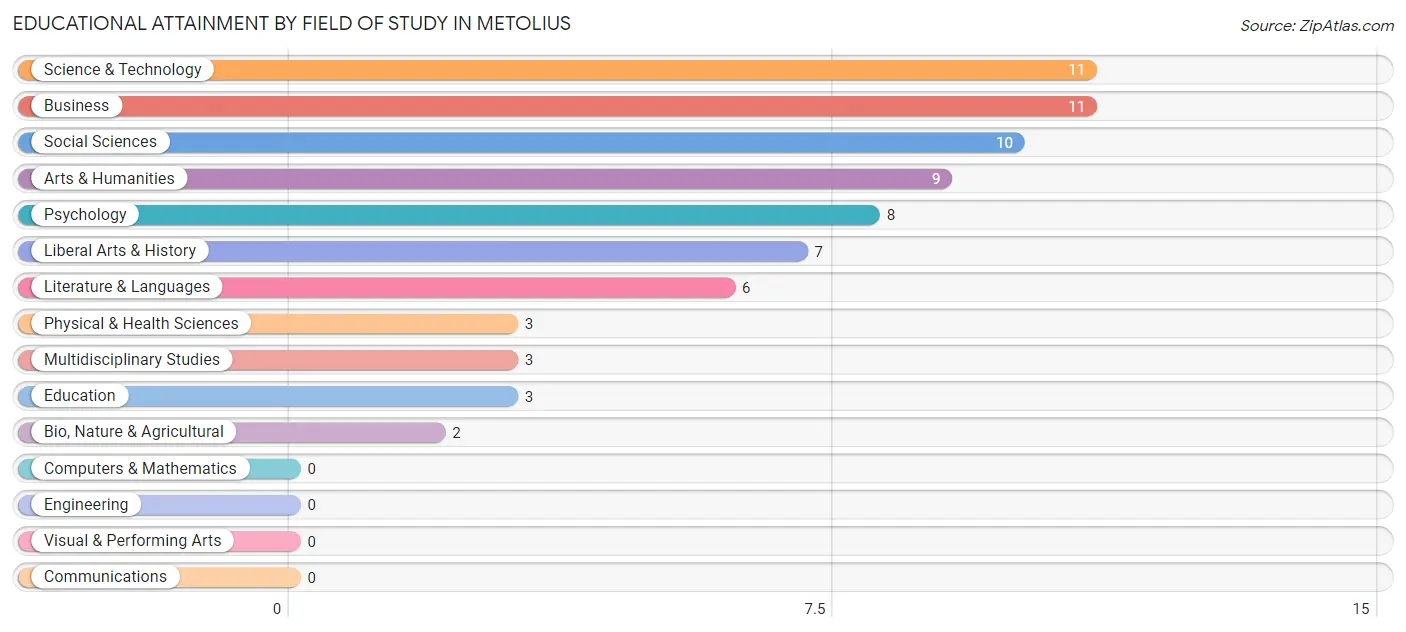
| Field of Study | # Graduates | % Graduates |
| Computers & Mathematics | 0 | 0.0% |
| Bio, Nature & Agricultural | 2 | 2.7% |
| Physical & Health Sciences | 3 | 4.1% |
| Psychology | 8 | 11.0% |
| Social Sciences | 10 | 13.7% |
| Engineering | 0 | 0.0% |
| Multidisciplinary Studies | 3 | 4.1% |
| Science & Technology | 11 | 15.1% |
| Business | 11 | 15.1% |
| Education | 3 | 4.1% |
| Literature & Languages | 6 | 8.2% |
| Liberal Arts & History | 7 | 9.6% |
| Visual & Performing Arts | 0 | 0.0% |
| Communications | 0 | 0.0% |
| Arts & Humanities | 9 | 12.3% |
| Total | 73 | 100.0% |
Transportation & Commute in Metolius
Vehicle Availability by Sex in Metolius
The most prevalent vehicle ownership categories in Metolius are males with 2 vehicles (156, accounting for 58.9%) and females with 2 vehicles (74, making up 109.1%).
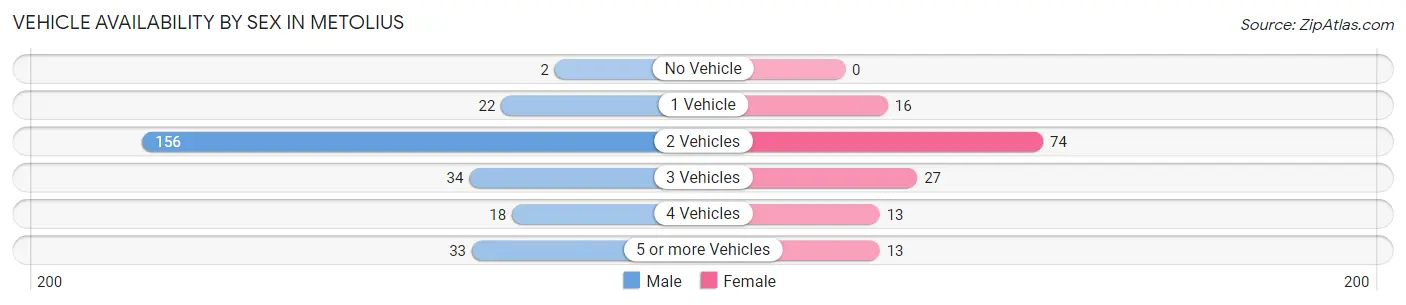
| Vehicles Available | Male | Female |
| No Vehicle | 2 (0.7%) | 0 (0.0%) |
| 1 Vehicle | 22 (8.3%) | 16 (11.2%) |
| 2 Vehicles | 156 (58.9%) | 74 (51.7%) |
| 3 Vehicles | 34 (12.8%) | 27 (18.9%) |
| 4 Vehicles | 18 (6.8%) | 13 (9.1%) |
| 5 or more Vehicles | 33 (12.4%) | 13 (9.1%) |
| Total | 265 (100.0%) | 143 (100.0%) |
Commute Time in Metolius
The most frequently occuring commute durations in Metolius are 10 to 14 minutes (96 commuters, 25.6%), 15 to 19 minutes (54 commuters, 14.4%), and 45 to 59 minutes (47 commuters, 12.5%).
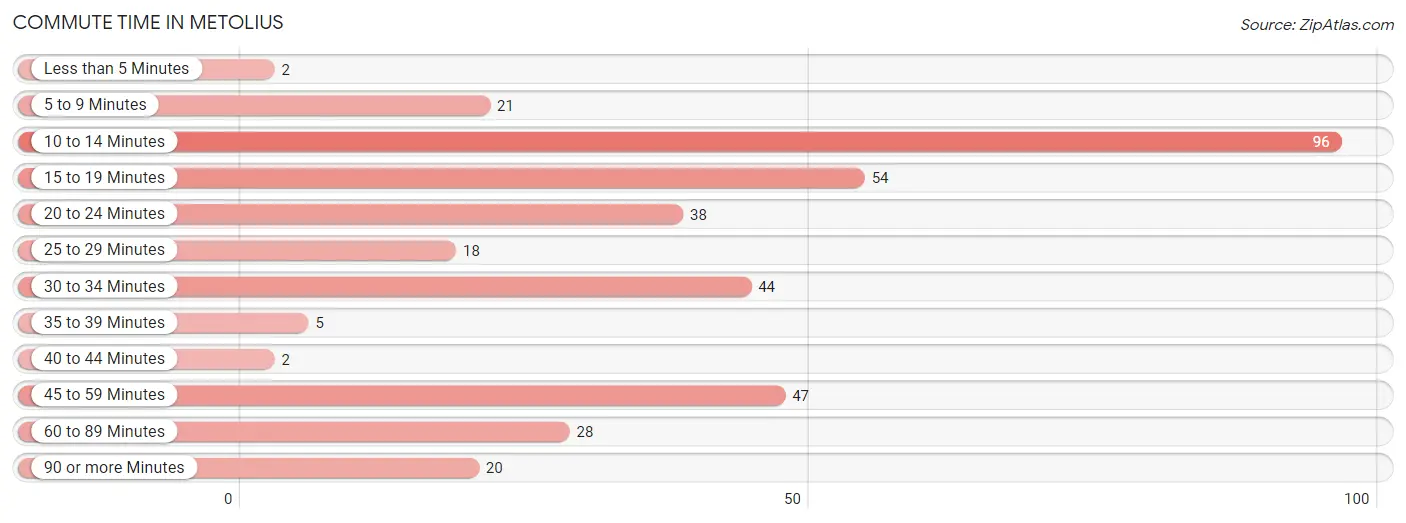
| Commute Time | # Commuters | % Commuters |
| Less than 5 Minutes | 2 | 0.5% |
| 5 to 9 Minutes | 21 | 5.6% |
| 10 to 14 Minutes | 96 | 25.6% |
| 15 to 19 Minutes | 54 | 14.4% |
| 20 to 24 Minutes | 38 | 10.1% |
| 25 to 29 Minutes | 18 | 4.8% |
| 30 to 34 Minutes | 44 | 11.7% |
| 35 to 39 Minutes | 5 | 1.3% |
| 40 to 44 Minutes | 2 | 0.5% |
| 45 to 59 Minutes | 47 | 12.5% |
| 60 to 89 Minutes | 28 | 7.5% |
| 90 or more Minutes | 20 | 5.3% |
Commute Time by Sex in Metolius
The most common commute times in Metolius are 10 to 14 minutes (76 commuters, 29.9%) for males and 30 to 34 minutes (24 commuters, 19.8%) for females.
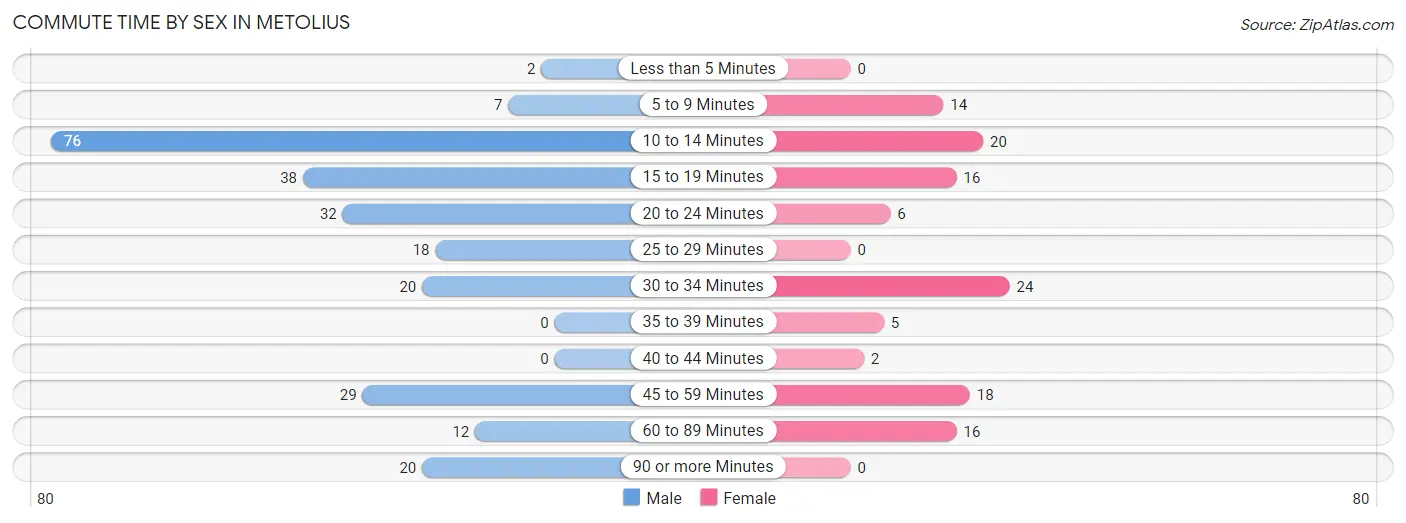
| Commute Time | Male | Female |
| Less than 5 Minutes | 2 (0.8%) | 0 (0.0%) |
| 5 to 9 Minutes | 7 (2.8%) | 14 (11.6%) |
| 10 to 14 Minutes | 76 (29.9%) | 20 (16.5%) |
| 15 to 19 Minutes | 38 (15.0%) | 16 (13.2%) |
| 20 to 24 Minutes | 32 (12.6%) | 6 (5.0%) |
| 25 to 29 Minutes | 18 (7.1%) | 0 (0.0%) |
| 30 to 34 Minutes | 20 (7.9%) | 24 (19.8%) |
| 35 to 39 Minutes | 0 (0.0%) | 5 (4.1%) |
| 40 to 44 Minutes | 0 (0.0%) | 2 (1.7%) |
| 45 to 59 Minutes | 29 (11.4%) | 18 (14.9%) |
| 60 to 89 Minutes | 12 (4.7%) | 16 (13.2%) |
| 90 or more Minutes | 20 (7.9%) | 0 (0.0%) |
Time of Departure to Work by Sex in Metolius
The most frequent times of departure to work in Metolius are 7:00 AM to 7:29 AM (70, 27.6%) for males and 12:00 AM to 4:59 AM (17, 14.1%) for females.
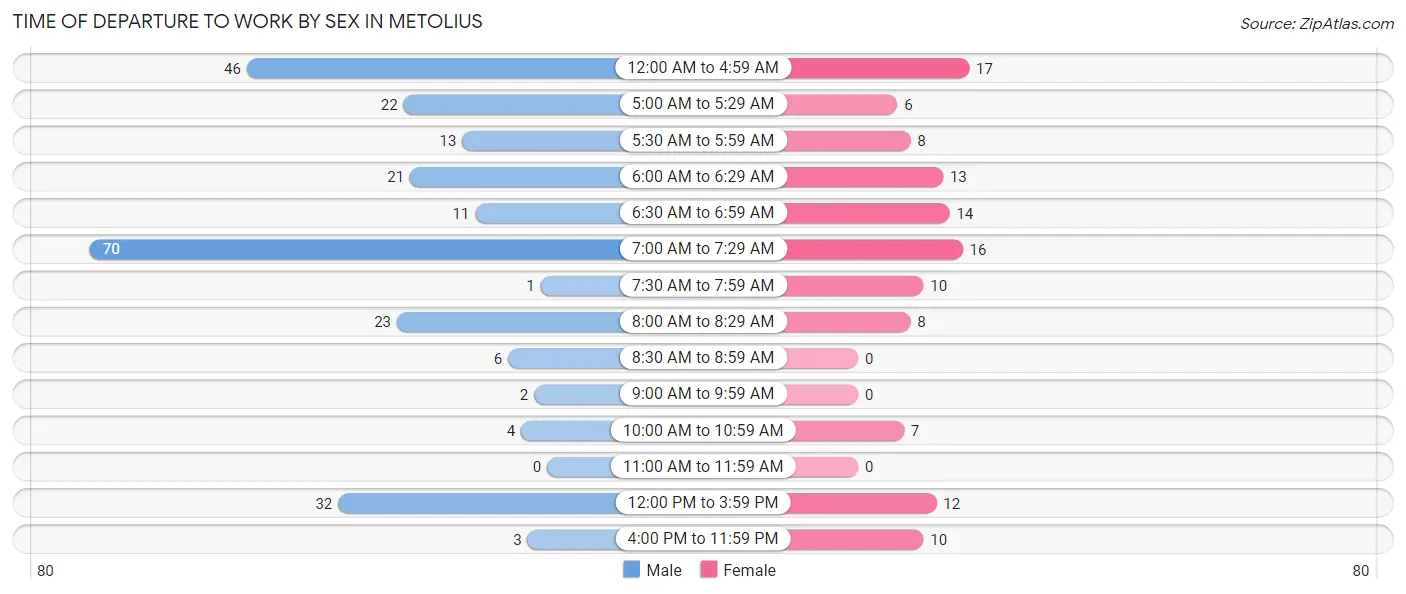
| Time of Departure | Male | Female |
| 12:00 AM to 4:59 AM | 46 (18.1%) | 17 (14.1%) |
| 5:00 AM to 5:29 AM | 22 (8.7%) | 6 (5.0%) |
| 5:30 AM to 5:59 AM | 13 (5.1%) | 8 (6.6%) |
| 6:00 AM to 6:29 AM | 21 (8.3%) | 13 (10.7%) |
| 6:30 AM to 6:59 AM | 11 (4.3%) | 14 (11.6%) |
| 7:00 AM to 7:29 AM | 70 (27.6%) | 16 (13.2%) |
| 7:30 AM to 7:59 AM | 1 (0.4%) | 10 (8.3%) |
| 8:00 AM to 8:29 AM | 23 (9.1%) | 8 (6.6%) |
| 8:30 AM to 8:59 AM | 6 (2.4%) | 0 (0.0%) |
| 9:00 AM to 9:59 AM | 2 (0.8%) | 0 (0.0%) |
| 10:00 AM to 10:59 AM | 4 (1.6%) | 7 (5.8%) |
| 11:00 AM to 11:59 AM | 0 (0.0%) | 0 (0.0%) |
| 12:00 PM to 3:59 PM | 32 (12.6%) | 12 (9.9%) |
| 4:00 PM to 11:59 PM | 3 (1.2%) | 10 (8.3%) |
| Total | 254 (100.0%) | 121 (100.0%) |
Housing Occupancy in Metolius
Occupancy by Ownership in Metolius
Of the total 334 dwellings in Metolius, owner-occupied units account for 251 (75.1%), while renter-occupied units make up 83 (24.8%).
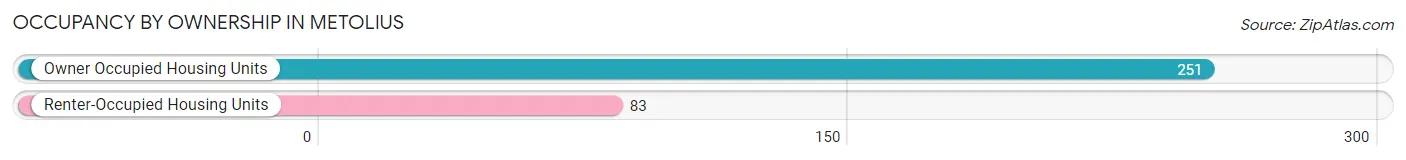
| Occupancy | # Housing Units | % Housing Units |
| Owner Occupied Housing Units | 251 | 75.1% |
| Renter-Occupied Housing Units | 83 | 24.8% |
| Total Occupied Housing Units | 334 | 100.0% |
Occupancy by Household Size in Metolius
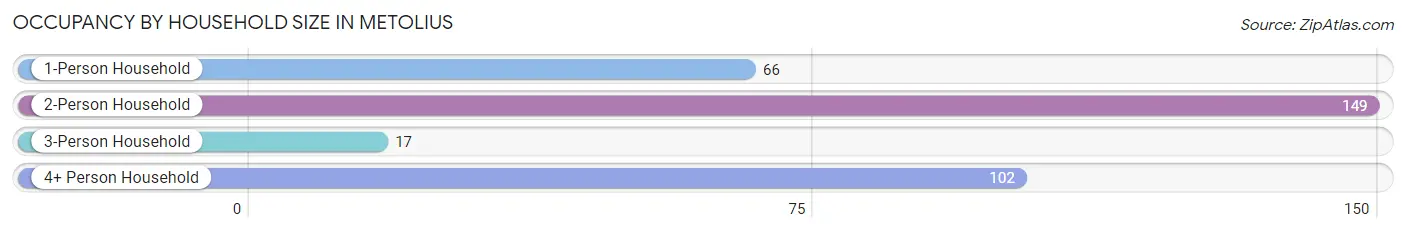
| Household Size | # Housing Units | % Housing Units |
| 1-Person Household | 66 | 19.8% |
| 2-Person Household | 149 | 44.6% |
| 3-Person Household | 17 | 5.1% |
| 4+ Person Household | 102 | 30.5% |
| Total Housing Units | 334 | 100.0% |
Occupancy by Ownership by Household Size in Metolius
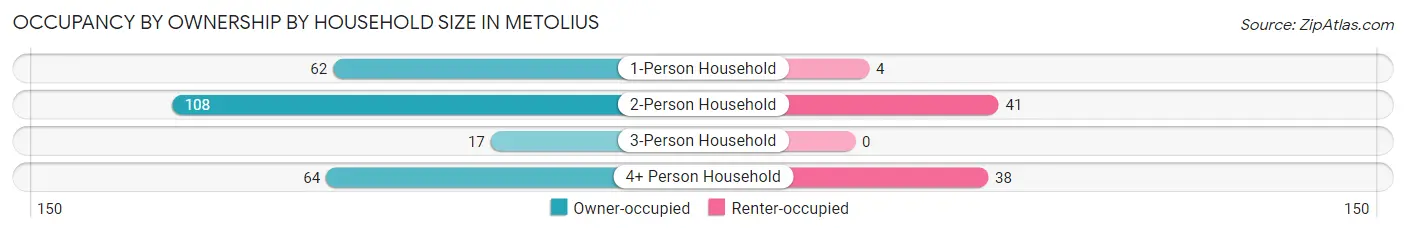
| Household Size | Owner-occupied | Renter-occupied |
| 1-Person Household | 62 (93.9%) | 4 (6.1%) |
| 2-Person Household | 108 (72.5%) | 41 (27.5%) |
| 3-Person Household | 17 (100.0%) | 0 (0.0%) |
| 4+ Person Household | 64 (62.7%) | 38 (37.2%) |
| Total Housing Units | 251 (75.1%) | 83 (24.8%) |
Occupancy by Educational Attainment in Metolius
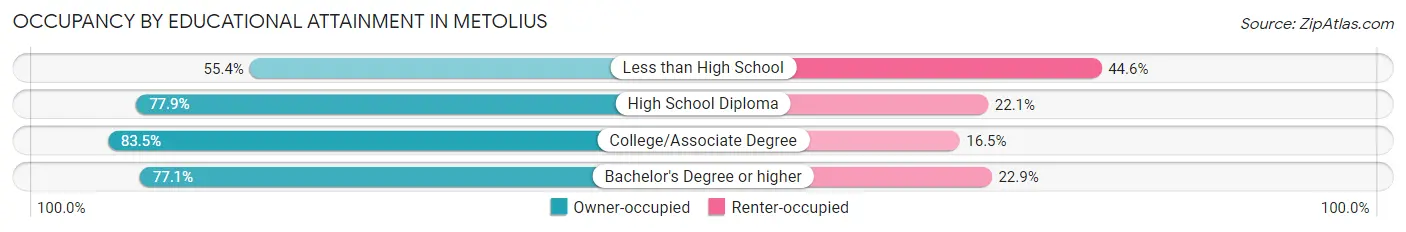
| Household Size | Owner-occupied | Renter-occupied |
| Less than High School | 36 (55.4%) | 29 (44.6%) |
| High School Diploma | 102 (77.9%) | 29 (22.1%) |
| College/Associate Degree | 86 (83.5%) | 17 (16.5%) |
| Bachelor's Degree or higher | 27 (77.1%) | 8 (22.9%) |
Occupancy by Age of Householder in Metolius
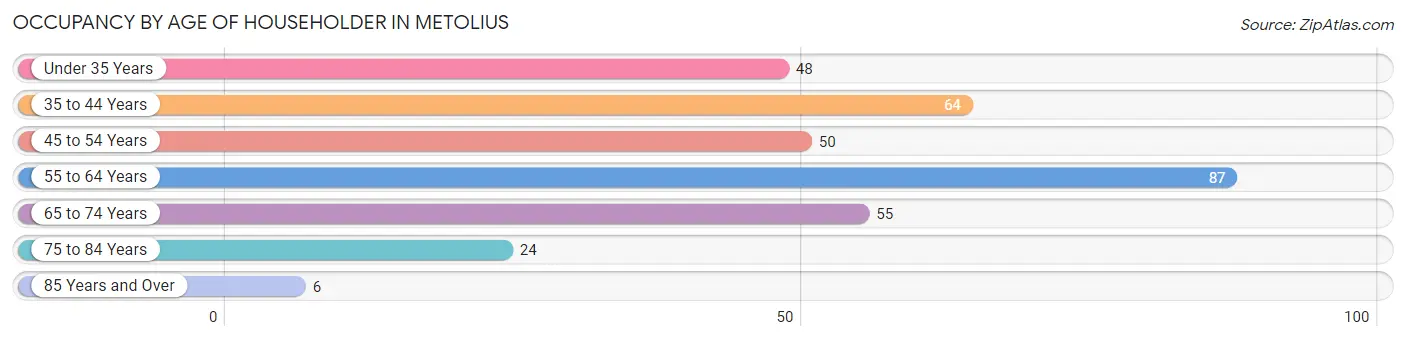
| Age Bracket | # Households | % Households |
| Under 35 Years | 48 | 14.4% |
| 35 to 44 Years | 64 | 19.2% |
| 45 to 54 Years | 50 | 15.0% |
| 55 to 64 Years | 87 | 26.1% |
| 65 to 74 Years | 55 | 16.5% |
| 75 to 84 Years | 24 | 7.2% |
| 85 Years and Over | 6 | 1.8% |
| Total | 334 | 100.0% |
Housing Finances in Metolius
Median Income by Occupancy in Metolius
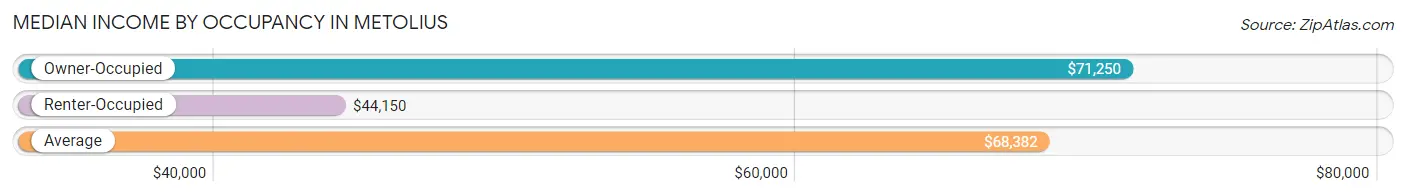
| Occupancy Type | # Households | Median Income |
| Owner-Occupied | 251 (75.1%) | $71,250 |
| Renter-Occupied | 83 (24.8%) | $44,150 |
| Average | 334 (100.0%) | $68,382 |
Occupancy by Householder Income Bracket in Metolius
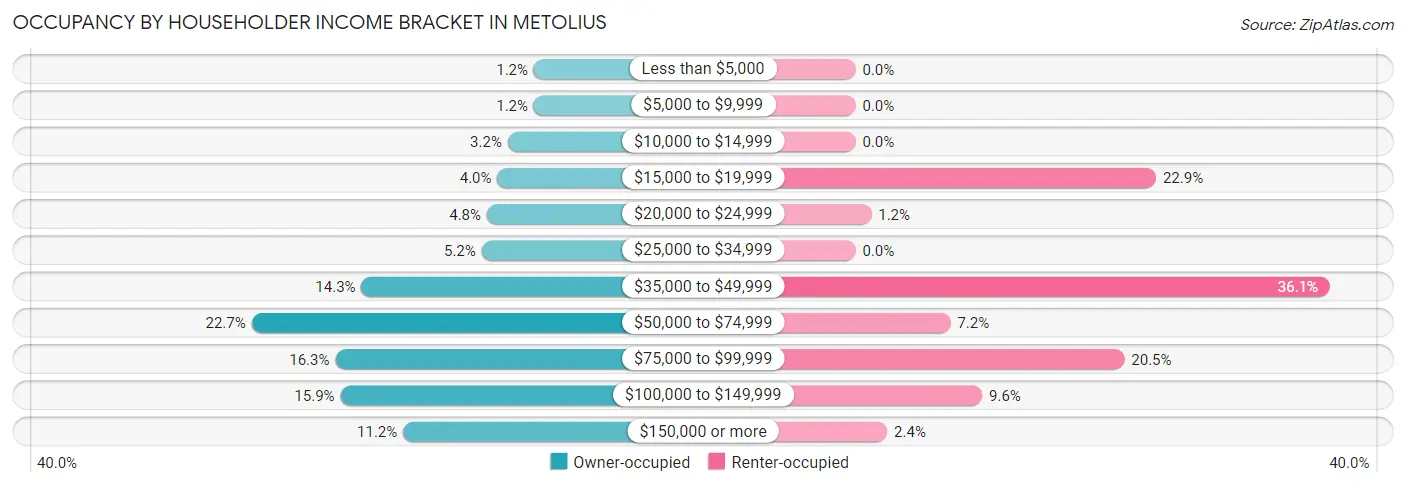
| Income Bracket | Owner-occupied | Renter-occupied |
| Less than $5,000 | 3 (1.2%) | 0 (0.0%) |
| $5,000 to $9,999 | 3 (1.2%) | 0 (0.0%) |
| $10,000 to $14,999 | 8 (3.2%) | 0 (0.0%) |
| $15,000 to $19,999 | 10 (4.0%) | 19 (22.9%) |
| $20,000 to $24,999 | 12 (4.8%) | 1 (1.2%) |
| $25,000 to $34,999 | 13 (5.2%) | 0 (0.0%) |
| $35,000 to $49,999 | 36 (14.3%) | 30 (36.1%) |
| $50,000 to $74,999 | 57 (22.7%) | 6 (7.2%) |
| $75,000 to $99,999 | 41 (16.3%) | 17 (20.5%) |
| $100,000 to $149,999 | 40 (15.9%) | 8 (9.6%) |
| $150,000 or more | 28 (11.2%) | 2 (2.4%) |
| Total | 251 (100.0%) | 83 (100.0%) |
Monthly Housing Cost Tiers in Metolius
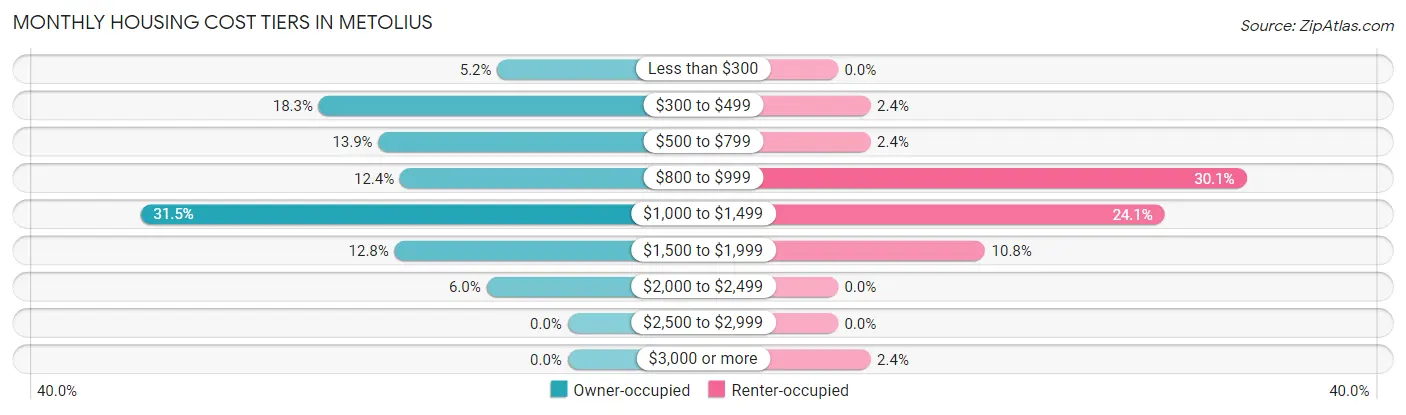
| Monthly Cost | Owner-occupied | Renter-occupied |
| Less than $300 | 13 (5.2%) | 0 (0.0%) |
| $300 to $499 | 46 (18.3%) | 2 (2.4%) |
| $500 to $799 | 35 (13.9%) | 2 (2.4%) |
| $800 to $999 | 31 (12.3%) | 25 (30.1%) |
| $1,000 to $1,499 | 79 (31.5%) | 20 (24.1%) |
| $1,500 to $1,999 | 32 (12.8%) | 9 (10.8%) |
| $2,000 to $2,499 | 15 (6.0%) | 0 (0.0%) |
| $2,500 to $2,999 | 0 (0.0%) | 0 (0.0%) |
| $3,000 or more | 0 (0.0%) | 2 (2.4%) |
| Total | 251 (100.0%) | 83 (100.0%) |
Physical Housing Characteristics in Metolius
Housing Structures in Metolius
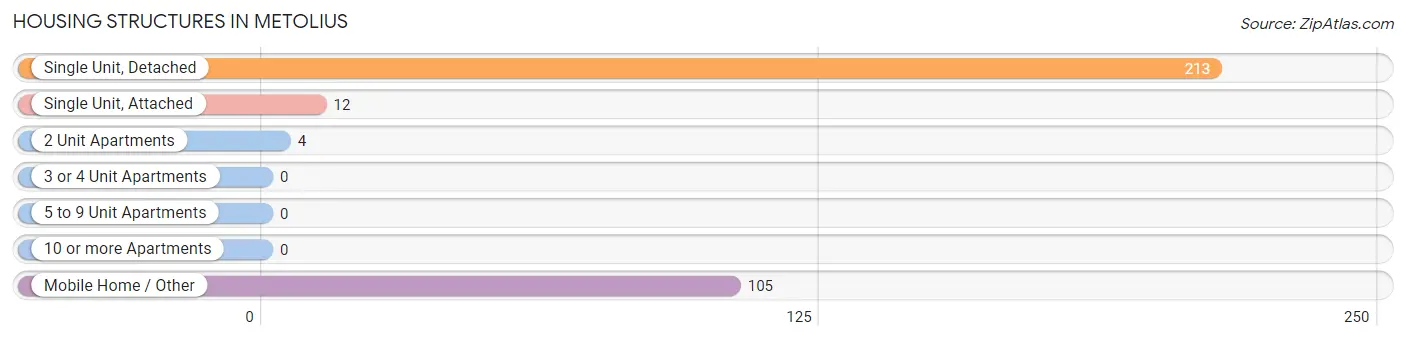
| Structure Type | # Housing Units | % Housing Units |
| Single Unit, Detached | 213 | 63.8% |
| Single Unit, Attached | 12 | 3.6% |
| 2 Unit Apartments | 4 | 1.2% |
| 3 or 4 Unit Apartments | 0 | 0.0% |
| 5 to 9 Unit Apartments | 0 | 0.0% |
| 10 or more Apartments | 0 | 0.0% |
| Mobile Home / Other | 105 | 31.4% |
| Total | 334 | 100.0% |
Housing Structures by Occupancy in Metolius
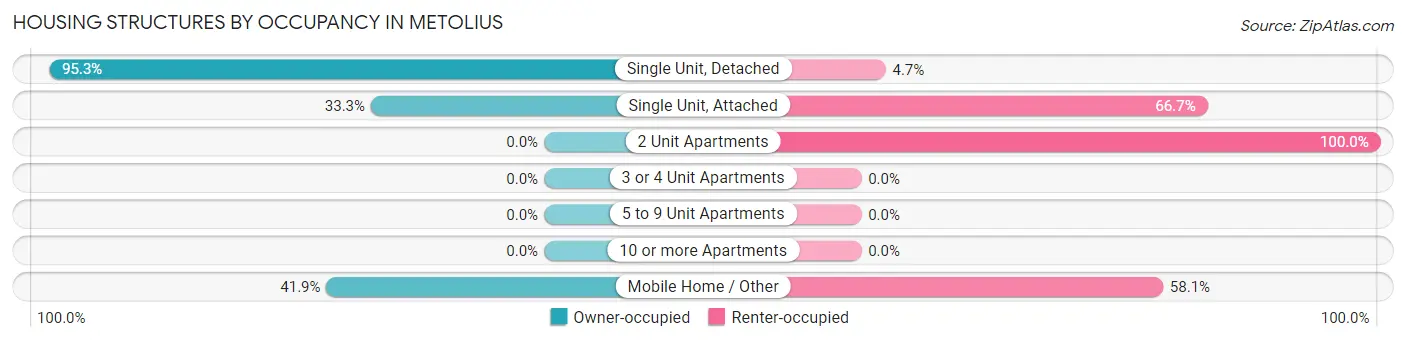
| Structure Type | Owner-occupied | Renter-occupied |
| Single Unit, Detached | 203 (95.3%) | 10 (4.7%) |
| Single Unit, Attached | 4 (33.3%) | 8 (66.7%) |
| 2 Unit Apartments | 0 (0.0%) | 4 (100.0%) |
| 3 or 4 Unit Apartments | 0 (0.0%) | 0 (0.0%) |
| 5 to 9 Unit Apartments | 0 (0.0%) | 0 (0.0%) |
| 10 or more Apartments | 0 (0.0%) | 0 (0.0%) |
| Mobile Home / Other | 44 (41.9%) | 61 (58.1%) |
| Total | 251 (75.1%) | 83 (24.8%) |
Housing Structures by Number of Rooms in Metolius
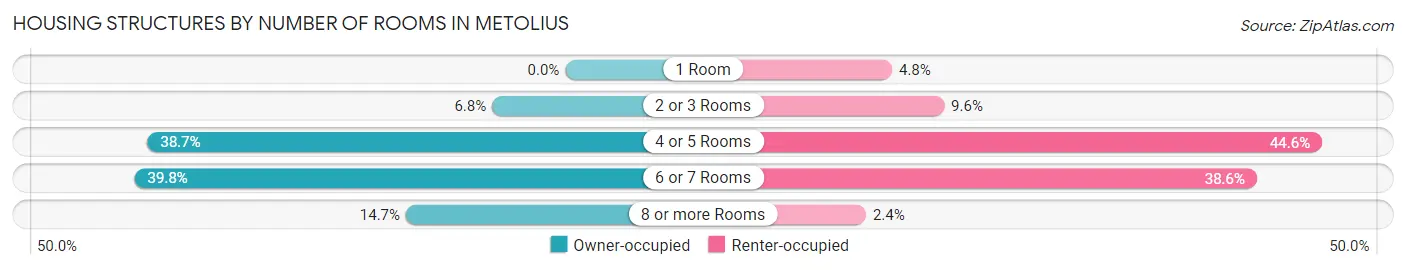
| Number of Rooms | Owner-occupied | Renter-occupied |
| 1 Room | 0 (0.0%) | 4 (4.8%) |
| 2 or 3 Rooms | 17 (6.8%) | 8 (9.6%) |
| 4 or 5 Rooms | 97 (38.7%) | 37 (44.6%) |
| 6 or 7 Rooms | 100 (39.8%) | 32 (38.6%) |
| 8 or more Rooms | 37 (14.7%) | 2 (2.4%) |
| Total | 251 (100.0%) | 83 (100.0%) |
Housing Structure by Heating Type in Metolius
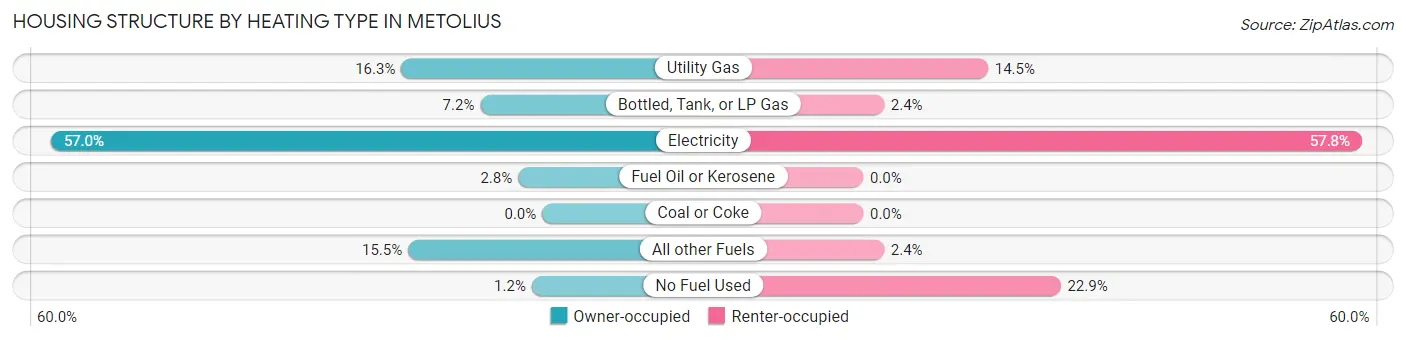
| Heating Type | Owner-occupied | Renter-occupied |
| Utility Gas | 41 (16.3%) | 12 (14.5%) |
| Bottled, Tank, or LP Gas | 18 (7.2%) | 2 (2.4%) |
| Electricity | 143 (57.0%) | 48 (57.8%) |
| Fuel Oil or Kerosene | 7 (2.8%) | 0 (0.0%) |
| Coal or Coke | 0 (0.0%) | 0 (0.0%) |
| All other Fuels | 39 (15.5%) | 2 (2.4%) |
| No Fuel Used | 3 (1.2%) | 19 (22.9%) |
| Total | 251 (100.0%) | 83 (100.0%) |
Household Vehicle Usage in Metolius
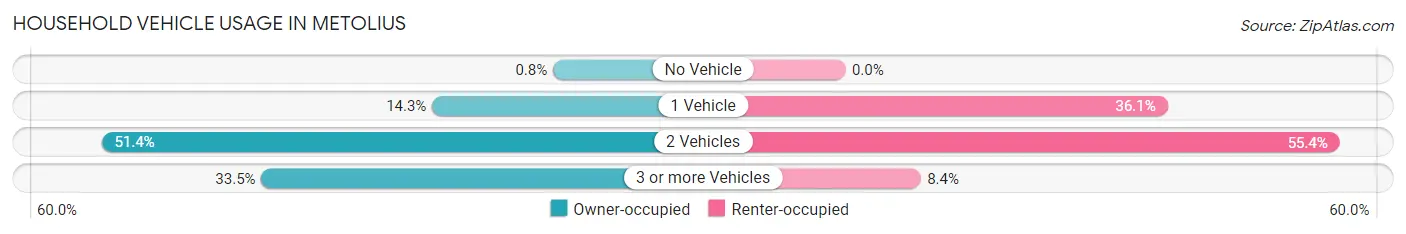
| Vehicles per Household | Owner-occupied | Renter-occupied |
| No Vehicle | 2 (0.8%) | 0 (0.0%) |
| 1 Vehicle | 36 (14.3%) | 30 (36.1%) |
| 2 Vehicles | 129 (51.4%) | 46 (55.4%) |
| 3 or more Vehicles | 84 (33.5%) | 7 (8.4%) |
| Total | 251 (100.0%) | 83 (100.0%) |
Real Estate & Mortgages in Metolius
Real Estate and Mortgage Overview in Metolius
| Characteristic | Without Mortgage | With Mortgage |
| Housing Units | 79 | 172 |
| Median Property Value | $193,100 | $211,700 |
| Median Household Income | $58,125 | $23 |
| Monthly Housing Costs | $443 | $0 |
| Real Estate Taxes | $1,707 | $13 |
Property Value by Mortgage Status in Metolius
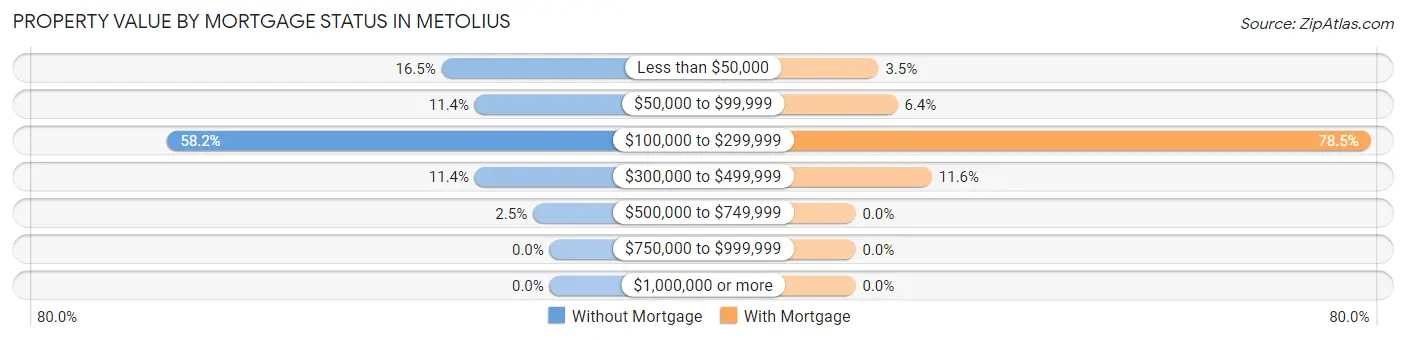
| Property Value | Without Mortgage | With Mortgage |
| Less than $50,000 | 13 (16.5%) | 6 (3.5%) |
| $50,000 to $99,999 | 9 (11.4%) | 11 (6.4%) |
| $100,000 to $299,999 | 46 (58.2%) | 135 (78.5%) |
| $300,000 to $499,999 | 9 (11.4%) | 20 (11.6%) |
| $500,000 to $749,999 | 2 (2.5%) | 0 (0.0%) |
| $750,000 to $999,999 | 0 (0.0%) | 0 (0.0%) |
| $1,000,000 or more | 0 (0.0%) | 0 (0.0%) |
| Total | 79 (100.0%) | 172 (100.0%) |
Household Income by Mortgage Status in Metolius
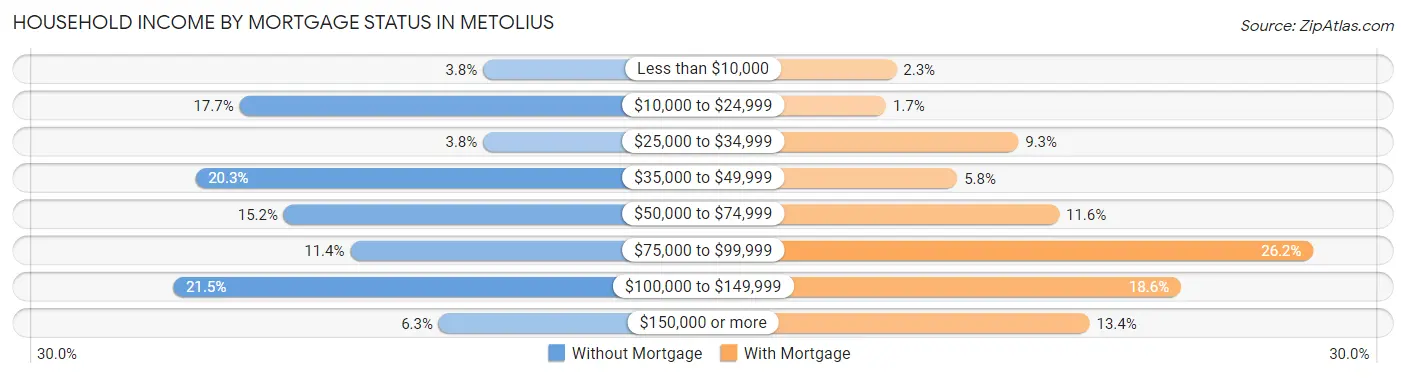
| Household Income | Without Mortgage | With Mortgage |
| Less than $10,000 | 3 (3.8%) | 4 (2.3%) |
| $10,000 to $24,999 | 14 (17.7%) | 3 (1.7%) |
| $25,000 to $34,999 | 3 (3.8%) | 16 (9.3%) |
| $35,000 to $49,999 | 16 (20.3%) | 10 (5.8%) |
| $50,000 to $74,999 | 12 (15.2%) | 20 (11.6%) |
| $75,000 to $99,999 | 9 (11.4%) | 45 (26.2%) |
| $100,000 to $149,999 | 17 (21.5%) | 32 (18.6%) |
| $150,000 or more | 5 (6.3%) | 23 (13.4%) |
| Total | 79 (100.0%) | 172 (100.0%) |
Property Value to Household Income Ratio in Metolius
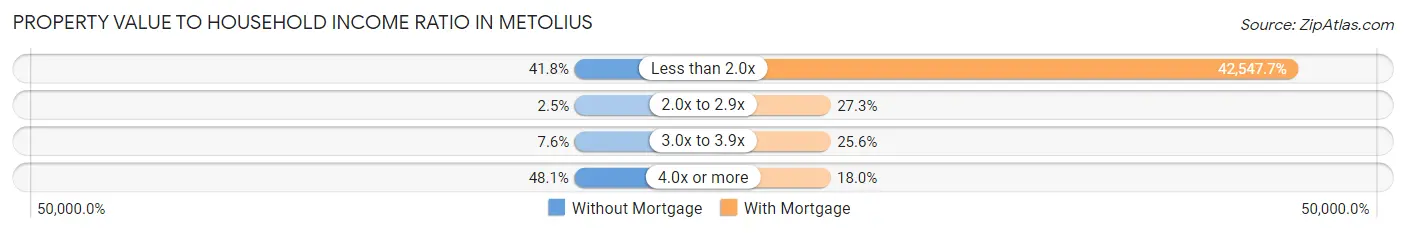
| Value-to-Income Ratio | Without Mortgage | With Mortgage |
| Less than 2.0x | 33 (41.8%) | 73,182 (42,547.7%) |
| 2.0x to 2.9x | 2 (2.5%) | 47 (27.3%) |
| 3.0x to 3.9x | 6 (7.6%) | 44 (25.6%) |
| 4.0x or more | 38 (48.1%) | 31 (18.0%) |
| Total | 79 (100.0%) | 172 (100.0%) |
Real Estate Taxes by Mortgage Status in Metolius
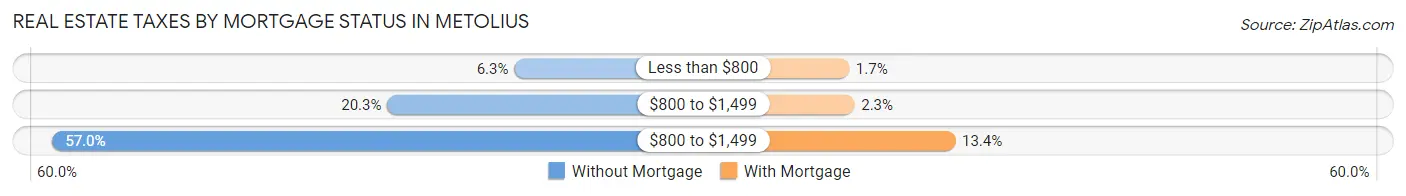
| Property Taxes | Without Mortgage | With Mortgage |
| Less than $800 | 5 (6.3%) | 3 (1.7%) |
| $800 to $1,499 | 16 (20.3%) | 4 (2.3%) |
| $800 to $1,499 | 45 (57.0%) | 23 (13.4%) |
| Total | 79 (100.0%) | 172 (100.0%) |
Health & Disability in Metolius
Health Insurance Coverage by Age in Metolius
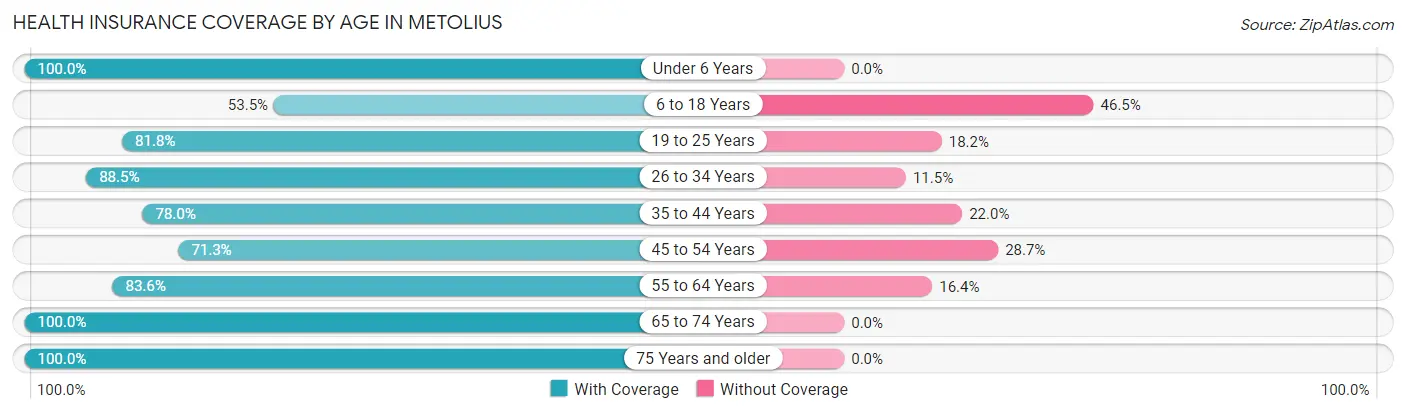
| Age Bracket | With Coverage | Without Coverage |
| Under 6 Years | 40 (100.0%) | 0 (0.0%) |
| 6 to 18 Years | 122 (53.5%) | 106 (46.5%) |
| 19 to 25 Years | 36 (81.8%) | 8 (18.2%) |
| 26 to 34 Years | 100 (88.5%) | 13 (11.5%) |
| 35 to 44 Years | 110 (78.0%) | 31 (22.0%) |
| 45 to 54 Years | 77 (71.3%) | 31 (28.7%) |
| 55 to 64 Years | 107 (83.6%) | 21 (16.4%) |
| 65 to 74 Years | 88 (100.0%) | 0 (0.0%) |
| 75 Years and older | 31 (100.0%) | 0 (0.0%) |
| Total | 711 (77.2%) | 210 (22.8%) |
Health Insurance Coverage by Citizenship Status in Metolius
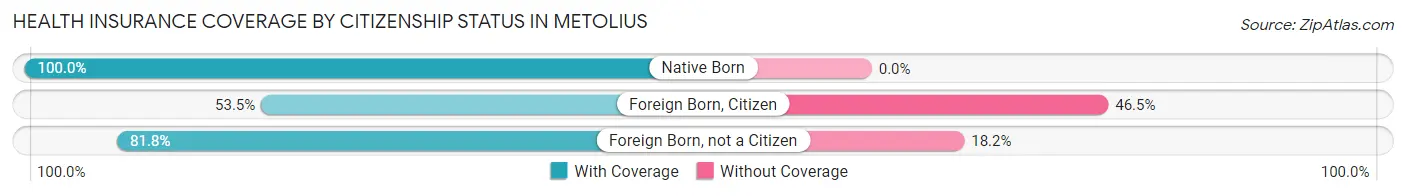
| Citizenship Status | With Coverage | Without Coverage |
| Native Born | 40 (100.0%) | 0 (0.0%) |
| Foreign Born, Citizen | 122 (53.5%) | 106 (46.5%) |
| Foreign Born, not a Citizen | 36 (81.8%) | 8 (18.2%) |
Health Insurance Coverage by Household Income in Metolius
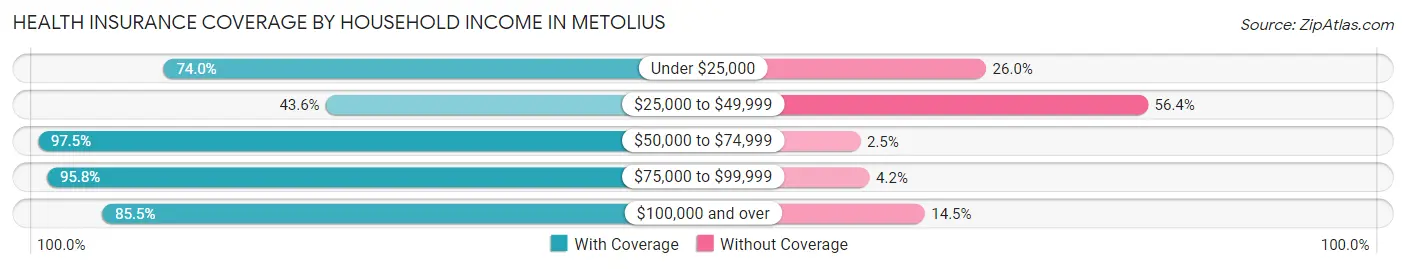
| Household Income | With Coverage | Without Coverage |
| Under $25,000 | 91 (74.0%) | 32 (26.0%) |
| $25,000 to $49,999 | 103 (43.6%) | 133 (56.4%) |
| $50,000 to $74,999 | 157 (97.5%) | 4 (2.5%) |
| $75,000 to $99,999 | 160 (95.8%) | 7 (4.2%) |
| $100,000 and over | 200 (85.5%) | 34 (14.5%) |
Public vs Private Health Insurance Coverage by Age in Metolius
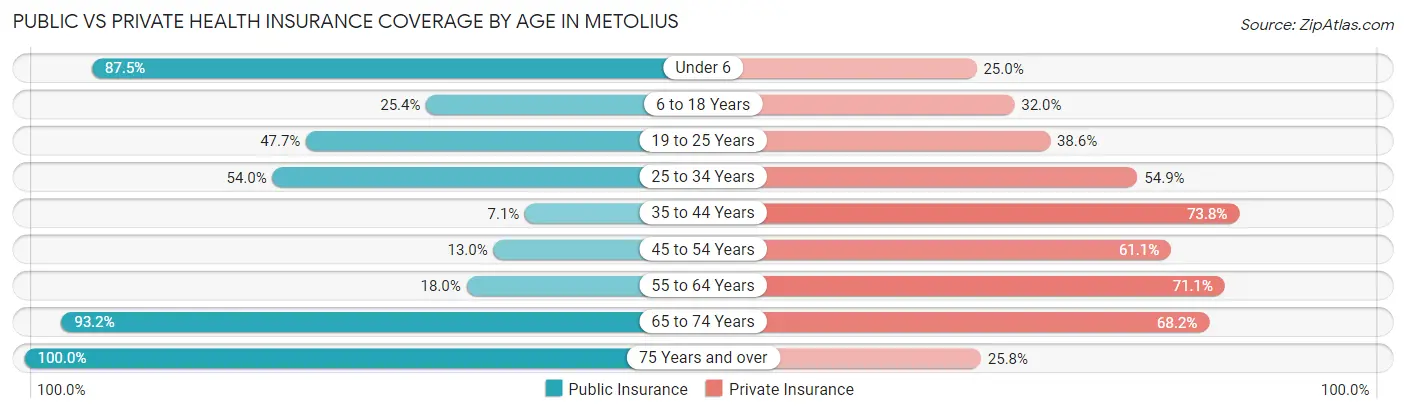
| Age Bracket | Public Insurance | Private Insurance |
| Under 6 | 35 (87.5%) | 10 (25.0%) |
| 6 to 18 Years | 58 (25.4%) | 73 (32.0%) |
| 19 to 25 Years | 21 (47.7%) | 17 (38.6%) |
| 25 to 34 Years | 61 (54.0%) | 62 (54.9%) |
| 35 to 44 Years | 10 (7.1%) | 104 (73.8%) |
| 45 to 54 Years | 14 (13.0%) | 66 (61.1%) |
| 55 to 64 Years | 23 (18.0%) | 91 (71.1%) |
| 65 to 74 Years | 82 (93.2%) | 60 (68.2%) |
| 75 Years and over | 31 (100.0%) | 8 (25.8%) |
| Total | 335 (36.4%) | 491 (53.3%) |
Disability Status by Sex by Age in Metolius
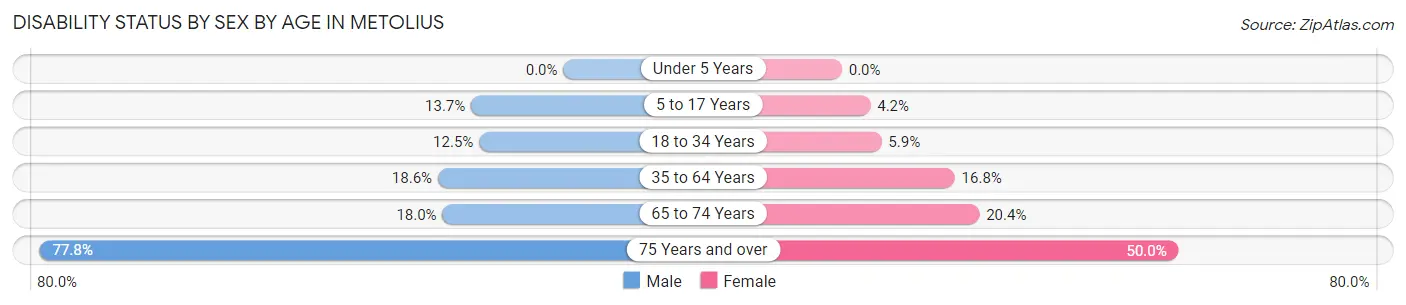
| Age Bracket | Male | Female |
| Under 5 Years | 0 (0.0%) | 0 (0.0%) |
| 5 to 17 Years | 20 (13.7%) | 3 (4.2%) |
| 18 to 34 Years | 11 (12.5%) | 5 (5.9%) |
| 35 to 64 Years | 38 (18.6%) | 29 (16.8%) |
| 65 to 74 Years | 7 (17.9%) | 10 (20.4%) |
| 75 Years and over | 7 (77.8%) | 11 (50.0%) |
Disability Class by Sex by Age in Metolius
Disability Class: Hearing Difficulty
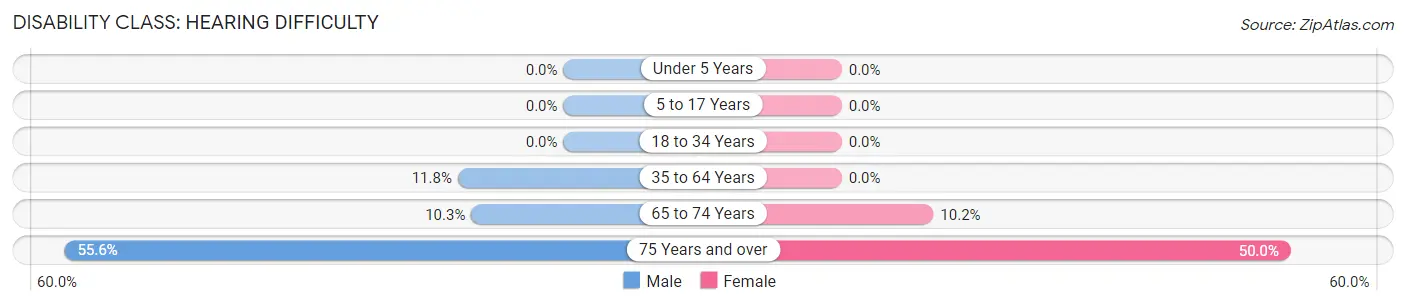
| Age Bracket | Male | Female |
| Under 5 Years | 0 (0.0%) | 0 (0.0%) |
| 5 to 17 Years | 0 (0.0%) | 0 (0.0%) |
| 18 to 34 Years | 0 (0.0%) | 0 (0.0%) |
| 35 to 64 Years | 24 (11.8%) | 0 (0.0%) |
| 65 to 74 Years | 4 (10.3%) | 5 (10.2%) |
| 75 Years and over | 5 (55.6%) | 11 (50.0%) |
Disability Class: Vision Difficulty
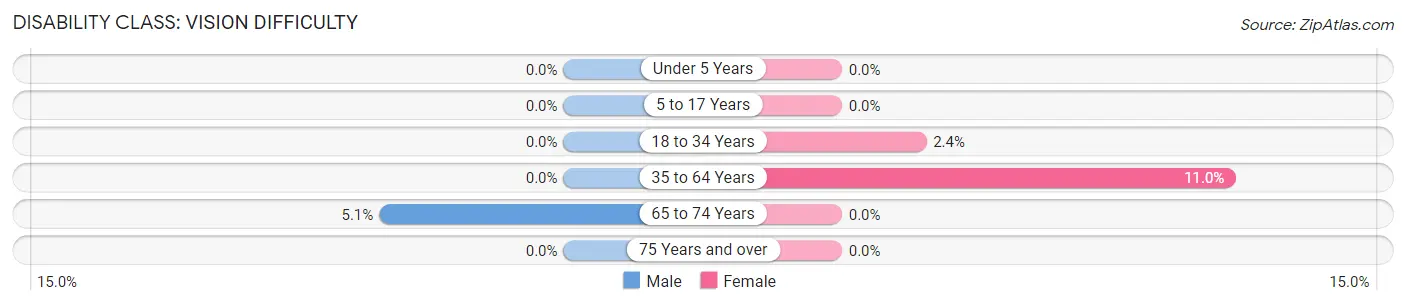
| Age Bracket | Male | Female |
| Under 5 Years | 0 (0.0%) | 0 (0.0%) |
| 5 to 17 Years | 0 (0.0%) | 0 (0.0%) |
| 18 to 34 Years | 0 (0.0%) | 2 (2.4%) |
| 35 to 64 Years | 0 (0.0%) | 19 (11.0%) |
| 65 to 74 Years | 2 (5.1%) | 0 (0.0%) |
| 75 Years and over | 0 (0.0%) | 0 (0.0%) |
Disability Class: Cognitive Difficulty
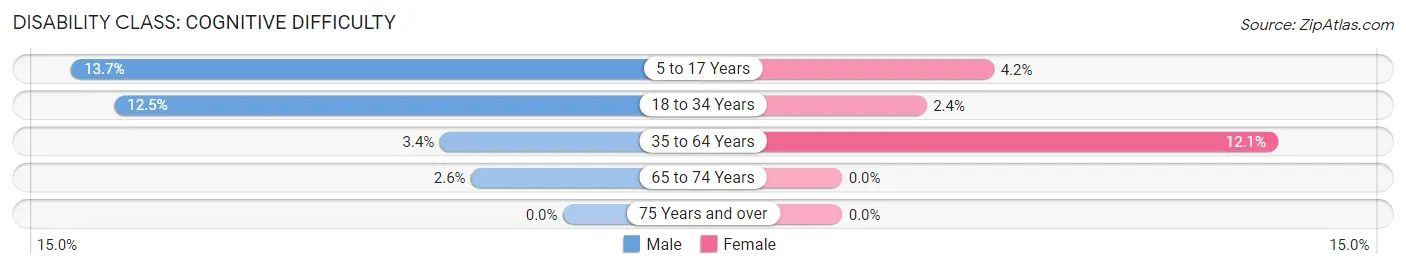
| Age Bracket | Male | Female |
| 5 to 17 Years | 20 (13.7%) | 3 (4.2%) |
| 18 to 34 Years | 11 (12.5%) | 2 (2.4%) |
| 35 to 64 Years | 7 (3.4%) | 21 (12.1%) |
| 65 to 74 Years | 1 (2.6%) | 0 (0.0%) |
| 75 Years and over | 0 (0.0%) | 0 (0.0%) |
Disability Class: Ambulatory Difficulty
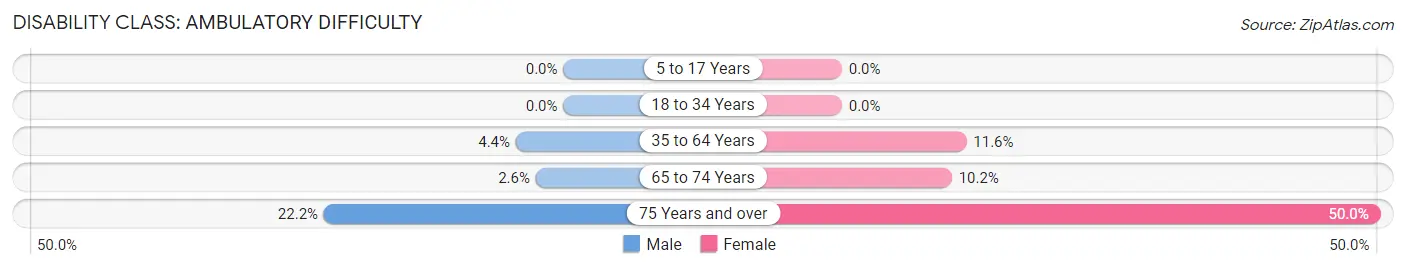
| Age Bracket | Male | Female |
| 5 to 17 Years | 0 (0.0%) | 0 (0.0%) |
| 18 to 34 Years | 0 (0.0%) | 0 (0.0%) |
| 35 to 64 Years | 9 (4.4%) | 20 (11.6%) |
| 65 to 74 Years | 1 (2.6%) | 5 (10.2%) |
| 75 Years and over | 2 (22.2%) | 11 (50.0%) |
Disability Class: Self-Care Difficulty
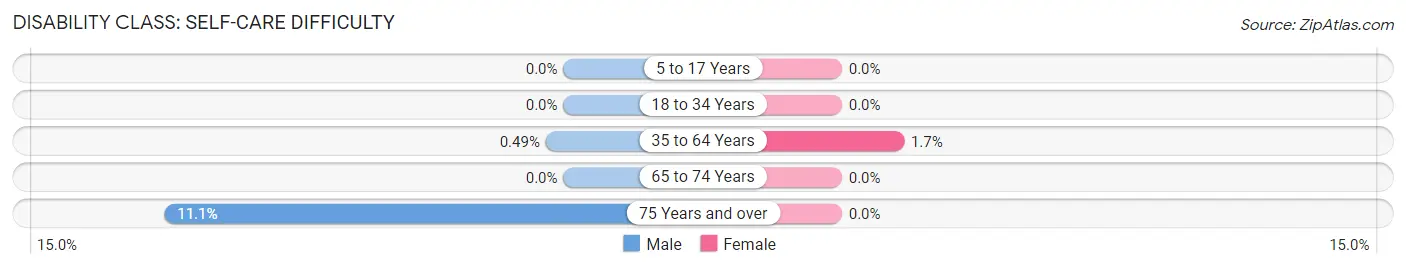
| Age Bracket | Male | Female |
| 5 to 17 Years | 0 (0.0%) | 0 (0.0%) |
| 18 to 34 Years | 0 (0.0%) | 0 (0.0%) |
| 35 to 64 Years | 1 (0.5%) | 3 (1.7%) |
| 65 to 74 Years | 0 (0.0%) | 0 (0.0%) |
| 75 Years and over | 1 (11.1%) | 0 (0.0%) |
Technology Access in Metolius
Computing Device Access in Metolius
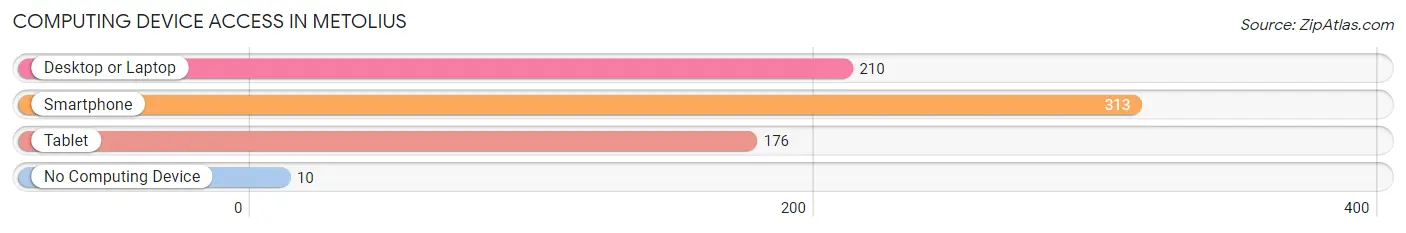
| Device Type | # Households | % Households |
| Desktop or Laptop | 210 | 62.9% |
| Smartphone | 313 | 93.7% |
| Tablet | 176 | 52.7% |
| No Computing Device | 10 | 3.0% |
| Total | 334 | 100.0% |
Internet Access in Metolius
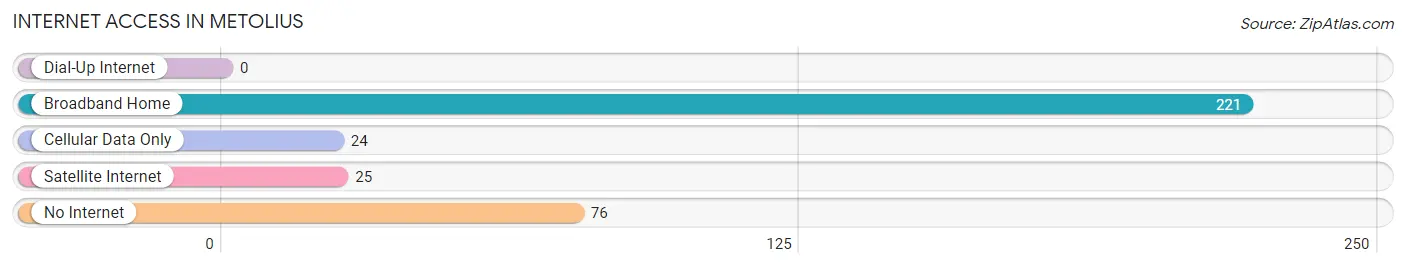
| Internet Type | # Households | % Households |
| Dial-Up Internet | 0 | 0.0% |
| Broadband Home | 221 | 66.2% |
| Cellular Data Only | 24 | 7.2% |
| Satellite Internet | 25 | 7.5% |
| No Internet | 76 | 22.8% |
| Total | 334 | 100.0% |
Metolius Summary
Metolius is a small city located in Jefferson County, Oregon, United States. It is situated on the banks of the Metolius River, a tributary of the Deschutes River. The city is located in the foothills of the Cascade Mountains, and is surrounded by the Deschutes National Forest. The population of Metolius was 1,092 at the 2010 census.
History
The area around Metolius was first inhabited by the Warm Springs Native American tribe. The first European settlers arrived in the area in the late 1800s, and the town of Metolius was established in 1902. The town was named after the Metolius River, which was named by explorer John C. Fremont in 1843.
The town was originally a logging and farming community, and the first sawmill was built in the area in 1906. The town was incorporated in 1911, and the first post office was established in 1912.
Geography
Metolius is located at an elevation of 2,845 feet (867 m) in the foothills of the Cascade Mountains. The city is situated on the banks of the Metolius River, a tributary of the Deschutes River. The city is surrounded by the Deschutes National Forest, and is located approximately 25 miles (40 km) east of Bend, Oregon.
The climate in Metolius is semi-arid, with hot summers and cold winters. The average annual precipitation is 11.5 inches (292 mm).
Economy
The economy of Metolius is largely based on tourism and recreation. The city is home to several resorts and campgrounds, and is a popular destination for fishing, camping, and hiking. The city is also home to several wineries and vineyards, and is a popular destination for wine tasting.
The city is also home to several small businesses, including restaurants, retail stores, and service providers.
Demographics
As of the 2010 census, the population of Metolius was 1,092. The racial makeup of the city was 94.2% White, 0.7% African American, 0.7% Native American, 0.7% Asian, 0.1% Pacific Islander, 0.7% from other races, and 2.7% from two or more races. Hispanic or Latino of any race were 3.2% of the population.
The median income for a household in Metolius was $37,500, and the median income for a family was $41,250. The per capita income for the city was $19,945. About 11.2% of families and 14.2% of the population were below the poverty line, including 18.2% of those under age 18 and 8.3% of those age 65 or over.
Common Questions
What is Per Capita Income in Metolius?
Per Capita income in Metolius is $27,290.
What is the Median Family Income in Metolius?
Median Family Income in Metolius is $68,654.
What is the Median Household income in Metolius?
Median Household Income in Metolius is $68,382.
What is Income or Wage Gap in Metolius?
Income or Wage Gap in Metolius is 42.0%.
Women in Metolius earn 58.0 cents for every dollar earned by a man.
What is Inequality or Gini Index in Metolius?
Inequality or Gini Index in Metolius is 0.39.
What is the Total Population of Metolius?
Total Population of Metolius is 921.
What is the Total Male Population of Metolius?
Total Male Population of Metolius is 504.
What is the Total Female Population of Metolius?
Total Female Population of Metolius is 417.
What is the Ratio of Males per 100 Females in Metolius?
There are 120.86 Males per 100 Females in Metolius.
What is the Ratio of Females per 100 Males in Metolius?
There are 82.74 Females per 100 Males in Metolius.
What is the Median Population Age in Metolius?
Median Population Age in Metolius is 36.6 Years.
What is the Average Family Size in Metolius
Average Family Size in Metolius is 3.1 People.
What is the Average Household Size in Metolius
Average Household Size in Metolius is 2.8 People.
How Large is the Labor Force in Metolius?
There are 436 People in the Labor Forcein in Metolius.
What is the Percentage of People in the Labor Force in Metolius?
63.5% of People are in the Labor Force in Metolius.
What is the Unemployment Rate in Metolius?
Unemployment Rate in Metolius is 3.4%.