Medford, OR Map & Demographics
Medford Map
Medford Overview
$33,822
PER CAPITA INCOME
$80,396
AVG FAMILY INCOME
$65,647
AVG HOUSEHOLD INCOME
28.4%
WAGE / INCOME GAP [ % ]
71.6¢/ $1
WAGE / INCOME GAP [ $ ]
$9,943
FAMILY INCOME DEFICIT
0.43
INEQUALITY / GINI INDEX
85,539
TOTAL POPULATION
42,713
MALE POPULATION
42,826
FEMALE POPULATION
99.74
MALES / 100 FEMALES
100.26
FEMALES / 100 MALES
38.1
MEDIAN AGE
3.0
AVG FAMILY SIZE
2.5
AVG HOUSEHOLD SIZE
41,884
LABOR FORCE [ PEOPLE ]
61.2%
PERCENT IN LABOR FORCE
5.0%
UNEMPLOYMENT RATE
Medford Area Codes
Income in Medford
Income Overview in Medford
Per Capita Income in Medford is $33,822, while median incomes of families and households are $80,396 and $65,647 respectively.
| Characteristic | Number | Measure |
| Per Capita Income | 85,539 | $33,822 |
| Median Family Income | 21,105 | $80,396 |
| Mean Family Income | 21,105 | $96,705 |
| Median Household Income | 34,127 | $65,647 |
| Mean Household Income | 34,127 | $83,278 |
| Income Deficit | 21,105 | $9,943 |
| Wage / Income Gap (%) | 85,539 | 28.45% |
| Wage / Income Gap ($) | 85,539 | 71.55¢ per $1 |
| Gini / Inequality Index | 85,539 | 0.43 |
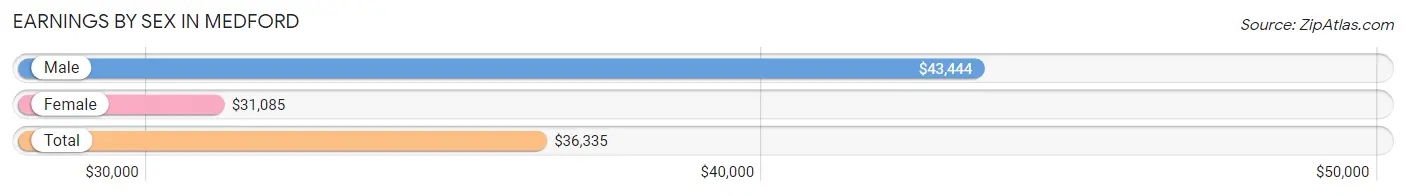
Earnings by Sex in Medford
Average Earnings in Medford are $36,335, $43,444 for men and $31,085 for women, a difference of 28.4%.
| Sex | Number | Average Earnings |
| Male | 23,118 (52.8%) | $43,444 |
| Female | 20,630 (47.2%) | $31,085 |
| Total | 43,748 (100.0%) | $36,335 |
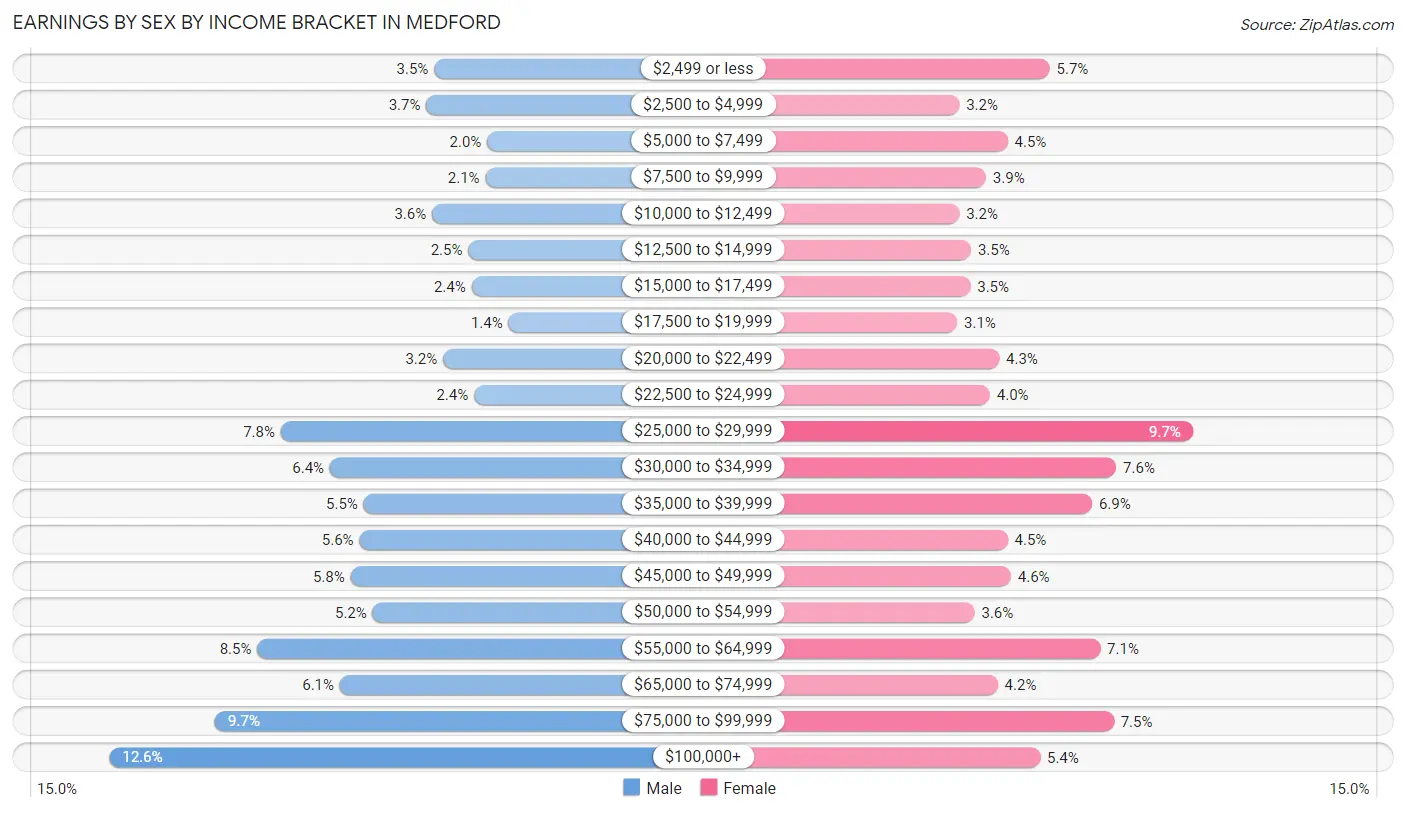
Earnings by Sex by Income Bracket in Medford
The most common earnings brackets in Medford are $100,000+ for men (2,918 | 12.6%) and $25,000 to $29,999 for women (2,006 | 9.7%).
| Income | Male | Female |
| $2,499 or less | 807 (3.5%) | 1,175 (5.7%) |
| $2,500 to $4,999 | 857 (3.7%) | 652 (3.2%) |
| $5,000 to $7,499 | 463 (2.0%) | 932 (4.5%) |
| $7,500 to $9,999 | 475 (2.1%) | 807 (3.9%) |
| $10,000 to $12,499 | 821 (3.5%) | 652 (3.2%) |
| $12,500 to $14,999 | 586 (2.5%) | 720 (3.5%) |
| $15,000 to $17,499 | 565 (2.4%) | 715 (3.5%) |
| $17,500 to $19,999 | 323 (1.4%) | 640 (3.1%) |
| $20,000 to $22,499 | 750 (3.2%) | 882 (4.3%) |
| $22,500 to $24,999 | 547 (2.4%) | 829 (4.0%) |
| $25,000 to $29,999 | 1,803 (7.8%) | 2,006 (9.7%) |
| $30,000 to $34,999 | 1,485 (6.4%) | 1,562 (7.6%) |
| $35,000 to $39,999 | 1,265 (5.5%) | 1,422 (6.9%) |
| $40,000 to $44,999 | 1,292 (5.6%) | 933 (4.5%) |
| $45,000 to $49,999 | 1,349 (5.8%) | 952 (4.6%) |
| $50,000 to $54,999 | 1,206 (5.2%) | 740 (3.6%) |
| $55,000 to $64,999 | 1,956 (8.5%) | 1,469 (7.1%) |
| $65,000 to $74,999 | 1,420 (6.1%) | 874 (4.2%) |
| $75,000 to $99,999 | 2,230 (9.7%) | 1,547 (7.5%) |
| $100,000+ | 2,918 (12.6%) | 1,121 (5.4%) |
| Total | 23,118 (100.0%) | 20,630 (100.0%) |
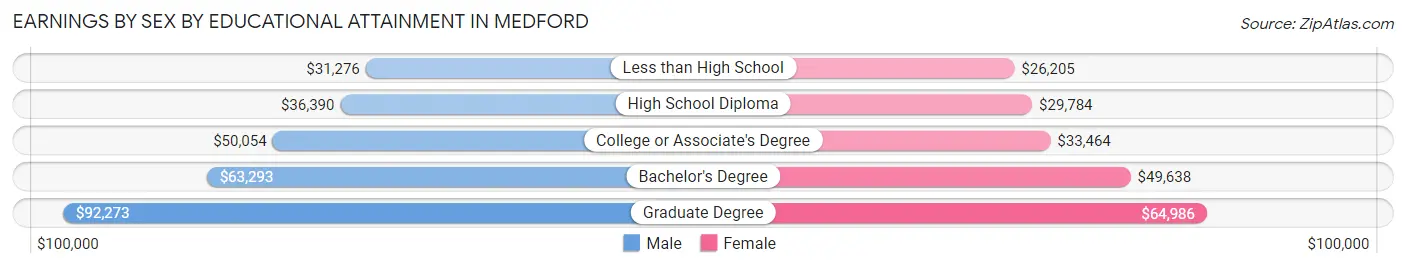
Earnings by Sex by Educational Attainment in Medford
Average earnings in Medford are $46,676 for men and $34,682 for women, a difference of 25.7%. Men with an educational attainment of graduate degree enjoy the highest average annual earnings of $92,273, while those with less than high school education earn the least with $31,276. Women with an educational attainment of graduate degree earn the most with the average annual earnings of $64,986, while those with less than high school education have the smallest earnings of $26,205.
| Educational Attainment | Male Income | Female Income |
| Less than High School | $31,276 | $26,205 |
| High School Diploma | $36,390 | $29,784 |
| College or Associate's Degree | $50,054 | $33,464 |
| Bachelor's Degree | $63,293 | $49,638 |
| Graduate Degree | $92,273 | $64,986 |
| Total | $46,676 | $34,682 |
Family Income in Medford
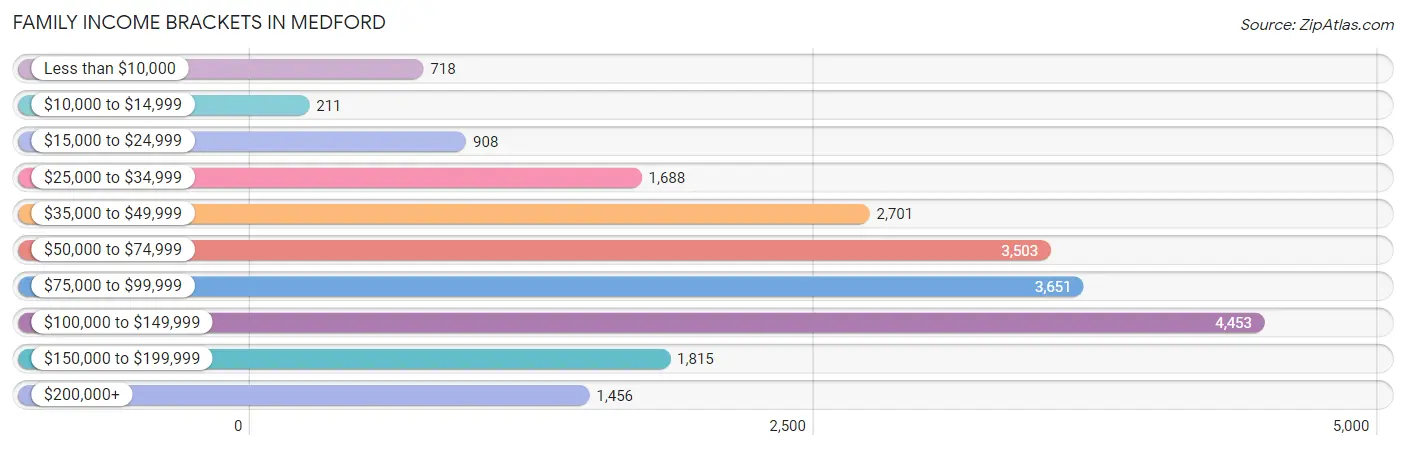
Family Income Brackets in Medford
According to the Medford family income data, there are 4,453 families falling into the $100,000 to $149,999 income range, which is the most common income bracket and makes up 21.1% of all families. Conversely, the $10,000 to $14,999 income bracket is the least frequent group with only 211 families (1.0%) belonging to this category.
| Income Bracket | # Families | % Families |
| Less than $10,000 | 718 | 3.4% |
| $10,000 to $14,999 | 211 | 1.0% |
| $15,000 to $24,999 | 908 | 4.3% |
| $25,000 to $34,999 | 1,688 | 8.0% |
| $35,000 to $49,999 | 2,701 | 12.8% |
| $50,000 to $74,999 | 3,503 | 16.6% |
| $75,000 to $99,999 | 3,651 | 17.3% |
| $100,000 to $149,999 | 4,453 | 21.1% |
| $150,000 to $199,999 | 1,815 | 8.6% |
| $200,000+ | 1,456 | 6.9% |
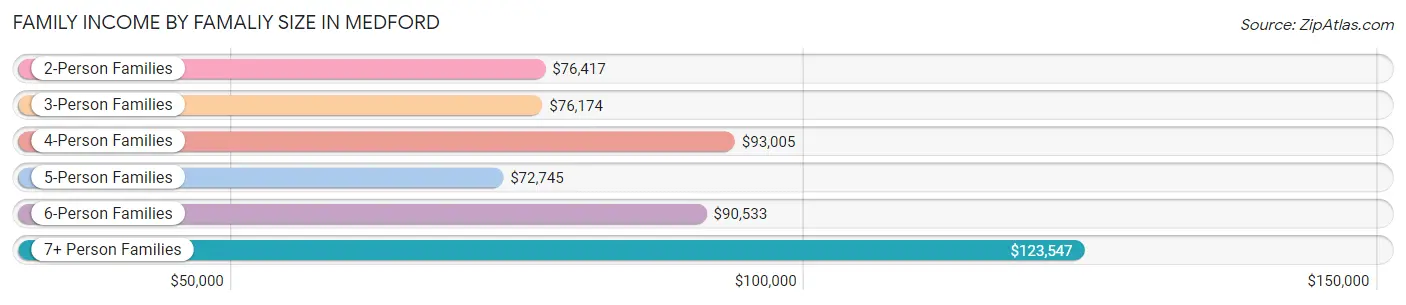
Family Income by Famaliy Size in Medford
7+ person families (189 | 0.9%) account for the highest median family income in Medford with $123,547 per family, while 2-person families (10,074 | 47.7%) have the highest median income of $38,208 per family member.
| Income Bracket | # Families | Median Income |
| 2-Person Families | 10,074 (47.7%) | $76,417 |
| 3-Person Families | 4,297 (20.4%) | $76,174 |
| 4-Person Families | 4,096 (19.4%) | $93,005 |
| 5-Person Families | 1,676 (7.9%) | $72,745 |
| 6-Person Families | 773 (3.7%) | $90,533 |
| 7+ Person Families | 189 (0.9%) | $123,547 |
| Total | 21,105 (100.0%) | $80,396 |
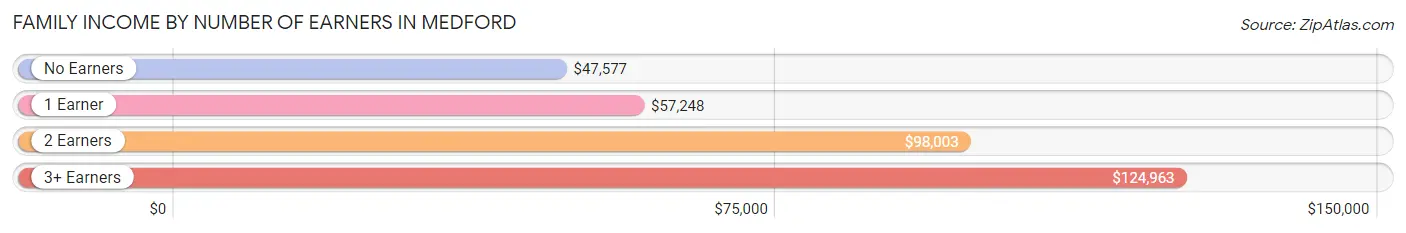
Family Income by Number of Earners in Medford
The median family income in Medford is $80,396, with families comprising 3+ earners (1,684) having the highest median family income of $124,963, while families with no earners (3,409) have the lowest median family income of $47,577, accounting for 8.0% and 16.2% of families, respectively.
| Number of Earners | # Families | Median Income |
| No Earners | 3,409 (16.2%) | $47,577 |
| 1 Earner | 7,112 (33.7%) | $57,248 |
| 2 Earners | 8,900 (42.2%) | $98,003 |
| 3+ Earners | 1,684 (8.0%) | $124,963 |
| Total | 21,105 (100.0%) | $80,396 |
Household Income in Medford
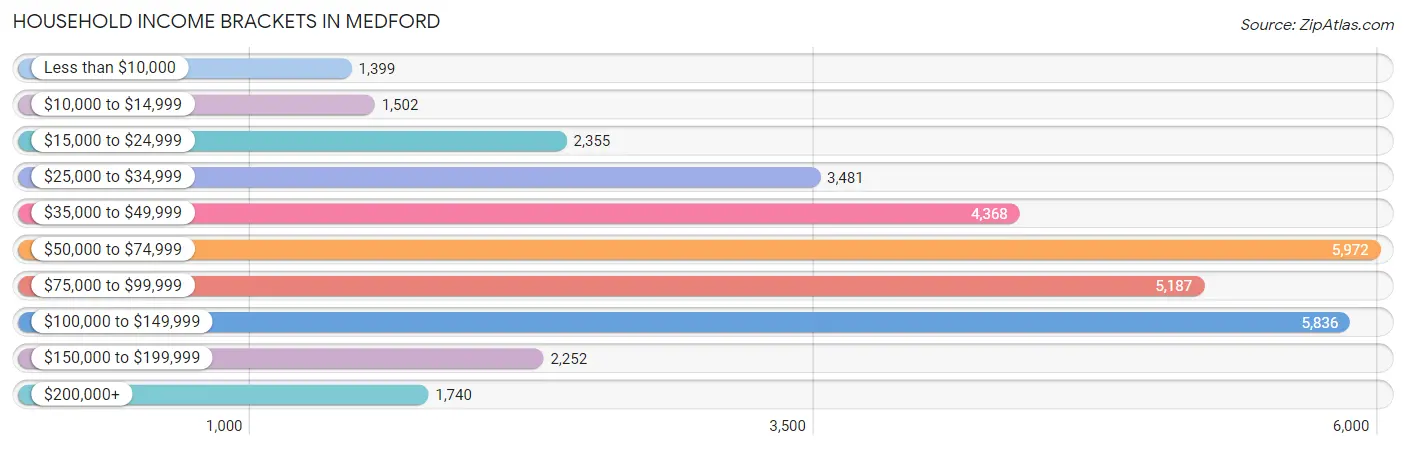
Household Income Brackets in Medford
With 5,972 households falling in the category, the $50,000 to $74,999 income range is the most frequent in Medford, accounting for 17.5% of all households. In contrast, only 1,399 households (4.1%) fall into the less than $10,000 income bracket, making it the least populous group.
| Income Bracket | # Households | % Households |
| Less than $10,000 | 1,399 | 4.1% |
| $10,000 to $14,999 | 1,502 | 4.4% |
| $15,000 to $24,999 | 2,355 | 6.9% |
| $25,000 to $34,999 | 3,481 | 10.2% |
| $35,000 to $49,999 | 4,368 | 12.8% |
| $50,000 to $74,999 | 5,972 | 17.5% |
| $75,000 to $99,999 | 5,187 | 15.2% |
| $100,000 to $149,999 | 5,836 | 17.1% |
| $150,000 to $199,999 | 2,252 | 6.6% |
| $200,000+ | 1,740 | 5.1% |
Household Income by Householder Age in Medford
The median household income in Medford is $65,647, with the highest median household income of $79,318 found in the 45 to 64 years age bracket for the primary householder. A total of 10,786 households (31.6%) fall into this category. Meanwhile, the 15 to 24 years age bracket for the primary householder has the lowest median household income of $47,598, with 1,674 households (4.9%) in this group.
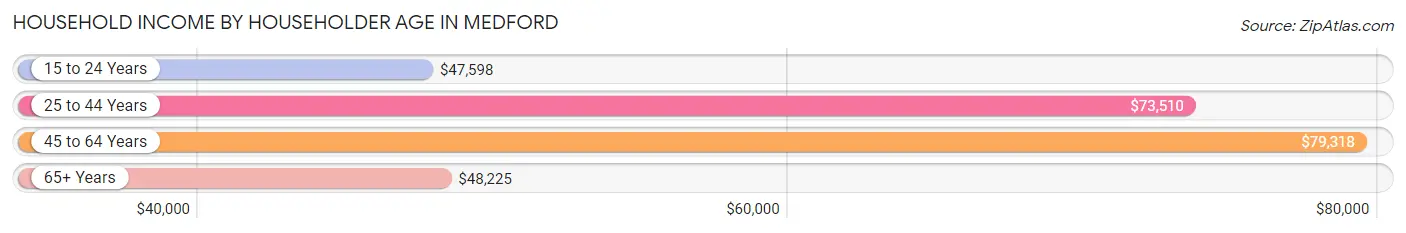
| Income Bracket | # Households | Median Income |
| 15 to 24 Years | 1,674 (4.9%) | $47,598 |
| 25 to 44 Years | 11,714 (34.3%) | $73,510 |
| 45 to 64 Years | 10,786 (31.6%) | $79,318 |
| 65+ Years | 9,953 (29.2%) | $48,225 |
| Total | 34,127 (100.0%) | $65,647 |
Poverty in Medford
Income Below Poverty by Sex and Age in Medford
With 11.2% poverty level for males and 15.1% for females among the residents of Medford, 5 year old males and 12 to 14 year old females are the most vulnerable to poverty, with 120 males (19.5%) and 370 females (26.1%) in their respective age groups living below the poverty level.
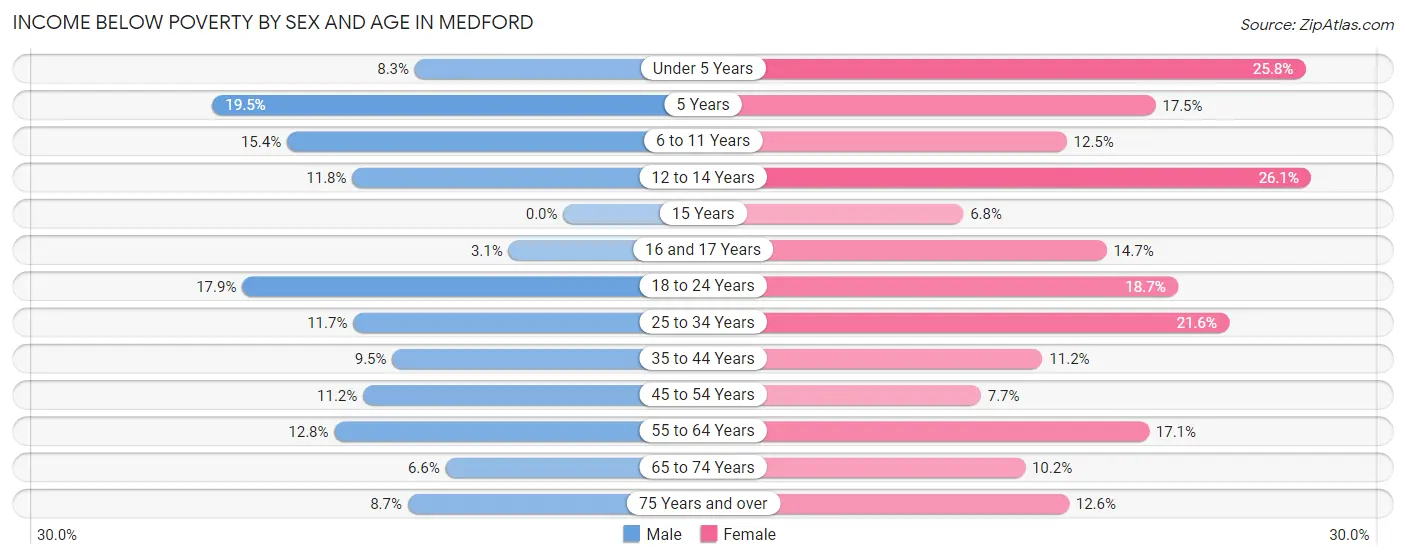
| Age Bracket | Male | Female |
| Under 5 Years | 174 (8.3%) | 624 (25.8%) |
| 5 Years | 120 (19.5%) | 73 (17.5%) |
| 6 to 11 Years | 556 (15.4%) | 419 (12.5%) |
| 12 to 14 Years | 213 (11.7%) | 370 (26.1%) |
| 15 Years | 0 (0.0%) | 42 (6.8%) |
| 16 and 17 Years | 35 (3.0%) | 153 (14.7%) |
| 18 to 24 Years | 655 (17.9%) | 633 (18.7%) |
| 25 to 34 Years | 804 (11.7%) | 1,290 (21.5%) |
| 35 to 44 Years | 506 (9.5%) | 617 (11.2%) |
| 45 to 54 Years | 557 (11.2%) | 353 (7.7%) |
| 55 to 64 Years | 577 (12.8%) | 893 (17.1%) |
| 65 to 74 Years | 259 (6.6%) | 475 (10.2%) |
| 75 Years and over | 256 (8.7%) | 471 (12.6%) |
| Total | 4,712 (11.2%) | 6,413 (15.1%) |
Income Above Poverty by Sex and Age in Medford
According to the poverty statistics in Medford, males aged 15 years and females aged 15 years are the age groups that are most secure financially, with 100.0% of males and 93.2% of females in these age groups living above the poverty line.
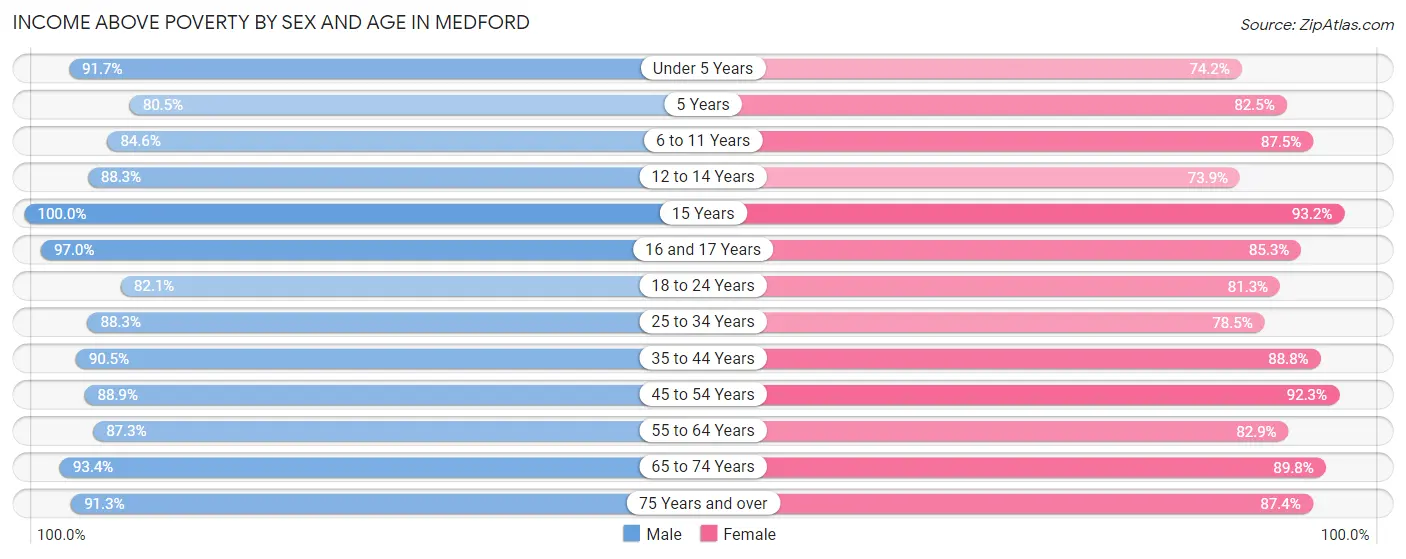
| Age Bracket | Male | Female |
| Under 5 Years | 1,929 (91.7%) | 1,795 (74.2%) |
| 5 Years | 494 (80.5%) | 345 (82.5%) |
| 6 to 11 Years | 3,056 (84.6%) | 2,928 (87.5%) |
| 12 to 14 Years | 1,599 (88.2%) | 1,047 (73.9%) |
| 15 Years | 502 (100.0%) | 579 (93.2%) |
| 16 and 17 Years | 1,113 (97.0%) | 885 (85.3%) |
| 18 to 24 Years | 3,008 (82.1%) | 2,754 (81.3%) |
| 25 to 34 Years | 6,068 (88.3%) | 4,697 (78.4%) |
| 35 to 44 Years | 4,809 (90.5%) | 4,907 (88.8%) |
| 45 to 54 Years | 4,440 (88.8%) | 4,209 (92.3%) |
| 55 to 64 Years | 3,948 (87.3%) | 4,329 (82.9%) |
| 65 to 74 Years | 3,690 (93.4%) | 4,180 (89.8%) |
| 75 Years and over | 2,700 (91.3%) | 3,254 (87.4%) |
| Total | 37,356 (88.8%) | 35,909 (84.9%) |
Income Below Poverty Among Married-Couple Families in Medford
The poverty statistics for married-couple families in Medford show that 5.0% or 773 of the total 15,547 families live below the poverty line. Families with 5 or more children have the highest poverty rate of 24.4%, comprising of 22 families. On the other hand, families with no children have the lowest poverty rate of 2.6%, which includes 227 families.
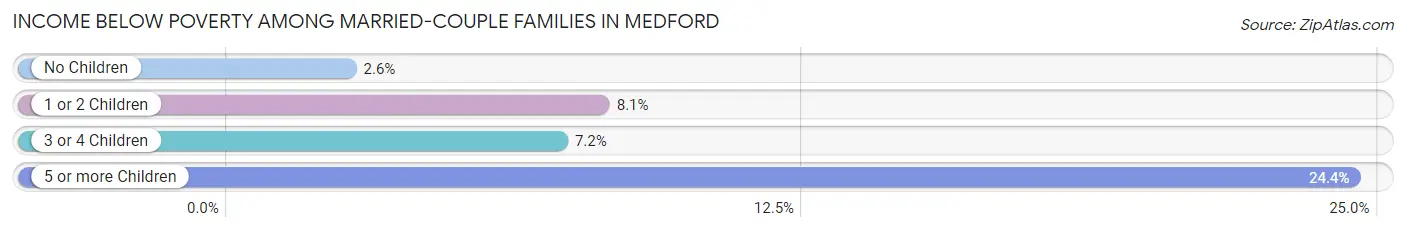
| Children | Above Poverty | Below Poverty |
| No Children | 8,574 (97.4%) | 227 (2.6%) |
| 1 or 2 Children | 4,658 (91.9%) | 410 (8.1%) |
| 3 or 4 Children | 1,474 (92.8%) | 114 (7.2%) |
| 5 or more Children | 68 (75.6%) | 22 (24.4%) |
| Total | 14,774 (95.0%) | 773 (5.0%) |
Income Below Poverty Among Single-Parent Households in Medford
According to the poverty data in Medford, 14.2% or 241 single-father households and 18.7% or 724 single-mother households are living below the poverty line. Among single-father households, those with 3 or 4 children have the highest poverty rate, with 96 households (57.5%) experiencing poverty. Likewise, among single-mother households, those with 5 or more children have the highest poverty rate, with 33 households (100.0%) falling below the poverty line.
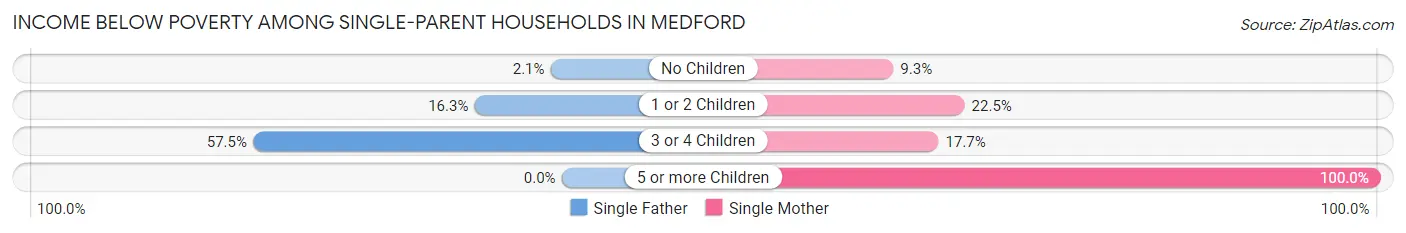
| Children | Single Father | Single Mother |
| No Children | 15 (2.1%) | 112 (9.3%) |
| 1 or 2 Children | 130 (16.3%) | 535 (22.5%) |
| 3 or 4 Children | 96 (57.5%) | 44 (17.7%) |
| 5 or more Children | 0 (0.0%) | 33 (100.0%) |
| Total | 241 (14.2%) | 724 (18.7%) |
Income Below Poverty Among Married-Couple vs Single-Parent Households in Medford
The poverty data for Medford shows that 773 of the married-couple family households (5.0%) and 965 of the single-parent households (17.4%) are living below the poverty level. Within the married-couple family households, those with 5 or more children have the highest poverty rate, with 22 households (24.4%) falling below the poverty line. Among the single-parent households, those with 5 or more children have the highest poverty rate, with 33 household (100.0%) living below poverty.
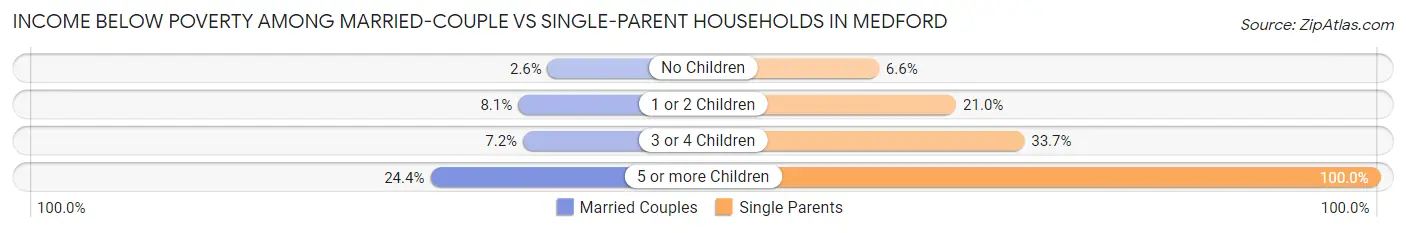
| Children | Married-Couple Families | Single-Parent Households |
| No Children | 227 (2.6%) | 127 (6.6%) |
| 1 or 2 Children | 410 (8.1%) | 665 (20.9%) |
| 3 or 4 Children | 114 (7.2%) | 140 (33.7%) |
| 5 or more Children | 22 (24.4%) | 33 (100.0%) |
| Total | 773 (5.0%) | 965 (17.4%) |
Race in Medford
The most populous races in Medford are White / Caucasian (70,280 | 82.2%), Hispanic or Latino (14,227 | 16.6%), and Two or more Races (9,517 | 11.1%).
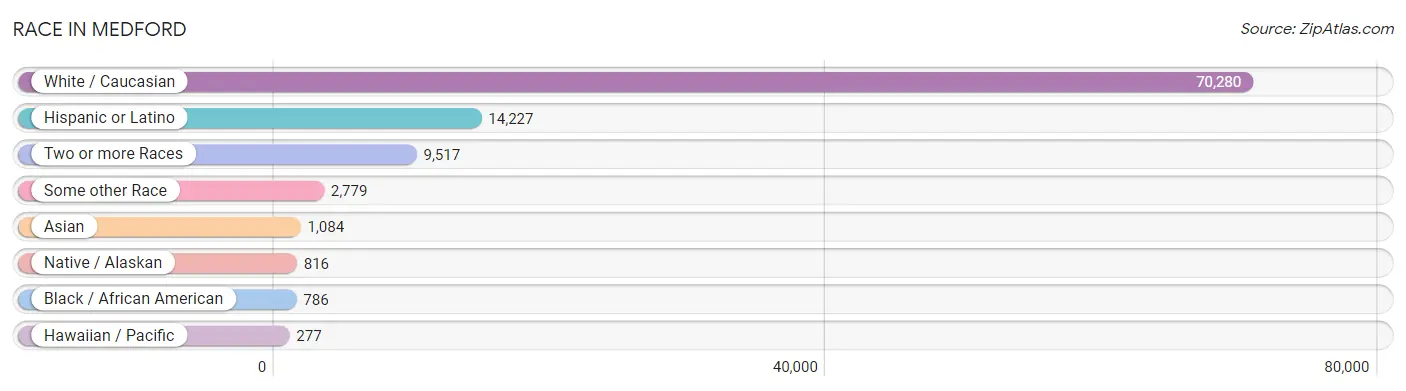
| Race | # Population | % Population |
| Asian | 1,084 | 1.3% |
| Black / African American | 786 | 0.9% |
| Hawaiian / Pacific | 277 | 0.3% |
| Hispanic or Latino | 14,227 | 16.6% |
| Native / Alaskan | 816 | 0.9% |
| White / Caucasian | 70,280 | 82.2% |
| Two or more Races | 9,517 | 11.1% |
| Some other Race | 2,779 | 3.3% |
| Total | 85,539 | 100.0% |
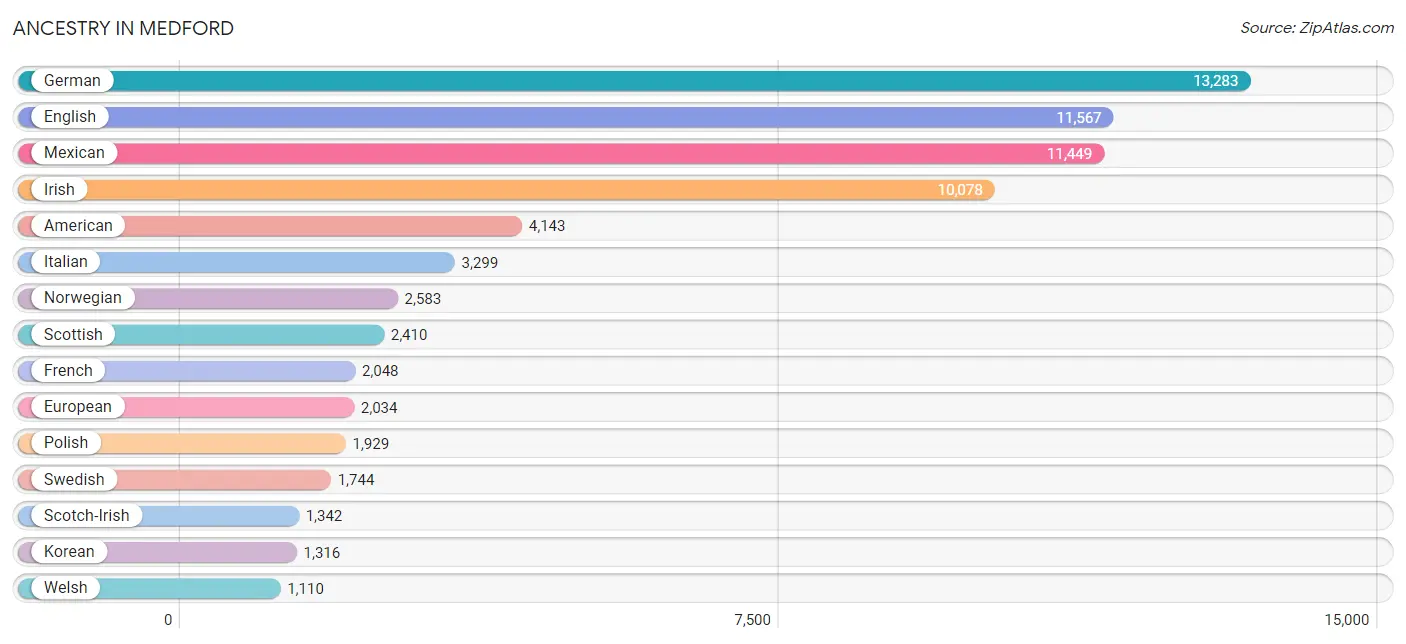
Ancestry in Medford
The most populous ancestries reported in Medford are German (13,283 | 15.5%), English (11,567 | 13.5%), Mexican (11,449 | 13.4%), Irish (10,078 | 11.8%), and American (4,143 | 4.8%), together accounting for 59.1% of all Medford residents.
| Ancestry | # Population | % Population |
| Afghan | 56 | 0.1% |
| African | 262 | 0.3% |
| Alaska Native | 16 | 0.0% |
| American | 4,143 | 4.8% |
| Apache | 86 | 0.1% |
| Arab | 26 | 0.0% |
| Argentinean | 27 | 0.0% |
| Armenian | 47 | 0.1% |
| Australian | 37 | 0.0% |
| Austrian | 269 | 0.3% |
| Basque | 23 | 0.0% |
| Belgian | 35 | 0.0% |
| Belizean | 15 | 0.0% |
| Bhutanese | 745 | 0.9% |
| Blackfeet | 93 | 0.1% |
| Brazilian | 50 | 0.1% |
| British | 1,028 | 1.2% |
| Bulgarian | 6 | 0.0% |
| Burmese | 98 | 0.1% |
| Cajun | 32 | 0.0% |
| Canadian | 290 | 0.3% |
| Celtic | 11 | 0.0% |
| Central American | 875 | 1.0% |
| Central American Indian | 74 | 0.1% |
| Cherokee | 474 | 0.5% |
| Chickasaw | 7 | 0.0% |
| Chippewa | 29 | 0.0% |
| Choctaw | 203 | 0.2% |
| Comanche | 3 | 0.0% |
| Costa Rican | 93 | 0.1% |
| Cree | 23 | 0.0% |
| Creek | 29 | 0.0% |
| Croatian | 95 | 0.1% |
| Cuban | 76 | 0.1% |
| Czech | 262 | 0.3% |
| Czechoslovakian | 69 | 0.1% |
| Danish | 569 | 0.7% |
| Dominican | 50 | 0.1% |
| Dutch | 972 | 1.1% |
| Eastern European | 108 | 0.1% |
| English | 11,567 | 13.5% |
| Ethiopian | 23 | 0.0% |
| European | 2,034 | 2.4% |
| Finnish | 313 | 0.4% |
| French | 2,048 | 2.4% |
| French American Indian | 53 | 0.1% |
| French Canadian | 422 | 0.5% |
| German | 13,283 | 15.5% |
| German Russian | 22 | 0.0% |
| Ghanaian | 24 | 0.0% |
| Greek | 412 | 0.5% |
| Guamanian / Chamorro | 214 | 0.3% |
| Guatemalan | 318 | 0.4% |
| Honduran | 131 | 0.2% |
| Hungarian | 441 | 0.5% |
| Icelander | 16 | 0.0% |
| Indian (Asian) | 392 | 0.5% |
| Iranian | 23 | 0.0% |
| Irish | 10,078 | 11.8% |
| Iroquois | 53 | 0.1% |
| Italian | 3,299 | 3.9% |
| Jamaican | 84 | 0.1% |
| Jordanian | 7 | 0.0% |
| Korean | 1,316 | 1.5% |
| Laotian | 29 | 0.0% |
| Lebanese | 13 | 0.0% |
| Lithuanian | 115 | 0.1% |
| Maltese | 1 | 0.0% |
| Mexican | 11,449 | 13.4% |
| Mexican American Indian | 298 | 0.4% |
| Native Hawaiian | 262 | 0.3% |
| Navajo | 25 | 0.0% |
| New Zealander | 7 | 0.0% |
| Nicaraguan | 18 | 0.0% |
| Nigerian | 18 | 0.0% |
| Northern European | 164 | 0.2% |
| Norwegian | 2,583 | 3.0% |
| Pakistani | 99 | 0.1% |
| Panamanian | 28 | 0.0% |
| Paraguayan | 113 | 0.1% |
| Pennsylvania German | 10 | 0.0% |
| Polish | 1,929 | 2.3% |
| Portuguese | 425 | 0.5% |
| Potawatomi | 169 | 0.2% |
| Pueblo | 15 | 0.0% |
| Puerto Rican | 580 | 0.7% |
| Puget Sound Salish | 8 | 0.0% |
| Romanian | 216 | 0.3% |
| Russian | 858 | 1.0% |
| Salvadoran | 287 | 0.3% |
| Samoan | 33 | 0.0% |
| Scandinavian | 620 | 0.7% |
| Scotch-Irish | 1,342 | 1.6% |
| Scottish | 2,410 | 2.8% |
| Sioux | 10 | 0.0% |
| Slavic | 44 | 0.1% |
| Slovak | 33 | 0.0% |
| Slovene | 48 | 0.1% |
| South American | 179 | 0.2% |
| Spaniard | 454 | 0.5% |
| Spanish | 267 | 0.3% |
| Spanish American | 80 | 0.1% |
| Sri Lankan | 121 | 0.1% |
| Subsaharan African | 342 | 0.4% |
| Swedish | 1,744 | 2.0% |
| Swiss | 270 | 0.3% |
| Thai | 44 | 0.1% |
| Tlingit-Haida | 30 | 0.0% |
| Tongan | 33 | 0.0% |
| Turkish | 127 | 0.2% |
| U.S. Virgin Islander | 10 | 0.0% |
| Ukrainian | 186 | 0.2% |
| Venezuelan | 39 | 0.1% |
| Welsh | 1,110 | 1.3% |
| West Indian | 23 | 0.0% |
| Yaqui | 13 | 0.0% |
| Yugoslavian | 51 | 0.1% | View All 117 Rows |
Immigrants in Medford
The most numerous immigrant groups reported in Medford came from Latin America (2,970 | 3.5%), Central America (2,869 | 3.4%), Mexico (2,670 | 3.1%), Europe (846 | 1.0%), and Asia (799 | 0.9%), together accounting for 11.9% of all Medford residents.
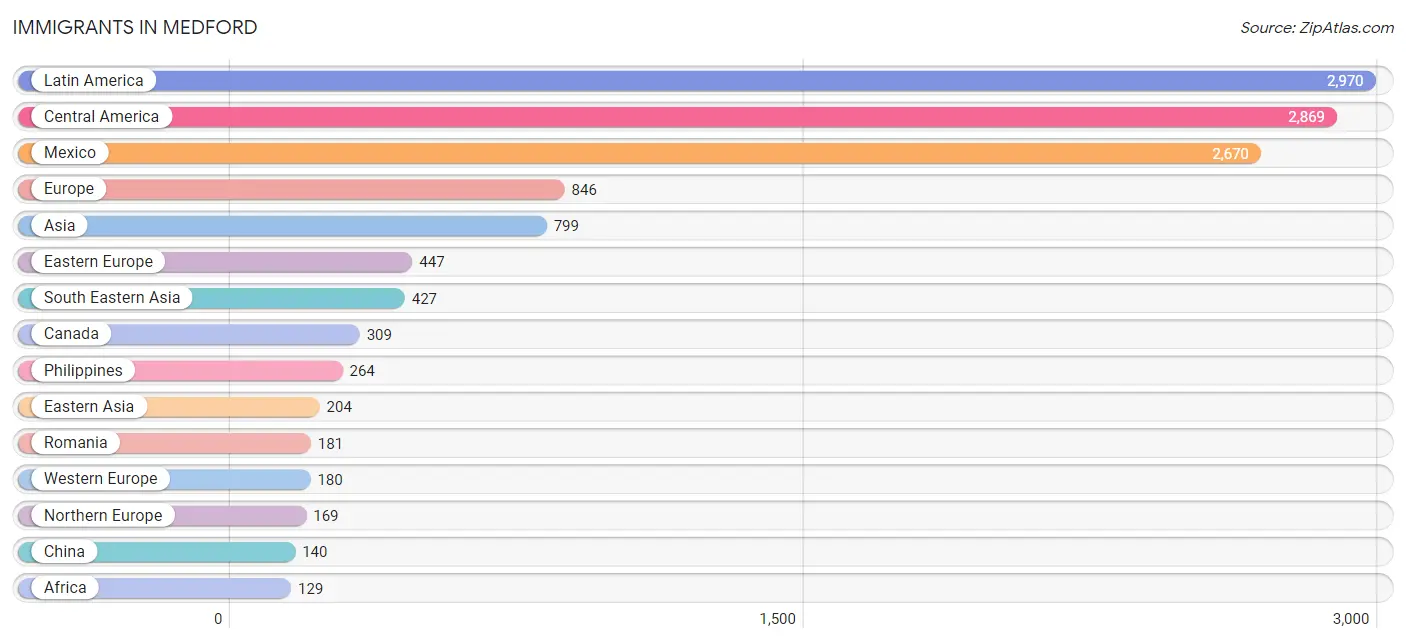
| Immigration Origin | # Population | % Population |
| Afghanistan | 8 | 0.0% |
| Africa | 129 | 0.2% |
| Asia | 799 | 0.9% |
| Australia | 41 | 0.1% |
| Austria | 11 | 0.0% |
| Belize | 15 | 0.0% |
| Brazil | 50 | 0.1% |
| Canada | 309 | 0.4% |
| Caribbean | 26 | 0.0% |
| Central America | 2,869 | 3.4% |
| China | 140 | 0.2% |
| Costa Rica | 34 | 0.0% |
| Croatia | 72 | 0.1% |
| Czechoslovakia | 16 | 0.0% |
| Dominican Republic | 16 | 0.0% |
| Eastern Africa | 57 | 0.1% |
| Eastern Asia | 204 | 0.2% |
| Eastern Europe | 447 | 0.5% |
| El Salvador | 80 | 0.1% |
| England | 125 | 0.2% |
| Ethiopia | 23 | 0.0% |
| Europe | 846 | 1.0% |
| Germany | 120 | 0.1% |
| Ghana | 24 | 0.0% |
| Guatemala | 12 | 0.0% |
| Honduras | 58 | 0.1% |
| Hong Kong | 1 | 0.0% |
| Hungary | 22 | 0.0% |
| India | 39 | 0.1% |
| Indonesia | 17 | 0.0% |
| Ireland | 14 | 0.0% |
| Italy | 49 | 0.1% |
| Jamaica | 10 | 0.0% |
| Japan | 38 | 0.0% |
| Jordan | 7 | 0.0% |
| Korea | 26 | 0.0% |
| Latin America | 2,970 | 3.5% |
| Mexico | 2,670 | 3.1% |
| Nepal | 44 | 0.1% |
| Netherlands | 6 | 0.0% |
| Nigeria | 28 | 0.0% |
| Northern Europe | 169 | 0.2% |
| Oceania | 111 | 0.1% |
| Philippines | 264 | 0.3% |
| Poland | 27 | 0.0% |
| Romania | 181 | 0.2% |
| Russia | 101 | 0.1% |
| Scotland | 18 | 0.0% |
| South America | 75 | 0.1% |
| South Central Asia | 91 | 0.1% |
| South Eastern Asia | 427 | 0.5% |
| Southern Europe | 50 | 0.1% |
| Spain | 1 | 0.0% |
| Switzerland | 43 | 0.1% |
| Taiwan | 2 | 0.0% |
| Thailand | 82 | 0.1% |
| Turkey | 70 | 0.1% |
| Ukraine | 16 | 0.0% |
| Vietnam | 64 | 0.1% |
| Western Africa | 67 | 0.1% |
| Western Asia | 77 | 0.1% |
| Western Europe | 180 | 0.2% |
| Zimbabwe | 34 | 0.0% | View All 63 Rows |
Sex and Age in Medford
Sex and Age in Medford
The most populous age groups in Medford are 25 to 29 Years (3,789 | 8.9%) for men and 25 to 29 Years (3,105 | 7.2%) for women.
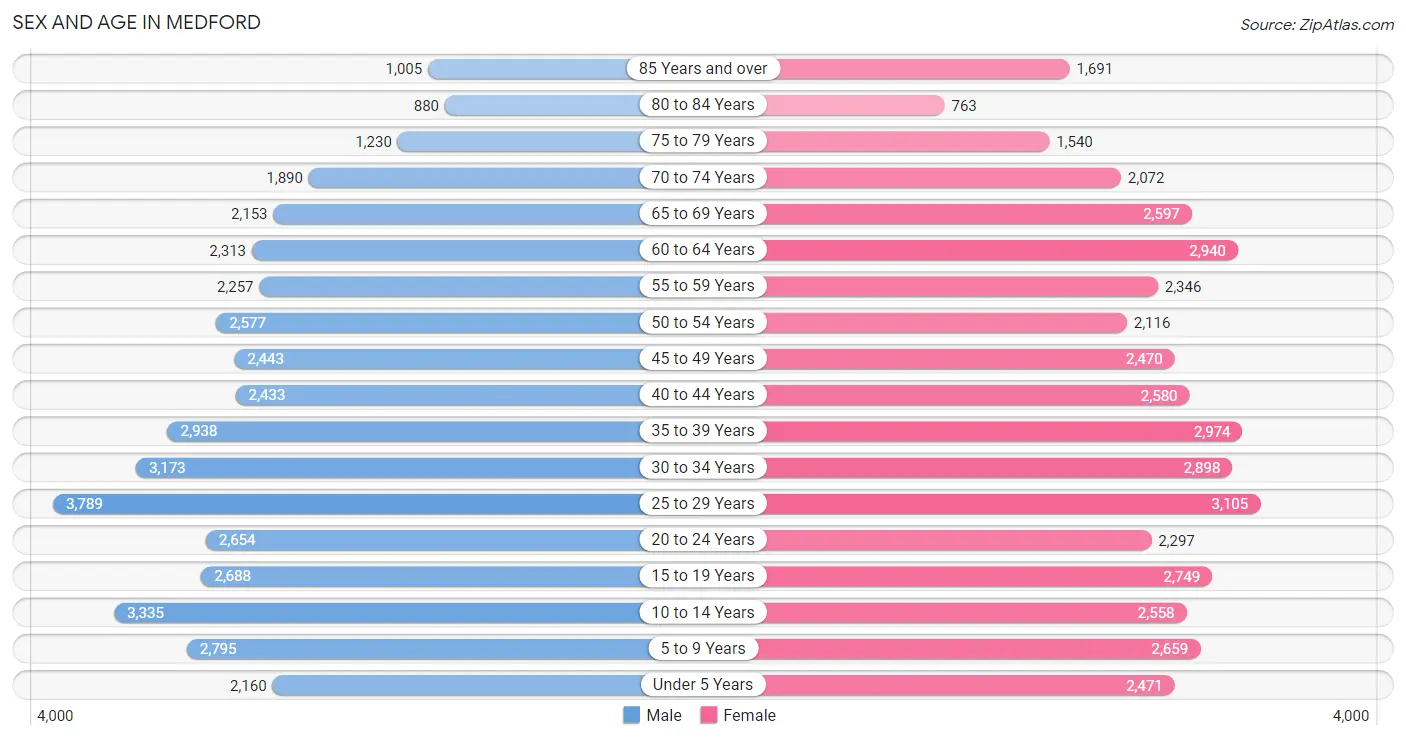
| Age Bracket | Male | Female |
| Under 5 Years | 2,160 (5.1%) | 2,471 (5.8%) |
| 5 to 9 Years | 2,795 (6.5%) | 2,659 (6.2%) |
| 10 to 14 Years | 3,335 (7.8%) | 2,558 (6.0%) |
| 15 to 19 Years | 2,688 (6.3%) | 2,749 (6.4%) |
| 20 to 24 Years | 2,654 (6.2%) | 2,297 (5.4%) |
| 25 to 29 Years | 3,789 (8.9%) | 3,105 (7.2%) |
| 30 to 34 Years | 3,173 (7.4%) | 2,898 (6.8%) |
| 35 to 39 Years | 2,938 (6.9%) | 2,974 (6.9%) |
| 40 to 44 Years | 2,433 (5.7%) | 2,580 (6.0%) |
| 45 to 49 Years | 2,443 (5.7%) | 2,470 (5.8%) |
| 50 to 54 Years | 2,577 (6.0%) | 2,116 (4.9%) |
| 55 to 59 Years | 2,257 (5.3%) | 2,346 (5.5%) |
| 60 to 64 Years | 2,313 (5.4%) | 2,940 (6.9%) |
| 65 to 69 Years | 2,153 (5.0%) | 2,597 (6.1%) |
| 70 to 74 Years | 1,890 (4.4%) | 2,072 (4.8%) |
| 75 to 79 Years | 1,230 (2.9%) | 1,540 (3.6%) |
| 80 to 84 Years | 880 (2.1%) | 763 (1.8%) |
| 85 Years and over | 1,005 (2.4%) | 1,691 (4.0%) |
| Total | 42,713 (100.0%) | 42,826 (100.0%) |
Families and Households in Medford
Median Family Size in Medford
The median family size in Medford is 3.03 persons per family, with married-couple families (15,547 | 73.7%) accounting for the largest median family size of 3.08 persons per family. On the other hand, single male/father families (1,693 | 8.0%) represent the smallest median family size with 2.81 persons per family.
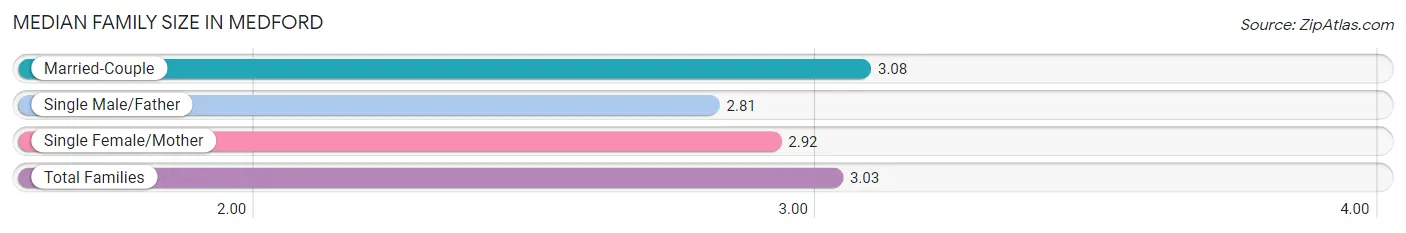
| Family Type | # Families | Family Size |
| Married-Couple | 15,547 (73.7%) | 3.08 |
| Single Male/Father | 1,693 (8.0%) | 2.81 |
| Single Female/Mother | 3,865 (18.3%) | 2.92 |
| Total Families | 21,105 (100.0%) | 3.03 |
Median Household Size in Medford
The median household size in Medford is 2.45 persons per household, with single male/father households (1,693 | 5.0%) accounting for the largest median household size of 3.4 persons per household. non-family households (13,022 | 38.2%) represent the smallest median household size with 1.29 persons per household.
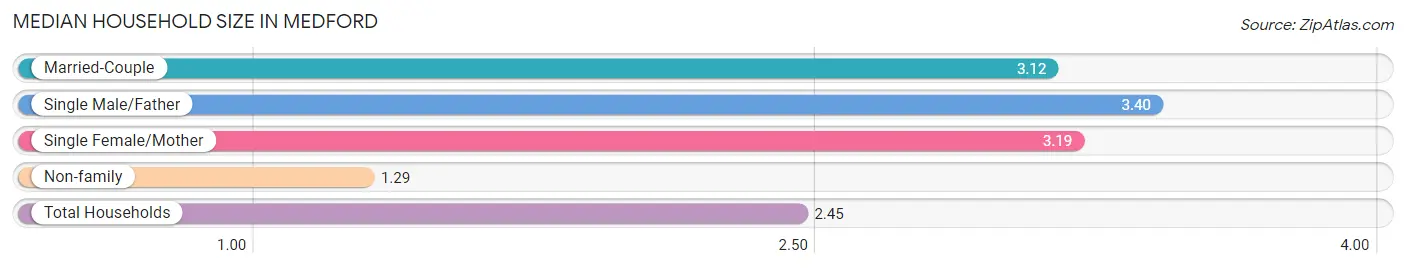
| Household Type | # Households | Household Size |
| Married-Couple | 15,547 (45.6%) | 3.12 |
| Single Male/Father | 1,693 (5.0%) | 3.40 |
| Single Female/Mother | 3,865 (11.3%) | 3.19 |
| Non-family | 13,022 (38.2%) | 1.29 |
| Total Households | 34,127 (100.0%) | 2.45 |
Household Size by Marriage Status in Medford
Out of a total of 34,127 households in Medford, 21,105 (61.8%) are family households, while 13,022 (38.2%) are nonfamily households. The most numerous type of family households are 2-person households, comprising 9,098, and the most common type of nonfamily households are 1-person households, comprising 10,180.
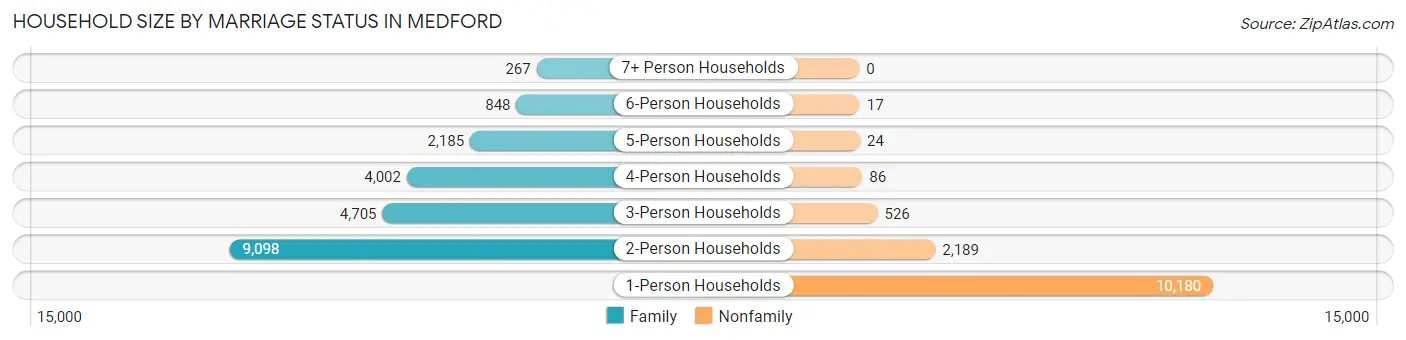
| Household Size | Family Households | Nonfamily Households |
| 1-Person Households | - | 10,180 (29.8%) |
| 2-Person Households | 9,098 (26.7%) | 2,189 (6.4%) |
| 3-Person Households | 4,705 (13.8%) | 526 (1.5%) |
| 4-Person Households | 4,002 (11.7%) | 86 (0.3%) |
| 5-Person Households | 2,185 (6.4%) | 24 (0.1%) |
| 6-Person Households | 848 (2.5%) | 17 (0.1%) |
| 7+ Person Households | 267 (0.8%) | 0 (0.0%) |
| Total | 21,105 (61.8%) | 13,022 (38.2%) |
Female Fertility in Medford
Fertility by Age in Medford
Average fertility rate in Medford is 73.0 births per 1,000 women. Women in the age bracket of 20 to 34 years have the highest fertility rate with 148.0 births per 1,000 women. Women in the age bracket of 20 to 34 years acount for 85.5% of all women with births.
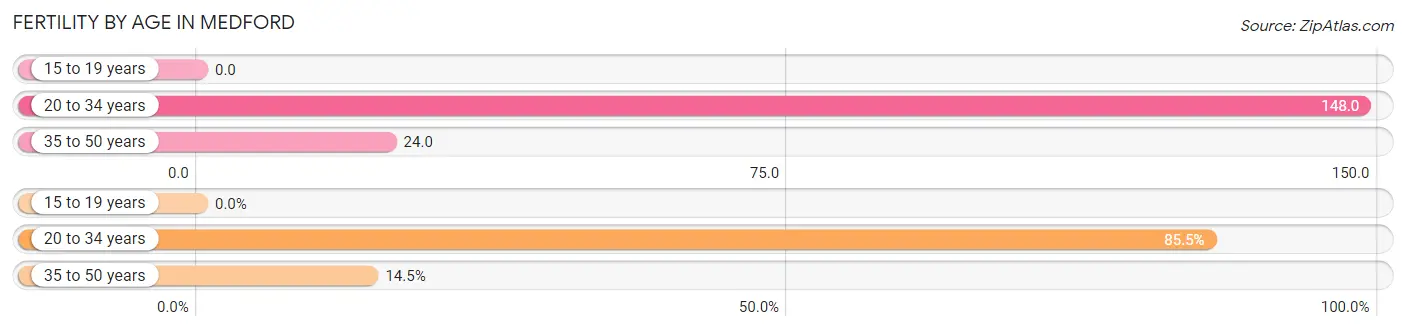
| Age Bracket | Women with Births | Births / 1,000 Women |
| 15 to 19 years | 0 (0.0%) | 0.0 |
| 20 to 34 years | 1,225 (85.5%) | 148.0 |
| 35 to 50 years | 207 (14.5%) | 24.0 |
| Total | 1,432 (100.0%) | 73.0 |
Fertility by Age by Marriage Status in Medford
76.4% of women with births (1,432) in Medford are married. The highest percentage of unmarried women with births falls into 20 to 34 years age bracket with 26.8% of them unmarried at the time of birth, while the lowest percentage of unmarried women with births belong to 35 to 50 years age bracket with 4.8% of them unmarried.
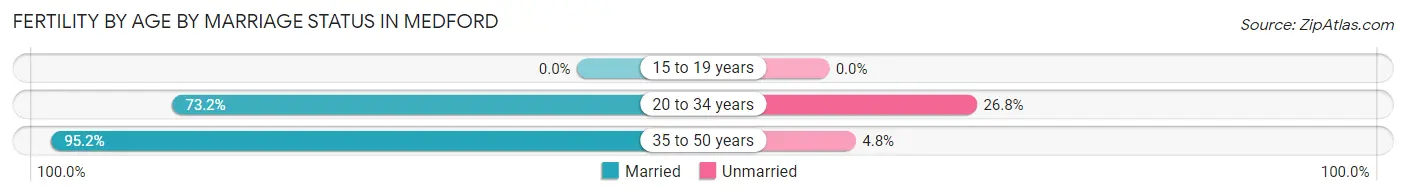
| Age Bracket | Married | Unmarried |
| 15 to 19 years | 0 (0.0%) | 0 (0.0%) |
| 20 to 34 years | 897 (73.2%) | 328 (26.8%) |
| 35 to 50 years | 197 (95.2%) | 10 (4.8%) |
| Total | 1,094 (76.4%) | 338 (23.6%) |
Fertility by Education in Medford
Average fertility rate in Medford is 73.0 births per 1,000 women. Women with the education attainment of college or associate's degree have the highest fertility rate of 109.0 births per 1,000 women, while women with the education attainment of less than high school have the lowest fertility at 34.0 births per 1,000 women. Women with the education attainment of college or associate's degree represent 55.9% of all women with births.
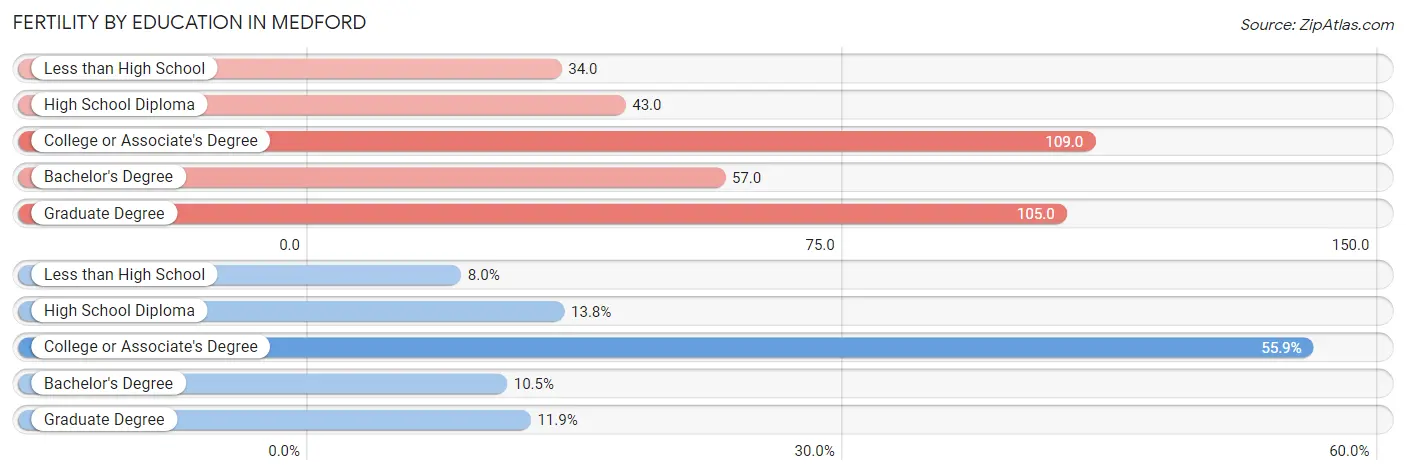
| Educational Attainment | Women with Births | Births / 1,000 Women |
| Less than High School | 114 (8.0%) | 34.0 |
| High School Diploma | 197 (13.8%) | 43.0 |
| College or Associate's Degree | 800 (55.9%) | 109.0 |
| Bachelor's Degree | 151 (10.5%) | 57.0 |
| Graduate Degree | 170 (11.9%) | 105.0 |
| Total | 1,432 (100.0%) | 73.0 |
Fertility by Education by Marriage Status in Medford
23.6% of women with births in Medford are unmarried. Women with the educational attainment of graduate degree are most likely to be married with 100.0% of them married at childbirth, while women with the educational attainment of less than high school are least likely to be married with 42.1% of them unmarried at childbirth.
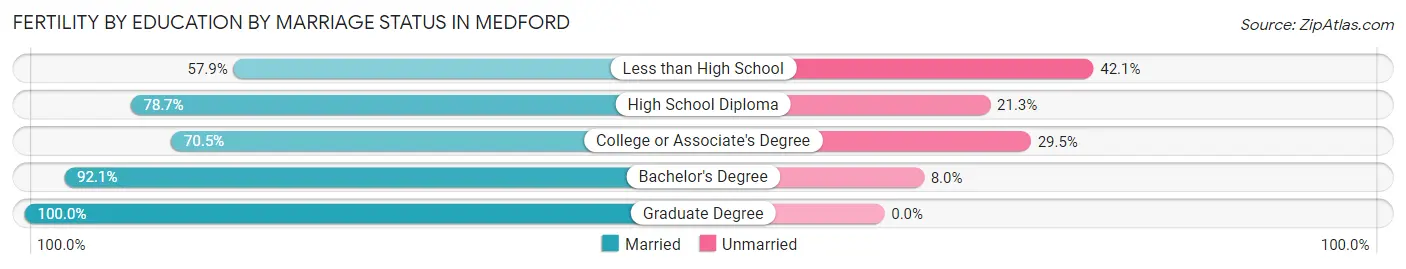
| Educational Attainment | Married | Unmarried |
| Less than High School | 66 (57.9%) | 48 (42.1%) |
| High School Diploma | 155 (78.7%) | 42 (21.3%) |
| College or Associate's Degree | 564 (70.5%) | 236 (29.5%) |
| Bachelor's Degree | 139 (92.0%) | 12 (8.0%) |
| Graduate Degree | 170 (100.0%) | 0 (0.0%) |
| Total | 1,094 (76.4%) | 338 (23.6%) |
Employment Characteristics in Medford
Employment by Class of Employer in Medford
Among the 38,949 employed individuals in Medford, private company employees (24,828 | 63.7%), not-for-profit organizations (5,358 | 13.8%), and self-employed (not incorporated) (2,645 | 6.8%) make up the most common classes of employment.
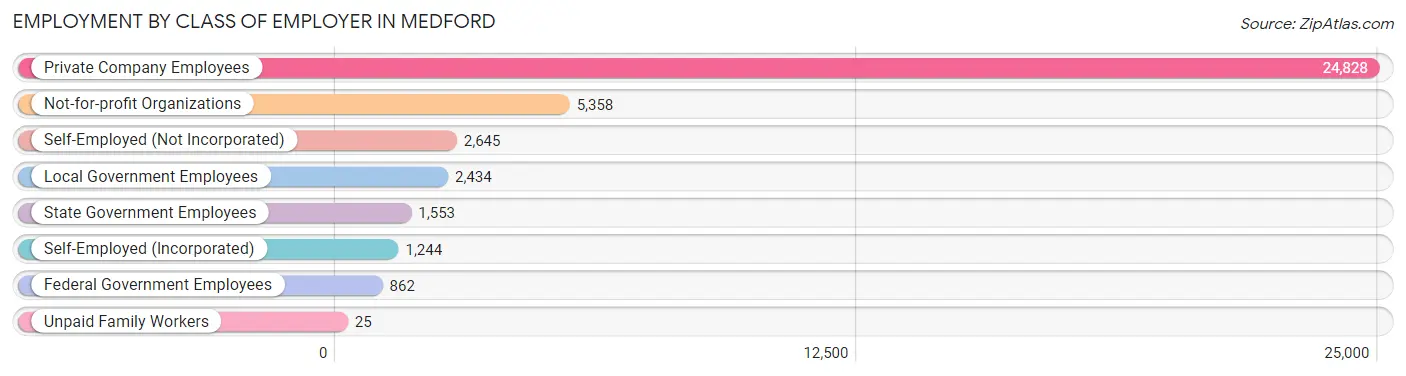
| Employer Class | # Employees | % Employees |
| Private Company Employees | 24,828 | 63.7% |
| Self-Employed (Incorporated) | 1,244 | 3.2% |
| Self-Employed (Not Incorporated) | 2,645 | 6.8% |
| Not-for-profit Organizations | 5,358 | 13.8% |
| Local Government Employees | 2,434 | 6.2% |
| State Government Employees | 1,553 | 4.0% |
| Federal Government Employees | 862 | 2.2% |
| Unpaid Family Workers | 25 | 0.1% |
| Total | 38,949 | 100.0% |
Employment Status by Age in Medford
According to the labor force statistics for Medford, out of the total population over 16 years of age (68,438), 61.2% or 41,884 individuals are in the labor force, with 5.0% or 2,094 of them unemployed. The age group with the highest labor force participation rate is 25 to 29 years, with 85.0% or 5,860 individuals in the labor force. Within the labor force, the 16 to 19 years age range has the highest percentage of unemployed individuals, with 16.6% or 334 of them being unemployed.
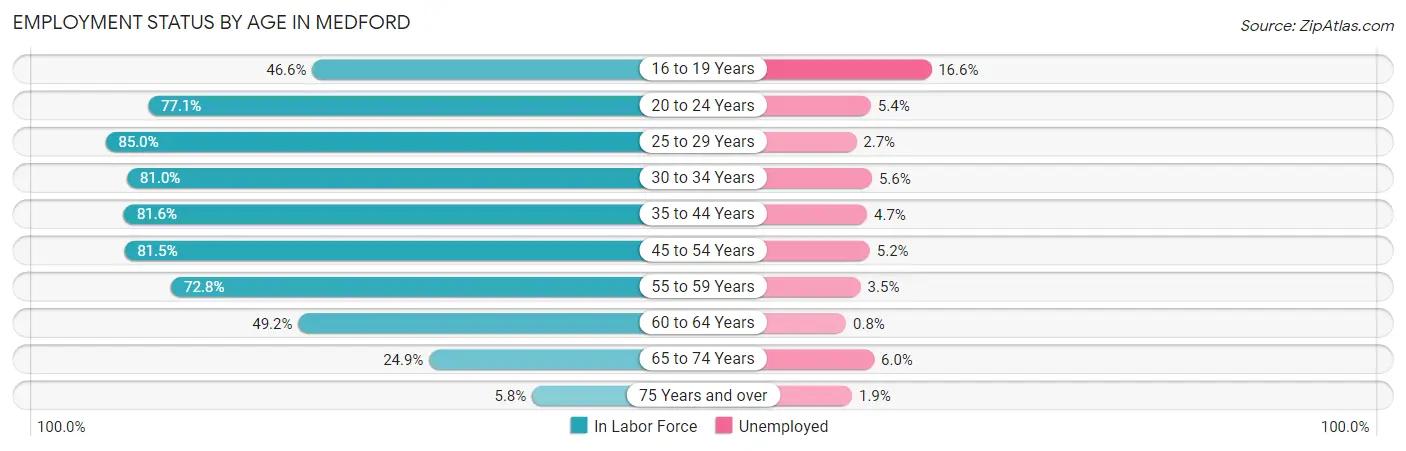
| Age Bracket | In Labor Force | Unemployed |
| 16 to 19 Years | 2,010 (46.6%) | 334 (16.6%) |
| 20 to 24 Years | 3,817 (77.1%) | 206 (5.4%) |
| 25 to 29 Years | 5,860 (85.0%) | 158 (2.7%) |
| 30 to 34 Years | 4,918 (81.0%) | 275 (5.6%) |
| 35 to 44 Years | 8,915 (81.6%) | 419 (4.7%) |
| 45 to 54 Years | 7,829 (81.5%) | 407 (5.2%) |
| 55 to 59 Years | 3,351 (72.8%) | 117 (3.5%) |
| 60 to 64 Years | 2,584 (49.2%) | 21 (0.8%) |
| 65 to 74 Years | 2,169 (24.9%) | 130 (6.0%) |
| 75 Years and over | 412 (5.8%) | 8 (1.9%) |
| Total | 41,884 (61.2%) | 2,094 (5.0%) |
Employment Status by Educational Attainment in Medford
According to labor force statistics for Medford, 77.2% of individuals (33,468) out of the total population between 25 and 64 years of age (43,352) are in the labor force, with 4.2% or 1,406 of them being unemployed. The group with the highest labor force participation rate are those with the educational attainment of bachelor's degree or higher, with 83.2% or 9,577 individuals in the labor force. Within the labor force, individuals with less than high school education have the highest percentage of unemployment, with 7.1% or 204 of them being unemployed.
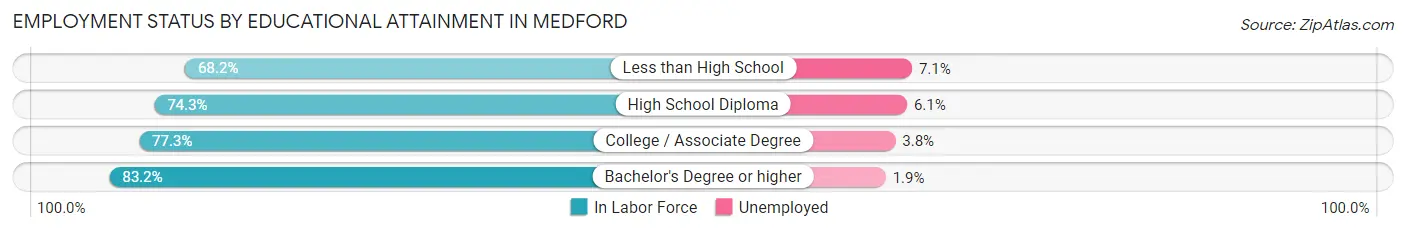
| Educational Attainment | In Labor Force | Unemployed |
| Less than High School | 2,880 (68.2%) | 300 (7.1%) |
| High School Diploma | 8,949 (74.3%) | 735 (6.1%) |
| College / Associate Degree | 12,039 (77.3%) | 592 (3.8%) |
| Bachelor's Degree or higher | 9,577 (83.2%) | 219 (1.9%) |
| Total | 33,468 (77.2%) | 1,821 (4.2%) |
Employment Occupations by Sex in Medford
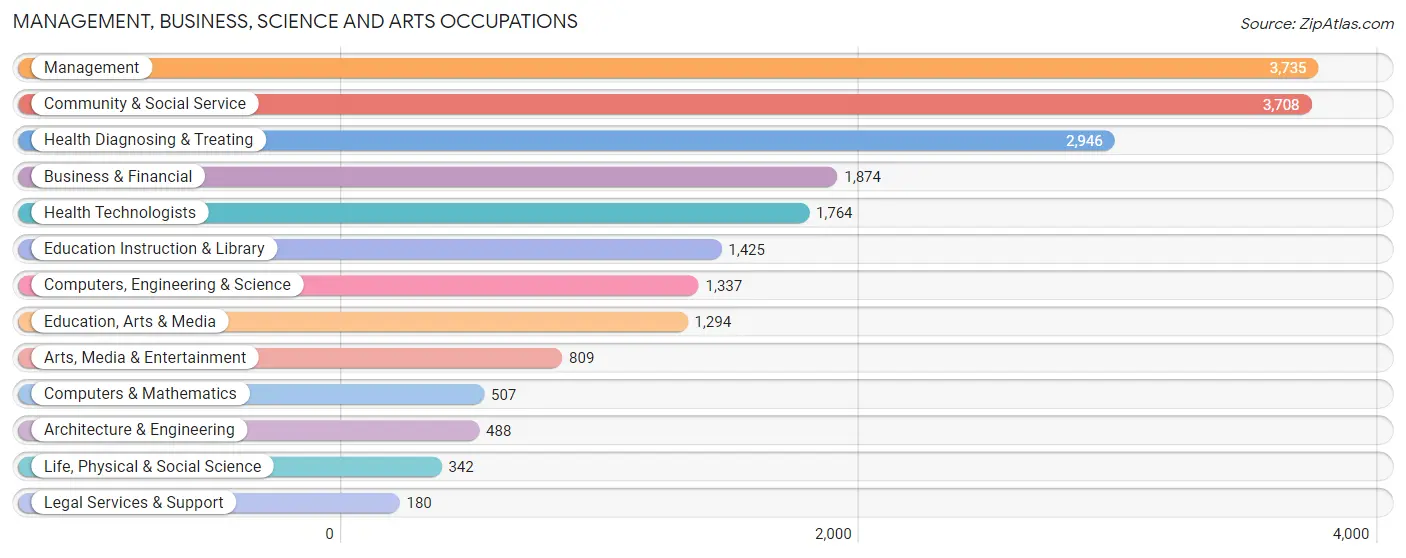
Management, Business, Science and Arts Occupations
The most common Management, Business, Science and Arts occupations in Medford are Management (3,735 | 9.4%), Community & Social Service (3,708 | 9.3%), Health Diagnosing & Treating (2,946 | 7.4%), Business & Financial (1,874 | 4.7%), and Health Technologists (1,764 | 4.4%).
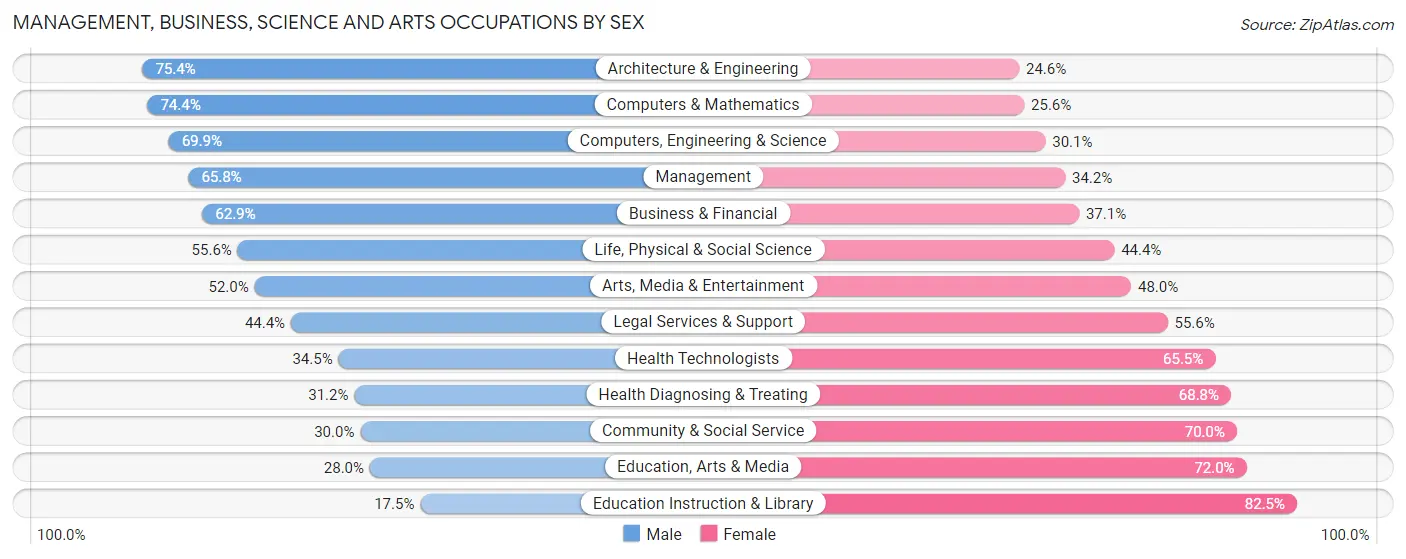
Management, Business, Science and Arts Occupations by Sex
Within the Management, Business, Science and Arts occupations in Medford, the most male-oriented occupations are Architecture & Engineering (75.4%), Computers & Mathematics (74.4%), and Computers, Engineering & Science (69.9%), while the most female-oriented occupations are Education Instruction & Library (82.5%), Education, Arts & Media (72.0%), and Community & Social Service (70.0%).
| Occupation | Male | Female |
| Management | 2,458 (65.8%) | 1,277 (34.2%) |
| Business & Financial | 1,179 (62.9%) | 695 (37.1%) |
| Computers, Engineering & Science | 935 (69.9%) | 402 (30.1%) |
| Computers & Mathematics | 377 (74.4%) | 130 (25.6%) |
| Architecture & Engineering | 368 (75.4%) | 120 (24.6%) |
| Life, Physical & Social Science | 190 (55.6%) | 152 (44.4%) |
| Community & Social Service | 1,112 (30.0%) | 2,596 (70.0%) |
| Education, Arts & Media | 362 (28.0%) | 932 (72.0%) |
| Legal Services & Support | 80 (44.4%) | 100 (55.6%) |
| Education Instruction & Library | 249 (17.5%) | 1,176 (82.5%) |
| Arts, Media & Entertainment | 421 (52.0%) | 388 (48.0%) |
| Health Diagnosing & Treating | 920 (31.2%) | 2,026 (68.8%) |
| Health Technologists | 609 (34.5%) | 1,155 (65.5%) |
| Total (Category) | 6,604 (48.6%) | 6,996 (51.4%) |
| Total (Overall) | 21,092 (53.1%) | 18,653 (46.9%) |
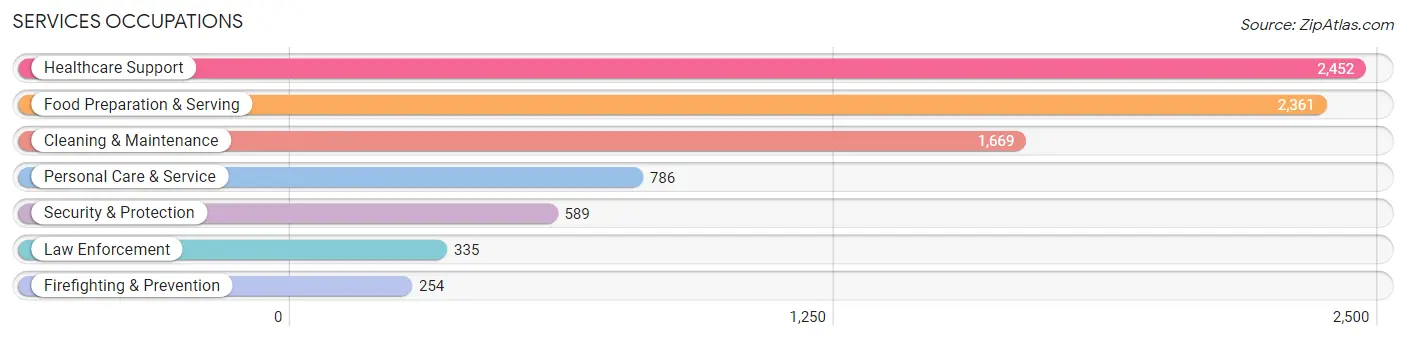
Services Occupations
The most common Services occupations in Medford are Healthcare Support (2,452 | 6.2%), Food Preparation & Serving (2,361 | 5.9%), Cleaning & Maintenance (1,669 | 4.2%), Personal Care & Service (786 | 2.0%), and Security & Protection (589 | 1.5%).
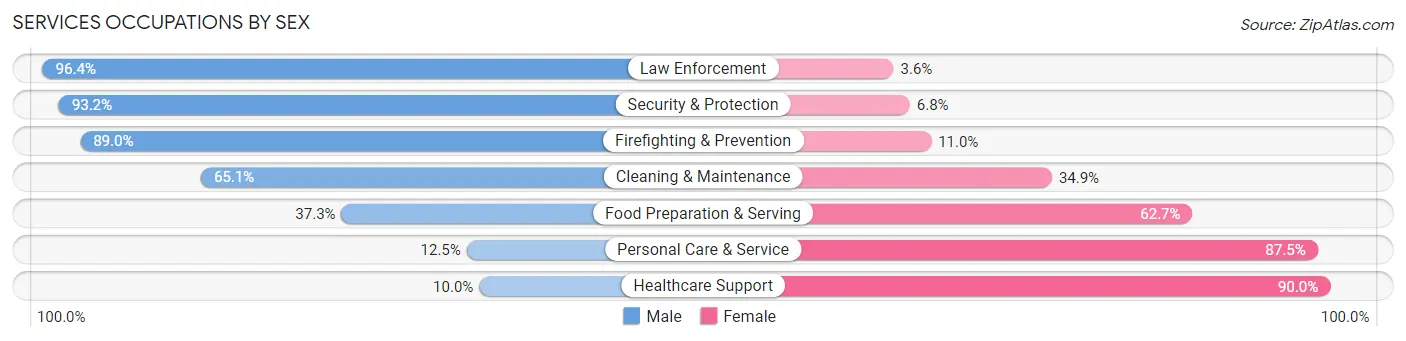
Services Occupations by Sex
Within the Services occupations in Medford, the most male-oriented occupations are Law Enforcement (96.4%), Security & Protection (93.2%), and Firefighting & Prevention (89.0%), while the most female-oriented occupations are Healthcare Support (90.0%), Personal Care & Service (87.5%), and Food Preparation & Serving (62.7%).
| Occupation | Male | Female |
| Healthcare Support | 245 (10.0%) | 2,207 (90.0%) |
| Security & Protection | 549 (93.2%) | 40 (6.8%) |
| Firefighting & Prevention | 226 (89.0%) | 28 (11.0%) |
| Law Enforcement | 323 (96.4%) | 12 (3.6%) |
| Food Preparation & Serving | 880 (37.3%) | 1,481 (62.7%) |
| Cleaning & Maintenance | 1,086 (65.1%) | 583 (34.9%) |
| Personal Care & Service | 98 (12.5%) | 688 (87.5%) |
| Total (Category) | 2,858 (36.4%) | 4,999 (63.6%) |
| Total (Overall) | 21,092 (53.1%) | 18,653 (46.9%) |
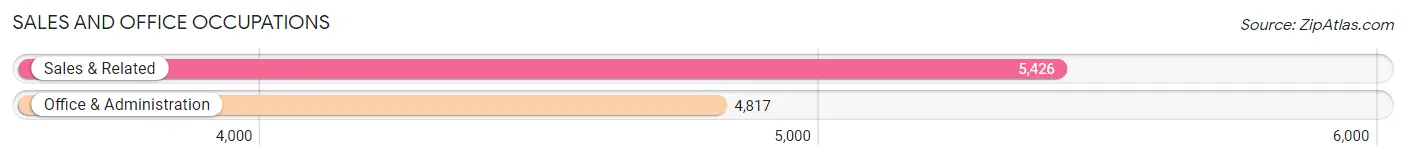
Sales and Office Occupations
The most common Sales and Office occupations in Medford are Sales & Related (5,426 | 13.7%), and Office & Administration (4,817 | 12.1%).
Sales and Office Occupations by Sex
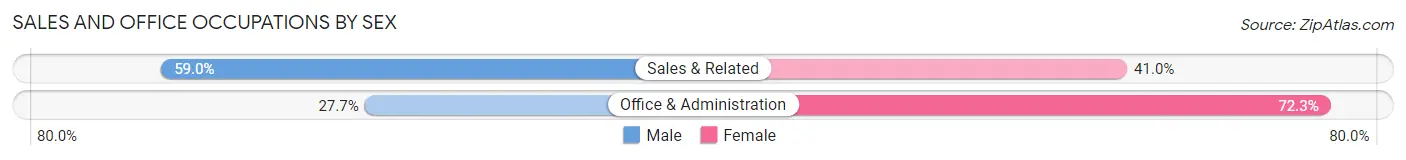
| Occupation | Male | Female |
| Sales & Related | 3,200 (59.0%) | 2,226 (41.0%) |
| Office & Administration | 1,335 (27.7%) | 3,482 (72.3%) |
| Total (Category) | 4,535 (44.3%) | 5,708 (55.7%) |
| Total (Overall) | 21,092 (53.1%) | 18,653 (46.9%) |
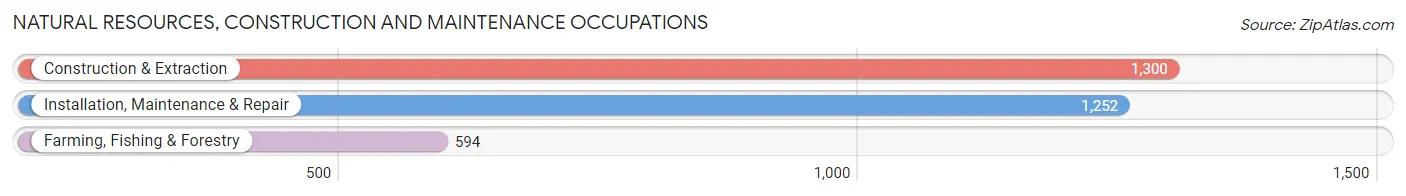
Natural Resources, Construction and Maintenance Occupations
The most common Natural Resources, Construction and Maintenance occupations in Medford are Construction & Extraction (1,300 | 3.3%), Installation, Maintenance & Repair (1,252 | 3.2%), and Farming, Fishing & Forestry (594 | 1.5%).
Natural Resources, Construction and Maintenance Occupations by Sex
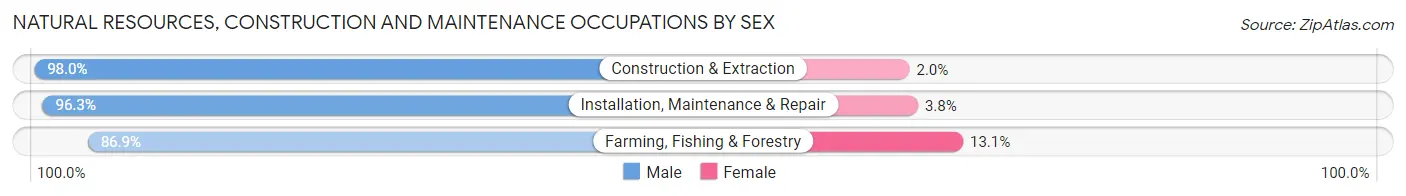
| Occupation | Male | Female |
| Farming, Fishing & Forestry | 516 (86.9%) | 78 (13.1%) |
| Construction & Extraction | 1,274 (98.0%) | 26 (2.0%) |
| Installation, Maintenance & Repair | 1,205 (96.3%) | 47 (3.7%) |
| Total (Category) | 2,995 (95.2%) | 151 (4.8%) |
| Total (Overall) | 21,092 (53.1%) | 18,653 (46.9%) |
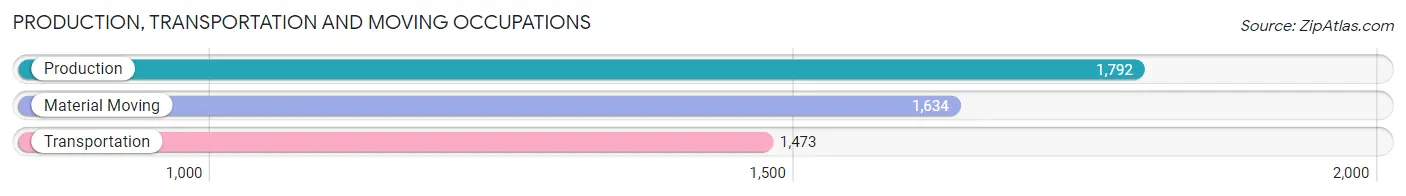
Production, Transportation and Moving Occupations
The most common Production, Transportation and Moving occupations in Medford are Production (1,792 | 4.5%), Material Moving (1,634 | 4.1%), and Transportation (1,473 | 3.7%).
Production, Transportation and Moving Occupations by Sex
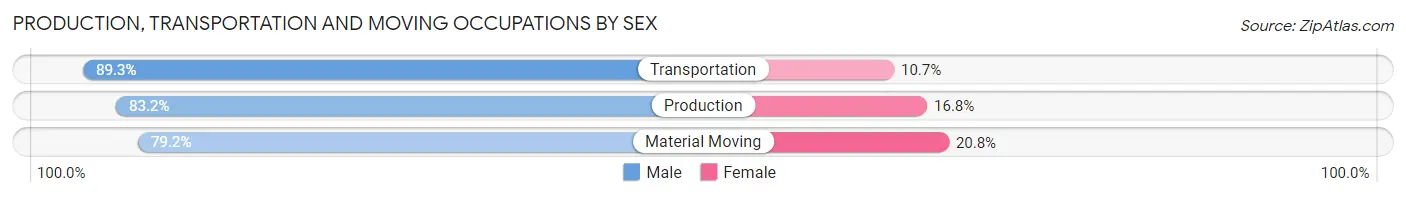
| Occupation | Male | Female |
| Production | 1,491 (83.2%) | 301 (16.8%) |
| Transportation | 1,315 (89.3%) | 158 (10.7%) |
| Material Moving | 1,294 (79.2%) | 340 (20.8%) |
| Total (Category) | 4,100 (83.7%) | 799 (16.3%) |
| Total (Overall) | 21,092 (53.1%) | 18,653 (46.9%) |
Employment Industries by Sex in Medford
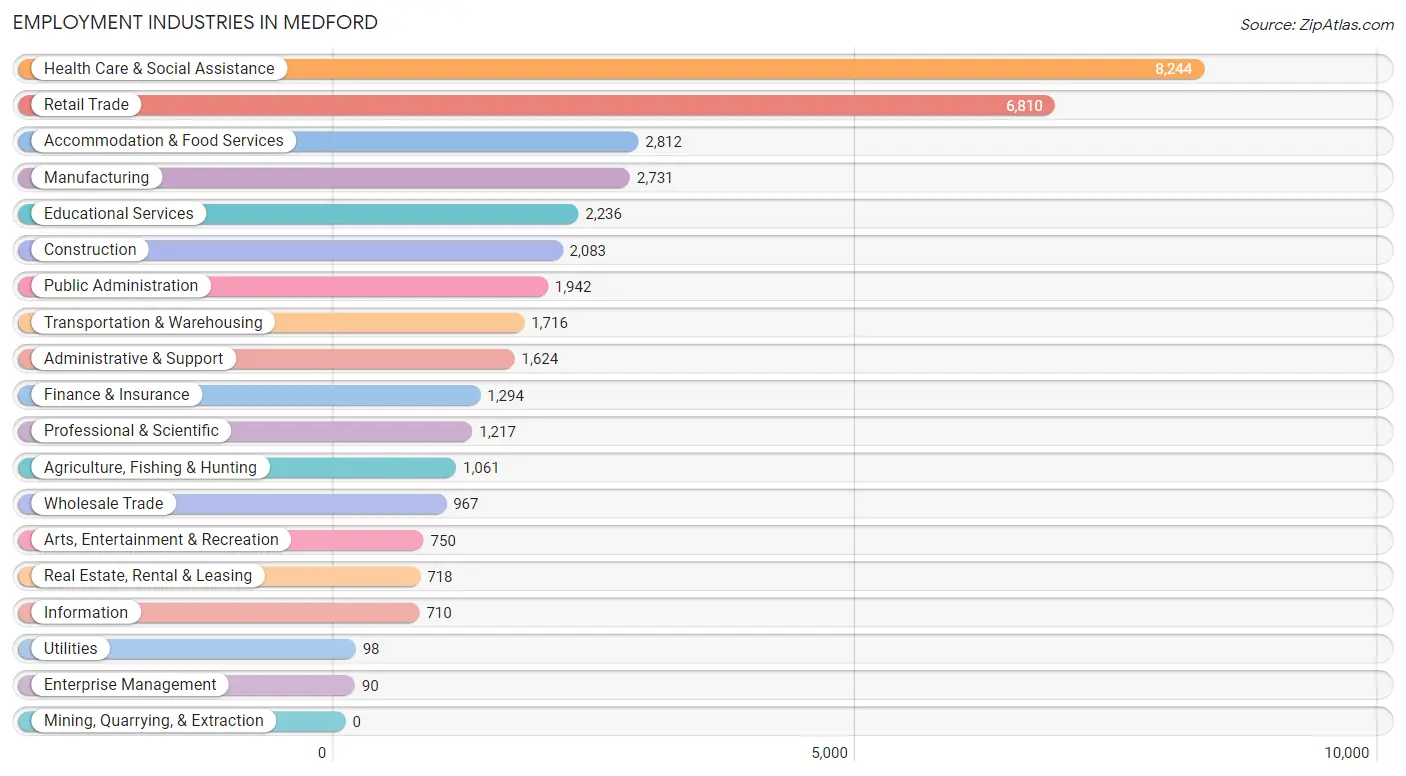
Employment Industries in Medford
The major employment industries in Medford include Health Care & Social Assistance (8,244 | 20.7%), Retail Trade (6,810 | 17.1%), Accommodation & Food Services (2,812 | 7.1%), Manufacturing (2,731 | 6.9%), and Educational Services (2,236 | 5.6%).
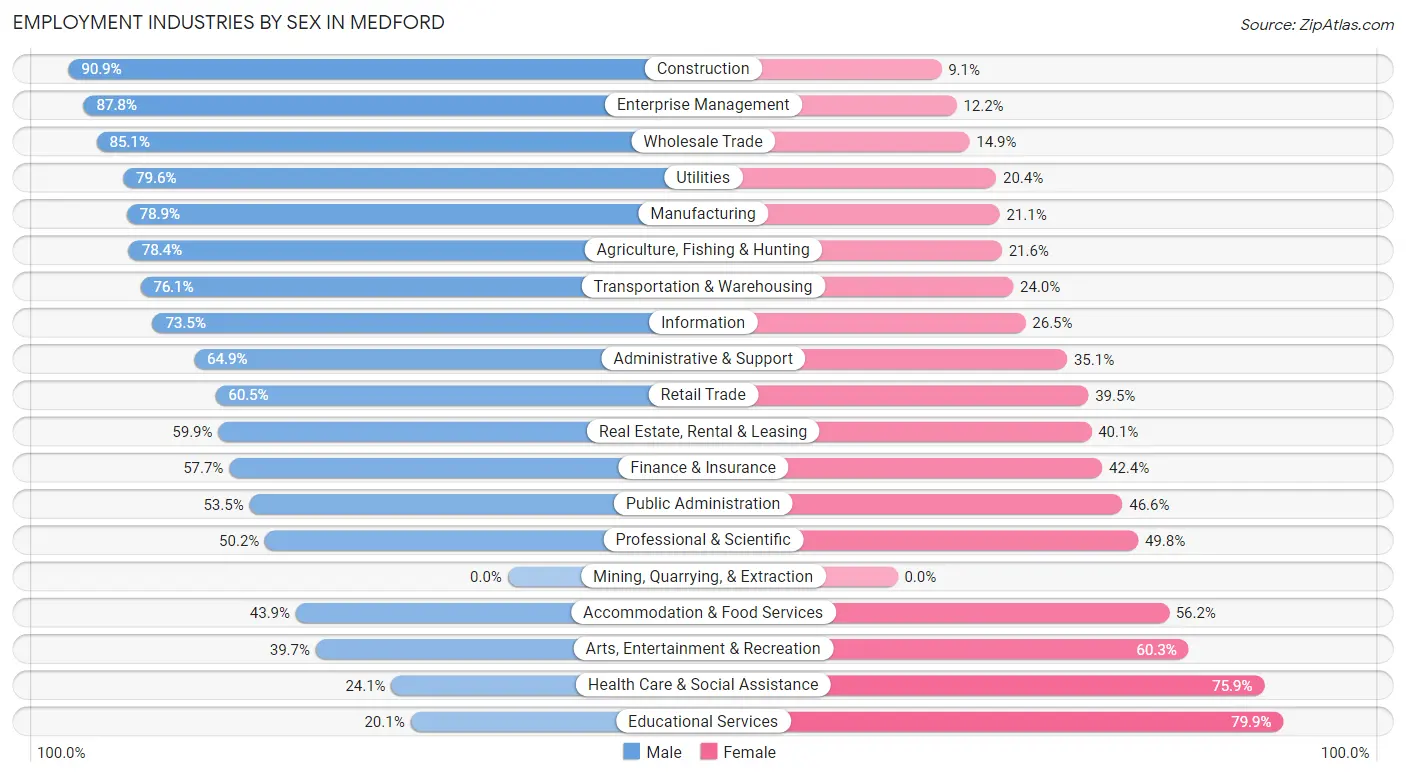
Employment Industries by Sex in Medford
The Medford industries that see more men than women are Construction (90.9%), Enterprise Management (87.8%), and Wholesale Trade (85.1%), whereas the industries that tend to have a higher number of women are Educational Services (79.9%), Health Care & Social Assistance (75.9%), and Arts, Entertainment & Recreation (60.3%).
| Industry | Male | Female |
| Agriculture, Fishing & Hunting | 832 (78.4%) | 229 (21.6%) |
| Mining, Quarrying, & Extraction | 0 (0.0%) | 0 (0.0%) |
| Construction | 1,894 (90.9%) | 189 (9.1%) |
| Manufacturing | 2,154 (78.9%) | 577 (21.1%) |
| Wholesale Trade | 823 (85.1%) | 144 (14.9%) |
| Retail Trade | 4,121 (60.5%) | 2,689 (39.5%) |
| Transportation & Warehousing | 1,305 (76.0%) | 411 (23.9%) |
| Utilities | 78 (79.6%) | 20 (20.4%) |
| Information | 522 (73.5%) | 188 (26.5%) |
| Finance & Insurance | 746 (57.7%) | 548 (42.3%) |
| Real Estate, Rental & Leasing | 430 (59.9%) | 288 (40.1%) |
| Professional & Scientific | 611 (50.2%) | 606 (49.8%) |
| Enterprise Management | 79 (87.8%) | 11 (12.2%) |
| Administrative & Support | 1,054 (64.9%) | 570 (35.1%) |
| Educational Services | 450 (20.1%) | 1,786 (79.9%) |
| Health Care & Social Assistance | 1,984 (24.1%) | 6,260 (75.9%) |
| Arts, Entertainment & Recreation | 298 (39.7%) | 452 (60.3%) |
| Accommodation & Food Services | 1,233 (43.9%) | 1,579 (56.1%) |
| Public Administration | 1,038 (53.4%) | 904 (46.6%) |
| Total | 21,092 (53.1%) | 18,653 (46.9%) |
Education in Medford
School Enrollment in Medford
The most common levels of schooling among the 19,119 students in Medford are elementary school (4,495 | 23.5%), high school (4,462 | 23.3%), and middle school (4,361 | 22.8%).
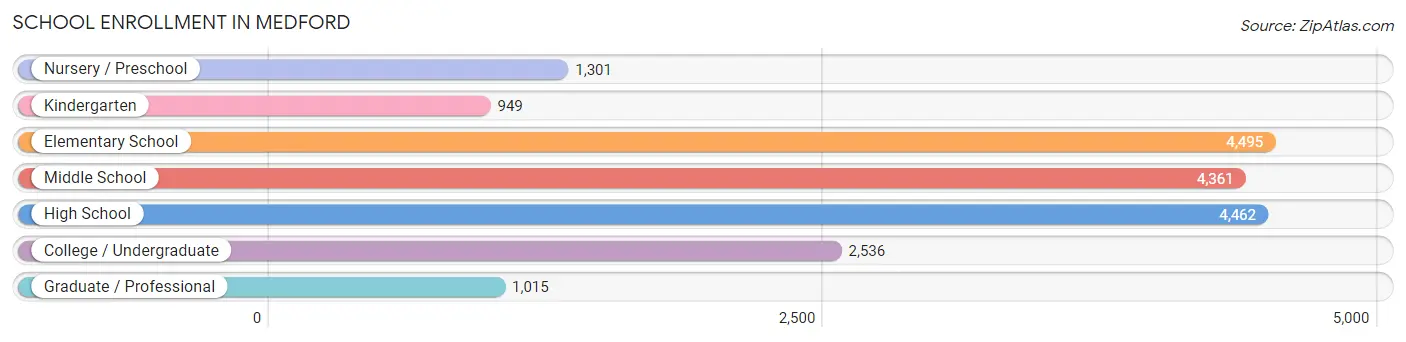
| School Level | # Students | % Students |
| Nursery / Preschool | 1,301 | 6.8% |
| Kindergarten | 949 | 5.0% |
| Elementary School | 4,495 | 23.5% |
| Middle School | 4,361 | 22.8% |
| High School | 4,462 | 23.3% |
| College / Undergraduate | 2,536 | 13.3% |
| Graduate / Professional | 1,015 | 5.3% |
| Total | 19,119 | 100.0% |
School Enrollment by Age by Funding Source in Medford
Out of a total of 19,119 students who are enrolled in schools in Medford, 3,059 (16.0%) attend a private institution, while the remaining 16,060 (84.0%) are enrolled in public schools. The age group of 3 to 4 year olds has the highest likelihood of being enrolled in private schools, with 482 (51.2% in the age bracket) enrolled. Conversely, the age group of 18 to 19 year olds has the lowest likelihood of being enrolled in a private school, with 1,152 (89.2% in the age bracket) attending a public institution.
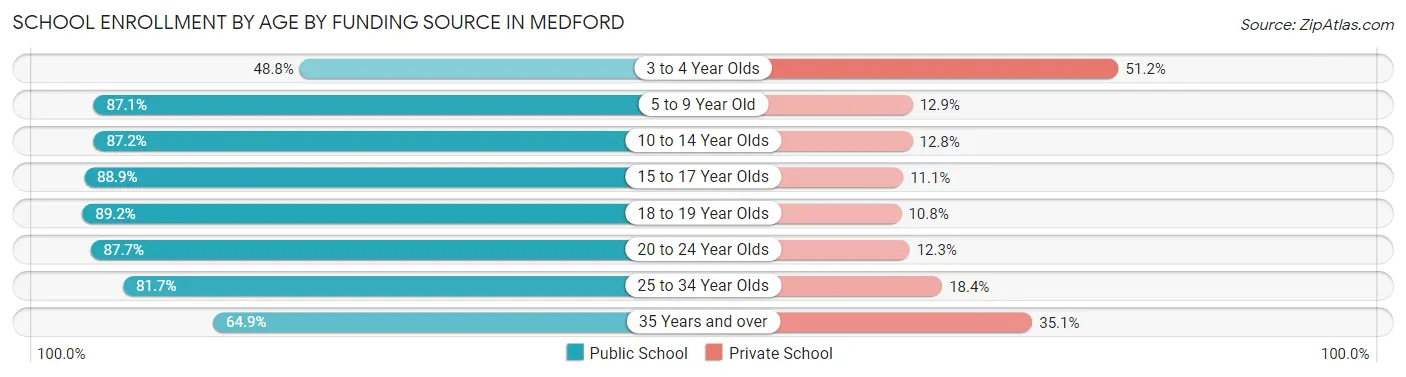
| Age Bracket | Public School | Private School |
| 3 to 4 Year Olds | 459 (48.8%) | 482 (51.2%) |
| 5 to 9 Year Old | 4,451 (87.1%) | 657 (12.9%) |
| 10 to 14 Year Olds | 4,893 (87.2%) | 720 (12.8%) |
| 15 to 17 Year Olds | 2,758 (88.9%) | 344 (11.1%) |
| 18 to 19 Year Olds | 1,152 (89.2%) | 139 (10.8%) |
| 20 to 24 Year Olds | 841 (87.7%) | 118 (12.3%) |
| 25 to 34 Year Olds | 703 (81.7%) | 158 (18.3%) |
| 35 Years and over | 807 (64.9%) | 437 (35.1%) |
| Total | 16,060 (84.0%) | 3,059 (16.0%) |
Educational Attainment by Field of Study in Medford
Business (2,802 | 14.7%), science & technology (2,103 | 11.0%), social sciences (1,975 | 10.3%), education (1,938 | 10.1%), and bio, nature & agricultural (1,377 | 7.2%) are the most common fields of study among 19,114 individuals in Medford who have obtained a bachelor's degree or higher.
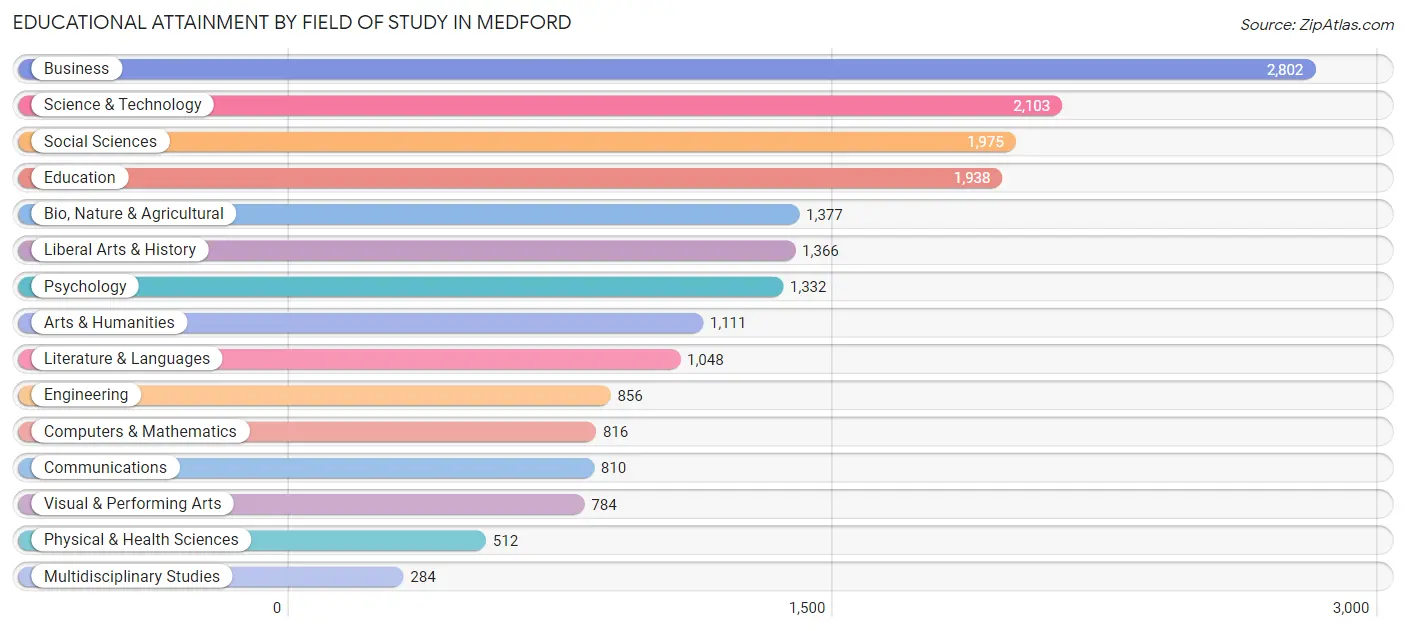
| Field of Study | # Graduates | % Graduates |
| Computers & Mathematics | 816 | 4.3% |
| Bio, Nature & Agricultural | 1,377 | 7.2% |
| Physical & Health Sciences | 512 | 2.7% |
| Psychology | 1,332 | 7.0% |
| Social Sciences | 1,975 | 10.3% |
| Engineering | 856 | 4.5% |
| Multidisciplinary Studies | 284 | 1.5% |
| Science & Technology | 2,103 | 11.0% |
| Business | 2,802 | 14.7% |
| Education | 1,938 | 10.1% |
| Literature & Languages | 1,048 | 5.5% |
| Liberal Arts & History | 1,366 | 7.1% |
| Visual & Performing Arts | 784 | 4.1% |
| Communications | 810 | 4.2% |
| Arts & Humanities | 1,111 | 5.8% |
| Total | 19,114 | 100.0% |
Transportation & Commute in Medford
Vehicle Availability by Sex in Medford
The most prevalent vehicle ownership categories in Medford are males with 2 vehicles (7,570, accounting for 36.7%) and females with 2 vehicles (7,250, making up 41.6%).
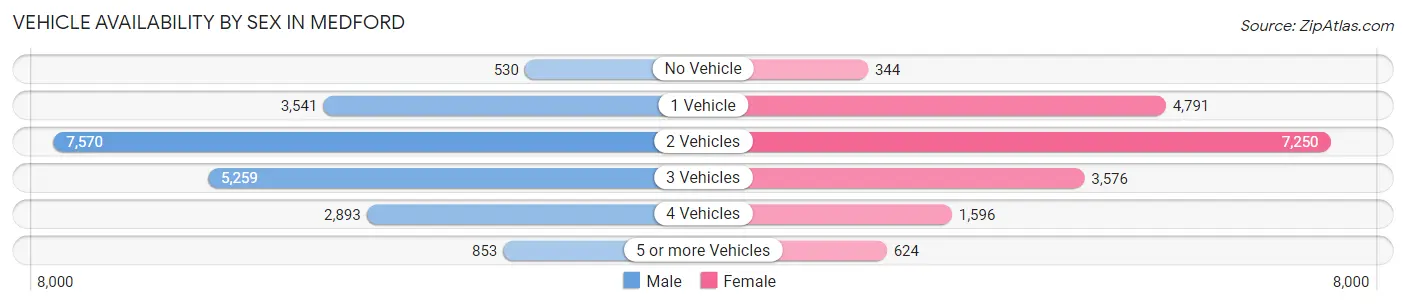
| Vehicles Available | Male | Female |
| No Vehicle | 530 (2.6%) | 344 (1.9%) |
| 1 Vehicle | 3,541 (17.2%) | 4,791 (26.4%) |
| 2 Vehicles | 7,570 (36.7%) | 7,250 (39.9%) |
| 3 Vehicles | 5,259 (25.5%) | 3,576 (19.7%) |
| 4 Vehicles | 2,893 (14.0%) | 1,596 (8.8%) |
| 5 or more Vehicles | 853 (4.1%) | 624 (3.4%) |
| Total | 20,646 (100.0%) | 18,181 (100.0%) |
Commute Time in Medford
The most frequently occuring commute durations in Medford are 15 to 19 minutes (9,452 commuters, 26.8%), 10 to 14 minutes (9,143 commuters, 25.9%), and 5 to 9 minutes (5,740 commuters, 16.3%).
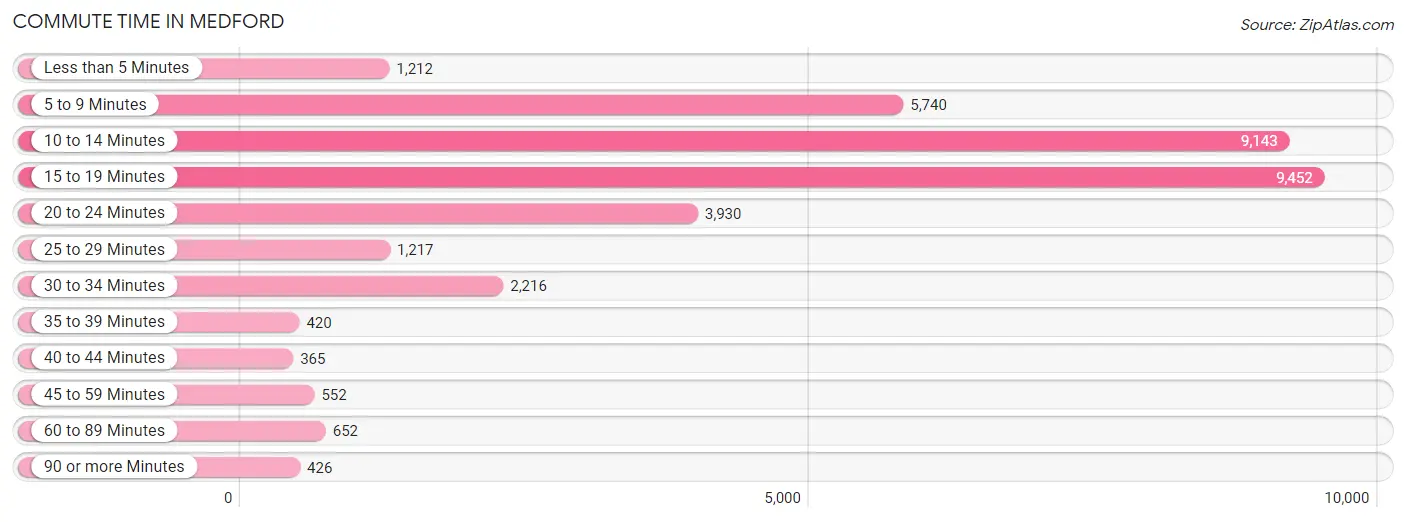
| Commute Time | # Commuters | % Commuters |
| Less than 5 Minutes | 1,212 | 3.4% |
| 5 to 9 Minutes | 5,740 | 16.3% |
| 10 to 14 Minutes | 9,143 | 25.9% |
| 15 to 19 Minutes | 9,452 | 26.8% |
| 20 to 24 Minutes | 3,930 | 11.1% |
| 25 to 29 Minutes | 1,217 | 3.5% |
| 30 to 34 Minutes | 2,216 | 6.3% |
| 35 to 39 Minutes | 420 | 1.2% |
| 40 to 44 Minutes | 365 | 1.0% |
| 45 to 59 Minutes | 552 | 1.6% |
| 60 to 89 Minutes | 652 | 1.8% |
| 90 or more Minutes | 426 | 1.2% |
Commute Time by Sex in Medford
The most common commute times in Medford are 15 to 19 minutes (5,074 commuters, 26.4%) for males and 10 to 14 minutes (4,451 commuters, 27.6%) for females.
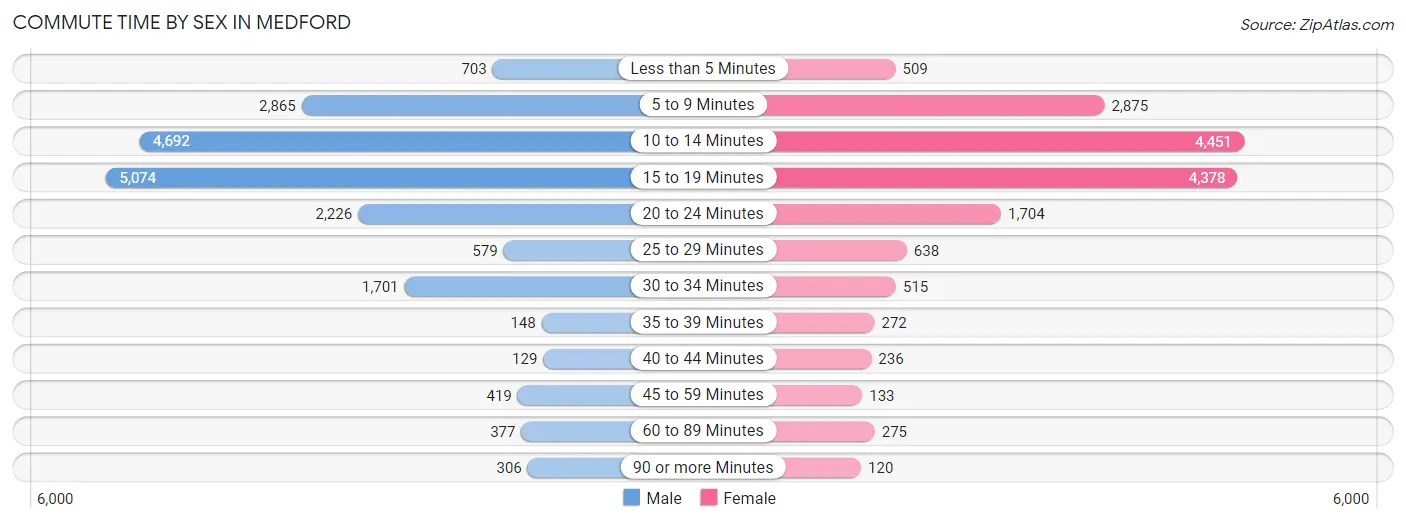
| Commute Time | Male | Female |
| Less than 5 Minutes | 703 (3.7%) | 509 (3.2%) |
| 5 to 9 Minutes | 2,865 (14.9%) | 2,875 (17.8%) |
| 10 to 14 Minutes | 4,692 (24.4%) | 4,451 (27.6%) |
| 15 to 19 Minutes | 5,074 (26.4%) | 4,378 (27.2%) |
| 20 to 24 Minutes | 2,226 (11.6%) | 1,704 (10.6%) |
| 25 to 29 Minutes | 579 (3.0%) | 638 (4.0%) |
| 30 to 34 Minutes | 1,701 (8.8%) | 515 (3.2%) |
| 35 to 39 Minutes | 148 (0.8%) | 272 (1.7%) |
| 40 to 44 Minutes | 129 (0.7%) | 236 (1.5%) |
| 45 to 59 Minutes | 419 (2.2%) | 133 (0.8%) |
| 60 to 89 Minutes | 377 (2.0%) | 275 (1.7%) |
| 90 or more Minutes | 306 (1.6%) | 120 (0.7%) |
Time of Departure to Work by Sex in Medford
The most frequent times of departure to work in Medford are 7:00 AM to 7:29 AM (2,554, 13.3%) for males and 7:30 AM to 7:59 AM (3,779, 23.5%) for females.
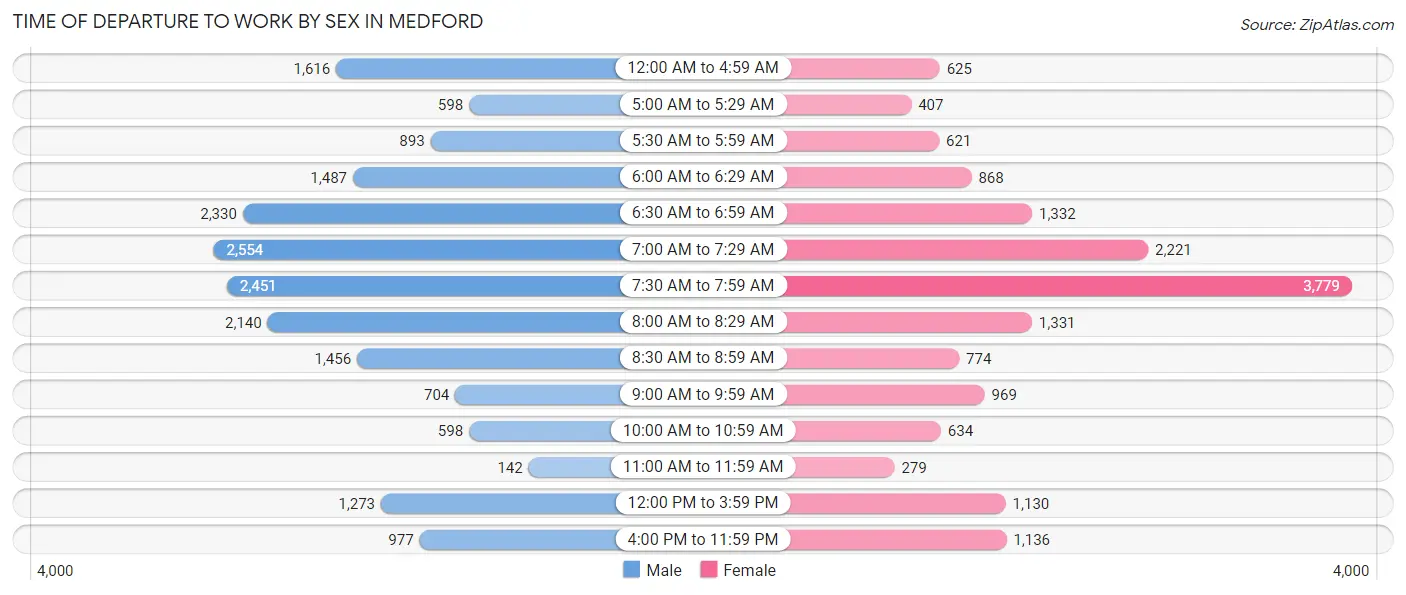
| Time of Departure | Male | Female |
| 12:00 AM to 4:59 AM | 1,616 (8.4%) | 625 (3.9%) |
| 5:00 AM to 5:29 AM | 598 (3.1%) | 407 (2.5%) |
| 5:30 AM to 5:59 AM | 893 (4.6%) | 621 (3.9%) |
| 6:00 AM to 6:29 AM | 1,487 (7.7%) | 868 (5.4%) |
| 6:30 AM to 6:59 AM | 2,330 (12.1%) | 1,332 (8.3%) |
| 7:00 AM to 7:29 AM | 2,554 (13.3%) | 2,221 (13.8%) |
| 7:30 AM to 7:59 AM | 2,451 (12.8%) | 3,779 (23.5%) |
| 8:00 AM to 8:29 AM | 2,140 (11.1%) | 1,331 (8.3%) |
| 8:30 AM to 8:59 AM | 1,456 (7.6%) | 774 (4.8%) |
| 9:00 AM to 9:59 AM | 704 (3.7%) | 969 (6.0%) |
| 10:00 AM to 10:59 AM | 598 (3.1%) | 634 (3.9%) |
| 11:00 AM to 11:59 AM | 142 (0.7%) | 279 (1.7%) |
| 12:00 PM to 3:59 PM | 1,273 (6.6%) | 1,130 (7.0%) |
| 4:00 PM to 11:59 PM | 977 (5.1%) | 1,136 (7.0%) |
| Total | 19,219 (100.0%) | 16,106 (100.0%) |
Housing Occupancy in Medford
Occupancy by Ownership in Medford
Of the total 34,127 dwellings in Medford, owner-occupied units account for 18,677 (54.7%), while renter-occupied units make up 15,450 (45.3%).
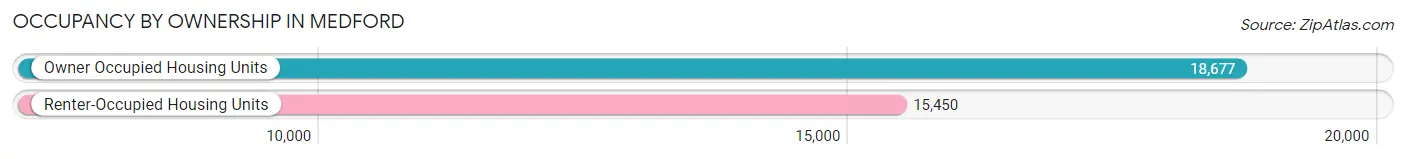
| Occupancy | # Housing Units | % Housing Units |
| Owner Occupied Housing Units | 18,677 | 54.7% |
| Renter-Occupied Housing Units | 15,450 | 45.3% |
| Total Occupied Housing Units | 34,127 | 100.0% |
Occupancy by Household Size in Medford
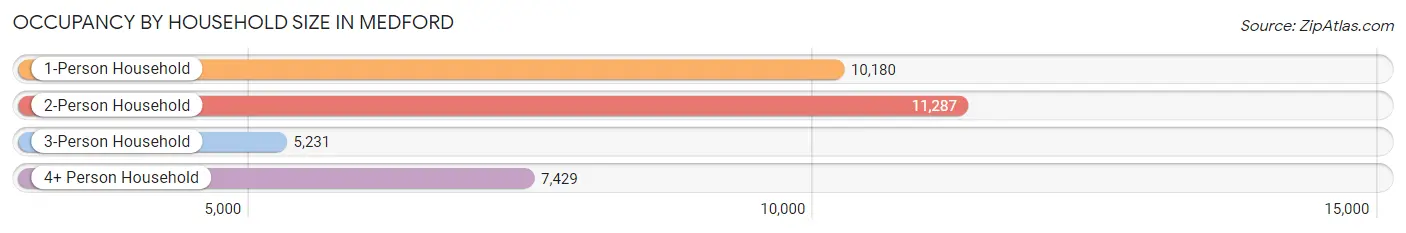
| Household Size | # Housing Units | % Housing Units |
| 1-Person Household | 10,180 | 29.8% |
| 2-Person Household | 11,287 | 33.1% |
| 3-Person Household | 5,231 | 15.3% |
| 4+ Person Household | 7,429 | 21.8% |
| Total Housing Units | 34,127 | 100.0% |
Occupancy by Ownership by Household Size in Medford
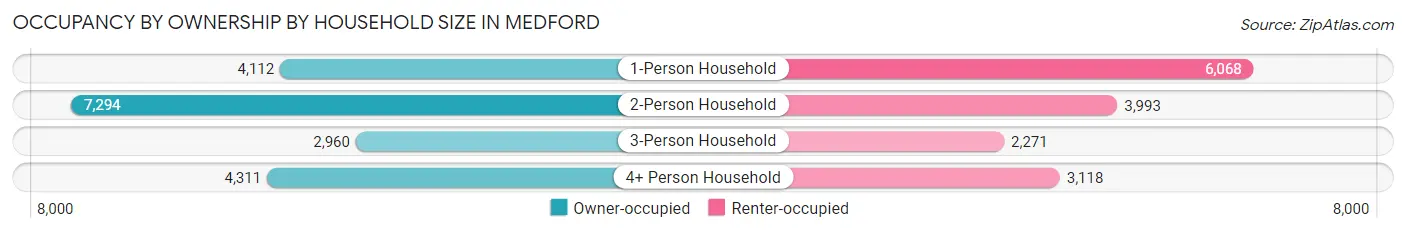
| Household Size | Owner-occupied | Renter-occupied |
| 1-Person Household | 4,112 (40.4%) | 6,068 (59.6%) |
| 2-Person Household | 7,294 (64.6%) | 3,993 (35.4%) |
| 3-Person Household | 2,960 (56.6%) | 2,271 (43.4%) |
| 4+ Person Household | 4,311 (58.0%) | 3,118 (42.0%) |
| Total Housing Units | 18,677 (54.7%) | 15,450 (45.3%) |
Occupancy by Educational Attainment in Medford
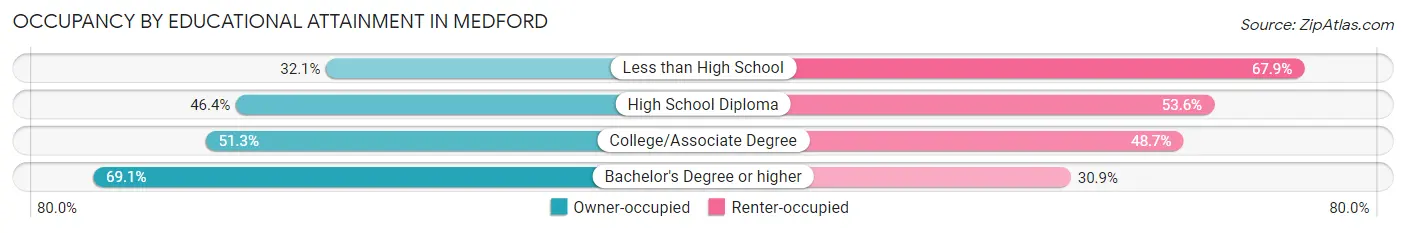
| Household Size | Owner-occupied | Renter-occupied |
| Less than High School | 691 (32.1%) | 1,459 (67.9%) |
| High School Diploma | 3,619 (46.4%) | 4,174 (53.6%) |
| College/Associate Degree | 6,761 (51.3%) | 6,420 (48.7%) |
| Bachelor's Degree or higher | 7,606 (69.1%) | 3,397 (30.9%) |
Occupancy by Age of Householder in Medford
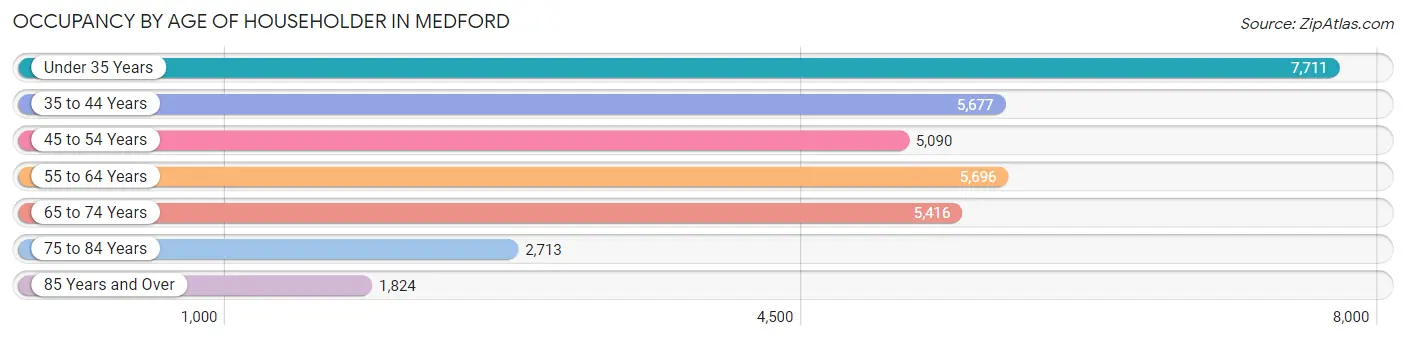
| Age Bracket | # Households | % Households |
| Under 35 Years | 7,711 | 22.6% |
| 35 to 44 Years | 5,677 | 16.6% |
| 45 to 54 Years | 5,090 | 14.9% |
| 55 to 64 Years | 5,696 | 16.7% |
| 65 to 74 Years | 5,416 | 15.9% |
| 75 to 84 Years | 2,713 | 8.0% |
| 85 Years and Over | 1,824 | 5.3% |
| Total | 34,127 | 100.0% |
Housing Finances in Medford
Median Income by Occupancy in Medford
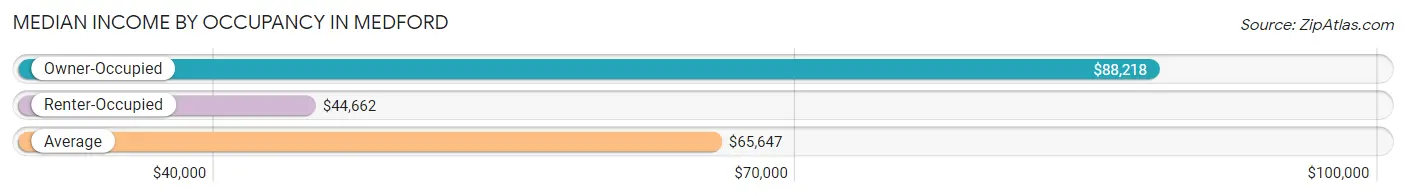
| Occupancy Type | # Households | Median Income |
| Owner-Occupied | 18,677 (54.7%) | $88,218 |
| Renter-Occupied | 15,450 (45.3%) | $44,662 |
| Average | 34,127 (100.0%) | $65,647 |
Occupancy by Householder Income Bracket in Medford
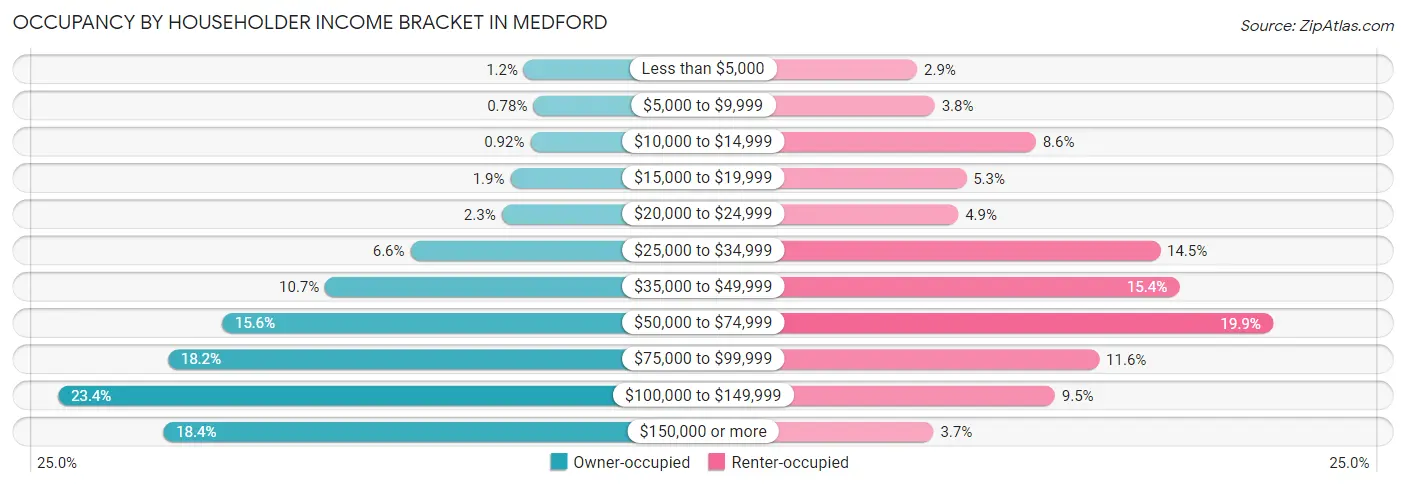
| Income Bracket | Owner-occupied | Renter-occupied |
| Less than $5,000 | 230 (1.2%) | 453 (2.9%) |
| $5,000 to $9,999 | 146 (0.8%) | 583 (3.8%) |
| $10,000 to $14,999 | 171 (0.9%) | 1,326 (8.6%) |
| $15,000 to $19,999 | 350 (1.9%) | 814 (5.3%) |
| $20,000 to $24,999 | 427 (2.3%) | 755 (4.9%) |
| $25,000 to $34,999 | 1,238 (6.6%) | 2,241 (14.5%) |
| $35,000 to $49,999 | 1,996 (10.7%) | 2,379 (15.4%) |
| $50,000 to $74,999 | 2,915 (15.6%) | 3,068 (19.9%) |
| $75,000 to $99,999 | 3,395 (18.2%) | 1,792 (11.6%) |
| $100,000 to $149,999 | 4,372 (23.4%) | 1,466 (9.5%) |
| $150,000 or more | 3,437 (18.4%) | 573 (3.7%) |
| Total | 18,677 (100.0%) | 15,450 (100.0%) |
Monthly Housing Cost Tiers in Medford
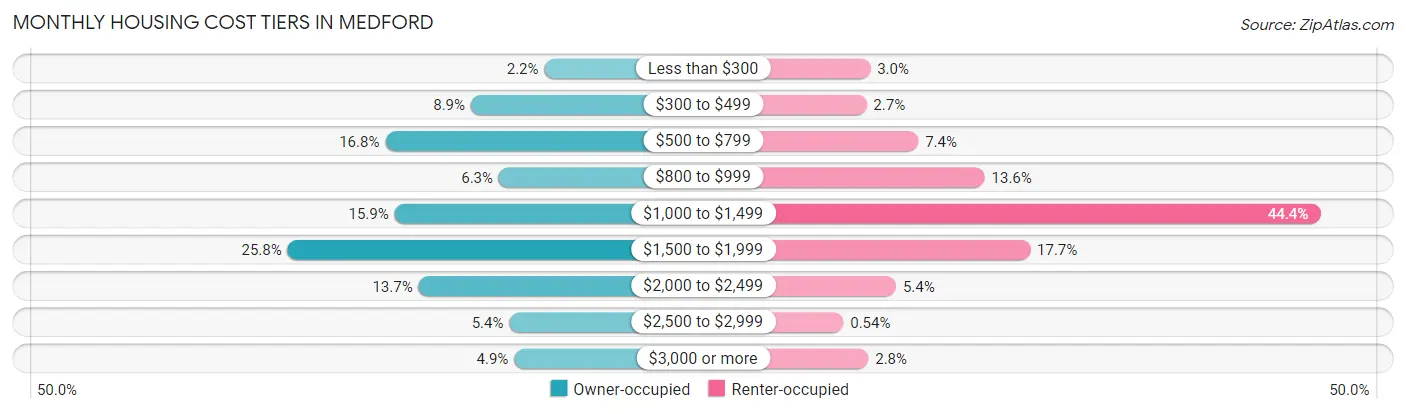
| Monthly Cost | Owner-occupied | Renter-occupied |
| Less than $300 | 401 (2.1%) | 467 (3.0%) |
| $300 to $499 | 1,666 (8.9%) | 413 (2.7%) |
| $500 to $799 | 3,137 (16.8%) | 1,149 (7.4%) |
| $800 to $999 | 1,185 (6.3%) | 2,093 (13.6%) |
| $1,000 to $1,499 | 2,978 (15.9%) | 6,864 (44.4%) |
| $1,500 to $1,999 | 4,817 (25.8%) | 2,741 (17.7%) |
| $2,000 to $2,499 | 2,567 (13.7%) | 832 (5.4%) |
| $2,500 to $2,999 | 1,005 (5.4%) | 84 (0.5%) |
| $3,000 or more | 921 (4.9%) | 439 (2.8%) |
| Total | 18,677 (100.0%) | 15,450 (100.0%) |
Physical Housing Characteristics in Medford
Housing Structures in Medford
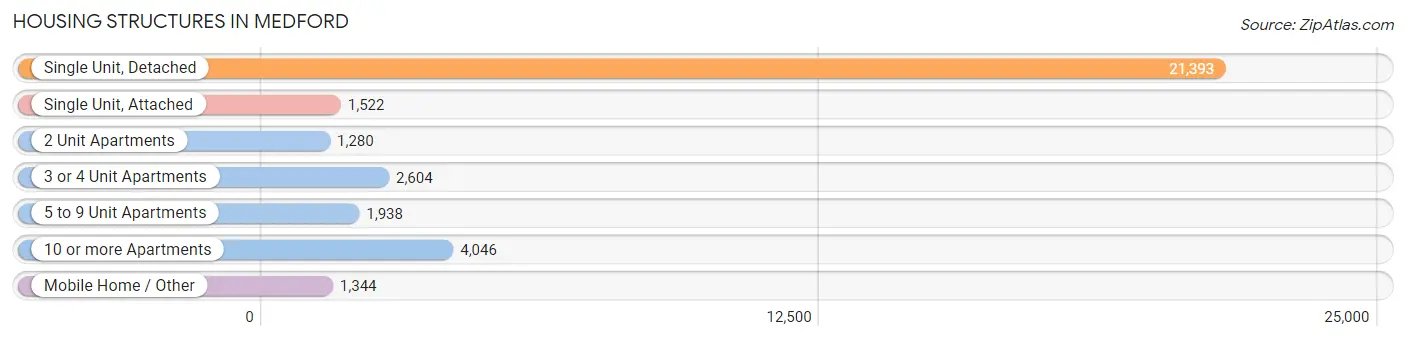
| Structure Type | # Housing Units | % Housing Units |
| Single Unit, Detached | 21,393 | 62.7% |
| Single Unit, Attached | 1,522 | 4.5% |
| 2 Unit Apartments | 1,280 | 3.7% |
| 3 or 4 Unit Apartments | 2,604 | 7.6% |
| 5 to 9 Unit Apartments | 1,938 | 5.7% |
| 10 or more Apartments | 4,046 | 11.9% |
| Mobile Home / Other | 1,344 | 3.9% |
| Total | 34,127 | 100.0% |
Housing Structures by Occupancy in Medford
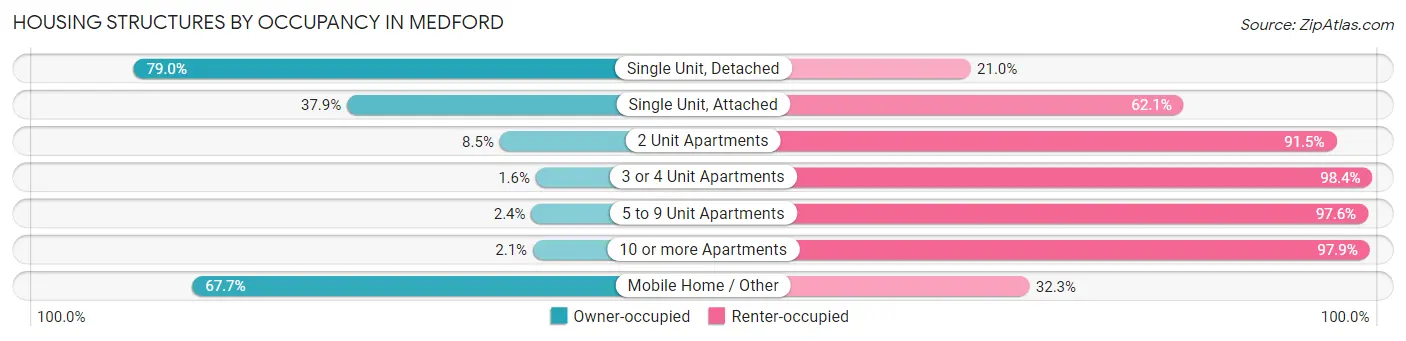
| Structure Type | Owner-occupied | Renter-occupied |
| Single Unit, Detached | 16,907 (79.0%) | 4,486 (21.0%) |
| Single Unit, Attached | 577 (37.9%) | 945 (62.1%) |
| 2 Unit Apartments | 109 (8.5%) | 1,171 (91.5%) |
| 3 or 4 Unit Apartments | 41 (1.6%) | 2,563 (98.4%) |
| 5 to 9 Unit Apartments | 47 (2.4%) | 1,891 (97.6%) |
| 10 or more Apartments | 86 (2.1%) | 3,960 (97.9%) |
| Mobile Home / Other | 910 (67.7%) | 434 (32.3%) |
| Total | 18,677 (54.7%) | 15,450 (45.3%) |
Housing Structures by Number of Rooms in Medford
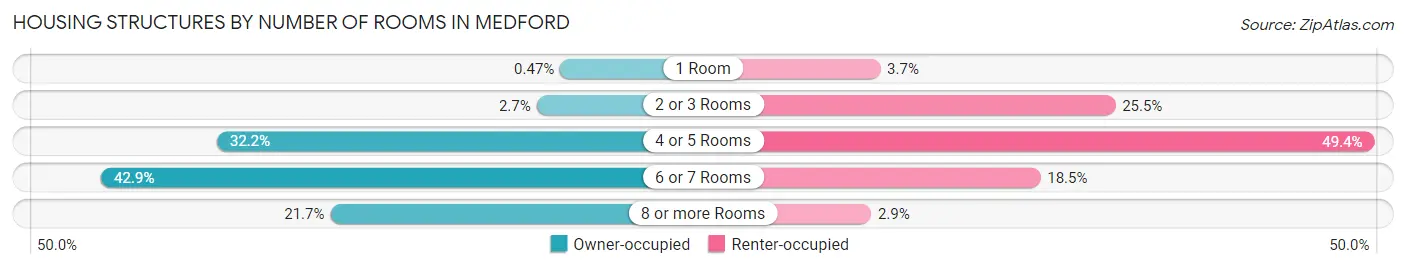
| Number of Rooms | Owner-occupied | Renter-occupied |
| 1 Room | 88 (0.5%) | 574 (3.7%) |
| 2 or 3 Rooms | 495 (2.6%) | 3,933 (25.5%) |
| 4 or 5 Rooms | 6,018 (32.2%) | 7,637 (49.4%) |
| 6 or 7 Rooms | 8,018 (42.9%) | 2,863 (18.5%) |
| 8 or more Rooms | 4,058 (21.7%) | 443 (2.9%) |
| Total | 18,677 (100.0%) | 15,450 (100.0%) |
Housing Structure by Heating Type in Medford
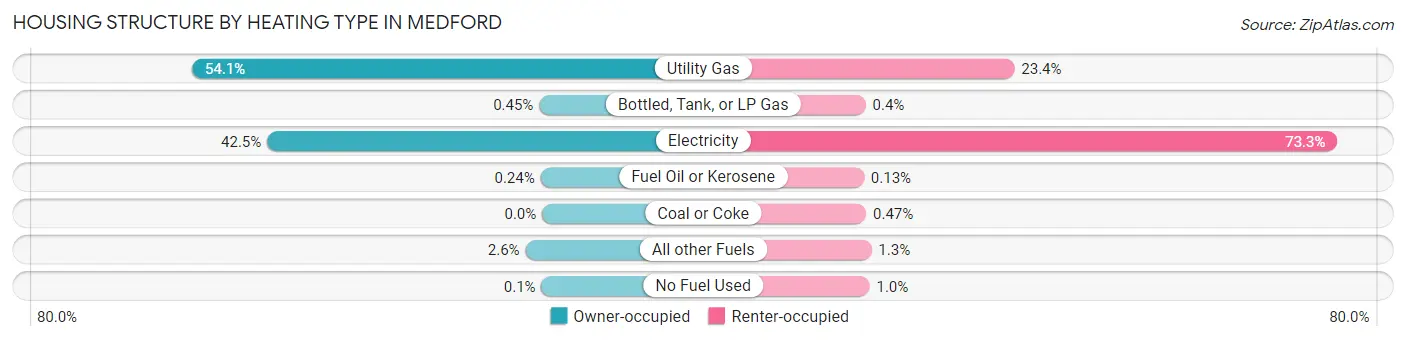
| Heating Type | Owner-occupied | Renter-occupied |
| Utility Gas | 10,109 (54.1%) | 3,613 (23.4%) |
| Bottled, Tank, or LP Gas | 84 (0.4%) | 62 (0.4%) |
| Electricity | 7,940 (42.5%) | 11,327 (73.3%) |
| Fuel Oil or Kerosene | 44 (0.2%) | 20 (0.1%) |
| Coal or Coke | 0 (0.0%) | 73 (0.5%) |
| All other Fuels | 482 (2.6%) | 200 (1.3%) |
| No Fuel Used | 18 (0.1%) | 155 (1.0%) |
| Total | 18,677 (100.0%) | 15,450 (100.0%) |
Household Vehicle Usage in Medford
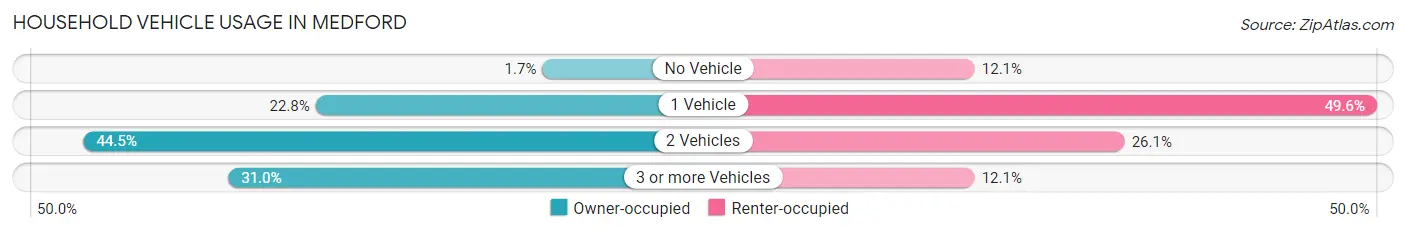
| Vehicles per Household | Owner-occupied | Renter-occupied |
| No Vehicle | 313 (1.7%) | 1,874 (12.1%) |
| 1 Vehicle | 4,265 (22.8%) | 7,669 (49.6%) |
| 2 Vehicles | 8,312 (44.5%) | 4,035 (26.1%) |
| 3 or more Vehicles | 5,787 (31.0%) | 1,872 (12.1%) |
| Total | 18,677 (100.0%) | 15,450 (100.0%) |
Real Estate & Mortgages in Medford
Real Estate and Mortgage Overview in Medford
| Characteristic | Without Mortgage | With Mortgage |
| Housing Units | 5,610 | 13,067 |
| Median Property Value | $346,300 | $358,500 |
| Median Household Income | $54,828 | $2,861 |
| Monthly Housing Costs | $576 | $896 |
| Real Estate Taxes | $2,946 | $196 |
Property Value by Mortgage Status in Medford
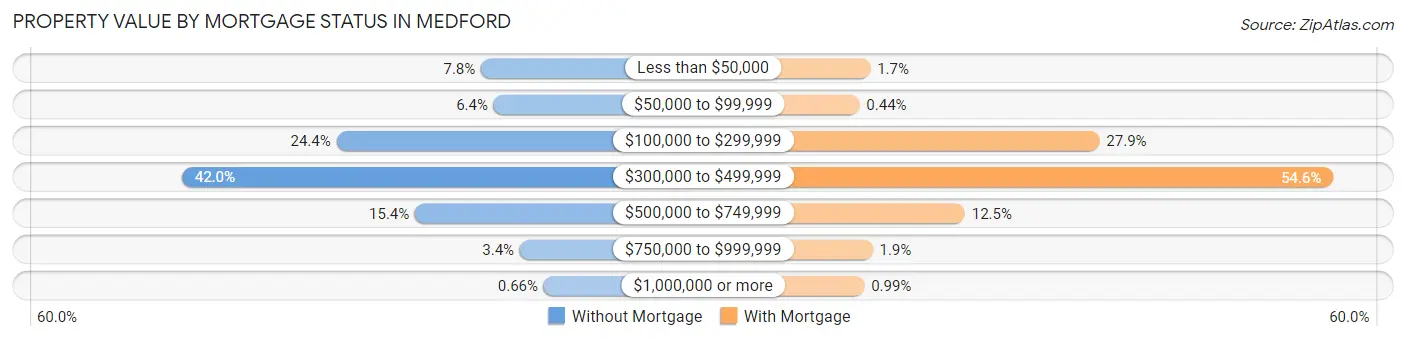
| Property Value | Without Mortgage | With Mortgage |
| Less than $50,000 | 439 (7.8%) | 220 (1.7%) |
| $50,000 to $99,999 | 358 (6.4%) | 57 (0.4%) |
| $100,000 to $299,999 | 1,366 (24.3%) | 3,642 (27.9%) |
| $300,000 to $499,999 | 2,358 (42.0%) | 7,133 (54.6%) |
| $500,000 to $749,999 | 862 (15.4%) | 1,632 (12.5%) |
| $750,000 to $999,999 | 190 (3.4%) | 253 (1.9%) |
| $1,000,000 or more | 37 (0.7%) | 130 (1.0%) |
| Total | 5,610 (100.0%) | 13,067 (100.0%) |
Household Income by Mortgage Status in Medford
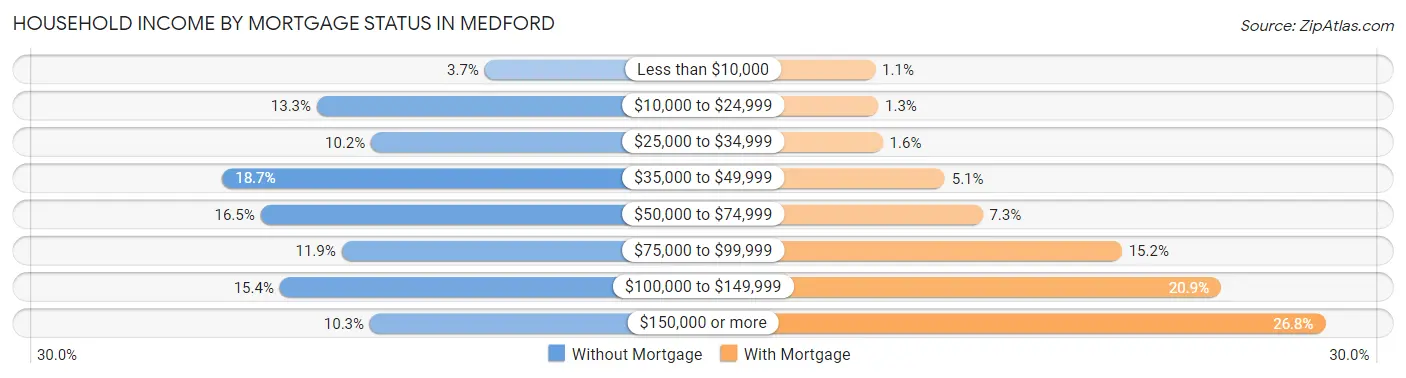
| Household Income | Without Mortgage | With Mortgage |
| Less than $10,000 | 208 (3.7%) | 147 (1.1%) |
| $10,000 to $24,999 | 746 (13.3%) | 168 (1.3%) |
| $25,000 to $34,999 | 572 (10.2%) | 202 (1.5%) |
| $35,000 to $49,999 | 1,049 (18.7%) | 666 (5.1%) |
| $50,000 to $74,999 | 927 (16.5%) | 947 (7.2%) |
| $75,000 to $99,999 | 667 (11.9%) | 1,988 (15.2%) |
| $100,000 to $149,999 | 865 (15.4%) | 2,728 (20.9%) |
| $150,000 or more | 576 (10.3%) | 3,507 (26.8%) |
| Total | 5,610 (100.0%) | 13,067 (100.0%) |
Property Value to Household Income Ratio in Medford
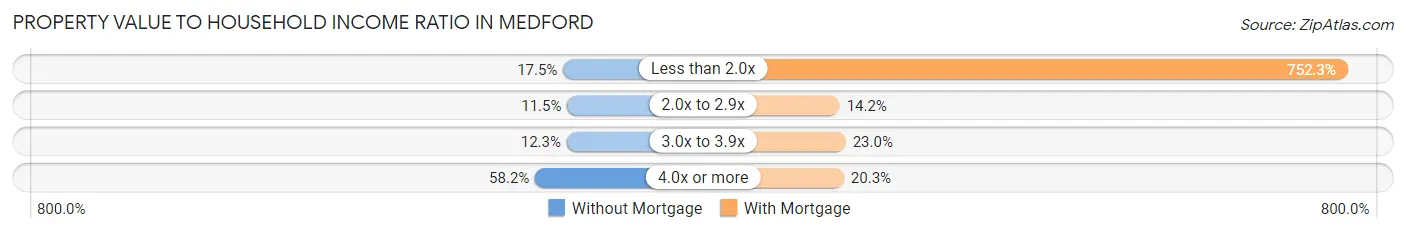
| Value-to-Income Ratio | Without Mortgage | With Mortgage |
| Less than 2.0x | 982 (17.5%) | 98,304 (752.3%) |
| 2.0x to 2.9x | 644 (11.5%) | 1,854 (14.2%) |
| 3.0x to 3.9x | 689 (12.3%) | 3,005 (23.0%) |
| 4.0x or more | 3,266 (58.2%) | 2,658 (20.3%) |
| Total | 5,610 (100.0%) | 13,067 (100.0%) |
Real Estate Taxes by Mortgage Status in Medford
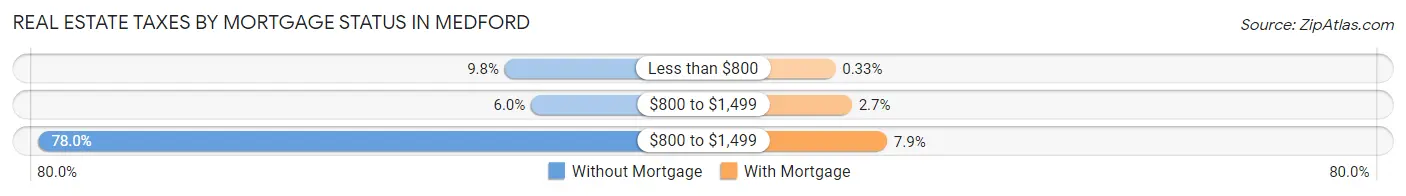
| Property Taxes | Without Mortgage | With Mortgage |
| Less than $800 | 552 (9.8%) | 43 (0.3%) |
| $800 to $1,499 | 336 (6.0%) | 357 (2.7%) |
| $800 to $1,499 | 4,374 (78.0%) | 1,029 (7.9%) |
| Total | 5,610 (100.0%) | 13,067 (100.0%) |
Health & Disability in Medford
Health Insurance Coverage by Age in Medford
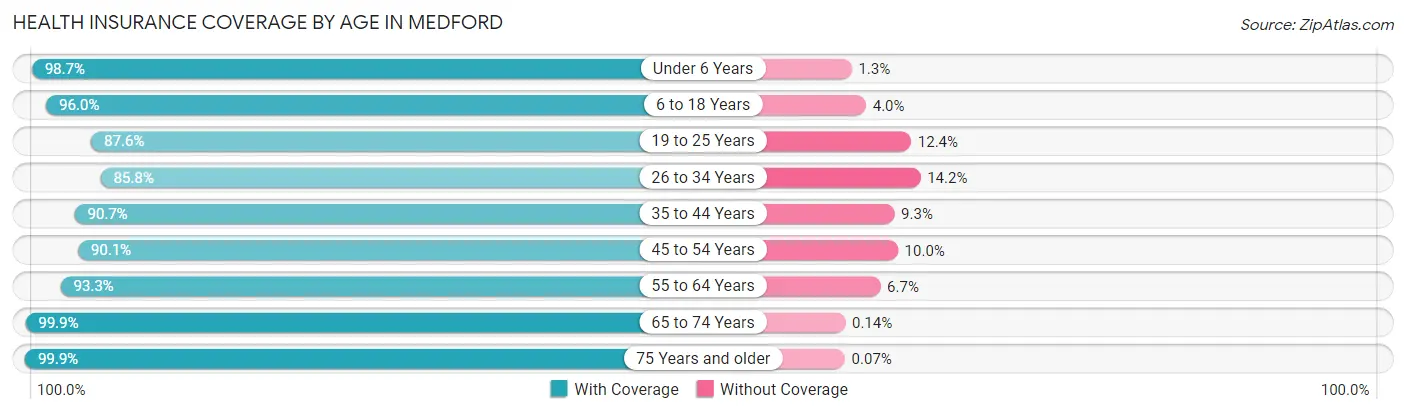
| Age Bracket | With Coverage | Without Coverage |
| Under 6 Years | 5,617 (98.7%) | 76 (1.3%) |
| 6 to 18 Years | 14,237 (96.0%) | 594 (4.0%) |
| 19 to 25 Years | 5,886 (87.6%) | 834 (12.4%) |
| 26 to 34 Years | 10,233 (85.8%) | 1,688 (14.2%) |
| 35 to 44 Years | 9,804 (90.7%) | 1,005 (9.3%) |
| 45 to 54 Years | 8,608 (90.0%) | 951 (10.0%) |
| 55 to 64 Years | 9,095 (93.3%) | 652 (6.7%) |
| 65 to 74 Years | 8,592 (99.9%) | 12 (0.1%) |
| 75 Years and older | 6,676 (99.9%) | 5 (0.1%) |
| Total | 78,748 (93.1%) | 5,817 (6.9%) |
Health Insurance Coverage by Citizenship Status in Medford
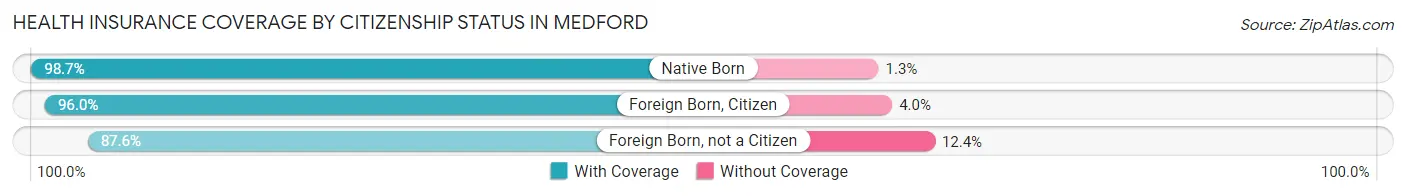
| Citizenship Status | With Coverage | Without Coverage |
| Native Born | 5,617 (98.7%) | 76 (1.3%) |
| Foreign Born, Citizen | 14,237 (96.0%) | 594 (4.0%) |
| Foreign Born, not a Citizen | 5,886 (87.6%) | 834 (12.4%) |
Health Insurance Coverage by Household Income in Medford
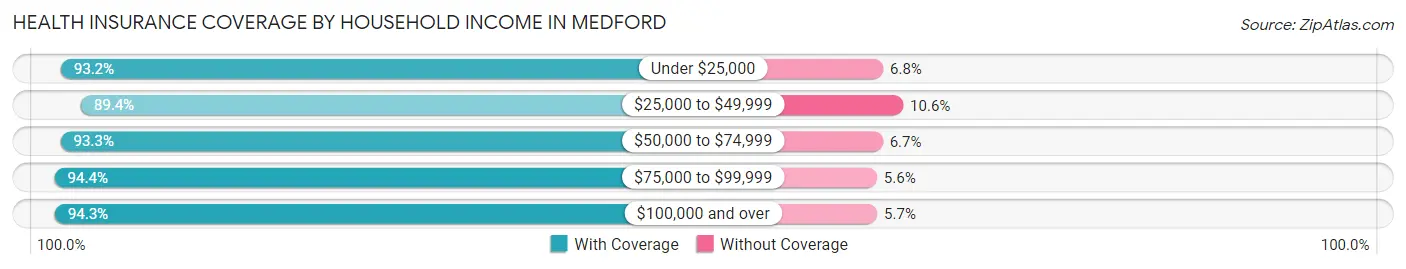
| Household Income | With Coverage | Without Coverage |
| Under $25,000 | 7,738 (93.2%) | 565 (6.8%) |
| $25,000 to $49,999 | 14,686 (89.4%) | 1,734 (10.6%) |
| $50,000 to $74,999 | 13,447 (93.3%) | 970 (6.7%) |
| $75,000 to $99,999 | 13,859 (94.4%) | 829 (5.6%) |
| $100,000 and over | 27,912 (94.3%) | 1,684 (5.7%) |
Public vs Private Health Insurance Coverage by Age in Medford
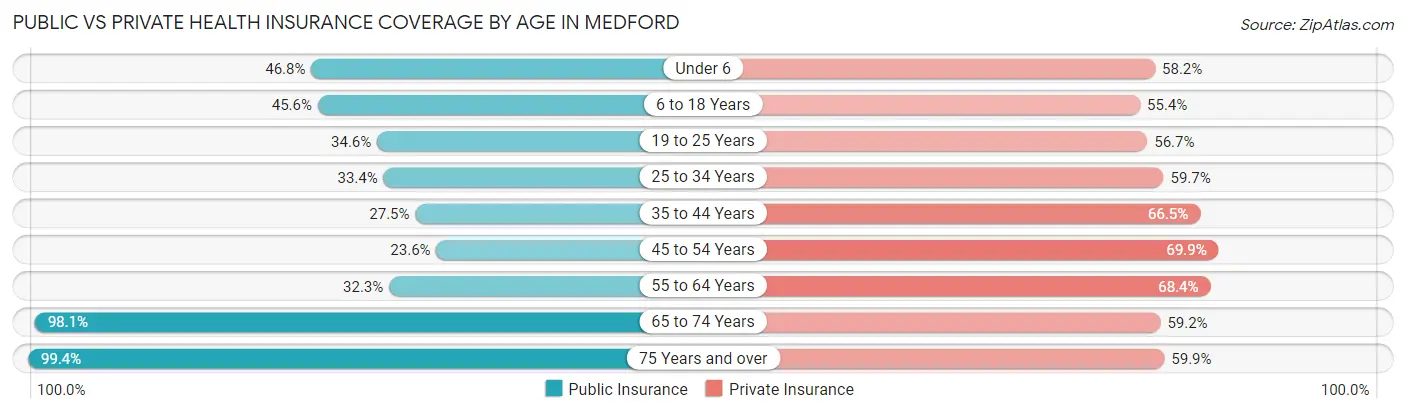
| Age Bracket | Public Insurance | Private Insurance |
| Under 6 | 2,664 (46.8%) | 3,311 (58.2%) |
| 6 to 18 Years | 6,760 (45.6%) | 8,212 (55.4%) |
| 19 to 25 Years | 2,323 (34.6%) | 3,810 (56.7%) |
| 25 to 34 Years | 3,978 (33.4%) | 7,121 (59.7%) |
| 35 to 44 Years | 2,969 (27.5%) | 7,188 (66.5%) |
| 45 to 54 Years | 2,252 (23.6%) | 6,685 (69.9%) |
| 55 to 64 Years | 3,152 (32.3%) | 6,667 (68.4%) |
| 65 to 74 Years | 8,442 (98.1%) | 5,089 (59.2%) |
| 75 Years and over | 6,640 (99.4%) | 4,000 (59.9%) |
| Total | 39,180 (46.3%) | 52,083 (61.6%) |
Disability Status by Sex by Age in Medford
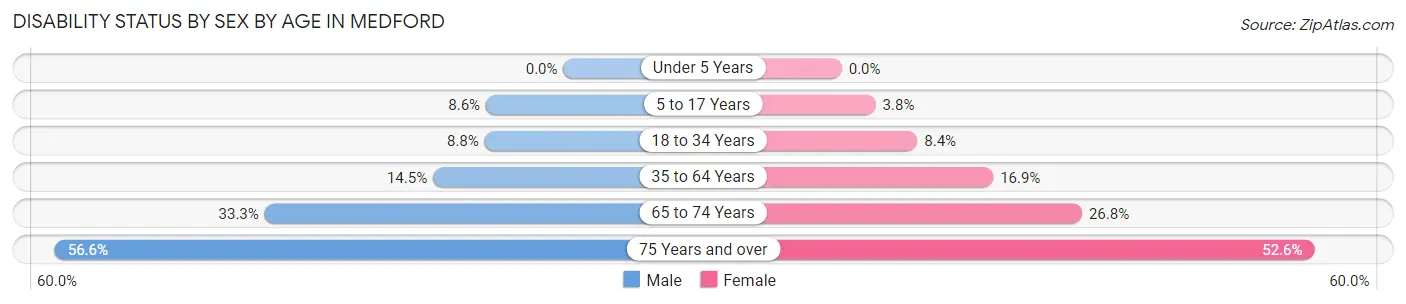
| Age Bracket | Male | Female |
| Under 5 Years | 0 (0.0%) | 0 (0.0%) |
| 5 to 17 Years | 671 (8.6%) | 259 (3.8%) |
| 18 to 34 Years | 921 (8.8%) | 788 (8.4%) |
| 35 to 64 Years | 2,150 (14.5%) | 2,581 (16.9%) |
| 65 to 74 Years | 1,314 (33.3%) | 1,245 (26.8%) |
| 75 Years and over | 1,674 (56.6%) | 1,960 (52.6%) |
Disability Class by Sex by Age in Medford
Disability Class: Hearing Difficulty
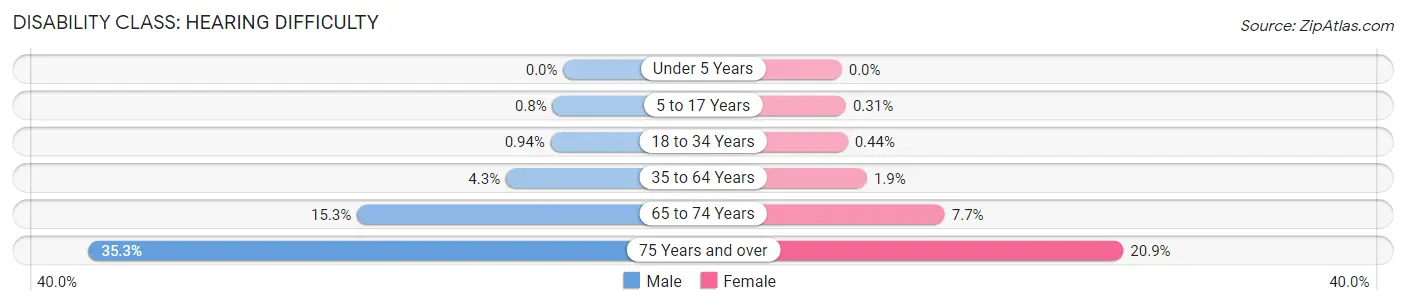
| Age Bracket | Male | Female |
| Under 5 Years | 0 (0.0%) | 0 (0.0%) |
| 5 to 17 Years | 62 (0.8%) | 21 (0.3%) |
| 18 to 34 Years | 99 (0.9%) | 41 (0.4%) |
| 35 to 64 Years | 631 (4.3%) | 286 (1.9%) |
| 65 to 74 Years | 605 (15.3%) | 356 (7.6%) |
| 75 Years and over | 1,042 (35.2%) | 779 (20.9%) |
Disability Class: Vision Difficulty
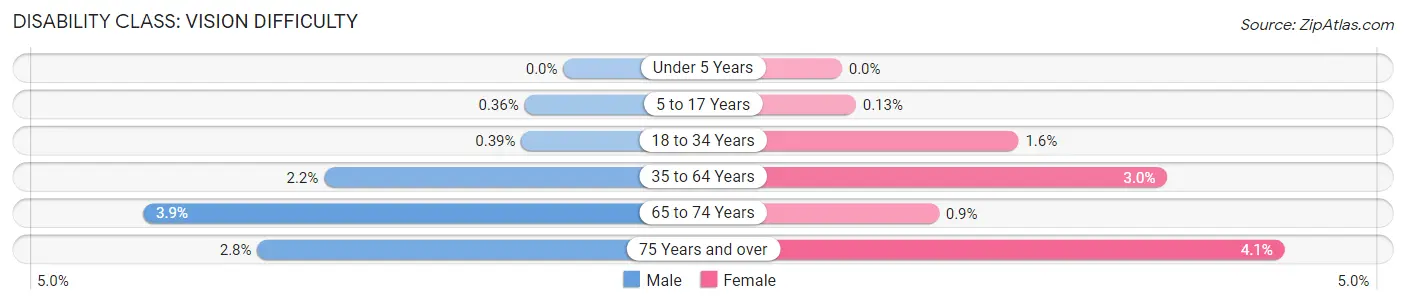
| Age Bracket | Male | Female |
| Under 5 Years | 0 (0.0%) | 0 (0.0%) |
| 5 to 17 Years | 28 (0.4%) | 9 (0.1%) |
| 18 to 34 Years | 41 (0.4%) | 154 (1.6%) |
| 35 to 64 Years | 328 (2.2%) | 463 (3.0%) |
| 65 to 74 Years | 154 (3.9%) | 42 (0.9%) |
| 75 Years and over | 84 (2.8%) | 153 (4.1%) |
Disability Class: Cognitive Difficulty
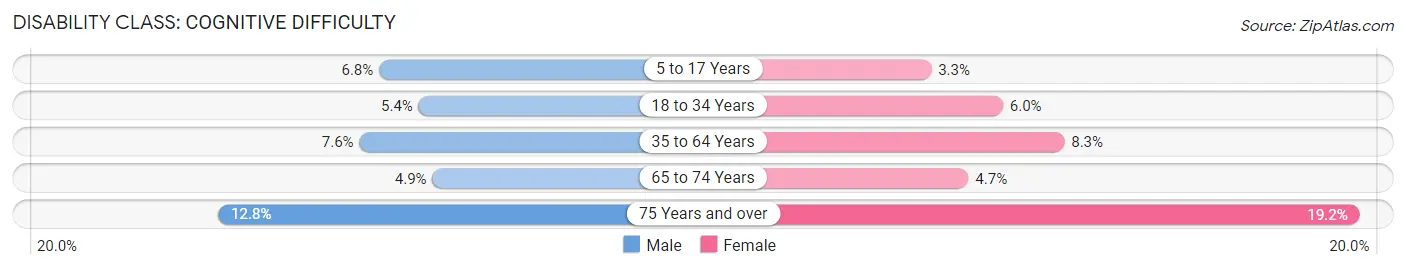
| Age Bracket | Male | Female |
| 5 to 17 Years | 532 (6.8%) | 228 (3.3%) |
| 18 to 34 Years | 564 (5.4%) | 561 (6.0%) |
| 35 to 64 Years | 1,121 (7.6%) | 1,265 (8.3%) |
| 65 to 74 Years | 192 (4.9%) | 219 (4.7%) |
| 75 Years and over | 379 (12.8%) | 716 (19.2%) |
Disability Class: Ambulatory Difficulty
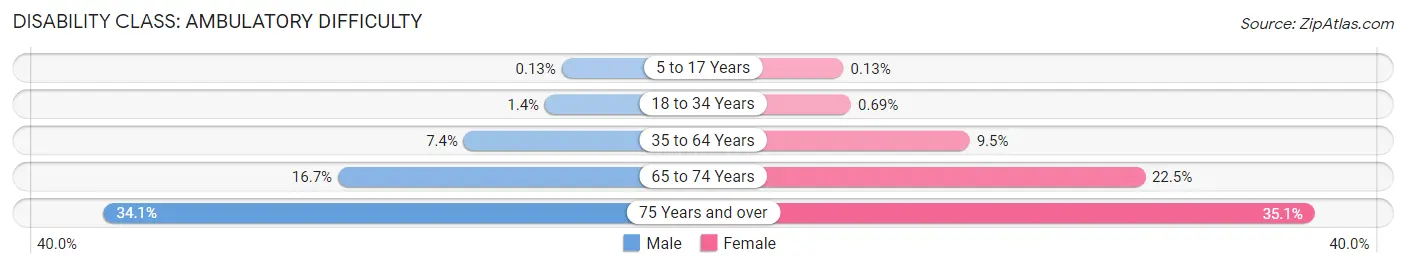
| Age Bracket | Male | Female |
| 5 to 17 Years | 10 (0.1%) | 9 (0.1%) |
| 18 to 34 Years | 144 (1.4%) | 65 (0.7%) |
| 35 to 64 Years | 1,094 (7.4%) | 1,455 (9.5%) |
| 65 to 74 Years | 661 (16.7%) | 1,048 (22.5%) |
| 75 Years and over | 1,009 (34.1%) | 1,308 (35.1%) |
Disability Class: Self-Care Difficulty
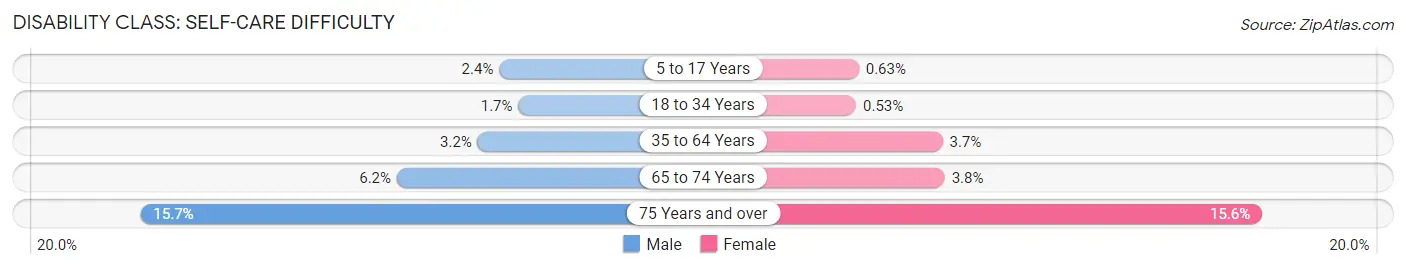
| Age Bracket | Male | Female |
| 5 to 17 Years | 185 (2.4%) | 43 (0.6%) |
| 18 to 34 Years | 175 (1.7%) | 50 (0.5%) |
| 35 to 64 Years | 471 (3.2%) | 572 (3.7%) |
| 65 to 74 Years | 244 (6.2%) | 178 (3.8%) |
| 75 Years and over | 464 (15.7%) | 581 (15.6%) |
Technology Access in Medford
Computing Device Access in Medford
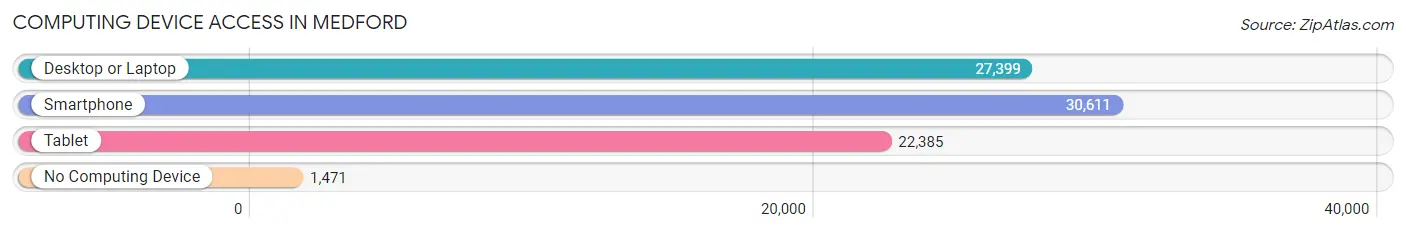
| Device Type | # Households | % Households |
| Desktop or Laptop | 27,399 | 80.3% |
| Smartphone | 30,611 | 89.7% |
| Tablet | 22,385 | 65.6% |
| No Computing Device | 1,471 | 4.3% |
| Total | 34,127 | 100.0% |
Internet Access in Medford
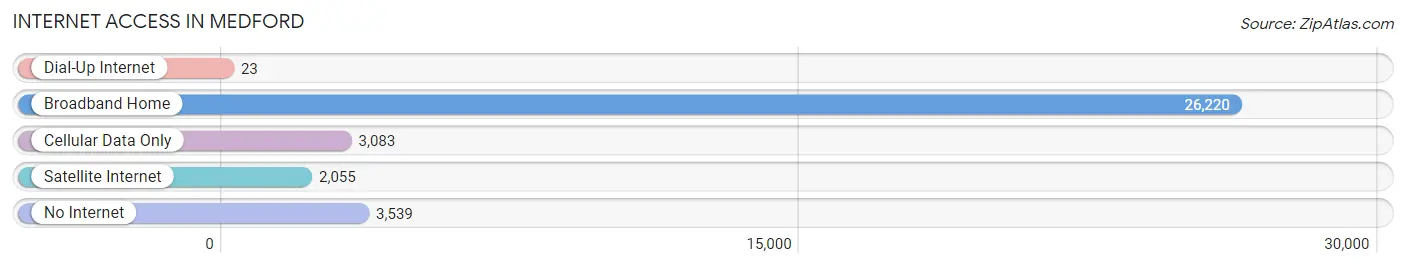
| Internet Type | # Households | % Households |
| Dial-Up Internet | 23 | 0.1% |
| Broadband Home | 26,220 | 76.8% |
| Cellular Data Only | 3,083 | 9.0% |
| Satellite Internet | 2,055 | 6.0% |
| No Internet | 3,539 | 10.4% |
| Total | 34,127 | 100.0% |
Medford Summary
Medford, Oregon is a city located in Jackson County in the southwestern part of the state. It is the county seat and the largest city in the county. The city is situated in the Rogue Valley, a region of the Pacific Northwest known for its mild climate and abundant natural beauty. The city is located at the confluence of the Bear Creek and Rogue River, and is surrounded by the Cascade and Siskiyou mountain ranges.
History
The area that is now Medford was first inhabited by the Takelma Native Americans. The first European settlers arrived in the area in the mid-1800s, and the city was officially incorporated in 1885. The city was named after Medford, Massachusetts, the hometown of one of the city’s founders.
The city grew rapidly in the late 19th and early 20th centuries, due to the abundance of natural resources in the area. The timber industry was particularly important to the city’s economy, and the city was home to several large lumber mills. The city also became a major center for fruit production, and the area’s orchards were a major source of income for many of the city’s residents.
In the mid-20th century, the city began to diversify its economy. The city’s economy is now based on a mix of manufacturing, healthcare, retail, and tourism. The city is also home to several large employers, including the Rogue Valley Medical Center, the Harry & David Corporation, and the Medford Airport.
Geography
Medford is located in the Rogue Valley, a region of the Pacific Northwest known for its mild climate and abundant natural beauty. The city is situated at the confluence of the Bear Creek and Rogue River, and is surrounded by the Cascade and Siskiyou mountain ranges. The city is located at an elevation of 1,890 feet (576 meters) above sea level.
The city has a total area of 28.2 square miles (73.1 square kilometers), of which 28.1 square miles (72.9 square kilometers) is land and 0.1 square miles (0.2 square kilometers) is water. The city is located in a temperate climate zone, with hot, dry summers and mild, wet winters.
Economy
Medford’s economy is based on a mix of manufacturing, healthcare, retail, and tourism. The city is home to several large employers, including the Rogue Valley Medical Center, the Harry & David Corporation, and the Medford Airport.
The city is also home to several major industries, including timber, agriculture, and manufacturing. The timber industry is particularly important to the city’s economy, and the city is home to several large lumber mills. The city is also a major center for fruit production, and the area’s orchards are a major source of income for many of the city’s residents.
The city is also home to several major retail centers, including the Rogue Valley Mall and the Medford Center. The city is also home to several major tourist attractions, including the Oregon Shakespeare Festival, the Rogue River, and Crater Lake National Park.
Demographics
As of the 2010 census, the city had a population of 74,907. The population is fairly evenly split between men and women, with 49.3% of the population being male and 50.7% being female. The median age of the population is 37.7 years.
The city is racially diverse, with the largest racial group being White (77.2%), followed by Hispanic or Latino (14.2%), Asian (3.7%), African American (2.2%), and Native American (1.2%). The city is also home to a large number of immigrants, with 11.2% of the population being foreign-born.
The median household income in the city is $45,837, and the median family income is $54,837. The city’s poverty rate is 13.3%, which is slightly higher than the national average. The city’s unemployment rate is 6.2%, which is slightly lower than the national average.
Common Questions
What is Per Capita Income in Medford?
Per Capita income in Medford is $33,822.
What is the Median Family Income in Medford?
Median Family Income in Medford is $80,396.
What is the Median Household income in Medford?
Median Household Income in Medford is $65,647.
What is Income or Wage Gap in Medford?
Income or Wage Gap in Medford is 28.4%.
Women in Medford earn 71.6 cents for every dollar earned by a man.
What is Family Income Deficit in Medford?
Family Income Deficit in Medford is $9,943.
Families that are below poverty line in Medford earn $9,943 less on average than the poverty threshold level.
What is Inequality or Gini Index in Medford?
Inequality or Gini Index in Medford is 0.43.
What is the Total Population of Medford?
Total Population of Medford is 85,539.
What is the Total Male Population of Medford?
Total Male Population of Medford is 42,713.
What is the Total Female Population of Medford?
Total Female Population of Medford is 42,826.
What is the Ratio of Males per 100 Females in Medford?
There are 99.74 Males per 100 Females in Medford.
What is the Ratio of Females per 100 Males in Medford?
There are 100.26 Females per 100 Males in Medford.
What is the Median Population Age in Medford?
Median Population Age in Medford is 38.1 Years.
What is the Average Family Size in Medford
Average Family Size in Medford is 3.0 People.
What is the Average Household Size in Medford
Average Household Size in Medford is 2.5 People.
How Large is the Labor Force in Medford?
There are 41,884 People in the Labor Forcein in Medford.
What is the Percentage of People in the Labor Force in Medford?
61.2% of People are in the Labor Force in Medford.
What is the Unemployment Rate in Medford?
Unemployment Rate in Medford is 5.0%.