Cordova, NM Map & Demographics
Cordova Map
Cordova Overview
$58,966
PER CAPITA INCOME
0.55
INEQUALITY / GINI INDEX
180
TOTAL POPULATION
59
MALE POPULATION
121
FEMALE POPULATION
48.76
MALES / 100 FEMALES
205.08
FEMALES / 100 MALES
68.7
MEDIAN AGE
1.9
AVG FAMILY SIZE
1.1
AVG HOUSEHOLD SIZE
79
LABOR FORCE [ PEOPLE ]
43.9%
PERCENT IN LABOR FORCE
Cordova Zip Codes
Cordova Area Codes
Income in Cordova
Income Overview in Cordova
| Characteristic | Number | Measure |
| Per Capita Income | 180 | $58,966 |
| Median Family Income | 22 | $0 |
| Mean Family Income | 22 | $0 |
| Median Household Income | 160 | $0 |
| Mean Household Income | 160 | $66,854 |
| Income Deficit | 22 | $0 |
| Wage / Income Gap (%) | 180 | 0.00% |
| Wage / Income Gap ($) | 180 | 100.00¢ per $1 |
| Gini / Inequality Index | 180 | 0.55 |
Earnings by Sex in Cordova
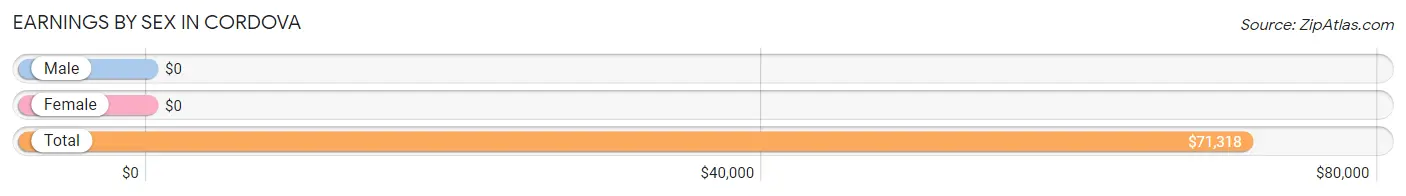
| Sex | Number | Average Earnings |
| Male | 59 (74.7%) | $0 |
| Female | 20 (25.3%) | $0 |
| Total | 79 (100.0%) | $71,318 |
Earnings by Sex by Income Bracket in Cordova
The most common earnings brackets in Cordova are $65,000 to $74,999 for men (37 | 62.7%) and $40,000 to $44,999 for women (20 | 100.0%).
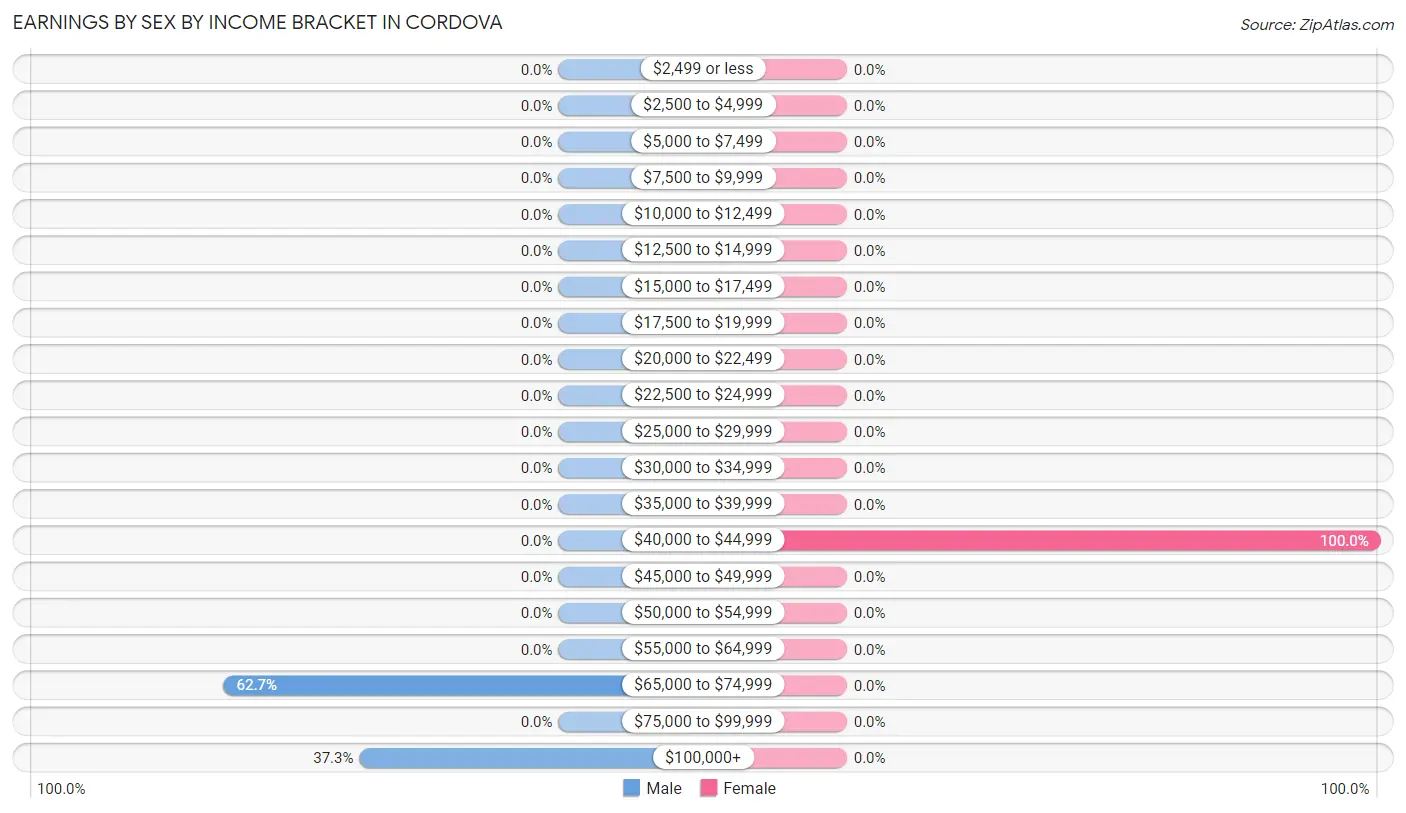
| Income | Male | Female |
| $2,499 or less | 0 (0.0%) | 0 (0.0%) |
| $2,500 to $4,999 | 0 (0.0%) | 0 (0.0%) |
| $5,000 to $7,499 | 0 (0.0%) | 0 (0.0%) |
| $7,500 to $9,999 | 0 (0.0%) | 0 (0.0%) |
| $10,000 to $12,499 | 0 (0.0%) | 0 (0.0%) |
| $12,500 to $14,999 | 0 (0.0%) | 0 (0.0%) |
| $15,000 to $17,499 | 0 (0.0%) | 0 (0.0%) |
| $17,500 to $19,999 | 0 (0.0%) | 0 (0.0%) |
| $20,000 to $22,499 | 0 (0.0%) | 0 (0.0%) |
| $22,500 to $24,999 | 0 (0.0%) | 0 (0.0%) |
| $25,000 to $29,999 | 0 (0.0%) | 0 (0.0%) |
| $30,000 to $34,999 | 0 (0.0%) | 0 (0.0%) |
| $35,000 to $39,999 | 0 (0.0%) | 0 (0.0%) |
| $40,000 to $44,999 | 0 (0.0%) | 20 (100.0%) |
| $45,000 to $49,999 | 0 (0.0%) | 0 (0.0%) |
| $50,000 to $54,999 | 0 (0.0%) | 0 (0.0%) |
| $55,000 to $64,999 | 0 (0.0%) | 0 (0.0%) |
| $65,000 to $74,999 | 37 (62.7%) | 0 (0.0%) |
| $75,000 to $99,999 | 0 (0.0%) | 0 (0.0%) |
| $100,000+ | 22 (37.3%) | 0 (0.0%) |
| Total | 59 (100.0%) | 20 (100.0%) |
Earnings by Sex by Educational Attainment in Cordova
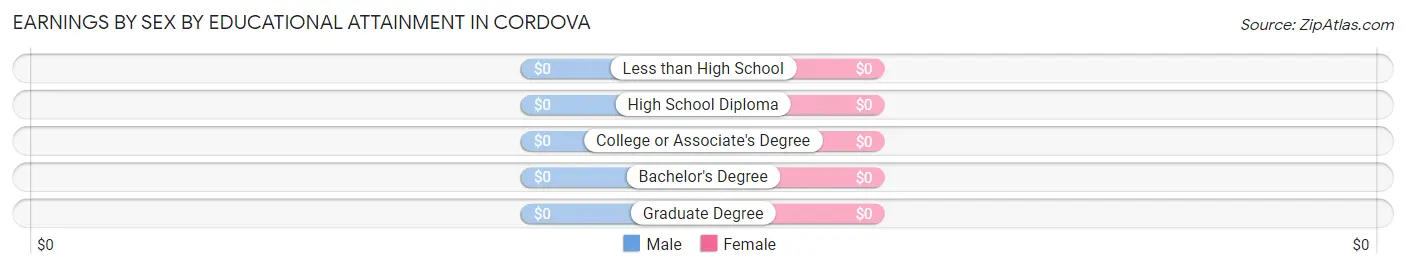
| Educational Attainment | Male Income | Female Income |
| Less than High School | - | - |
| High School Diploma | - | - |
| College or Associate's Degree | - | - |
| Bachelor's Degree | - | - |
| Graduate Degree | - | - |
| Total | - | - |
Family Income in Cordova
Family Income Brackets in Cordova
According to the Cordova family income data, there are 22 families falling into the $200,000+ income range, which is the most common income bracket and makes up 100.0% of all families.
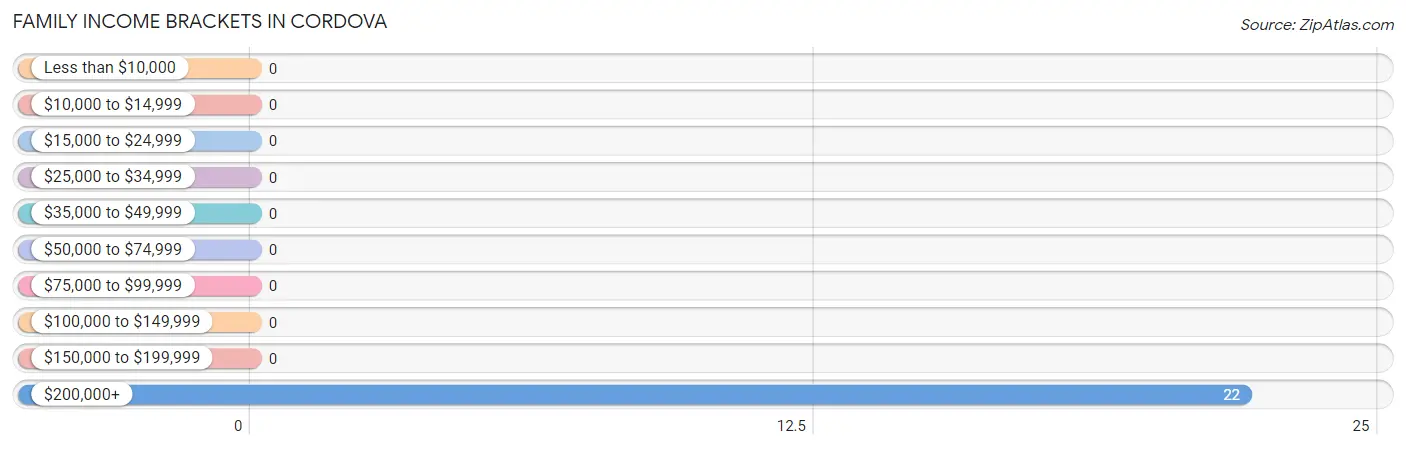
| Income Bracket | # Families | % Families |
| Less than $10,000 | 0 | 0.0% |
| $10,000 to $14,999 | 0 | 0.0% |
| $15,000 to $24,999 | 0 | 0.0% |
| $25,000 to $34,999 | 0 | 0.0% |
| $35,000 to $49,999 | 0 | 0.0% |
| $50,000 to $74,999 | 0 | 0.0% |
| $75,000 to $99,999 | 0 | 0.0% |
| $100,000 to $149,999 | 0 | 0.0% |
| $150,000 to $199,999 | 0 | 0.0% |
| $200,000+ | 22 | 100.0% |
Family Income by Famaliy Size in Cordova
| Income Bracket | # Families | Median Income |
| 2-Person Families | 22 (100.0%) | $0 |
| 3-Person Families | 0 (0.0%) | $0 |
| 4-Person Families | 0 (0.0%) | $0 |
| 5-Person Families | 0 (0.0%) | $0 |
| 6-Person Families | 0 (0.0%) | $0 |
| 7+ Person Families | 0 (0.0%) | $0 |
| Total | 22 (100.0%) | $0 |
Family Income by Number of Earners in Cordova
| Number of Earners | # Families | Median Income |
| No Earners | 0 (0.0%) | $0 |
| 1 Earner | 0 (0.0%) | $0 |
| 2 Earners | 22 (100.0%) | $0 |
| 3+ Earners | 0 (0.0%) | $0 |
| Total | 22 (100.0%) | $0 |
Household Income in Cordova
Household Income Brackets in Cordova
With 84 households falling in the category, the $15,000 to $24,999 income range is the most frequent in Cordova, accounting for 52.5% of all households.
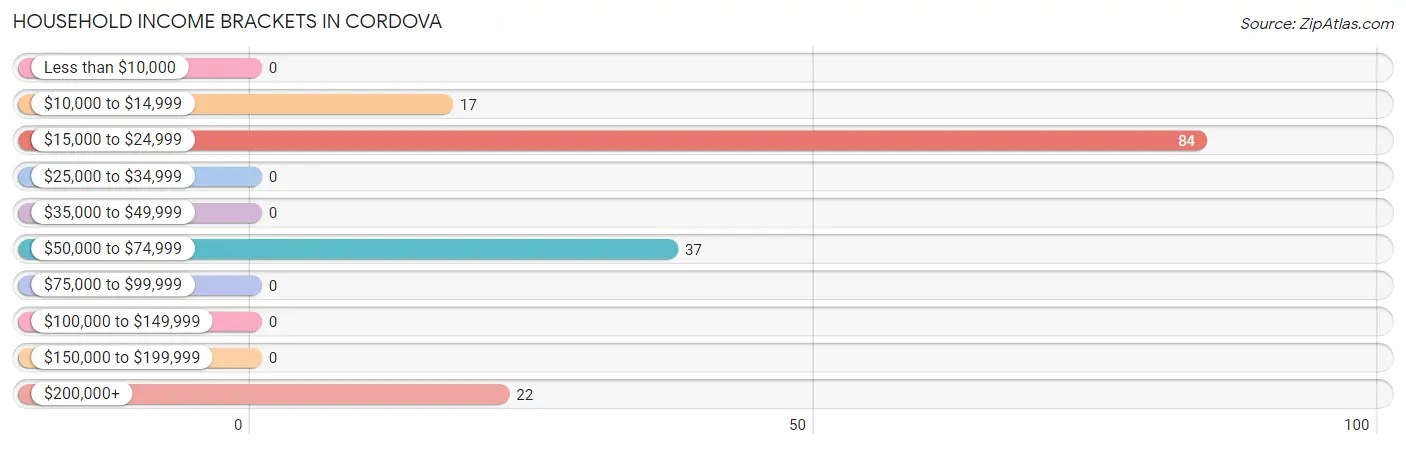
| Income Bracket | # Households | % Households |
| Less than $10,000 | 0 | 0.0% |
| $10,000 to $14,999 | 17 | 10.6% |
| $15,000 to $24,999 | 84 | 52.5% |
| $25,000 to $34,999 | 0 | 0.0% |
| $35,000 to $49,999 | 0 | 0.0% |
| $50,000 to $74,999 | 37 | 23.1% |
| $75,000 to $99,999 | 0 | 0.0% |
| $100,000 to $149,999 | 0 | 0.0% |
| $150,000 to $199,999 | 0 | 0.0% |
| $200,000+ | 22 | 13.8% |
Household Income by Householder Age in Cordova
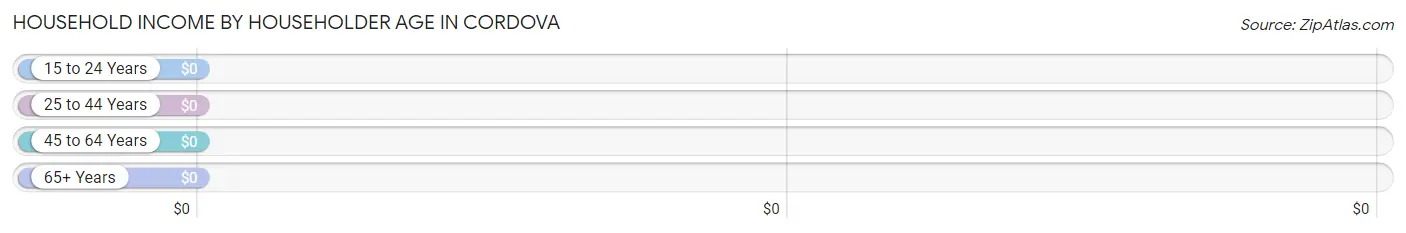
| Income Bracket | # Households | Median Income |
| 15 to 24 Years | 0 (0.0%) | $0 |
| 25 to 44 Years | 17 (10.6%) | $0 |
| 45 to 64 Years | 37 (23.1%) | $0 |
| 65+ Years | 106 (66.2%) | $0 |
| Total | 160 (100.0%) | $0 |
Poverty in Cordova
Income Below Poverty by Sex and Age in Cordova
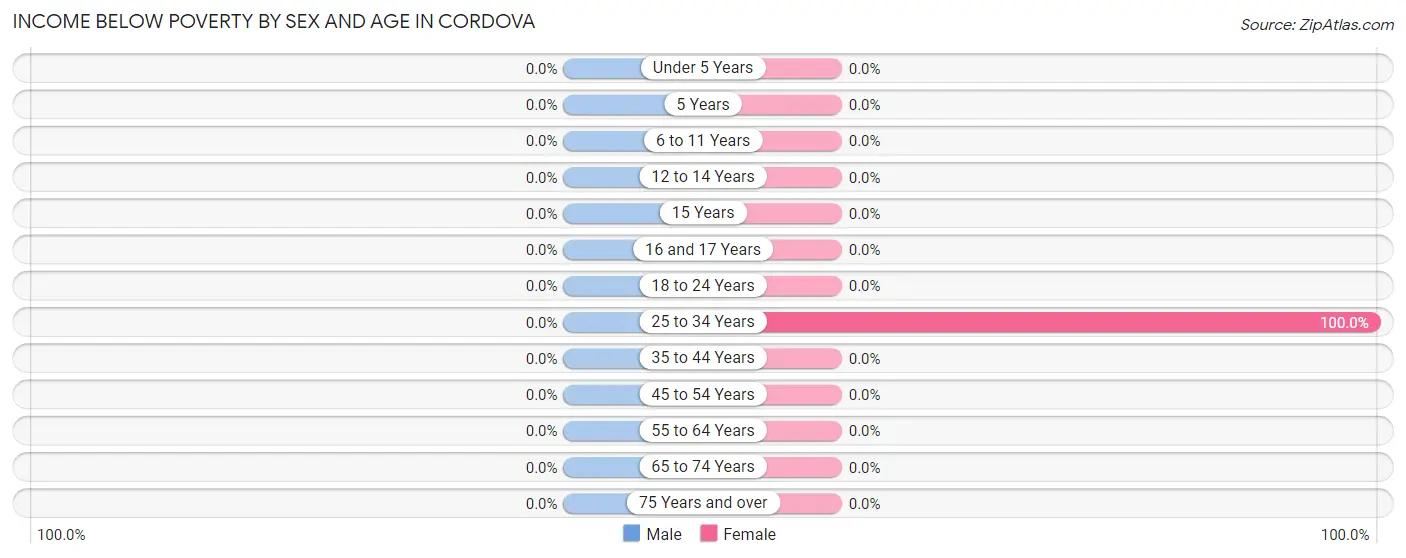
| Age Bracket | Male | Female |
| Under 5 Years | 0 (0.0%) | 0 (0.0%) |
| 5 Years | 0 (0.0%) | 0 (0.0%) |
| 6 to 11 Years | 0 (0.0%) | 0 (0.0%) |
| 12 to 14 Years | 0 (0.0%) | 0 (0.0%) |
| 15 Years | 0 (0.0%) | 0 (0.0%) |
| 16 and 17 Years | 0 (0.0%) | 0 (0.0%) |
| 18 to 24 Years | 0 (0.0%) | 0 (0.0%) |
| 25 to 34 Years | 0 (0.0%) | 17 (100.0%) |
| 35 to 44 Years | 0 (0.0%) | 0 (0.0%) |
| 45 to 54 Years | 0 (0.0%) | 0 (0.0%) |
| 55 to 64 Years | 0 (0.0%) | 0 (0.0%) |
| 65 to 74 Years | 0 (0.0%) | 0 (0.0%) |
| 75 Years and over | 0 (0.0%) | 0 (0.0%) |
| Total | 0 (0.0%) | 17 (14.1%) |
Income Above Poverty by Sex and Age in Cordova
According to the poverty statistics in Cordova, males aged 45 to 54 years and females aged 45 to 54 years are the age groups that are most secure financially, with 100.0% of males and 100.0% of females in these age groups living above the poverty line.
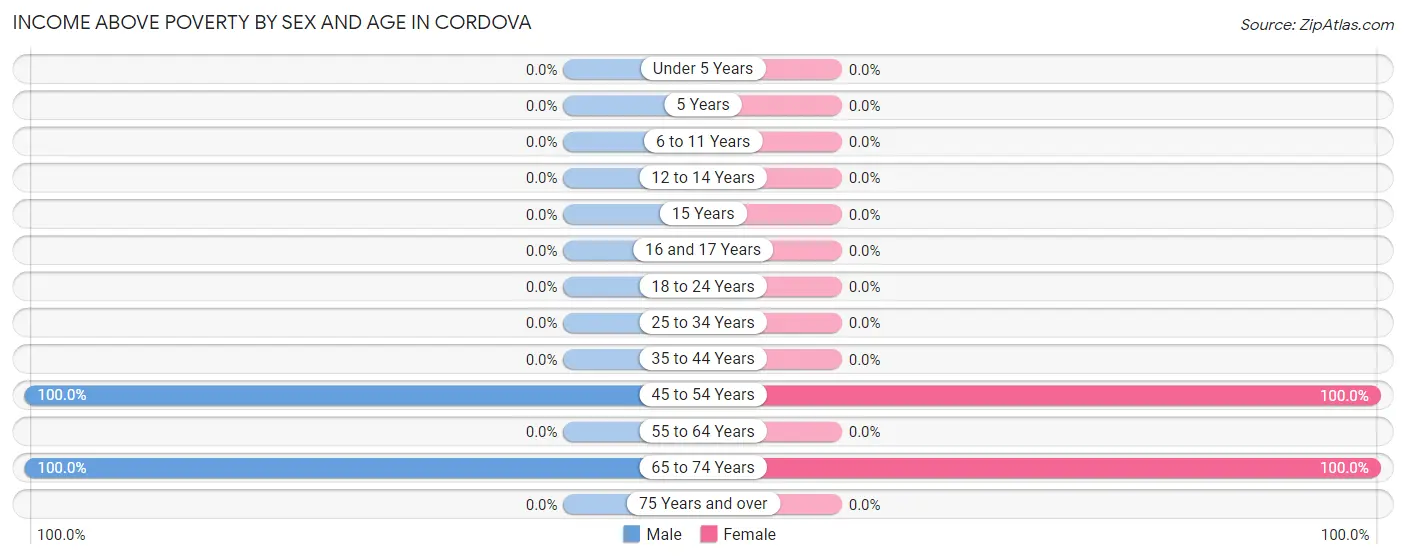
| Age Bracket | Male | Female |
| Under 5 Years | 0 (0.0%) | 0 (0.0%) |
| 5 Years | 0 (0.0%) | 0 (0.0%) |
| 6 to 11 Years | 0 (0.0%) | 0 (0.0%) |
| 12 to 14 Years | 0 (0.0%) | 0 (0.0%) |
| 15 Years | 0 (0.0%) | 0 (0.0%) |
| 16 and 17 Years | 0 (0.0%) | 0 (0.0%) |
| 18 to 24 Years | 0 (0.0%) | 0 (0.0%) |
| 25 to 34 Years | 0 (0.0%) | 0 (0.0%) |
| 35 to 44 Years | 0 (0.0%) | 0 (0.0%) |
| 45 to 54 Years | 37 (100.0%) | 20 (100.0%) |
| 55 to 64 Years | 0 (0.0%) | 0 (0.0%) |
| 65 to 74 Years | 22 (100.0%) | 84 (100.0%) |
| 75 Years and over | 0 (0.0%) | 0 (0.0%) |
| Total | 59 (100.0%) | 104 (86.0%) |
Income Below Poverty Among Married-Couple Families in Cordova
| Children | Above Poverty | Below Poverty |
| No Children | 22 (100.0%) | 0 (0.0%) |
| 1 or 2 Children | 0 (0.0%) | 0 (0.0%) |
| 3 or 4 Children | 0 (0.0%) | 0 (0.0%) |
| 5 or more Children | 0 (0.0%) | 0 (0.0%) |
| Total | 22 (100.0%) | 0 (0.0%) |
Income Below Poverty Among Single-Parent Households in Cordova
| Children | Single Father | Single Mother |
| No Children | 0 (0.0%) | 0 (0.0%) |
| 1 or 2 Children | 0 (0.0%) | 0 (0.0%) |
| 3 or 4 Children | 0 (0.0%) | 0 (0.0%) |
| 5 or more Children | 0 (0.0%) | 0 (0.0%) |
| Total | 0 (0.0%) | 0 (0.0%) |
Income Below Poverty Among Married-Couple vs Single-Parent Households in Cordova
| Children | Married-Couple Families | Single-Parent Households |
| No Children | 0 (0.0%) | 0 (0.0%) |
| 1 or 2 Children | 0 (0.0%) | 0 (0.0%) |
| 3 or 4 Children | 0 (0.0%) | 0 (0.0%) |
| 5 or more Children | 0 (0.0%) | 0 (0.0%) |
| Total | 0 (0.0%) | 0 (0.0%) |
Race in Cordova
The most populous races in Cordova are Hispanic or Latino (180 | 100.0%), Two or more Races (84 | 46.7%), and Some other Race (59 | 32.8%).
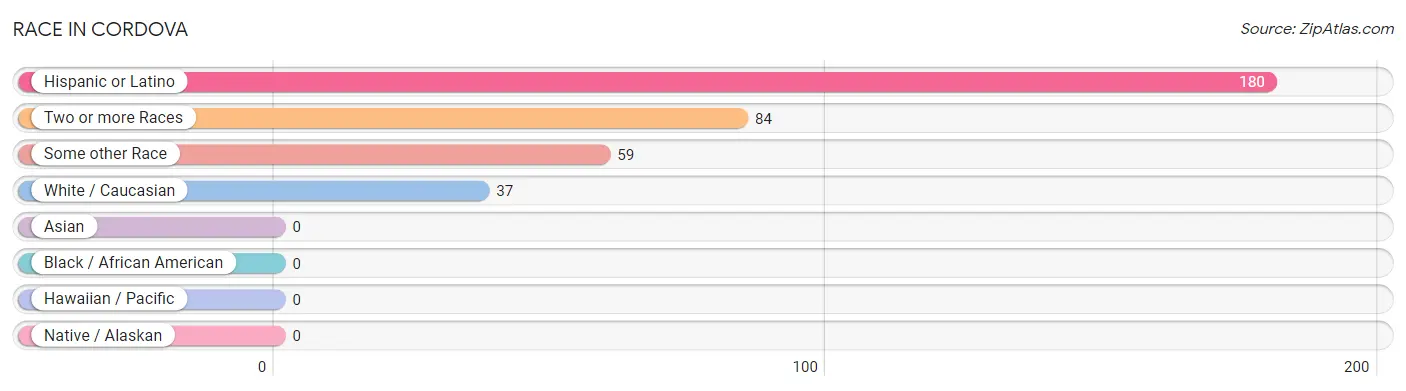
| Race | # Population | % Population |
| Asian | 0 | 0.0% |
| Black / African American | 0 | 0.0% |
| Hawaiian / Pacific | 0 | 0.0% |
| Hispanic or Latino | 180 | 100.0% |
| Native / Alaskan | 0 | 0.0% |
| White / Caucasian | 37 | 20.6% |
| Two or more Races | 84 | 46.7% |
| Some other Race | 59 | 32.8% |
| Total | 180 | 100.0% |
Ancestry in Cordova
The most populous ancestries reported in Cordova are Spanish (84 | 46.7%), Spaniard (42 | 23.3%), and Mexican (17 | 9.4%), together accounting for 79.4% of all Cordova residents.
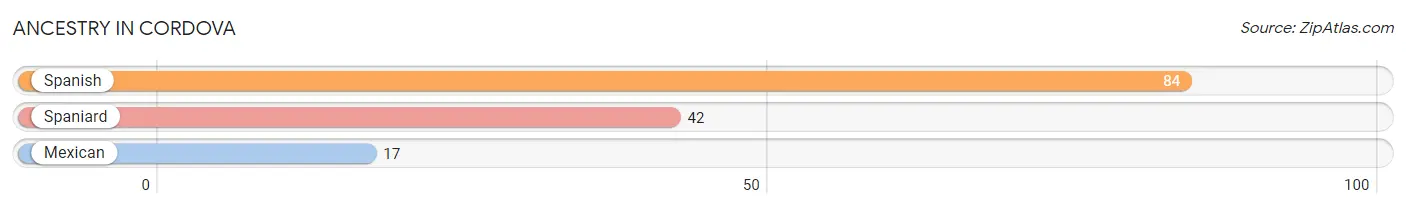
| Ancestry | # Population | % Population |
| Mexican | 17 | 9.4% |
| Spaniard | 42 | 23.3% |
| Spanish | 84 | 46.7% | View All 3 Rows |
Immigrants in Cordova

| Immigration Origin | # Population | % Population | View All 0 Rows |
Sex and Age in Cordova
Sex and Age in Cordova
The most populous age groups in Cordova are 50 to 54 Years (37 | 62.7%) for men and 70 to 74 Years (84 | 69.4%) for women.
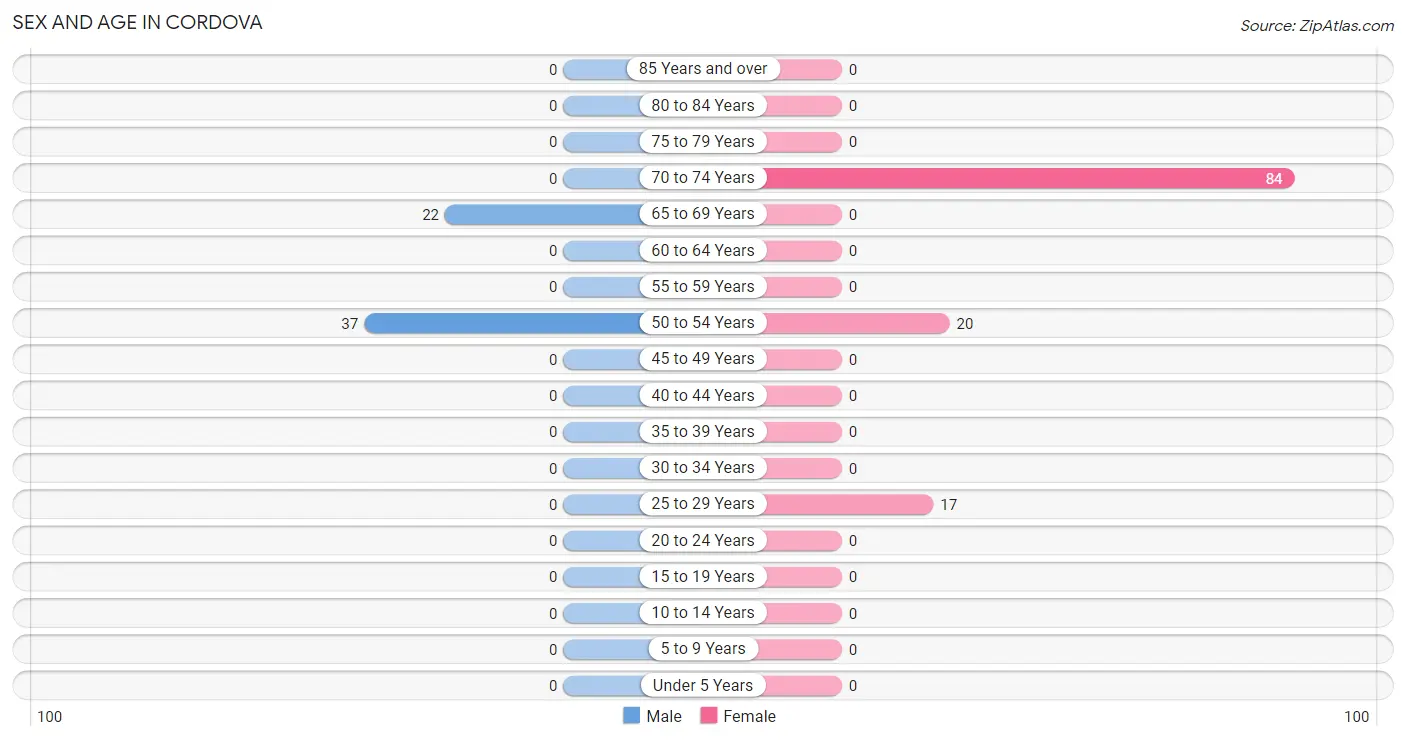
| Age Bracket | Male | Female |
| Under 5 Years | 0 (0.0%) | 0 (0.0%) |
| 5 to 9 Years | 0 (0.0%) | 0 (0.0%) |
| 10 to 14 Years | 0 (0.0%) | 0 (0.0%) |
| 15 to 19 Years | 0 (0.0%) | 0 (0.0%) |
| 20 to 24 Years | 0 (0.0%) | 0 (0.0%) |
| 25 to 29 Years | 0 (0.0%) | 17 (14.1%) |
| 30 to 34 Years | 0 (0.0%) | 0 (0.0%) |
| 35 to 39 Years | 0 (0.0%) | 0 (0.0%) |
| 40 to 44 Years | 0 (0.0%) | 0 (0.0%) |
| 45 to 49 Years | 0 (0.0%) | 0 (0.0%) |
| 50 to 54 Years | 37 (62.7%) | 20 (16.5%) |
| 55 to 59 Years | 0 (0.0%) | 0 (0.0%) |
| 60 to 64 Years | 0 (0.0%) | 0 (0.0%) |
| 65 to 69 Years | 22 (37.3%) | 0 (0.0%) |
| 70 to 74 Years | 0 (0.0%) | 84 (69.4%) |
| 75 to 79 Years | 0 (0.0%) | 0 (0.0%) |
| 80 to 84 Years | 0 (0.0%) | 0 (0.0%) |
| 85 Years and over | 0 (0.0%) | 0 (0.0%) |
| Total | 59 (100.0%) | 121 (100.0%) |
Families and Households in Cordova
Median Family Size in Cordova
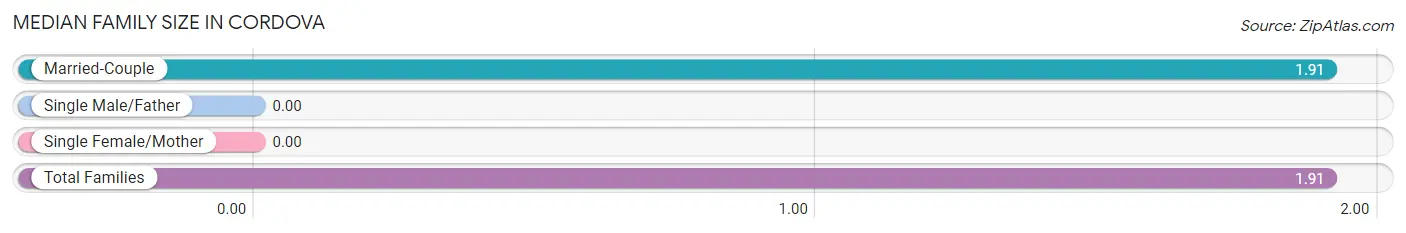
| Family Type | # Families | Family Size |
| Married-Couple | 22 (100.0%) | 1.91 |
| Single Male/Father | 0 (0.0%) | - |
| Single Female/Mother | 0 (0.0%) | - |
| Total Families | 22 (100.0%) | 1.91 |
Median Household Size in Cordova
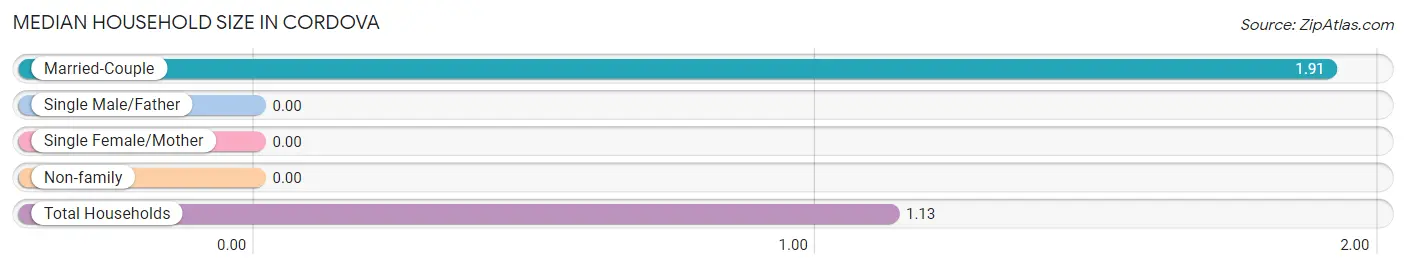
| Household Type | # Households | Household Size |
| Married-Couple | 22 (13.8%) | 1.91 |
| Single Male/Father | 0 (0.0%) | - |
| Single Female/Mother | 0 (0.0%) | - |
| Non-family | 138 (86.3%) | - |
| Total Households | 160 (100.0%) | 1.13 |
Household Size by Marriage Status in Cordova
Out of a total of 160 households in Cordova, 22 (13.8%) are family households, while 138 (86.3%) are nonfamily households. The most numerous type of family households are 2-person households, comprising 22, and the most common type of nonfamily households are 1-person households, comprising 138.
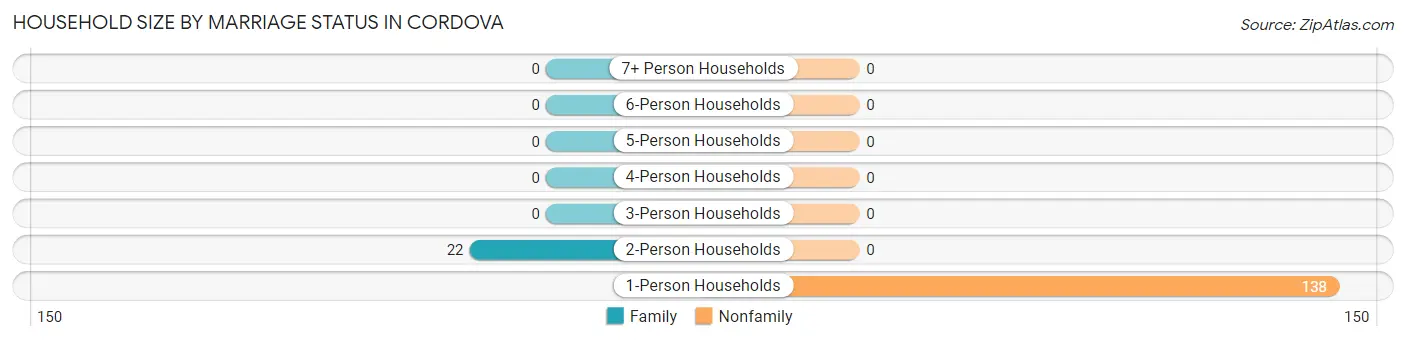
| Household Size | Family Households | Nonfamily Households |
| 1-Person Households | - | 138 (86.3%) |
| 2-Person Households | 22 (13.8%) | 0 (0.0%) |
| 3-Person Households | 0 (0.0%) | 0 (0.0%) |
| 4-Person Households | 0 (0.0%) | 0 (0.0%) |
| 5-Person Households | 0 (0.0%) | 0 (0.0%) |
| 6-Person Households | 0 (0.0%) | 0 (0.0%) |
| 7+ Person Households | 0 (0.0%) | 0 (0.0%) |
| Total | 22 (13.8%) | 138 (86.3%) |
Female Fertility in Cordova
Fertility by Age in Cordova
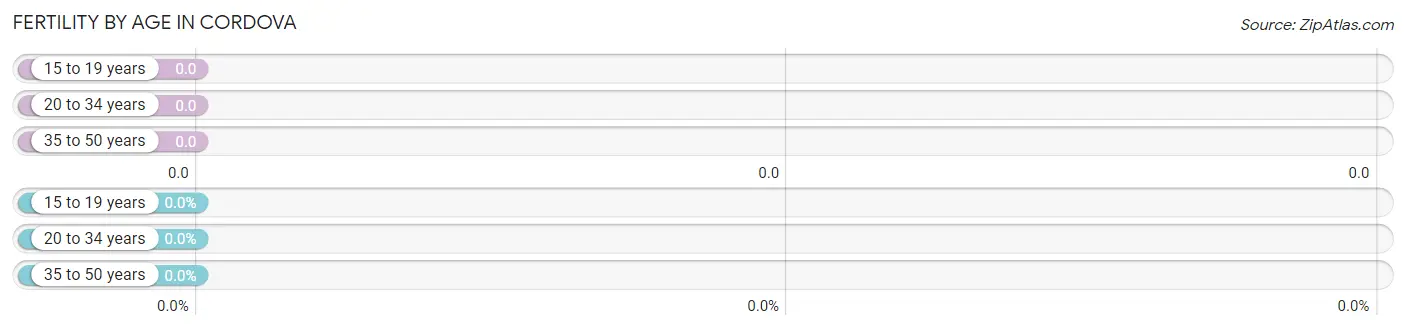
| Age Bracket | Women with Births | Births / 1,000 Women |
| 15 to 19 years | 0 (0.0%) | 0.0 |
| 20 to 34 years | 0 (0.0%) | 0.0 |
| 35 to 50 years | 0 (0.0%) | 0.0 |
| Total | 0 (0.0%) | 0.0 |
Fertility by Age by Marriage Status in Cordova
| Age Bracket | Married | Unmarried |
| 15 to 19 years | 0 (0.0%) | 0 (0.0%) |
| 20 to 34 years | 0 (0.0%) | 0 (0.0%) |
| 35 to 50 years | 0 (0.0%) | 0 (0.0%) |
| Total | 0 (0.0%) | 0 (0.0%) |
Fertility by Education in Cordova
| Educational Attainment | Women with Births | Births / 1,000 Women |
| Less than High School | 0 (0.0%) | 0.0 |
| High School Diploma | 0 (0.0%) | 0.0 |
| College or Associate's Degree | 0 (0.0%) | 0.0 |
| Bachelor's Degree | 0 (0.0%) | 0.0 |
| Graduate Degree | 0 (0.0%) | 0.0 |
| Total | 0 (0.0%) | 0.0 |
Fertility by Education by Marriage Status in Cordova
| Educational Attainment | Married | Unmarried |
| Less than High School | 0 (0.0%) | 0 (0.0%) |
| High School Diploma | 0 (0.0%) | 0 (0.0%) |
| College or Associate's Degree | 0 (0.0%) | 0 (0.0%) |
| Bachelor's Degree | 0 (0.0%) | 0 (0.0%) |
| Graduate Degree | 0 (0.0%) | 0 (0.0%) |
| Total | 0 (0.0%) | 0 (0.0%) |
Employment Characteristics in Cordova
Employment by Class of Employer in Cordova
Among the 79 employed individuals in Cordova, private company employees (59 | 74.7%), and state government employees (20 | 25.3%) make up the most common classes of employment.
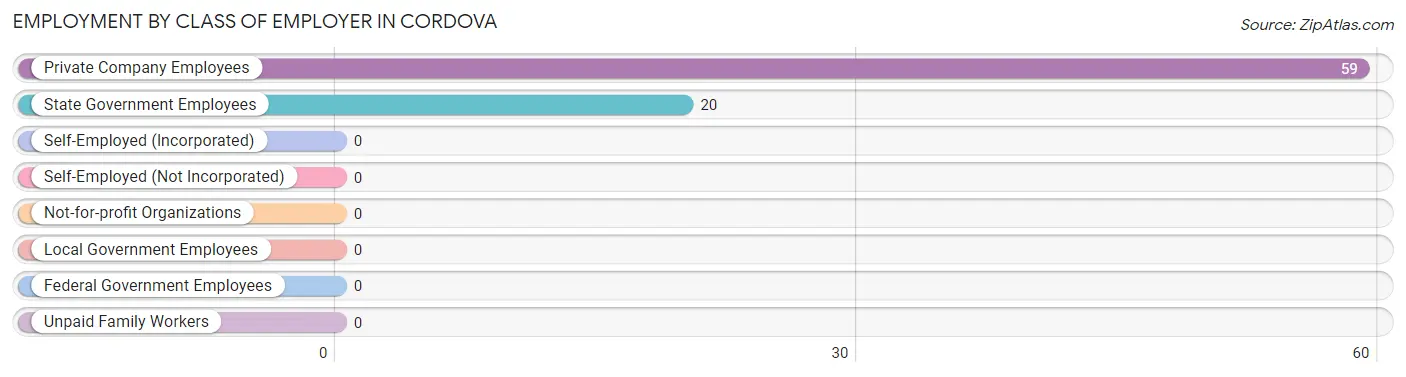
| Employer Class | # Employees | % Employees |
| Private Company Employees | 59 | 74.7% |
| Self-Employed (Incorporated) | 0 | 0.0% |
| Self-Employed (Not Incorporated) | 0 | 0.0% |
| Not-for-profit Organizations | 0 | 0.0% |
| Local Government Employees | 0 | 0.0% |
| State Government Employees | 20 | 25.3% |
| Federal Government Employees | 0 | 0.0% |
| Unpaid Family Workers | 0 | 0.0% |
| Total | 79 | 100.0% |
Employment Status by Age in Cordova
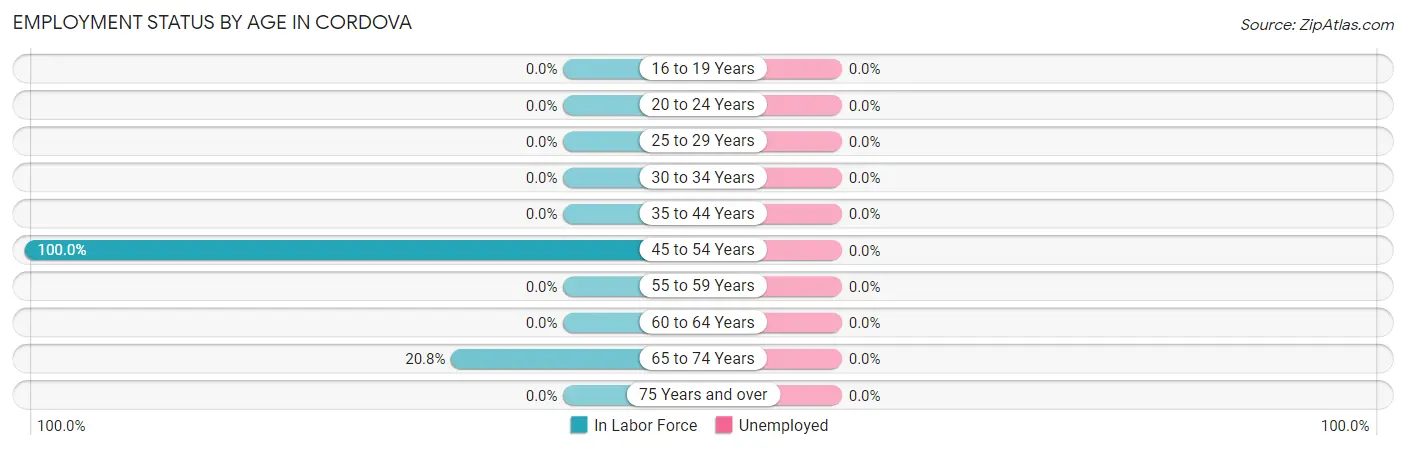
| Age Bracket | In Labor Force | Unemployed |
| 16 to 19 Years | 0 (0.0%) | 0 (0.0%) |
| 20 to 24 Years | 0 (0.0%) | 0 (0.0%) |
| 25 to 29 Years | 0 (0.0%) | 0 (0.0%) |
| 30 to 34 Years | 0 (0.0%) | 0 (0.0%) |
| 35 to 44 Years | 0 (0.0%) | 0 (0.0%) |
| 45 to 54 Years | 57 (100.0%) | 0 (0.0%) |
| 55 to 59 Years | 0 (0.0%) | 0 (0.0%) |
| 60 to 64 Years | 0 (0.0%) | 0 (0.0%) |
| 65 to 74 Years | 22 (20.8%) | 0 (0.0%) |
| 75 Years and over | 0 (0.0%) | 0 (0.0%) |
| Total | 79 (43.9%) | 0 (0.0%) |
Employment Status by Educational Attainment in Cordova
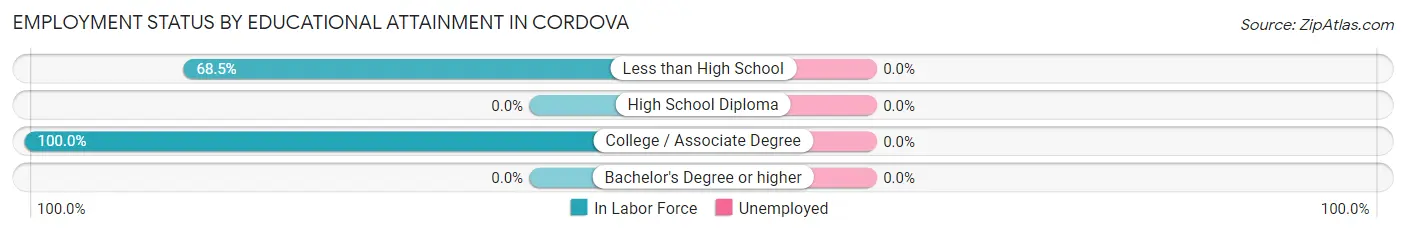
| Educational Attainment | In Labor Force | Unemployed |
| Less than High School | 37 (68.5%) | 0 (0.0%) |
| High School Diploma | 0 (0.0%) | 0 (0.0%) |
| College / Associate Degree | 20 (100.0%) | 0 (0.0%) |
| Bachelor's Degree or higher | 0 (0.0%) | 0 (0.0%) |
| Total | 57 (77.0%) | 0 (0.0%) |
Employment Occupations by Sex in Cordova
Management, Business, Science and Arts Occupations
The most common Management, Business, Science and Arts occupations in Cordova are , and Management (37 | 46.8%).
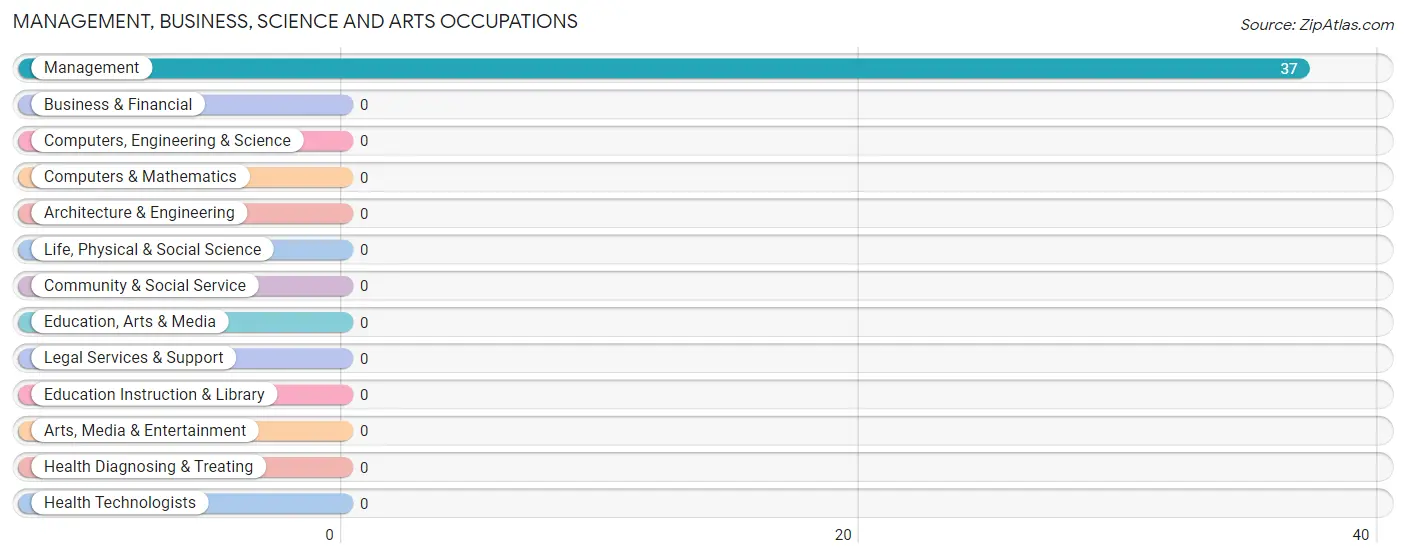
Management, Business, Science and Arts Occupations by Sex
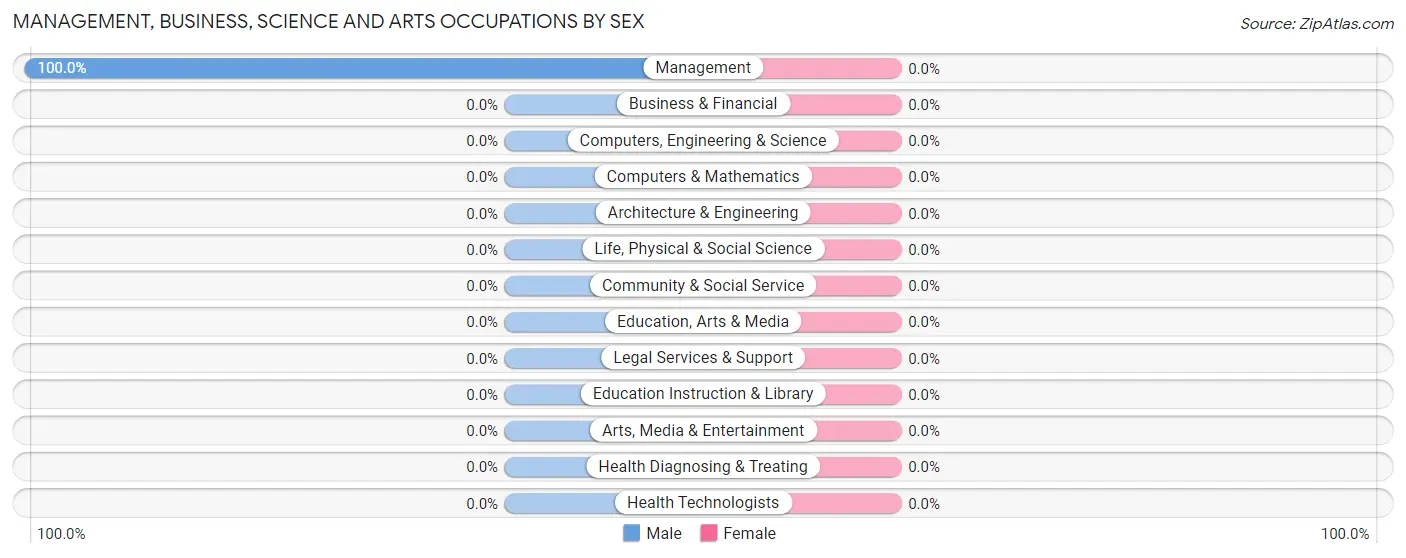
| Occupation | Male | Female |
| Management | 37 (100.0%) | 0 (0.0%) |
| Business & Financial | 0 (0.0%) | 0 (0.0%) |
| Computers, Engineering & Science | 0 (0.0%) | 0 (0.0%) |
| Computers & Mathematics | 0 (0.0%) | 0 (0.0%) |
| Architecture & Engineering | 0 (0.0%) | 0 (0.0%) |
| Life, Physical & Social Science | 0 (0.0%) | 0 (0.0%) |
| Community & Social Service | 0 (0.0%) | 0 (0.0%) |
| Education, Arts & Media | 0 (0.0%) | 0 (0.0%) |
| Legal Services & Support | 0 (0.0%) | 0 (0.0%) |
| Education Instruction & Library | 0 (0.0%) | 0 (0.0%) |
| Arts, Media & Entertainment | 0 (0.0%) | 0 (0.0%) |
| Health Diagnosing & Treating | 0 (0.0%) | 0 (0.0%) |
| Health Technologists | 0 (0.0%) | 0 (0.0%) |
| Total (Category) | 37 (100.0%) | 0 (0.0%) |
| Total (Overall) | 59 (74.7%) | 20 (25.3%) |
Services Occupations
Services Occupations by Sex
| Occupation | Male | Female |
| Healthcare Support | 0 (0.0%) | 0 (0.0%) |
| Security & Protection | 0 (0.0%) | 0 (0.0%) |
| Firefighting & Prevention | 0 (0.0%) | 0 (0.0%) |
| Law Enforcement | 0 (0.0%) | 0 (0.0%) |
| Food Preparation & Serving | 0 (0.0%) | 0 (0.0%) |
| Cleaning & Maintenance | 0 (0.0%) | 0 (0.0%) |
| Personal Care & Service | 0 (0.0%) | 0 (0.0%) |
| Total (Category) | 0 (0.0%) | 0 (0.0%) |
| Total (Overall) | 59 (74.7%) | 20 (25.3%) |
Sales and Office Occupations
The most common Sales and Office occupations in Cordova are , and Office & Administration (42 | 53.2%).
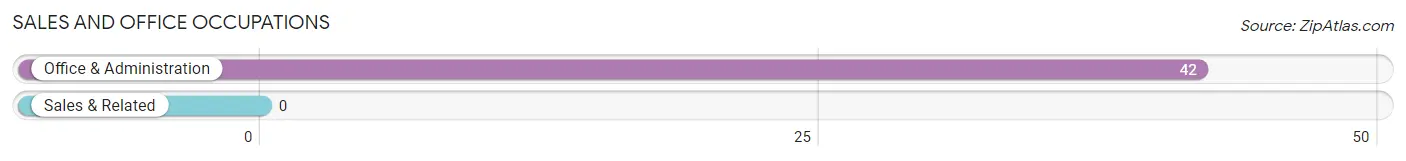
Sales and Office Occupations by Sex
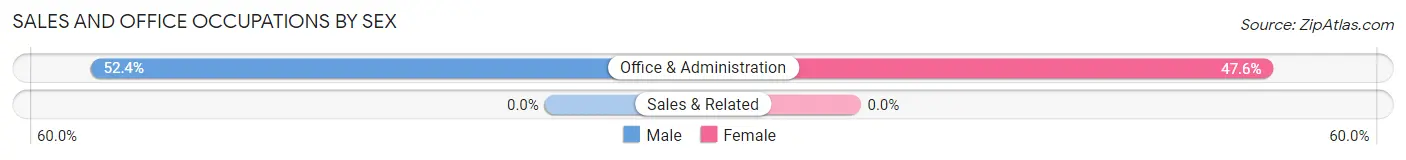
| Occupation | Male | Female |
| Sales & Related | 0 (0.0%) | 0 (0.0%) |
| Office & Administration | 22 (52.4%) | 20 (47.6%) |
| Total (Category) | 22 (52.4%) | 20 (47.6%) |
| Total (Overall) | 59 (74.7%) | 20 (25.3%) |
Natural Resources, Construction and Maintenance Occupations
Natural Resources, Construction and Maintenance Occupations by Sex
| Occupation | Male | Female |
| Farming, Fishing & Forestry | 0 (0.0%) | 0 (0.0%) |
| Construction & Extraction | 0 (0.0%) | 0 (0.0%) |
| Installation, Maintenance & Repair | 0 (0.0%) | 0 (0.0%) |
| Total (Category) | 0 (0.0%) | 0 (0.0%) |
| Total (Overall) | 59 (74.7%) | 20 (25.3%) |
Production, Transportation and Moving Occupations
Production, Transportation and Moving Occupations by Sex
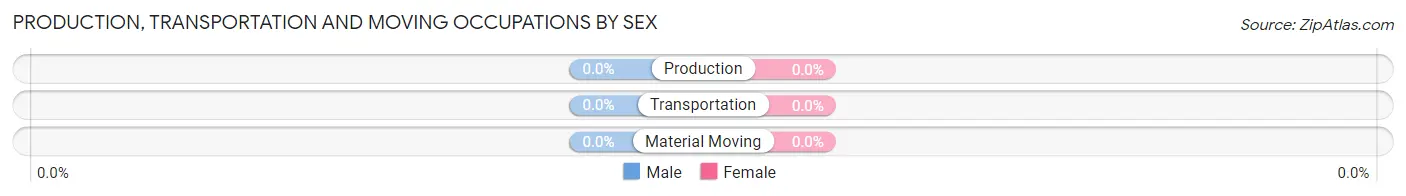
| Occupation | Male | Female |
| Production | 0 (0.0%) | 0 (0.0%) |
| Transportation | 0 (0.0%) | 0 (0.0%) |
| Material Moving | 0 (0.0%) | 0 (0.0%) |
| Total (Category) | 0 (0.0%) | 0 (0.0%) |
| Total (Overall) | 59 (74.7%) | 20 (25.3%) |
Employment Industries by Sex in Cordova
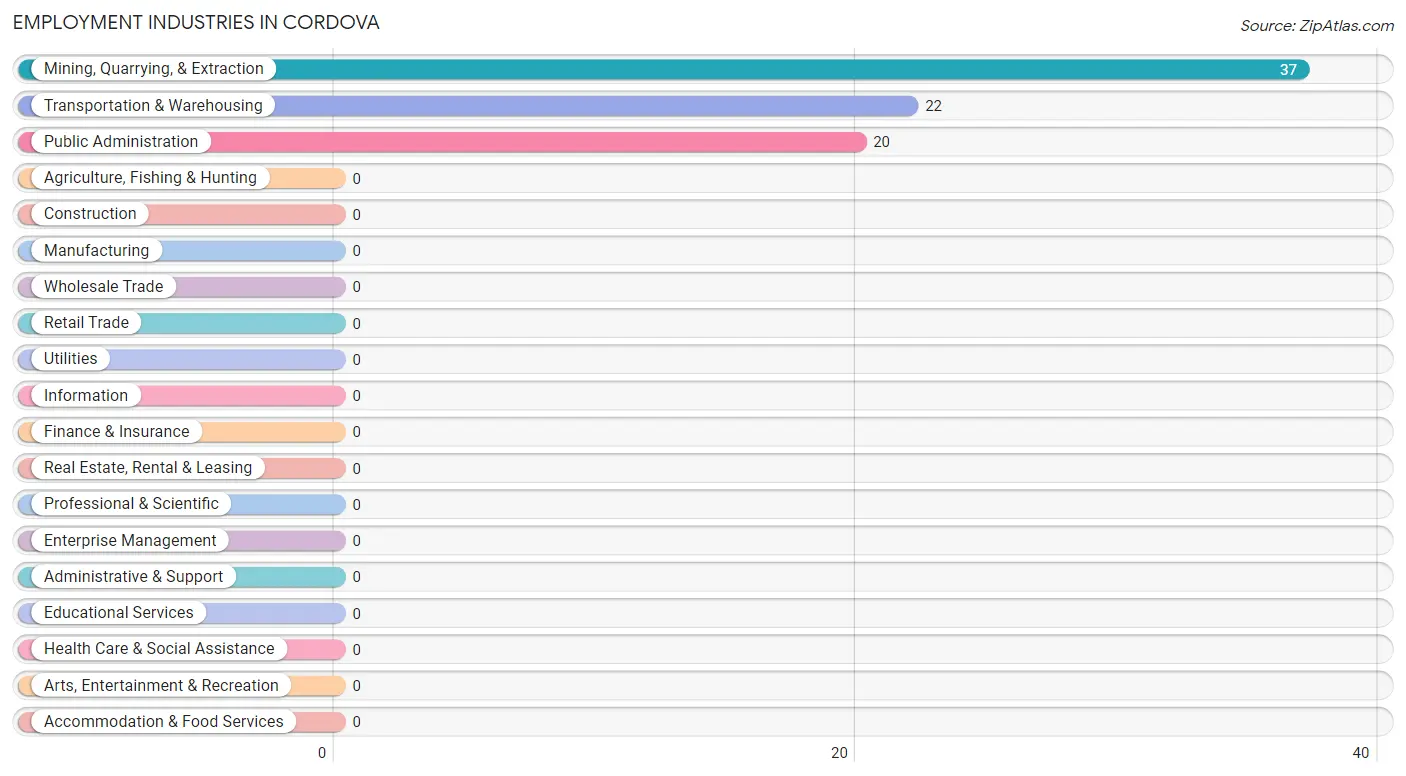
Employment Industries in Cordova
The major employment industries in Cordova include Mining, Quarrying, & Extraction (37 | 46.8%), Transportation & Warehousing (22 | 27.9%), and Public Administration (20 | 25.3%).
Employment Industries by Sex in Cordova
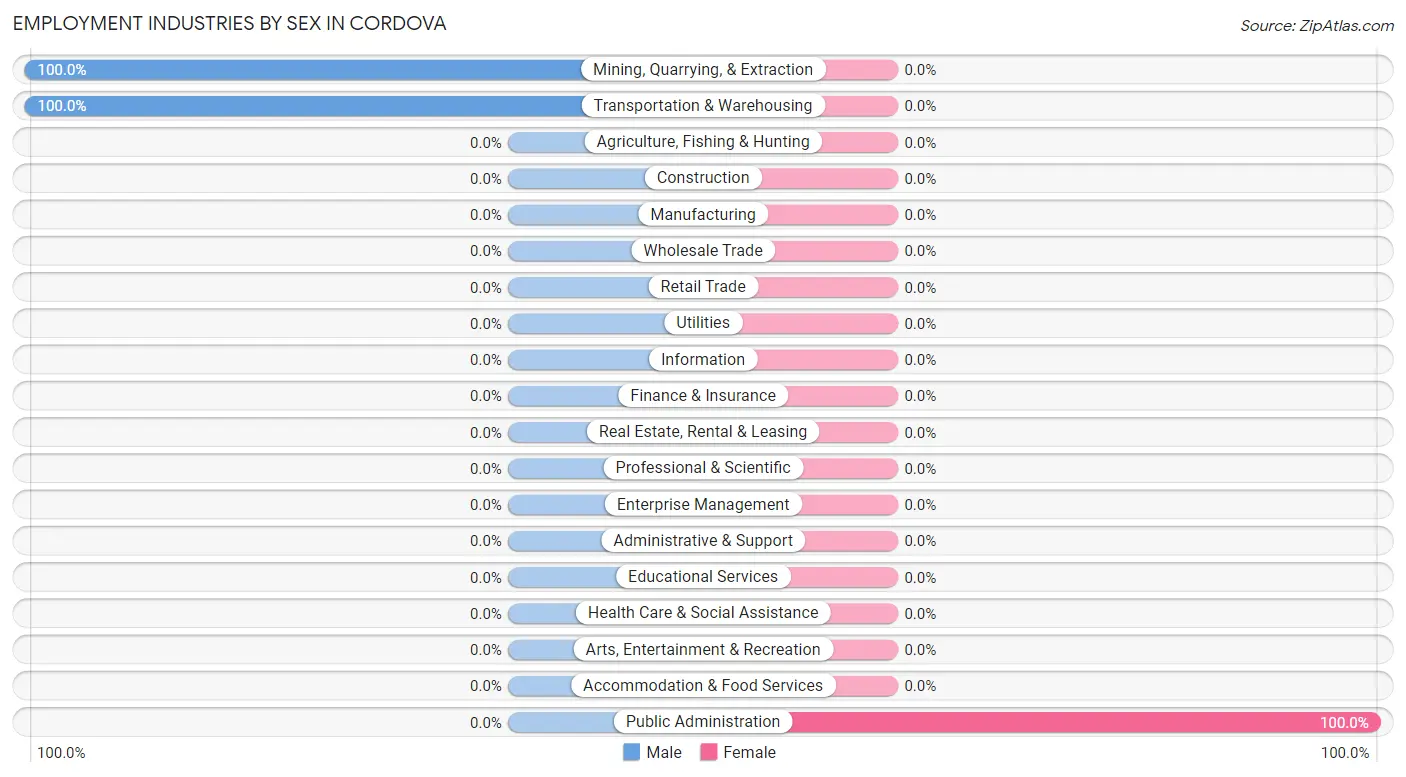
| Industry | Male | Female |
| Agriculture, Fishing & Hunting | 0 (0.0%) | 0 (0.0%) |
| Mining, Quarrying, & Extraction | 37 (100.0%) | 0 (0.0%) |
| Construction | 0 (0.0%) | 0 (0.0%) |
| Manufacturing | 0 (0.0%) | 0 (0.0%) |
| Wholesale Trade | 0 (0.0%) | 0 (0.0%) |
| Retail Trade | 0 (0.0%) | 0 (0.0%) |
| Transportation & Warehousing | 22 (100.0%) | 0 (0.0%) |
| Utilities | 0 (0.0%) | 0 (0.0%) |
| Information | 0 (0.0%) | 0 (0.0%) |
| Finance & Insurance | 0 (0.0%) | 0 (0.0%) |
| Real Estate, Rental & Leasing | 0 (0.0%) | 0 (0.0%) |
| Professional & Scientific | 0 (0.0%) | 0 (0.0%) |
| Enterprise Management | 0 (0.0%) | 0 (0.0%) |
| Administrative & Support | 0 (0.0%) | 0 (0.0%) |
| Educational Services | 0 (0.0%) | 0 (0.0%) |
| Health Care & Social Assistance | 0 (0.0%) | 0 (0.0%) |
| Arts, Entertainment & Recreation | 0 (0.0%) | 0 (0.0%) |
| Accommodation & Food Services | 0 (0.0%) | 0 (0.0%) |
| Public Administration | 0 (0.0%) | 20 (100.0%) |
| Total | 59 (74.7%) | 20 (25.3%) |
Education in Cordova
School Enrollment in Cordova
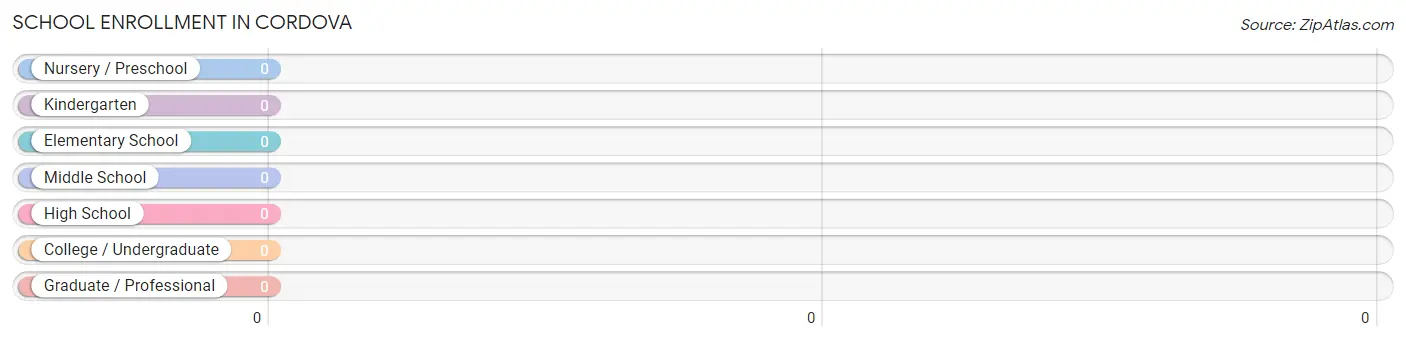
| School Level | # Students | % Students |
| Nursery / Preschool | 0 | 0.0% |
| Kindergarten | 0 | 0.0% |
| Elementary School | 0 | 0.0% |
| Middle School | 0 | 0.0% |
| High School | 0 | 0.0% |
| College / Undergraduate | 0 | 0.0% |
| Graduate / Professional | 0 | 0.0% |
| Total | 0 | 0.0% |
School Enrollment by Age by Funding Source in Cordova
| Age Bracket | Public School | Private School |
| 3 to 4 Year Olds | 0 (0.0%) | 0 (0.0%) |
| 5 to 9 Year Old | 0 (0.0%) | 0 (0.0%) |
| 10 to 14 Year Olds | 0 (0.0%) | 0 (0.0%) |
| 15 to 17 Year Olds | 0 (0.0%) | 0 (0.0%) |
| 18 to 19 Year Olds | 0 (0.0%) | 0 (0.0%) |
| 20 to 24 Year Olds | 0 (0.0%) | 0 (0.0%) |
| 25 to 34 Year Olds | 0 (0.0%) | 0 (0.0%) |
| 35 Years and over | 0 (0.0%) | 0 (0.0%) |
| Total | 0 (0.0%) | 0 (0.0%) |
Educational Attainment by Field of Study in Cordova
| Field of Study | # Graduates | % Graduates |
| Computers & Mathematics | 0 | 0.0% |
| Bio, Nature & Agricultural | 0 | 0.0% |
| Physical & Health Sciences | 0 | 0.0% |
| Psychology | 0 | 0.0% |
| Social Sciences | 0 | 0.0% |
| Engineering | 0 | 0.0% |
| Multidisciplinary Studies | 0 | 0.0% |
| Science & Technology | 0 | 0.0% |
| Business | 0 | 0.0% |
| Education | 0 | 0.0% |
| Literature & Languages | 0 | 0.0% |
| Liberal Arts & History | 0 | 0.0% |
| Visual & Performing Arts | 0 | 0.0% |
| Communications | 0 | 0.0% |
| Arts & Humanities | 0 | 0.0% |
| Total | 0 | 0.0% |
Transportation & Commute in Cordova
Vehicle Availability by Sex in Cordova
The most prevalent vehicle ownership categories in Cordova are males with 3 vehicles (59, accounting for 100.0%) and females with 3 vehicles (20, making up 295.0%).
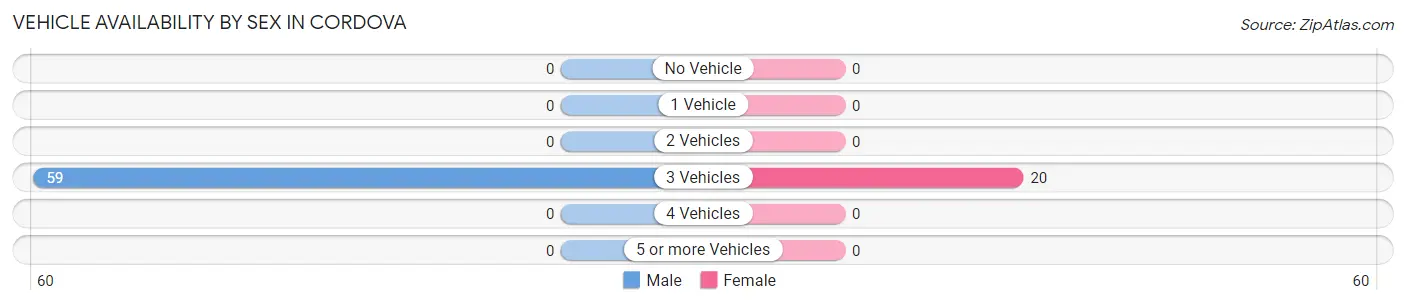
| Vehicles Available | Male | Female |
| No Vehicle | 0 (0.0%) | 0 (0.0%) |
| 1 Vehicle | 0 (0.0%) | 0 (0.0%) |
| 2 Vehicles | 0 (0.0%) | 0 (0.0%) |
| 3 Vehicles | 59 (100.0%) | 20 (100.0%) |
| 4 Vehicles | 0 (0.0%) | 0 (0.0%) |
| 5 or more Vehicles | 0 (0.0%) | 0 (0.0%) |
| Total | 59 (100.0%) | 20 (100.0%) |
Commute Time in Cordova
The most frequently occuring commute durations in Cordova are 40 to 44 minutes (59 commuters, 74.7%), 60 to 89 minutes (20 commuters, 25.3%), and less than 5 minutes (0 commuters, 0.0%).
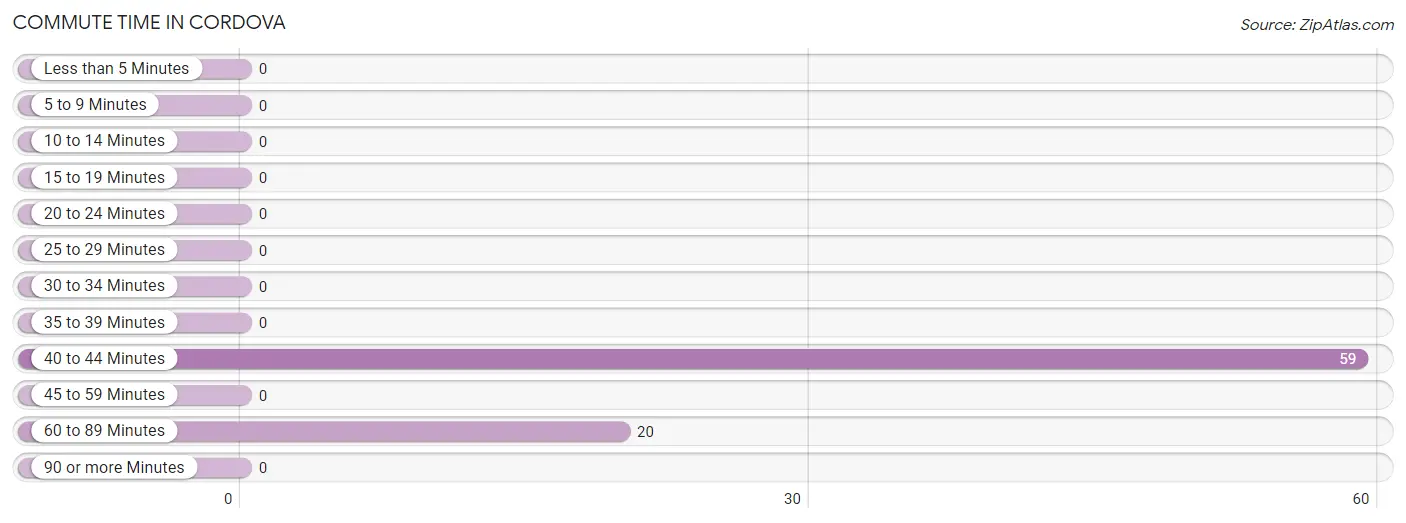
| Commute Time | # Commuters | % Commuters |
| Less than 5 Minutes | 0 | 0.0% |
| 5 to 9 Minutes | 0 | 0.0% |
| 10 to 14 Minutes | 0 | 0.0% |
| 15 to 19 Minutes | 0 | 0.0% |
| 20 to 24 Minutes | 0 | 0.0% |
| 25 to 29 Minutes | 0 | 0.0% |
| 30 to 34 Minutes | 0 | 0.0% |
| 35 to 39 Minutes | 0 | 0.0% |
| 40 to 44 Minutes | 59 | 74.7% |
| 45 to 59 Minutes | 0 | 0.0% |
| 60 to 89 Minutes | 20 | 25.3% |
| 90 or more Minutes | 0 | 0.0% |
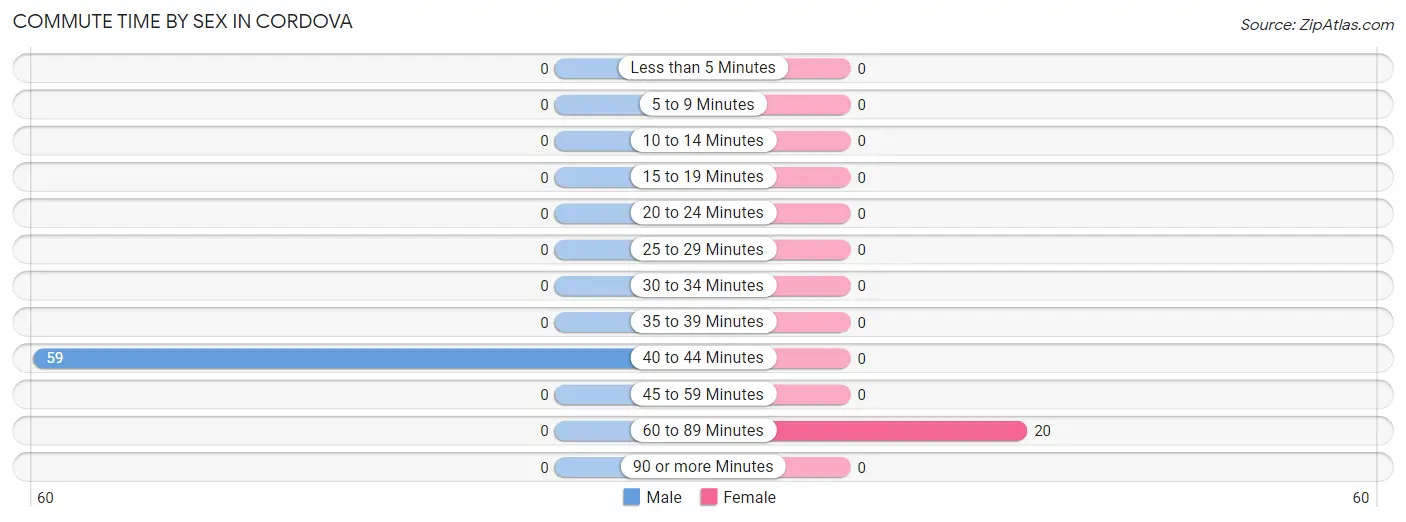
Commute Time by Sex in Cordova
The most common commute times in Cordova are 40 to 44 minutes (59 commuters, 100.0%) for males and 60 to 89 minutes (20 commuters, 100.0%) for females.
| Commute Time | Male | Female |
| Less than 5 Minutes | 0 (0.0%) | 0 (0.0%) |
| 5 to 9 Minutes | 0 (0.0%) | 0 (0.0%) |
| 10 to 14 Minutes | 0 (0.0%) | 0 (0.0%) |
| 15 to 19 Minutes | 0 (0.0%) | 0 (0.0%) |
| 20 to 24 Minutes | 0 (0.0%) | 0 (0.0%) |
| 25 to 29 Minutes | 0 (0.0%) | 0 (0.0%) |
| 30 to 34 Minutes | 0 (0.0%) | 0 (0.0%) |
| 35 to 39 Minutes | 0 (0.0%) | 0 (0.0%) |
| 40 to 44 Minutes | 59 (100.0%) | 0 (0.0%) |
| 45 to 59 Minutes | 0 (0.0%) | 0 (0.0%) |
| 60 to 89 Minutes | 0 (0.0%) | 20 (100.0%) |
| 90 or more Minutes | 0 (0.0%) | 0 (0.0%) |
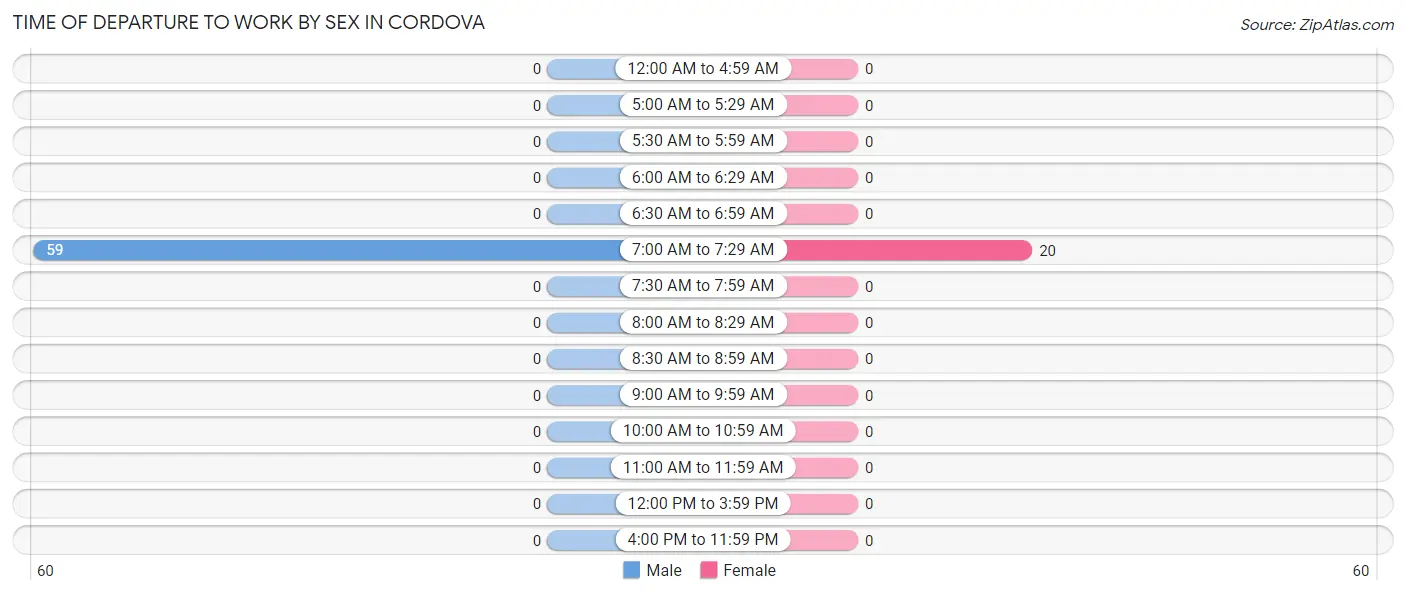
Time of Departure to Work by Sex in Cordova
The most frequent times of departure to work in Cordova are 7:00 AM to 7:29 AM (59, 100.0%) for males and 7:00 AM to 7:29 AM (20, 100.0%) for females.
| Time of Departure | Male | Female |
| 12:00 AM to 4:59 AM | 0 (0.0%) | 0 (0.0%) |
| 5:00 AM to 5:29 AM | 0 (0.0%) | 0 (0.0%) |
| 5:30 AM to 5:59 AM | 0 (0.0%) | 0 (0.0%) |
| 6:00 AM to 6:29 AM | 0 (0.0%) | 0 (0.0%) |
| 6:30 AM to 6:59 AM | 0 (0.0%) | 0 (0.0%) |
| 7:00 AM to 7:29 AM | 59 (100.0%) | 20 (100.0%) |
| 7:30 AM to 7:59 AM | 0 (0.0%) | 0 (0.0%) |
| 8:00 AM to 8:29 AM | 0 (0.0%) | 0 (0.0%) |
| 8:30 AM to 8:59 AM | 0 (0.0%) | 0 (0.0%) |
| 9:00 AM to 9:59 AM | 0 (0.0%) | 0 (0.0%) |
| 10:00 AM to 10:59 AM | 0 (0.0%) | 0 (0.0%) |
| 11:00 AM to 11:59 AM | 0 (0.0%) | 0 (0.0%) |
| 12:00 PM to 3:59 PM | 0 (0.0%) | 0 (0.0%) |
| 4:00 PM to 11:59 PM | 0 (0.0%) | 0 (0.0%) |
| Total | 59 (100.0%) | 20 (100.0%) |
Housing Occupancy in Cordova
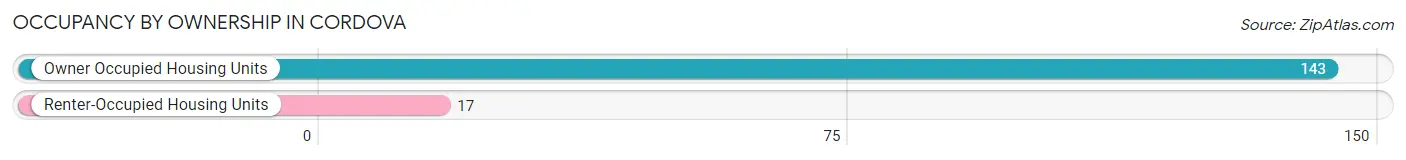
Occupancy by Ownership in Cordova
Of the total 160 dwellings in Cordova, owner-occupied units account for 143 (89.4%), while renter-occupied units make up 17 (10.6%).
| Occupancy | # Housing Units | % Housing Units |
| Owner Occupied Housing Units | 143 | 89.4% |
| Renter-Occupied Housing Units | 17 | 10.6% |
| Total Occupied Housing Units | 160 | 100.0% |
Occupancy by Household Size in Cordova
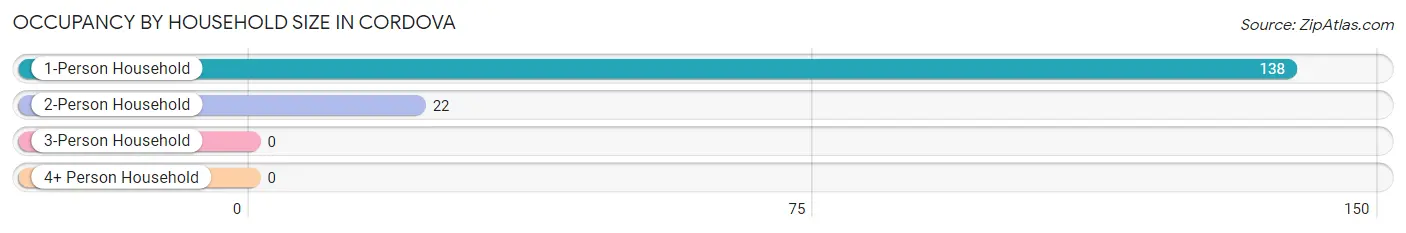
| Household Size | # Housing Units | % Housing Units |
| 1-Person Household | 138 | 86.3% |
| 2-Person Household | 22 | 13.8% |
| 3-Person Household | 0 | 0.0% |
| 4+ Person Household | 0 | 0.0% |
| Total Housing Units | 160 | 100.0% |
Occupancy by Ownership by Household Size in Cordova
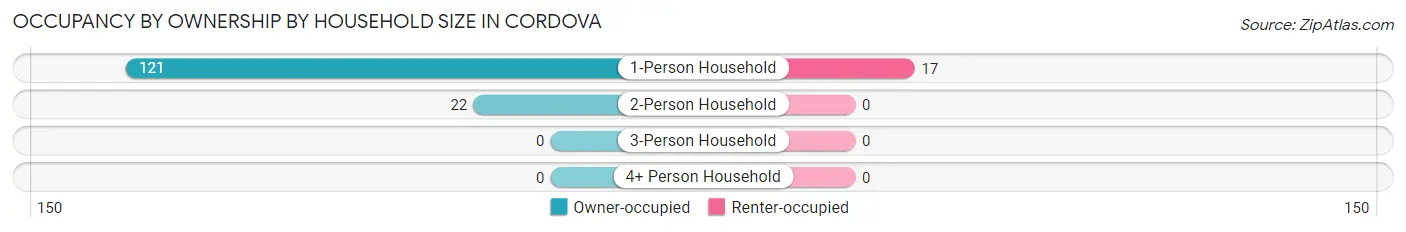
| Household Size | Owner-occupied | Renter-occupied |
| 1-Person Household | 121 (87.7%) | 17 (12.3%) |
| 2-Person Household | 22 (100.0%) | 0 (0.0%) |
| 3-Person Household | 0 (0.0%) | 0 (0.0%) |
| 4+ Person Household | 0 (0.0%) | 0 (0.0%) |
| Total Housing Units | 143 (89.4%) | 17 (10.6%) |
Occupancy by Educational Attainment in Cordova
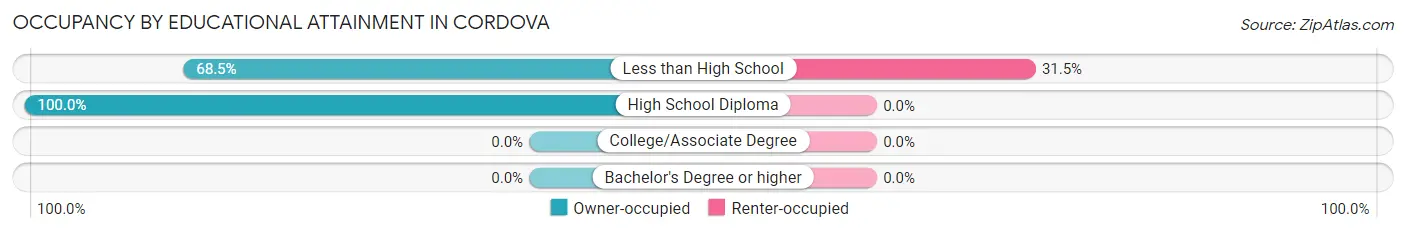
| Household Size | Owner-occupied | Renter-occupied |
| Less than High School | 37 (68.5%) | 17 (31.5%) |
| High School Diploma | 106 (100.0%) | 0 (0.0%) |
| College/Associate Degree | 0 (0.0%) | 0 (0.0%) |
| Bachelor's Degree or higher | 0 (0.0%) | 0 (0.0%) |
Occupancy by Age of Householder in Cordova
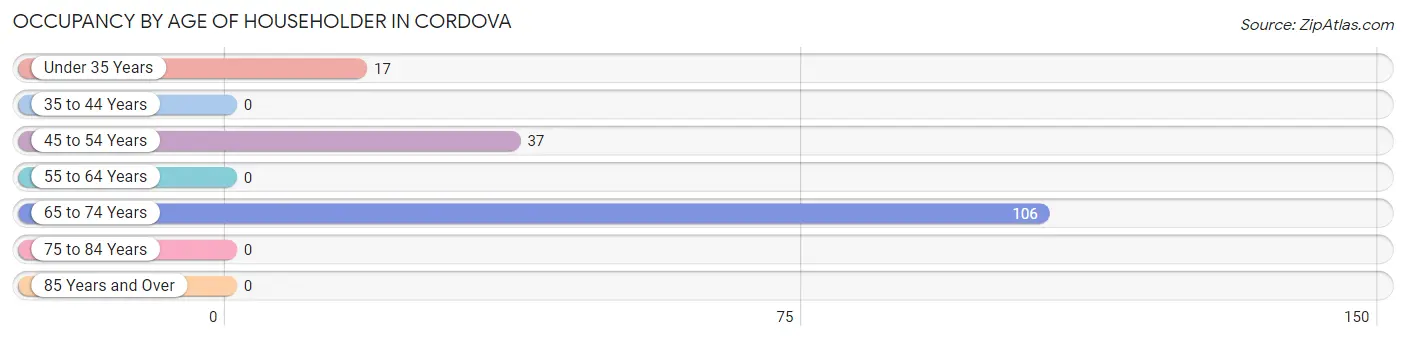
| Age Bracket | # Households | % Households |
| Under 35 Years | 17 | 10.6% |
| 35 to 44 Years | 0 | 0.0% |
| 45 to 54 Years | 37 | 23.1% |
| 55 to 64 Years | 0 | 0.0% |
| 65 to 74 Years | 106 | 66.2% |
| 75 to 84 Years | 0 | 0.0% |
| 85 Years and Over | 0 | 0.0% |
| Total | 160 | 100.0% |
Housing Finances in Cordova
Median Income by Occupancy in Cordova
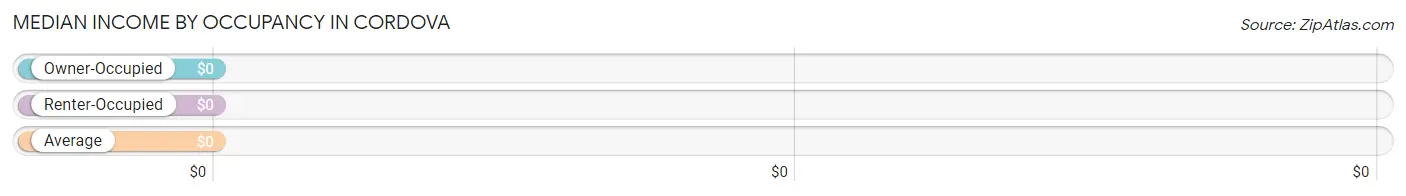
| Occupancy Type | # Households | Median Income |
| Owner-Occupied | 143 (89.4%) | $0 |
| Renter-Occupied | 17 (10.6%) | $0 |
| Average | 160 (100.0%) | $0 |
Occupancy by Householder Income Bracket in Cordova
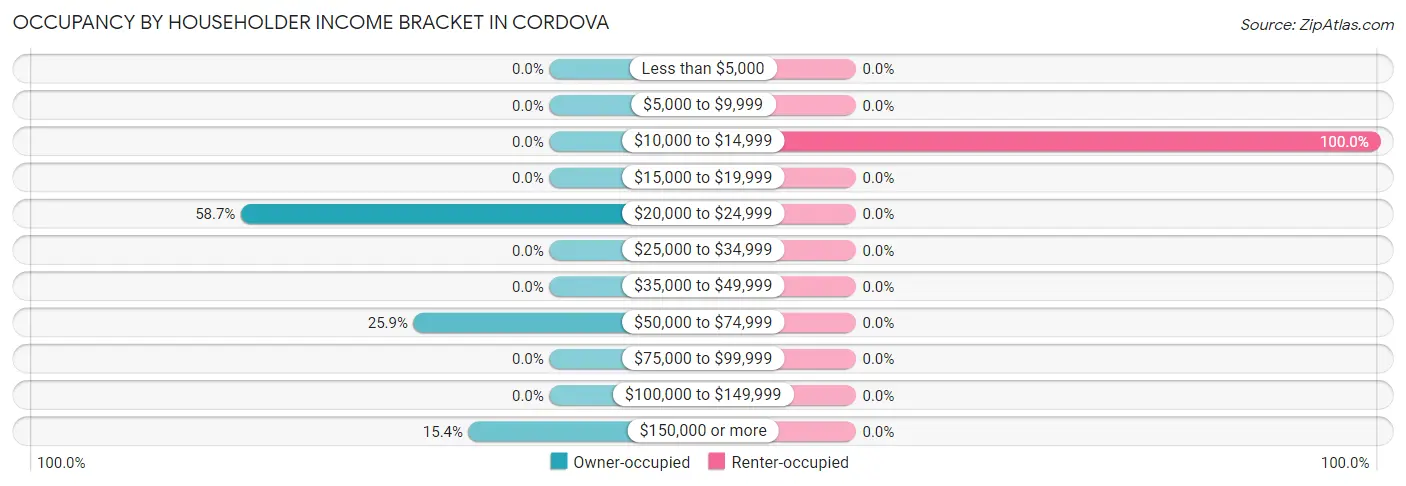
| Income Bracket | Owner-occupied | Renter-occupied |
| Less than $5,000 | 0 (0.0%) | 0 (0.0%) |
| $5,000 to $9,999 | 0 (0.0%) | 0 (0.0%) |
| $10,000 to $14,999 | 0 (0.0%) | 17 (100.0%) |
| $15,000 to $19,999 | 0 (0.0%) | 0 (0.0%) |
| $20,000 to $24,999 | 84 (58.7%) | 0 (0.0%) |
| $25,000 to $34,999 | 0 (0.0%) | 0 (0.0%) |
| $35,000 to $49,999 | 0 (0.0%) | 0 (0.0%) |
| $50,000 to $74,999 | 37 (25.9%) | 0 (0.0%) |
| $75,000 to $99,999 | 0 (0.0%) | 0 (0.0%) |
| $100,000 to $149,999 | 0 (0.0%) | 0 (0.0%) |
| $150,000 or more | 22 (15.4%) | 0 (0.0%) |
| Total | 143 (100.0%) | 17 (100.0%) |
Monthly Housing Cost Tiers in Cordova
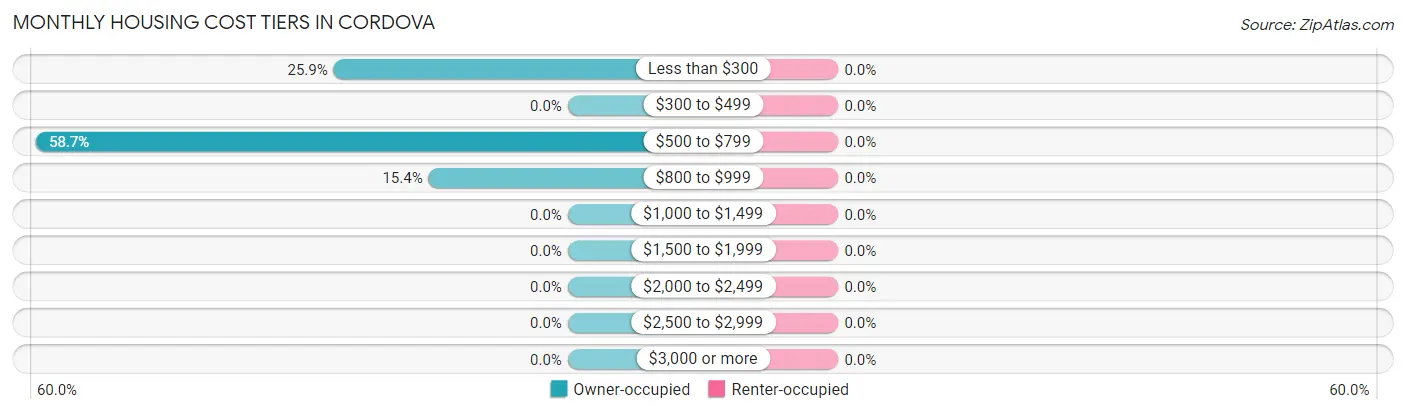
| Monthly Cost | Owner-occupied | Renter-occupied |
| Less than $300 | 37 (25.9%) | 0 (0.0%) |
| $300 to $499 | 0 (0.0%) | 0 (0.0%) |
| $500 to $799 | 84 (58.7%) | 0 (0.0%) |
| $800 to $999 | 22 (15.4%) | 0 (0.0%) |
| $1,000 to $1,499 | 0 (0.0%) | 0 (0.0%) |
| $1,500 to $1,999 | 0 (0.0%) | 0 (0.0%) |
| $2,000 to $2,499 | 0 (0.0%) | 0 (0.0%) |
| $2,500 to $2,999 | 0 (0.0%) | 0 (0.0%) |
| $3,000 or more | 0 (0.0%) | 0 (0.0%) |
| Total | 143 (100.0%) | 17 (100.0%) |
Physical Housing Characteristics in Cordova
Housing Structures in Cordova
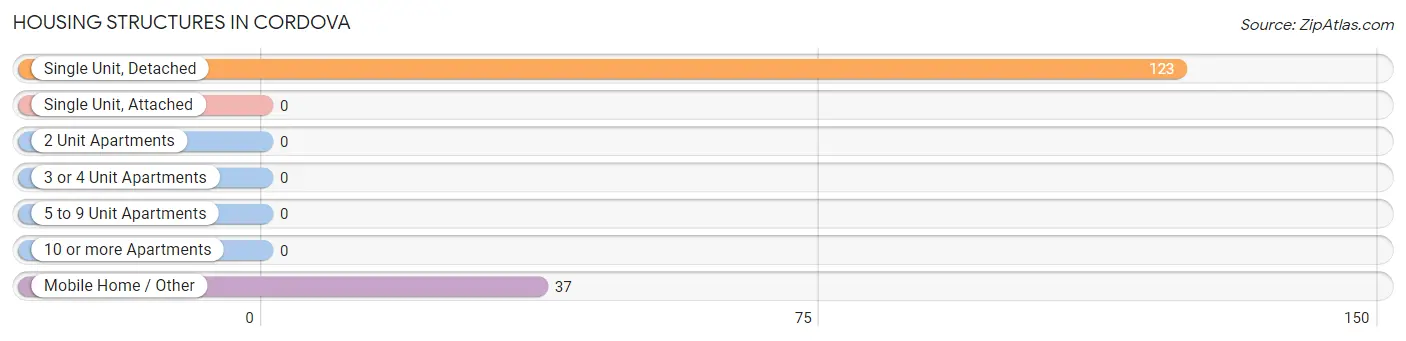
| Structure Type | # Housing Units | % Housing Units |
| Single Unit, Detached | 123 | 76.9% |
| Single Unit, Attached | 0 | 0.0% |
| 2 Unit Apartments | 0 | 0.0% |
| 3 or 4 Unit Apartments | 0 | 0.0% |
| 5 to 9 Unit Apartments | 0 | 0.0% |
| 10 or more Apartments | 0 | 0.0% |
| Mobile Home / Other | 37 | 23.1% |
| Total | 160 | 100.0% |
Housing Structures by Occupancy in Cordova
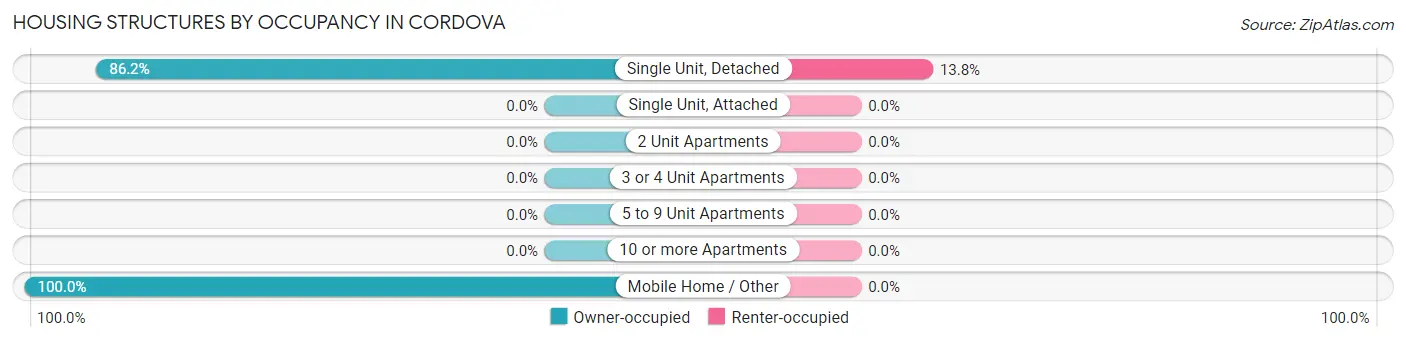
| Structure Type | Owner-occupied | Renter-occupied |
| Single Unit, Detached | 106 (86.2%) | 17 (13.8%) |
| Single Unit, Attached | 0 (0.0%) | 0 (0.0%) |
| 2 Unit Apartments | 0 (0.0%) | 0 (0.0%) |
| 3 or 4 Unit Apartments | 0 (0.0%) | 0 (0.0%) |
| 5 to 9 Unit Apartments | 0 (0.0%) | 0 (0.0%) |
| 10 or more Apartments | 0 (0.0%) | 0 (0.0%) |
| Mobile Home / Other | 37 (100.0%) | 0 (0.0%) |
| Total | 143 (89.4%) | 17 (10.6%) |
Housing Structures by Number of Rooms in Cordova
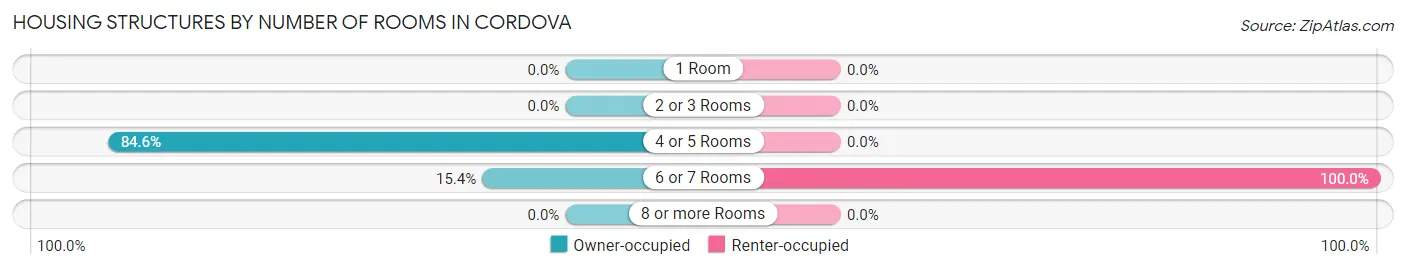
| Number of Rooms | Owner-occupied | Renter-occupied |
| 1 Room | 0 (0.0%) | 0 (0.0%) |
| 2 or 3 Rooms | 0 (0.0%) | 0 (0.0%) |
| 4 or 5 Rooms | 121 (84.6%) | 0 (0.0%) |
| 6 or 7 Rooms | 22 (15.4%) | 17 (100.0%) |
| 8 or more Rooms | 0 (0.0%) | 0 (0.0%) |
| Total | 143 (100.0%) | 17 (100.0%) |
Housing Structure by Heating Type in Cordova
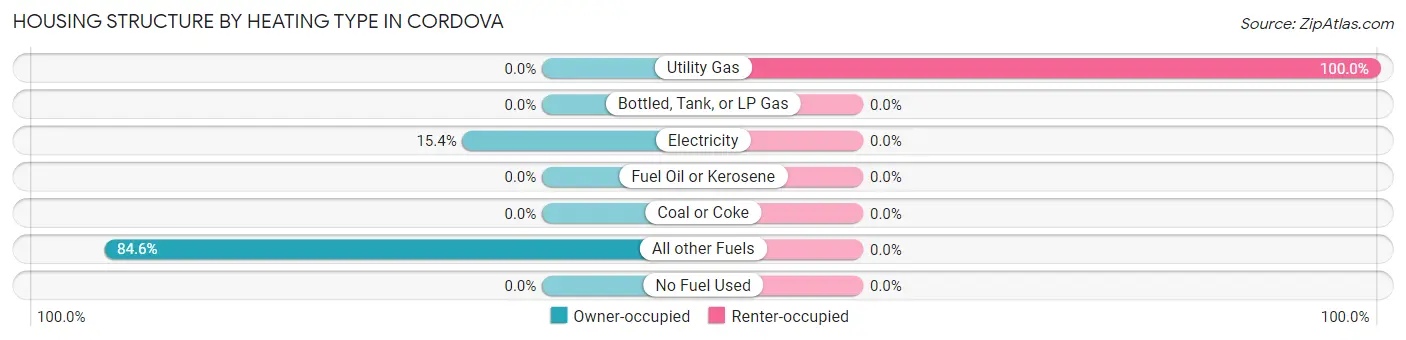
| Heating Type | Owner-occupied | Renter-occupied |
| Utility Gas | 0 (0.0%) | 17 (100.0%) |
| Bottled, Tank, or LP Gas | 0 (0.0%) | 0 (0.0%) |
| Electricity | 22 (15.4%) | 0 (0.0%) |
| Fuel Oil or Kerosene | 0 (0.0%) | 0 (0.0%) |
| Coal or Coke | 0 (0.0%) | 0 (0.0%) |
| All other Fuels | 121 (84.6%) | 0 (0.0%) |
| No Fuel Used | 0 (0.0%) | 0 (0.0%) |
| Total | 143 (100.0%) | 17 (100.0%) |
Household Vehicle Usage in Cordova
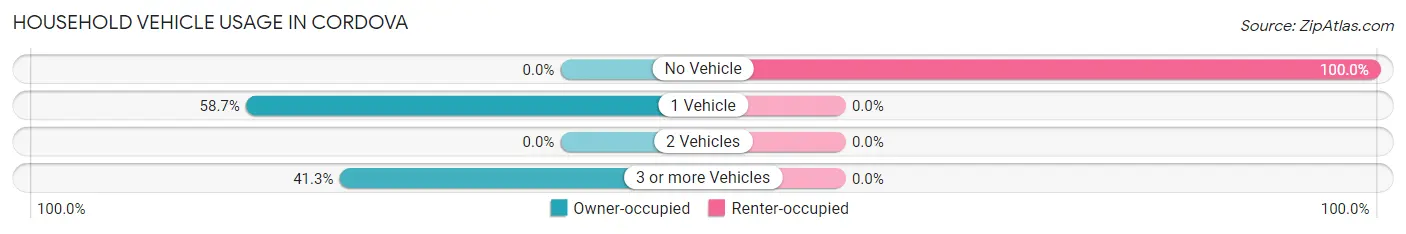
| Vehicles per Household | Owner-occupied | Renter-occupied |
| No Vehicle | 0 (0.0%) | 17 (100.0%) |
| 1 Vehicle | 84 (58.7%) | 0 (0.0%) |
| 2 Vehicles | 0 (0.0%) | 0 (0.0%) |
| 3 or more Vehicles | 59 (41.3%) | 0 (0.0%) |
| Total | 143 (100.0%) | 17 (100.0%) |
Real Estate & Mortgages in Cordova
Real Estate and Mortgage Overview in Cordova
| Characteristic | Without Mortgage | With Mortgage |
| Housing Units | 121 | 22 |
| Median Property Value | - | - |
| Median Household Income | - | - |
| Monthly Housing Costs | - | - |
| Real Estate Taxes | - | - |
Property Value by Mortgage Status in Cordova
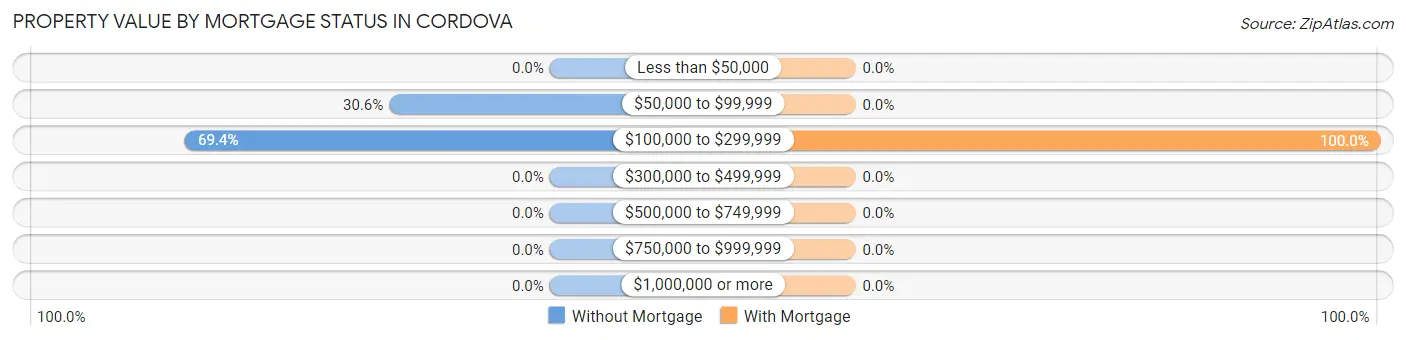
| Property Value | Without Mortgage | With Mortgage |
| Less than $50,000 | 0 (0.0%) | 0 (0.0%) |
| $50,000 to $99,999 | 37 (30.6%) | 0 (0.0%) |
| $100,000 to $299,999 | 84 (69.4%) | 22 (100.0%) |
| $300,000 to $499,999 | 0 (0.0%) | 0 (0.0%) |
| $500,000 to $749,999 | 0 (0.0%) | 0 (0.0%) |
| $750,000 to $999,999 | 0 (0.0%) | 0 (0.0%) |
| $1,000,000 or more | 0 (0.0%) | 0 (0.0%) |
| Total | 121 (100.0%) | 22 (100.0%) |
Household Income by Mortgage Status in Cordova
| Household Income | Without Mortgage | With Mortgage |
| Less than $10,000 | 0 (0.0%) | 0 (0.0%) |
| $10,000 to $24,999 | 84 (69.4%) | 0 (0.0%) |
| $25,000 to $34,999 | 0 (0.0%) | 0 (0.0%) |
| $35,000 to $49,999 | 0 (0.0%) | 0 (0.0%) |
| $50,000 to $74,999 | 37 (30.6%) | 0 (0.0%) |
| $75,000 to $99,999 | 0 (0.0%) | 0 (0.0%) |
| $100,000 to $149,999 | 0 (0.0%) | 0 (0.0%) |
| $150,000 or more | 0 (0.0%) | 0 (0.0%) |
| Total | 121 (100.0%) | 22 (100.0%) |
Property Value to Household Income Ratio in Cordova
| Value-to-Income Ratio | Without Mortgage | With Mortgage |
| Less than 2.0x | 37 (30.6%) | 0 (0.0%) |
| 2.0x to 2.9x | 0 (0.0%) | 22 (100.0%) |
| 3.0x to 3.9x | 0 (0.0%) | 0 (0.0%) |
| 4.0x or more | 84 (69.4%) | 0 (0.0%) |
| Total | 121 (100.0%) | 22 (100.0%) |
Real Estate Taxes by Mortgage Status in Cordova
| Property Taxes | Without Mortgage | With Mortgage |
| Less than $800 | 121 (100.0%) | 0 (0.0%) |
| $800 to $1,499 | 0 (0.0%) | 22 (100.0%) |
| $800 to $1,499 | 0 (0.0%) | 0 (0.0%) |
| Total | 121 (100.0%) | 22 (100.0%) |
Health & Disability in Cordova
Health Insurance Coverage by Age in Cordova
| Age Bracket | With Coverage | Without Coverage |
| Under 6 Years | 0 (0.0%) | 0 (0.0%) |
| 6 to 18 Years | 0 (0.0%) | 0 (0.0%) |
| 19 to 25 Years | 0 (0.0%) | 0 (0.0%) |
| 26 to 34 Years | 17 (100.0%) | 0 (0.0%) |
| 35 to 44 Years | 0 (0.0%) | 0 (0.0%) |
| 45 to 54 Years | 57 (100.0%) | 0 (0.0%) |
| 55 to 64 Years | 0 (0.0%) | 0 (0.0%) |
| 65 to 74 Years | 106 (100.0%) | 0 (0.0%) |
| 75 Years and older | 0 (0.0%) | 0 (0.0%) |
| Total | 180 (100.0%) | 0 (0.0%) |
Health Insurance Coverage by Citizenship Status in Cordova
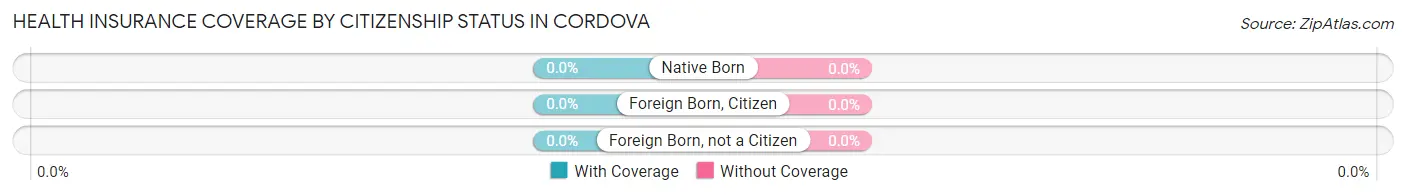
| Citizenship Status | With Coverage | Without Coverage |
| Native Born | 0 (0.0%) | 0 (0.0%) |
| Foreign Born, Citizen | 0 (0.0%) | 0 (0.0%) |
| Foreign Born, not a Citizen | 0 (0.0%) | 0 (0.0%) |
Health Insurance Coverage by Household Income in Cordova
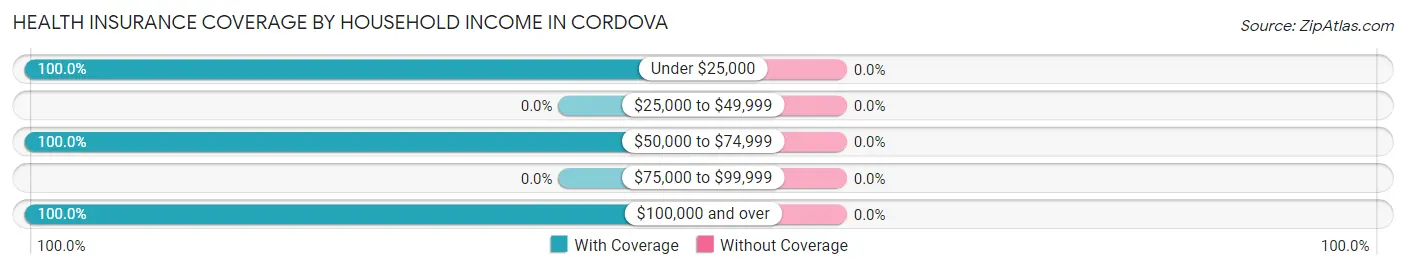
| Household Income | With Coverage | Without Coverage |
| Under $25,000 | 101 (100.0%) | 0 (0.0%) |
| $25,000 to $49,999 | 0 (0.0%) | 0 (0.0%) |
| $50,000 to $74,999 | 37 (100.0%) | 0 (0.0%) |
| $75,000 to $99,999 | 0 (0.0%) | 0 (0.0%) |
| $100,000 and over | 42 (100.0%) | 0 (0.0%) |
Public vs Private Health Insurance Coverage by Age in Cordova
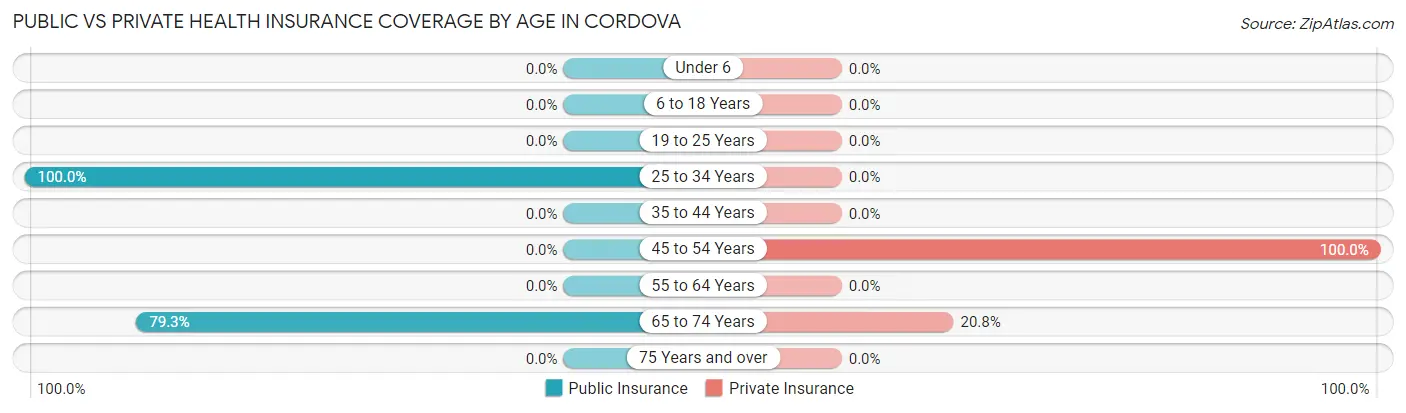
| Age Bracket | Public Insurance | Private Insurance |
| Under 6 | 0 (0.0%) | 0 (0.0%) |
| 6 to 18 Years | 0 (0.0%) | 0 (0.0%) |
| 19 to 25 Years | 0 (0.0%) | 0 (0.0%) |
| 25 to 34 Years | 17 (100.0%) | 0 (0.0%) |
| 35 to 44 Years | 0 (0.0%) | 0 (0.0%) |
| 45 to 54 Years | 0 (0.0%) | 57 (100.0%) |
| 55 to 64 Years | 0 (0.0%) | 0 (0.0%) |
| 65 to 74 Years | 84 (79.2%) | 22 (20.7%) |
| 75 Years and over | 0 (0.0%) | 0 (0.0%) |
| Total | 101 (56.1%) | 79 (43.9%) |
Disability Status by Sex by Age in Cordova
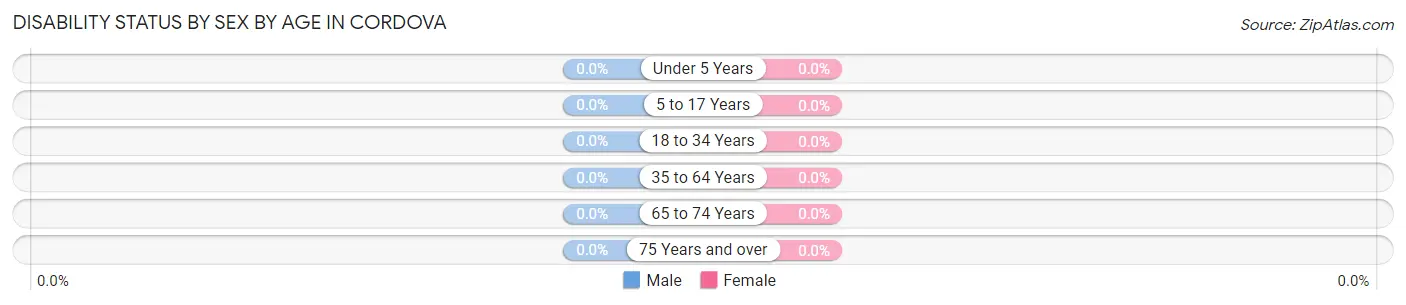
| Age Bracket | Male | Female |
| Under 5 Years | 0 (0.0%) | 0 (0.0%) |
| 5 to 17 Years | 0 (0.0%) | 0 (0.0%) |
| 18 to 34 Years | 0 (0.0%) | 0 (0.0%) |
| 35 to 64 Years | 0 (0.0%) | 0 (0.0%) |
| 65 to 74 Years | 0 (0.0%) | 0 (0.0%) |
| 75 Years and over | 0 (0.0%) | 0 (0.0%) |
Disability Class by Sex by Age in Cordova
Disability Class: Hearing Difficulty
| Age Bracket | Male | Female |
| Under 5 Years | 0 (0.0%) | 0 (0.0%) |
| 5 to 17 Years | 0 (0.0%) | 0 (0.0%) |
| 18 to 34 Years | 0 (0.0%) | 0 (0.0%) |
| 35 to 64 Years | 0 (0.0%) | 0 (0.0%) |
| 65 to 74 Years | 0 (0.0%) | 0 (0.0%) |
| 75 Years and over | 0 (0.0%) | 0 (0.0%) |
Disability Class: Vision Difficulty
| Age Bracket | Male | Female |
| Under 5 Years | 0 (0.0%) | 0 (0.0%) |
| 5 to 17 Years | 0 (0.0%) | 0 (0.0%) |
| 18 to 34 Years | 0 (0.0%) | 0 (0.0%) |
| 35 to 64 Years | 0 (0.0%) | 0 (0.0%) |
| 65 to 74 Years | 0 (0.0%) | 0 (0.0%) |
| 75 Years and over | 0 (0.0%) | 0 (0.0%) |
Disability Class: Cognitive Difficulty
| Age Bracket | Male | Female |
| 5 to 17 Years | 0 (0.0%) | 0 (0.0%) |
| 18 to 34 Years | 0 (0.0%) | 0 (0.0%) |
| 35 to 64 Years | 0 (0.0%) | 0 (0.0%) |
| 65 to 74 Years | 0 (0.0%) | 0 (0.0%) |
| 75 Years and over | 0 (0.0%) | 0 (0.0%) |
Disability Class: Ambulatory Difficulty
| Age Bracket | Male | Female |
| 5 to 17 Years | 0 (0.0%) | 0 (0.0%) |
| 18 to 34 Years | 0 (0.0%) | 0 (0.0%) |
| 35 to 64 Years | 0 (0.0%) | 0 (0.0%) |
| 65 to 74 Years | 0 (0.0%) | 0 (0.0%) |
| 75 Years and over | 0 (0.0%) | 0 (0.0%) |
Disability Class: Self-Care Difficulty
| Age Bracket | Male | Female |
| 5 to 17 Years | 0 (0.0%) | 0 (0.0%) |
| 18 to 34 Years | 0 (0.0%) | 0 (0.0%) |
| 35 to 64 Years | 0 (0.0%) | 0 (0.0%) |
| 65 to 74 Years | 0 (0.0%) | 0 (0.0%) |
| 75 Years and over | 0 (0.0%) | 0 (0.0%) |
Technology Access in Cordova
Computing Device Access in Cordova
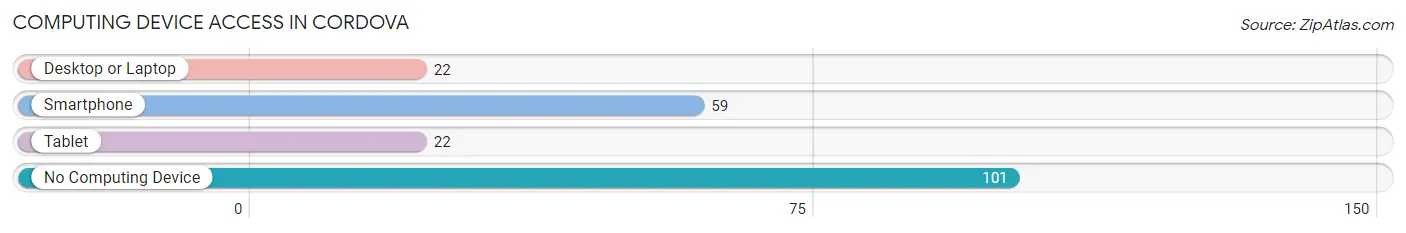
| Device Type | # Households | % Households |
| Desktop or Laptop | 22 | 13.8% |
| Smartphone | 59 | 36.9% |
| Tablet | 22 | 13.8% |
| No Computing Device | 101 | 63.1% |
| Total | 160 | 100.0% |
Internet Access in Cordova
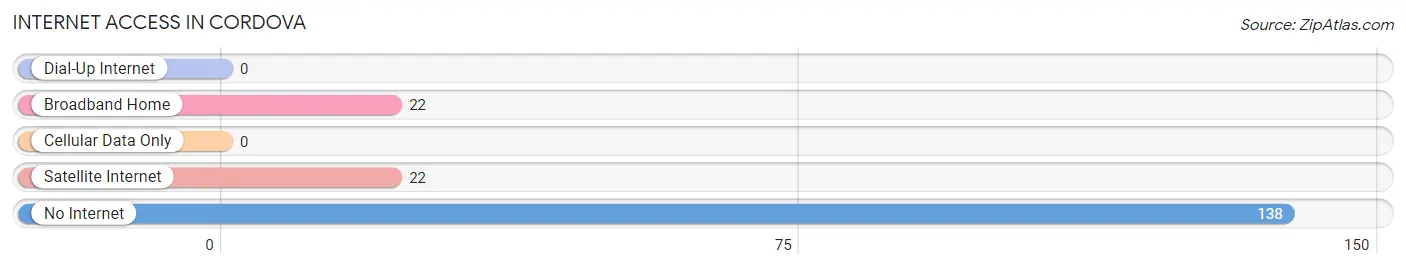
| Internet Type | # Households | % Households |
| Dial-Up Internet | 0 | 0.0% |
| Broadband Home | 22 | 13.8% |
| Cellular Data Only | 0 | 0.0% |
| Satellite Internet | 22 | 13.8% |
| No Internet | 138 | 86.3% |
| Total | 160 | 100.0% |
Cordova Summary
Cordova is a small town located in the state of New Mexico, United States. It is situated in the Rio Grande Valley, about 25 miles south of Albuquerque. The town was founded in 1881 and has a population of about 1,000 people.
Geography
Cordova is located in the Rio Grande Valley, which is a large valley that stretches from the Colorado River to the Gulf of Mexico. The town is situated on the east side of the valley, near the Rio Grande River. The town is surrounded by mountains, including the Sandia Mountains to the east and the Manzano Mountains to the west. The climate in Cordova is semi-arid, with hot summers and mild winters.
Economy
The economy of Cordova is largely based on agriculture. The town is home to several farms and ranches, which produce a variety of crops, including alfalfa, corn, cotton, and wheat. The town also has a few small businesses, including a grocery store, a hardware store, and a few restaurants.
Demographics
As of the 2010 census, the population of Cordova was 1,000 people. The racial makeup of the town was 94.2% White, 0.7% African American, 0.7% Native American, 0.7% Asian, 0.7% from other races, and 2.7% from two or more races. The median household income was $30,000, and the median family income was $35,000.
History
Cordova was founded in 1881 by a group of settlers from Mexico. The town was named after the Spanish explorer Francisco Vázquez de Coronado, who explored the area in the 16th century. The town grew slowly over the years, and by the early 20th century, it had become a small farming community.
In the 1950s, the town began to experience a population boom, as many people moved to the area to take advantage of the agricultural opportunities. The town continued to grow throughout the 20th century, and today it is a small but thriving community.
Conclusion
Cordova is a small town located in the Rio Grande Valley of New Mexico. It has a population of about 1,000 people and is largely based on agriculture. The town has a rich history, and it has experienced a population boom in recent years. The town is home to several farms and ranches, and it has a few small businesses. The town is a great place to live, and it offers a unique blend of culture, history, and natural beauty.
Common Questions
What is Per Capita Income in Cordova?
Per Capita income in Cordova is $58,966.
What is Inequality or Gini Index in Cordova?
Inequality or Gini Index in Cordova is 0.55.
What is the Total Population of Cordova?
Total Population of Cordova is 180.
What is the Total Male Population of Cordova?
Total Male Population of Cordova is 59.
What is the Total Female Population of Cordova?
Total Female Population of Cordova is 121.
What is the Ratio of Males per 100 Females in Cordova?
There are 48.76 Males per 100 Females in Cordova.
What is the Ratio of Females per 100 Males in Cordova?
There are 205.08 Females per 100 Males in Cordova.
What is the Median Population Age in Cordova?
Median Population Age in Cordova is 68.7 Years.
What is the Average Family Size in Cordova
Average Family Size in Cordova is 1.9 People.
What is the Average Household Size in Cordova
Average Household Size in Cordova is 1.1 People.
How Large is the Labor Force in Cordova?
There are 79 People in the Labor Forcein in Cordova.
What is the Percentage of People in the Labor Force in Cordova?
43.9% of People are in the Labor Force in Cordova.