Cruzville, NM Map & Demographics
Cruzville Map
Cruzville Overview
$23,785
PER CAPITA INCOME
$58,603
AVG HOUSEHOLD INCOME
0.40
INEQUALITY / GINI INDEX
279
TOTAL POPULATION
208
MALE POPULATION
71
FEMALE POPULATION
292.96
MALES / 100 FEMALES
34.13
FEMALES / 100 MALES
25.3
MEDIAN AGE
7.7
AVG FAMILY SIZE
5.5
AVG HOUSEHOLD SIZE
63
LABOR FORCE [ PEOPLE ]
22.6%
PERCENT IN LABOR FORCE
Income in Cruzville
Income Overview in Cruzville
| Characteristic | Number | Measure |
| Per Capita Income | 279 | $23,785 |
| Median Family Income | 34 | $0 |
| Mean Family Income | 34 | $135,418 |
| Median Household Income | 51 | $58,603 |
| Mean Household Income | 51 | $109,539 |
| Income Deficit | 34 | $0 |
| Wage / Income Gap (%) | 279 | 0.00% |
| Wage / Income Gap ($) | 279 | 100.00¢ per $1 |
| Gini / Inequality Index | 279 | 0.40 |
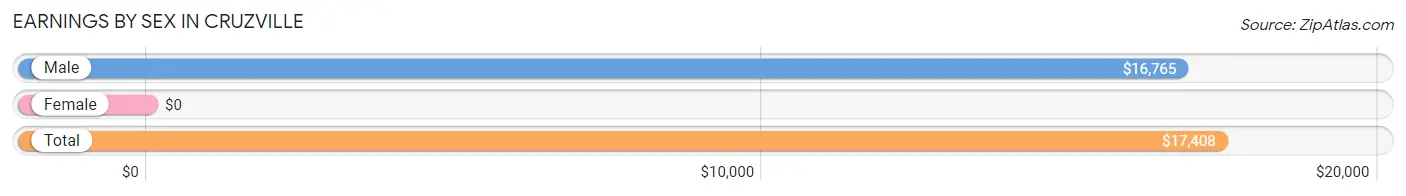
Earnings by Sex in Cruzville
| Sex | Number | Average Earnings |
| Male | 96 (73.3%) | $16,765 |
| Female | 35 (26.7%) | $0 |
| Total | 131 (100.0%) | $17,408 |
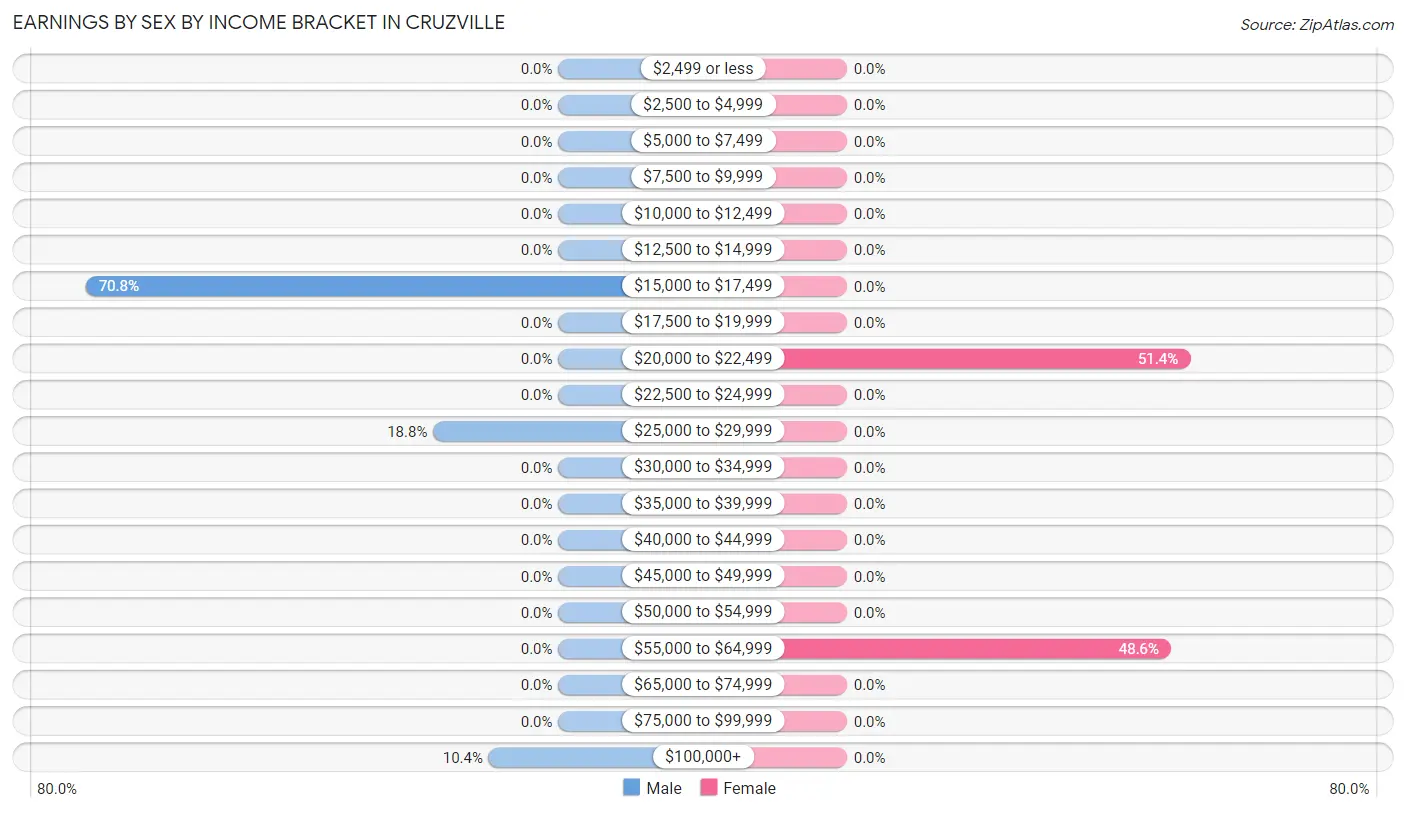
Earnings by Sex by Income Bracket in Cruzville
The most common earnings brackets in Cruzville are $15,000 to $17,499 for men (68 | 70.8%) and $20,000 to $22,499 for women (18 | 51.4%).
| Income | Male | Female |
| $2,499 or less | 0 (0.0%) | 0 (0.0%) |
| $2,500 to $4,999 | 0 (0.0%) | 0 (0.0%) |
| $5,000 to $7,499 | 0 (0.0%) | 0 (0.0%) |
| $7,500 to $9,999 | 0 (0.0%) | 0 (0.0%) |
| $10,000 to $12,499 | 0 (0.0%) | 0 (0.0%) |
| $12,500 to $14,999 | 0 (0.0%) | 0 (0.0%) |
| $15,000 to $17,499 | 68 (70.8%) | 0 (0.0%) |
| $17,500 to $19,999 | 0 (0.0%) | 0 (0.0%) |
| $20,000 to $22,499 | 0 (0.0%) | 18 (51.4%) |
| $22,500 to $24,999 | 0 (0.0%) | 0 (0.0%) |
| $25,000 to $29,999 | 18 (18.8%) | 0 (0.0%) |
| $30,000 to $34,999 | 0 (0.0%) | 0 (0.0%) |
| $35,000 to $39,999 | 0 (0.0%) | 0 (0.0%) |
| $40,000 to $44,999 | 0 (0.0%) | 0 (0.0%) |
| $45,000 to $49,999 | 0 (0.0%) | 0 (0.0%) |
| $50,000 to $54,999 | 0 (0.0%) | 0 (0.0%) |
| $55,000 to $64,999 | 0 (0.0%) | 17 (48.6%) |
| $65,000 to $74,999 | 0 (0.0%) | 0 (0.0%) |
| $75,000 to $99,999 | 0 (0.0%) | 0 (0.0%) |
| $100,000+ | 10 (10.4%) | 0 (0.0%) |
| Total | 96 (100.0%) | 35 (100.0%) |
Earnings by Sex by Educational Attainment in Cruzville
| Educational Attainment | Male Income | Female Income |
| Less than High School | - | - |
| High School Diploma | - | - |
| College or Associate's Degree | - | - |
| Bachelor's Degree | - | - |
| Graduate Degree | - | - |
| Total | - | - |
Family Income in Cruzville
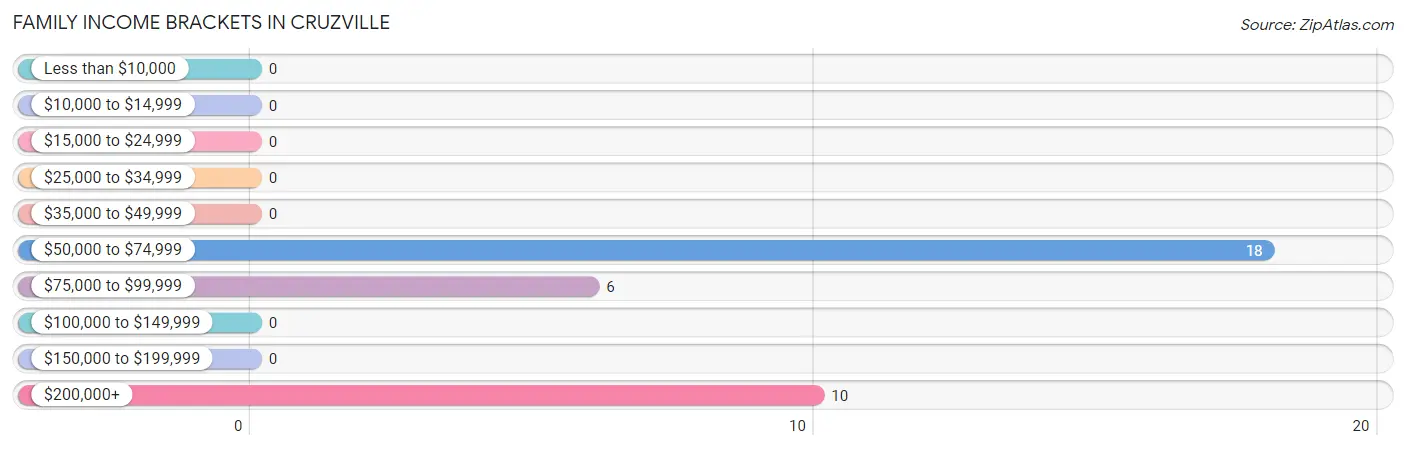
Family Income Brackets in Cruzville
According to the Cruzville family income data, there are 18 families falling into the $50,000 to $74,999 income range, which is the most common income bracket and makes up 52.9% of all families.
| Income Bracket | # Families | % Families |
| Less than $10,000 | 0 | 0.0% |
| $10,000 to $14,999 | 0 | 0.0% |
| $15,000 to $24,999 | 0 | 0.0% |
| $25,000 to $34,999 | 0 | 0.0% |
| $35,000 to $49,999 | 0 | 0.0% |
| $50,000 to $74,999 | 18 | 52.9% |
| $75,000 to $99,999 | 6 | 17.6% |
| $100,000 to $149,999 | 0 | 0.0% |
| $150,000 to $199,999 | 0 | 0.0% |
| $200,000+ | 10 | 29.4% |
Family Income by Famaliy Size in Cruzville
| Income Bracket | # Families | Median Income |
| 2-Person Families | 6 (17.6%) | $0 |
| 3-Person Families | 10 (29.4%) | $0 |
| 4-Person Families | 0 (0.0%) | $0 |
| 5-Person Families | 18 (52.9%) | $0 |
| 6-Person Families | 0 (0.0%) | $0 |
| 7+ Person Families | 0 (0.0%) | $0 |
| Total | 34 (100.0%) | $0 |
Family Income by Number of Earners in Cruzville
| Number of Earners | # Families | Median Income |
| No Earners | 6 (17.6%) | $0 |
| 1 Earner | 0 (0.0%) | $0 |
| 2 Earners | 28 (82.4%) | $0 |
| 3+ Earners | 0 (0.0%) | $0 |
| Total | 34 (100.0%) | $0 |
Household Income in Cruzville
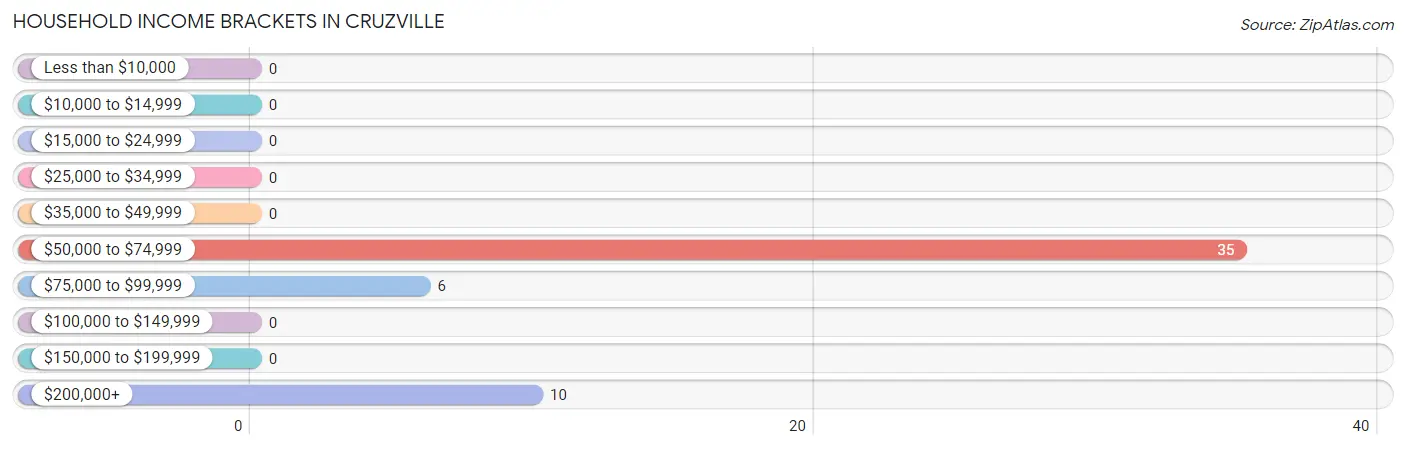
Household Income Brackets in Cruzville
With 35 households falling in the category, the $50,000 to $74,999 income range is the most frequent in Cruzville, accounting for 68.6% of all households.
| Income Bracket | # Households | % Households |
| Less than $10,000 | 0 | 0.0% |
| $10,000 to $14,999 | 0 | 0.0% |
| $15,000 to $24,999 | 0 | 0.0% |
| $25,000 to $34,999 | 0 | 0.0% |
| $35,000 to $49,999 | 0 | 0.0% |
| $50,000 to $74,999 | 35 | 68.6% |
| $75,000 to $99,999 | 6 | 11.8% |
| $100,000 to $149,999 | 0 | 0.0% |
| $150,000 to $199,999 | 0 | 0.0% |
| $200,000+ | 10 | 19.6% |
Household Income by Householder Age in Cruzville
| Income Bracket | # Households | Median Income |
| 15 to 24 Years | 0 (0.0%) | $0 |
| 25 to 44 Years | 17 (33.3%) | $0 |
| 45 to 64 Years | 28 (54.9%) | $0 |
| 65+ Years | 6 (11.8%) | $0 |
| Total | 51 (100.0%) | $58,603 |
Poverty in Cruzville
Income Below Poverty by Sex and Age in Cruzville
| Age Bracket | Male | Female |
| Under 5 Years | 0 (0.0%) | 0 (0.0%) |
| 5 Years | 0 (0.0%) | 0 (0.0%) |
| 6 to 11 Years | 0 (0.0%) | 0 (0.0%) |
| 12 to 14 Years | 0 (0.0%) | 0 (0.0%) |
| 15 Years | 0 (0.0%) | 0 (0.0%) |
| 16 and 17 Years | 0 (0.0%) | 0 (0.0%) |
| 18 to 24 Years | 0 (0.0%) | 0 (0.0%) |
| 25 to 34 Years | 0 (0.0%) | 0 (0.0%) |
| 35 to 44 Years | 0 (0.0%) | 0 (0.0%) |
| 45 to 54 Years | 0 (0.0%) | 0 (0.0%) |
| 55 to 64 Years | 0 (0.0%) | 0 (0.0%) |
| 65 to 74 Years | 0 (0.0%) | 0 (0.0%) |
| 75 Years and over | 0 (0.0%) | 0 (0.0%) |
| Total | 0 (0.0%) | 0 (0.0%) |
Income Above Poverty by Sex and Age in Cruzville
According to the poverty statistics in Cruzville, males aged 16 and 17 years and females aged 35 to 44 years are the age groups that are most secure financially, with 100.0% of males and 100.0% of females in these age groups living above the poverty line.
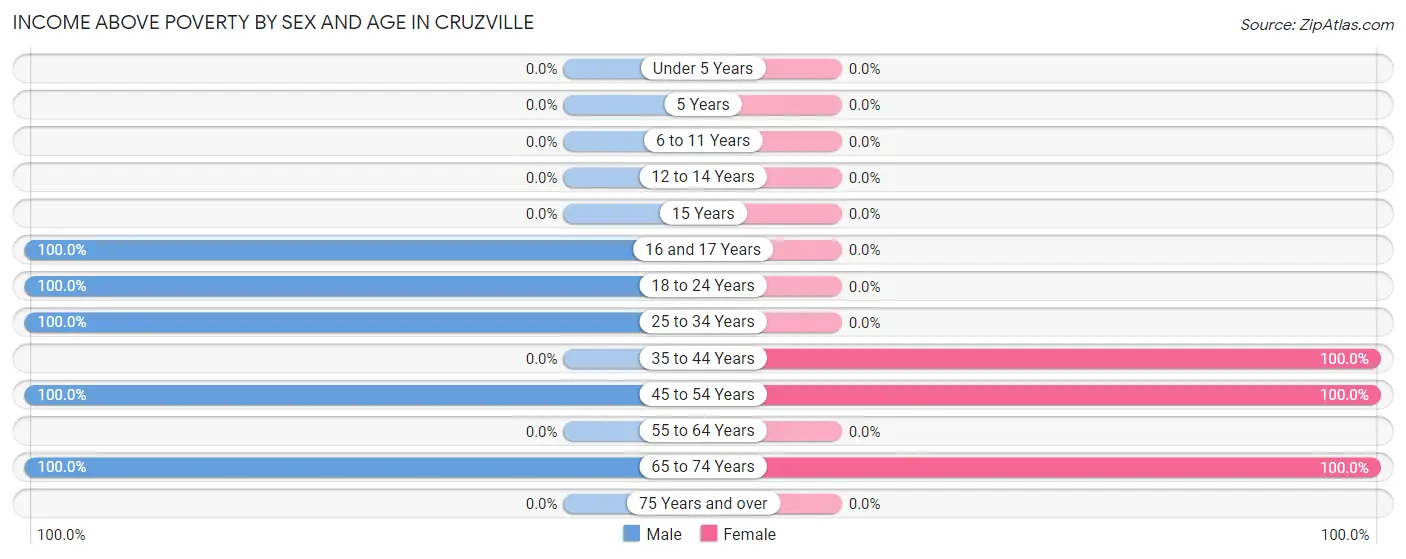
| Age Bracket | Male | Female |
| Under 5 Years | 0 (0.0%) | 0 (0.0%) |
| 5 Years | 0 (0.0%) | 0 (0.0%) |
| 6 to 11 Years | 0 (0.0%) | 0 (0.0%) |
| 12 to 14 Years | 0 (0.0%) | 0 (0.0%) |
| 15 Years | 0 (0.0%) | 0 (0.0%) |
| 16 and 17 Years | 16 (100.0%) | 0 (0.0%) |
| 18 to 24 Years | 109 (100.0%) | 0 (0.0%) |
| 25 to 34 Years | 49 (100.0%) | 0 (0.0%) |
| 35 to 44 Years | 0 (0.0%) | 17 (100.0%) |
| 45 to 54 Years | 28 (100.0%) | 46 (100.0%) |
| 55 to 64 Years | 0 (0.0%) | 0 (0.0%) |
| 65 to 74 Years | 6 (100.0%) | 8 (100.0%) |
| 75 Years and over | 0 (0.0%) | 0 (0.0%) |
| Total | 208 (100.0%) | 71 (100.0%) |
Income Below Poverty Among Married-Couple Families in Cruzville
| Children | Above Poverty | Below Poverty |
| No Children | 16 (100.0%) | 0 (0.0%) |
| 1 or 2 Children | 18 (100.0%) | 0 (0.0%) |
| 3 or 4 Children | 0 (0.0%) | 0 (0.0%) |
| 5 or more Children | 0 (0.0%) | 0 (0.0%) |
| Total | 34 (100.0%) | 0 (0.0%) |
Income Below Poverty Among Single-Parent Households in Cruzville
| Children | Single Father | Single Mother |
| No Children | 0 (0.0%) | 0 (0.0%) |
| 1 or 2 Children | 0 (0.0%) | 0 (0.0%) |
| 3 or 4 Children | 0 (0.0%) | 0 (0.0%) |
| 5 or more Children | 0 (0.0%) | 0 (0.0%) |
| Total | 0 (0.0%) | 0 (0.0%) |
Income Below Poverty Among Married-Couple vs Single-Parent Households in Cruzville
| Children | Married-Couple Families | Single-Parent Households |
| No Children | 0 (0.0%) | 0 (0.0%) |
| 1 or 2 Children | 0 (0.0%) | 0 (0.0%) |
| 3 or 4 Children | 0 (0.0%) | 0 (0.0%) |
| 5 or more Children | 0 (0.0%) | 0 (0.0%) |
| Total | 0 (0.0%) | 0 (0.0%) |
Race in Cruzville
The most populous races in Cruzville are White / Caucasian (279 | 100.0%), and Hispanic or Latino (124 | 44.4%).
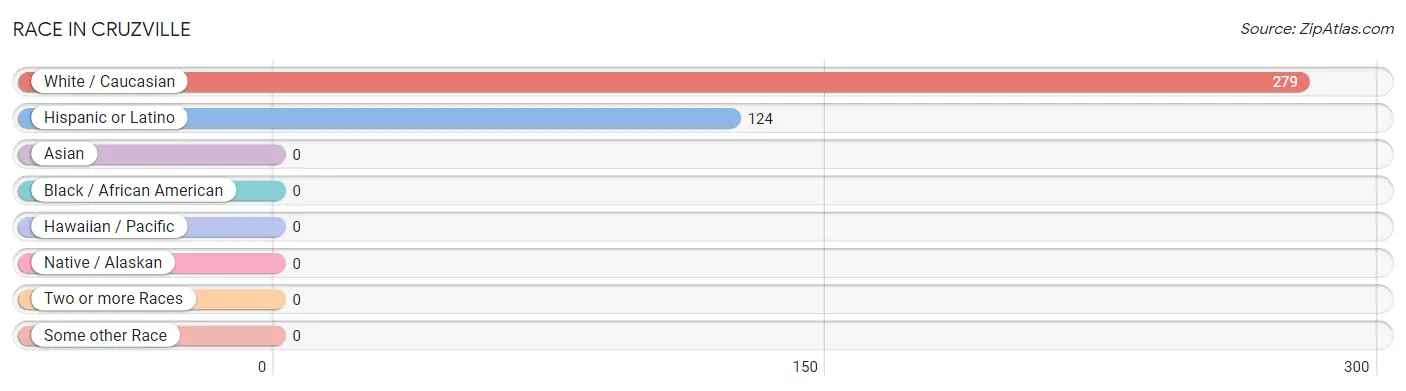
| Race | # Population | % Population |
| Asian | 0 | 0.0% |
| Black / African American | 0 | 0.0% |
| Hawaiian / Pacific | 0 | 0.0% |
| Hispanic or Latino | 124 | 44.4% |
| Native / Alaskan | 0 | 0.0% |
| White / Caucasian | 279 | 100.0% |
| Two or more Races | 0 | 0.0% |
| Some other Race | 0 | 0.0% |
| Total | 279 | 100.0% |
Ancestry in Cruzville
The most populous ancestries reported in Cruzville are Mexican (106 | 38.0%), American (18 | 6.5%), Scotch-Irish (17 | 6.1%), Irish (8 | 2.9%), and Greek (6 | 2.1%), together accounting for 55.5% of all Cruzville residents.
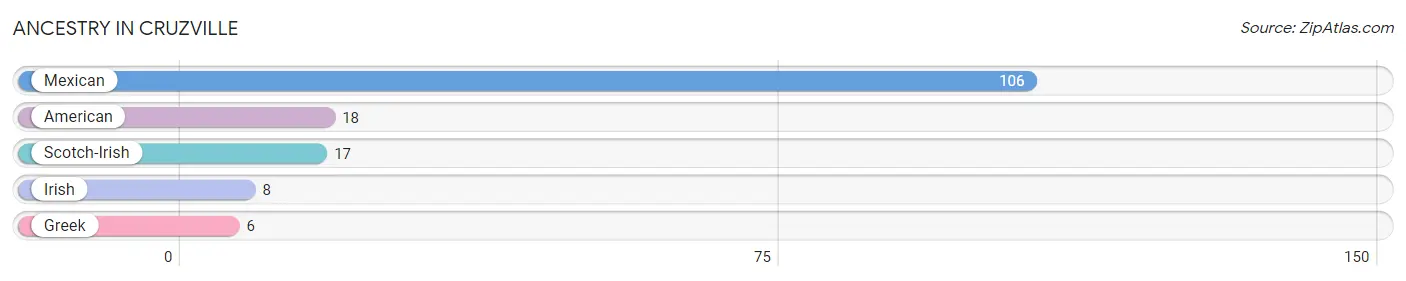
| Ancestry | # Population | % Population |
| American | 18 | 6.5% |
| Greek | 6 | 2.1% |
| Irish | 8 | 2.9% |
| Mexican | 106 | 38.0% |
| Scotch-Irish | 17 | 6.1% | View All 5 Rows |
Immigrants in Cruzville

| Immigration Origin | # Population | % Population | View All 0 Rows |
Sex and Age in Cruzville
Sex and Age in Cruzville
The most populous age groups in Cruzville are 15 to 19 Years (84 | 40.4%) for men and 45 to 49 Years (46 | 64.8%) for women.
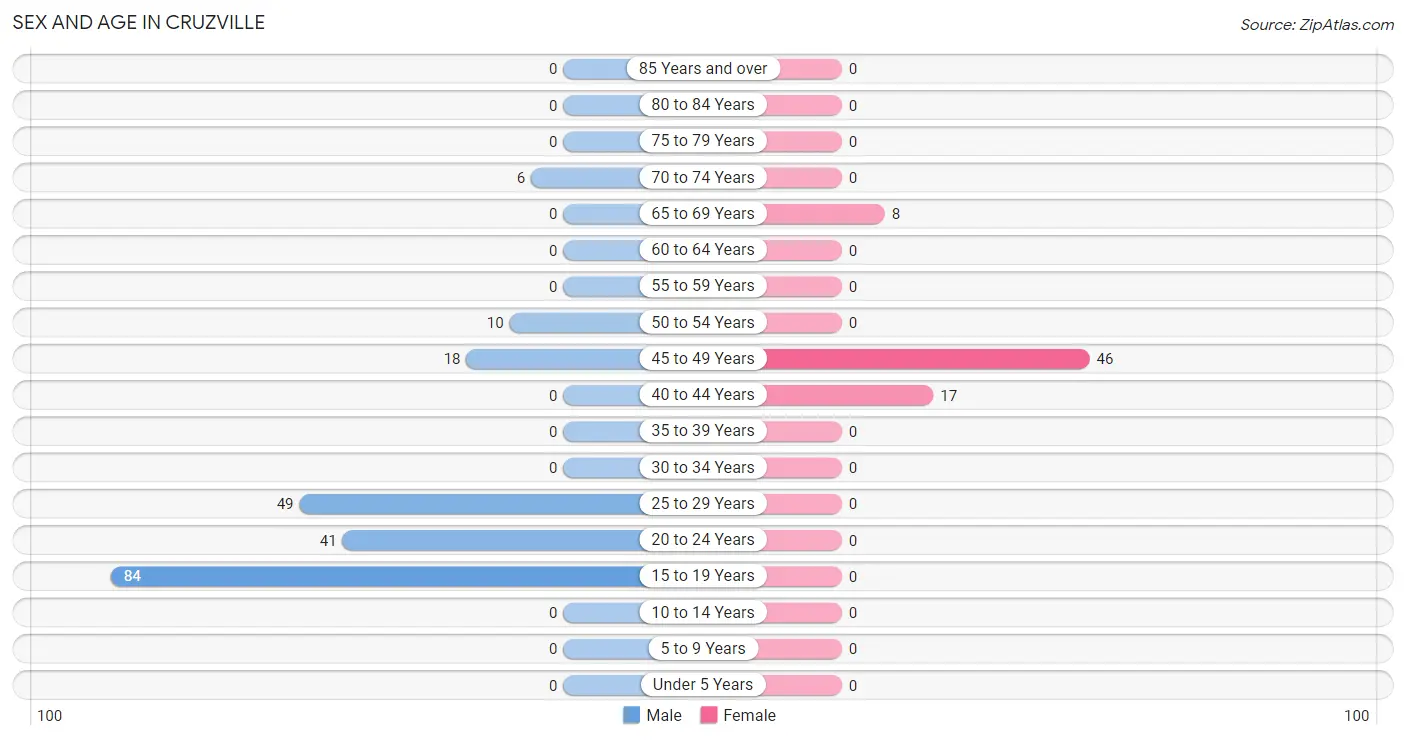
| Age Bracket | Male | Female |
| Under 5 Years | 0 (0.0%) | 0 (0.0%) |
| 5 to 9 Years | 0 (0.0%) | 0 (0.0%) |
| 10 to 14 Years | 0 (0.0%) | 0 (0.0%) |
| 15 to 19 Years | 84 (40.4%) | 0 (0.0%) |
| 20 to 24 Years | 41 (19.7%) | 0 (0.0%) |
| 25 to 29 Years | 49 (23.6%) | 0 (0.0%) |
| 30 to 34 Years | 0 (0.0%) | 0 (0.0%) |
| 35 to 39 Years | 0 (0.0%) | 0 (0.0%) |
| 40 to 44 Years | 0 (0.0%) | 17 (23.9%) |
| 45 to 49 Years | 18 (8.6%) | 46 (64.8%) |
| 50 to 54 Years | 10 (4.8%) | 0 (0.0%) |
| 55 to 59 Years | 0 (0.0%) | 0 (0.0%) |
| 60 to 64 Years | 0 (0.0%) | 0 (0.0%) |
| 65 to 69 Years | 0 (0.0%) | 8 (11.3%) |
| 70 to 74 Years | 6 (2.9%) | 0 (0.0%) |
| 75 to 79 Years | 0 (0.0%) | 0 (0.0%) |
| 80 to 84 Years | 0 (0.0%) | 0 (0.0%) |
| 85 Years and over | 0 (0.0%) | 0 (0.0%) |
| Total | 208 (100.0%) | 71 (100.0%) |
Families and Households in Cruzville
Median Family Size in Cruzville
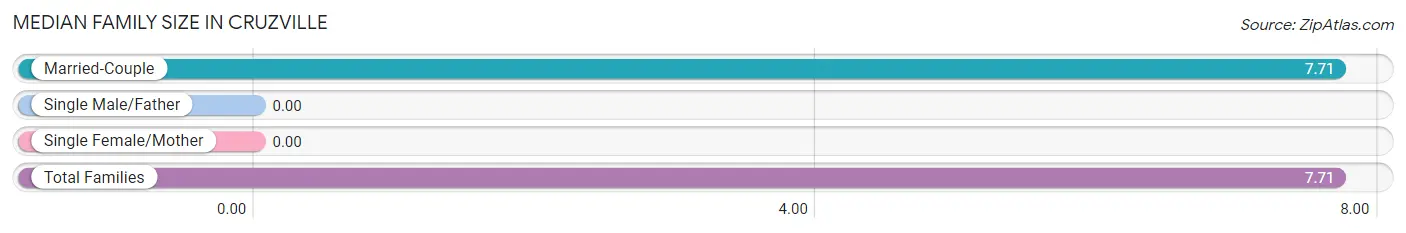
| Family Type | # Families | Family Size |
| Married-Couple | 34 (100.0%) | 7.71 |
| Single Male/Father | 0 (0.0%) | - |
| Single Female/Mother | 0 (0.0%) | - |
| Total Families | 34 (100.0%) | 7.71 |
Median Household Size in Cruzville
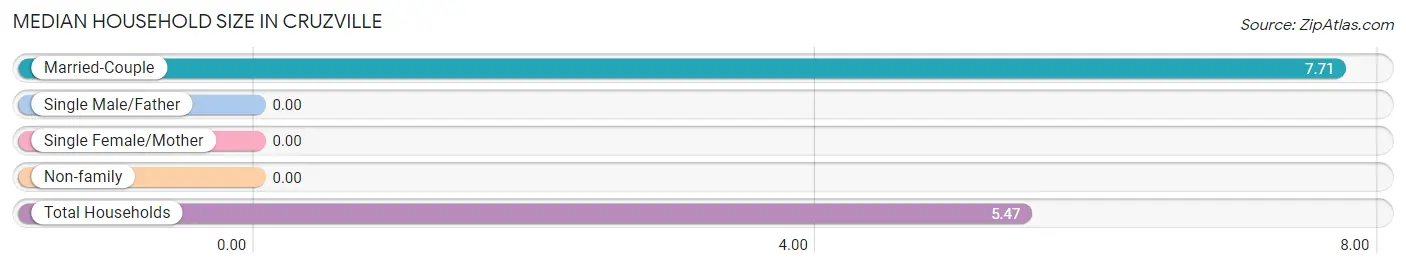
| Household Type | # Households | Household Size |
| Married-Couple | 34 (66.7%) | 7.71 |
| Single Male/Father | 0 (0.0%) | - |
| Single Female/Mother | 0 (0.0%) | - |
| Non-family | 17 (33.3%) | - |
| Total Households | 51 (100.0%) | 5.47 |
Household Size by Marriage Status in Cruzville
Out of a total of 51 households in Cruzville, 34 (66.7%) are family households, while 17 (33.3%) are nonfamily households. The most numerous type of family households are 5-person households, comprising 18, and the most common type of nonfamily households are 1-person households, comprising 17.
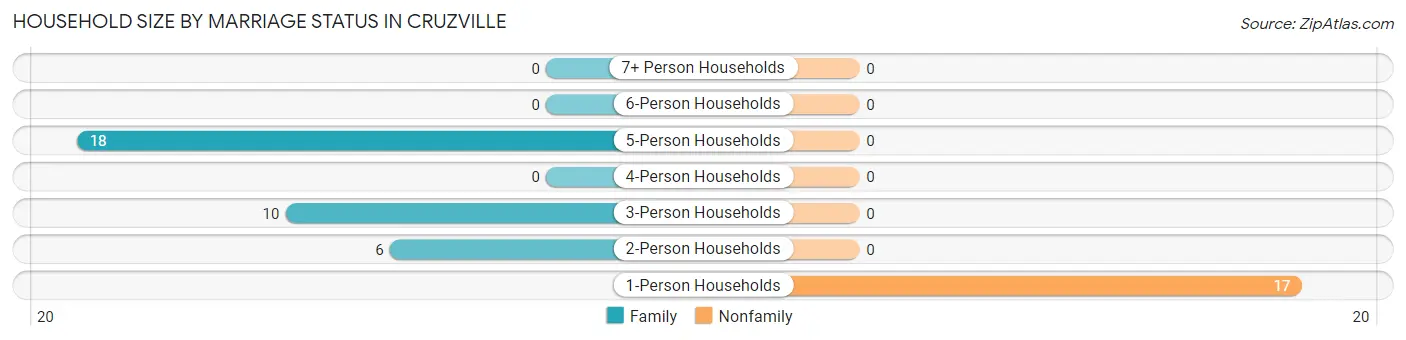
| Household Size | Family Households | Nonfamily Households |
| 1-Person Households | - | 17 (33.3%) |
| 2-Person Households | 6 (11.8%) | 0 (0.0%) |
| 3-Person Households | 10 (19.6%) | 0 (0.0%) |
| 4-Person Households | 0 (0.0%) | 0 (0.0%) |
| 5-Person Households | 18 (35.3%) | 0 (0.0%) |
| 6-Person Households | 0 (0.0%) | 0 (0.0%) |
| 7+ Person Households | 0 (0.0%) | 0 (0.0%) |
| Total | 34 (66.7%) | 17 (33.3%) |
Female Fertility in Cruzville
Fertility by Age in Cruzville
| Age Bracket | Women with Births | Births / 1,000 Women |
| 15 to 19 years | 0 (0.0%) | 0.0 |
| 20 to 34 years | 0 (0.0%) | 0.0 |
| 35 to 50 years | 0 (0.0%) | 0.0 |
| Total | 0 (0.0%) | 0.0 |
Fertility by Age by Marriage Status in Cruzville
| Age Bracket | Married | Unmarried |
| 15 to 19 years | 0 (0.0%) | 0 (0.0%) |
| 20 to 34 years | 0 (0.0%) | 0 (0.0%) |
| 35 to 50 years | 0 (0.0%) | 0 (0.0%) |
| Total | 0 (0.0%) | 0 (0.0%) |
Fertility by Education in Cruzville
| Educational Attainment | Women with Births | Births / 1,000 Women |
| Less than High School | 0 (0.0%) | 0.0 |
| High School Diploma | 0 (0.0%) | 0.0 |
| College or Associate's Degree | 0 (0.0%) | 0.0 |
| Bachelor's Degree | 0 (0.0%) | 0.0 |
| Graduate Degree | 0 (0.0%) | 0.0 |
| Total | 0 (0.0%) | 0.0 |
Fertility by Education by Marriage Status in Cruzville
| Educational Attainment | Married | Unmarried |
| Less than High School | 0 (0.0%) | 0 (0.0%) |
| High School Diploma | 0 (0.0%) | 0 (0.0%) |
| College or Associate's Degree | 0 (0.0%) | 0 (0.0%) |
| Bachelor's Degree | 0 (0.0%) | 0 (0.0%) |
| Graduate Degree | 0 (0.0%) | 0 (0.0%) |
| Total | 0 (0.0%) | 0 (0.0%) |
Employment Characteristics in Cruzville
Employment by Class of Employer in Cruzville
Among the 63 employed individuals in Cruzville, private company employees (18 | 28.6%), local government employees (18 | 28.6%), and federal government employees (17 | 27.0%) make up the most common classes of employment.
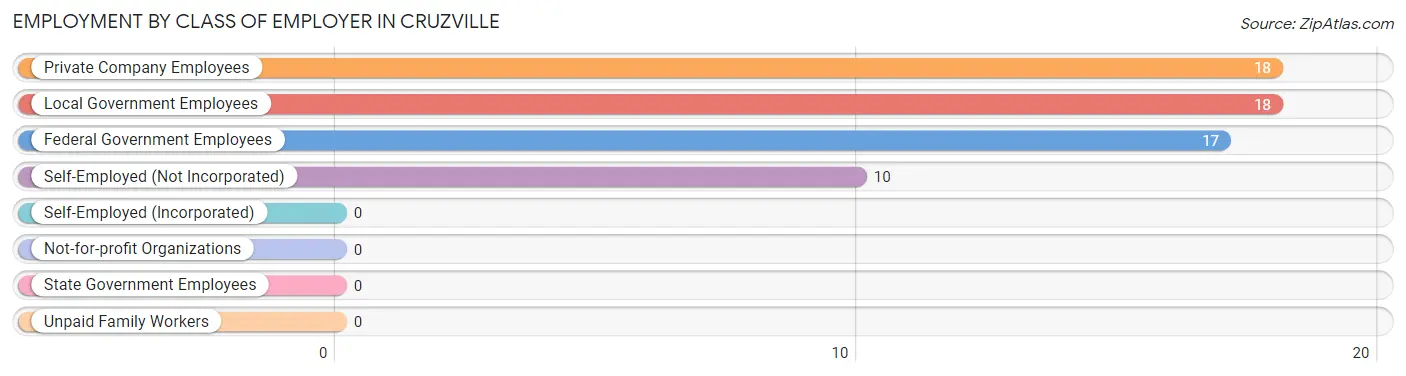
| Employer Class | # Employees | % Employees |
| Private Company Employees | 18 | 28.6% |
| Self-Employed (Incorporated) | 0 | 0.0% |
| Self-Employed (Not Incorporated) | 10 | 15.9% |
| Not-for-profit Organizations | 0 | 0.0% |
| Local Government Employees | 18 | 28.6% |
| State Government Employees | 0 | 0.0% |
| Federal Government Employees | 17 | 27.0% |
| Unpaid Family Workers | 0 | 0.0% |
| Total | 63 | 100.0% |
Employment Status by Age in Cruzville
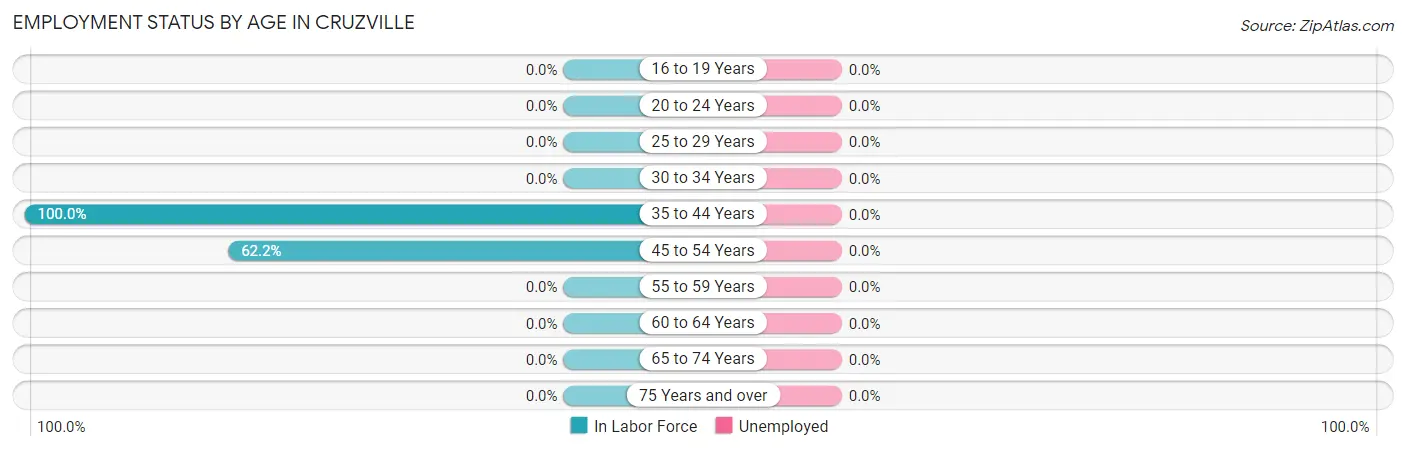
| Age Bracket | In Labor Force | Unemployed |
| 16 to 19 Years | 0 (0.0%) | 0 (0.0%) |
| 20 to 24 Years | 0 (0.0%) | 0 (0.0%) |
| 25 to 29 Years | 0 (0.0%) | 0 (0.0%) |
| 30 to 34 Years | 0 (0.0%) | 0 (0.0%) |
| 35 to 44 Years | 17 (100.0%) | 0 (0.0%) |
| 45 to 54 Years | 46 (62.2%) | 0 (0.0%) |
| 55 to 59 Years | 0 (0.0%) | 0 (0.0%) |
| 60 to 64 Years | 0 (0.0%) | 0 (0.0%) |
| 65 to 74 Years | 0 (0.0%) | 0 (0.0%) |
| 75 Years and over | 0 (0.0%) | 0 (0.0%) |
| Total | 63 (22.6%) | 0 (0.0%) |
Employment Status by Educational Attainment in Cruzville
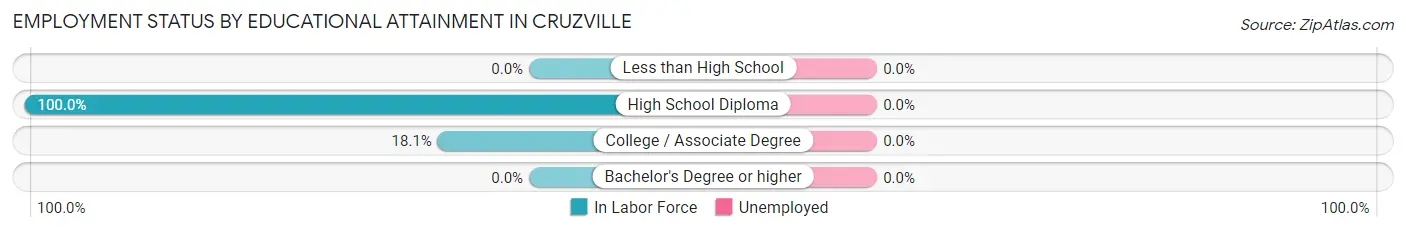
| Educational Attainment | In Labor Force | Unemployed |
| Less than High School | 0 (0.0%) | 0 (0.0%) |
| High School Diploma | 46 (100.0%) | 0 (0.0%) |
| College / Associate Degree | 17 (18.1%) | 0 (0.0%) |
| Bachelor's Degree or higher | 0 (0.0%) | 0 (0.0%) |
| Total | 63 (45.0%) | 0 (0.0%) |
Employment Occupations by Sex in Cruzville
Management, Business, Science and Arts Occupations
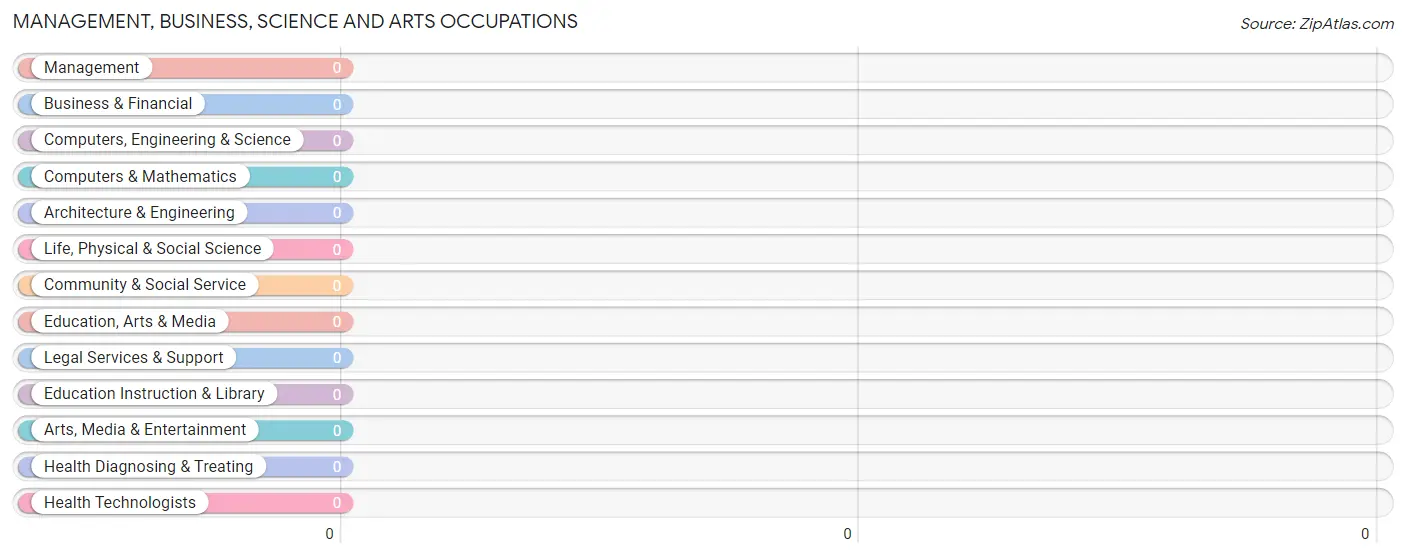
Management, Business, Science and Arts Occupations by Sex
| Occupation | Male | Female |
| Management | 0 (0.0%) | 0 (0.0%) |
| Business & Financial | 0 (0.0%) | 0 (0.0%) |
| Computers, Engineering & Science | 0 (0.0%) | 0 (0.0%) |
| Computers & Mathematics | 0 (0.0%) | 0 (0.0%) |
| Architecture & Engineering | 0 (0.0%) | 0 (0.0%) |
| Life, Physical & Social Science | 0 (0.0%) | 0 (0.0%) |
| Community & Social Service | 0 (0.0%) | 0 (0.0%) |
| Education, Arts & Media | 0 (0.0%) | 0 (0.0%) |
| Legal Services & Support | 0 (0.0%) | 0 (0.0%) |
| Education Instruction & Library | 0 (0.0%) | 0 (0.0%) |
| Arts, Media & Entertainment | 0 (0.0%) | 0 (0.0%) |
| Health Diagnosing & Treating | 0 (0.0%) | 0 (0.0%) |
| Health Technologists | 0 (0.0%) | 0 (0.0%) |
| Total (Category) | 0 (0.0%) | 0 (0.0%) |
| Total (Overall) | 28 (44.4%) | 35 (55.6%) |
Services Occupations
Services Occupations by Sex
| Occupation | Male | Female |
| Healthcare Support | 0 (0.0%) | 0 (0.0%) |
| Security & Protection | 0 (0.0%) | 0 (0.0%) |
| Firefighting & Prevention | 0 (0.0%) | 0 (0.0%) |
| Law Enforcement | 0 (0.0%) | 0 (0.0%) |
| Food Preparation & Serving | 0 (0.0%) | 0 (0.0%) |
| Cleaning & Maintenance | 0 (0.0%) | 0 (0.0%) |
| Personal Care & Service | 0 (0.0%) | 0 (0.0%) |
| Total (Category) | 0 (0.0%) | 0 (0.0%) |
| Total (Overall) | 28 (44.4%) | 35 (55.6%) |
Sales and Office Occupations
The most common Sales and Office occupations in Cruzville are Sales & Related (18 | 28.6%), and Office & Administration (17 | 27.0%).
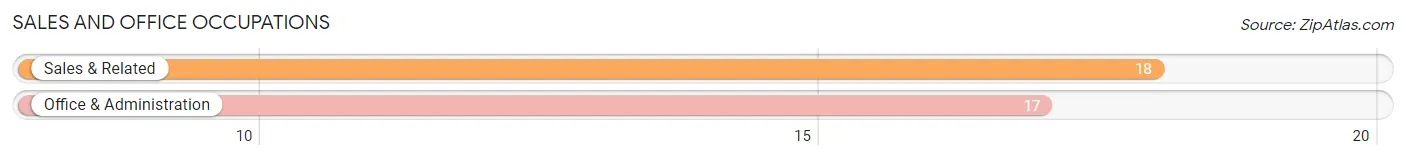
Sales and Office Occupations by Sex

| Occupation | Male | Female |
| Sales & Related | 0 (0.0%) | 18 (100.0%) |
| Office & Administration | 0 (0.0%) | 17 (100.0%) |
| Total (Category) | 0 (0.0%) | 35 (100.0%) |
| Total (Overall) | 28 (44.4%) | 35 (55.6%) |
Natural Resources, Construction and Maintenance Occupations
The most common Natural Resources, Construction and Maintenance occupations in Cruzville are Construction & Extraction (18 | 28.6%), and Farming, Fishing & Forestry (10 | 15.9%).
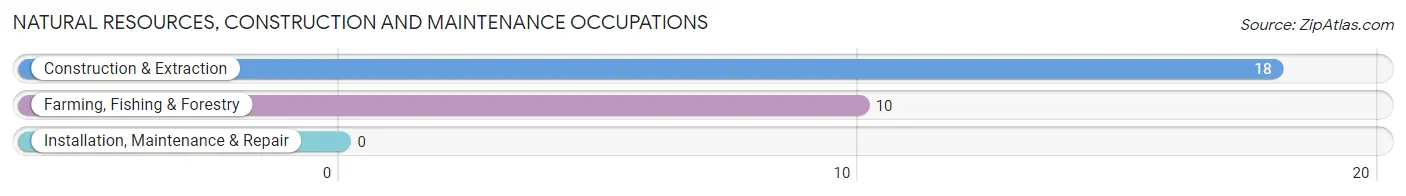
Natural Resources, Construction and Maintenance Occupations by Sex
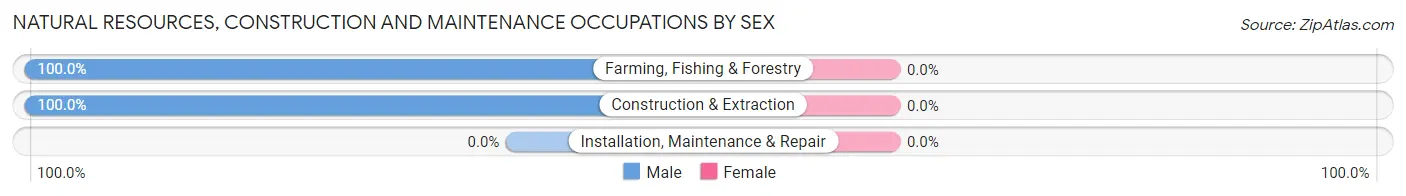
| Occupation | Male | Female |
| Farming, Fishing & Forestry | 10 (100.0%) | 0 (0.0%) |
| Construction & Extraction | 18 (100.0%) | 0 (0.0%) |
| Installation, Maintenance & Repair | 0 (0.0%) | 0 (0.0%) |
| Total (Category) | 28 (100.0%) | 0 (0.0%) |
| Total (Overall) | 28 (44.4%) | 35 (55.6%) |
Production, Transportation and Moving Occupations
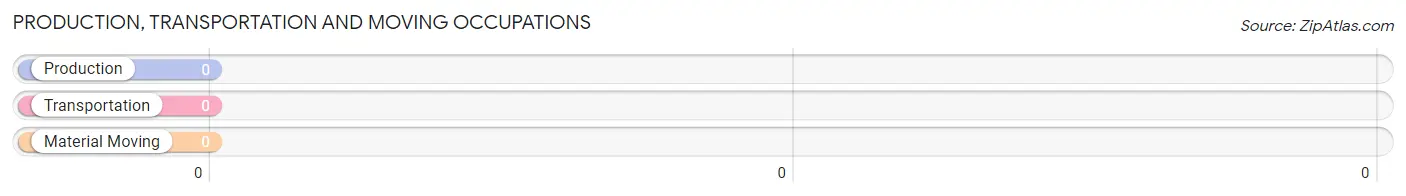
Production, Transportation and Moving Occupations by Sex
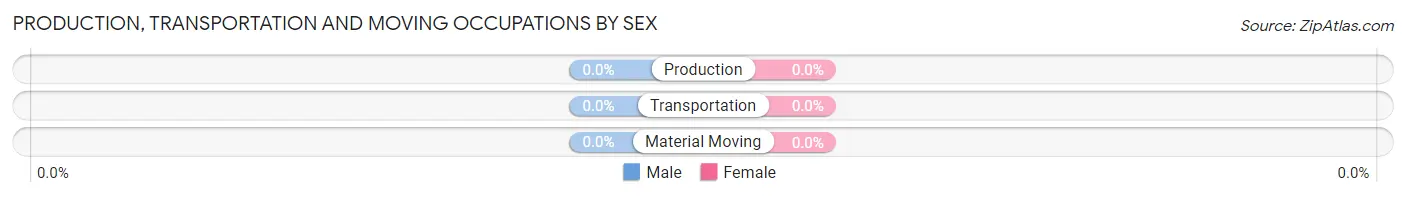
| Occupation | Male | Female |
| Production | 0 (0.0%) | 0 (0.0%) |
| Transportation | 0 (0.0%) | 0 (0.0%) |
| Material Moving | 0 (0.0%) | 0 (0.0%) |
| Total (Category) | 0 (0.0%) | 0 (0.0%) |
| Total (Overall) | 28 (44.4%) | 35 (55.6%) |
Employment Industries by Sex in Cruzville
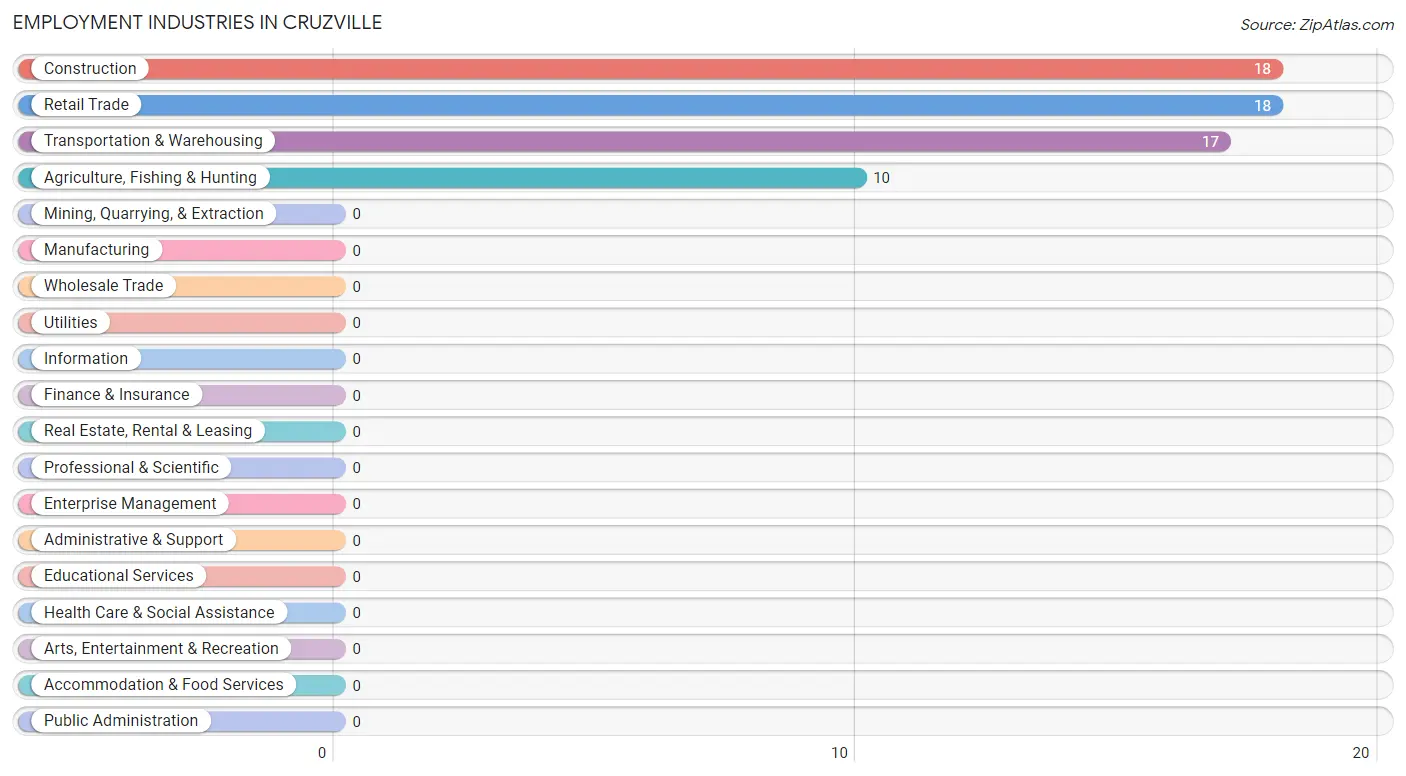
Employment Industries in Cruzville
The major employment industries in Cruzville include Construction (18 | 28.6%), Retail Trade (18 | 28.6%), Transportation & Warehousing (17 | 27.0%), and Agriculture, Fishing & Hunting (10 | 15.9%).
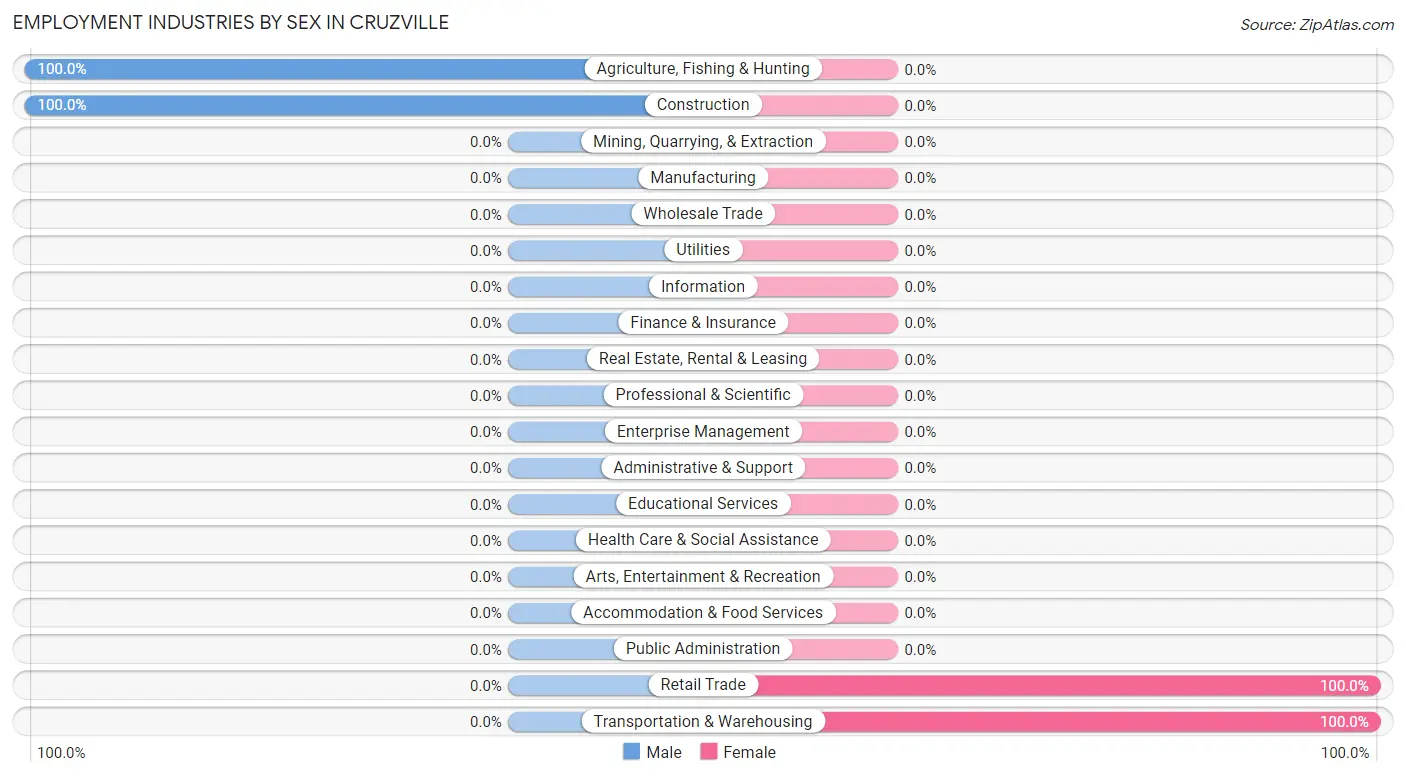
Employment Industries by Sex in Cruzville
The Cruzville industries that see more men than women are Agriculture, Fishing & Hunting (100.0%), and Construction (100.0%), whereas the industries that tend to have a higher number of women are Retail Trade (100.0%), and Transportation & Warehousing (100.0%).
| Industry | Male | Female |
| Agriculture, Fishing & Hunting | 10 (100.0%) | 0 (0.0%) |
| Mining, Quarrying, & Extraction | 0 (0.0%) | 0 (0.0%) |
| Construction | 18 (100.0%) | 0 (0.0%) |
| Manufacturing | 0 (0.0%) | 0 (0.0%) |
| Wholesale Trade | 0 (0.0%) | 0 (0.0%) |
| Retail Trade | 0 (0.0%) | 18 (100.0%) |
| Transportation & Warehousing | 0 (0.0%) | 17 (100.0%) |
| Utilities | 0 (0.0%) | 0 (0.0%) |
| Information | 0 (0.0%) | 0 (0.0%) |
| Finance & Insurance | 0 (0.0%) | 0 (0.0%) |
| Real Estate, Rental & Leasing | 0 (0.0%) | 0 (0.0%) |
| Professional & Scientific | 0 (0.0%) | 0 (0.0%) |
| Enterprise Management | 0 (0.0%) | 0 (0.0%) |
| Administrative & Support | 0 (0.0%) | 0 (0.0%) |
| Educational Services | 0 (0.0%) | 0 (0.0%) |
| Health Care & Social Assistance | 0 (0.0%) | 0 (0.0%) |
| Arts, Entertainment & Recreation | 0 (0.0%) | 0 (0.0%) |
| Accommodation & Food Services | 0 (0.0%) | 0 (0.0%) |
| Public Administration | 0 (0.0%) | 0 (0.0%) |
| Total | 28 (44.4%) | 35 (55.6%) |
Education in Cruzville
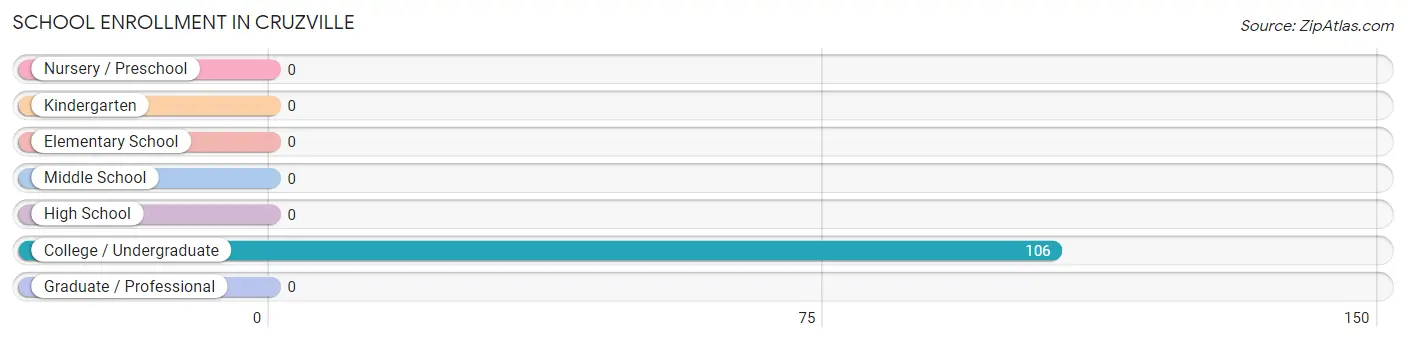
School Enrollment in Cruzville
| School Level | # Students | % Students |
| Nursery / Preschool | 0 | 0.0% |
| Kindergarten | 0 | 0.0% |
| Elementary School | 0 | 0.0% |
| Middle School | 0 | 0.0% |
| High School | 0 | 0.0% |
| College / Undergraduate | 106 | 100.0% |
| Graduate / Professional | 0 | 0.0% |
| Total | 106 | 100.0% |
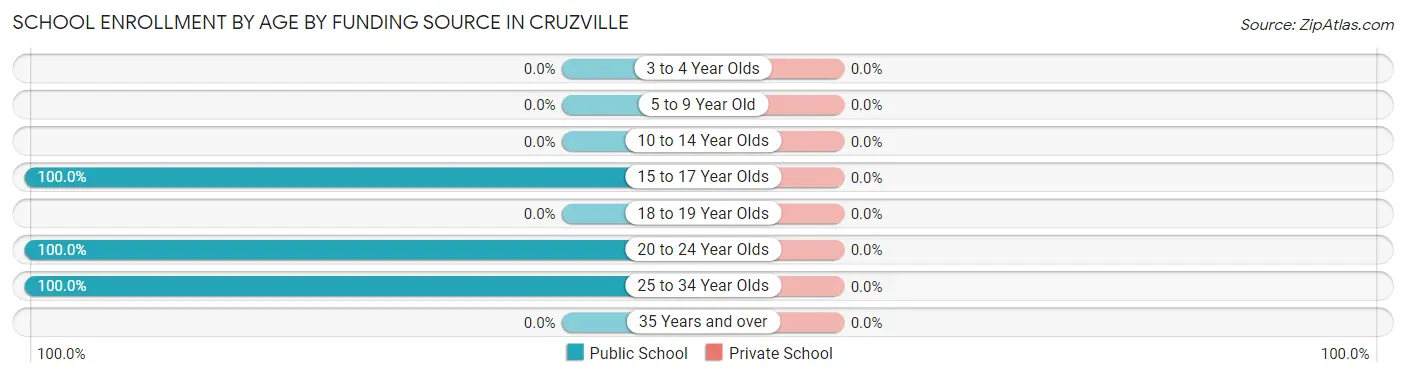
School Enrollment by Age by Funding Source in Cruzville
| Age Bracket | Public School | Private School |
| 3 to 4 Year Olds | 0 (0.0%) | 0 (0.0%) |
| 5 to 9 Year Old | 0 (0.0%) | 0 (0.0%) |
| 10 to 14 Year Olds | 0 (0.0%) | 0 (0.0%) |
| 15 to 17 Year Olds | 16 (100.0%) | 0 (0.0%) |
| 18 to 19 Year Olds | 0 (0.0%) | 0 (0.0%) |
| 20 to 24 Year Olds | 41 (100.0%) | 0 (0.0%) |
| 25 to 34 Year Olds | 49 (100.0%) | 0 (0.0%) |
| 35 Years and over | 0 (0.0%) | 0 (0.0%) |
| Total | 106 (100.0%) | 0 (0.0%) |
Educational Attainment by Field of Study in Cruzville
| Field of Study | # Graduates | % Graduates |
| Computers & Mathematics | 0 | 0.0% |
| Bio, Nature & Agricultural | 0 | 0.0% |
| Physical & Health Sciences | 0 | 0.0% |
| Psychology | 0 | 0.0% |
| Social Sciences | 0 | 0.0% |
| Engineering | 0 | 0.0% |
| Multidisciplinary Studies | 0 | 0.0% |
| Science & Technology | 0 | 0.0% |
| Business | 0 | 0.0% |
| Education | 0 | 0.0% |
| Literature & Languages | 0 | 0.0% |
| Liberal Arts & History | 0 | 0.0% |
| Visual & Performing Arts | 0 | 0.0% |
| Communications | 0 | 0.0% |
| Arts & Humanities | 0 | 0.0% |
| Total | 0 | 0.0% |
Transportation & Commute in Cruzville
Vehicle Availability by Sex in Cruzville
The most prevalent vehicle ownership categories in Cruzville are males with 2 vehicles (28, accounting for 100.0%) and females with 2 vehicles (18, making up 80.0%).
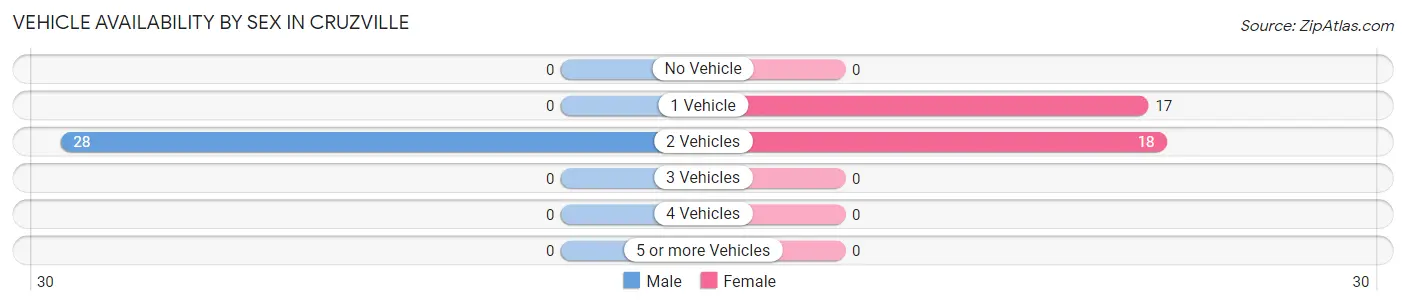
| Vehicles Available | Male | Female |
| No Vehicle | 0 (0.0%) | 0 (0.0%) |
| 1 Vehicle | 0 (0.0%) | 17 (48.6%) |
| 2 Vehicles | 28 (100.0%) | 18 (51.4%) |
| 3 Vehicles | 0 (0.0%) | 0 (0.0%) |
| 4 Vehicles | 0 (0.0%) | 0 (0.0%) |
| 5 or more Vehicles | 0 (0.0%) | 0 (0.0%) |
| Total | 28 (100.0%) | 35 (100.0%) |
Commute Time in Cruzville
The most frequently occuring commute durations in Cruzville are 20 to 24 minutes (18 commuters, 28.6%), 30 to 34 minutes (18 commuters, 28.6%), and 10 to 14 minutes (17 commuters, 27.0%).
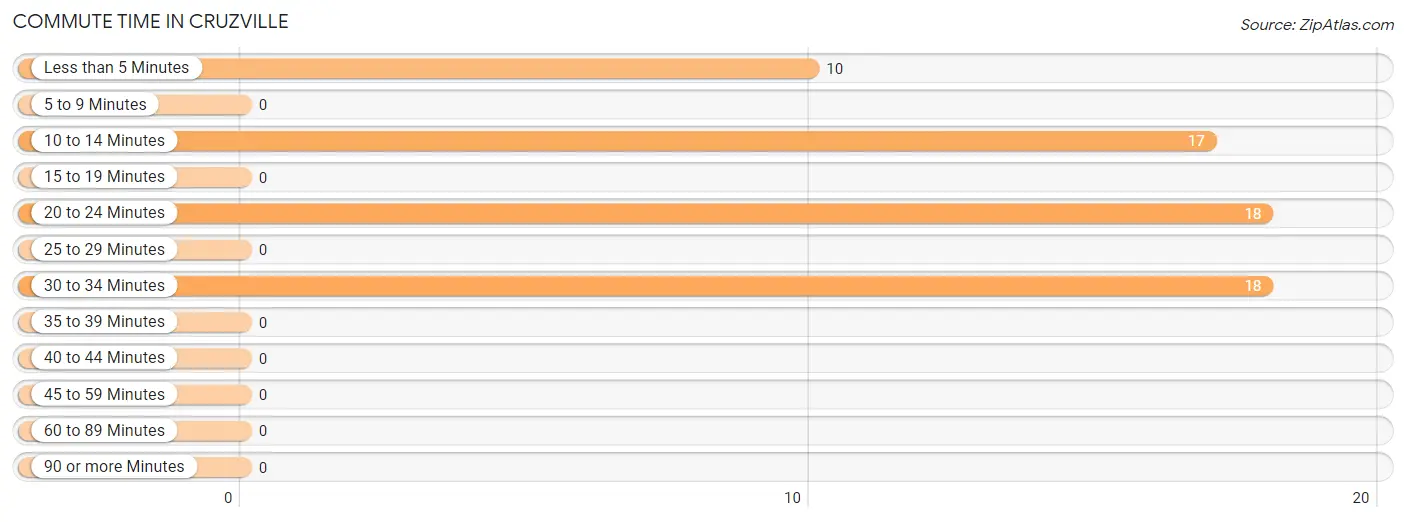
| Commute Time | # Commuters | % Commuters |
| Less than 5 Minutes | 10 | 15.9% |
| 5 to 9 Minutes | 0 | 0.0% |
| 10 to 14 Minutes | 17 | 27.0% |
| 15 to 19 Minutes | 0 | 0.0% |
| 20 to 24 Minutes | 18 | 28.6% |
| 25 to 29 Minutes | 0 | 0.0% |
| 30 to 34 Minutes | 18 | 28.6% |
| 35 to 39 Minutes | 0 | 0.0% |
| 40 to 44 Minutes | 0 | 0.0% |
| 45 to 59 Minutes | 0 | 0.0% |
| 60 to 89 Minutes | 0 | 0.0% |
| 90 or more Minutes | 0 | 0.0% |
Commute Time by Sex in Cruzville
The most common commute times in Cruzville are 30 to 34 minutes (18 commuters, 64.3%) for males and 20 to 24 minutes (18 commuters, 51.4%) for females.
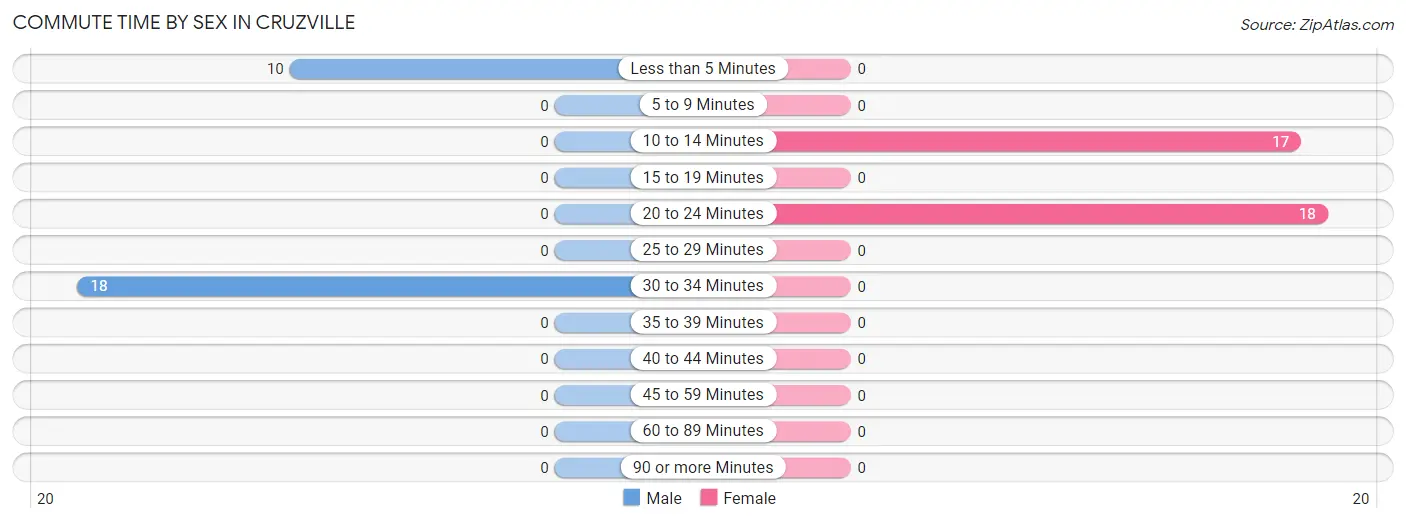
| Commute Time | Male | Female |
| Less than 5 Minutes | 10 (35.7%) | 0 (0.0%) |
| 5 to 9 Minutes | 0 (0.0%) | 0 (0.0%) |
| 10 to 14 Minutes | 0 (0.0%) | 17 (48.6%) |
| 15 to 19 Minutes | 0 (0.0%) | 0 (0.0%) |
| 20 to 24 Minutes | 0 (0.0%) | 18 (51.4%) |
| 25 to 29 Minutes | 0 (0.0%) | 0 (0.0%) |
| 30 to 34 Minutes | 18 (64.3%) | 0 (0.0%) |
| 35 to 39 Minutes | 0 (0.0%) | 0 (0.0%) |
| 40 to 44 Minutes | 0 (0.0%) | 0 (0.0%) |
| 45 to 59 Minutes | 0 (0.0%) | 0 (0.0%) |
| 60 to 89 Minutes | 0 (0.0%) | 0 (0.0%) |
| 90 or more Minutes | 0 (0.0%) | 0 (0.0%) |
Time of Departure to Work by Sex in Cruzville
The most frequent times of departure to work in Cruzville are 7:00 AM to 7:29 AM (18, 64.3%) for males and 6:00 AM to 6:29 AM (18, 51.4%) for females.
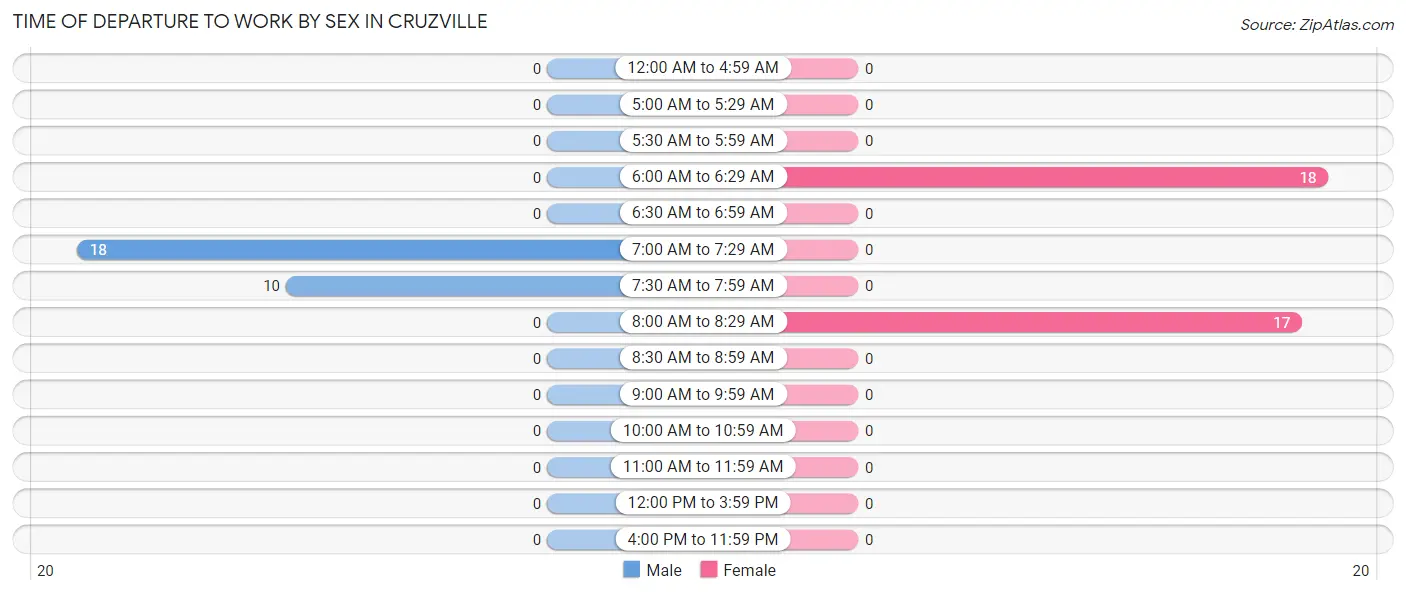
| Time of Departure | Male | Female |
| 12:00 AM to 4:59 AM | 0 (0.0%) | 0 (0.0%) |
| 5:00 AM to 5:29 AM | 0 (0.0%) | 0 (0.0%) |
| 5:30 AM to 5:59 AM | 0 (0.0%) | 0 (0.0%) |
| 6:00 AM to 6:29 AM | 0 (0.0%) | 18 (51.4%) |
| 6:30 AM to 6:59 AM | 0 (0.0%) | 0 (0.0%) |
| 7:00 AM to 7:29 AM | 18 (64.3%) | 0 (0.0%) |
| 7:30 AM to 7:59 AM | 10 (35.7%) | 0 (0.0%) |
| 8:00 AM to 8:29 AM | 0 (0.0%) | 17 (48.6%) |
| 8:30 AM to 8:59 AM | 0 (0.0%) | 0 (0.0%) |
| 9:00 AM to 9:59 AM | 0 (0.0%) | 0 (0.0%) |
| 10:00 AM to 10:59 AM | 0 (0.0%) | 0 (0.0%) |
| 11:00 AM to 11:59 AM | 0 (0.0%) | 0 (0.0%) |
| 12:00 PM to 3:59 PM | 0 (0.0%) | 0 (0.0%) |
| 4:00 PM to 11:59 PM | 0 (0.0%) | 0 (0.0%) |
| Total | 28 (100.0%) | 35 (100.0%) |
Housing Occupancy in Cruzville
Occupancy by Ownership in Cruzville
Of the total 51 dwellings in Cruzville, owner-occupied units account for 24 (47.1%), while renter-occupied units make up 27 (52.9%).
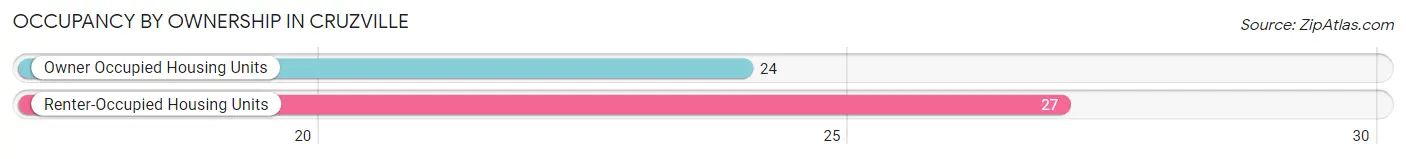
| Occupancy | # Housing Units | % Housing Units |
| Owner Occupied Housing Units | 24 | 47.1% |
| Renter-Occupied Housing Units | 27 | 52.9% |
| Total Occupied Housing Units | 51 | 100.0% |
Occupancy by Household Size in Cruzville
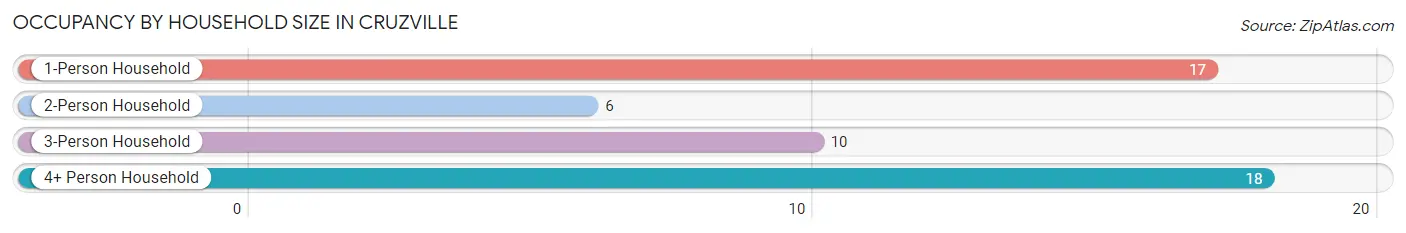
| Household Size | # Housing Units | % Housing Units |
| 1-Person Household | 17 | 33.3% |
| 2-Person Household | 6 | 11.8% |
| 3-Person Household | 10 | 19.6% |
| 4+ Person Household | 18 | 35.3% |
| Total Housing Units | 51 | 100.0% |
Occupancy by Ownership by Household Size in Cruzville
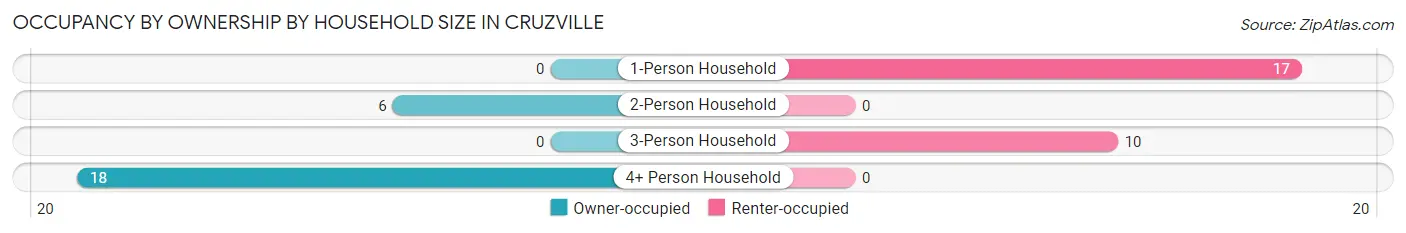
| Household Size | Owner-occupied | Renter-occupied |
| 1-Person Household | 0 (0.0%) | 17 (100.0%) |
| 2-Person Household | 6 (100.0%) | 0 (0.0%) |
| 3-Person Household | 0 (0.0%) | 10 (100.0%) |
| 4+ Person Household | 18 (100.0%) | 0 (0.0%) |
| Total Housing Units | 24 (47.1%) | 27 (52.9%) |
Occupancy by Educational Attainment in Cruzville
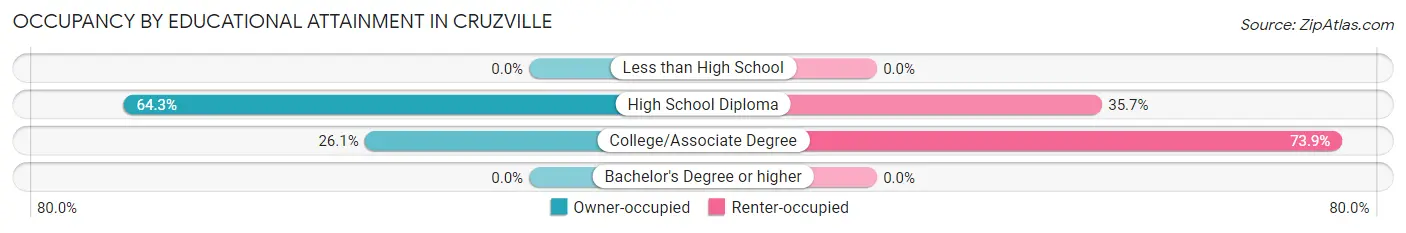
| Household Size | Owner-occupied | Renter-occupied |
| Less than High School | 0 (0.0%) | 0 (0.0%) |
| High School Diploma | 18 (64.3%) | 10 (35.7%) |
| College/Associate Degree | 6 (26.1%) | 17 (73.9%) |
| Bachelor's Degree or higher | 0 (0.0%) | 0 (0.0%) |
Occupancy by Age of Householder in Cruzville
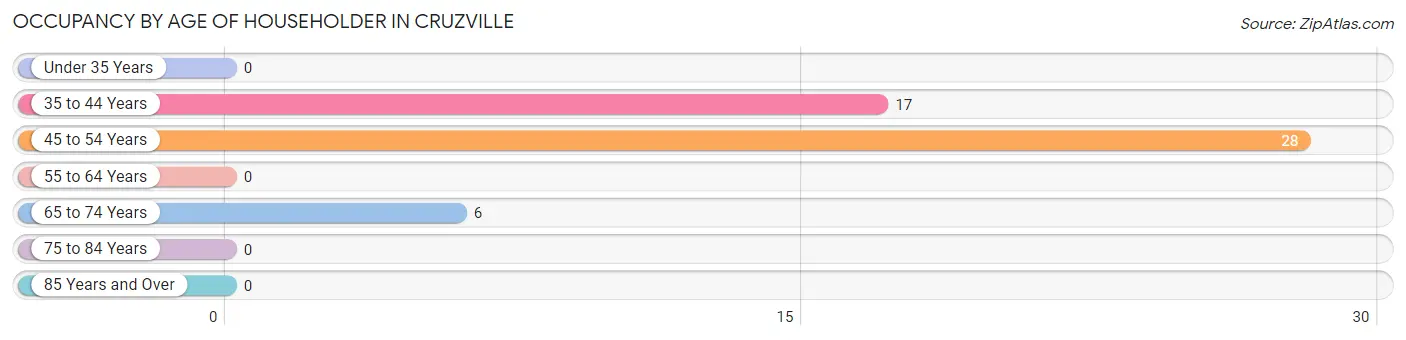
| Age Bracket | # Households | % Households |
| Under 35 Years | 0 | 0.0% |
| 35 to 44 Years | 17 | 33.3% |
| 45 to 54 Years | 28 | 54.9% |
| 55 to 64 Years | 0 | 0.0% |
| 65 to 74 Years | 6 | 11.8% |
| 75 to 84 Years | 0 | 0.0% |
| 85 Years and Over | 0 | 0.0% |
| Total | 51 | 100.0% |
Housing Finances in Cruzville
Median Income by Occupancy in Cruzville
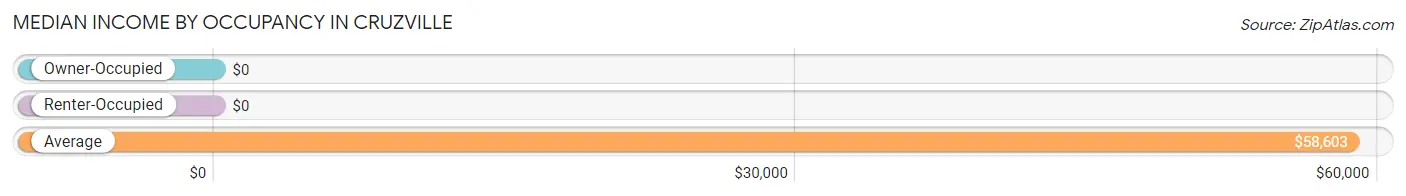
| Occupancy Type | # Households | Median Income |
| Owner-Occupied | 24 (47.1%) | $0 |
| Renter-Occupied | 27 (52.9%) | $0 |
| Average | 51 (100.0%) | $58,603 |
Occupancy by Householder Income Bracket in Cruzville
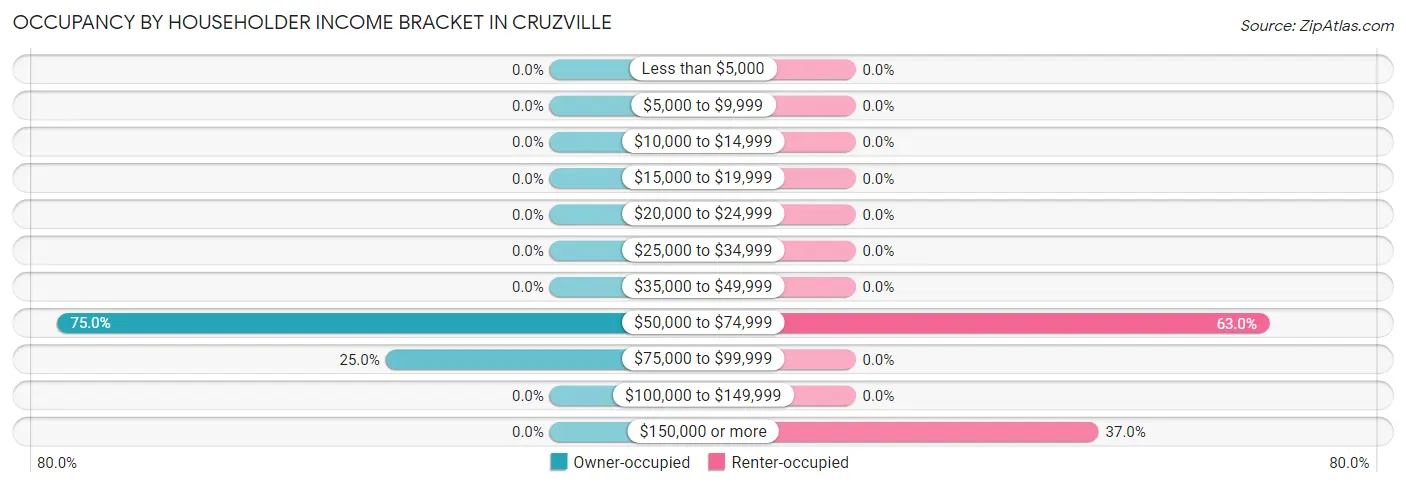
| Income Bracket | Owner-occupied | Renter-occupied |
| Less than $5,000 | 0 (0.0%) | 0 (0.0%) |
| $5,000 to $9,999 | 0 (0.0%) | 0 (0.0%) |
| $10,000 to $14,999 | 0 (0.0%) | 0 (0.0%) |
| $15,000 to $19,999 | 0 (0.0%) | 0 (0.0%) |
| $20,000 to $24,999 | 0 (0.0%) | 0 (0.0%) |
| $25,000 to $34,999 | 0 (0.0%) | 0 (0.0%) |
| $35,000 to $49,999 | 0 (0.0%) | 0 (0.0%) |
| $50,000 to $74,999 | 18 (75.0%) | 17 (63.0%) |
| $75,000 to $99,999 | 6 (25.0%) | 0 (0.0%) |
| $100,000 to $149,999 | 0 (0.0%) | 0 (0.0%) |
| $150,000 or more | 0 (0.0%) | 10 (37.0%) |
| Total | 24 (100.0%) | 27 (100.0%) |
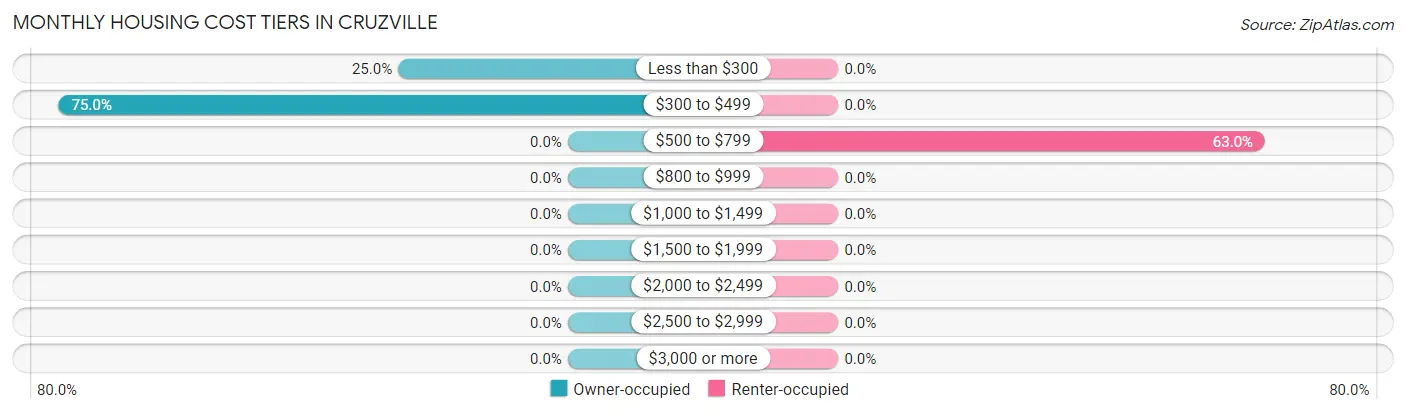
Monthly Housing Cost Tiers in Cruzville
| Monthly Cost | Owner-occupied | Renter-occupied |
| Less than $300 | 6 (25.0%) | 0 (0.0%) |
| $300 to $499 | 18 (75.0%) | 0 (0.0%) |
| $500 to $799 | 0 (0.0%) | 17 (63.0%) |
| $800 to $999 | 0 (0.0%) | 0 (0.0%) |
| $1,000 to $1,499 | 0 (0.0%) | 0 (0.0%) |
| $1,500 to $1,999 | 0 (0.0%) | 0 (0.0%) |
| $2,000 to $2,499 | 0 (0.0%) | 0 (0.0%) |
| $2,500 to $2,999 | 0 (0.0%) | 0 (0.0%) |
| $3,000 or more | 0 (0.0%) | 0 (0.0%) |
| Total | 24 (100.0%) | 27 (100.0%) |
Physical Housing Characteristics in Cruzville
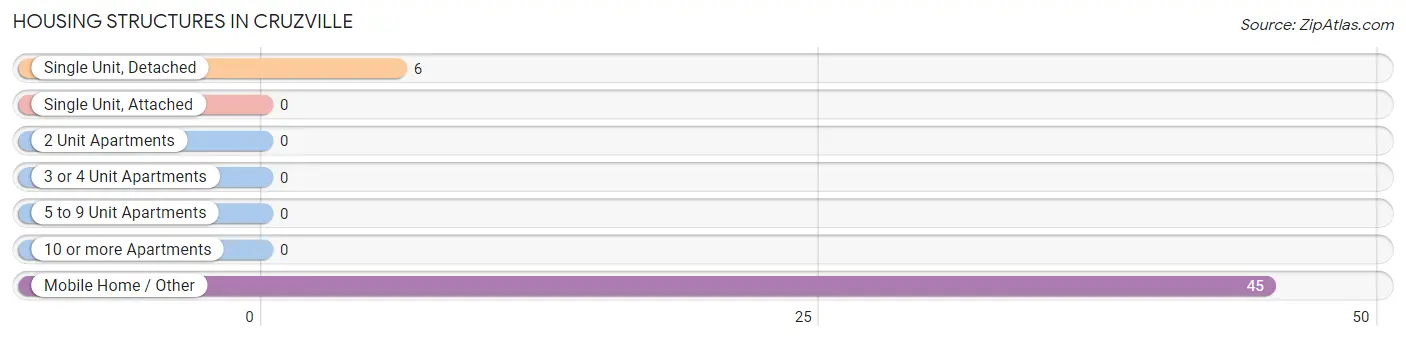
Housing Structures in Cruzville
| Structure Type | # Housing Units | % Housing Units |
| Single Unit, Detached | 6 | 11.8% |
| Single Unit, Attached | 0 | 0.0% |
| 2 Unit Apartments | 0 | 0.0% |
| 3 or 4 Unit Apartments | 0 | 0.0% |
| 5 to 9 Unit Apartments | 0 | 0.0% |
| 10 or more Apartments | 0 | 0.0% |
| Mobile Home / Other | 45 | 88.2% |
| Total | 51 | 100.0% |
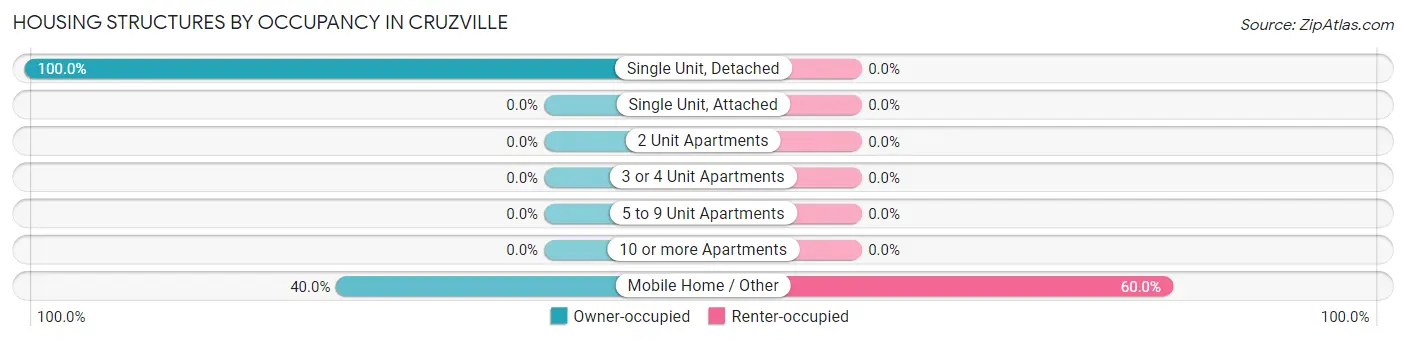
Housing Structures by Occupancy in Cruzville
| Structure Type | Owner-occupied | Renter-occupied |
| Single Unit, Detached | 6 (100.0%) | 0 (0.0%) |
| Single Unit, Attached | 0 (0.0%) | 0 (0.0%) |
| 2 Unit Apartments | 0 (0.0%) | 0 (0.0%) |
| 3 or 4 Unit Apartments | 0 (0.0%) | 0 (0.0%) |
| 5 to 9 Unit Apartments | 0 (0.0%) | 0 (0.0%) |
| 10 or more Apartments | 0 (0.0%) | 0 (0.0%) |
| Mobile Home / Other | 18 (40.0%) | 27 (60.0%) |
| Total | 24 (47.1%) | 27 (52.9%) |
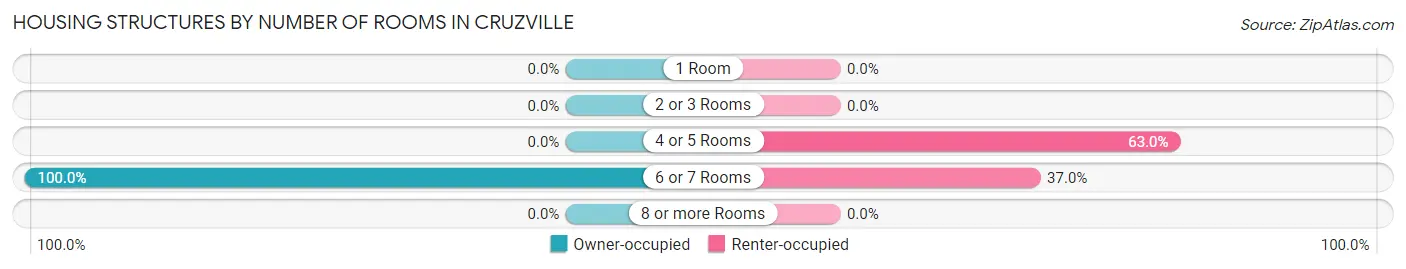
Housing Structures by Number of Rooms in Cruzville
| Number of Rooms | Owner-occupied | Renter-occupied |
| 1 Room | 0 (0.0%) | 0 (0.0%) |
| 2 or 3 Rooms | 0 (0.0%) | 0 (0.0%) |
| 4 or 5 Rooms | 0 (0.0%) | 17 (63.0%) |
| 6 or 7 Rooms | 24 (100.0%) | 10 (37.0%) |
| 8 or more Rooms | 0 (0.0%) | 0 (0.0%) |
| Total | 24 (100.0%) | 27 (100.0%) |
Housing Structure by Heating Type in Cruzville
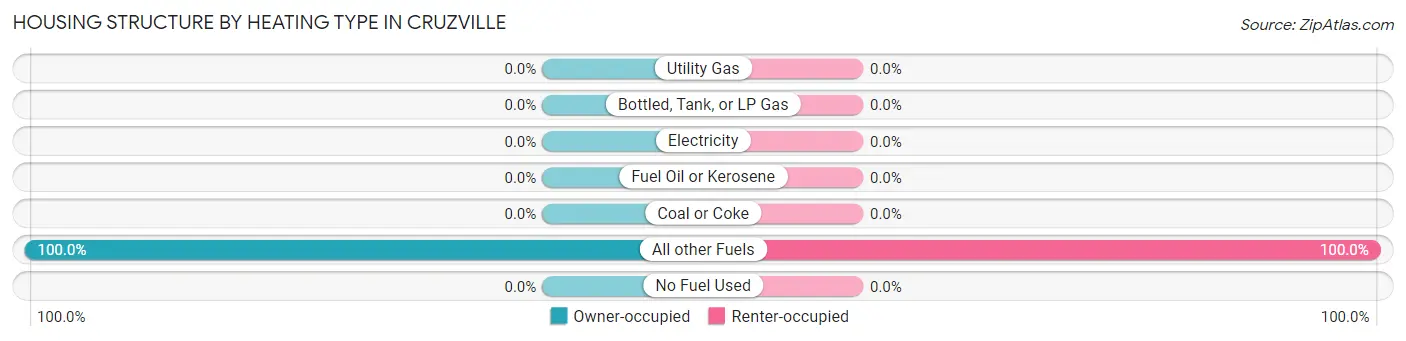
| Heating Type | Owner-occupied | Renter-occupied |
| Utility Gas | 0 (0.0%) | 0 (0.0%) |
| Bottled, Tank, or LP Gas | 0 (0.0%) | 0 (0.0%) |
| Electricity | 0 (0.0%) | 0 (0.0%) |
| Fuel Oil or Kerosene | 0 (0.0%) | 0 (0.0%) |
| Coal or Coke | 0 (0.0%) | 0 (0.0%) |
| All other Fuels | 24 (100.0%) | 27 (100.0%) |
| No Fuel Used | 0 (0.0%) | 0 (0.0%) |
| Total | 24 (100.0%) | 27 (100.0%) |
Household Vehicle Usage in Cruzville
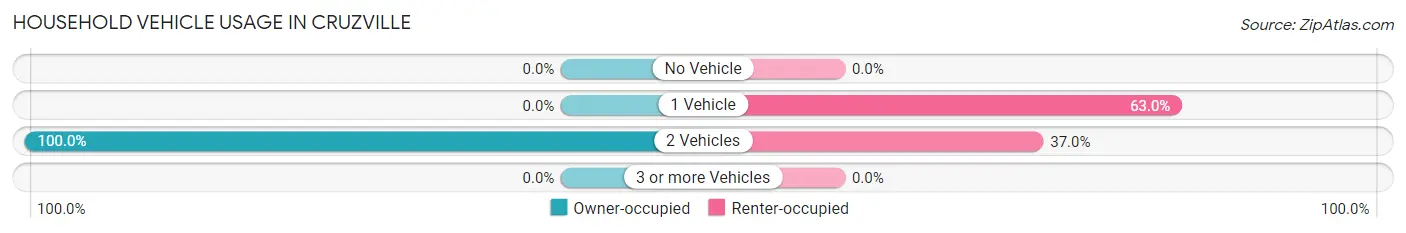
| Vehicles per Household | Owner-occupied | Renter-occupied |
| No Vehicle | 0 (0.0%) | 0 (0.0%) |
| 1 Vehicle | 0 (0.0%) | 17 (63.0%) |
| 2 Vehicles | 24 (100.0%) | 10 (37.0%) |
| 3 or more Vehicles | 0 (0.0%) | 0 (0.0%) |
| Total | 24 (100.0%) | 27 (100.0%) |
Real Estate & Mortgages in Cruzville
Real Estate and Mortgage Overview in Cruzville
| Characteristic | Without Mortgage | With Mortgage |
| Housing Units | 24 | 0 |
| Median Property Value | - | - |
| Median Household Income | - | - |
| Monthly Housing Costs | - | - |
| Real Estate Taxes | - | - |
Property Value by Mortgage Status in Cruzville
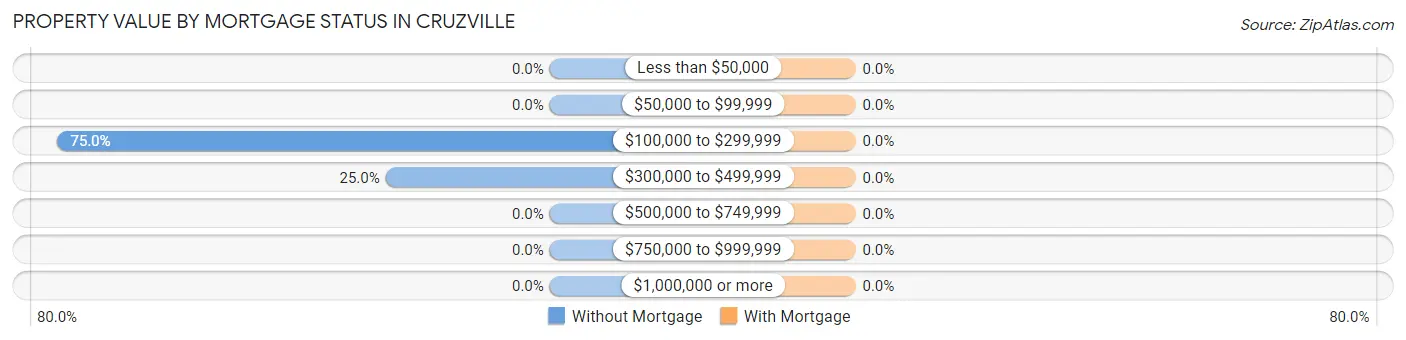
| Property Value | Without Mortgage | With Mortgage |
| Less than $50,000 | 0 (0.0%) | 0 (0.0%) |
| $50,000 to $99,999 | 0 (0.0%) | 0 (0.0%) |
| $100,000 to $299,999 | 18 (75.0%) | 0 (0.0%) |
| $300,000 to $499,999 | 6 (25.0%) | 0 (0.0%) |
| $500,000 to $749,999 | 0 (0.0%) | 0 (0.0%) |
| $750,000 to $999,999 | 0 (0.0%) | 0 (0.0%) |
| $1,000,000 or more | 0 (0.0%) | 0 (0.0%) |
| Total | 24 (100.0%) | 0 (0.0%) |
Household Income by Mortgage Status in Cruzville

| Household Income | Without Mortgage | With Mortgage |
| Less than $10,000 | 0 (0.0%) | 0 (0.0%) |
| $10,000 to $24,999 | 0 (0.0%) | 0 (0.0%) |
| $25,000 to $34,999 | 0 (0.0%) | 0 (0.0%) |
| $35,000 to $49,999 | 0 (0.0%) | 0 (0.0%) |
| $50,000 to $74,999 | 18 (75.0%) | 0 (0.0%) |
| $75,000 to $99,999 | 6 (25.0%) | 0 (0.0%) |
| $100,000 to $149,999 | 0 (0.0%) | 0 (0.0%) |
| $150,000 or more | 0 (0.0%) | 0 (0.0%) |
| Total | 24 (100.0%) | 0 (0.0%) |
Property Value to Household Income Ratio in Cruzville
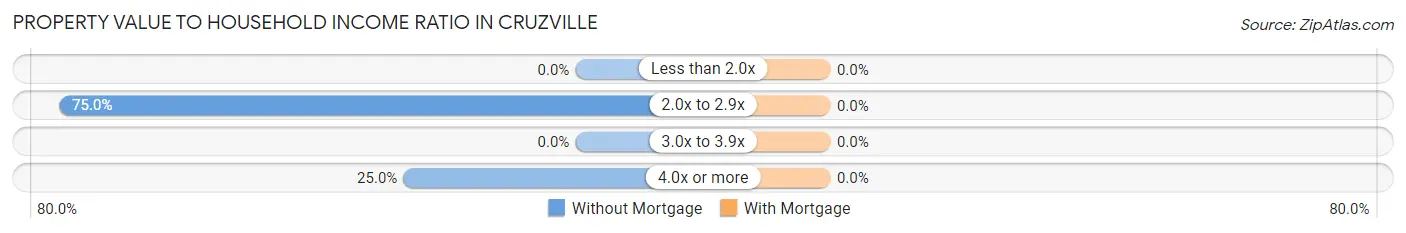
| Value-to-Income Ratio | Without Mortgage | With Mortgage |
| Less than 2.0x | 0 (0.0%) | 0 (0.0%) |
| 2.0x to 2.9x | 18 (75.0%) | 0 (0.0%) |
| 3.0x to 3.9x | 0 (0.0%) | 0 (0.0%) |
| 4.0x or more | 6 (25.0%) | 0 (0.0%) |
| Total | 24 (100.0%) | 0 (0.0%) |
Real Estate Taxes by Mortgage Status in Cruzville
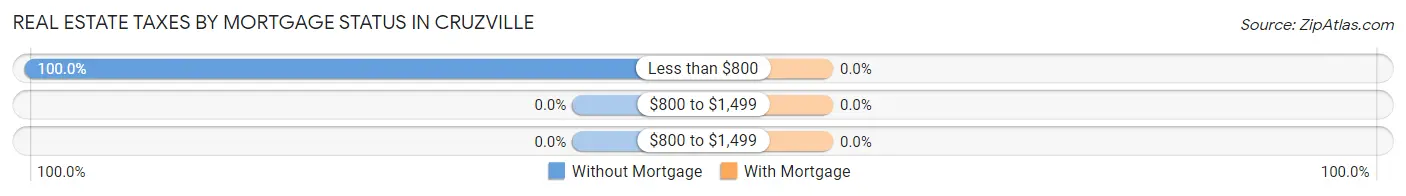
| Property Taxes | Without Mortgage | With Mortgage |
| Less than $800 | 24 (100.0%) | 0 (0.0%) |
| $800 to $1,499 | 0 (0.0%) | 0 (0.0%) |
| $800 to $1,499 | 0 (0.0%) | 0 (0.0%) |
| Total | 24 (100.0%) | 0 (0.0%) |
Health & Disability in Cruzville
Health Insurance Coverage by Age in Cruzville
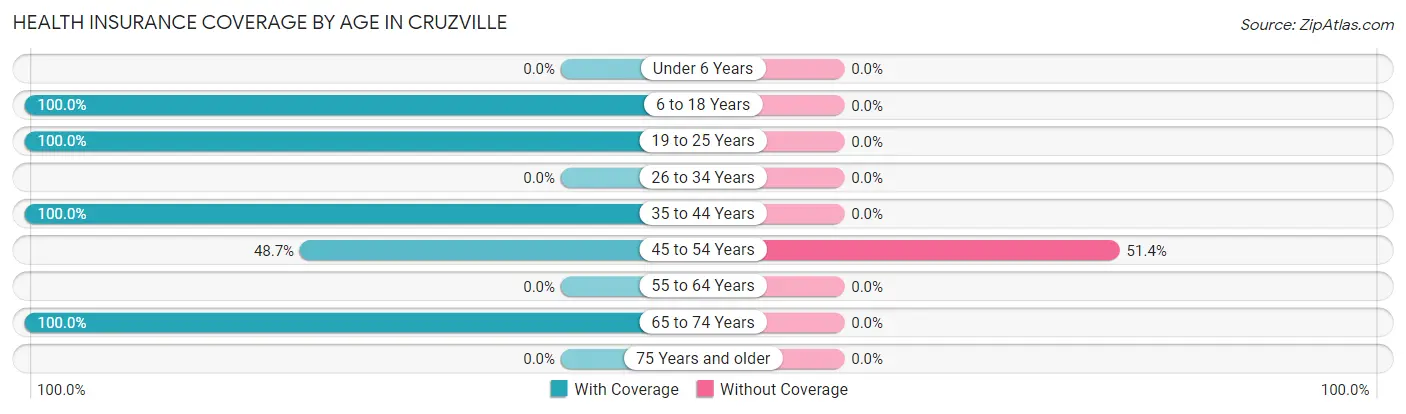
| Age Bracket | With Coverage | Without Coverage |
| Under 6 Years | 0 (0.0%) | 0 (0.0%) |
| 6 to 18 Years | 16 (100.0%) | 0 (0.0%) |
| 19 to 25 Years | 158 (100.0%) | 0 (0.0%) |
| 26 to 34 Years | 0 (0.0%) | 0 (0.0%) |
| 35 to 44 Years | 17 (100.0%) | 0 (0.0%) |
| 45 to 54 Years | 36 (48.6%) | 38 (51.3%) |
| 55 to 64 Years | 0 (0.0%) | 0 (0.0%) |
| 65 to 74 Years | 14 (100.0%) | 0 (0.0%) |
| 75 Years and older | 0 (0.0%) | 0 (0.0%) |
| Total | 241 (86.4%) | 38 (13.6%) |
Health Insurance Coverage by Citizenship Status in Cruzville

| Citizenship Status | With Coverage | Without Coverage |
| Native Born | 0 (0.0%) | 0 (0.0%) |
| Foreign Born, Citizen | 16 (100.0%) | 0 (0.0%) |
| Foreign Born, not a Citizen | 158 (100.0%) | 0 (0.0%) |
Health Insurance Coverage by Household Income in Cruzville
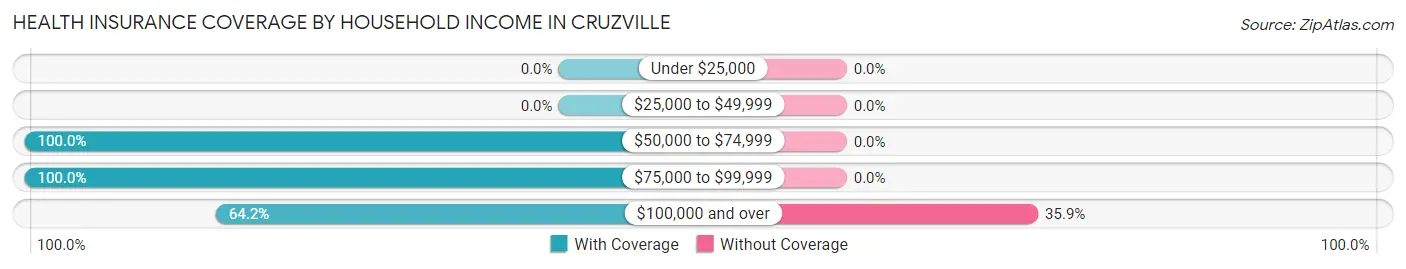
| Household Income | With Coverage | Without Coverage |
| Under $25,000 | 0 (0.0%) | 0 (0.0%) |
| $25,000 to $49,999 | 0 (0.0%) | 0 (0.0%) |
| $50,000 to $74,999 | 159 (100.0%) | 0 (0.0%) |
| $75,000 to $99,999 | 14 (100.0%) | 0 (0.0%) |
| $100,000 and over | 68 (64.1%) | 38 (35.8%) |
Public vs Private Health Insurance Coverage by Age in Cruzville
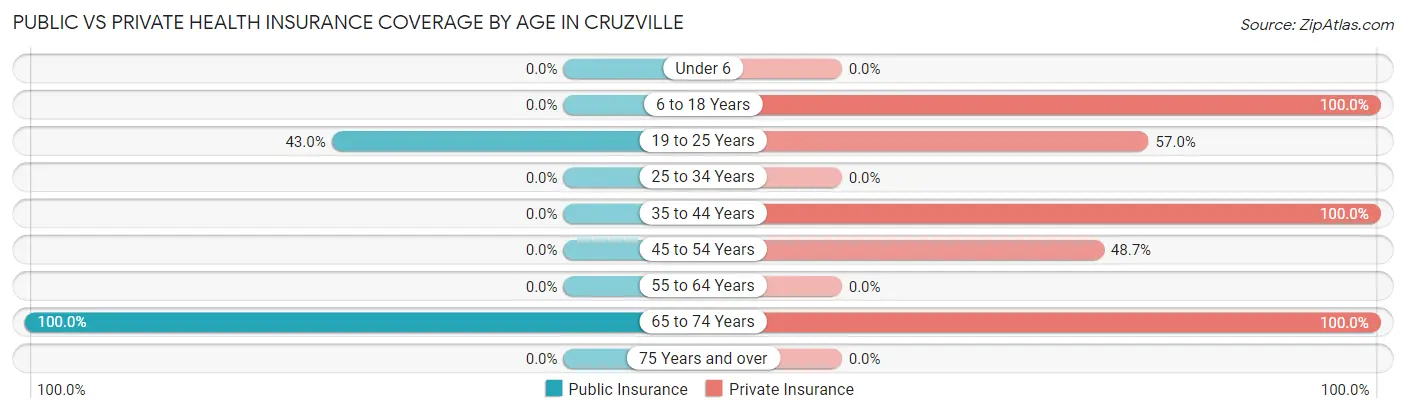
| Age Bracket | Public Insurance | Private Insurance |
| Under 6 | 0 (0.0%) | 0 (0.0%) |
| 6 to 18 Years | 0 (0.0%) | 16 (100.0%) |
| 19 to 25 Years | 68 (43.0%) | 90 (57.0%) |
| 25 to 34 Years | 0 (0.0%) | 0 (0.0%) |
| 35 to 44 Years | 0 (0.0%) | 17 (100.0%) |
| 45 to 54 Years | 0 (0.0%) | 36 (48.6%) |
| 55 to 64 Years | 0 (0.0%) | 0 (0.0%) |
| 65 to 74 Years | 14 (100.0%) | 14 (100.0%) |
| 75 Years and over | 0 (0.0%) | 0 (0.0%) |
| Total | 82 (29.4%) | 173 (62.0%) |
Disability Status by Sex by Age in Cruzville
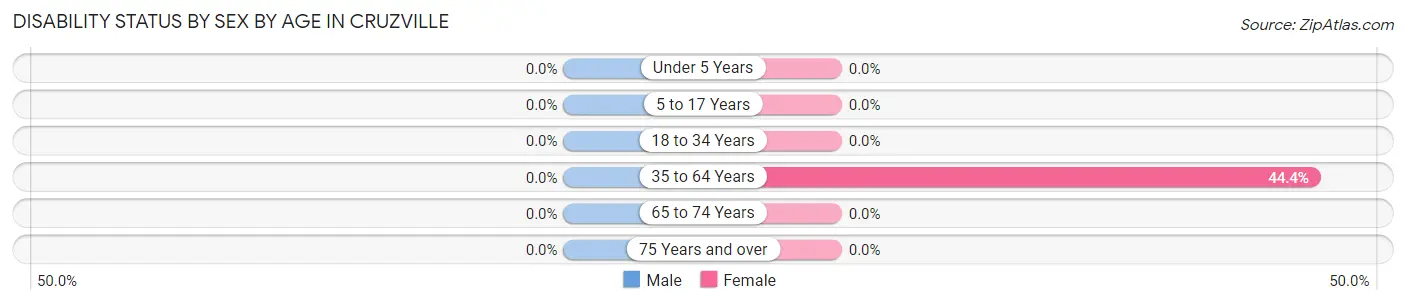
| Age Bracket | Male | Female |
| Under 5 Years | 0 (0.0%) | 0 (0.0%) |
| 5 to 17 Years | 0 (0.0%) | 0 (0.0%) |
| 18 to 34 Years | 0 (0.0%) | 0 (0.0%) |
| 35 to 64 Years | 0 (0.0%) | 28 (44.4%) |
| 65 to 74 Years | 0 (0.0%) | 0 (0.0%) |
| 75 Years and over | 0 (0.0%) | 0 (0.0%) |
Disability Class by Sex by Age in Cruzville
Disability Class: Hearing Difficulty
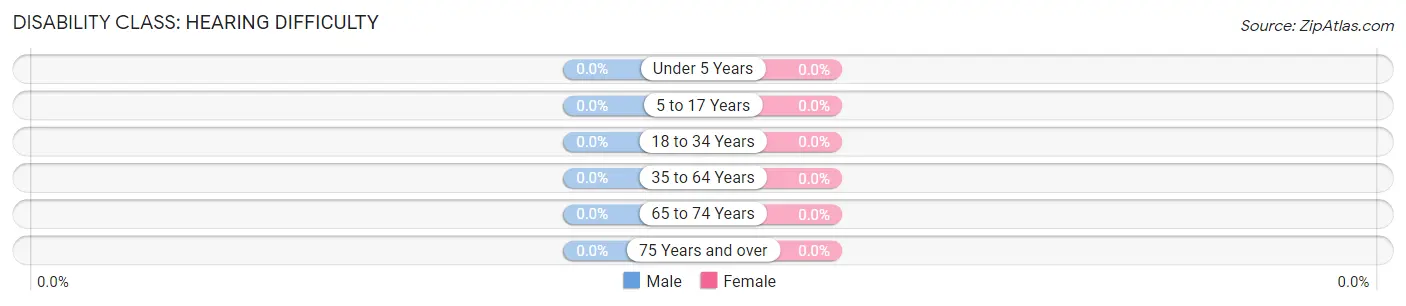
| Age Bracket | Male | Female |
| Under 5 Years | 0 (0.0%) | 0 (0.0%) |
| 5 to 17 Years | 0 (0.0%) | 0 (0.0%) |
| 18 to 34 Years | 0 (0.0%) | 0 (0.0%) |
| 35 to 64 Years | 0 (0.0%) | 0 (0.0%) |
| 65 to 74 Years | 0 (0.0%) | 0 (0.0%) |
| 75 Years and over | 0 (0.0%) | 0 (0.0%) |
Disability Class: Vision Difficulty
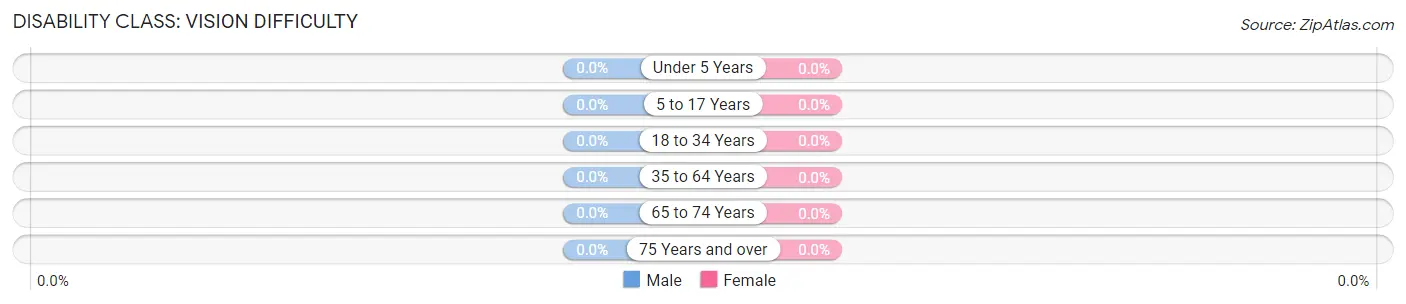
| Age Bracket | Male | Female |
| Under 5 Years | 0 (0.0%) | 0 (0.0%) |
| 5 to 17 Years | 0 (0.0%) | 0 (0.0%) |
| 18 to 34 Years | 0 (0.0%) | 0 (0.0%) |
| 35 to 64 Years | 0 (0.0%) | 0 (0.0%) |
| 65 to 74 Years | 0 (0.0%) | 0 (0.0%) |
| 75 Years and over | 0 (0.0%) | 0 (0.0%) |
Disability Class: Cognitive Difficulty
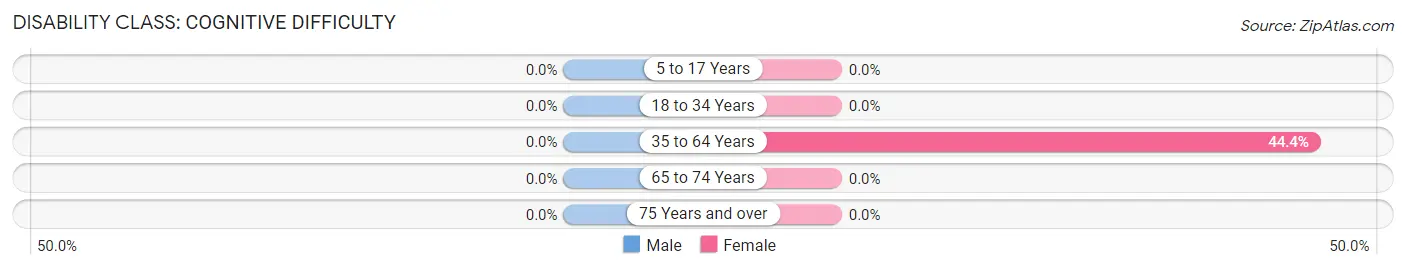
| Age Bracket | Male | Female |
| 5 to 17 Years | 0 (0.0%) | 0 (0.0%) |
| 18 to 34 Years | 0 (0.0%) | 0 (0.0%) |
| 35 to 64 Years | 0 (0.0%) | 28 (44.4%) |
| 65 to 74 Years | 0 (0.0%) | 0 (0.0%) |
| 75 Years and over | 0 (0.0%) | 0 (0.0%) |
Disability Class: Ambulatory Difficulty
| Age Bracket | Male | Female |
| 5 to 17 Years | 0 (0.0%) | 0 (0.0%) |
| 18 to 34 Years | 0 (0.0%) | 0 (0.0%) |
| 35 to 64 Years | 0 (0.0%) | 0 (0.0%) |
| 65 to 74 Years | 0 (0.0%) | 0 (0.0%) |
| 75 Years and over | 0 (0.0%) | 0 (0.0%) |
Disability Class: Self-Care Difficulty
| Age Bracket | Male | Female |
| 5 to 17 Years | 0 (0.0%) | 0 (0.0%) |
| 18 to 34 Years | 0 (0.0%) | 0 (0.0%) |
| 35 to 64 Years | 0 (0.0%) | 0 (0.0%) |
| 65 to 74 Years | 0 (0.0%) | 0 (0.0%) |
| 75 Years and over | 0 (0.0%) | 0 (0.0%) |
Technology Access in Cruzville
Computing Device Access in Cruzville
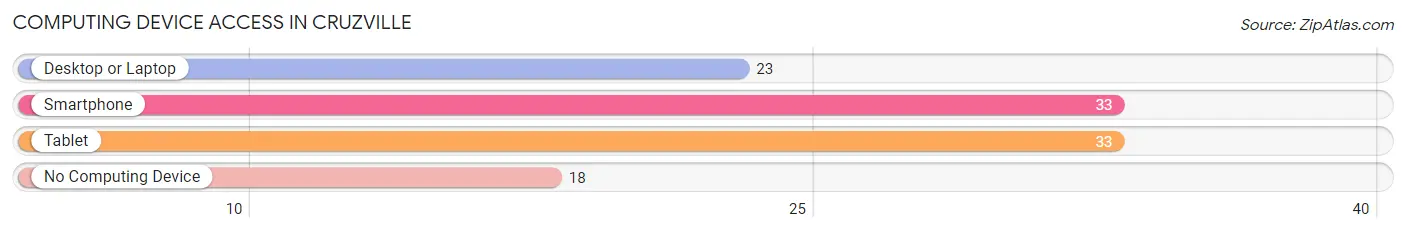
| Device Type | # Households | % Households |
| Desktop or Laptop | 23 | 45.1% |
| Smartphone | 33 | 64.7% |
| Tablet | 33 | 64.7% |
| No Computing Device | 18 | 35.3% |
| Total | 51 | 100.0% |
Internet Access in Cruzville
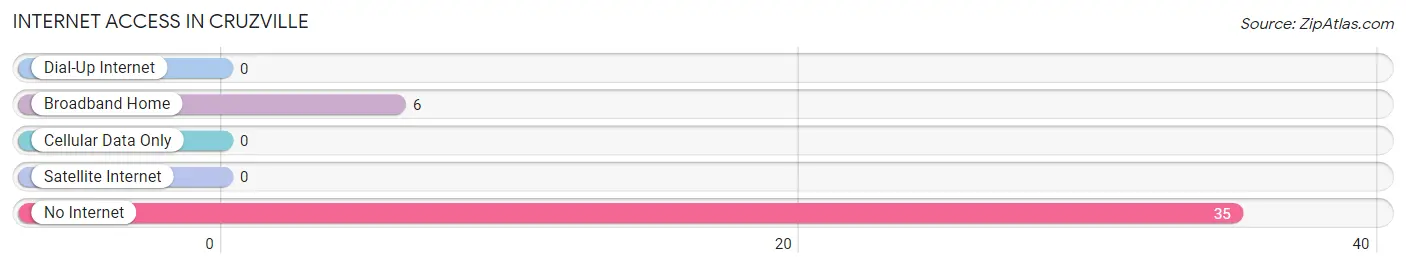
| Internet Type | # Households | % Households |
| Dial-Up Internet | 0 | 0.0% |
| Broadband Home | 6 | 11.8% |
| Cellular Data Only | 0 | 0.0% |
| Satellite Internet | 0 | 0.0% |
| No Internet | 35 | 68.6% |
| Total | 51 | 100.0% |
Cruzville Summary
Cruzville, NM is a small unincorporated community located in the northwest corner of New Mexico. It is situated in the San Juan Basin, which is part of the larger Colorado Plateau. The area is known for its rugged terrain and stunning views of the surrounding mountains. The community is home to a diverse population of Native Americans, Hispanics, and Anglos.
History
Cruzville, NM was first settled in the late 1800s by a group of Hispanic settlers. The area was originally known as “La Cruz”, which translates to “the cross” in English. The name was changed to Cruzville in the early 1900s. The community was a small farming and ranching community until the 1950s when oil and gas exploration began in the area. This led to an influx of people and businesses, and the population of Cruzville began to grow.
Geography
Cruzville, NM is located in the northwest corner of New Mexico, in the San Juan Basin. The area is known for its rugged terrain and stunning views of the surrounding mountains. The community is situated at an elevation of 5,400 feet and is surrounded by the Chuska Mountains to the east, the San Juan Mountains to the west, and the La Plata Mountains to the south. The climate in the area is semi-arid, with hot summers and cold winters.
Economy
The economy of Cruzville, NM is largely based on oil and gas exploration. The area is home to several oil and gas companies, as well as a number of related businesses. The community is also home to a number of small businesses, including restaurants, grocery stores, and other retail establishments. The area is also home to a number of farms and ranches, which provide employment for many of the local residents.
Demographics
As of the 2010 census, the population of Cruzville, NM was 1,845. The population is largely Hispanic, with a small percentage of Native Americans and Anglos. The median household income in the area is $35,000, and the median age is 33. The area is home to a number of churches, including Catholic, Baptist, and Methodist.
Cruzville, NM is a small, rural community with a rich history and a diverse population. The area is known for its rugged terrain and stunning views of the surrounding mountains. The economy of the area is largely based on oil and gas exploration, and the population is largely Hispanic. The area is home to a number of small businesses, farms, and ranches, which provide employment for many of the local residents.
Common Questions
What is Per Capita Income in Cruzville?
Per Capita income in Cruzville is $23,785.
What is the Median Household income in Cruzville?
Median Household Income in Cruzville is $58,603.
What is Inequality or Gini Index in Cruzville?
Inequality or Gini Index in Cruzville is 0.40.
What is the Total Population of Cruzville?
Total Population of Cruzville is 279.
What is the Total Male Population of Cruzville?
Total Male Population of Cruzville is 208.
What is the Total Female Population of Cruzville?
Total Female Population of Cruzville is 71.
What is the Ratio of Males per 100 Females in Cruzville?
There are 292.96 Males per 100 Females in Cruzville.
What is the Ratio of Females per 100 Males in Cruzville?
There are 34.13 Females per 100 Males in Cruzville.
What is the Median Population Age in Cruzville?
Median Population Age in Cruzville is 25.3 Years.
What is the Average Family Size in Cruzville
Average Family Size in Cruzville is 7.7 People.
What is the Average Household Size in Cruzville
Average Household Size in Cruzville is 5.5 People.
How Large is the Labor Force in Cruzville?
There are 63 People in the Labor Forcein in Cruzville.
What is the Percentage of People in the Labor Force in Cruzville?
22.6% of People are in the Labor Force in Cruzville.