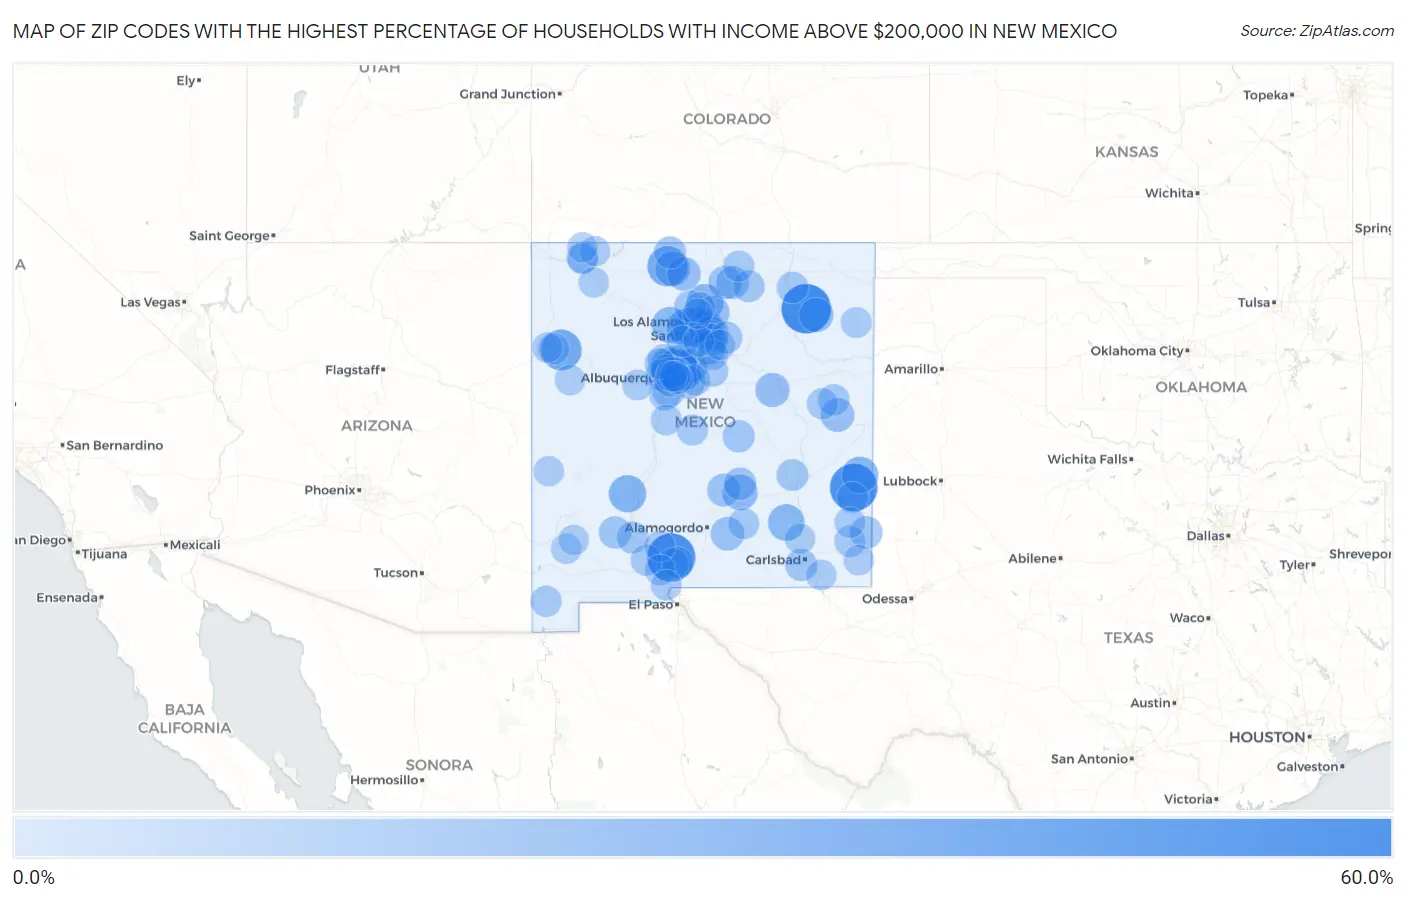
Zip Codes with the Highest Percentage of Households with Income Above $200,000 in New Mexico
RELATED REPORTS & OPTIONS
Household Income | $200k+
New Mexico
Compare Zip Codes
Map of Zip Codes with the Highest Percentage of Households with Income Above $200,000 in New Mexico
0.0%
60.0%
Zip Codes with the Highest Percentage of Households with Income Above $200,000 in New Mexico
| Zip Code | Households with Income > $200k | vs State | vs National | |
| 1. | 87730 | 57.1% | 6.1%(+51.0)#1 | 11.4%(+45.7)#145 |
| 2. | 88052 | 53.2% | 6.1%(+47.1)#2 | 11.4%(+41.8)#210 |
| 3. | 88114 | 51.7% | 6.1%(+45.6)#3 | 11.4%(+40.3)#239 |
| 4. | 87122 | 35.9% | 6.1%(+29.8)#4 | 11.4%(+24.5)#911 |
| 5. | 87316 | 32.6% | 6.1%(+26.5)#5 | 11.4%(+21.2)#1,199 |
| 6. | 87551 | 31.2% | 6.1%(+25.1)#6 | 11.4%(+19.8)#1,335 |
| 7. | 87547 | 30.1% | 6.1%(+24.0)#7 | 11.4%(+18.7)#1,446 |
| 8. | 87544 | 25.0% | 6.1%(+18.9)#8 | 11.4%(+13.6)#2,191 |
| 9. | 87939 | 23.2% | 6.1%(+17.1)#9 | 11.4%(+11.8)#2,529 |
| 10. | 87048 | 23.0% | 6.1%(+16.9)#10 | 11.4%(+11.6)#2,559 |
| 11. | 87008 | 23.0% | 6.1%(+16.9)#11 | 11.4%(+11.6)#2,562 |
| 12. | 87582 | 22.4% | 6.1%(+16.3)#12 | 11.4%(+11.0)#2,706 |
| 13. | 88125 | 21.1% | 6.1%(+15.0)#13 | 11.4%(+9.70)#3,016 |
| 14. | 88253 | 21.0% | 6.1%(+14.9)#14 | 11.4%(+9.60)#3,039 |
| 15. | 87025 | 20.2% | 6.1%(+14.1)#15 | 11.4%(+8.80)#3,244 |
| 16. | 88348 | 18.1% | 6.1%(+12.0)#16 | 11.4%(+6.70)#3,834 |
| 17. | 87506 | 17.2% | 6.1%(+11.1)#17 | 11.4%(+5.80)#4,108 |
| 18. | 87575 | 16.5% | 6.1%(+10.4)#18 | 11.4%(+5.10)#4,396 |
| 19. | 87501 | 16.0% | 6.1%(+9.90)#19 | 11.4%(+4.60)#4,566 |
| 20. | 87047 | 15.7% | 6.1%(+9.60)#20 | 11.4%(+4.30)#4,700 |
| 21. | 87043 | 15.6% | 6.1%(+9.50)#21 | 11.4%(+4.20)#4,739 |
| 22. | 87743 | 15.4% | 6.1%(+9.30)#22 | 11.4%(+4.00)#4,830 |
| 23. | 88435 | 14.5% | 6.1%(+8.40)#23 | 11.4%(+3.10)#5,231 |
| 24. | 87523 | 13.8% | 6.1%(+7.70)#24 | 11.4%(+2.40)#5,608 |
| 25. | 87508 | 13.7% | 6.1%(+7.60)#25 | 11.4%(+2.30)#5,626 |
| 26. | 88124 | 13.4% | 6.1%(+7.30)#26 | 11.4%(+2.00)#5,831 |
| 27. | 87515 | 13.4% | 6.1%(+7.30)#27 | 11.4%(+2.00)#5,835 |
| 28. | 88317 | 13.3% | 6.1%(+7.20)#28 | 11.4%(+1.90)#5,871 |
| 29. | 87104 | 12.4% | 6.1%(+6.30)#29 | 11.4%(+1.000)#6,417 |
| 30. | 87111 | 12.3% | 6.1%(+6.20)#30 | 11.4%(+0.900)#6,457 |
| 31. | 87529 | 12.3% | 6.1%(+6.20)#31 | 11.4%(+0.900)#6,491 |
| 32. | 87571 | 11.9% | 6.1%(+5.80)#32 | 11.4%(+0.500)#6,741 |
| 33. | 88312 | 11.4% | 6.1%(+5.30)#33 | 11.4%(=0.000)#7,114 |
| 34. | 87059 | 10.7% | 6.1%(+4.60)#34 | 11.4%(-0.700)#7,648 |
| 35. | 88242 | 10.7% | 6.1%(+4.60)#35 | 11.4%(-0.700)#7,655 |
| 36. | 87505 | 10.2% | 6.1%(+4.10)#36 | 11.4%(-1.20)#8,055 |
| 37. | 88338 | 10.2% | 6.1%(+4.10)#37 | 11.4%(-1.20)#8,121 |
| 38. | 88042 | 10.0% | 6.1%(+3.90)#38 | 11.4%(-1.40)#8,332 |
| 39. | 87113 | 9.6% | 6.1%(+3.50)#39 | 11.4%(-1.80)#8,643 |
| 40. | 87520 | 9.6% | 6.1%(+3.50)#40 | 11.4%(-1.80)#8,680 |
| 41. | 88318 | 9.5% | 6.1%(+3.40)#41 | 11.4%(-1.90)#8,809 |
| 42. | 87552 | 9.3% | 6.1%(+3.20)#42 | 11.4%(-2.10)#8,984 |
| 43. | 88220 | 9.2% | 6.1%(+3.10)#43 | 11.4%(-2.20)#9,031 |
| 44. | 87068 | 9.1% | 6.1%(+3.00)#44 | 11.4%(-2.30)#9,162 |
| 45. | 87936 | 8.9% | 6.1%(+2.80)#45 | 11.4%(-2.50)#9,404 |
| 46. | 88201 | 8.3% | 6.1%(+2.20)#46 | 11.4%(-3.10)#10,006 |
| 47. | 87710 | 8.3% | 6.1%(+2.20)#47 | 11.4%(-3.10)#10,073 |
| 48. | 87537 | 8.0% | 6.1%(+1.90)#48 | 11.4%(-3.40)#10,429 |
| 49. | 87747 | 7.9% | 6.1%(+1.80)#49 | 11.4%(-3.50)#10,566 |
| 50. | 87402 | 7.8% | 6.1%(+1.70)#50 | 11.4%(-3.60)#10,651 |
| 51. | 88011 | 7.7% | 6.1%(+1.60)#51 | 11.4%(-3.70)#10,762 |
| 52. | 87144 | 7.6% | 6.1%(+1.50)#52 | 11.4%(-3.80)#10,893 |
| 53. | 87107 | 7.6% | 6.1%(+1.50)#53 | 11.4%(-3.80)#10,916 |
| 54. | 87072 | 7.6% | 6.1%(+1.50)#54 | 11.4%(-3.80)#11,013 |
| 55. | 88427 | 7.5% | 6.1%(+1.40)#55 | 11.4%(-3.90)#11,171 |
| 56. | 88002 | 7.3% | 6.1%(+1.20)#56 | 11.4%(-4.10)#11,430 |
| 57. | 87120 | 7.2% | 6.1%(+1.10)#57 | 11.4%(-4.20)#11,464 |
| 58. | 88240 | 7.2% | 6.1%(+1.10)#58 | 11.4%(-4.20)#11,477 |
| 59. | 87056 | 7.1% | 6.1%(+1.000)#59 | 11.4%(-4.30)#11,714 |
| 60. | 88267 | 7.0% | 6.1%(+0.900)#60 | 11.4%(-4.40)#11,853 |
| 61. | 87042 | 6.9% | 6.1%(+0.800)#61 | 11.4%(-4.50)#11,980 |
| 62. | 87114 | 6.8% | 6.1%(+0.700)#62 | 11.4%(-4.60)#12,046 |
| 63. | 87106 | 6.8% | 6.1%(+0.700)#63 | 11.4%(-4.60)#12,077 |
| 64. | 87322 | 6.8% | 6.1%(+0.700)#64 | 11.4%(-4.60)#12,188 |
| 65. | 88121 | 6.8% | 6.1%(+0.700)#65 | 11.4%(-4.60)#12,204 |
| 66. | 88007 | 6.7% | 6.1%(+0.600)#66 | 11.4%(-4.70)#12,230 |
| 67. | 87015 | 6.7% | 6.1%(+0.600)#67 | 11.4%(-4.70)#12,246 |
| 68. | 87558 | 6.6% | 6.1%(+0.500)#68 | 11.4%(-4.80)#12,514 |
| 69. | 87540 | 6.6% | 6.1%(+0.500)#69 | 11.4%(-4.80)#12,519 |
| 70. | 88020 | 6.4% | 6.1%(+0.300)#70 | 11.4%(-5.00)#12,854 |
| 71. | 87036 | 6.3% | 6.1%(+0.200)#71 | 11.4%(-5.10)#13,006 |
| 72. | 88339 | 6.3% | 6.1%(+0.200)#72 | 11.4%(-5.10)#13,035 |
| 73. | 87109 | 6.2% | 6.1%(+0.100)#73 | 11.4%(-5.20)#13,072 |
| 74. | 87124 | 6.0% | 6.1%(-0.100)#74 | 11.4%(-5.40)#13,428 |
| 75. | 87507 | 5.9% | 6.1%(-0.200)#75 | 11.4%(-5.50)#13,619 |
| 76. | 87123 | 5.9% | 6.1%(-0.200)#76 | 11.4%(-5.50)#13,622 |
| 77. | 88410 | 5.9% | 6.1%(-0.200)#77 | 11.4%(-5.50)#13,814 |
| 78. | 87062 | 5.8% | 6.1%(-0.300)#78 | 11.4%(-5.60)#13,977 |
| 79. | 88260 | 5.7% | 6.1%(-0.400)#79 | 11.4%(-5.70)#14,096 |
| 80. | 87110 | 5.6% | 6.1%(-0.500)#80 | 11.4%(-5.80)#14,258 |
| 81. | 88012 | 5.6% | 6.1%(-0.500)#81 | 11.4%(-5.80)#14,271 |
| 82. | 87566 | 5.6% | 6.1%(-0.500)#82 | 11.4%(-5.80)#14,358 |
| 83. | 87112 | 5.5% | 6.1%(-0.600)#83 | 11.4%(-5.90)#14,475 |
| 84. | 88046 | 5.4% | 6.1%(-0.700)#84 | 11.4%(-6.00)#14,837 |
| 85. | 88027 | 5.2% | 6.1%(-0.900)#85 | 11.4%(-6.20)#15,261 |
| 86. | 87026 | 5.1% | 6.1%(-1.00)#86 | 11.4%(-6.30)#15,415 |
| 87. | 88256 | 5.1% | 6.1%(-1.00)#87 | 11.4%(-6.30)#15,444 |
| 88. | 88231 | 5.0% | 6.1%(-1.10)#88 | 11.4%(-6.40)#15,685 |
| 89. | 88061 | 4.8% | 6.1%(-1.30)#89 | 11.4%(-6.60)#16,076 |
| 90. | 87321 | 4.8% | 6.1%(-1.30)#90 | 11.4%(-6.60)#16,185 |
| 91. | 88210 | 4.7% | 6.1%(-1.40)#91 | 11.4%(-6.70)#16,307 |
| 92. | 88065 | 4.7% | 6.1%(-1.40)#92 | 11.4%(-6.70)#16,471 |
| 93. | 87401 | 4.6% | 6.1%(-1.50)#93 | 11.4%(-6.80)#16,507 |
| 94. | 87410 | 4.5% | 6.1%(-1.60)#94 | 11.4%(-6.90)#16,805 |
| 95. | 87413 | 4.5% | 6.1%(-1.60)#95 | 11.4%(-6.90)#16,806 |
| 96. | 87535 | 4.5% | 6.1%(-1.60)#96 | 11.4%(-6.90)#16,917 |
| 97. | 87418 | 4.5% | 6.1%(-1.60)#97 | 11.4%(-6.90)#16,947 |
| 98. | 87301 | 4.4% | 6.1%(-1.70)#98 | 11.4%(-7.00)#17,038 |
| 99. | 87532 | 4.4% | 6.1%(-1.70)#99 | 11.4%(-7.00)#17,042 |
| 100. | 87830 | 4.4% | 6.1%(-1.70)#100 | 11.4%(-7.00)#17,207 |
Common Questions
What are the Top 10 Zip Codes with the Highest Percentage of Households with Income Above $200,000 in New Mexico?
Top 10 Zip Codes with the Highest Percentage of Households with Income Above $200,000 in New Mexico are:
What zip code has the Highest Percentage of Households with Income Above $200,000 in New Mexico?
87730 has the Highest Percentage of Households with Income Above $200,000 in New Mexico with 57.1%.
What is the Percentage of Households with Income Above $200,000 in the State of New Mexico?
Percentage of Households with Income Above $200,000 in New Mexico is 6.1%.
What is the Percentage of Households with Income Above $200,000 in the United States?
Percentage of Households with Income Above $200,000 in the United States is 11.4%.