Statesville, NC Map & Demographics
Statesville Map
Statesville Overview
$29,538
PER CAPITA INCOME
$68,420
AVG FAMILY INCOME
$51,784
AVG HOUSEHOLD INCOME
23.5%
WAGE / INCOME GAP [ % ]
76.5¢/ $1
WAGE / INCOME GAP [ $ ]
$9,706
FAMILY INCOME DEFICIT
0.44
INEQUALITY / GINI INDEX
28,576
TOTAL POPULATION
14,068
MALE POPULATION
14,508
FEMALE POPULATION
96.97
MALES / 100 FEMALES
103.13
FEMALES / 100 MALES
38.3
MEDIAN AGE
3.1
AVG FAMILY SIZE
2.4
AVG HOUSEHOLD SIZE
14,576
LABOR FORCE [ PEOPLE ]
64.3%
PERCENT IN LABOR FORCE
7.2%
UNEMPLOYMENT RATE
Income in Statesville
Income Overview in Statesville
Per Capita Income in Statesville is $29,538, while median incomes of families and households are $68,420 and $51,784 respectively.
| Characteristic | Number | Measure |
| Per Capita Income | 28,576 | $29,538 |
| Median Family Income | 7,225 | $68,420 |
| Mean Family Income | 7,225 | $84,691 |
| Median Household Income | 11,400 | $51,784 |
| Mean Household Income | 11,400 | $69,519 |
| Income Deficit | 7,225 | $9,706 |
| Wage / Income Gap (%) | 28,576 | 23.49% |
| Wage / Income Gap ($) | 28,576 | 76.51¢ per $1 |
| Gini / Inequality Index | 28,576 | 0.44 |
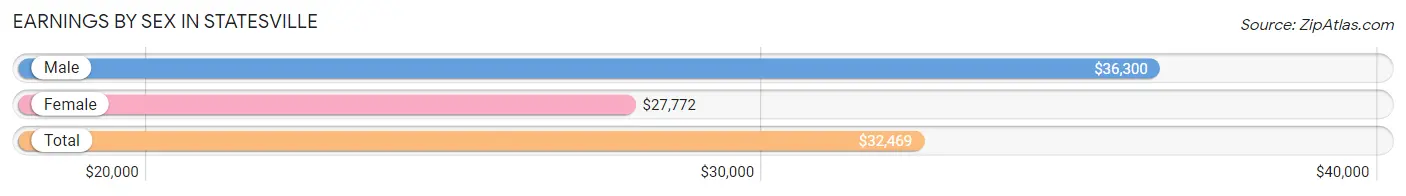
Earnings by Sex in Statesville
Average Earnings in Statesville are $32,469, $36,300 for men and $27,772 for women, a difference of 23.5%.
| Sex | Number | Average Earnings |
| Male | 7,756 (51.3%) | $36,300 |
| Female | 7,366 (48.7%) | $27,772 |
| Total | 15,122 (100.0%) | $32,469 |
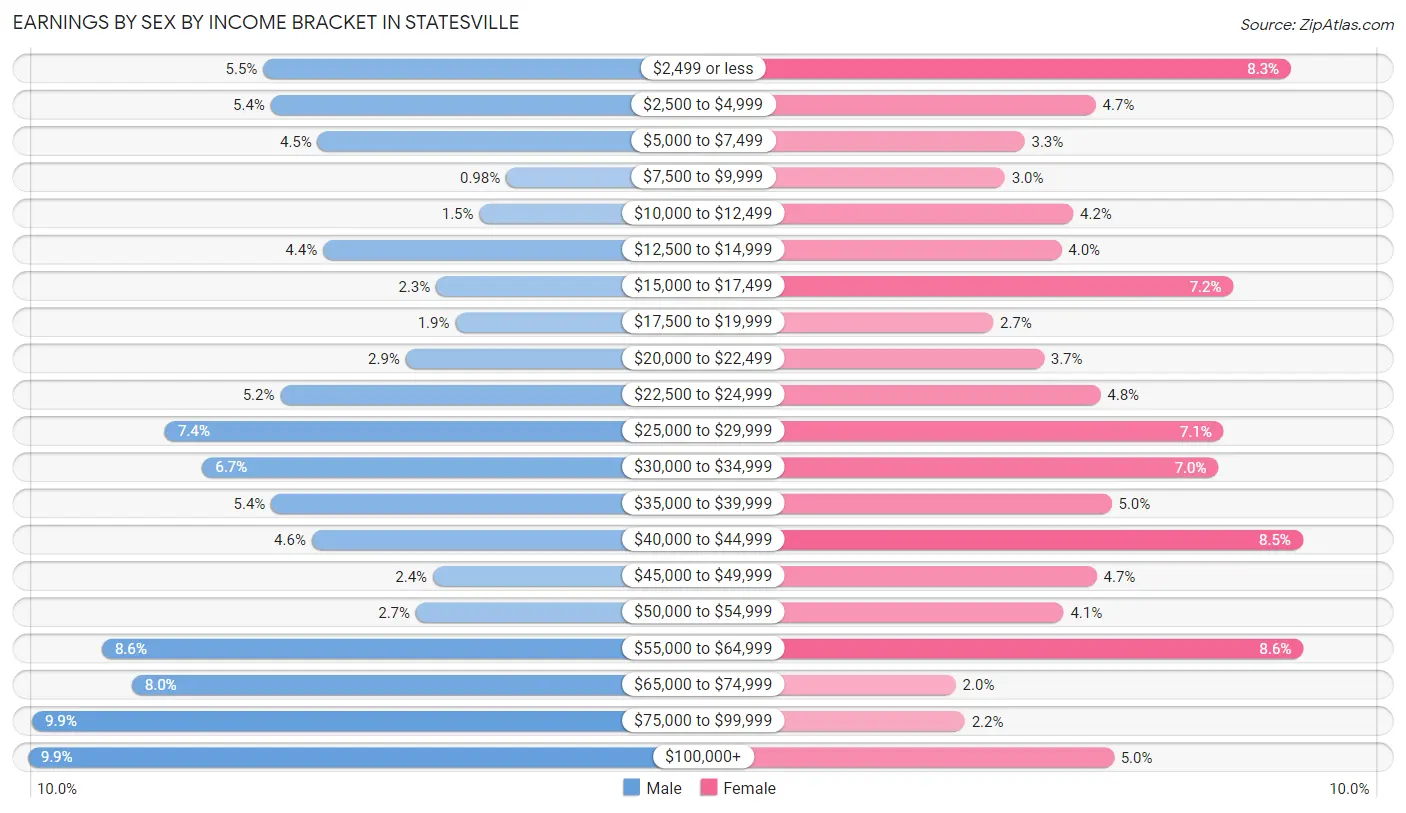
Earnings by Sex by Income Bracket in Statesville
The most common earnings brackets in Statesville are $100,000+ for men (771 | 9.9%) and $55,000 to $64,999 for women (630 | 8.6%).
| Income | Male | Female |
| $2,499 or less | 429 (5.5%) | 613 (8.3%) |
| $2,500 to $4,999 | 418 (5.4%) | 343 (4.7%) |
| $5,000 to $7,499 | 350 (4.5%) | 245 (3.3%) |
| $7,500 to $9,999 | 76 (1.0%) | 218 (3.0%) |
| $10,000 to $12,499 | 115 (1.5%) | 312 (4.2%) |
| $12,500 to $14,999 | 342 (4.4%) | 296 (4.0%) |
| $15,000 to $17,499 | 178 (2.3%) | 533 (7.2%) |
| $17,500 to $19,999 | 150 (1.9%) | 202 (2.7%) |
| $20,000 to $22,499 | 222 (2.9%) | 272 (3.7%) |
| $22,500 to $24,999 | 404 (5.2%) | 350 (4.8%) |
| $25,000 to $29,999 | 572 (7.4%) | 520 (7.1%) |
| $30,000 to $34,999 | 517 (6.7%) | 513 (7.0%) |
| $35,000 to $39,999 | 417 (5.4%) | 365 (5.0%) |
| $40,000 to $44,999 | 358 (4.6%) | 629 (8.5%) |
| $45,000 to $49,999 | 182 (2.4%) | 345 (4.7%) |
| $50,000 to $54,999 | 207 (2.7%) | 299 (4.1%) |
| $55,000 to $64,999 | 663 (8.6%) | 630 (8.6%) |
| $65,000 to $74,999 | 620 (8.0%) | 150 (2.0%) |
| $75,000 to $99,999 | 765 (9.9%) | 163 (2.2%) |
| $100,000+ | 771 (9.9%) | 368 (5.0%) |
| Total | 7,756 (100.0%) | 7,366 (100.0%) |
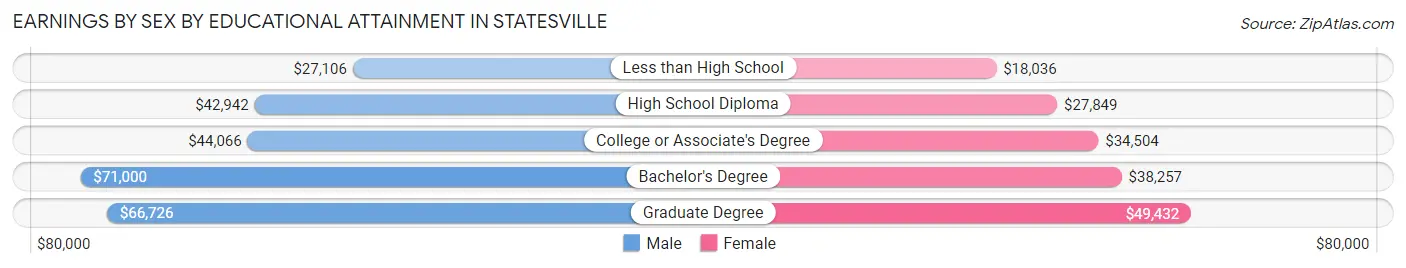
Earnings by Sex by Educational Attainment in Statesville
Average earnings in Statesville are $44,392 for men and $33,485 for women, a difference of 24.6%. Men with an educational attainment of bachelor's degree enjoy the highest average annual earnings of $71,000, while those with less than high school education earn the least with $27,106. Women with an educational attainment of graduate degree earn the most with the average annual earnings of $49,432, while those with less than high school education have the smallest earnings of $18,036.
| Educational Attainment | Male Income | Female Income |
| Less than High School | $27,106 | $18,036 |
| High School Diploma | $42,942 | $27,849 |
| College or Associate's Degree | $44,066 | $34,504 |
| Bachelor's Degree | $71,000 | $38,257 |
| Graduate Degree | $66,726 | $49,432 |
| Total | $44,392 | $33,485 |
Family Income in Statesville
Family Income Brackets in Statesville
According to the Statesville family income data, there are 1,409 families falling into the $100,000 to $149,999 income range, which is the most common income bracket and makes up 19.5% of all families. Conversely, the $10,000 to $14,999 income bracket is the least frequent group with only 101 families (1.4%) belonging to this category.
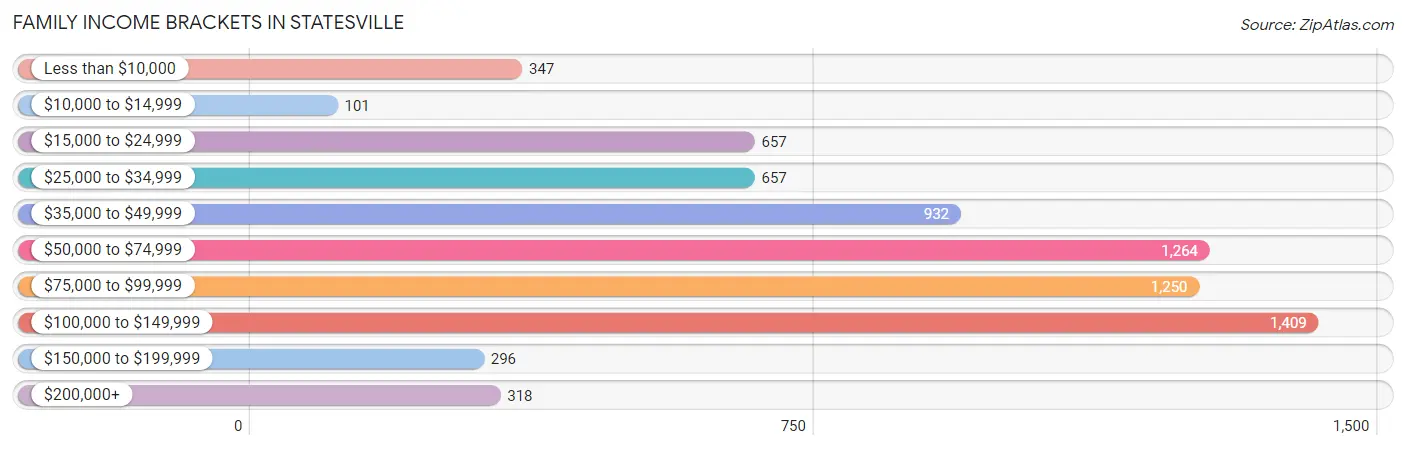
| Income Bracket | # Families | % Families |
| Less than $10,000 | 347 | 4.8% |
| $10,000 to $14,999 | 101 | 1.4% |
| $15,000 to $24,999 | 657 | 9.1% |
| $25,000 to $34,999 | 657 | 9.1% |
| $35,000 to $49,999 | 932 | 12.9% |
| $50,000 to $74,999 | 1,264 | 17.5% |
| $75,000 to $99,999 | 1,250 | 17.3% |
| $100,000 to $149,999 | 1,409 | 19.5% |
| $150,000 to $199,999 | 296 | 4.1% |
| $200,000+ | 318 | 4.4% |
Family Income by Famaliy Size in Statesville
4-person families (1,293 | 17.9%) account for the highest median family income in Statesville with $86,458 per family, while 2-person families (3,625 | 50.2%) have the highest median income of $32,833 per family member.
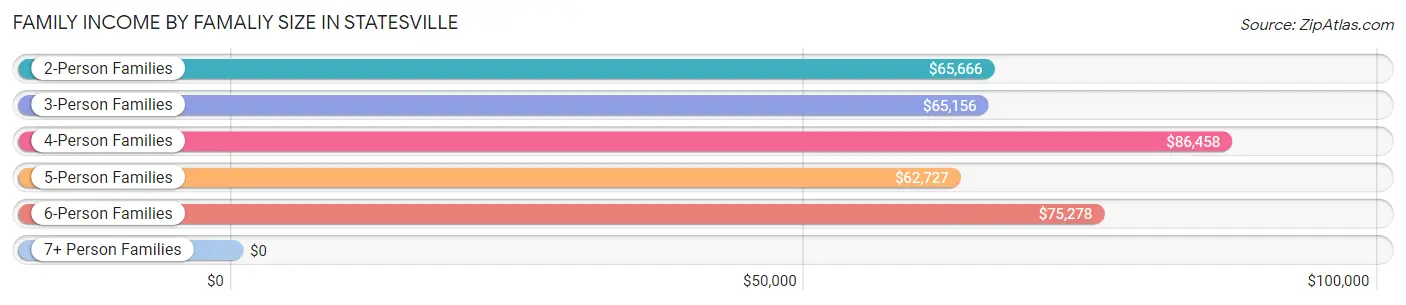
| Income Bracket | # Families | Median Income |
| 2-Person Families | 3,625 (50.2%) | $65,666 |
| 3-Person Families | 1,468 (20.3%) | $65,156 |
| 4-Person Families | 1,293 (17.9%) | $86,458 |
| 5-Person Families | 632 (8.7%) | $62,727 |
| 6-Person Families | 152 (2.1%) | $75,278 |
| 7+ Person Families | 55 (0.8%) | $0 |
| Total | 7,225 (100.0%) | $68,420 |
Family Income by Number of Earners in Statesville
The median family income in Statesville is $68,420, with families comprising 3+ earners (754) having the highest median family income of $106,528, while families with no earners (926) have the lowest median family income of $39,069, accounting for 10.4% and 12.8% of families, respectively.
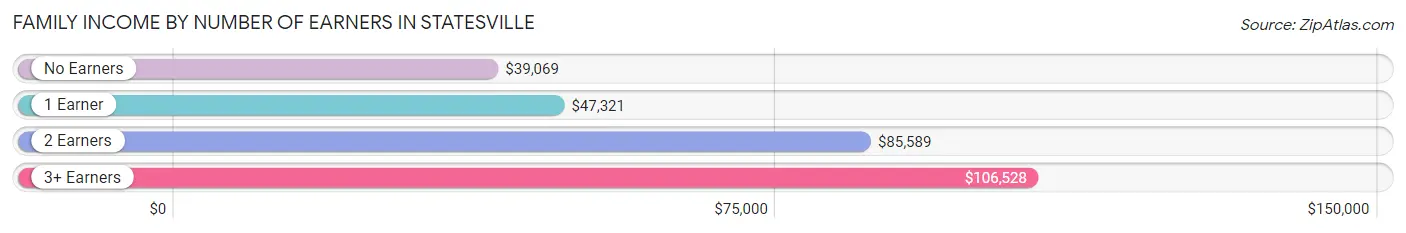
| Number of Earners | # Families | Median Income |
| No Earners | 926 (12.8%) | $39,069 |
| 1 Earner | 2,784 (38.5%) | $47,321 |
| 2 Earners | 2,761 (38.2%) | $85,589 |
| 3+ Earners | 754 (10.4%) | $106,528 |
| Total | 7,225 (100.0%) | $68,420 |
Household Income in Statesville
Household Income Brackets in Statesville
With 2,018 households falling in the category, the $50,000 to $74,999 income range is the most frequent in Statesville, accounting for 17.7% of all households. In contrast, only 331 households (2.9%) fall into the $150,000 to $199,999 income bracket, making it the least populous group.
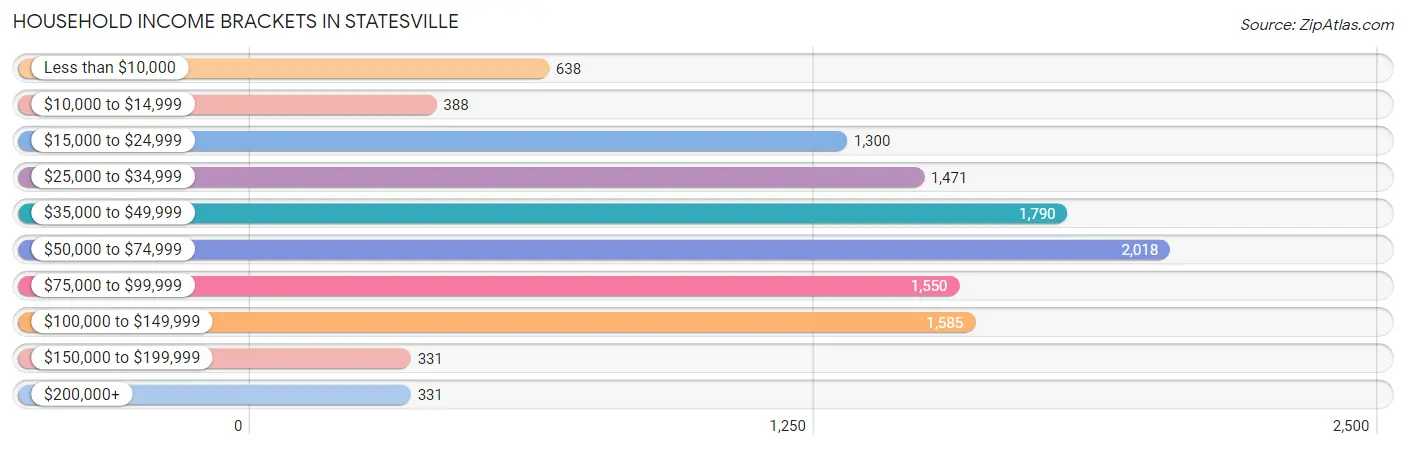
| Income Bracket | # Households | % Households |
| Less than $10,000 | 638 | 5.6% |
| $10,000 to $14,999 | 388 | 3.4% |
| $15,000 to $24,999 | 1,300 | 11.4% |
| $25,000 to $34,999 | 1,471 | 12.9% |
| $35,000 to $49,999 | 1,790 | 15.7% |
| $50,000 to $74,999 | 2,018 | 17.7% |
| $75,000 to $99,999 | 1,550 | 13.6% |
| $100,000 to $149,999 | 1,585 | 13.9% |
| $150,000 to $199,999 | 331 | 2.9% |
| $200,000+ | 331 | 2.9% |
Household Income by Householder Age in Statesville
The median household income in Statesville is $51,784, with the highest median household income of $65,984 found in the 45 to 64 years age bracket for the primary householder. A total of 3,918 households (34.4%) fall into this category. Meanwhile, the 15 to 24 years age bracket for the primary householder has the lowest median household income of $27,077, with 376 households (3.3%) in this group.
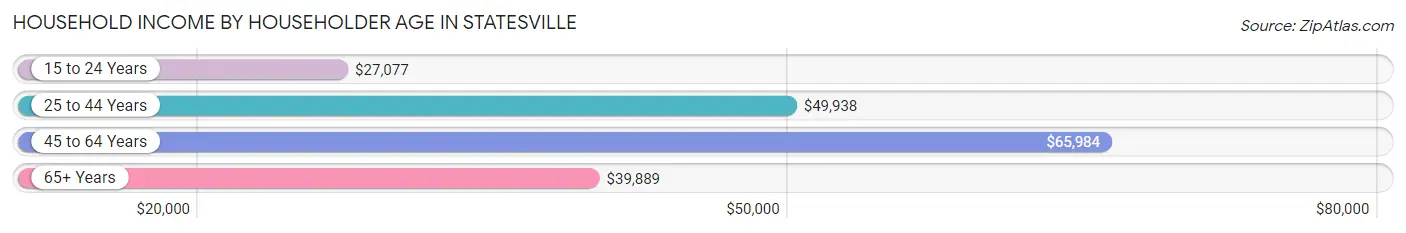
| Income Bracket | # Households | Median Income |
| 15 to 24 Years | 376 (3.3%) | $27,077 |
| 25 to 44 Years | 3,960 (34.7%) | $49,938 |
| 45 to 64 Years | 3,918 (34.4%) | $65,984 |
| 65+ Years | 3,146 (27.6%) | $39,889 |
| Total | 11,400 (100.0%) | $51,784 |
Poverty in Statesville
Income Below Poverty by Sex and Age in Statesville
With 18.1% poverty level for males and 18.9% for females among the residents of Statesville, under 5 year old males and under 5 year old females are the most vulnerable to poverty, with 430 males (44.7%) and 236 females (32.9%) in their respective age groups living below the poverty level.
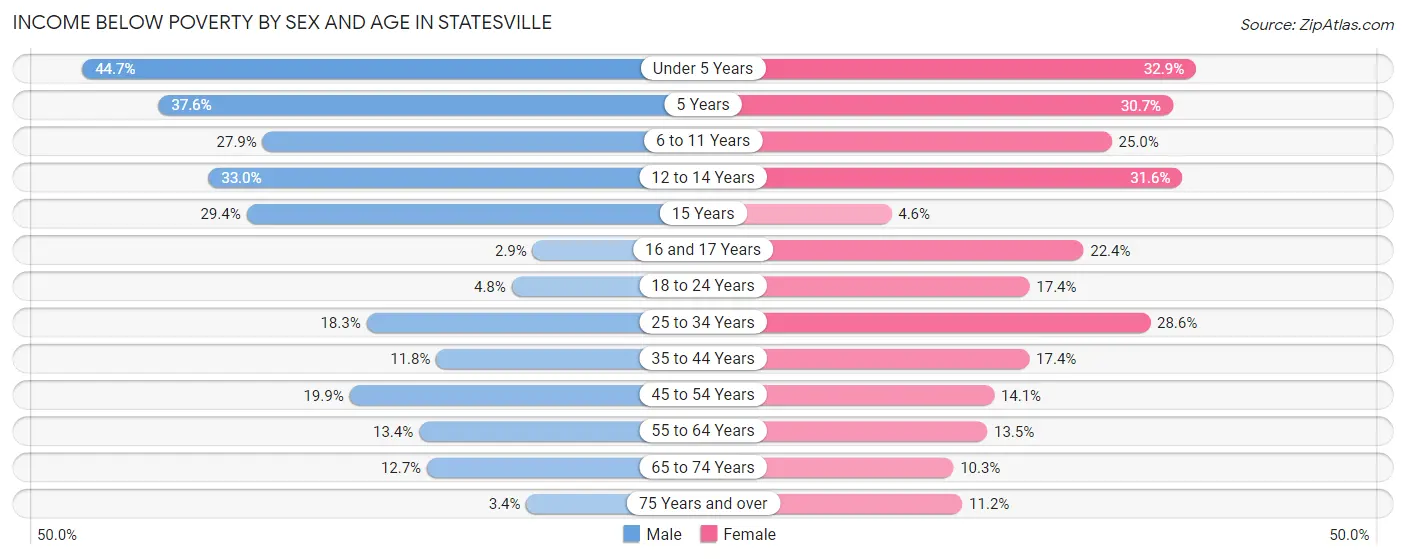
| Age Bracket | Male | Female |
| Under 5 Years | 430 (44.7%) | 236 (32.9%) |
| 5 Years | 62 (37.6%) | 63 (30.7%) |
| 6 to 11 Years | 300 (27.9%) | 302 (25.0%) |
| 12 to 14 Years | 174 (33.0%) | 152 (31.6%) |
| 15 Years | 125 (29.4%) | 5 (4.6%) |
| 16 and 17 Years | 8 (2.9%) | 65 (22.4%) |
| 18 to 24 Years | 60 (4.8%) | 165 (17.4%) |
| 25 to 34 Years | 403 (18.3%) | 582 (28.6%) |
| 35 to 44 Years | 204 (11.8%) | 309 (17.4%) |
| 45 to 54 Years | 282 (19.9%) | 251 (14.1%) |
| 55 to 64 Years | 188 (13.4%) | 236 (13.5%) |
| 65 to 74 Years | 154 (12.7%) | 135 (10.3%) |
| 75 Years and over | 24 (3.4%) | 175 (11.2%) |
| Total | 2,414 (18.1%) | 2,676 (18.9%) |
Income Above Poverty by Sex and Age in Statesville
According to the poverty statistics in Statesville, males aged 16 and 17 years and females aged 15 years are the age groups that are most secure financially, with 97.2% of males and 95.4% of females in these age groups living above the poverty line.
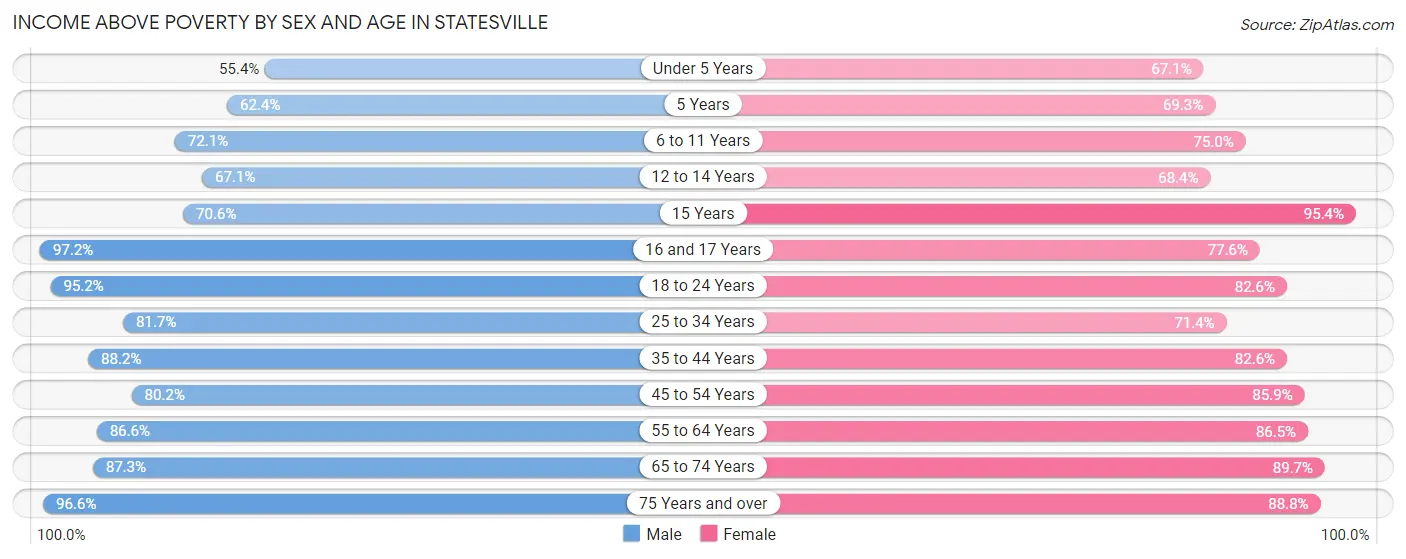
| Age Bracket | Male | Female |
| Under 5 Years | 533 (55.3%) | 482 (67.1%) |
| 5 Years | 103 (62.4%) | 142 (69.3%) |
| 6 to 11 Years | 775 (72.1%) | 904 (75.0%) |
| 12 to 14 Years | 354 (67.0%) | 329 (68.4%) |
| 15 Years | 300 (70.6%) | 104 (95.4%) |
| 16 and 17 Years | 273 (97.2%) | 225 (77.6%) |
| 18 to 24 Years | 1,189 (95.2%) | 783 (82.6%) |
| 25 to 34 Years | 1,803 (81.7%) | 1,452 (71.4%) |
| 35 to 44 Years | 1,527 (88.2%) | 1,468 (82.6%) |
| 45 to 54 Years | 1,139 (80.1%) | 1,527 (85.9%) |
| 55 to 64 Years | 1,216 (86.6%) | 1,515 (86.5%) |
| 65 to 74 Years | 1,062 (87.3%) | 1,170 (89.7%) |
| 75 Years and over | 675 (96.6%) | 1,392 (88.8%) |
| Total | 10,949 (81.9%) | 11,493 (81.1%) |
Income Below Poverty Among Married-Couple Families in Statesville
The poverty statistics for married-couple families in Statesville show that 9.1% or 401 of the total 4,383 families live below the poverty line. Families with 3 or 4 children have the highest poverty rate of 30.9%, comprising of 149 families. On the other hand, families with 5 or more children have the lowest poverty rate of 0.0%, which includes 0 families.
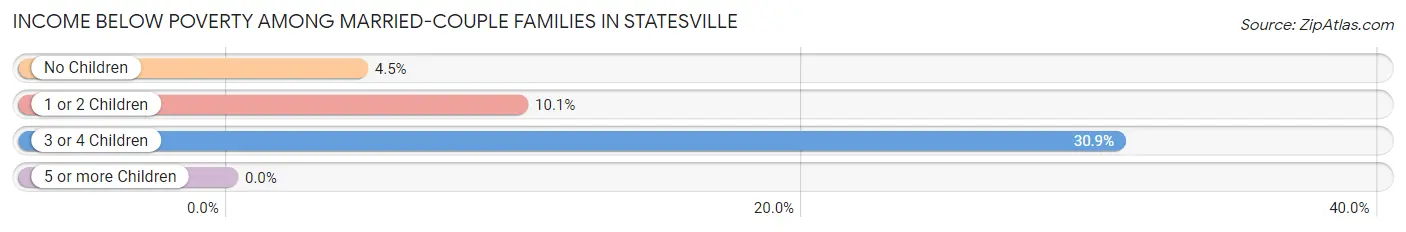
| Children | Above Poverty | Below Poverty |
| No Children | 2,408 (95.5%) | 114 (4.5%) |
| 1 or 2 Children | 1,229 (89.9%) | 138 (10.1%) |
| 3 or 4 Children | 333 (69.1%) | 149 (30.9%) |
| 5 or more Children | 12 (100.0%) | 0 (0.0%) |
| Total | 3,982 (90.8%) | 401 (9.1%) |
Income Below Poverty Among Single-Parent Households in Statesville
According to the poverty data in Statesville, 29.8% or 176 single-father households and 25.1% or 566 single-mother households are living below the poverty line. Among single-father households, those with 3 or 4 children have the highest poverty rate, with 15 households (75.0%) experiencing poverty. Likewise, among single-mother households, those with 5 or more children have the highest poverty rate, with 2 households (100.0%) falling below the poverty line.
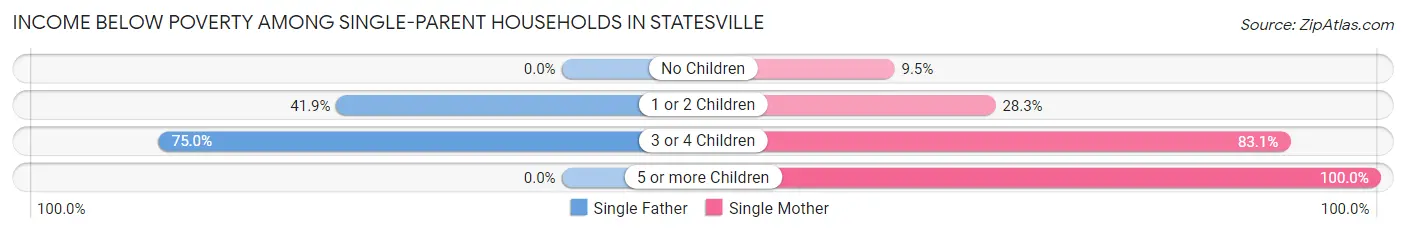
| Children | Single Father | Single Mother |
| No Children | 0 (0.0%) | 84 (9.5%) |
| 1 or 2 Children | 161 (41.9%) | 337 (28.3%) |
| 3 or 4 Children | 15 (75.0%) | 143 (83.1%) |
| 5 or more Children | 0 (0.0%) | 2 (100.0%) |
| Total | 176 (29.8%) | 566 (25.1%) |
Income Below Poverty Among Married-Couple vs Single-Parent Households in Statesville
The poverty data for Statesville shows that 401 of the married-couple family households (9.1%) and 742 of the single-parent households (26.1%) are living below the poverty level. Within the married-couple family households, those with 3 or 4 children have the highest poverty rate, with 149 households (30.9%) falling below the poverty line. Among the single-parent households, those with 5 or more children have the highest poverty rate, with 2 household (100.0%) living below poverty.
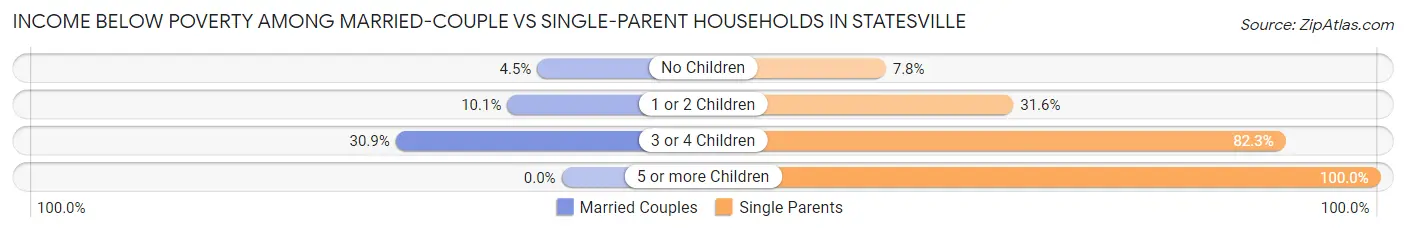
| Children | Married-Couple Families | Single-Parent Households |
| No Children | 114 (4.5%) | 84 (7.8%) |
| 1 or 2 Children | 138 (10.1%) | 498 (31.6%) |
| 3 or 4 Children | 149 (30.9%) | 158 (82.3%) |
| 5 or more Children | 0 (0.0%) | 2 (100.0%) |
| Total | 401 (9.1%) | 742 (26.1%) |
Race in Statesville
The most populous races in Statesville are White / Caucasian (15,431 | 54.0%), Black / African American (8,531 | 29.8%), and Hispanic or Latino (4,309 | 15.1%).
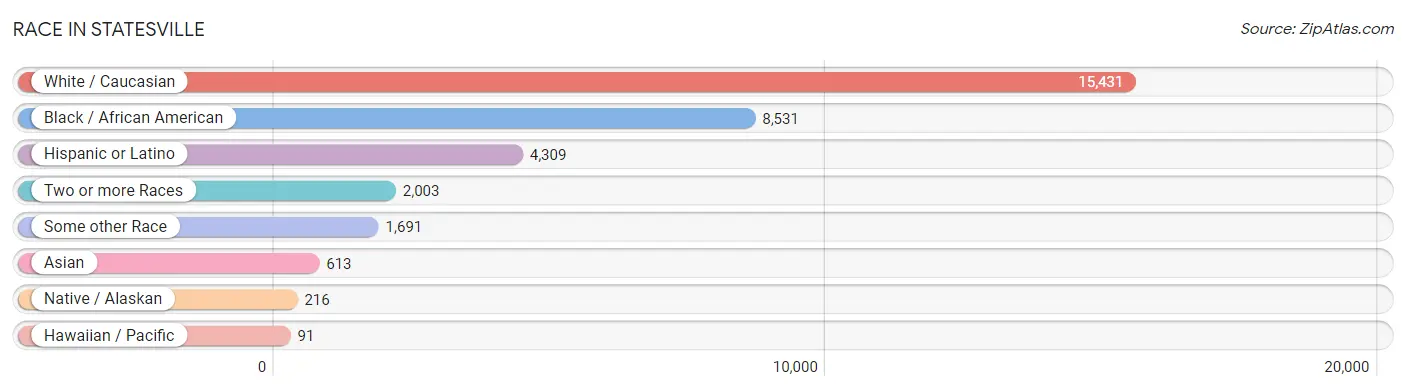
| Race | # Population | % Population |
| Asian | 613 | 2.1% |
| Black / African American | 8,531 | 29.8% |
| Hawaiian / Pacific | 91 | 0.3% |
| Hispanic or Latino | 4,309 | 15.1% |
| Native / Alaskan | 216 | 0.8% |
| White / Caucasian | 15,431 | 54.0% |
| Two or more Races | 2,003 | 7.0% |
| Some other Race | 1,691 | 5.9% |
| Total | 28,576 | 100.0% |
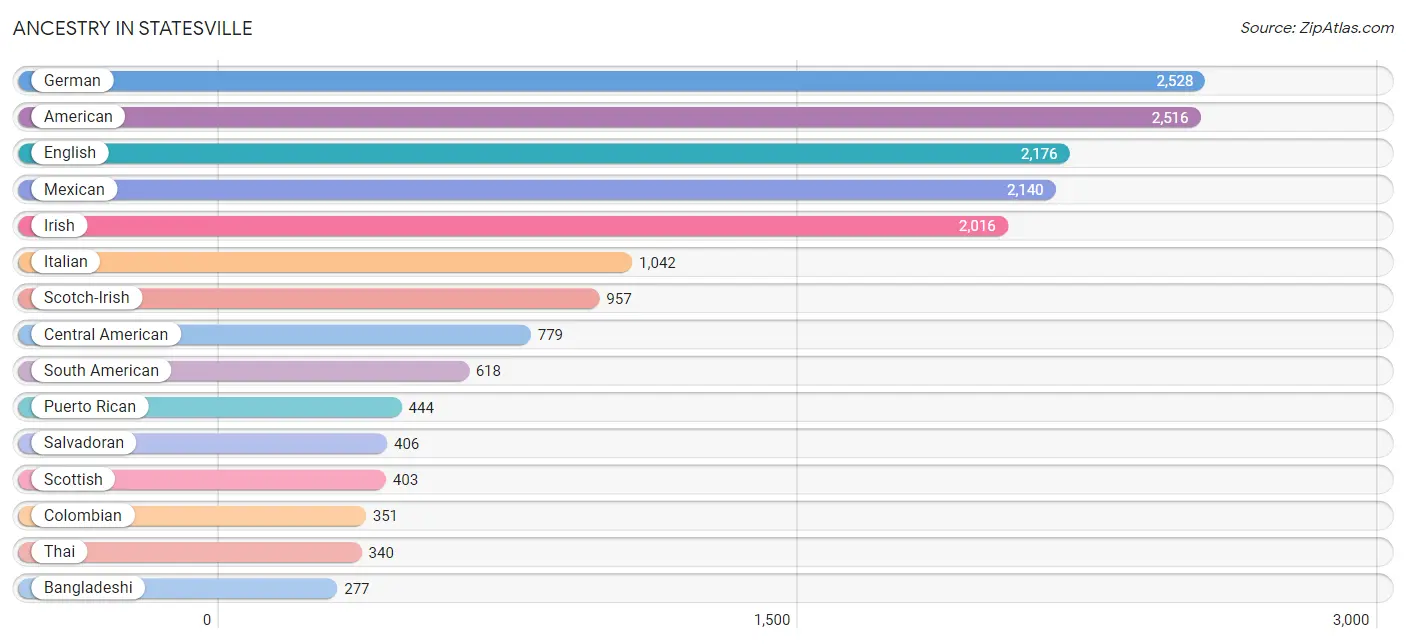
Ancestry in Statesville
The most populous ancestries reported in Statesville are German (2,528 | 8.8%), American (2,516 | 8.8%), English (2,176 | 7.6%), Mexican (2,140 | 7.5%), and Irish (2,016 | 7.0%), together accounting for 39.8% of all Statesville residents.
| Ancestry | # Population | % Population |
| African | 112 | 0.4% |
| American | 2,516 | 8.8% |
| Arab | 176 | 0.6% |
| Argentinean | 27 | 0.1% |
| Austrian | 8 | 0.0% |
| Bangladeshi | 277 | 1.0% |
| Barbadian | 63 | 0.2% |
| Bhutanese | 12 | 0.0% |
| British | 110 | 0.4% |
| Burmese | 2 | 0.0% |
| Celtic | 17 | 0.1% |
| Central American | 779 | 2.7% |
| Central American Indian | 28 | 0.1% |
| Cherokee | 185 | 0.6% |
| Chickasaw | 48 | 0.2% |
| Choctaw | 48 | 0.2% |
| Colombian | 351 | 1.2% |
| Croatian | 28 | 0.1% |
| Cuban | 47 | 0.2% |
| Czechoslovakian | 125 | 0.4% |
| Danish | 23 | 0.1% |
| Dominican | 183 | 0.6% |
| Dutch | 110 | 0.4% |
| Eastern European | 62 | 0.2% |
| English | 2,176 | 7.6% |
| European | 189 | 0.7% |
| French | 247 | 0.9% |
| French Canadian | 8 | 0.0% |
| German | 2,528 | 8.8% |
| Ghanaian | 18 | 0.1% |
| Guatemalan | 44 | 0.2% |
| Haitian | 190 | 0.7% |
| Honduran | 138 | 0.5% |
| Hungarian | 100 | 0.4% |
| Iranian | 4 | 0.0% |
| Irish | 2,016 | 7.0% |
| Iroquois | 35 | 0.1% |
| Italian | 1,042 | 3.6% |
| Jamaican | 68 | 0.2% |
| Korean | 25 | 0.1% |
| Lebanese | 5 | 0.0% |
| Liberian | 31 | 0.1% |
| Mexican | 2,140 | 7.5% |
| Mexican American Indian | 95 | 0.3% |
| Moroccan | 8 | 0.0% |
| Nicaraguan | 191 | 0.7% |
| Nigerian | 7 | 0.0% |
| Norwegian | 46 | 0.2% |
| Pennsylvania German | 29 | 0.1% |
| Peruvian | 27 | 0.1% |
| Polish | 90 | 0.3% |
| Portuguese | 28 | 0.1% |
| Puerto Rican | 444 | 1.5% |
| Russian | 19 | 0.1% |
| Salvadoran | 406 | 1.4% |
| Samoan | 27 | 0.1% |
| Scandinavian | 26 | 0.1% |
| Scotch-Irish | 957 | 3.4% |
| Scottish | 403 | 1.4% |
| Slovak | 13 | 0.1% |
| South American | 618 | 2.2% |
| Spaniard | 19 | 0.1% |
| Spanish | 25 | 0.1% |
| Subsaharan African | 168 | 0.6% |
| Swedish | 67 | 0.2% |
| Swiss | 10 | 0.0% |
| Syrian | 41 | 0.1% |
| Thai | 340 | 1.2% |
| Trinidadian and Tobagonian | 14 | 0.1% |
| Ukrainian | 10 | 0.0% |
| Venezuelan | 213 | 0.7% |
| Welsh | 69 | 0.2% | View All 72 Rows |
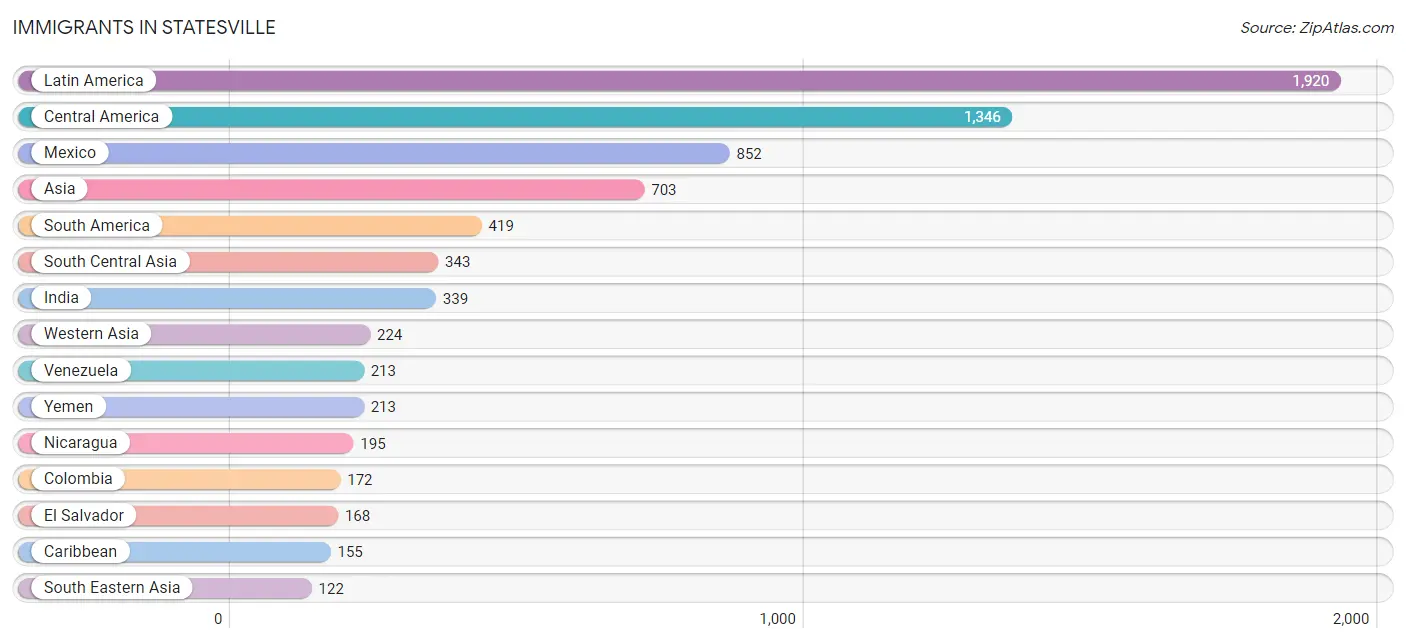
Immigrants in Statesville
The most numerous immigrant groups reported in Statesville came from Latin America (1,920 | 6.7%), Central America (1,346 | 4.7%), Mexico (852 | 3.0%), Asia (703 | 2.5%), and South America (419 | 1.5%), together accounting for 18.3% of all Statesville residents.
| Immigration Origin | # Population | % Population |
| Africa | 58 | 0.2% |
| Argentina | 7 | 0.0% |
| Asia | 703 | 2.5% |
| Caribbean | 155 | 0.5% |
| Central America | 1,346 | 4.7% |
| China | 2 | 0.0% |
| Colombia | 172 | 0.6% |
| Cuba | 13 | 0.1% |
| Dominican Republic | 17 | 0.1% |
| Eastern Asia | 14 | 0.1% |
| Eastern Europe | 10 | 0.0% |
| El Salvador | 168 | 0.6% |
| England | 6 | 0.0% |
| Europe | 103 | 0.4% |
| Germany | 41 | 0.1% |
| Ghana | 18 | 0.1% |
| Guatemala | 95 | 0.3% |
| Haiti | 83 | 0.3% |
| Honduras | 26 | 0.1% |
| Hong Kong | 2 | 0.0% |
| India | 339 | 1.2% |
| Iran | 4 | 0.0% |
| Italy | 13 | 0.1% |
| Japan | 12 | 0.0% |
| Laos | 118 | 0.4% |
| Latin America | 1,920 | 6.7% |
| Liberia | 31 | 0.1% |
| Mexico | 852 | 3.0% |
| Morocco | 8 | 0.0% |
| Nicaragua | 195 | 0.7% |
| Nigeria | 1 | 0.0% |
| Northern Africa | 8 | 0.0% |
| Northern Europe | 29 | 0.1% |
| Panama | 10 | 0.0% |
| Peru | 27 | 0.1% |
| Philippines | 4 | 0.0% |
| Portugal | 10 | 0.0% |
| South America | 419 | 1.5% |
| South Central Asia | 343 | 1.2% |
| South Eastern Asia | 122 | 0.4% |
| Southern Europe | 23 | 0.1% |
| Sweden | 14 | 0.1% |
| Syria | 11 | 0.0% |
| Trinidad and Tobago | 42 | 0.2% |
| Ukraine | 10 | 0.0% |
| Venezuela | 213 | 0.7% |
| Western Africa | 50 | 0.2% |
| Western Asia | 224 | 0.8% |
| Western Europe | 41 | 0.1% |
| Yemen | 213 | 0.7% | View All 50 Rows |
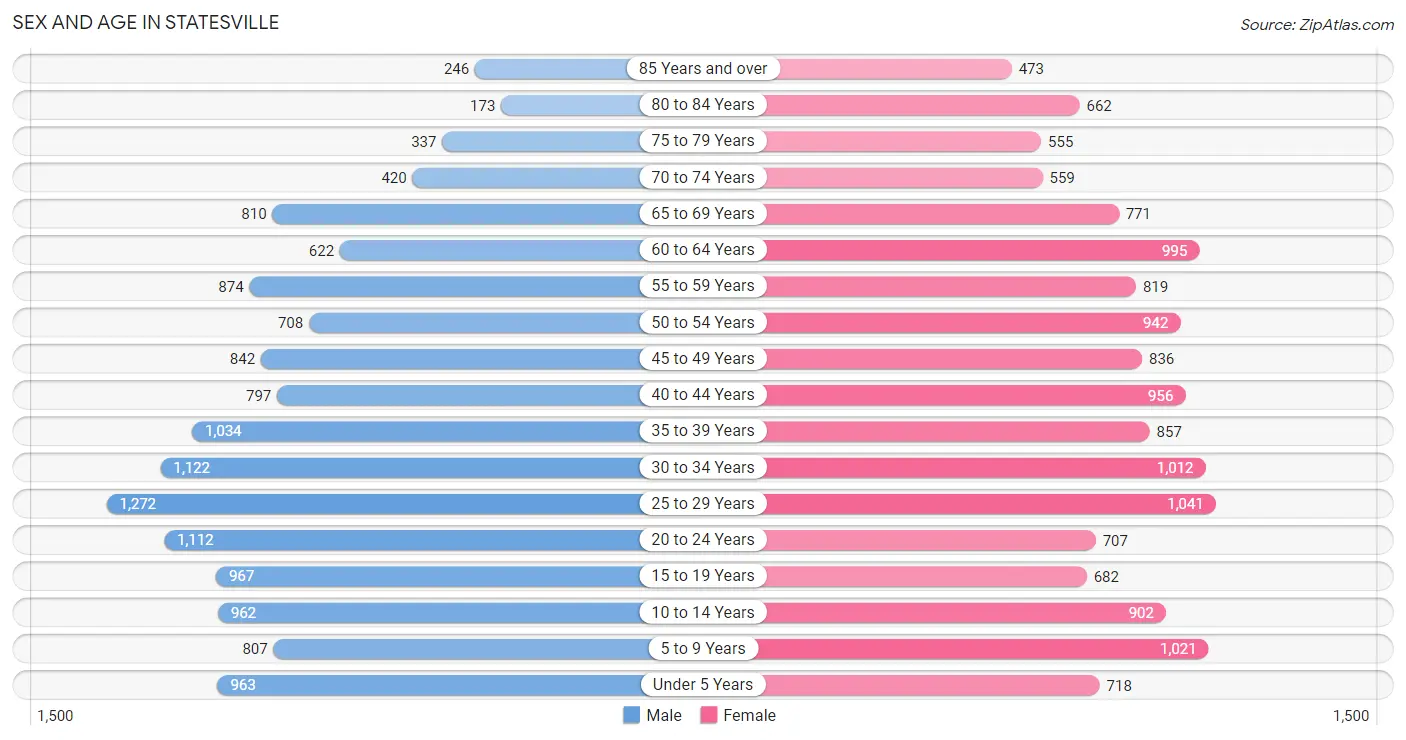
Sex and Age in Statesville
Sex and Age in Statesville
The most populous age groups in Statesville are 25 to 29 Years (1,272 | 9.0%) for men and 25 to 29 Years (1,041 | 7.2%) for women.
| Age Bracket | Male | Female |
| Under 5 Years | 963 (6.9%) | 718 (5.0%) |
| 5 to 9 Years | 807 (5.7%) | 1,021 (7.0%) |
| 10 to 14 Years | 962 (6.8%) | 902 (6.2%) |
| 15 to 19 Years | 967 (6.9%) | 682 (4.7%) |
| 20 to 24 Years | 1,112 (7.9%) | 707 (4.9%) |
| 25 to 29 Years | 1,272 (9.0%) | 1,041 (7.2%) |
| 30 to 34 Years | 1,122 (8.0%) | 1,012 (7.0%) |
| 35 to 39 Years | 1,034 (7.3%) | 857 (5.9%) |
| 40 to 44 Years | 797 (5.7%) | 956 (6.6%) |
| 45 to 49 Years | 842 (6.0%) | 836 (5.8%) |
| 50 to 54 Years | 708 (5.0%) | 942 (6.5%) |
| 55 to 59 Years | 874 (6.2%) | 819 (5.7%) |
| 60 to 64 Years | 622 (4.4%) | 995 (6.9%) |
| 65 to 69 Years | 810 (5.8%) | 771 (5.3%) |
| 70 to 74 Years | 420 (3.0%) | 559 (3.8%) |
| 75 to 79 Years | 337 (2.4%) | 555 (3.8%) |
| 80 to 84 Years | 173 (1.2%) | 662 (4.6%) |
| 85 Years and over | 246 (1.8%) | 473 (3.3%) |
| Total | 14,068 (100.0%) | 14,508 (100.0%) |
Families and Households in Statesville
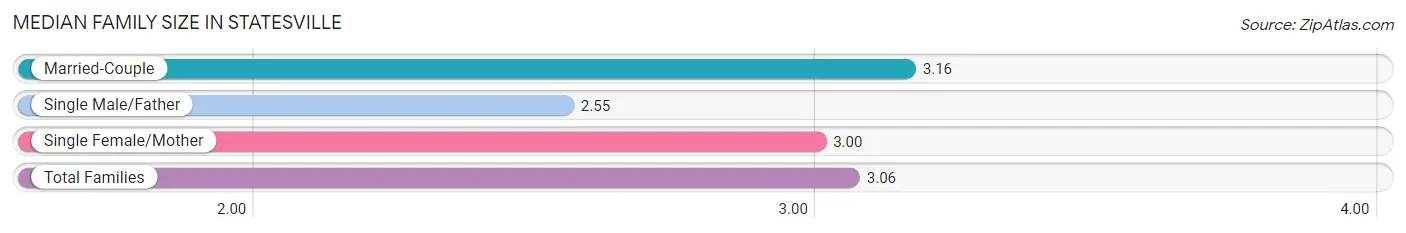
Median Family Size in Statesville
The median family size in Statesville is 3.06 persons per family, with married-couple families (4,383 | 60.7%) accounting for the largest median family size of 3.16 persons per family. On the other hand, single male/father families (590 | 8.2%) represent the smallest median family size with 2.55 persons per family.
| Family Type | # Families | Family Size |
| Married-Couple | 4,383 (60.7%) | 3.16 |
| Single Male/Father | 590 (8.2%) | 2.55 |
| Single Female/Mother | 2,252 (31.2%) | 3.00 |
| Total Families | 7,225 (100.0%) | 3.06 |
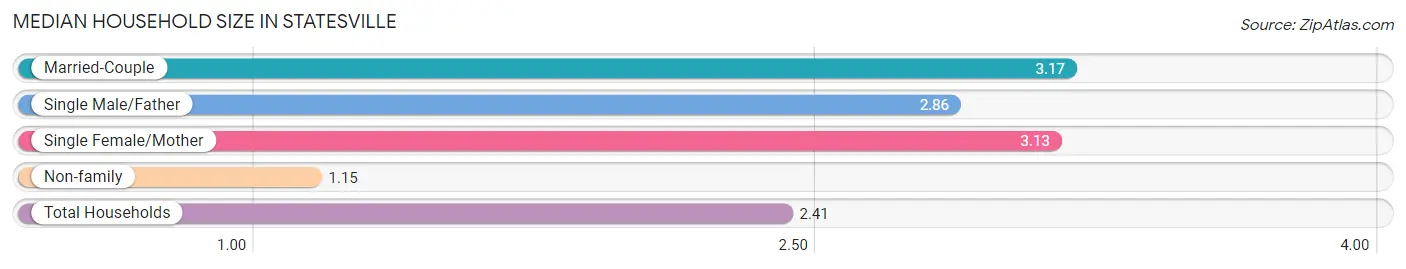
Median Household Size in Statesville
The median household size in Statesville is 2.41 persons per household, with married-couple households (4,383 | 38.5%) accounting for the largest median household size of 3.17 persons per household. non-family households (4,175 | 36.6%) represent the smallest median household size with 1.15 persons per household.
| Household Type | # Households | Household Size |
| Married-Couple | 4,383 (38.5%) | 3.17 |
| Single Male/Father | 590 (5.2%) | 2.86 |
| Single Female/Mother | 2,252 (19.8%) | 3.13 |
| Non-family | 4,175 (36.6%) | 1.15 |
| Total Households | 11,400 (100.0%) | 2.41 |
Household Size by Marriage Status in Statesville
Out of a total of 11,400 households in Statesville, 7,225 (63.4%) are family households, while 4,175 (36.6%) are nonfamily households. The most numerous type of family households are 2-person households, comprising 3,455, and the most common type of nonfamily households are 1-person households, comprising 3,678.
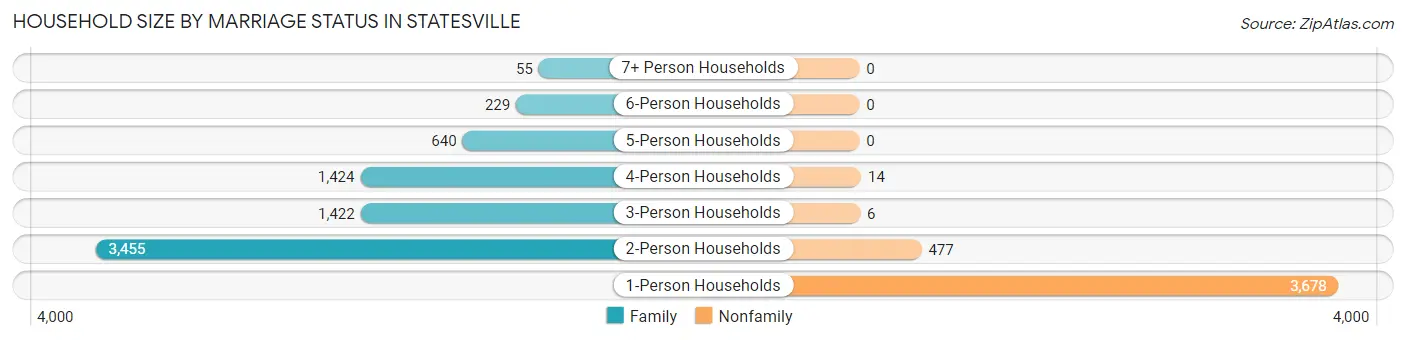
| Household Size | Family Households | Nonfamily Households |
| 1-Person Households | - | 3,678 (32.3%) |
| 2-Person Households | 3,455 (30.3%) | 477 (4.2%) |
| 3-Person Households | 1,422 (12.5%) | 6 (0.1%) |
| 4-Person Households | 1,424 (12.5%) | 14 (0.1%) |
| 5-Person Households | 640 (5.6%) | 0 (0.0%) |
| 6-Person Households | 229 (2.0%) | 0 (0.0%) |
| 7+ Person Households | 55 (0.5%) | 0 (0.0%) |
| Total | 7,225 (63.4%) | 4,175 (36.6%) |
Female Fertility in Statesville
Fertility by Age in Statesville
Average fertility rate in Statesville is 73.0 births per 1,000 women. Women in the age bracket of 20 to 34 years have the highest fertility rate with 153.0 births per 1,000 women. Women in the age bracket of 20 to 34 years acount for 89.2% of all women with births.
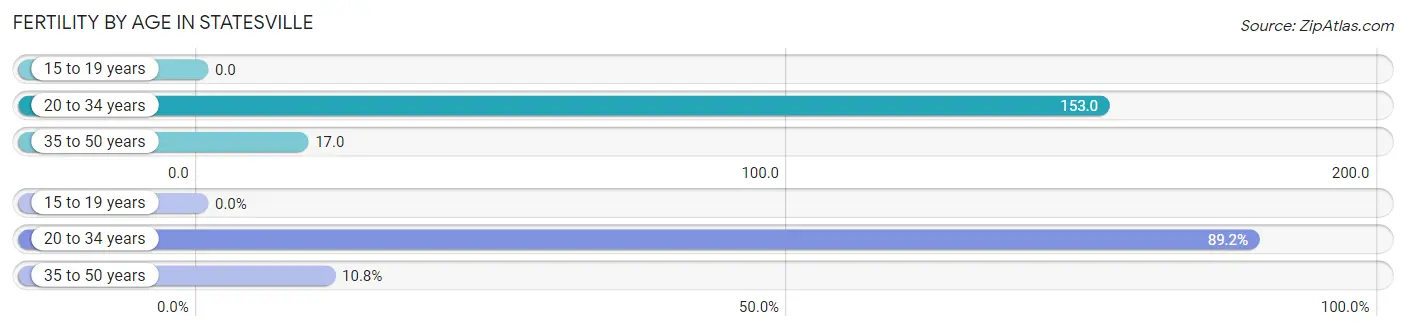
| Age Bracket | Women with Births | Births / 1,000 Women |
| 15 to 19 years | 0 (0.0%) | 0.0 |
| 20 to 34 years | 422 (89.2%) | 153.0 |
| 35 to 50 years | 51 (10.8%) | 17.0 |
| Total | 473 (100.0%) | 73.0 |
Fertility by Age by Marriage Status in Statesville
72.7% of women with births (473) in Statesville are married. The highest percentage of unmarried women with births falls into 20 to 34 years age bracket with 28.0% of them unmarried at the time of birth, while the lowest percentage of unmarried women with births belong to 35 to 50 years age bracket with 21.6% of them unmarried.
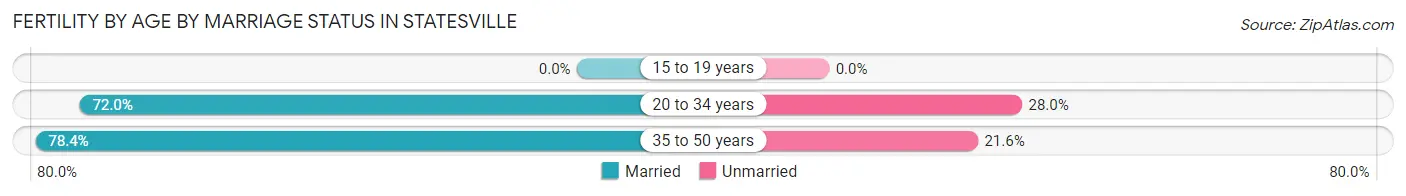
| Age Bracket | Married | Unmarried |
| 15 to 19 years | 0 (0.0%) | 0 (0.0%) |
| 20 to 34 years | 304 (72.0%) | 118 (28.0%) |
| 35 to 50 years | 40 (78.4%) | 11 (21.6%) |
| Total | 344 (72.7%) | 129 (27.3%) |
Fertility by Education in Statesville
Average fertility rate in Statesville is 73.0 births per 1,000 women. Women with the education attainment of less than high school have the highest fertility rate of 168.0 births per 1,000 women, while women with the education attainment of high school diploma have the lowest fertility at 21.0 births per 1,000 women. Women with the education attainment of less than high school represent 35.7% of all women with births.
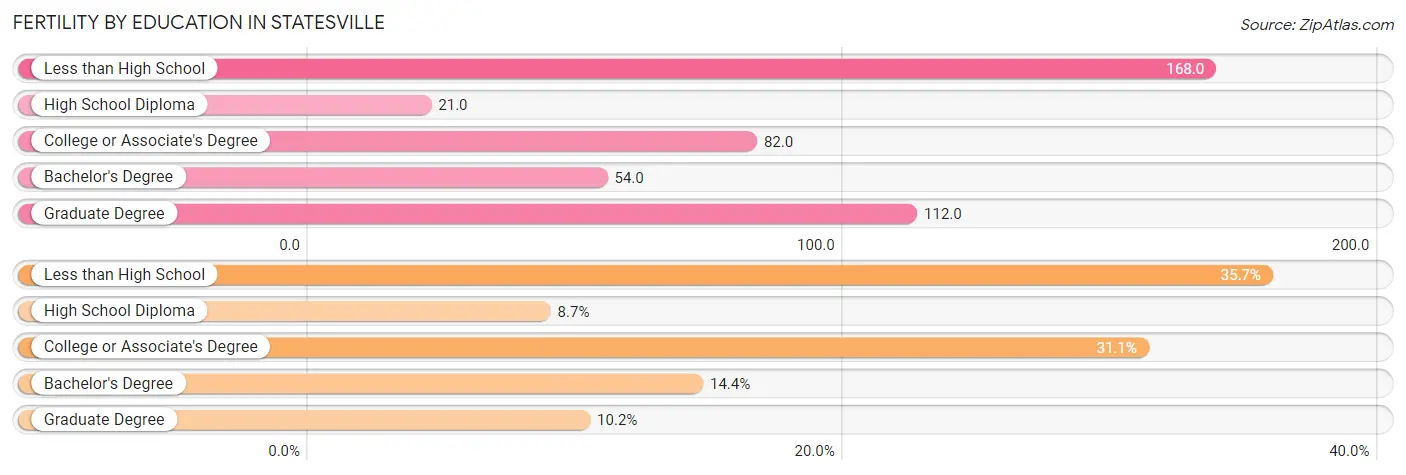
| Educational Attainment | Women with Births | Births / 1,000 Women |
| Less than High School | 169 (35.7%) | 168.0 |
| High School Diploma | 41 (8.7%) | 21.0 |
| College or Associate's Degree | 147 (31.1%) | 82.0 |
| Bachelor's Degree | 68 (14.4%) | 54.0 |
| Graduate Degree | 48 (10.2%) | 112.0 |
| Total | 473 (100.0%) | 73.0 |
Fertility by Education by Marriage Status in Statesville
27.3% of women with births in Statesville are unmarried. Women with the educational attainment of less than high school are most likely to be married with 100.0% of them married at childbirth, while women with the educational attainment of high school diploma are least likely to be married with 100.0% of them unmarried at childbirth.
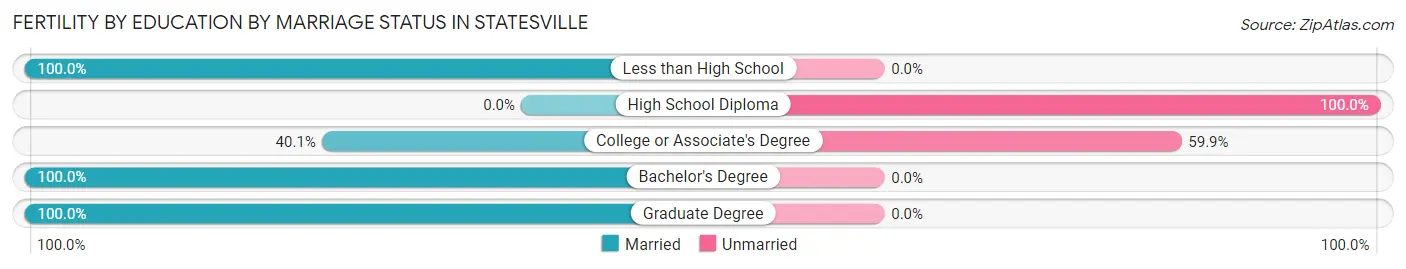
| Educational Attainment | Married | Unmarried |
| Less than High School | 169 (100.0%) | 0 (0.0%) |
| High School Diploma | 0 (0.0%) | 41 (100.0%) |
| College or Associate's Degree | 59 (40.1%) | 88 (59.9%) |
| Bachelor's Degree | 68 (100.0%) | 0 (0.0%) |
| Graduate Degree | 48 (100.0%) | 0 (0.0%) |
| Total | 344 (72.7%) | 129 (27.3%) |
Employment Characteristics in Statesville
Employment by Class of Employer in Statesville
Among the 13,096 employed individuals in Statesville, private company employees (9,542 | 72.9%), not-for-profit organizations (1,101 | 8.4%), and local government employees (797 | 6.1%) make up the most common classes of employment.
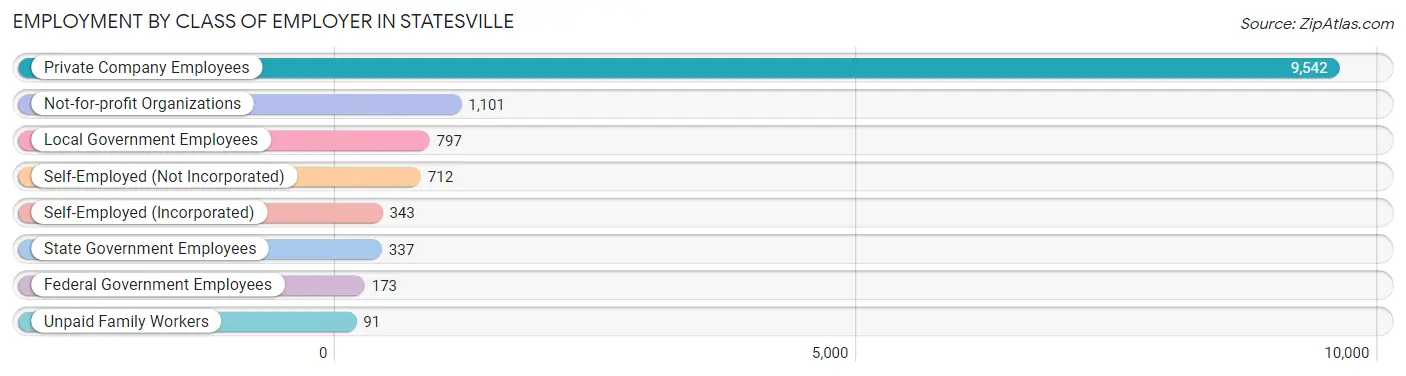
| Employer Class | # Employees | % Employees |
| Private Company Employees | 9,542 | 72.9% |
| Self-Employed (Incorporated) | 343 | 2.6% |
| Self-Employed (Not Incorporated) | 712 | 5.4% |
| Not-for-profit Organizations | 1,101 | 8.4% |
| Local Government Employees | 797 | 6.1% |
| State Government Employees | 337 | 2.6% |
| Federal Government Employees | 173 | 1.3% |
| Unpaid Family Workers | 91 | 0.7% |
| Total | 13,096 | 100.0% |
Employment Status by Age in Statesville
According to the labor force statistics for Statesville, out of the total population over 16 years of age (22,668), 64.3% or 14,576 individuals are in the labor force, with 7.2% or 1,049 of them unemployed. The age group with the highest labor force participation rate is 35 to 44 years, with 85.5% or 3,116 individuals in the labor force. Within the labor force, the 16 to 19 years age range has the highest percentage of unemployed individuals, with 24.7% or 153 of them being unemployed.
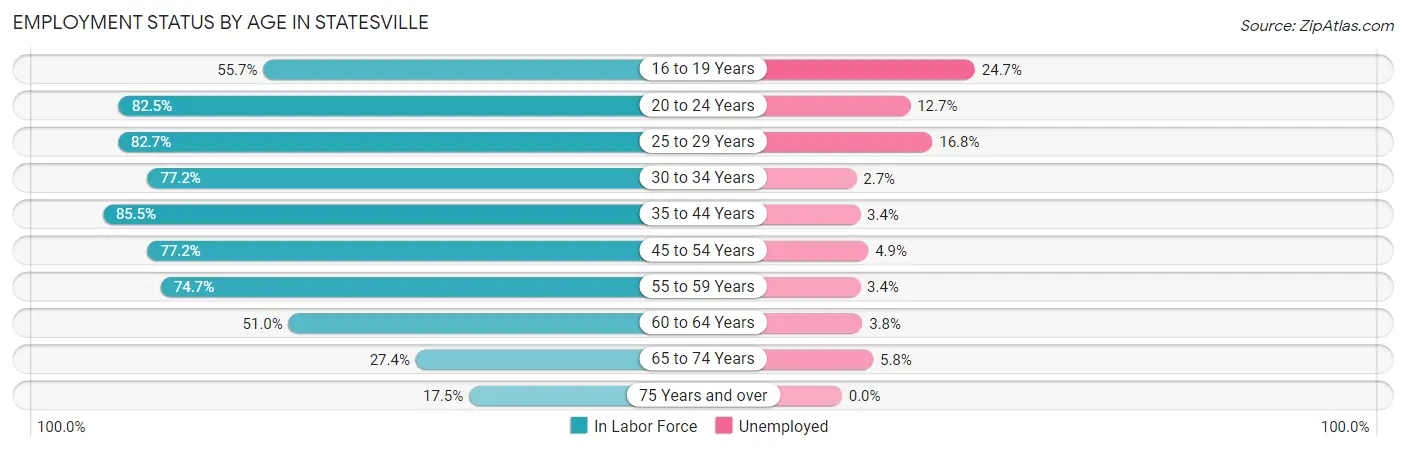
| Age Bracket | In Labor Force | Unemployed |
| 16 to 19 Years | 620 (55.7%) | 153 (24.7%) |
| 20 to 24 Years | 1,501 (82.5%) | 191 (12.7%) |
| 25 to 29 Years | 1,913 (82.7%) | 321 (16.8%) |
| 30 to 34 Years | 1,647 (77.2%) | 44 (2.7%) |
| 35 to 44 Years | 3,116 (85.5%) | 106 (3.4%) |
| 45 to 54 Years | 2,569 (77.2%) | 126 (4.9%) |
| 55 to 59 Years | 1,265 (74.7%) | 43 (3.4%) |
| 60 to 64 Years | 825 (51.0%) | 31 (3.8%) |
| 65 to 74 Years | 701 (27.4%) | 41 (5.8%) |
| 75 Years and over | 428 (17.5%) | 0 (0.0%) |
| Total | 14,576 (64.3%) | 1,049 (7.2%) |
Employment Status by Educational Attainment in Statesville
According to labor force statistics for Statesville, 77.0% of individuals (11,341) out of the total population between 25 and 64 years of age (14,729) are in the labor force, with 5.9% or 669 of them being unemployed. The group with the highest labor force participation rate are those with the educational attainment of bachelor's degree or higher, with 85.6% or 3,312 individuals in the labor force. Within the labor force, individuals with bachelor's degree or higher education have the highest percentage of unemployment, with 6.4% or 212 of them being unemployed.
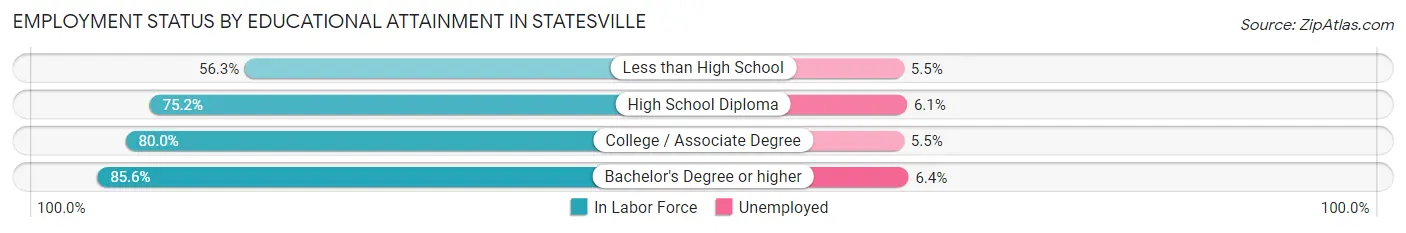
| Educational Attainment | In Labor Force | Unemployed |
| Less than High School | 1,118 (56.3%) | 109 (5.5%) |
| High School Diploma | 3,055 (75.2%) | 248 (6.1%) |
| College / Associate Degree | 3,850 (80.0%) | 265 (5.5%) |
| Bachelor's Degree or higher | 3,312 (85.6%) | 248 (6.4%) |
| Total | 11,341 (77.0%) | 869 (5.9%) |
Employment Occupations by Sex in Statesville
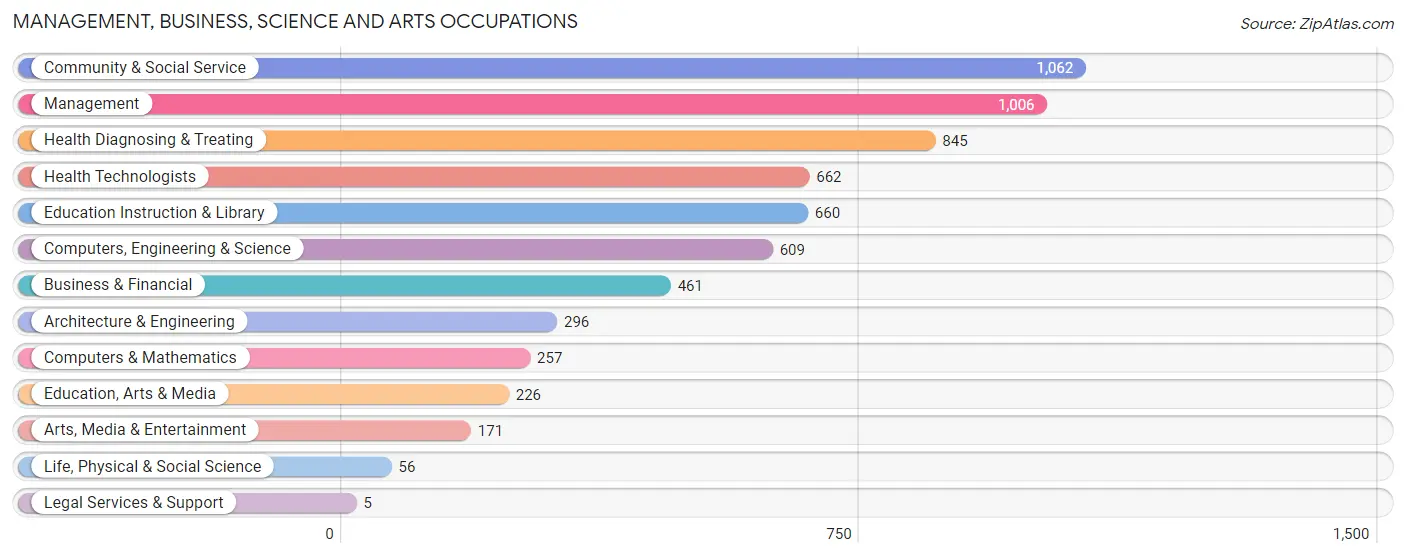
Management, Business, Science and Arts Occupations
The most common Management, Business, Science and Arts occupations in Statesville are Community & Social Service (1,062 | 7.9%), Management (1,006 | 7.4%), Health Diagnosing & Treating (845 | 6.2%), Health Technologists (662 | 4.9%), and Education Instruction & Library (660 | 4.9%).
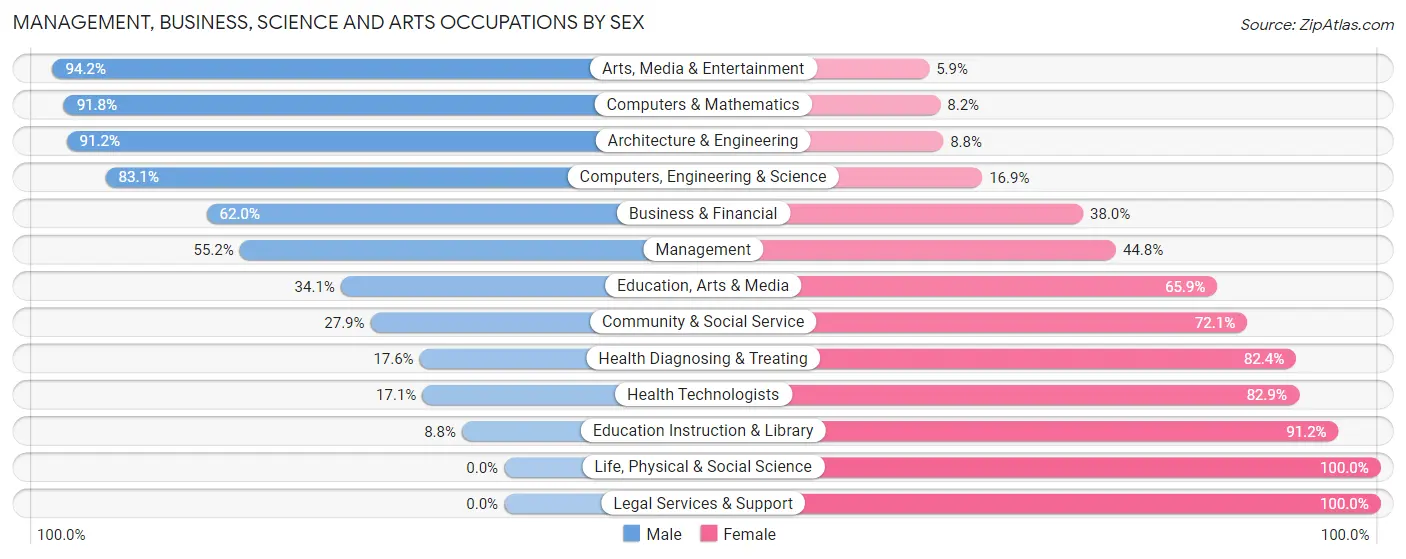
Management, Business, Science and Arts Occupations by Sex
Within the Management, Business, Science and Arts occupations in Statesville, the most male-oriented occupations are Arts, Media & Entertainment (94.2%), Computers & Mathematics (91.8%), and Architecture & Engineering (91.2%), while the most female-oriented occupations are Life, Physical & Social Science (100.0%), Legal Services & Support (100.0%), and Education Instruction & Library (91.2%).
| Occupation | Male | Female |
| Management | 555 (55.2%) | 451 (44.8%) |
| Business & Financial | 286 (62.0%) | 175 (38.0%) |
| Computers, Engineering & Science | 506 (83.1%) | 103 (16.9%) |
| Computers & Mathematics | 236 (91.8%) | 21 (8.2%) |
| Architecture & Engineering | 270 (91.2%) | 26 (8.8%) |
| Life, Physical & Social Science | 0 (0.0%) | 56 (100.0%) |
| Community & Social Service | 296 (27.9%) | 766 (72.1%) |
| Education, Arts & Media | 77 (34.1%) | 149 (65.9%) |
| Legal Services & Support | 0 (0.0%) | 5 (100.0%) |
| Education Instruction & Library | 58 (8.8%) | 602 (91.2%) |
| Arts, Media & Entertainment | 161 (94.2%) | 10 (5.9%) |
| Health Diagnosing & Treating | 149 (17.6%) | 696 (82.4%) |
| Health Technologists | 113 (17.1%) | 549 (82.9%) |
| Total (Category) | 1,792 (45.0%) | 2,191 (55.0%) |
| Total (Overall) | 6,843 (50.6%) | 6,674 (49.4%) |
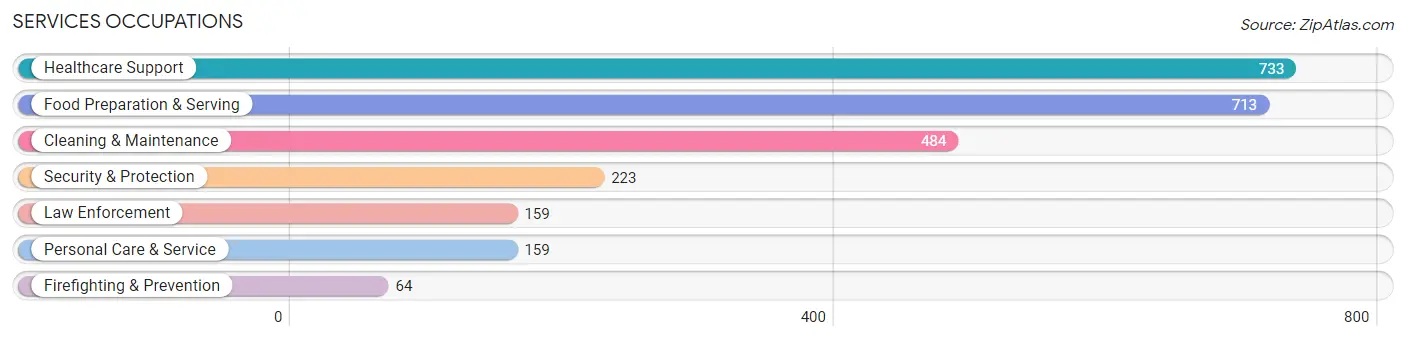
Services Occupations
The most common Services occupations in Statesville are Healthcare Support (733 | 5.4%), Food Preparation & Serving (713 | 5.3%), Cleaning & Maintenance (484 | 3.6%), Security & Protection (223 | 1.7%), and Law Enforcement (159 | 1.2%).
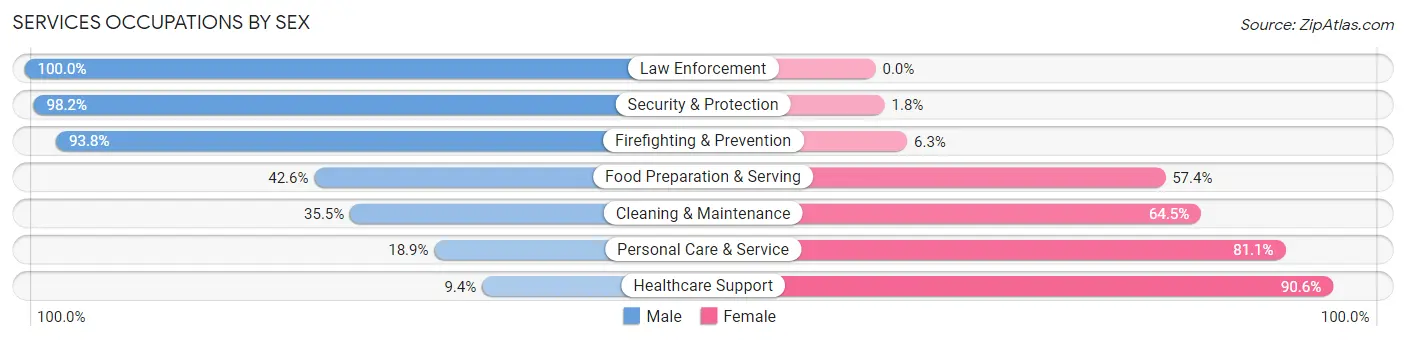
Services Occupations by Sex
Within the Services occupations in Statesville, the most male-oriented occupations are Law Enforcement (100.0%), Security & Protection (98.2%), and Firefighting & Prevention (93.8%), while the most female-oriented occupations are Healthcare Support (90.6%), Personal Care & Service (81.1%), and Cleaning & Maintenance (64.5%).
| Occupation | Male | Female |
| Healthcare Support | 69 (9.4%) | 664 (90.6%) |
| Security & Protection | 219 (98.2%) | 4 (1.8%) |
| Firefighting & Prevention | 60 (93.8%) | 4 (6.2%) |
| Law Enforcement | 159 (100.0%) | 0 (0.0%) |
| Food Preparation & Serving | 304 (42.6%) | 409 (57.4%) |
| Cleaning & Maintenance | 172 (35.5%) | 312 (64.5%) |
| Personal Care & Service | 30 (18.9%) | 129 (81.1%) |
| Total (Category) | 794 (34.3%) | 1,518 (65.7%) |
| Total (Overall) | 6,843 (50.6%) | 6,674 (49.4%) |
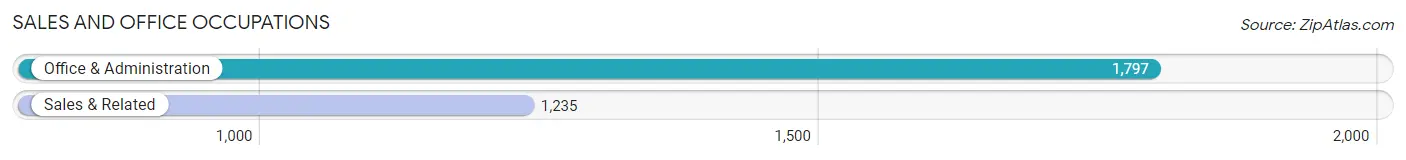
Sales and Office Occupations
The most common Sales and Office occupations in Statesville are Office & Administration (1,797 | 13.3%), and Sales & Related (1,235 | 9.1%).
Sales and Office Occupations by Sex
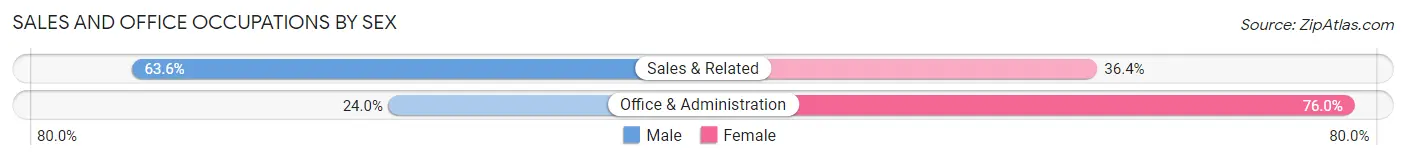
| Occupation | Male | Female |
| Sales & Related | 785 (63.6%) | 450 (36.4%) |
| Office & Administration | 431 (24.0%) | 1,366 (76.0%) |
| Total (Category) | 1,216 (40.1%) | 1,816 (59.9%) |
| Total (Overall) | 6,843 (50.6%) | 6,674 (49.4%) |
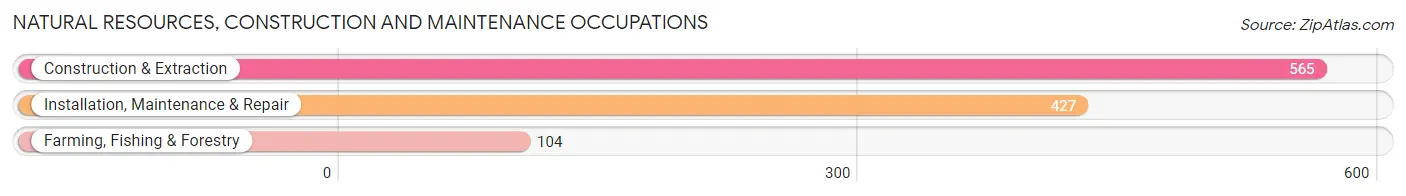
Natural Resources, Construction and Maintenance Occupations
The most common Natural Resources, Construction and Maintenance occupations in Statesville are Construction & Extraction (565 | 4.2%), Installation, Maintenance & Repair (427 | 3.2%), and Farming, Fishing & Forestry (104 | 0.8%).
Natural Resources, Construction and Maintenance Occupations by Sex
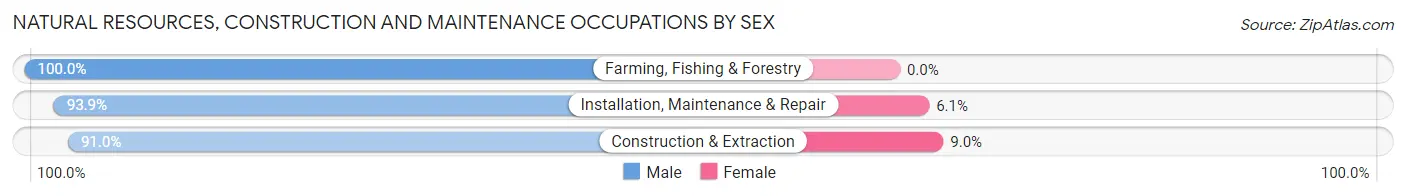
| Occupation | Male | Female |
| Farming, Fishing & Forestry | 104 (100.0%) | 0 (0.0%) |
| Construction & Extraction | 514 (91.0%) | 51 (9.0%) |
| Installation, Maintenance & Repair | 401 (93.9%) | 26 (6.1%) |
| Total (Category) | 1,019 (93.0%) | 77 (7.0%) |
| Total (Overall) | 6,843 (50.6%) | 6,674 (49.4%) |
Production, Transportation and Moving Occupations
The most common Production, Transportation and Moving occupations in Statesville are Production (2,000 | 14.8%), Material Moving (730 | 5.4%), and Transportation (364 | 2.7%).
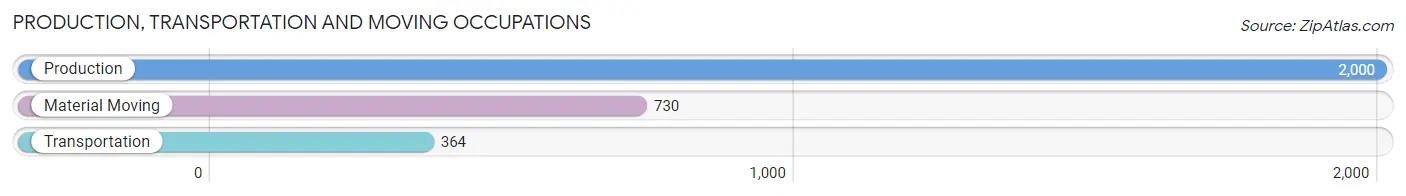
Production, Transportation and Moving Occupations by Sex
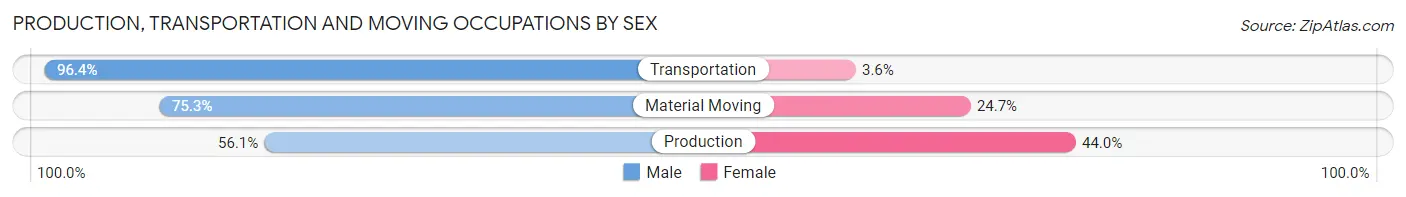
| Occupation | Male | Female |
| Production | 1,121 (56.0%) | 879 (44.0%) |
| Transportation | 351 (96.4%) | 13 (3.6%) |
| Material Moving | 550 (75.3%) | 180 (24.7%) |
| Total (Category) | 2,022 (65.3%) | 1,072 (34.6%) |
| Total (Overall) | 6,843 (50.6%) | 6,674 (49.4%) |
Employment Industries by Sex in Statesville
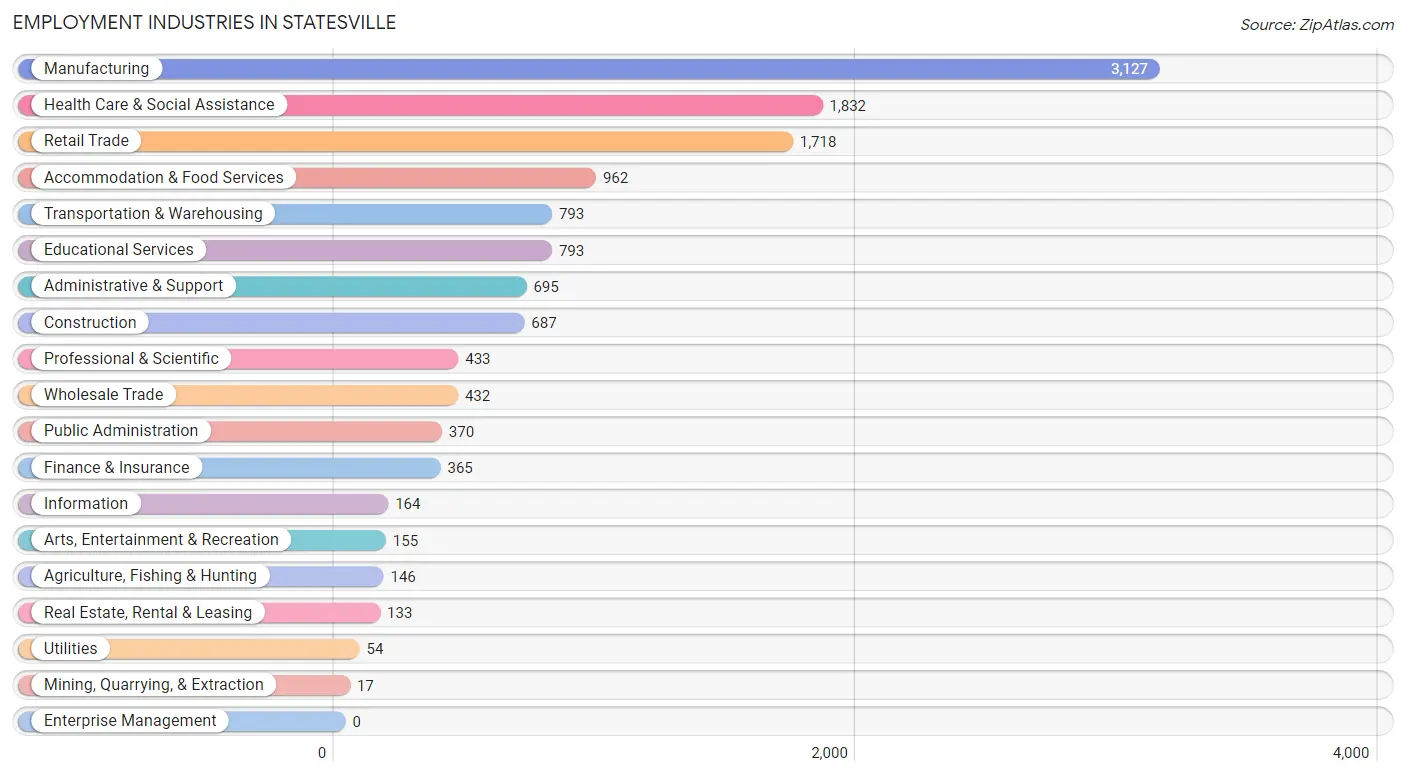
Employment Industries in Statesville
The major employment industries in Statesville include Manufacturing (3,127 | 23.1%), Health Care & Social Assistance (1,832 | 13.6%), Retail Trade (1,718 | 12.7%), Accommodation & Food Services (962 | 7.1%), and Transportation & Warehousing (793 | 5.9%).
Employment Industries by Sex in Statesville
The Statesville industries that see more men than women are Mining, Quarrying, & Extraction (100.0%), Utilities (100.0%), and Arts, Entertainment & Recreation (86.5%), whereas the industries that tend to have a higher number of women are Health Care & Social Assistance (87.3%), Information (83.5%), and Educational Services (82.7%).
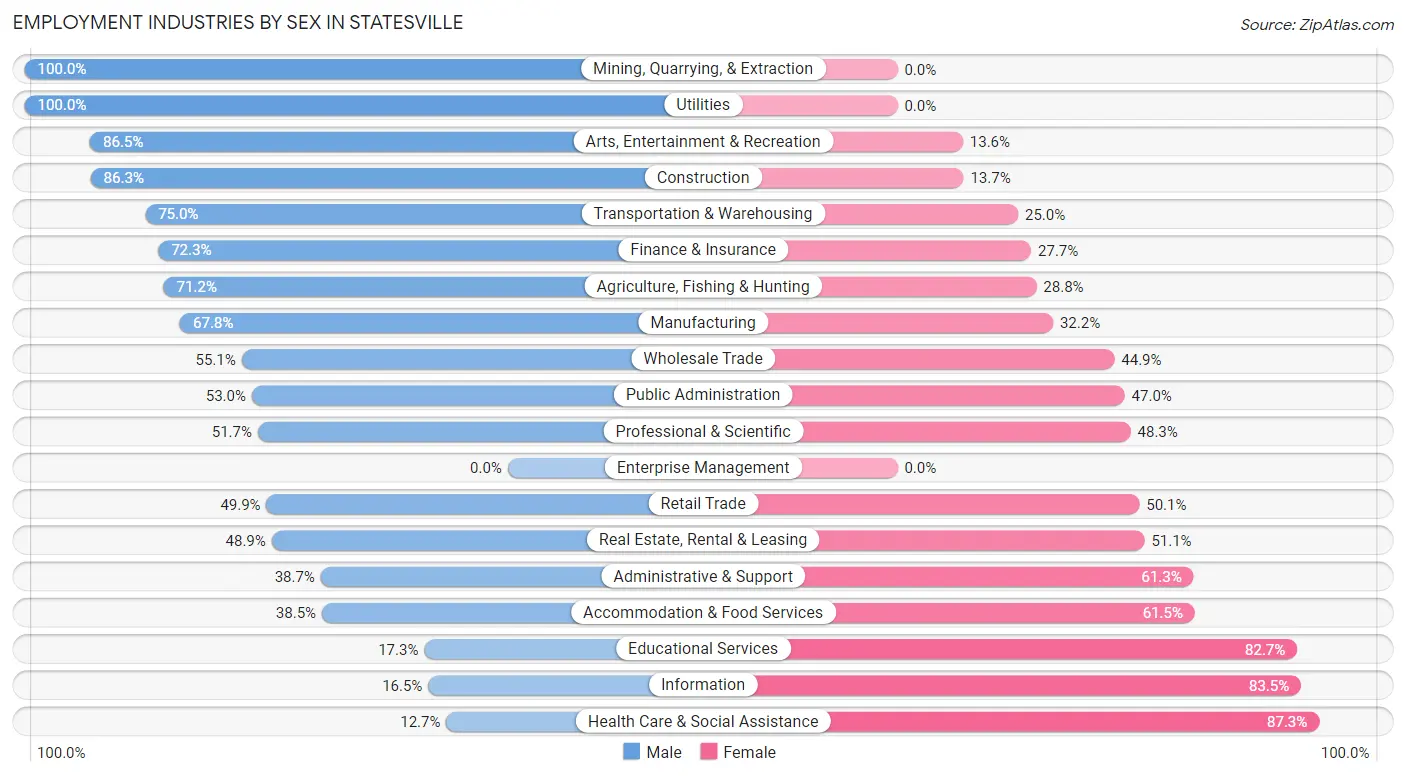
| Industry | Male | Female |
| Agriculture, Fishing & Hunting | 104 (71.2%) | 42 (28.8%) |
| Mining, Quarrying, & Extraction | 17 (100.0%) | 0 (0.0%) |
| Construction | 593 (86.3%) | 94 (13.7%) |
| Manufacturing | 2,120 (67.8%) | 1,007 (32.2%) |
| Wholesale Trade | 238 (55.1%) | 194 (44.9%) |
| Retail Trade | 858 (49.9%) | 860 (50.1%) |
| Transportation & Warehousing | 595 (75.0%) | 198 (25.0%) |
| Utilities | 54 (100.0%) | 0 (0.0%) |
| Information | 27 (16.5%) | 137 (83.5%) |
| Finance & Insurance | 264 (72.3%) | 101 (27.7%) |
| Real Estate, Rental & Leasing | 65 (48.9%) | 68 (51.1%) |
| Professional & Scientific | 224 (51.7%) | 209 (48.3%) |
| Enterprise Management | 0 (0.0%) | 0 (0.0%) |
| Administrative & Support | 269 (38.7%) | 426 (61.3%) |
| Educational Services | 137 (17.3%) | 656 (82.7%) |
| Health Care & Social Assistance | 233 (12.7%) | 1,599 (87.3%) |
| Arts, Entertainment & Recreation | 134 (86.5%) | 21 (13.6%) |
| Accommodation & Food Services | 370 (38.5%) | 592 (61.5%) |
| Public Administration | 196 (53.0%) | 174 (47.0%) |
| Total | 6,843 (50.6%) | 6,674 (49.4%) |
Education in Statesville
School Enrollment in Statesville
The most common levels of schooling among the 6,260 students in Statesville are middle school (1,529 | 24.4%), high school (1,316 | 21.0%), and elementary school (1,294 | 20.7%).
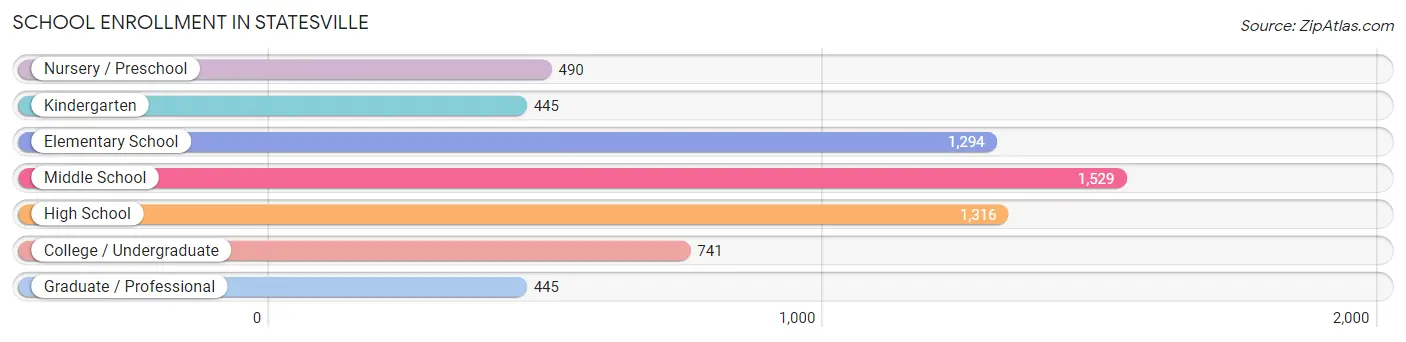
| School Level | # Students | % Students |
| Nursery / Preschool | 490 | 7.8% |
| Kindergarten | 445 | 7.1% |
| Elementary School | 1,294 | 20.7% |
| Middle School | 1,529 | 24.4% |
| High School | 1,316 | 21.0% |
| College / Undergraduate | 741 | 11.8% |
| Graduate / Professional | 445 | 7.1% |
| Total | 6,260 | 100.0% |
School Enrollment by Age by Funding Source in Statesville
Out of a total of 6,260 students who are enrolled in schools in Statesville, 876 (14.0%) attend a private institution, while the remaining 5,384 (86.0%) are enrolled in public schools. The age group of 18 to 19 year olds has the highest likelihood of being enrolled in private schools, with 87 (43.1% in the age bracket) enrolled. Conversely, the age group of 20 to 24 year olds has the lowest likelihood of being enrolled in a private school, with 323 (96.4% in the age bracket) attending a public institution.
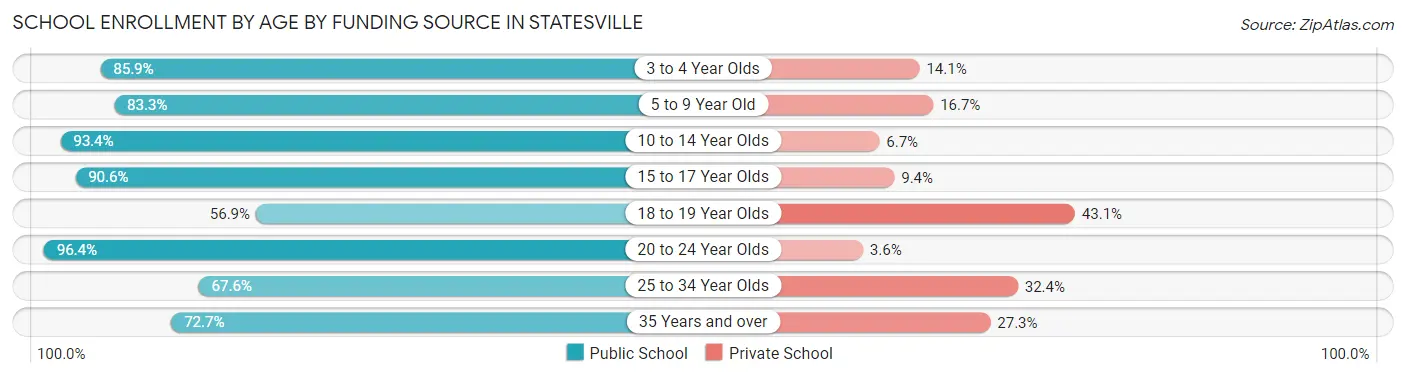
| Age Bracket | Public School | Private School |
| 3 to 4 Year Olds | 298 (85.9%) | 49 (14.1%) |
| 5 to 9 Year Old | 1,444 (83.3%) | 289 (16.7%) |
| 10 to 14 Year Olds | 1,685 (93.3%) | 120 (6.7%) |
| 15 to 17 Year Olds | 1,008 (90.6%) | 105 (9.4%) |
| 18 to 19 Year Olds | 115 (56.9%) | 87 (43.1%) |
| 20 to 24 Year Olds | 323 (96.4%) | 12 (3.6%) |
| 25 to 34 Year Olds | 250 (67.6%) | 120 (32.4%) |
| 35 Years and over | 258 (72.7%) | 97 (27.3%) |
| Total | 5,384 (86.0%) | 876 (14.0%) |
Educational Attainment by Field of Study in Statesville
Business (1,006 | 17.6%), education (737 | 12.9%), science & technology (706 | 12.3%), engineering (459 | 8.0%), and arts & humanities (419 | 7.3%) are the most common fields of study among 5,716 individuals in Statesville who have obtained a bachelor's degree or higher.
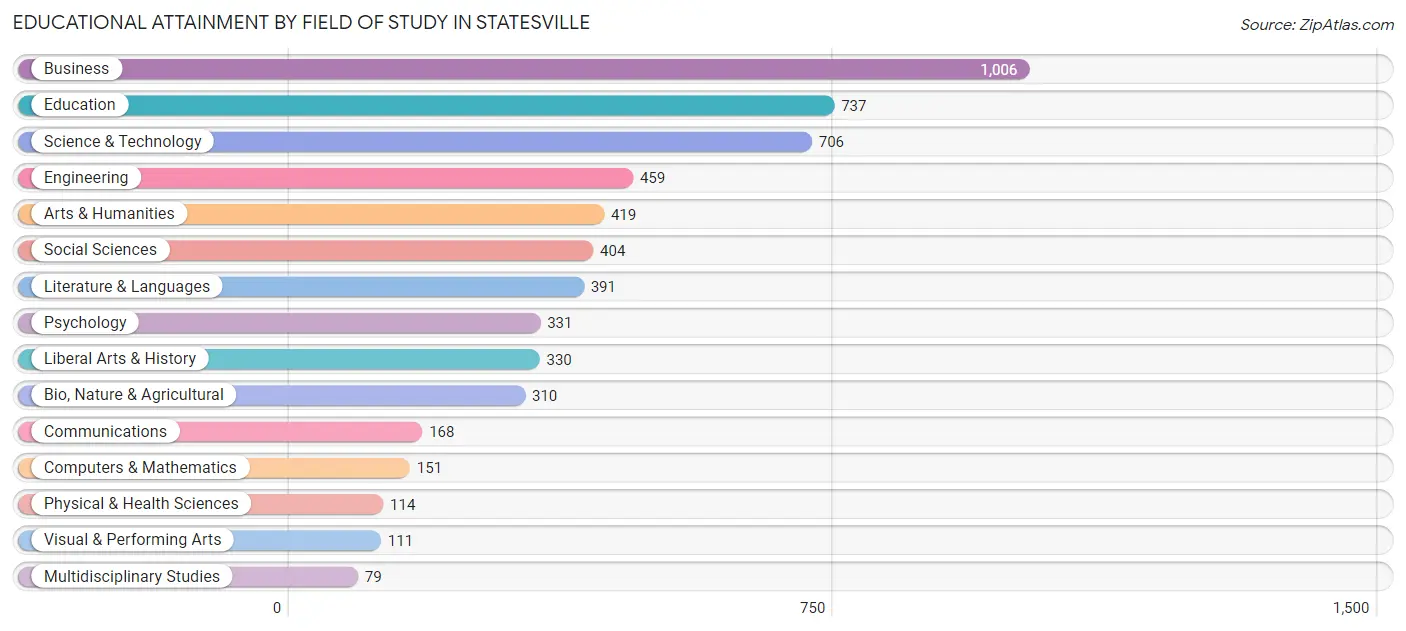
| Field of Study | # Graduates | % Graduates |
| Computers & Mathematics | 151 | 2.6% |
| Bio, Nature & Agricultural | 310 | 5.4% |
| Physical & Health Sciences | 114 | 2.0% |
| Psychology | 331 | 5.8% |
| Social Sciences | 404 | 7.1% |
| Engineering | 459 | 8.0% |
| Multidisciplinary Studies | 79 | 1.4% |
| Science & Technology | 706 | 12.3% |
| Business | 1,006 | 17.6% |
| Education | 737 | 12.9% |
| Literature & Languages | 391 | 6.8% |
| Liberal Arts & History | 330 | 5.8% |
| Visual & Performing Arts | 111 | 1.9% |
| Communications | 168 | 2.9% |
| Arts & Humanities | 419 | 7.3% |
| Total | 5,716 | 100.0% |
Transportation & Commute in Statesville
Vehicle Availability by Sex in Statesville
The most prevalent vehicle ownership categories in Statesville are males with 2 vehicles (2,834, accounting for 42.0%) and females with 2 vehicles (2,360, making up 44.7%).
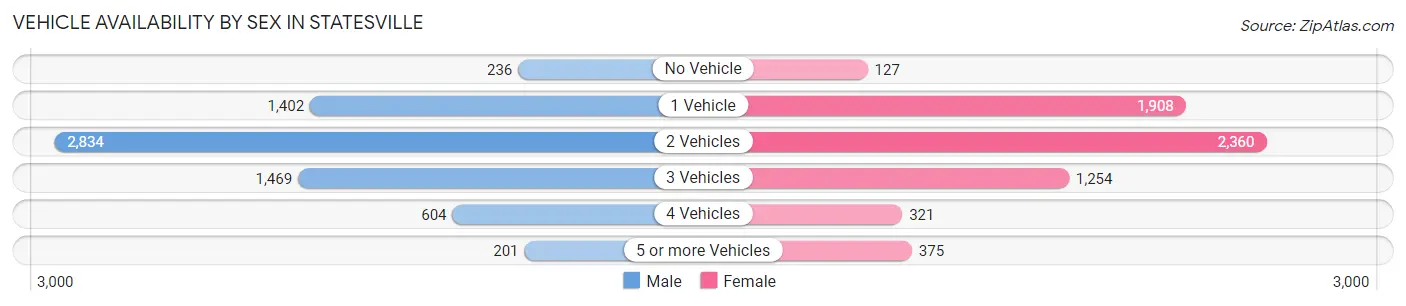
| Vehicles Available | Male | Female |
| No Vehicle | 236 (3.5%) | 127 (2.0%) |
| 1 Vehicle | 1,402 (20.8%) | 1,908 (30.1%) |
| 2 Vehicles | 2,834 (42.0%) | 2,360 (37.2%) |
| 3 Vehicles | 1,469 (21.8%) | 1,254 (19.8%) |
| 4 Vehicles | 604 (8.9%) | 321 (5.1%) |
| 5 or more Vehicles | 201 (3.0%) | 375 (5.9%) |
| Total | 6,746 (100.0%) | 6,345 (100.0%) |
Commute Time in Statesville
The most frequently occuring commute durations in Statesville are 15 to 19 minutes (2,416 commuters, 19.7%), 10 to 14 minutes (2,099 commuters, 17.1%), and 5 to 9 minutes (1,980 commuters, 16.1%).
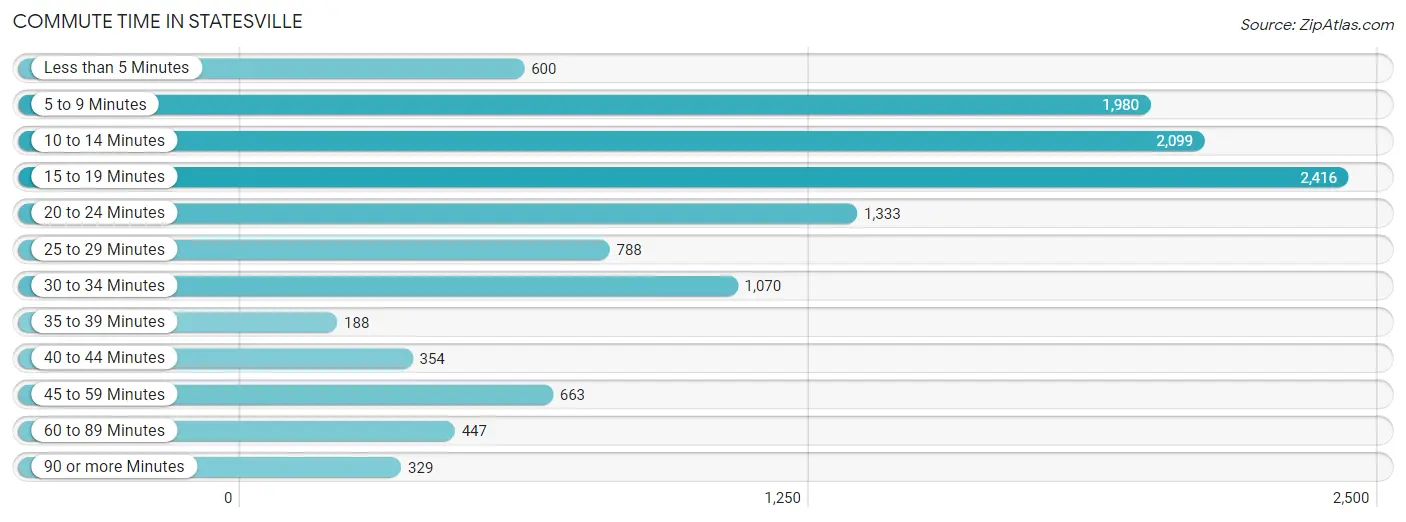
| Commute Time | # Commuters | % Commuters |
| Less than 5 Minutes | 600 | 4.9% |
| 5 to 9 Minutes | 1,980 | 16.1% |
| 10 to 14 Minutes | 2,099 | 17.1% |
| 15 to 19 Minutes | 2,416 | 19.7% |
| 20 to 24 Minutes | 1,333 | 10.9% |
| 25 to 29 Minutes | 788 | 6.4% |
| 30 to 34 Minutes | 1,070 | 8.7% |
| 35 to 39 Minutes | 188 | 1.5% |
| 40 to 44 Minutes | 354 | 2.9% |
| 45 to 59 Minutes | 663 | 5.4% |
| 60 to 89 Minutes | 447 | 3.6% |
| 90 or more Minutes | 329 | 2.7% |
Commute Time by Sex in Statesville
The most common commute times in Statesville are 15 to 19 minutes (1,307 commuters, 20.5%) for males and 10 to 14 minutes (1,176 commuters, 20.0%) for females.
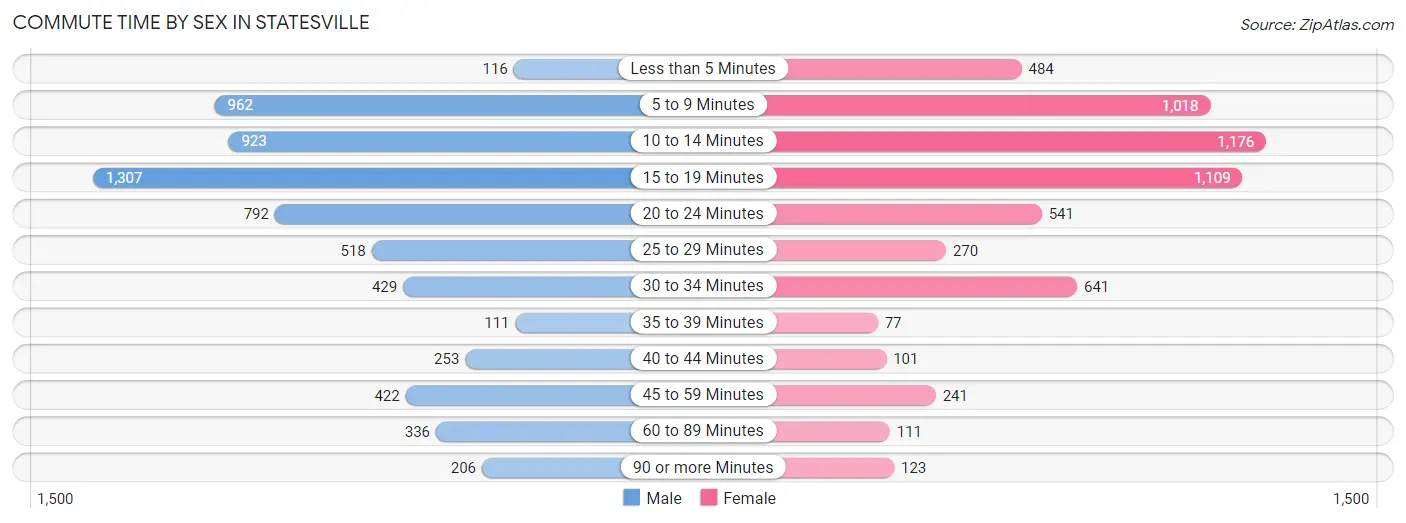
| Commute Time | Male | Female |
| Less than 5 Minutes | 116 (1.8%) | 484 (8.2%) |
| 5 to 9 Minutes | 962 (15.1%) | 1,018 (17.3%) |
| 10 to 14 Minutes | 923 (14.5%) | 1,176 (20.0%) |
| 15 to 19 Minutes | 1,307 (20.5%) | 1,109 (18.8%) |
| 20 to 24 Minutes | 792 (12.4%) | 541 (9.2%) |
| 25 to 29 Minutes | 518 (8.1%) | 270 (4.6%) |
| 30 to 34 Minutes | 429 (6.7%) | 641 (10.9%) |
| 35 to 39 Minutes | 111 (1.7%) | 77 (1.3%) |
| 40 to 44 Minutes | 253 (4.0%) | 101 (1.7%) |
| 45 to 59 Minutes | 422 (6.6%) | 241 (4.1%) |
| 60 to 89 Minutes | 336 (5.3%) | 111 (1.9%) |
| 90 or more Minutes | 206 (3.2%) | 123 (2.1%) |
Time of Departure to Work by Sex in Statesville
The most frequent times of departure to work in Statesville are 7:00 AM to 7:29 AM (768, 12.0%) for males and 7:00 AM to 7:29 AM (961, 16.3%) for females.
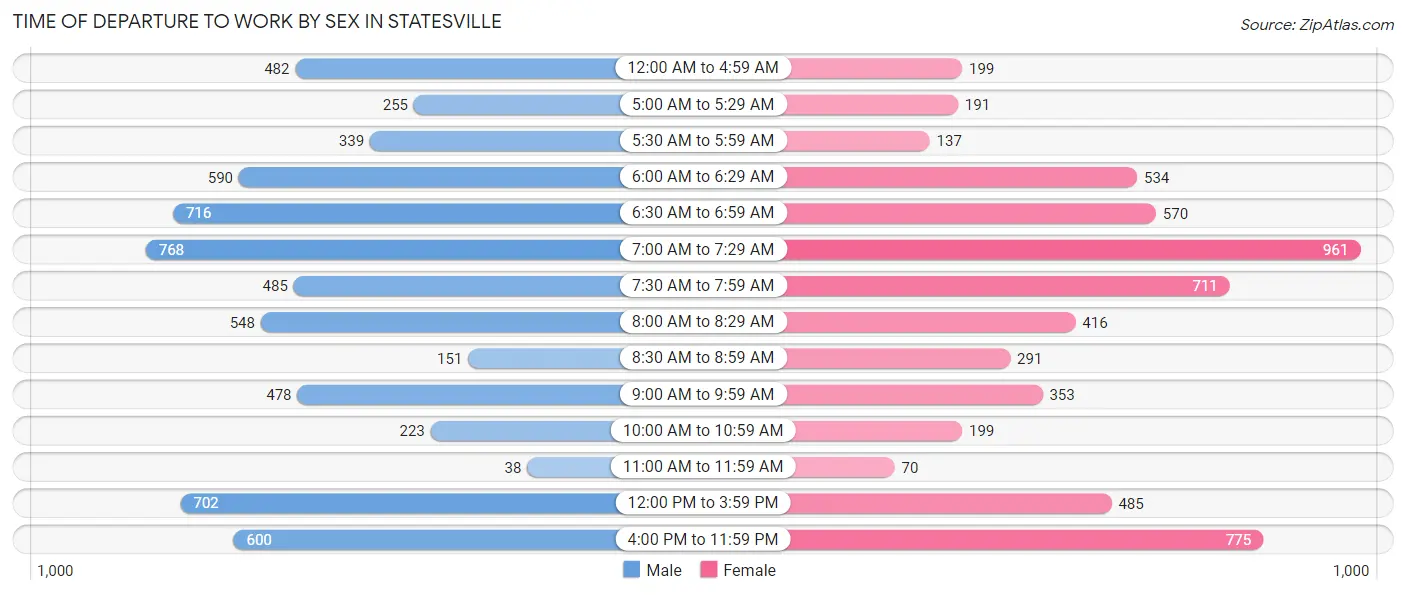
| Time of Departure | Male | Female |
| 12:00 AM to 4:59 AM | 482 (7.6%) | 199 (3.4%) |
| 5:00 AM to 5:29 AM | 255 (4.0%) | 191 (3.2%) |
| 5:30 AM to 5:59 AM | 339 (5.3%) | 137 (2.3%) |
| 6:00 AM to 6:29 AM | 590 (9.2%) | 534 (9.1%) |
| 6:30 AM to 6:59 AM | 716 (11.2%) | 570 (9.7%) |
| 7:00 AM to 7:29 AM | 768 (12.0%) | 961 (16.3%) |
| 7:30 AM to 7:59 AM | 485 (7.6%) | 711 (12.1%) |
| 8:00 AM to 8:29 AM | 548 (8.6%) | 416 (7.1%) |
| 8:30 AM to 8:59 AM | 151 (2.4%) | 291 (4.9%) |
| 9:00 AM to 9:59 AM | 478 (7.5%) | 353 (6.0%) |
| 10:00 AM to 10:59 AM | 223 (3.5%) | 199 (3.4%) |
| 11:00 AM to 11:59 AM | 38 (0.6%) | 70 (1.2%) |
| 12:00 PM to 3:59 PM | 702 (11.0%) | 485 (8.2%) |
| 4:00 PM to 11:59 PM | 600 (9.4%) | 775 (13.2%) |
| Total | 6,375 (100.0%) | 5,892 (100.0%) |
Housing Occupancy in Statesville
Occupancy by Ownership in Statesville
Of the total 11,400 dwellings in Statesville, owner-occupied units account for 6,290 (55.2%), while renter-occupied units make up 5,110 (44.8%).
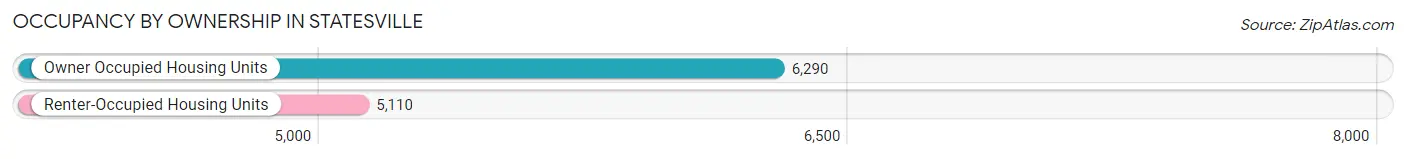
| Occupancy | # Housing Units | % Housing Units |
| Owner Occupied Housing Units | 6,290 | 55.2% |
| Renter-Occupied Housing Units | 5,110 | 44.8% |
| Total Occupied Housing Units | 11,400 | 100.0% |
Occupancy by Household Size in Statesville
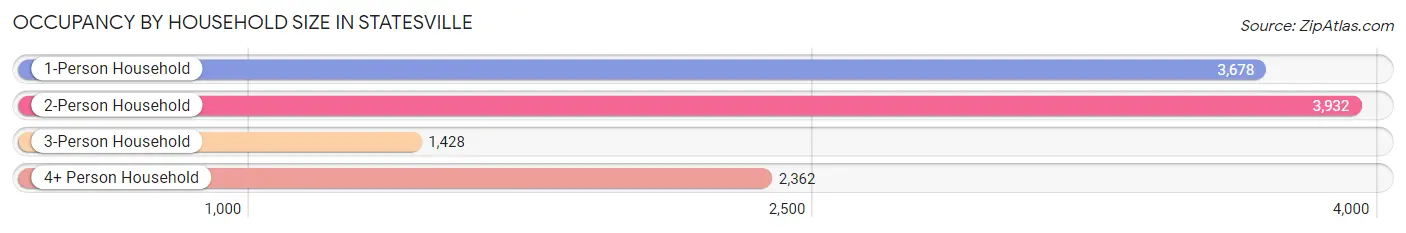
| Household Size | # Housing Units | % Housing Units |
| 1-Person Household | 3,678 | 32.3% |
| 2-Person Household | 3,932 | 34.5% |
| 3-Person Household | 1,428 | 12.5% |
| 4+ Person Household | 2,362 | 20.7% |
| Total Housing Units | 11,400 | 100.0% |
Occupancy by Ownership by Household Size in Statesville
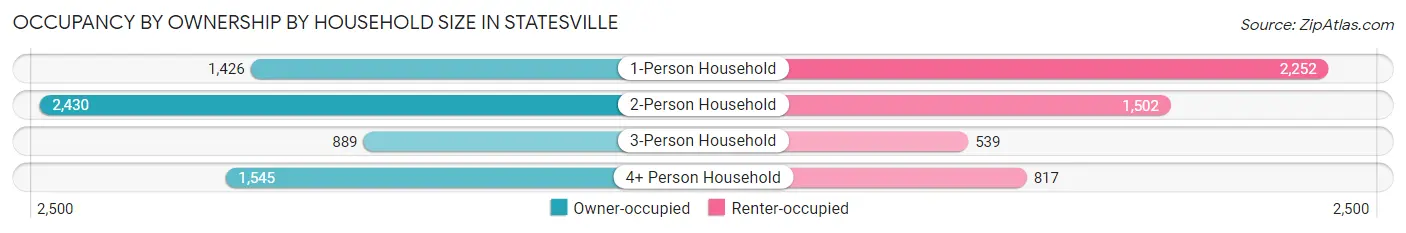
| Household Size | Owner-occupied | Renter-occupied |
| 1-Person Household | 1,426 (38.8%) | 2,252 (61.2%) |
| 2-Person Household | 2,430 (61.8%) | 1,502 (38.2%) |
| 3-Person Household | 889 (62.3%) | 539 (37.8%) |
| 4+ Person Household | 1,545 (65.4%) | 817 (34.6%) |
| Total Housing Units | 6,290 (55.2%) | 5,110 (44.8%) |
Occupancy by Educational Attainment in Statesville
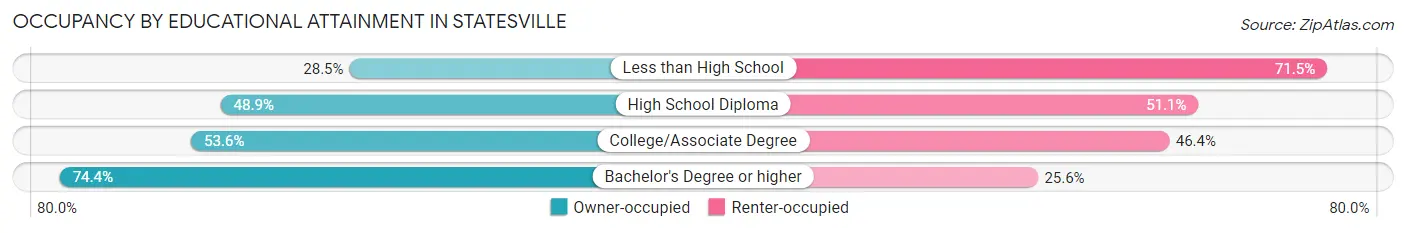
| Household Size | Owner-occupied | Renter-occupied |
| Less than High School | 386 (28.5%) | 969 (71.5%) |
| High School Diploma | 1,442 (48.9%) | 1,507 (51.1%) |
| College/Associate Degree | 2,106 (53.6%) | 1,824 (46.4%) |
| Bachelor's Degree or higher | 2,356 (74.4%) | 810 (25.6%) |
Occupancy by Age of Householder in Statesville
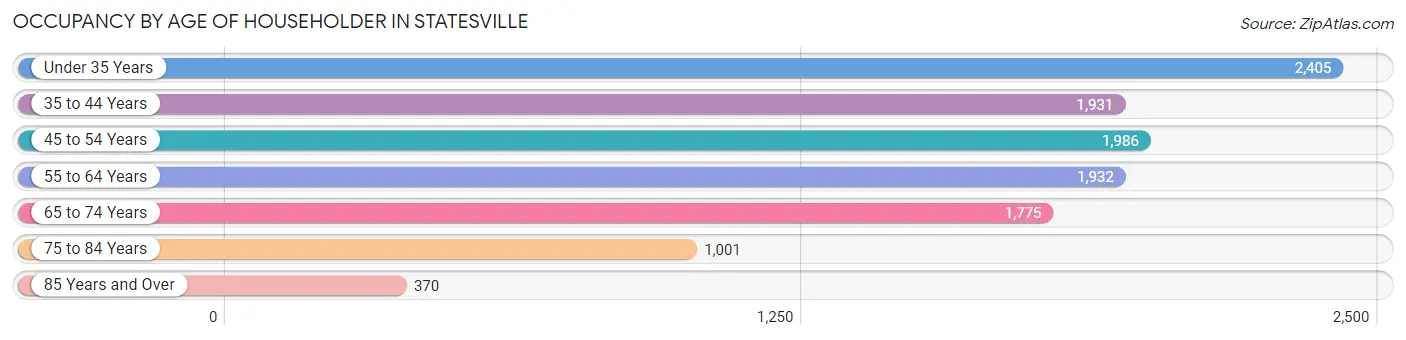
| Age Bracket | # Households | % Households |
| Under 35 Years | 2,405 | 21.1% |
| 35 to 44 Years | 1,931 | 16.9% |
| 45 to 54 Years | 1,986 | 17.4% |
| 55 to 64 Years | 1,932 | 17.0% |
| 65 to 74 Years | 1,775 | 15.6% |
| 75 to 84 Years | 1,001 | 8.8% |
| 85 Years and Over | 370 | 3.3% |
| Total | 11,400 | 100.0% |
Housing Finances in Statesville
Median Income by Occupancy in Statesville
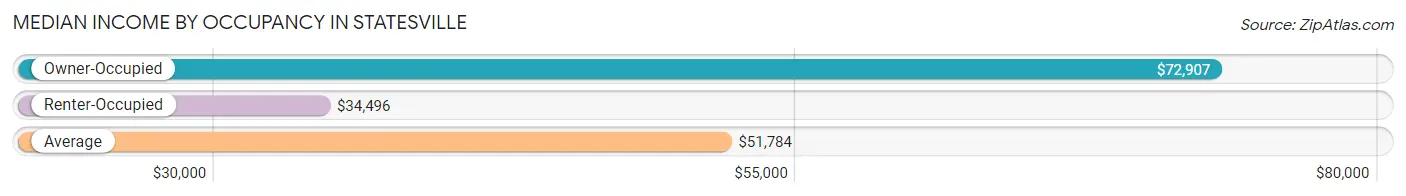
| Occupancy Type | # Households | Median Income |
| Owner-Occupied | 6,290 (55.2%) | $72,907 |
| Renter-Occupied | 5,110 (44.8%) | $34,496 |
| Average | 11,400 (100.0%) | $51,784 |
Occupancy by Householder Income Bracket in Statesville
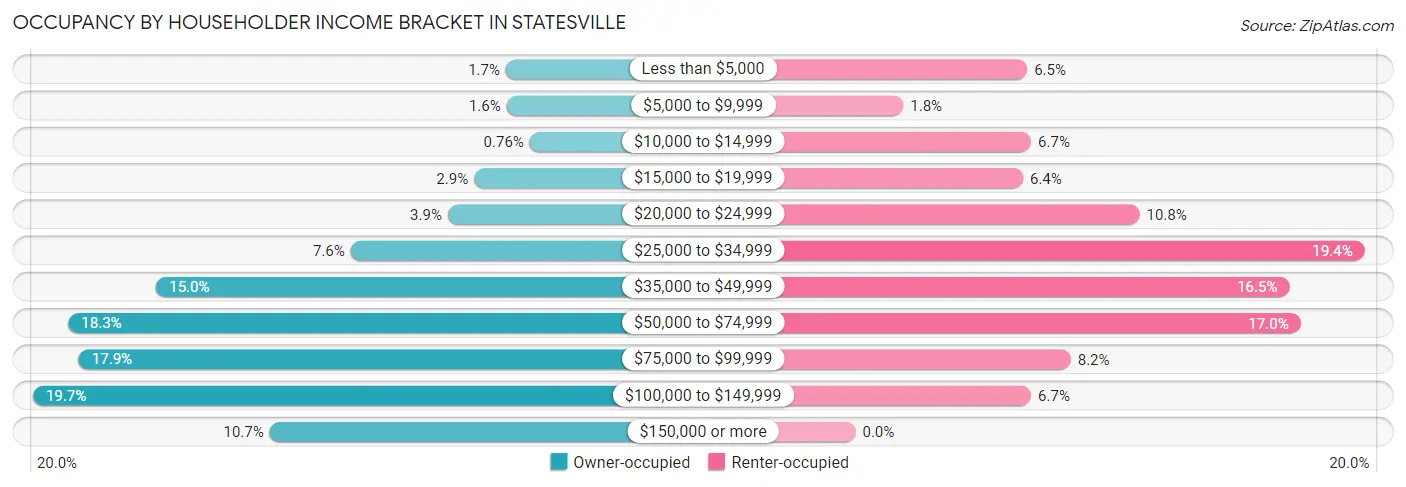
| Income Bracket | Owner-occupied | Renter-occupied |
| Less than $5,000 | 105 (1.7%) | 334 (6.5%) |
| $5,000 to $9,999 | 103 (1.6%) | 93 (1.8%) |
| $10,000 to $14,999 | 48 (0.8%) | 342 (6.7%) |
| $15,000 to $19,999 | 181 (2.9%) | 326 (6.4%) |
| $20,000 to $24,999 | 244 (3.9%) | 553 (10.8%) |
| $25,000 to $34,999 | 477 (7.6%) | 991 (19.4%) |
| $35,000 to $49,999 | 942 (15.0%) | 844 (16.5%) |
| $50,000 to $74,999 | 1,153 (18.3%) | 866 (17.0%) |
| $75,000 to $99,999 | 1,128 (17.9%) | 419 (8.2%) |
| $100,000 to $149,999 | 1,238 (19.7%) | 342 (6.7%) |
| $150,000 or more | 671 (10.7%) | 0 (0.0%) |
| Total | 6,290 (100.0%) | 5,110 (100.0%) |
Monthly Housing Cost Tiers in Statesville
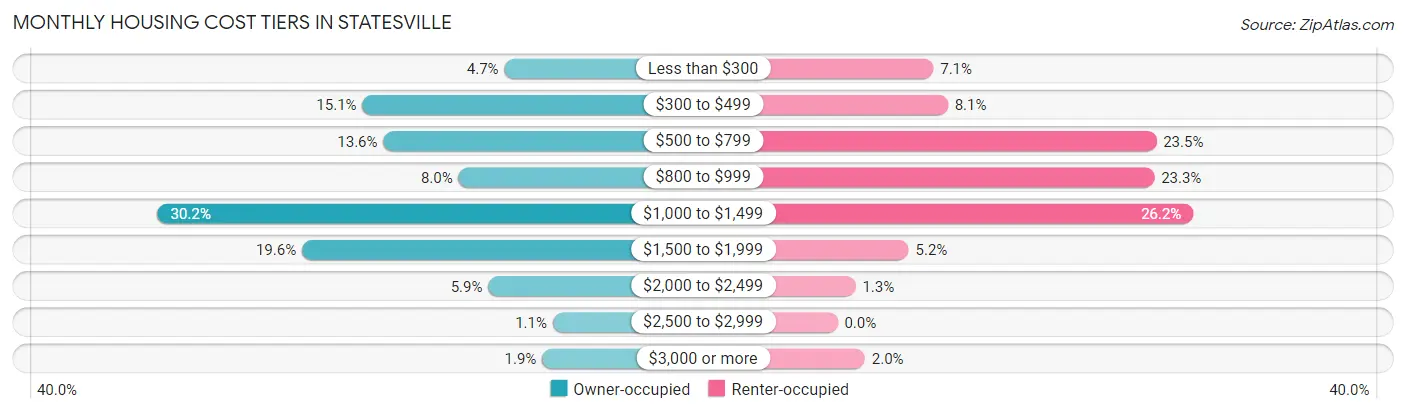
| Monthly Cost | Owner-occupied | Renter-occupied |
| Less than $300 | 293 (4.7%) | 361 (7.1%) |
| $300 to $499 | 951 (15.1%) | 415 (8.1%) |
| $500 to $799 | 854 (13.6%) | 1,200 (23.5%) |
| $800 to $999 | 506 (8.0%) | 1,192 (23.3%) |
| $1,000 to $1,499 | 1,900 (30.2%) | 1,339 (26.2%) |
| $1,500 to $1,999 | 1,231 (19.6%) | 268 (5.2%) |
| $2,000 to $2,499 | 368 (5.9%) | 68 (1.3%) |
| $2,500 to $2,999 | 69 (1.1%) | 0 (0.0%) |
| $3,000 or more | 118 (1.9%) | 103 (2.0%) |
| Total | 6,290 (100.0%) | 5,110 (100.0%) |
Physical Housing Characteristics in Statesville
Housing Structures in Statesville
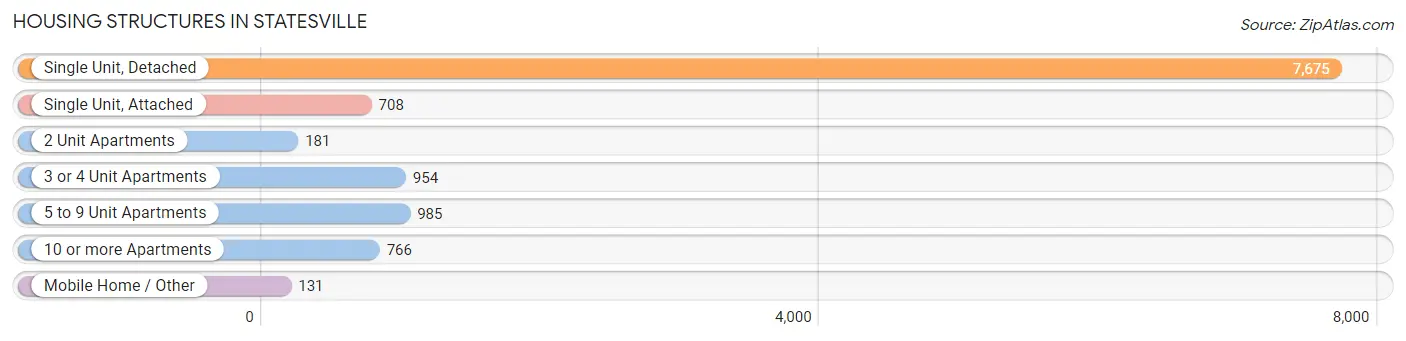
| Structure Type | # Housing Units | % Housing Units |
| Single Unit, Detached | 7,675 | 67.3% |
| Single Unit, Attached | 708 | 6.2% |
| 2 Unit Apartments | 181 | 1.6% |
| 3 or 4 Unit Apartments | 954 | 8.4% |
| 5 to 9 Unit Apartments | 985 | 8.6% |
| 10 or more Apartments | 766 | 6.7% |
| Mobile Home / Other | 131 | 1.1% |
| Total | 11,400 | 100.0% |
Housing Structures by Occupancy in Statesville
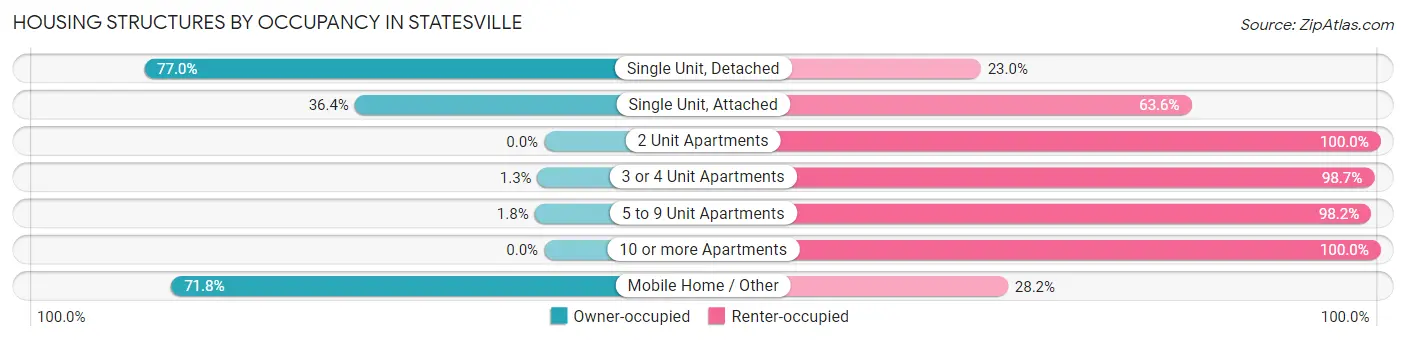
| Structure Type | Owner-occupied | Renter-occupied |
| Single Unit, Detached | 5,908 (77.0%) | 1,767 (23.0%) |
| Single Unit, Attached | 258 (36.4%) | 450 (63.6%) |
| 2 Unit Apartments | 0 (0.0%) | 181 (100.0%) |
| 3 or 4 Unit Apartments | 12 (1.3%) | 942 (98.7%) |
| 5 to 9 Unit Apartments | 18 (1.8%) | 967 (98.2%) |
| 10 or more Apartments | 0 (0.0%) | 766 (100.0%) |
| Mobile Home / Other | 94 (71.8%) | 37 (28.2%) |
| Total | 6,290 (55.2%) | 5,110 (44.8%) |
Housing Structures by Number of Rooms in Statesville
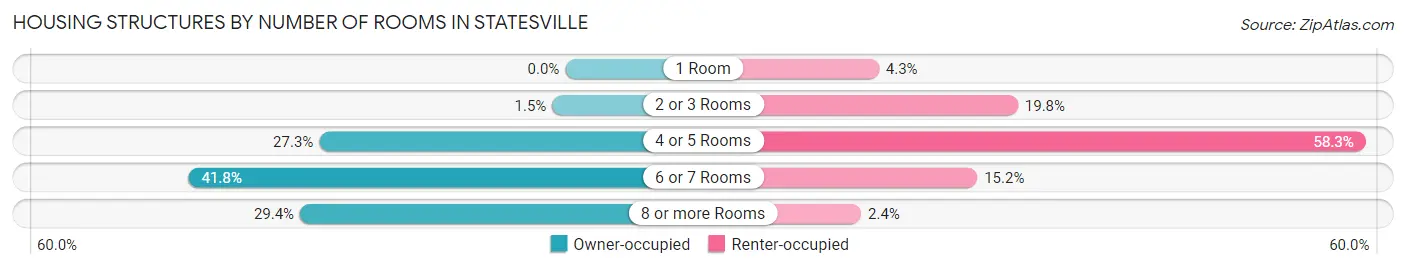
| Number of Rooms | Owner-occupied | Renter-occupied |
| 1 Room | 0 (0.0%) | 221 (4.3%) |
| 2 or 3 Rooms | 91 (1.5%) | 1,009 (19.8%) |
| 4 or 5 Rooms | 1,718 (27.3%) | 2,981 (58.3%) |
| 6 or 7 Rooms | 2,629 (41.8%) | 779 (15.2%) |
| 8 or more Rooms | 1,852 (29.4%) | 120 (2.4%) |
| Total | 6,290 (100.0%) | 5,110 (100.0%) |
Housing Structure by Heating Type in Statesville
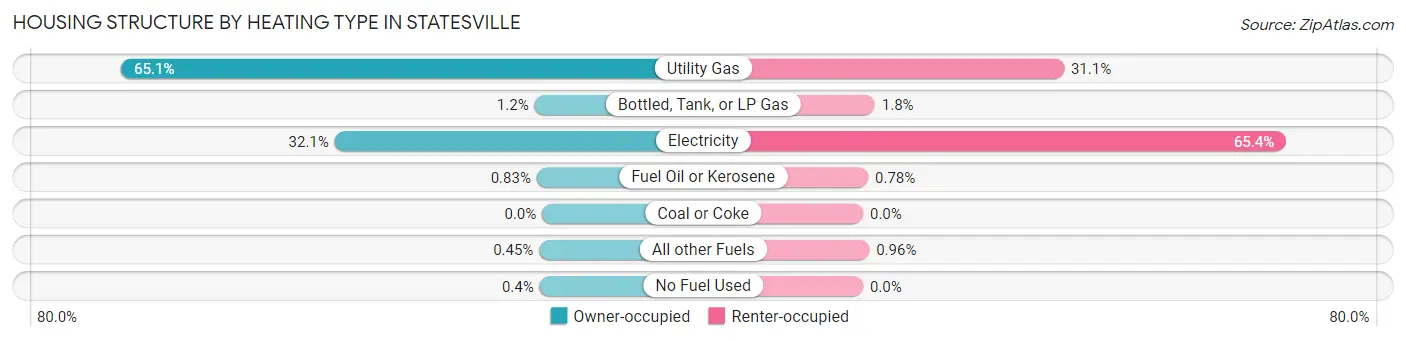
| Heating Type | Owner-occupied | Renter-occupied |
| Utility Gas | 4,093 (65.1%) | 1,587 (31.1%) |
| Bottled, Tank, or LP Gas | 74 (1.2%) | 93 (1.8%) |
| Electricity | 2,018 (32.1%) | 3,341 (65.4%) |
| Fuel Oil or Kerosene | 52 (0.8%) | 40 (0.8%) |
| Coal or Coke | 0 (0.0%) | 0 (0.0%) |
| All other Fuels | 28 (0.4%) | 49 (1.0%) |
| No Fuel Used | 25 (0.4%) | 0 (0.0%) |
| Total | 6,290 (100.0%) | 5,110 (100.0%) |
Household Vehicle Usage in Statesville
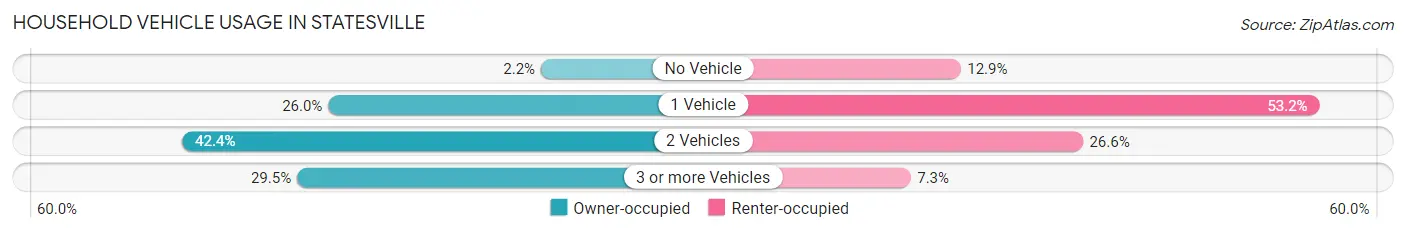
| Vehicles per Household | Owner-occupied | Renter-occupied |
| No Vehicle | 136 (2.2%) | 660 (12.9%) |
| 1 Vehicle | 1,635 (26.0%) | 2,716 (53.1%) |
| 2 Vehicles | 2,664 (42.3%) | 1,360 (26.6%) |
| 3 or more Vehicles | 1,855 (29.5%) | 374 (7.3%) |
| Total | 6,290 (100.0%) | 5,110 (100.0%) |
Real Estate & Mortgages in Statesville
Real Estate and Mortgage Overview in Statesville
| Characteristic | Without Mortgage | With Mortgage |
| Housing Units | 1,940 | 4,350 |
| Median Property Value | $164,700 | $208,200 |
| Median Household Income | $62,128 | $473 |
| Monthly Housing Costs | $445 | $118 |
| Real Estate Taxes | $1,288 | $195 |
Property Value by Mortgage Status in Statesville
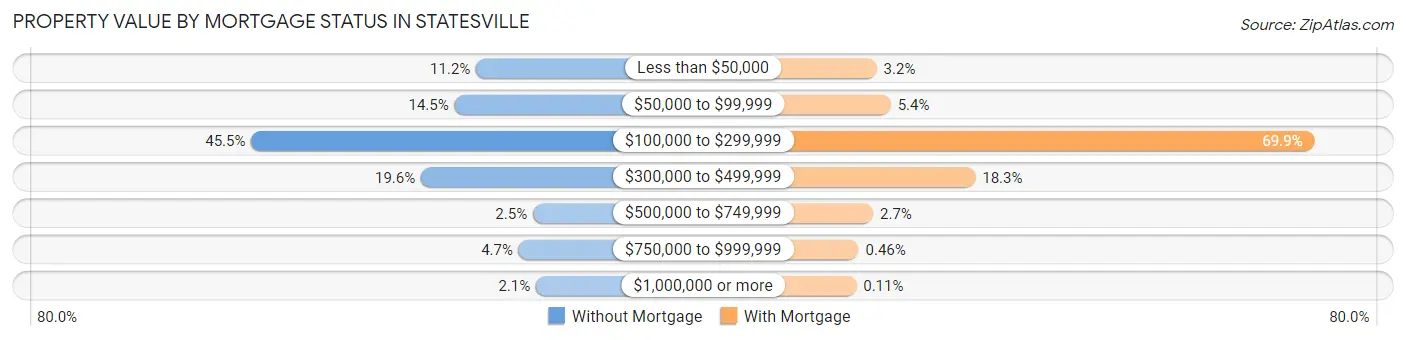
| Property Value | Without Mortgage | With Mortgage |
| Less than $50,000 | 217 (11.2%) | 140 (3.2%) |
| $50,000 to $99,999 | 281 (14.5%) | 233 (5.4%) |
| $100,000 to $299,999 | 882 (45.5%) | 3,042 (69.9%) |
| $300,000 to $499,999 | 380 (19.6%) | 794 (18.2%) |
| $500,000 to $749,999 | 49 (2.5%) | 116 (2.7%) |
| $750,000 to $999,999 | 91 (4.7%) | 20 (0.5%) |
| $1,000,000 or more | 40 (2.1%) | 5 (0.1%) |
| Total | 1,940 (100.0%) | 4,350 (100.0%) |
Household Income by Mortgage Status in Statesville
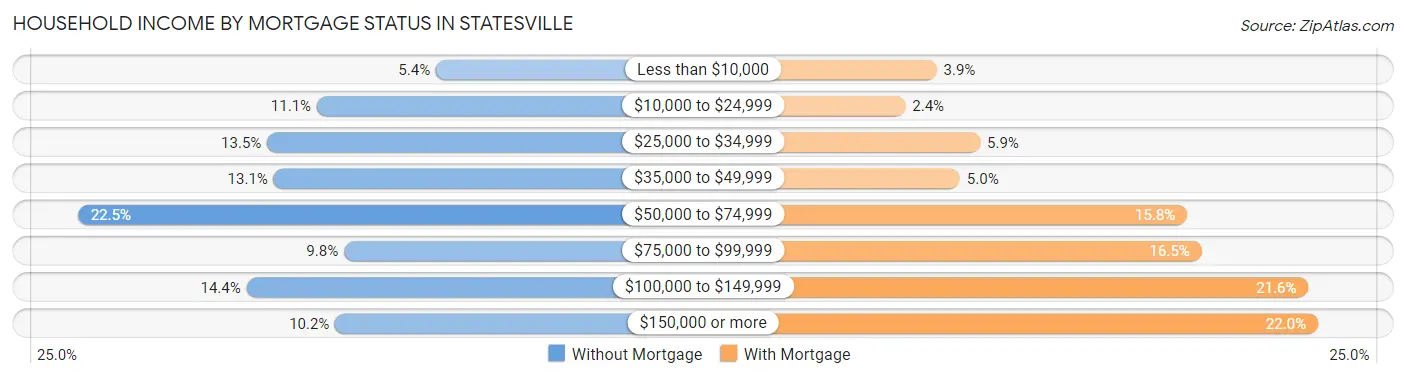
| Household Income | Without Mortgage | With Mortgage |
| Less than $10,000 | 105 (5.4%) | 168 (3.9%) |
| $10,000 to $24,999 | 215 (11.1%) | 103 (2.4%) |
| $25,000 to $34,999 | 261 (13.5%) | 258 (5.9%) |
| $35,000 to $49,999 | 255 (13.1%) | 216 (5.0%) |
| $50,000 to $74,999 | 436 (22.5%) | 687 (15.8%) |
| $75,000 to $99,999 | 190 (9.8%) | 717 (16.5%) |
| $100,000 to $149,999 | 280 (14.4%) | 938 (21.6%) |
| $150,000 or more | 198 (10.2%) | 958 (22.0%) |
| Total | 1,940 (100.0%) | 4,350 (100.0%) |
Property Value to Household Income Ratio in Statesville
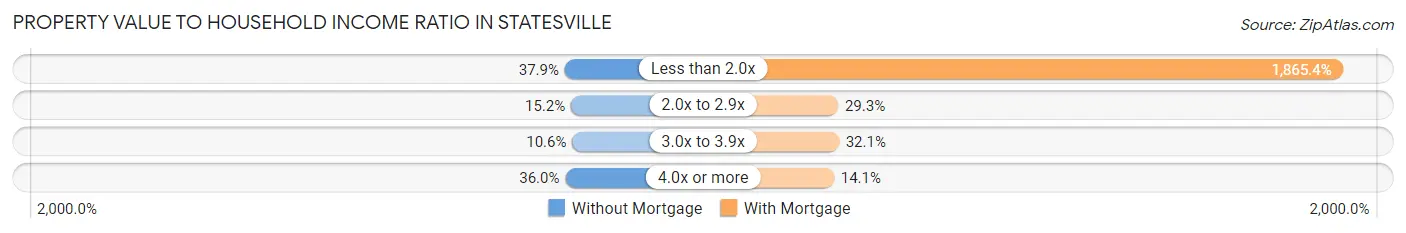
| Value-to-Income Ratio | Without Mortgage | With Mortgage |
| Less than 2.0x | 736 (37.9%) | 81,143 (1,865.4%) |
| 2.0x to 2.9x | 294 (15.1%) | 1,276 (29.3%) |
| 3.0x to 3.9x | 206 (10.6%) | 1,394 (32.1%) |
| 4.0x or more | 698 (36.0%) | 615 (14.1%) |
| Total | 1,940 (100.0%) | 4,350 (100.0%) |
Real Estate Taxes by Mortgage Status in Statesville
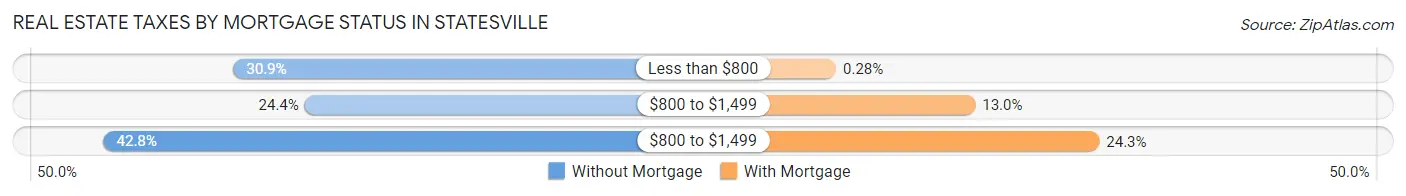
| Property Taxes | Without Mortgage | With Mortgage |
| Less than $800 | 600 (30.9%) | 12 (0.3%) |
| $800 to $1,499 | 474 (24.4%) | 565 (13.0%) |
| $800 to $1,499 | 830 (42.8%) | 1,058 (24.3%) |
| Total | 1,940 (100.0%) | 4,350 (100.0%) |
Health & Disability in Statesville
Health Insurance Coverage by Age in Statesville
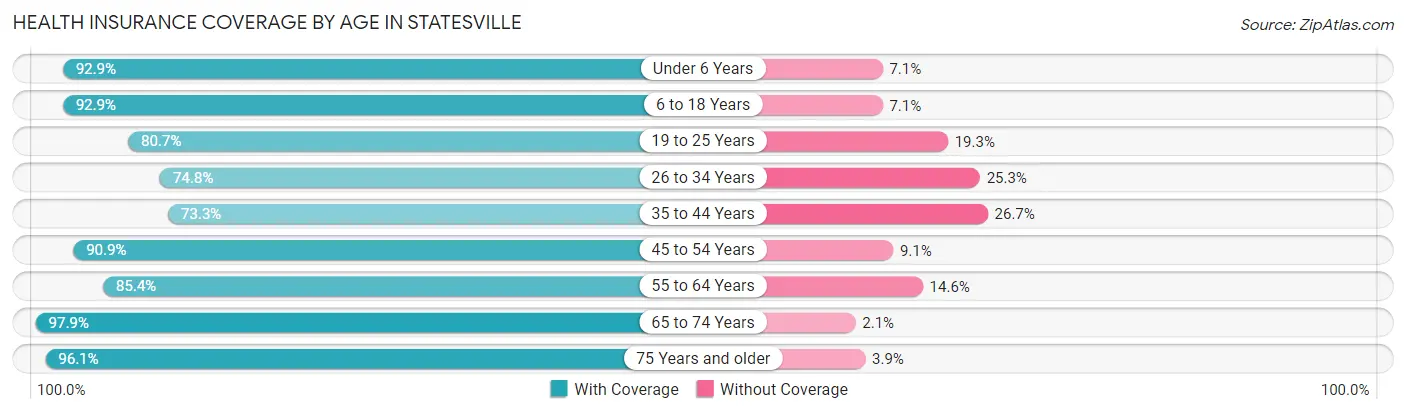
| Age Bracket | With Coverage | Without Coverage |
| Under 6 Years | 1,905 (92.9%) | 146 (7.1%) |
| 6 to 18 Years | 4,337 (92.9%) | 332 (7.1%) |
| 19 to 25 Years | 2,000 (80.7%) | 478 (19.3%) |
| 26 to 34 Years | 2,777 (74.8%) | 938 (25.3%) |
| 35 to 44 Years | 2,563 (73.3%) | 935 (26.7%) |
| 45 to 54 Years | 2,909 (90.9%) | 290 (9.1%) |
| 55 to 64 Years | 2,694 (85.4%) | 461 (14.6%) |
| 65 to 74 Years | 2,469 (97.9%) | 52 (2.1%) |
| 75 Years and older | 2,178 (96.1%) | 88 (3.9%) |
| Total | 23,832 (86.5%) | 3,720 (13.5%) |
Health Insurance Coverage by Citizenship Status in Statesville
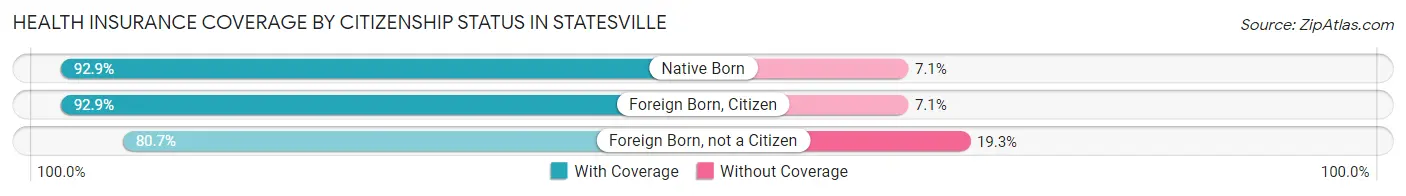
| Citizenship Status | With Coverage | Without Coverage |
| Native Born | 1,905 (92.9%) | 146 (7.1%) |
| Foreign Born, Citizen | 4,337 (92.9%) | 332 (7.1%) |
| Foreign Born, not a Citizen | 2,000 (80.7%) | 478 (19.3%) |
Health Insurance Coverage by Household Income in Statesville
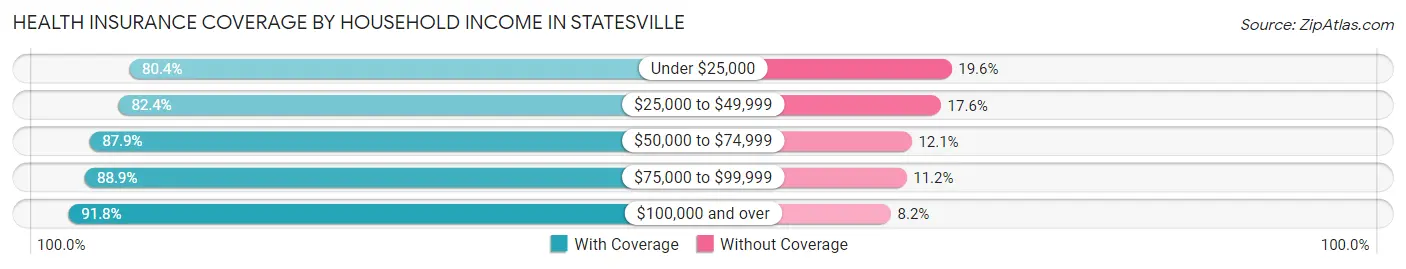
| Household Income | With Coverage | Without Coverage |
| Under $25,000 | 3,462 (80.4%) | 843 (19.6%) |
| $25,000 to $49,999 | 5,715 (82.4%) | 1,220 (17.6%) |
| $50,000 to $74,999 | 3,970 (87.9%) | 547 (12.1%) |
| $75,000 to $99,999 | 3,895 (88.8%) | 489 (11.2%) |
| $100,000 and over | 6,697 (91.8%) | 599 (8.2%) |
Public vs Private Health Insurance Coverage by Age in Statesville
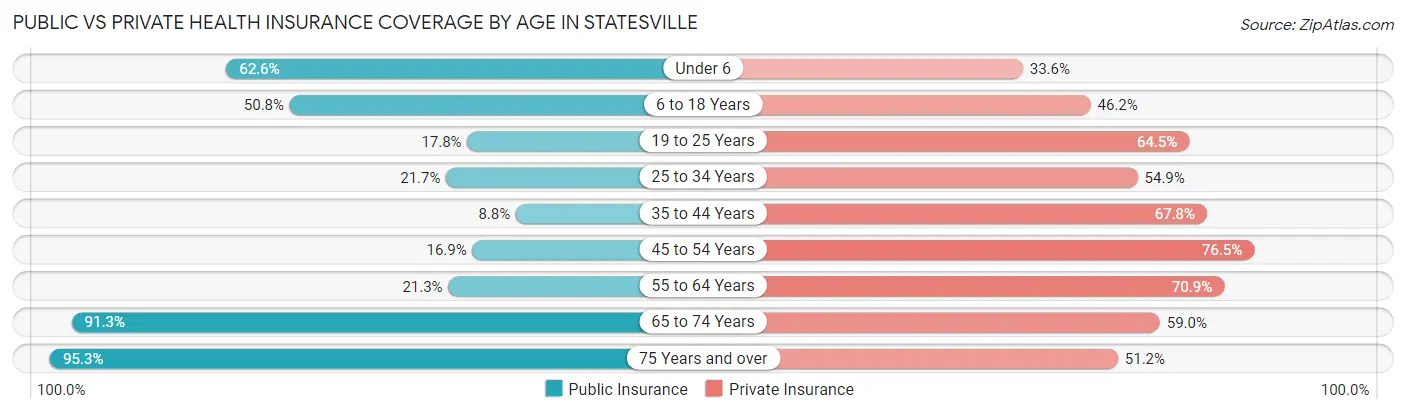
| Age Bracket | Public Insurance | Private Insurance |
| Under 6 | 1,283 (62.5%) | 689 (33.6%) |
| 6 to 18 Years | 2,370 (50.8%) | 2,156 (46.2%) |
| 19 to 25 Years | 441 (17.8%) | 1,597 (64.4%) |
| 25 to 34 Years | 807 (21.7%) | 2,040 (54.9%) |
| 35 to 44 Years | 307 (8.8%) | 2,370 (67.7%) |
| 45 to 54 Years | 539 (16.9%) | 2,448 (76.5%) |
| 55 to 64 Years | 673 (21.3%) | 2,238 (70.9%) |
| 65 to 74 Years | 2,301 (91.3%) | 1,488 (59.0%) |
| 75 Years and over | 2,159 (95.3%) | 1,161 (51.2%) |
| Total | 10,880 (39.5%) | 16,187 (58.8%) |
Disability Status by Sex by Age in Statesville
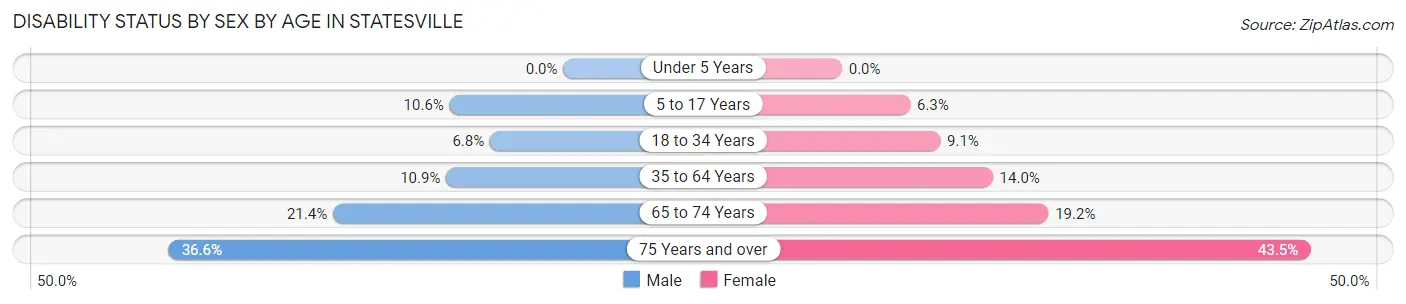
| Age Bracket | Male | Female |
| Under 5 Years | 0 (0.0%) | 0 (0.0%) |
| 5 to 17 Years | 261 (10.5%) | 147 (6.3%) |
| 18 to 34 Years | 235 (6.8%) | 272 (9.1%) |
| 35 to 64 Years | 494 (10.9%) | 743 (14.0%) |
| 65 to 74 Years | 260 (21.4%) | 250 (19.2%) |
| 75 Years and over | 256 (36.6%) | 681 (43.5%) |
Disability Class by Sex by Age in Statesville
Disability Class: Hearing Difficulty
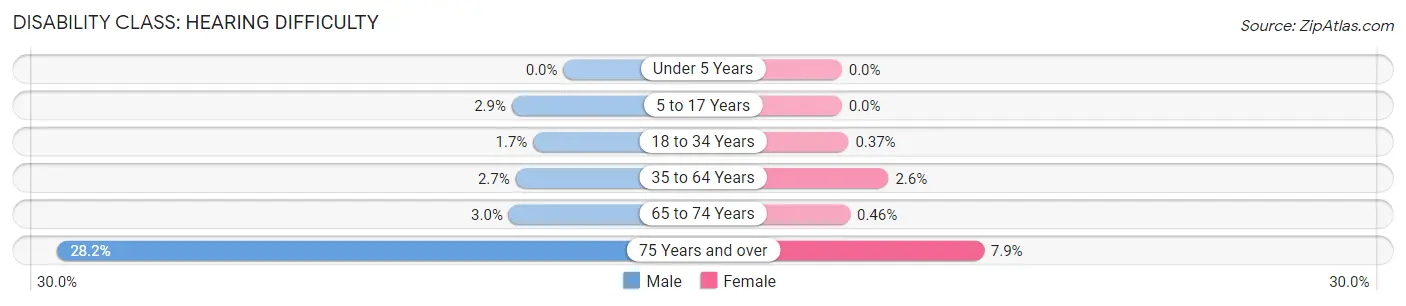
| Age Bracket | Male | Female |
| Under 5 Years | 0 (0.0%) | 0 (0.0%) |
| 5 to 17 Years | 71 (2.9%) | 0 (0.0%) |
| 18 to 34 Years | 58 (1.7%) | 11 (0.4%) |
| 35 to 64 Years | 121 (2.7%) | 138 (2.6%) |
| 65 to 74 Years | 37 (3.0%) | 6 (0.5%) |
| 75 Years and over | 197 (28.2%) | 124 (7.9%) |
Disability Class: Vision Difficulty

| Age Bracket | Male | Female |
| Under 5 Years | 0 (0.0%) | 0 (0.0%) |
| 5 to 17 Years | 46 (1.9%) | 0 (0.0%) |
| 18 to 34 Years | 13 (0.4%) | 34 (1.1%) |
| 35 to 64 Years | 41 (0.9%) | 128 (2.4%) |
| 65 to 74 Years | 47 (3.9%) | 35 (2.7%) |
| 75 Years and over | 45 (6.4%) | 107 (6.8%) |
Disability Class: Cognitive Difficulty
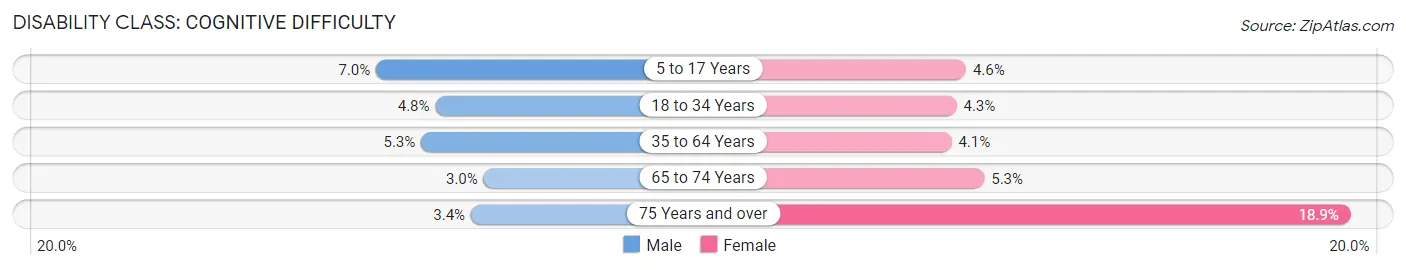
| Age Bracket | Male | Female |
| 5 to 17 Years | 172 (7.0%) | 107 (4.6%) |
| 18 to 34 Years | 164 (4.8%) | 127 (4.3%) |
| 35 to 64 Years | 240 (5.3%) | 216 (4.1%) |
| 65 to 74 Years | 36 (3.0%) | 69 (5.3%) |
| 75 Years and over | 24 (3.4%) | 296 (18.9%) |
Disability Class: Ambulatory Difficulty
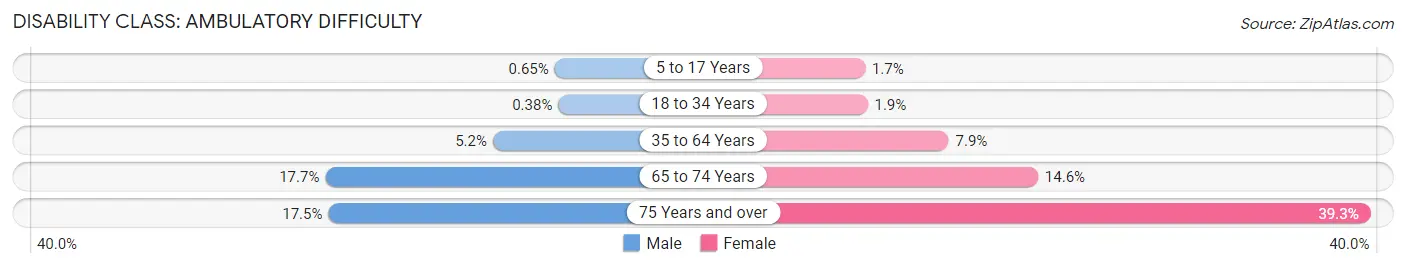
| Age Bracket | Male | Female |
| 5 to 17 Years | 16 (0.6%) | 40 (1.7%) |
| 18 to 34 Years | 13 (0.4%) | 57 (1.9%) |
| 35 to 64 Years | 238 (5.2%) | 421 (7.9%) |
| 65 to 74 Years | 215 (17.7%) | 190 (14.6%) |
| 75 Years and over | 122 (17.4%) | 615 (39.3%) |
Disability Class: Self-Care Difficulty
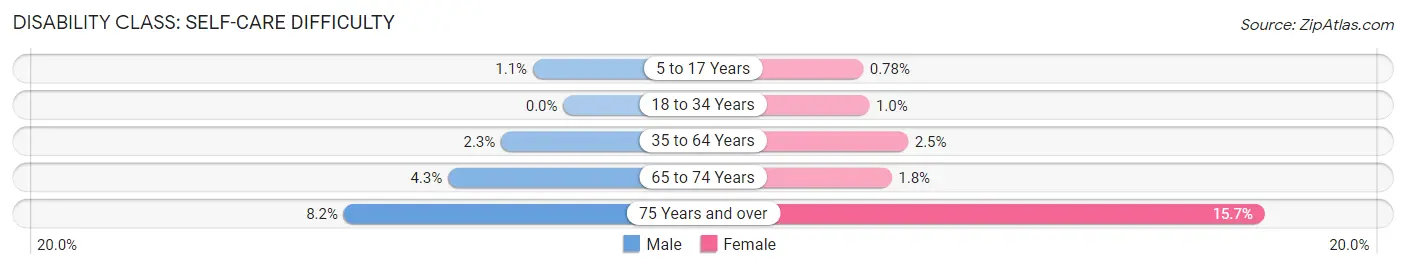
| Age Bracket | Male | Female |
| 5 to 17 Years | 28 (1.1%) | 18 (0.8%) |
| 18 to 34 Years | 0 (0.0%) | 30 (1.0%) |
| 35 to 64 Years | 105 (2.3%) | 130 (2.5%) |
| 65 to 74 Years | 52 (4.3%) | 24 (1.8%) |
| 75 Years and over | 57 (8.2%) | 246 (15.7%) |
Technology Access in Statesville
Computing Device Access in Statesville
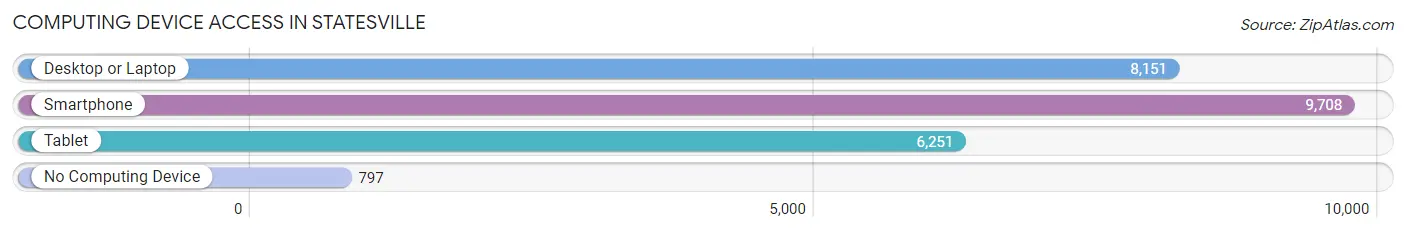
| Device Type | # Households | % Households |
| Desktop or Laptop | 8,151 | 71.5% |
| Smartphone | 9,708 | 85.2% |
| Tablet | 6,251 | 54.8% |
| No Computing Device | 797 | 7.0% |
| Total | 11,400 | 100.0% |
Internet Access in Statesville
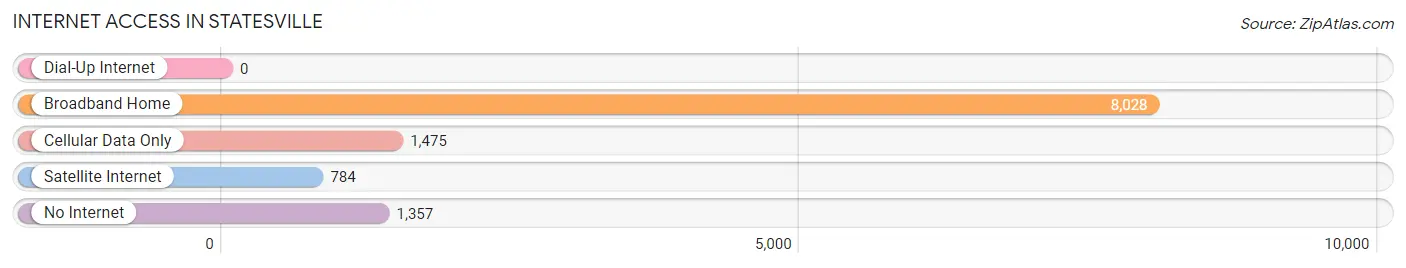
| Internet Type | # Households | % Households |
| Dial-Up Internet | 0 | 0.0% |
| Broadband Home | 8,028 | 70.4% |
| Cellular Data Only | 1,475 | 12.9% |
| Satellite Internet | 784 | 6.9% |
| No Internet | 1,357 | 11.9% |
| Total | 11,400 | 100.0% |
Statesville Summary
History
The city of Statesville, North Carolina is located in Iredell County, in the Piedmont region of the state. It is situated at the intersection of I-77 and I-40, and is the county seat of Iredell County. The city was founded in 1789 by John and William Sharpe, two brothers from Pennsylvania who had moved to the area in search of land. The city was named after the state of North Carolina, which was then known as the “State of Franklin”.
The city of Statesville was an important center of commerce and industry in the 19th century. It was home to several cotton mills, a tobacco factory, and a number of other businesses. The city was also a major railroad hub, with several lines running through it. The city was also home to a number of educational institutions, including the Statesville Female College, which was founded in 1856.
The city of Statesville experienced significant growth in the 20th century, with the population increasing from just over 5,000 in 1900 to over 25,000 by the year 2000. The city has continued to grow since then, and is now home to over 28,000 people.
Geography
The city of Statesville is located in the Piedmont region of North Carolina, in Iredell County. It is situated at the intersection of I-77 and I-40, and is about 50 miles north of Charlotte. The city is located in a hilly area, with the highest point being the summit of Statesville Mountain, which is about 1,000 feet above sea level. The city is also located near several lakes, including Lake Norman, Lake Hickory, and Lake Lookout.
The climate in Statesville is generally mild, with hot summers and cool winters. The average temperature in the summer is around 80 degrees Fahrenheit, and the average temperature in the winter is around 40 degrees Fahrenheit. The city receives an average of 44 inches of precipitation per year, with most of it falling in the form of rain.
Economy
The economy of Statesville is largely based on manufacturing and services. The city is home to several large manufacturing companies, including Moen, Inc., which produces plumbing fixtures, and Lowe’s Companies, Inc., which is a home improvement retailer. The city is also home to several other businesses, including banks, insurance companies, and medical centers.
The city of Statesville is also home to several educational institutions, including Mitchell Community College and the University of North Carolina at Charlotte. The city is also home to several parks and recreational areas, including Lake Norman State Park and the Statesville Regional Airport.
Demographics
As of the 2010 census, the population of Statesville was 28,639. The racial makeup of the city was 73.3% White, 19.2% African American, 0.4% Native American, 1.7% Asian, 0.1% Pacific Islander, and 4.3% from other races. The median household income in the city was $37,837, and the median family income was $45,945. The per capita income in the city was $20,945.
The city of Statesville is home to several churches, including the First Presbyterian Church, the Statesville Christian Church, and the Statesville United Methodist Church. The city is also home to several schools, including Statesville High School, Statesville Middle School, and Statesville Elementary School. The city is also home to several parks and recreational areas, including Lake Norman State Park and the Statesville Regional Airport.
Common Questions
What is Per Capita Income in Statesville?
Per Capita income in Statesville is $29,538.
What is the Median Family Income in Statesville?
Median Family Income in Statesville is $68,420.
What is the Median Household income in Statesville?
Median Household Income in Statesville is $51,784.
What is Income or Wage Gap in Statesville?
Income or Wage Gap in Statesville is 23.5%.
Women in Statesville earn 76.5 cents for every dollar earned by a man.
What is Family Income Deficit in Statesville?
Family Income Deficit in Statesville is $9,706.
Families that are below poverty line in Statesville earn $9,706 less on average than the poverty threshold level.
What is Inequality or Gini Index in Statesville?
Inequality or Gini Index in Statesville is 0.44.
What is the Total Population of Statesville?
Total Population of Statesville is 28,576.
What is the Total Male Population of Statesville?
Total Male Population of Statesville is 14,068.
What is the Total Female Population of Statesville?
Total Female Population of Statesville is 14,508.
What is the Ratio of Males per 100 Females in Statesville?
There are 96.97 Males per 100 Females in Statesville.
What is the Ratio of Females per 100 Males in Statesville?
There are 103.13 Females per 100 Males in Statesville.
What is the Median Population Age in Statesville?
Median Population Age in Statesville is 38.3 Years.
What is the Average Family Size in Statesville
Average Family Size in Statesville is 3.1 People.
What is the Average Household Size in Statesville
Average Household Size in Statesville is 2.4 People.
How Large is the Labor Force in Statesville?
There are 14,576 People in the Labor Forcein in Statesville.
What is the Percentage of People in the Labor Force in Statesville?
64.3% of People are in the Labor Force in Statesville.
What is the Unemployment Rate in Statesville?
Unemployment Rate in Statesville is 7.2%.