Lumberton, NC Map & Demographics
Lumberton Map
Lumberton Overview
$23,858
PER CAPITA INCOME
$53,468
AVG FAMILY INCOME
$41,314
AVG HOUSEHOLD INCOME
23.5%
WAGE / INCOME GAP [ % ]
76.5¢/ $1
WAGE / INCOME GAP [ $ ]
$11,231
FAMILY INCOME DEFICIT
0.52
INEQUALITY / GINI INDEX
19,099
TOTAL POPULATION
9,135
MALE POPULATION
9,964
FEMALE POPULATION
91.68
MALES / 100 FEMALES
109.07
FEMALES / 100 MALES
37.2
MEDIAN AGE
3.4
AVG FAMILY SIZE
2.5
AVG HOUSEHOLD SIZE
7,227
LABOR FORCE [ PEOPLE ]
49.5%
PERCENT IN LABOR FORCE
6.7%
UNEMPLOYMENT RATE
Lumberton Area Codes
Income in Lumberton
Income Overview in Lumberton
Per Capita Income in Lumberton is $23,858, while median incomes of families and households are $53,468 and $41,314 respectively.
| Characteristic | Number | Measure |
| Per Capita Income | 19,099 | $23,858 |
| Median Family Income | 4,149 | $53,468 |
| Mean Family Income | 4,149 | $76,673 |
| Median Household Income | 6,947 | $41,314 |
| Mean Household Income | 6,947 | $61,002 |
| Income Deficit | 4,149 | $11,231 |
| Wage / Income Gap (%) | 19,099 | 23.48% |
| Wage / Income Gap ($) | 19,099 | 76.52¢ per $1 |
| Gini / Inequality Index | 19,099 | 0.52 |
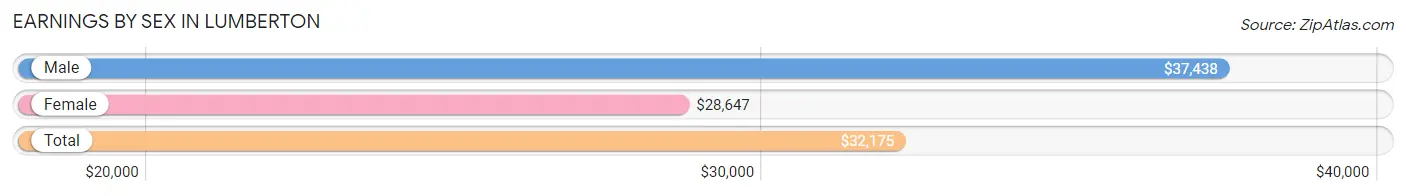
Earnings by Sex in Lumberton
Average Earnings in Lumberton are $32,175, $37,438 for men and $28,647 for women, a difference of 23.5%.
| Sex | Number | Average Earnings |
| Male | 3,599 (48.0%) | $37,438 |
| Female | 3,898 (52.0%) | $28,647 |
| Total | 7,497 (100.0%) | $32,175 |
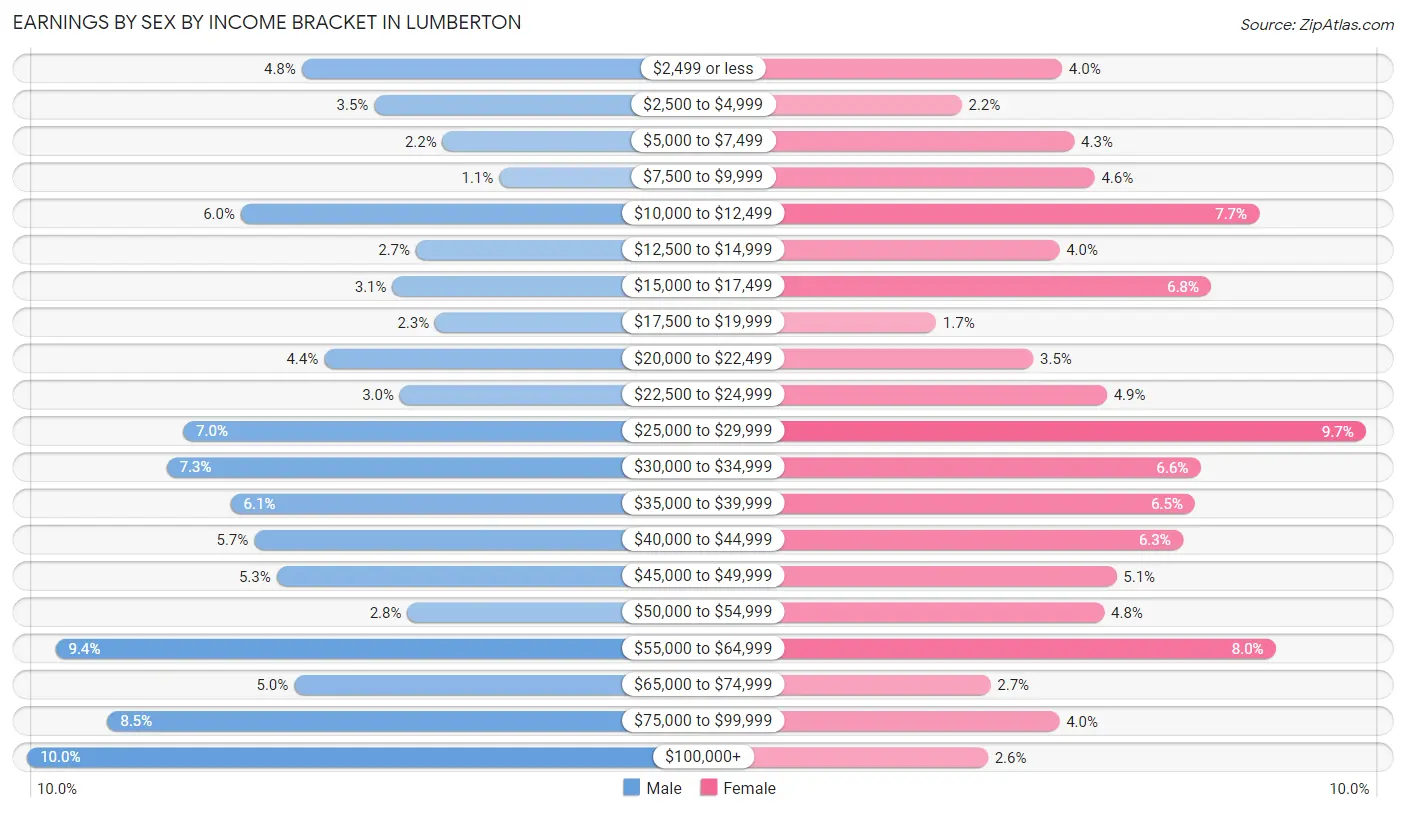
Earnings by Sex by Income Bracket in Lumberton
The most common earnings brackets in Lumberton are $100,000+ for men (358 | 10.0%) and $25,000 to $29,999 for women (379 | 9.7%).
| Income | Male | Female |
| $2,499 or less | 173 (4.8%) | 157 (4.0%) |
| $2,500 to $4,999 | 124 (3.5%) | 84 (2.1%) |
| $5,000 to $7,499 | 78 (2.2%) | 166 (4.3%) |
| $7,500 to $9,999 | 40 (1.1%) | 181 (4.6%) |
| $10,000 to $12,499 | 214 (5.9%) | 301 (7.7%) |
| $12,500 to $14,999 | 96 (2.7%) | 155 (4.0%) |
| $15,000 to $17,499 | 112 (3.1%) | 266 (6.8%) |
| $17,500 to $19,999 | 83 (2.3%) | 65 (1.7%) |
| $20,000 to $22,499 | 158 (4.4%) | 136 (3.5%) |
| $22,500 to $24,999 | 107 (3.0%) | 190 (4.9%) |
| $25,000 to $29,999 | 253 (7.0%) | 379 (9.7%) |
| $30,000 to $34,999 | 264 (7.3%) | 258 (6.6%) |
| $35,000 to $39,999 | 221 (6.1%) | 254 (6.5%) |
| $40,000 to $44,999 | 205 (5.7%) | 245 (6.3%) |
| $45,000 to $49,999 | 190 (5.3%) | 197 (5.1%) |
| $50,000 to $54,999 | 102 (2.8%) | 188 (4.8%) |
| $55,000 to $64,999 | 339 (9.4%) | 313 (8.0%) |
| $65,000 to $74,999 | 178 (5.0%) | 105 (2.7%) |
| $75,000 to $99,999 | 304 (8.5%) | 155 (4.0%) |
| $100,000+ | 358 (10.0%) | 103 (2.6%) |
| Total | 3,599 (100.0%) | 3,898 (100.0%) |
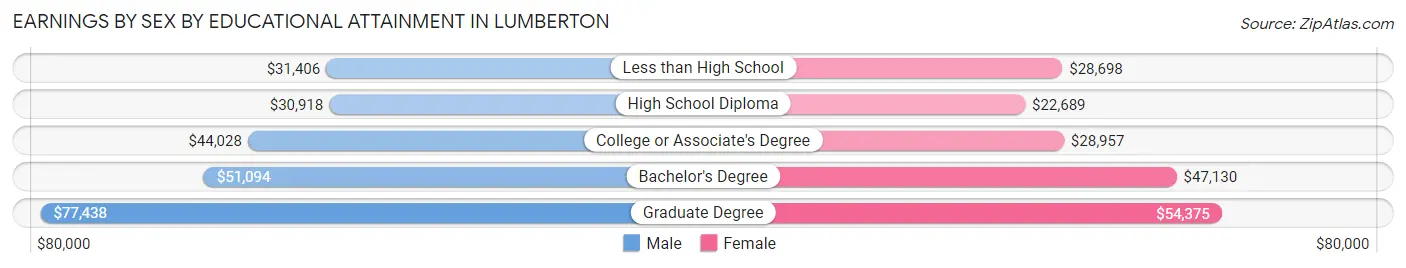
Earnings by Sex by Educational Attainment in Lumberton
Average earnings in Lumberton are $41,915 for men and $31,384 for women, a difference of 25.1%. Men with an educational attainment of graduate degree enjoy the highest average annual earnings of $77,438, while those with high school diploma education earn the least with $30,918. Women with an educational attainment of graduate degree earn the most with the average annual earnings of $54,375, while those with high school diploma education have the smallest earnings of $22,689.
| Educational Attainment | Male Income | Female Income |
| Less than High School | $31,406 | $28,698 |
| High School Diploma | $30,918 | $22,689 |
| College or Associate's Degree | $44,028 | $28,957 |
| Bachelor's Degree | $51,094 | $47,130 |
| Graduate Degree | $77,438 | $54,375 |
| Total | $41,915 | $31,384 |
Family Income in Lumberton
Family Income Brackets in Lumberton
According to the Lumberton family income data, there are 768 families falling into the $50,000 to $74,999 income range, which is the most common income bracket and makes up 18.5% of all families. Conversely, the $200,000+ income bracket is the least frequent group with only 212 families (5.1%) belonging to this category.
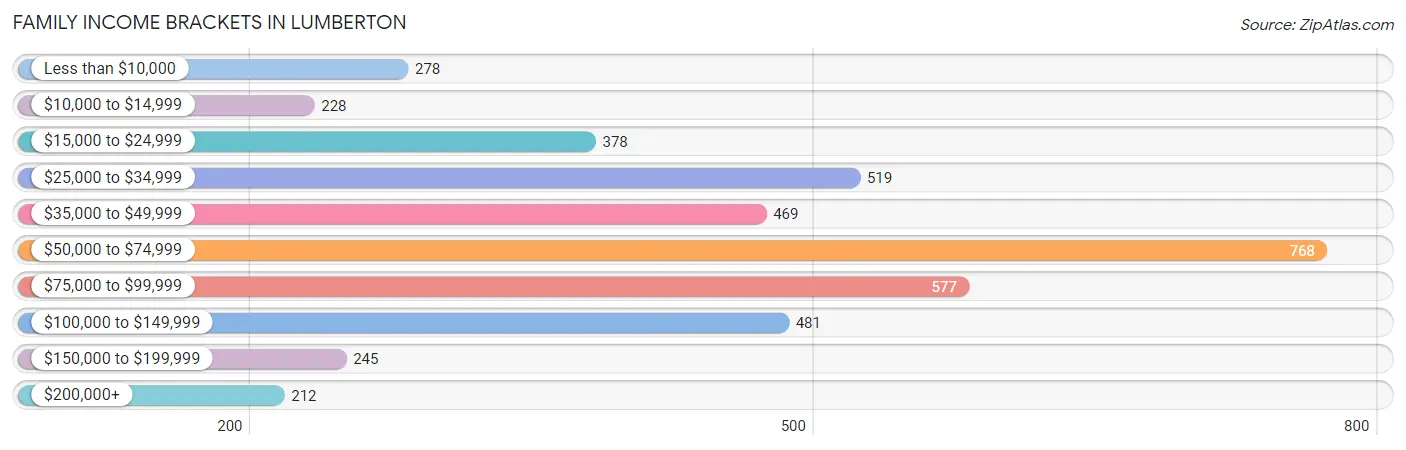
| Income Bracket | # Families | % Families |
| Less than $10,000 | 278 | 6.7% |
| $10,000 to $14,999 | 228 | 5.5% |
| $15,000 to $24,999 | 378 | 9.1% |
| $25,000 to $34,999 | 519 | 12.5% |
| $35,000 to $49,999 | 469 | 11.3% |
| $50,000 to $74,999 | 768 | 18.5% |
| $75,000 to $99,999 | 577 | 13.9% |
| $100,000 to $149,999 | 481 | 11.6% |
| $150,000 to $199,999 | 245 | 5.9% |
| $200,000+ | 212 | 5.1% |
Family Income by Famaliy Size in Lumberton
4-person families (626 | 15.1%) account for the highest median family income in Lumberton with $83,864 per family, while 2-person families (2,065 | 49.8%) have the highest median income of $25,594 per family member.
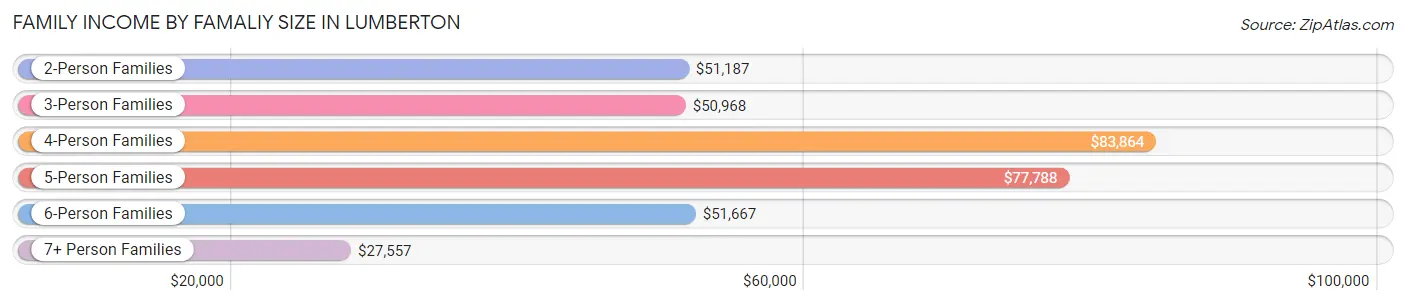
| Income Bracket | # Families | Median Income |
| 2-Person Families | 2,065 (49.8%) | $51,187 |
| 3-Person Families | 940 (22.7%) | $50,968 |
| 4-Person Families | 626 (15.1%) | $83,864 |
| 5-Person Families | 271 (6.5%) | $77,788 |
| 6-Person Families | 134 (3.2%) | $51,667 |
| 7+ Person Families | 113 (2.7%) | $27,557 |
| Total | 4,149 (100.0%) | $53,468 |
Family Income by Number of Earners in Lumberton
The median family income in Lumberton is $53,468, with families comprising 3+ earners (211) having the highest median family income of $133,073, while families with no earners (859) have the lowest median family income of $25,304, accounting for 5.1% and 20.7% of families, respectively.
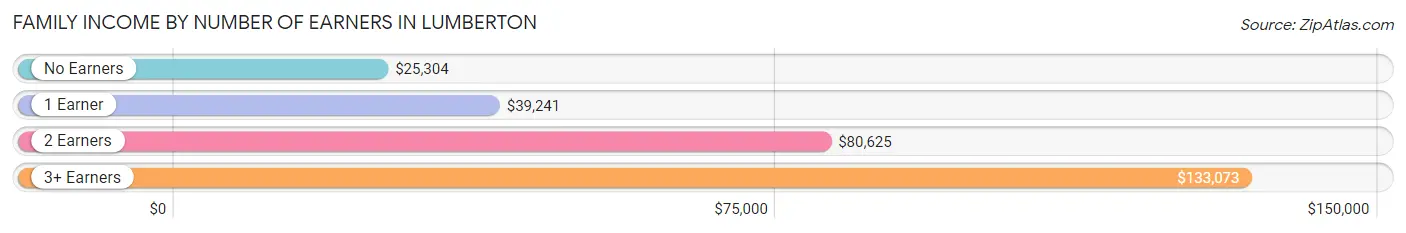
| Number of Earners | # Families | Median Income |
| No Earners | 859 (20.7%) | $25,304 |
| 1 Earner | 1,651 (39.8%) | $39,241 |
| 2 Earners | 1,428 (34.4%) | $80,625 |
| 3+ Earners | 211 (5.1%) | $133,073 |
| Total | 4,149 (100.0%) | $53,468 |
Household Income in Lumberton
Household Income Brackets in Lumberton
With 1,250 households falling in the category, the $50,000 to $74,999 income range is the most frequent in Lumberton, accounting for 18.0% of all households. In contrast, only 229 households (3.3%) fall into the $200,000+ income bracket, making it the least populous group.
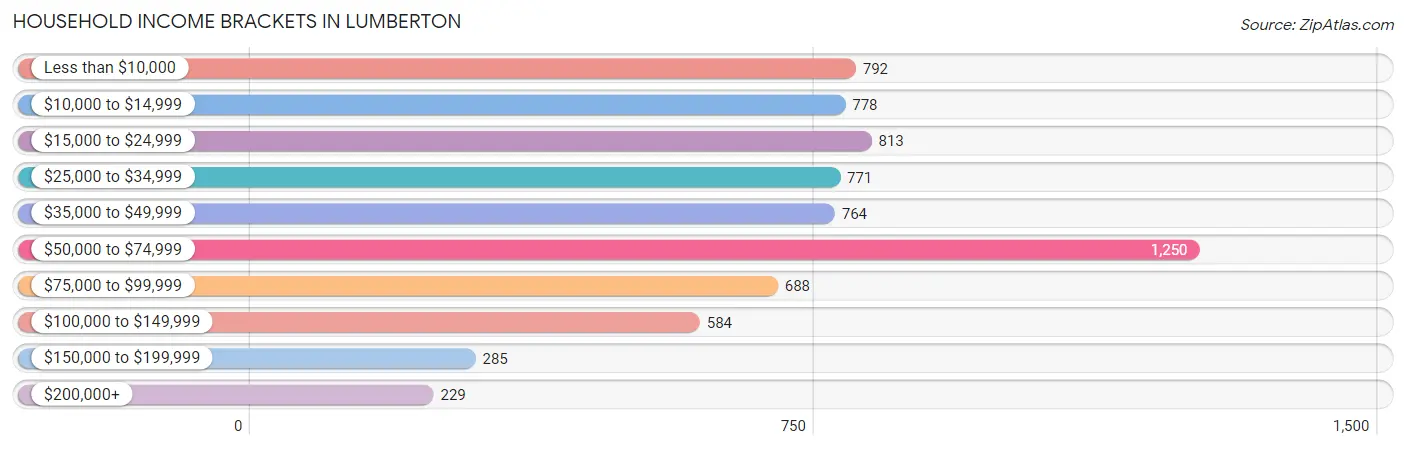
| Income Bracket | # Households | % Households |
| Less than $10,000 | 792 | 11.4% |
| $10,000 to $14,999 | 778 | 11.2% |
| $15,000 to $24,999 | 813 | 11.7% |
| $25,000 to $34,999 | 771 | 11.1% |
| $35,000 to $49,999 | 764 | 11.0% |
| $50,000 to $74,999 | 1,250 | 18.0% |
| $75,000 to $99,999 | 688 | 9.9% |
| $100,000 to $149,999 | 584 | 8.4% |
| $150,000 to $199,999 | 285 | 4.1% |
| $200,000+ | 229 | 3.3% |
Household Income by Householder Age in Lumberton
The median household income in Lumberton is $41,314, with the highest median household income of $52,015 found in the 45 to 64 years age bracket for the primary householder. A total of 2,494 households (35.9%) fall into this category. Meanwhile, the 15 to 24 years age bracket for the primary householder has the lowest median household income of $27,667, with 252 households (3.6%) in this group.
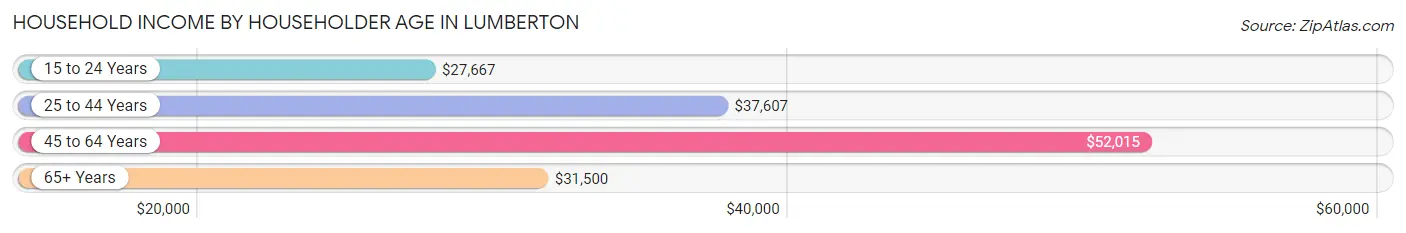
| Income Bracket | # Households | Median Income |
| 15 to 24 Years | 252 (3.6%) | $27,667 |
| 25 to 44 Years | 2,197 (31.6%) | $37,607 |
| 45 to 64 Years | 2,494 (35.9%) | $52,015 |
| 65+ Years | 2,004 (28.8%) | $31,500 |
| Total | 6,947 (100.0%) | $41,314 |
Poverty in Lumberton
Income Below Poverty by Sex and Age in Lumberton
With 26.1% poverty level for males and 32.2% for females among the residents of Lumberton, 5 year old males and 18 to 24 year old females are the most vulnerable to poverty, with 115 males (67.2%) and 366 females (51.5%) in their respective age groups living below the poverty level.
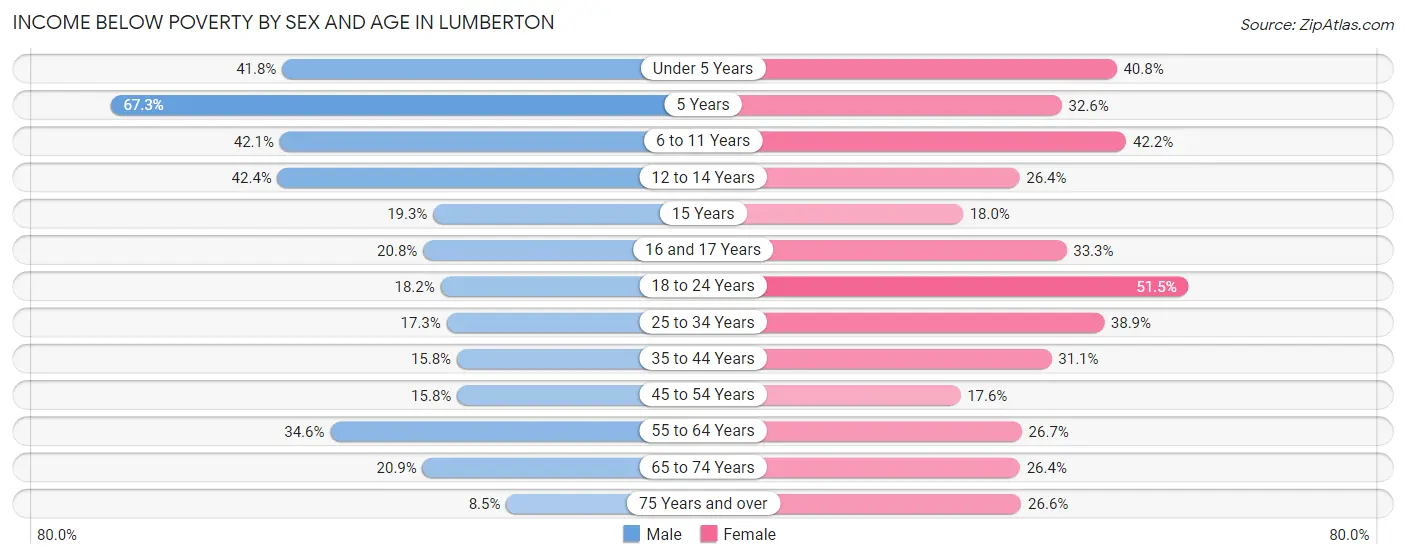
| Age Bracket | Male | Female |
| Under 5 Years | 291 (41.7%) | 321 (40.8%) |
| 5 Years | 115 (67.2%) | 31 (32.6%) |
| 6 to 11 Years | 440 (42.1%) | 279 (42.2%) |
| 12 to 14 Years | 98 (42.4%) | 140 (26.4%) |
| 15 Years | 23 (19.3%) | 28 (17.9%) |
| 16 and 17 Years | 56 (20.8%) | 87 (33.3%) |
| 18 to 24 Years | 118 (18.2%) | 366 (51.5%) |
| 25 to 34 Years | 188 (17.3%) | 526 (38.9%) |
| 35 to 44 Years | 128 (15.8%) | 357 (31.1%) |
| 45 to 54 Years | 161 (15.8%) | 167 (17.6%) |
| 55 to 64 Years | 318 (34.6%) | 317 (26.7%) |
| 65 to 74 Years | 125 (20.9%) | 256 (26.4%) |
| 75 Years and over | 37 (8.5%) | 208 (26.6%) |
| Total | 2,098 (26.1%) | 3,083 (32.2%) |
Income Above Poverty by Sex and Age in Lumberton
According to the poverty statistics in Lumberton, males aged 75 years and over and females aged 45 to 54 years are the age groups that are most secure financially, with 91.5% of males and 82.4% of females in these age groups living above the poverty line.
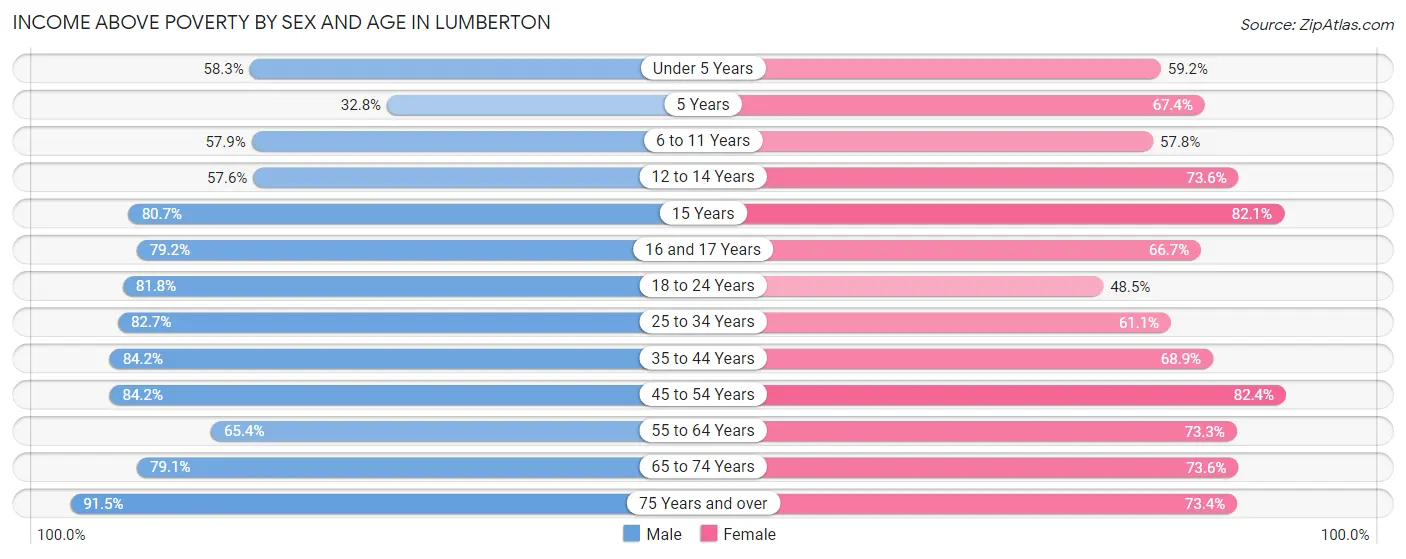
| Age Bracket | Male | Female |
| Under 5 Years | 406 (58.3%) | 466 (59.2%) |
| 5 Years | 56 (32.8%) | 64 (67.4%) |
| 6 to 11 Years | 605 (57.9%) | 382 (57.8%) |
| 12 to 14 Years | 133 (57.6%) | 391 (73.6%) |
| 15 Years | 96 (80.7%) | 128 (82.1%) |
| 16 and 17 Years | 213 (79.2%) | 174 (66.7%) |
| 18 to 24 Years | 529 (81.8%) | 345 (48.5%) |
| 25 to 34 Years | 896 (82.7%) | 826 (61.1%) |
| 35 to 44 Years | 682 (84.2%) | 790 (68.9%) |
| 45 to 54 Years | 860 (84.2%) | 783 (82.4%) |
| 55 to 64 Years | 601 (65.4%) | 870 (73.3%) |
| 65 to 74 Years | 473 (79.1%) | 713 (73.6%) |
| 75 Years and over | 400 (91.5%) | 573 (73.4%) |
| Total | 5,950 (73.9%) | 6,505 (67.8%) |
Income Below Poverty Among Married-Couple Families in Lumberton
The poverty statistics for married-couple families in Lumberton show that 10.3% or 217 of the total 2,096 families live below the poverty line. Families with 5 or more children have the highest poverty rate of 100.0%, comprising of 20 families. On the other hand, families with no children have the lowest poverty rate of 5.5%, which includes 62 families.
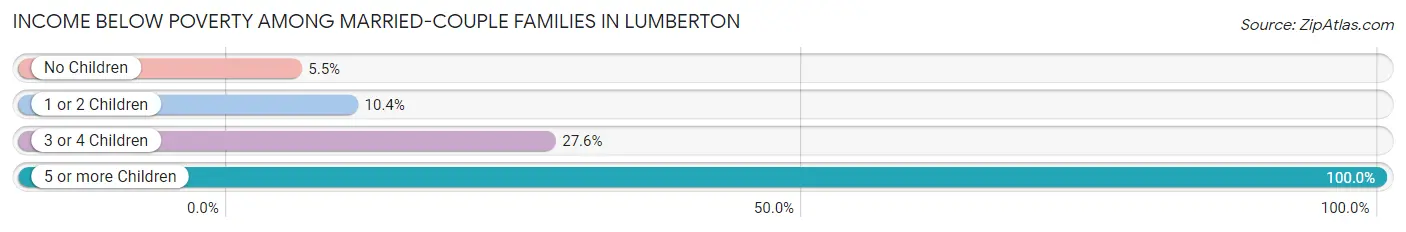
| Children | Above Poverty | Below Poverty |
| No Children | 1,064 (94.5%) | 62 (5.5%) |
| 1 or 2 Children | 663 (89.6%) | 77 (10.4%) |
| 3 or 4 Children | 152 (72.4%) | 58 (27.6%) |
| 5 or more Children | 0 (0.0%) | 20 (100.0%) |
| Total | 1,879 (89.6%) | 217 (10.3%) |
Income Below Poverty Among Single-Parent Households in Lumberton
According to the poverty data in Lumberton, 14.9% or 50 single-father households and 38.2% or 656 single-mother households are living below the poverty line. Among single-father households, those with 5 or more children have the highest poverty rate, with 15 households (100.0%) experiencing poverty. Likewise, among single-mother households, those with 5 or more children have the highest poverty rate, with 86 households (100.0%) falling below the poverty line.
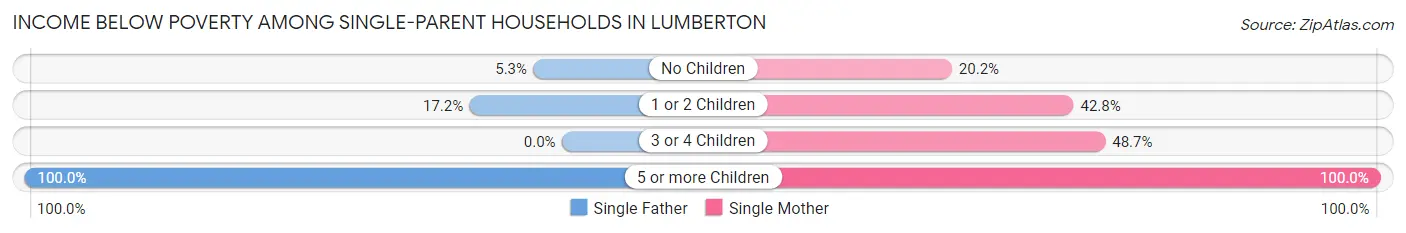
| Children | Single Father | Single Mother |
| No Children | 9 (5.3%) | 123 (20.2%) |
| 1 or 2 Children | 26 (17.2%) | 370 (42.8%) |
| 3 or 4 Children | 0 (0.0%) | 77 (48.7%) |
| 5 or more Children | 15 (100.0%) | 86 (100.0%) |
| Total | 50 (14.9%) | 656 (38.2%) |
Income Below Poverty Among Married-Couple vs Single-Parent Households in Lumberton
The poverty data for Lumberton shows that 217 of the married-couple family households (10.3%) and 706 of the single-parent households (34.4%) are living below the poverty level. Within the married-couple family households, those with 5 or more children have the highest poverty rate, with 20 households (100.0%) falling below the poverty line. Among the single-parent households, those with 5 or more children have the highest poverty rate, with 101 household (100.0%) living below poverty.
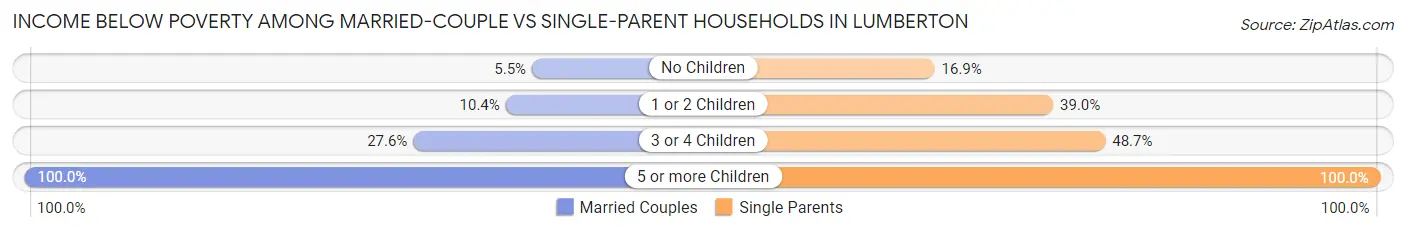
| Children | Married-Couple Families | Single-Parent Households |
| No Children | 62 (5.5%) | 132 (16.9%) |
| 1 or 2 Children | 77 (10.4%) | 396 (39.0%) |
| 3 or 4 Children | 58 (27.6%) | 77 (48.7%) |
| 5 or more Children | 20 (100.0%) | 101 (100.0%) |
| Total | 217 (10.3%) | 706 (34.4%) |
Race in Lumberton
The most populous races in Lumberton are White / Caucasian (7,355 | 38.5%), Black / African American (6,989 | 36.6%), and Native / Alaskan (2,470 | 12.9%).
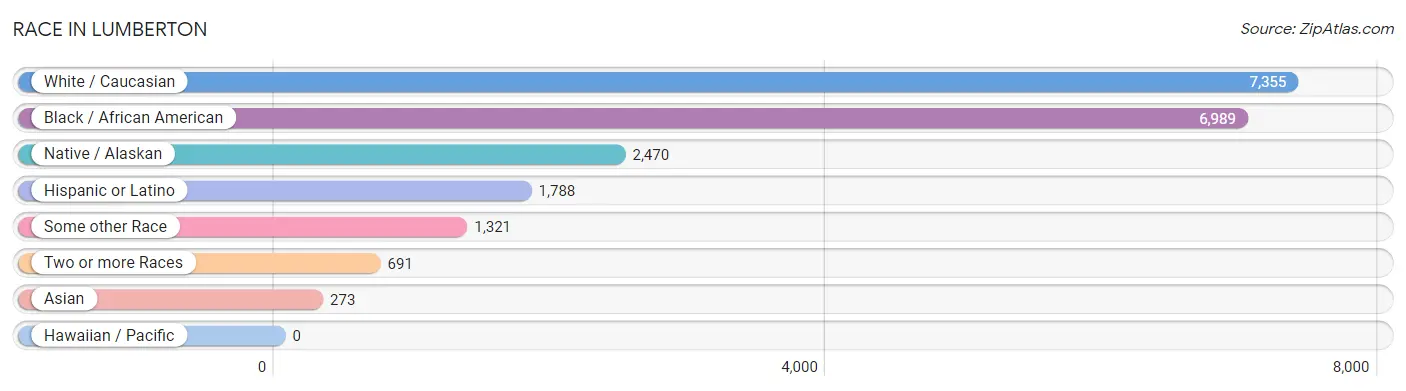
| Race | # Population | % Population |
| Asian | 273 | 1.4% |
| Black / African American | 6,989 | 36.6% |
| Hawaiian / Pacific | 0 | 0.0% |
| Hispanic or Latino | 1,788 | 9.4% |
| Native / Alaskan | 2,470 | 12.9% |
| White / Caucasian | 7,355 | 38.5% |
| Two or more Races | 691 | 3.6% |
| Some other Race | 1,321 | 6.9% |
| Total | 19,099 | 100.0% |
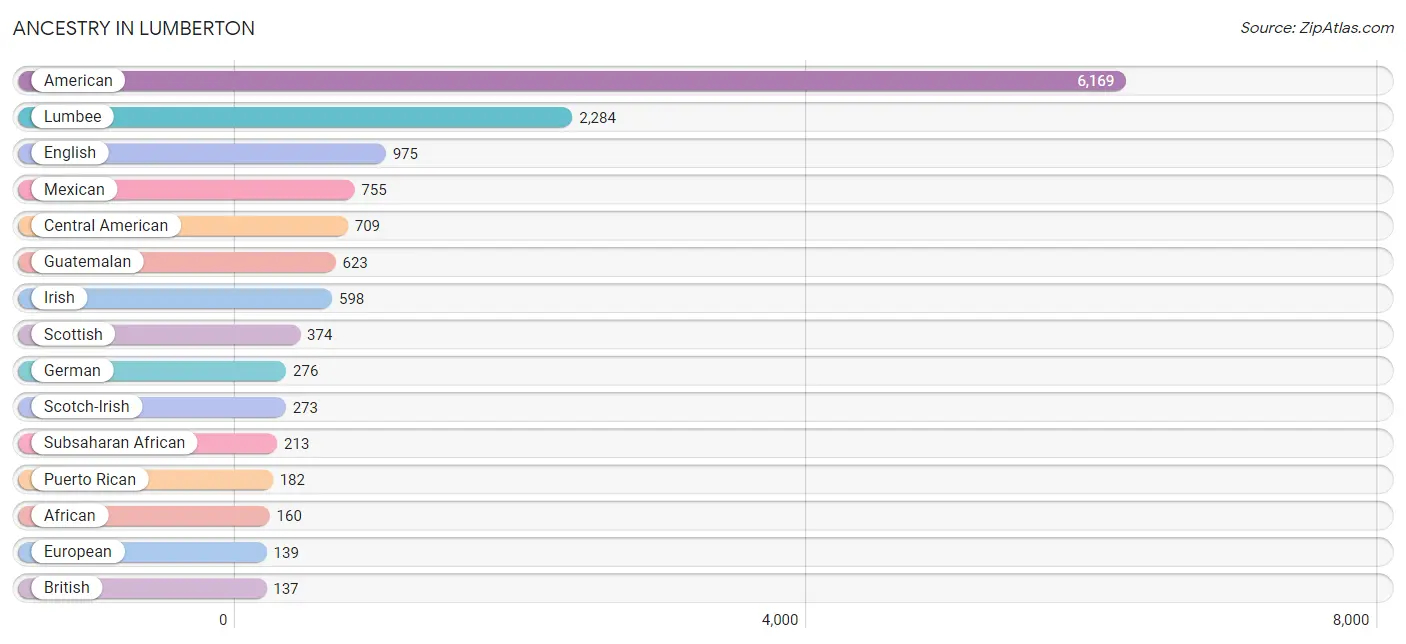
Ancestry in Lumberton
The most populous ancestries reported in Lumberton are American (6,169 | 32.3%), Lumbee (2,284 | 12.0%), English (975 | 5.1%), Mexican (755 | 4.0%), and Central American (709 | 3.7%), together accounting for 57.0% of all Lumberton residents.
| Ancestry | # Population | % Population |
| African | 160 | 0.8% |
| American | 6,169 | 32.3% |
| Austrian | 6 | 0.0% |
| Bhutanese | 3 | 0.0% |
| British | 137 | 0.7% |
| Burmese | 49 | 0.3% |
| Canadian | 5 | 0.0% |
| Central American | 709 | 3.7% |
| Cherokee | 23 | 0.1% |
| Chippewa | 9 | 0.1% |
| Colombian | 2 | 0.0% |
| Czechoslovakian | 21 | 0.1% |
| Danish | 5 | 0.0% |
| Dominican | 5 | 0.0% |
| Dutch | 4 | 0.0% |
| Eastern European | 20 | 0.1% |
| English | 975 | 5.1% |
| Ethiopian | 9 | 0.1% |
| European | 139 | 0.7% |
| French | 95 | 0.5% |
| French Canadian | 47 | 0.3% |
| German | 276 | 1.5% |
| Guatemalan | 623 | 3.3% |
| Haitian | 83 | 0.4% |
| Honduran | 74 | 0.4% |
| Hungarian | 24 | 0.1% |
| Indian (Asian) | 41 | 0.2% |
| Irish | 598 | 3.1% |
| Iroquois | 5 | 0.0% |
| Israeli | 6 | 0.0% |
| Italian | 125 | 0.6% |
| Jamaican | 19 | 0.1% |
| Korean | 113 | 0.6% |
| Lumbee | 2,284 | 12.0% |
| Mexican | 755 | 4.0% |
| Mexican American Indian | 10 | 0.1% |
| Native Hawaiian | 1 | 0.0% |
| Navajo | 27 | 0.1% |
| Nigerian | 34 | 0.2% |
| Norwegian | 33 | 0.2% |
| Peruvian | 12 | 0.1% |
| Polish | 81 | 0.4% |
| Puerto Rican | 182 | 0.9% |
| Salvadoran | 12 | 0.1% |
| Samoan | 17 | 0.1% |
| Scandinavian | 74 | 0.4% |
| Scotch-Irish | 273 | 1.4% |
| Scottish | 374 | 2.0% |
| South American | 14 | 0.1% |
| Spaniard | 61 | 0.3% |
| Sri Lankan | 41 | 0.2% |
| Subsaharan African | 213 | 1.1% |
| Sudanese | 10 | 0.1% |
| Swedish | 9 | 0.1% |
| Swiss | 9 | 0.1% |
| Thai | 53 | 0.3% |
| Ukrainian | 59 | 0.3% |
| Welsh | 26 | 0.1% | View All 58 Rows |
Immigrants in Lumberton
The most numerous immigrant groups reported in Lumberton came from Latin America (864 | 4.5%), Central America (660 | 3.5%), Guatemala (401 | 2.1%), Asia (258 | 1.3%), and Mexico (239 | 1.3%), together accounting for 12.7% of all Lumberton residents.
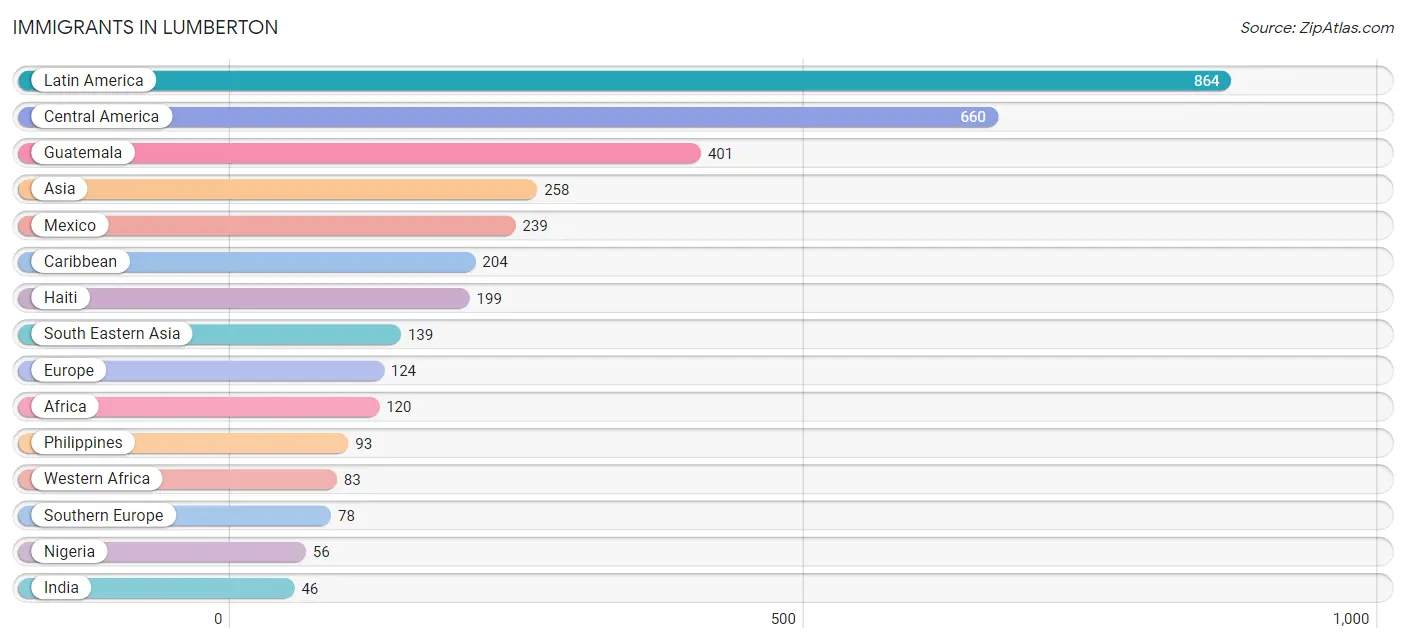
| Immigration Origin | # Population | % Population |
| Africa | 120 | 0.6% |
| Asia | 258 | 1.3% |
| Canada | 5 | 0.0% |
| Caribbean | 204 | 1.1% |
| Central America | 660 | 3.5% |
| China | 41 | 0.2% |
| Dominican Republic | 5 | 0.0% |
| Eastern Africa | 26 | 0.1% |
| Eastern Asia | 41 | 0.2% |
| Eastern Europe | 7 | 0.0% |
| Egypt | 11 | 0.1% |
| Ethiopia | 9 | 0.1% |
| Europe | 124 | 0.6% |
| Germany | 39 | 0.2% |
| Guatemala | 401 | 2.1% |
| Haiti | 199 | 1.0% |
| Honduras | 20 | 0.1% |
| India | 46 | 0.2% |
| Kenya | 7 | 0.0% |
| Latin America | 864 | 4.5% |
| Malaysia | 5 | 0.0% |
| Mexico | 239 | 1.3% |
| Nigeria | 56 | 0.3% |
| Northern Africa | 11 | 0.1% |
| Philippines | 93 | 0.5% |
| Senegal | 27 | 0.1% |
| South Central Asia | 46 | 0.2% |
| South Eastern Asia | 139 | 0.7% |
| Southern Europe | 78 | 0.4% |
| Spain | 36 | 0.2% |
| Ukraine | 7 | 0.0% |
| Vietnam | 41 | 0.2% |
| Western Africa | 83 | 0.4% |
| Western Asia | 32 | 0.2% |
| Western Europe | 39 | 0.2% |
| Yemen | 32 | 0.2% | View All 36 Rows |
Sex and Age in Lumberton
Sex and Age in Lumberton
The most populous age groups in Lumberton are 5 to 9 Years (833 | 9.1%) for men and Under 5 Years (791 | 7.9%) for women.
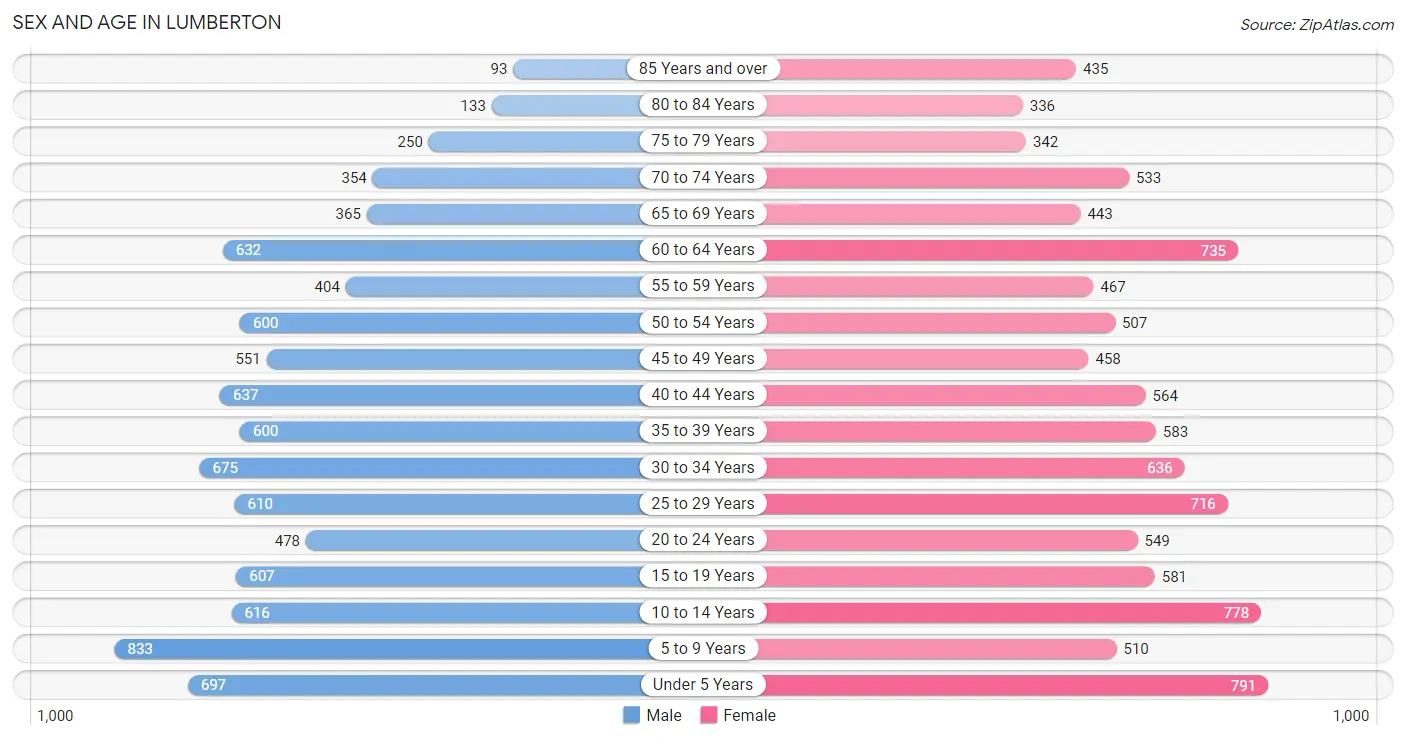
| Age Bracket | Male | Female |
| Under 5 Years | 697 (7.6%) | 791 (7.9%) |
| 5 to 9 Years | 833 (9.1%) | 510 (5.1%) |
| 10 to 14 Years | 616 (6.7%) | 778 (7.8%) |
| 15 to 19 Years | 607 (6.6%) | 581 (5.8%) |
| 20 to 24 Years | 478 (5.2%) | 549 (5.5%) |
| 25 to 29 Years | 610 (6.7%) | 716 (7.2%) |
| 30 to 34 Years | 675 (7.4%) | 636 (6.4%) |
| 35 to 39 Years | 600 (6.6%) | 583 (5.9%) |
| 40 to 44 Years | 637 (7.0%) | 564 (5.7%) |
| 45 to 49 Years | 551 (6.0%) | 458 (4.6%) |
| 50 to 54 Years | 600 (6.6%) | 507 (5.1%) |
| 55 to 59 Years | 404 (4.4%) | 467 (4.7%) |
| 60 to 64 Years | 632 (6.9%) | 735 (7.4%) |
| 65 to 69 Years | 365 (4.0%) | 443 (4.4%) |
| 70 to 74 Years | 354 (3.9%) | 533 (5.3%) |
| 75 to 79 Years | 250 (2.7%) | 342 (3.4%) |
| 80 to 84 Years | 133 (1.5%) | 336 (3.4%) |
| 85 Years and over | 93 (1.0%) | 435 (4.4%) |
| Total | 9,135 (100.0%) | 9,964 (100.0%) |
Families and Households in Lumberton
Median Family Size in Lumberton
The median family size in Lumberton is 3.36 persons per family, with single male/father families (335 | 8.1%) accounting for the largest median family size of 3.46 persons per family. On the other hand, married-couple families (2,096 | 50.5%) represent the smallest median family size with 3.32 persons per family.
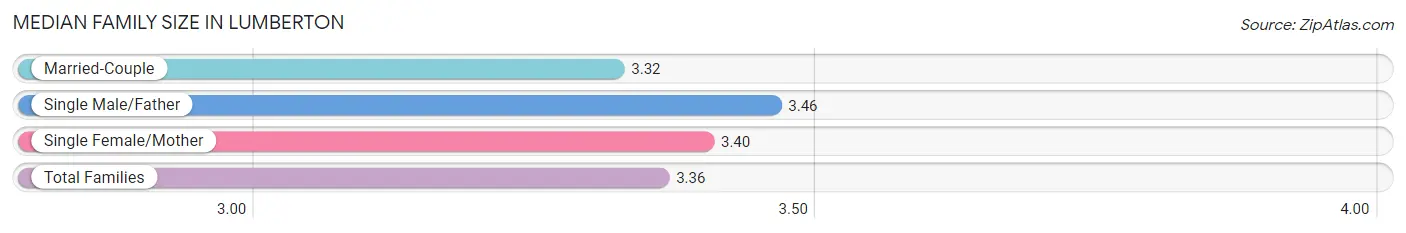
| Family Type | # Families | Family Size |
| Married-Couple | 2,096 (50.5%) | 3.32 |
| Single Male/Father | 335 (8.1%) | 3.46 |
| Single Female/Mother | 1,718 (41.4%) | 3.40 |
| Total Families | 4,149 (100.0%) | 3.36 |
Median Household Size in Lumberton
The median household size in Lumberton is 2.53 persons per household, with single male/father households (335 | 4.8%) accounting for the largest median household size of 3.82 persons per household. non-family households (2,798 | 40.3%) represent the smallest median household size with 1.15 persons per household.
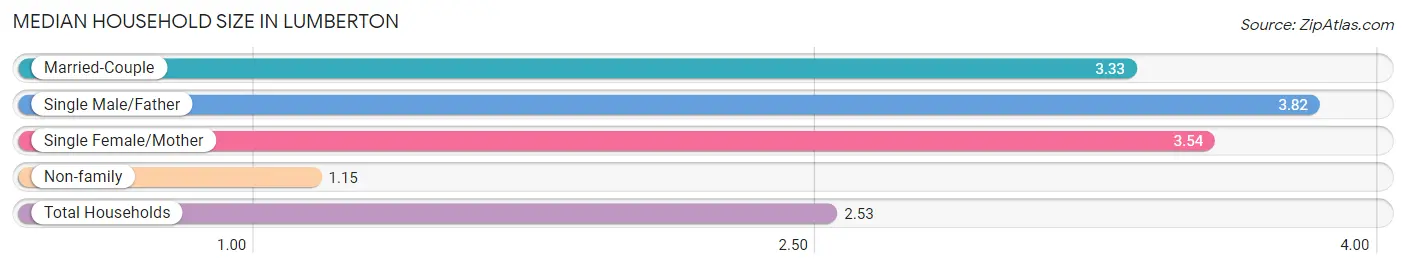
| Household Type | # Households | Household Size |
| Married-Couple | 2,096 (30.2%) | 3.33 |
| Single Male/Father | 335 (4.8%) | 3.82 |
| Single Female/Mother | 1,718 (24.7%) | 3.54 |
| Non-family | 2,798 (40.3%) | 1.15 |
| Total Households | 6,947 (100.0%) | 2.53 |
Household Size by Marriage Status in Lumberton
Out of a total of 6,947 households in Lumberton, 4,149 (59.7%) are family households, while 2,798 (40.3%) are nonfamily households. The most numerous type of family households are 2-person households, comprising 1,878, and the most common type of nonfamily households are 1-person households, comprising 2,503.
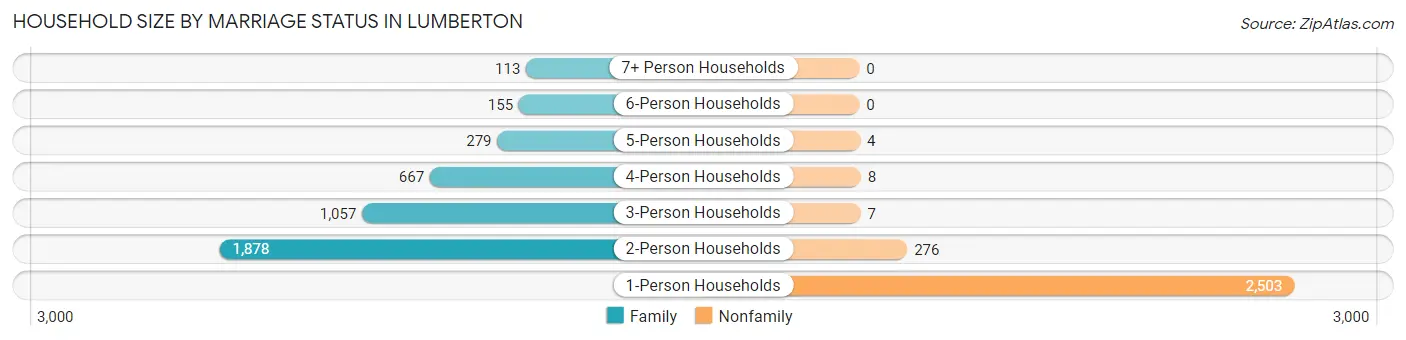
| Household Size | Family Households | Nonfamily Households |
| 1-Person Households | - | 2,503 (36.0%) |
| 2-Person Households | 1,878 (27.0%) | 276 (4.0%) |
| 3-Person Households | 1,057 (15.2%) | 7 (0.1%) |
| 4-Person Households | 667 (9.6%) | 8 (0.1%) |
| 5-Person Households | 279 (4.0%) | 4 (0.1%) |
| 6-Person Households | 155 (2.2%) | 0 (0.0%) |
| 7+ Person Households | 113 (1.6%) | 0 (0.0%) |
| Total | 4,149 (59.7%) | 2,798 (40.3%) |
Female Fertility in Lumberton
Fertility by Age in Lumberton
Average fertility rate in Lumberton is 62.0 births per 1,000 women. Women in the age bracket of 20 to 34 years have the highest fertility rate with 120.0 births per 1,000 women. Women in the age bracket of 20 to 34 years acount for 89.8% of all women with births.
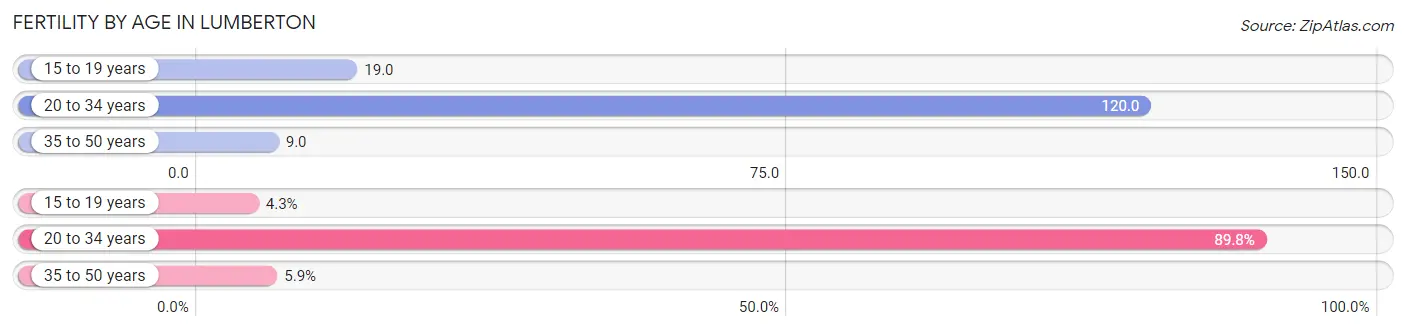
| Age Bracket | Women with Births | Births / 1,000 Women |
| 15 to 19 years | 11 (4.3%) | 19.0 |
| 20 to 34 years | 229 (89.8%) | 120.0 |
| 35 to 50 years | 15 (5.9%) | 9.0 |
| Total | 255 (100.0%) | 62.0 |
Fertility by Age by Marriage Status in Lumberton
43.9% of women with births (255) in Lumberton are married. The highest percentage of unmarried women with births falls into 15 to 19 years age bracket with 100.0% of them unmarried at the time of birth, while the lowest percentage of unmarried women with births belong to 35 to 50 years age bracket with 46.7% of them unmarried.
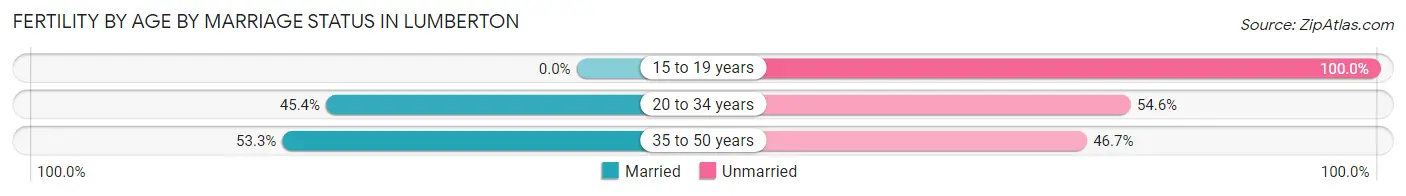
| Age Bracket | Married | Unmarried |
| 15 to 19 years | 0 (0.0%) | 11 (100.0%) |
| 20 to 34 years | 104 (45.4%) | 125 (54.6%) |
| 35 to 50 years | 8 (53.3%) | 7 (46.7%) |
| Total | 112 (43.9%) | 143 (56.1%) |
Fertility by Education in Lumberton
Average fertility rate in Lumberton is 62.0 births per 1,000 women. Women with the education attainment of bachelor's degree have the highest fertility rate of 79.0 births per 1,000 women, while women with the education attainment of less than high school have the lowest fertility at 39.0 births per 1,000 women. Women with the education attainment of college or associate's degree represent 32.2% of all women with births.
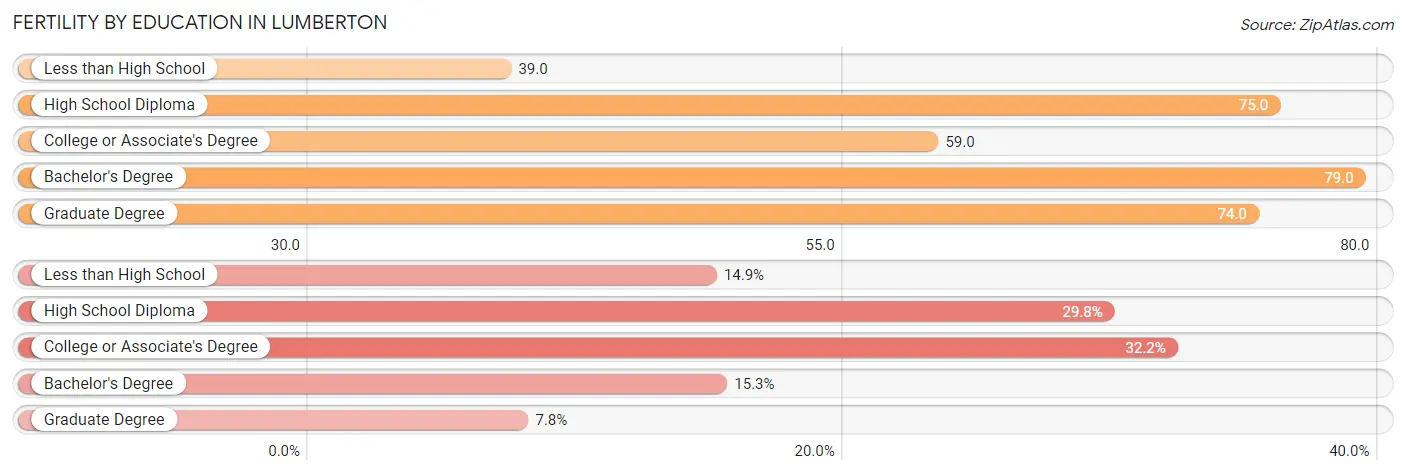
| Educational Attainment | Women with Births | Births / 1,000 Women |
| Less than High School | 38 (14.9%) | 39.0 |
| High School Diploma | 76 (29.8%) | 75.0 |
| College or Associate's Degree | 82 (32.2%) | 59.0 |
| Bachelor's Degree | 39 (15.3%) | 79.0 |
| Graduate Degree | 20 (7.8%) | 74.0 |
| Total | 255 (100.0%) | 62.0 |
Fertility by Education by Marriage Status in Lumberton
56.1% of women with births in Lumberton are unmarried. Women with the educational attainment of bachelor's degree are most likely to be married with 100.0% of them married at childbirth, while women with the educational attainment of high school diploma are least likely to be married with 88.2% of them unmarried at childbirth.
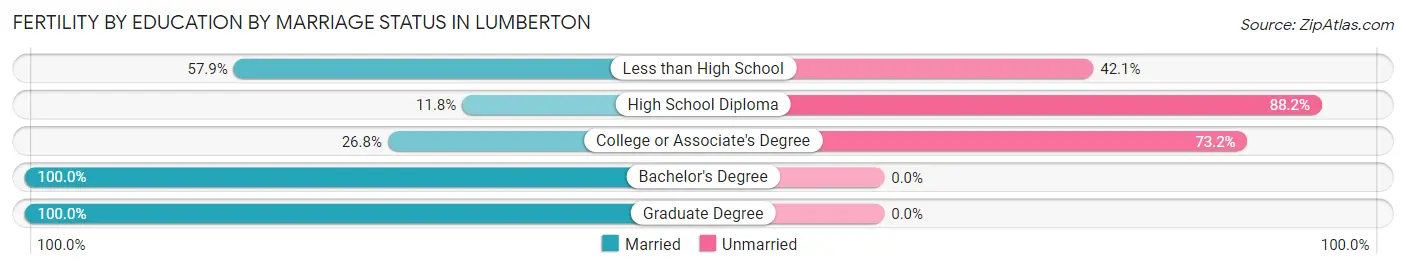
| Educational Attainment | Married | Unmarried |
| Less than High School | 22 (57.9%) | 16 (42.1%) |
| High School Diploma | 9 (11.8%) | 67 (88.2%) |
| College or Associate's Degree | 22 (26.8%) | 60 (73.2%) |
| Bachelor's Degree | 39 (100.0%) | 0 (0.0%) |
| Graduate Degree | 20 (100.0%) | 0 (0.0%) |
| Total | 112 (43.9%) | 143 (56.1%) |
Employment Characteristics in Lumberton
Employment by Class of Employer in Lumberton
Among the 6,602 employed individuals in Lumberton, private company employees (4,876 | 73.9%), state government employees (474 | 7.2%), and not-for-profit organizations (408 | 6.2%) make up the most common classes of employment.
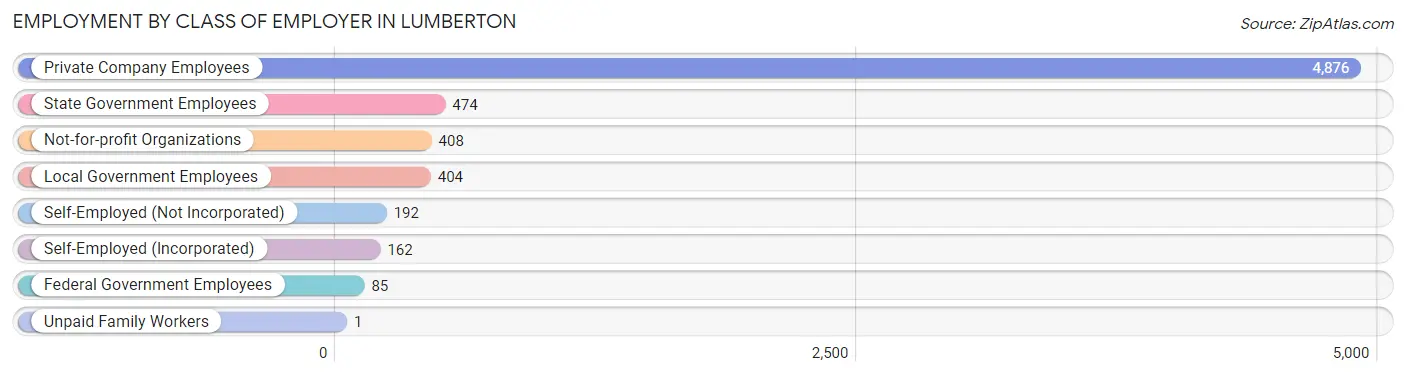
| Employer Class | # Employees | % Employees |
| Private Company Employees | 4,876 | 73.9% |
| Self-Employed (Incorporated) | 162 | 2.5% |
| Self-Employed (Not Incorporated) | 192 | 2.9% |
| Not-for-profit Organizations | 408 | 6.2% |
| Local Government Employees | 404 | 6.1% |
| State Government Employees | 474 | 7.2% |
| Federal Government Employees | 85 | 1.3% |
| Unpaid Family Workers | 1 | 0.0% |
| Total | 6,602 | 100.0% |
Employment Status by Age in Lumberton
According to the labor force statistics for Lumberton, out of the total population over 16 years of age (14,599), 49.5% or 7,227 individuals are in the labor force, with 6.7% or 484 of them unemployed. The age group with the highest labor force participation rate is 25 to 29 years, with 74.0% or 981 individuals in the labor force. Within the labor force, the 16 to 19 years age range has the highest percentage of unemployed individuals, with 16.3% or 41 of them being unemployed.
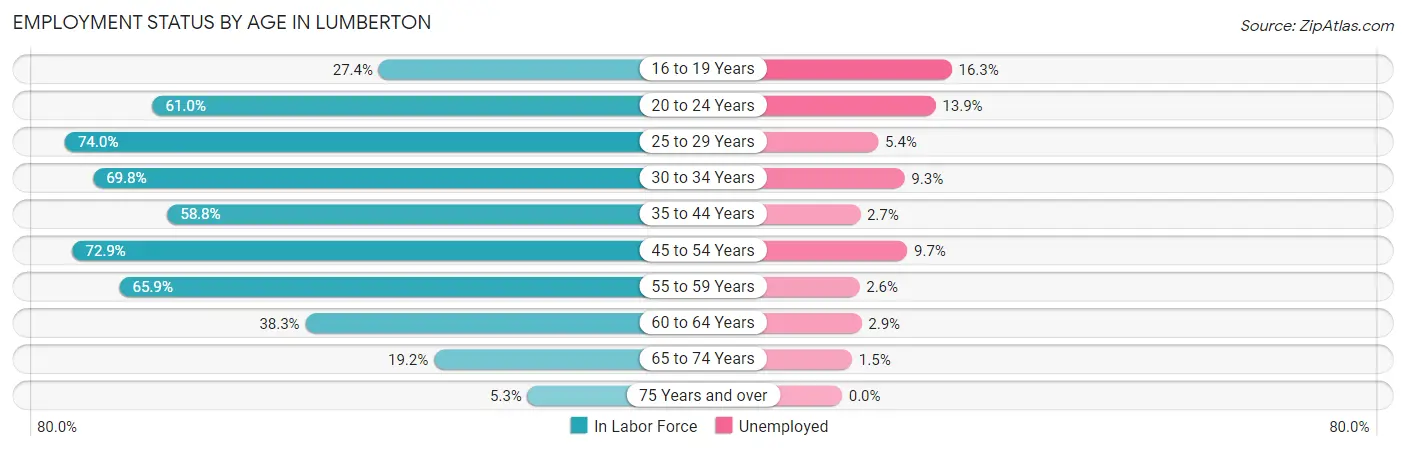
| Age Bracket | In Labor Force | Unemployed |
| 16 to 19 Years | 250 (27.4%) | 41 (16.3%) |
| 20 to 24 Years | 626 (61.0%) | 87 (13.9%) |
| 25 to 29 Years | 981 (74.0%) | 53 (5.4%) |
| 30 to 34 Years | 915 (69.8%) | 85 (9.3%) |
| 35 to 44 Years | 1,402 (58.8%) | 38 (2.7%) |
| 45 to 54 Years | 1,543 (72.9%) | 150 (9.7%) |
| 55 to 59 Years | 574 (65.9%) | 15 (2.6%) |
| 60 to 64 Years | 524 (38.3%) | 15 (2.9%) |
| 65 to 74 Years | 325 (19.2%) | 5 (1.5%) |
| 75 Years and over | 84 (5.3%) | 0 (0.0%) |
| Total | 7,227 (49.5%) | 484 (6.7%) |
Employment Status by Educational Attainment in Lumberton
According to labor force statistics for Lumberton, 63.3% of individuals (5,934) out of the total population between 25 and 64 years of age (9,375) are in the labor force, with 6.0% or 356 of them being unemployed. The group with the highest labor force participation rate are those with the educational attainment of bachelor's degree or higher, with 84.1% or 1,614 individuals in the labor force. Within the labor force, individuals with bachelor's degree or higher education have the highest percentage of unemployment, with 8.2% or 132 of them being unemployed.
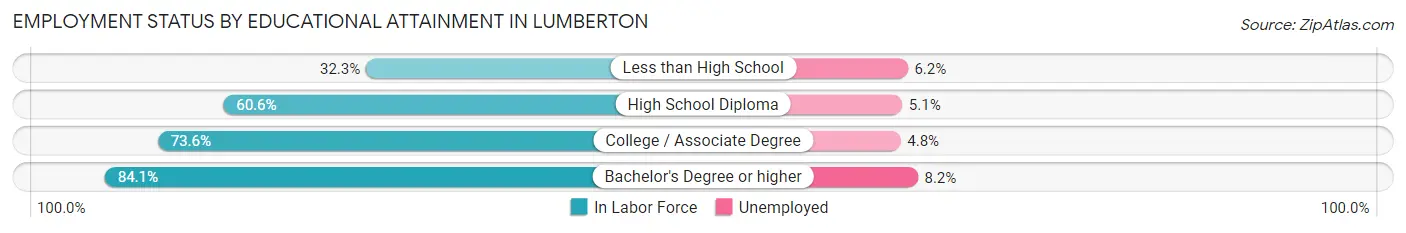
| Educational Attainment | In Labor Force | Unemployed |
| Less than High School | 647 (32.3%) | 124 (6.2%) |
| High School Diploma | 1,571 (60.6%) | 132 (5.1%) |
| College / Associate Degree | 2,106 (73.6%) | 137 (4.8%) |
| Bachelor's Degree or higher | 1,614 (84.1%) | 157 (8.2%) |
| Total | 5,934 (63.3%) | 562 (6.0%) |
Employment Occupations by Sex in Lumberton
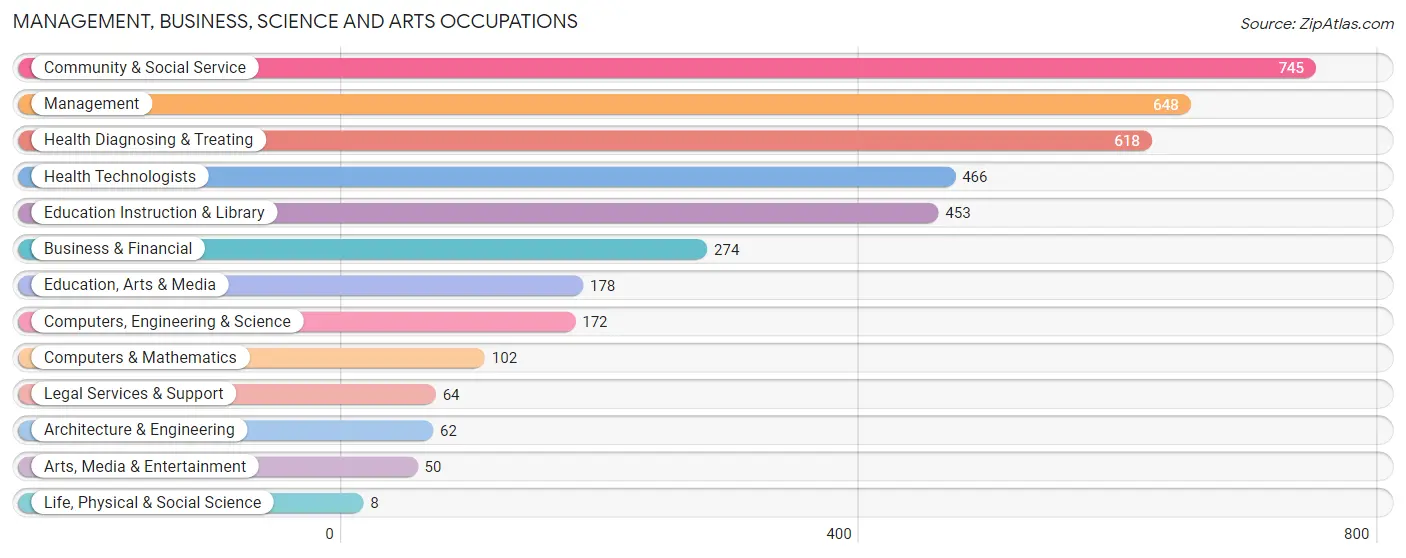
Management, Business, Science and Arts Occupations
The most common Management, Business, Science and Arts occupations in Lumberton are Community & Social Service (745 | 11.1%), Management (648 | 9.7%), Health Diagnosing & Treating (618 | 9.2%), Health Technologists (466 | 6.9%), and Education Instruction & Library (453 | 6.8%).
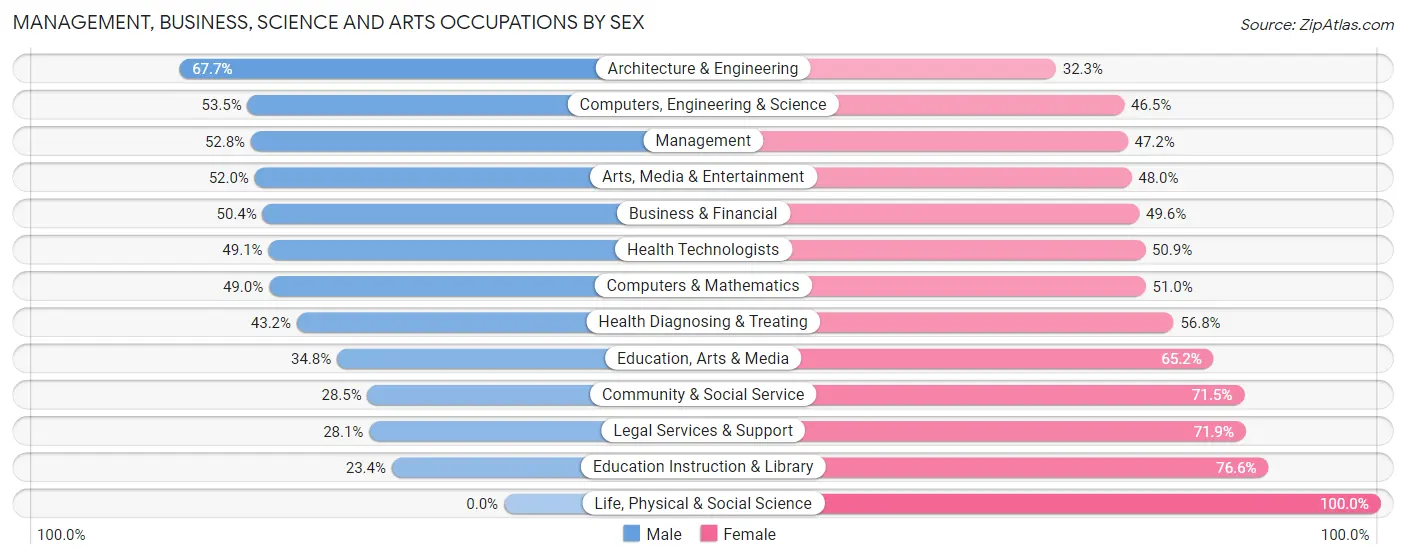
Management, Business, Science and Arts Occupations by Sex
Within the Management, Business, Science and Arts occupations in Lumberton, the most male-oriented occupations are Architecture & Engineering (67.7%), Computers, Engineering & Science (53.5%), and Management (52.8%), while the most female-oriented occupations are Life, Physical & Social Science (100.0%), Education Instruction & Library (76.6%), and Legal Services & Support (71.9%).
| Occupation | Male | Female |
| Management | 342 (52.8%) | 306 (47.2%) |
| Business & Financial | 138 (50.4%) | 136 (49.6%) |
| Computers, Engineering & Science | 92 (53.5%) | 80 (46.5%) |
| Computers & Mathematics | 50 (49.0%) | 52 (51.0%) |
| Architecture & Engineering | 42 (67.7%) | 20 (32.3%) |
| Life, Physical & Social Science | 0 (0.0%) | 8 (100.0%) |
| Community & Social Service | 212 (28.5%) | 533 (71.5%) |
| Education, Arts & Media | 62 (34.8%) | 116 (65.2%) |
| Legal Services & Support | 18 (28.1%) | 46 (71.9%) |
| Education Instruction & Library | 106 (23.4%) | 347 (76.6%) |
| Arts, Media & Entertainment | 26 (52.0%) | 24 (48.0%) |
| Health Diagnosing & Treating | 267 (43.2%) | 351 (56.8%) |
| Health Technologists | 229 (49.1%) | 237 (50.9%) |
| Total (Category) | 1,051 (42.8%) | 1,406 (57.2%) |
| Total (Overall) | 3,227 (48.1%) | 3,484 (51.9%) |
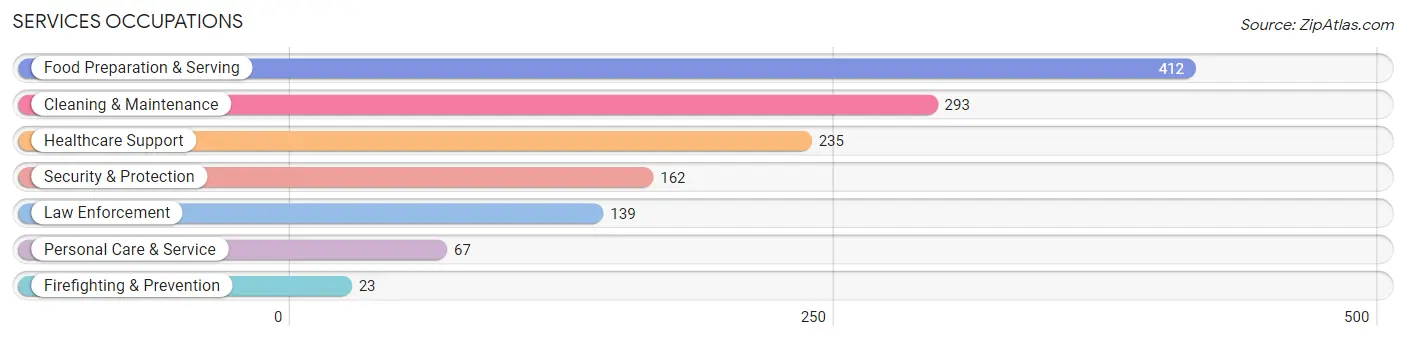
Services Occupations
The most common Services occupations in Lumberton are Food Preparation & Serving (412 | 6.1%), Cleaning & Maintenance (293 | 4.4%), Healthcare Support (235 | 3.5%), Security & Protection (162 | 2.4%), and Law Enforcement (139 | 2.1%).
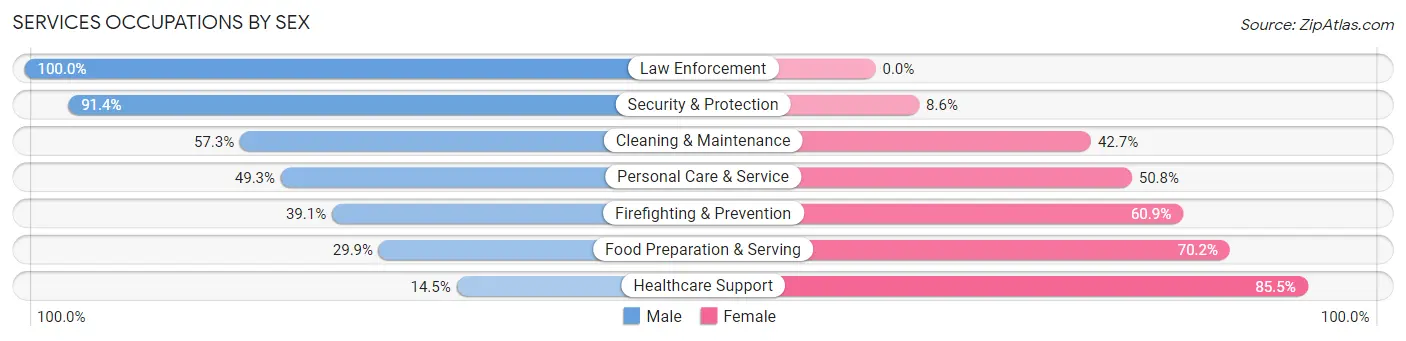
Services Occupations by Sex
Within the Services occupations in Lumberton, the most male-oriented occupations are Law Enforcement (100.0%), Security & Protection (91.4%), and Cleaning & Maintenance (57.3%), while the most female-oriented occupations are Healthcare Support (85.5%), Food Preparation & Serving (70.2%), and Firefighting & Prevention (60.9%).
| Occupation | Male | Female |
| Healthcare Support | 34 (14.5%) | 201 (85.5%) |
| Security & Protection | 148 (91.4%) | 14 (8.6%) |
| Firefighting & Prevention | 9 (39.1%) | 14 (60.9%) |
| Law Enforcement | 139 (100.0%) | 0 (0.0%) |
| Food Preparation & Serving | 123 (29.8%) | 289 (70.2%) |
| Cleaning & Maintenance | 168 (57.3%) | 125 (42.7%) |
| Personal Care & Service | 33 (49.2%) | 34 (50.7%) |
| Total (Category) | 506 (43.3%) | 663 (56.7%) |
| Total (Overall) | 3,227 (48.1%) | 3,484 (51.9%) |
Sales and Office Occupations
The most common Sales and Office occupations in Lumberton are Sales & Related (706 | 10.5%), and Office & Administration (627 | 9.3%).
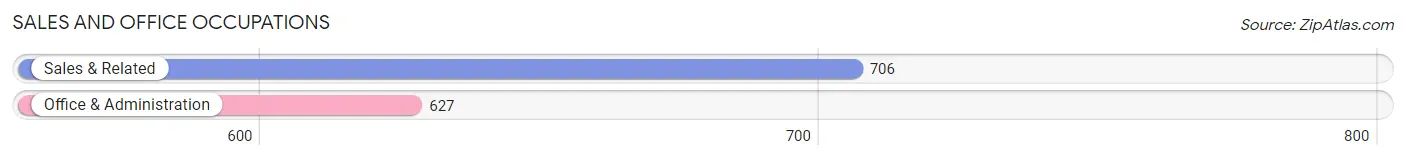
Sales and Office Occupations by Sex
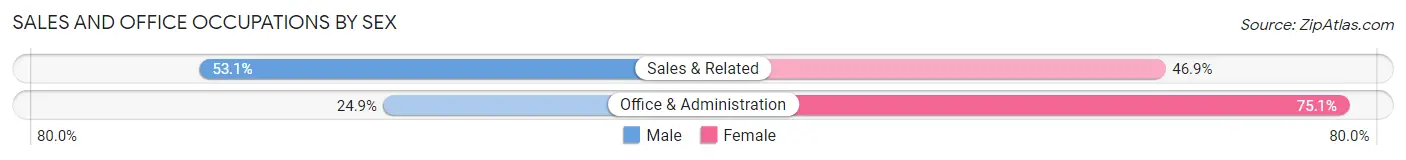
| Occupation | Male | Female |
| Sales & Related | 375 (53.1%) | 331 (46.9%) |
| Office & Administration | 156 (24.9%) | 471 (75.1%) |
| Total (Category) | 531 (39.8%) | 802 (60.2%) |
| Total (Overall) | 3,227 (48.1%) | 3,484 (51.9%) |
Natural Resources, Construction and Maintenance Occupations
The most common Natural Resources, Construction and Maintenance occupations in Lumberton are Construction & Extraction (239 | 3.6%), Installation, Maintenance & Repair (159 | 2.4%), and Farming, Fishing & Forestry (25 | 0.4%).
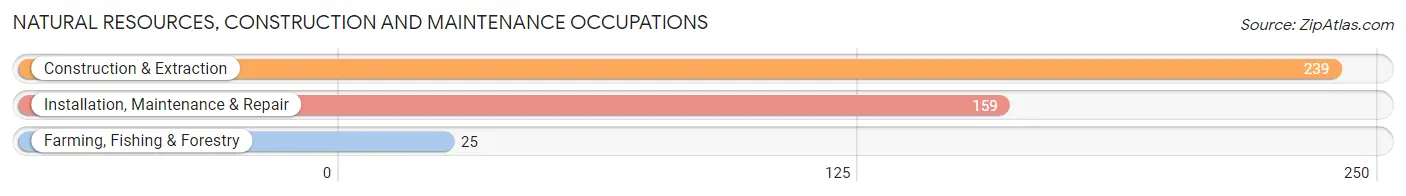
Natural Resources, Construction and Maintenance Occupations by Sex
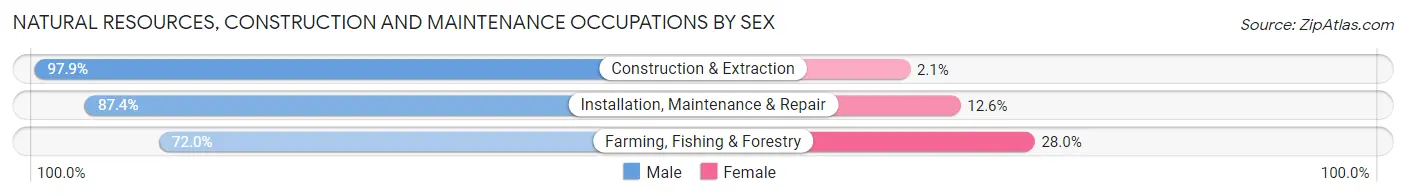
| Occupation | Male | Female |
| Farming, Fishing & Forestry | 18 (72.0%) | 7 (28.0%) |
| Construction & Extraction | 234 (97.9%) | 5 (2.1%) |
| Installation, Maintenance & Repair | 139 (87.4%) | 20 (12.6%) |
| Total (Category) | 391 (92.4%) | 32 (7.6%) |
| Total (Overall) | 3,227 (48.1%) | 3,484 (51.9%) |
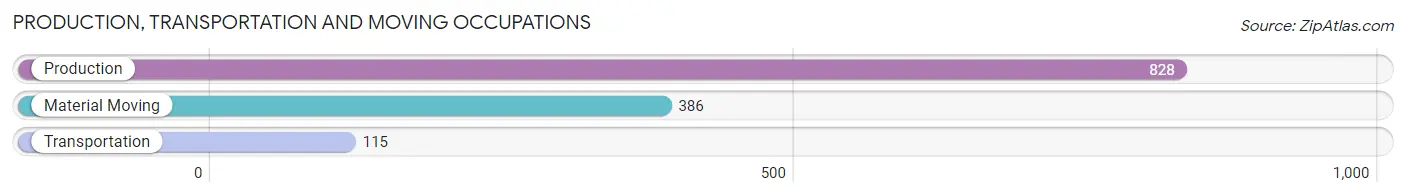
Production, Transportation and Moving Occupations
The most common Production, Transportation and Moving occupations in Lumberton are Production (828 | 12.3%), Material Moving (386 | 5.8%), and Transportation (115 | 1.7%).
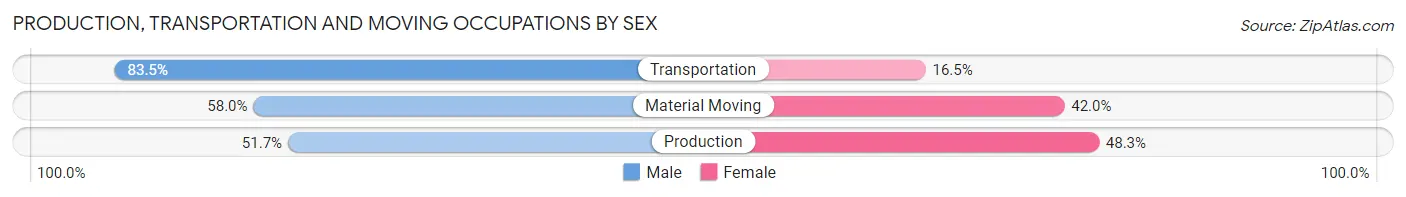
Production, Transportation and Moving Occupations by Sex
| Occupation | Male | Female |
| Production | 428 (51.7%) | 400 (48.3%) |
| Transportation | 96 (83.5%) | 19 (16.5%) |
| Material Moving | 224 (58.0%) | 162 (42.0%) |
| Total (Category) | 748 (56.3%) | 581 (43.7%) |
| Total (Overall) | 3,227 (48.1%) | 3,484 (51.9%) |
Employment Industries by Sex in Lumberton
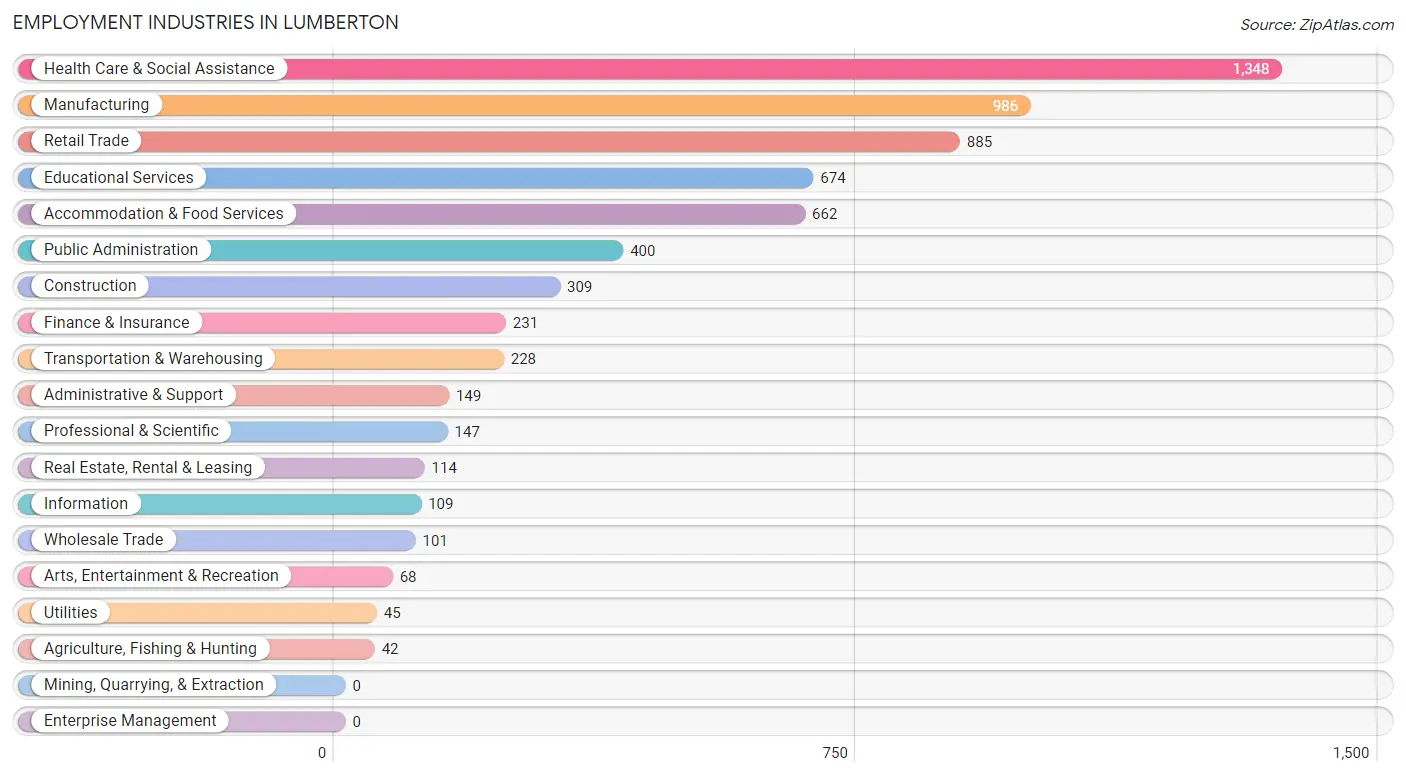
Employment Industries in Lumberton
The major employment industries in Lumberton include Health Care & Social Assistance (1,348 | 20.1%), Manufacturing (986 | 14.7%), Retail Trade (885 | 13.2%), Educational Services (674 | 10.0%), and Accommodation & Food Services (662 | 9.9%).
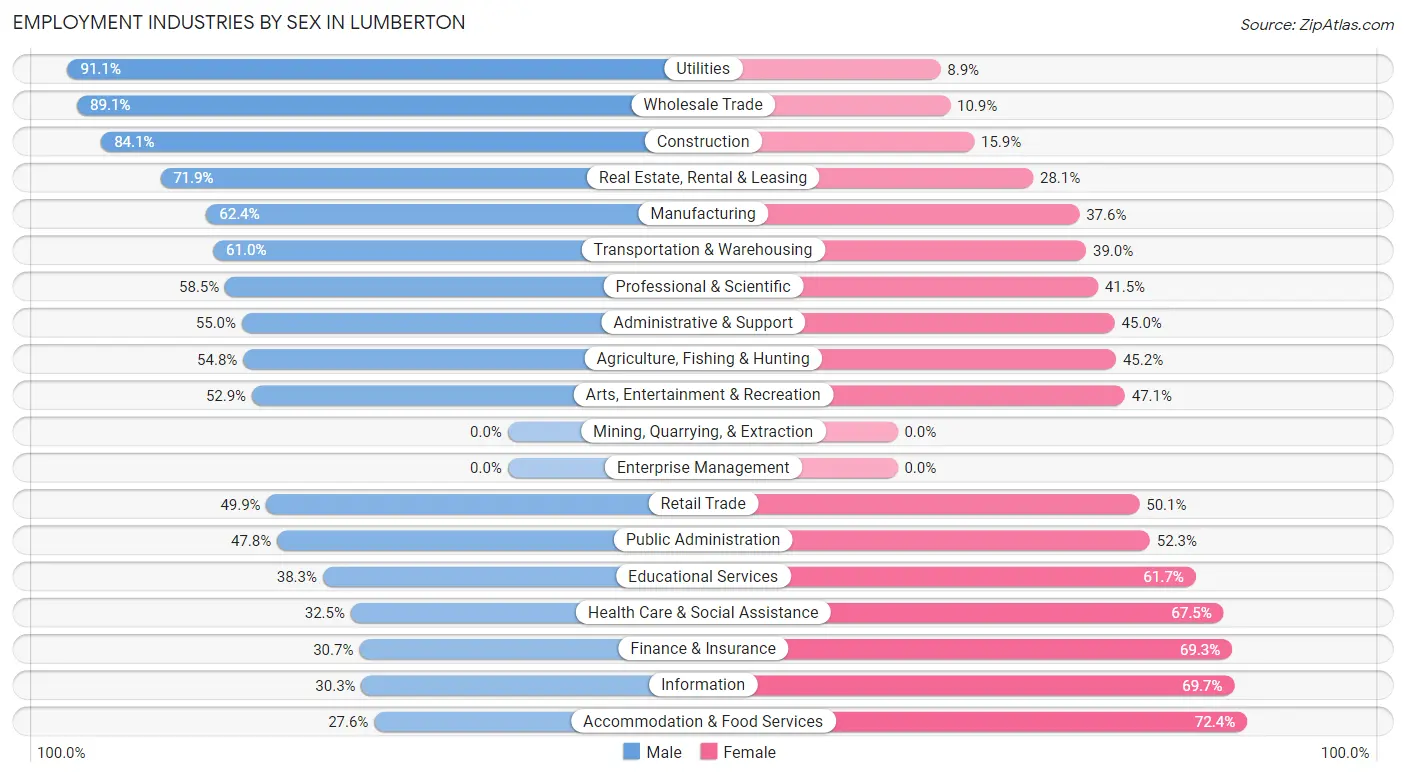
Employment Industries by Sex in Lumberton
The Lumberton industries that see more men than women are Utilities (91.1%), Wholesale Trade (89.1%), and Construction (84.1%), whereas the industries that tend to have a higher number of women are Accommodation & Food Services (72.4%), Information (69.7%), and Finance & Insurance (69.3%).
| Industry | Male | Female |
| Agriculture, Fishing & Hunting | 23 (54.8%) | 19 (45.2%) |
| Mining, Quarrying, & Extraction | 0 (0.0%) | 0 (0.0%) |
| Construction | 260 (84.1%) | 49 (15.9%) |
| Manufacturing | 615 (62.4%) | 371 (37.6%) |
| Wholesale Trade | 90 (89.1%) | 11 (10.9%) |
| Retail Trade | 442 (49.9%) | 443 (50.1%) |
| Transportation & Warehousing | 139 (61.0%) | 89 (39.0%) |
| Utilities | 41 (91.1%) | 4 (8.9%) |
| Information | 33 (30.3%) | 76 (69.7%) |
| Finance & Insurance | 71 (30.7%) | 160 (69.3%) |
| Real Estate, Rental & Leasing | 82 (71.9%) | 32 (28.1%) |
| Professional & Scientific | 86 (58.5%) | 61 (41.5%) |
| Enterprise Management | 0 (0.0%) | 0 (0.0%) |
| Administrative & Support | 82 (55.0%) | 67 (45.0%) |
| Educational Services | 258 (38.3%) | 416 (61.7%) |
| Health Care & Social Assistance | 438 (32.5%) | 910 (67.5%) |
| Arts, Entertainment & Recreation | 36 (52.9%) | 32 (47.1%) |
| Accommodation & Food Services | 183 (27.6%) | 479 (72.4%) |
| Public Administration | 191 (47.7%) | 209 (52.2%) |
| Total | 3,227 (48.1%) | 3,484 (51.9%) |
Education in Lumberton
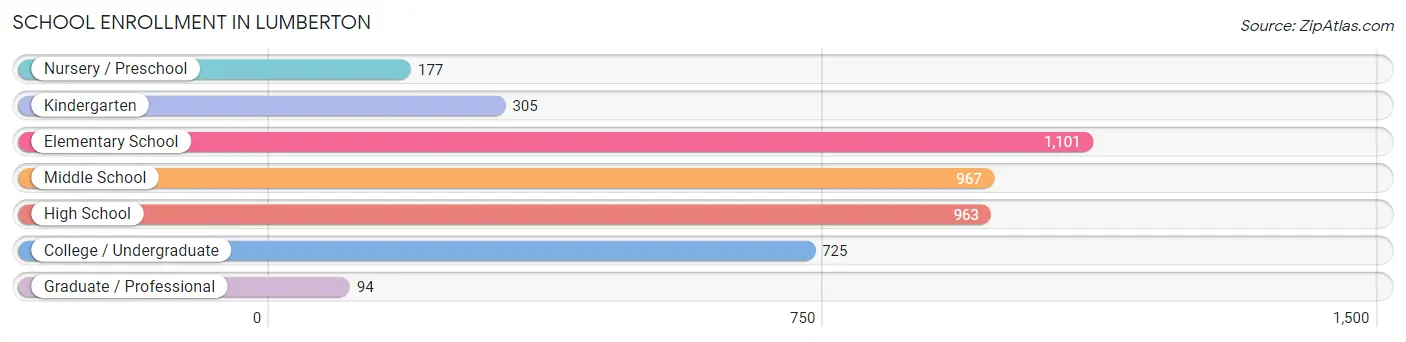
School Enrollment in Lumberton
The most common levels of schooling among the 4,332 students in Lumberton are elementary school (1,101 | 25.4%), middle school (967 | 22.3%), and high school (963 | 22.2%).
| School Level | # Students | % Students |
| Nursery / Preschool | 177 | 4.1% |
| Kindergarten | 305 | 7.0% |
| Elementary School | 1,101 | 25.4% |
| Middle School | 967 | 22.3% |
| High School | 963 | 22.2% |
| College / Undergraduate | 725 | 16.7% |
| Graduate / Professional | 94 | 2.2% |
| Total | 4,332 | 100.0% |
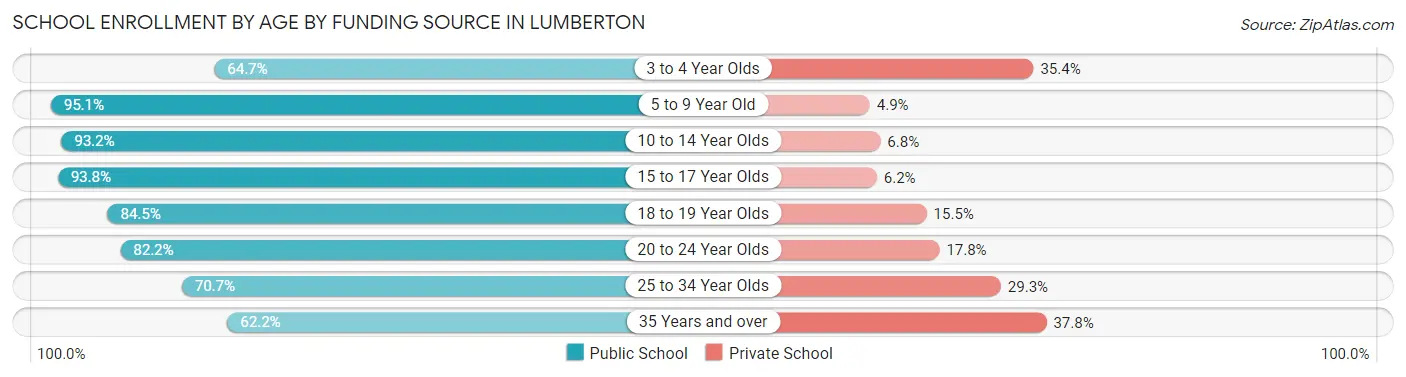
School Enrollment by Age by Funding Source in Lumberton
Out of a total of 4,332 students who are enrolled in schools in Lumberton, 468 (10.8%) attend a private institution, while the remaining 3,864 (89.2%) are enrolled in public schools. The age group of 35 years and over has the highest likelihood of being enrolled in private schools, with 85 (37.8% in the age bracket) enrolled. Conversely, the age group of 5 to 9 year old has the lowest likelihood of being enrolled in a private school, with 1,188 (95.1% in the age bracket) attending a public institution.
| Age Bracket | Public School | Private School |
| 3 to 4 Year Olds | 64 (64.6%) | 35 (35.3%) |
| 5 to 9 Year Old | 1,188 (95.1%) | 61 (4.9%) |
| 10 to 14 Year Olds | 1,266 (93.2%) | 93 (6.8%) |
| 15 to 17 Year Olds | 683 (93.8%) | 45 (6.2%) |
| 18 to 19 Year Olds | 175 (84.5%) | 32 (15.5%) |
| 20 to 24 Year Olds | 152 (82.2%) | 33 (17.8%) |
| 25 to 34 Year Olds | 198 (70.7%) | 82 (29.3%) |
| 35 Years and over | 140 (62.2%) | 85 (37.8%) |
| Total | 3,864 (89.2%) | 468 (10.8%) |
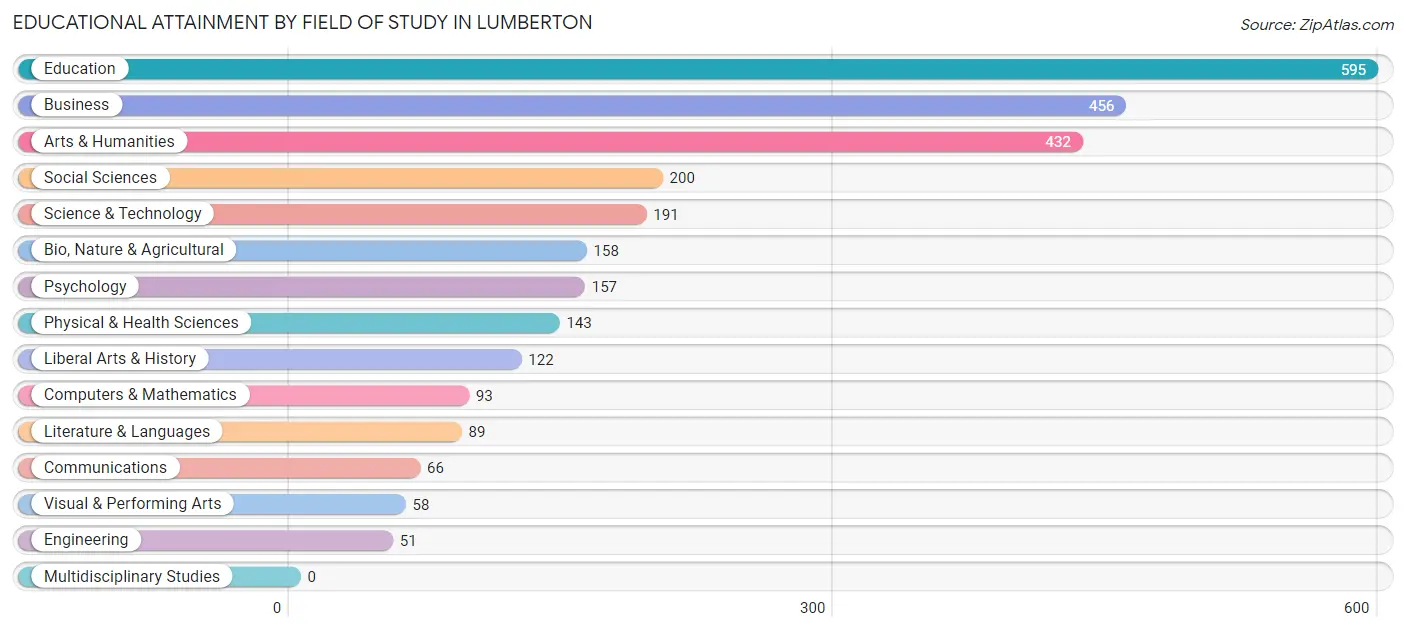
Educational Attainment by Field of Study in Lumberton
Education (595 | 21.2%), business (456 | 16.2%), arts & humanities (432 | 15.4%), social sciences (200 | 7.1%), and science & technology (191 | 6.8%) are the most common fields of study among 2,811 individuals in Lumberton who have obtained a bachelor's degree or higher.
| Field of Study | # Graduates | % Graduates |
| Computers & Mathematics | 93 | 3.3% |
| Bio, Nature & Agricultural | 158 | 5.6% |
| Physical & Health Sciences | 143 | 5.1% |
| Psychology | 157 | 5.6% |
| Social Sciences | 200 | 7.1% |
| Engineering | 51 | 1.8% |
| Multidisciplinary Studies | 0 | 0.0% |
| Science & Technology | 191 | 6.8% |
| Business | 456 | 16.2% |
| Education | 595 | 21.2% |
| Literature & Languages | 89 | 3.2% |
| Liberal Arts & History | 122 | 4.3% |
| Visual & Performing Arts | 58 | 2.1% |
| Communications | 66 | 2.4% |
| Arts & Humanities | 432 | 15.4% |
| Total | 2,811 | 100.0% |
Transportation & Commute in Lumberton
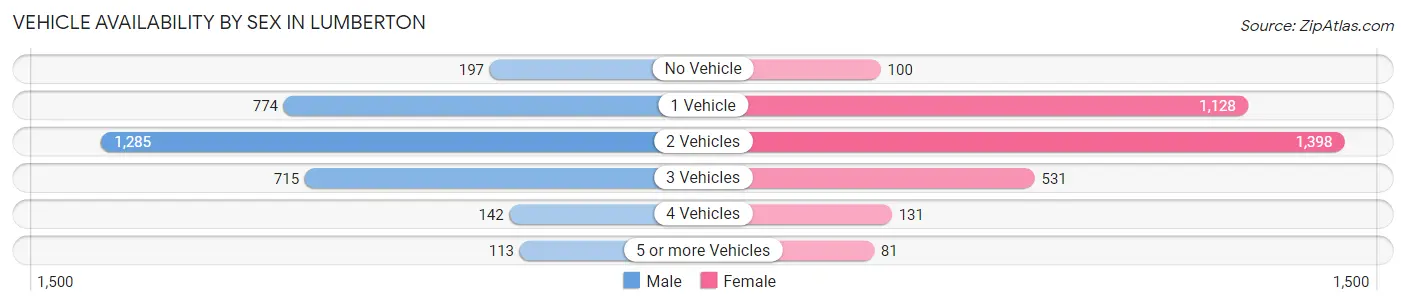
Vehicle Availability by Sex in Lumberton
The most prevalent vehicle ownership categories in Lumberton are males with 2 vehicles (1,285, accounting for 39.8%) and females with 2 vehicles (1,398, making up 38.1%).
| Vehicles Available | Male | Female |
| No Vehicle | 197 (6.1%) | 100 (3.0%) |
| 1 Vehicle | 774 (24.0%) | 1,128 (33.5%) |
| 2 Vehicles | 1,285 (39.8%) | 1,398 (41.5%) |
| 3 Vehicles | 715 (22.2%) | 531 (15.8%) |
| 4 Vehicles | 142 (4.4%) | 131 (3.9%) |
| 5 or more Vehicles | 113 (3.5%) | 81 (2.4%) |
| Total | 3,226 (100.0%) | 3,369 (100.0%) |
Commute Time in Lumberton
The most frequently occuring commute durations in Lumberton are 10 to 14 minutes (1,510 commuters, 23.8%), 5 to 9 minutes (1,305 commuters, 20.5%), and 15 to 19 minutes (892 commuters, 14.0%).
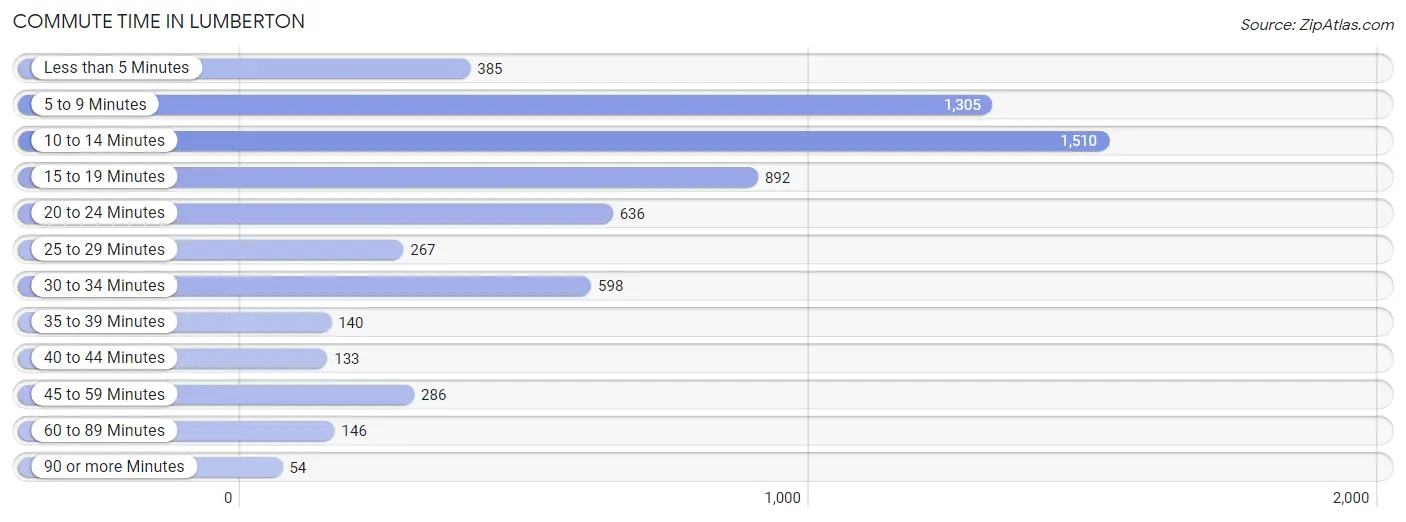
| Commute Time | # Commuters | % Commuters |
| Less than 5 Minutes | 385 | 6.1% |
| 5 to 9 Minutes | 1,305 | 20.5% |
| 10 to 14 Minutes | 1,510 | 23.8% |
| 15 to 19 Minutes | 892 | 14.0% |
| 20 to 24 Minutes | 636 | 10.0% |
| 25 to 29 Minutes | 267 | 4.2% |
| 30 to 34 Minutes | 598 | 9.4% |
| 35 to 39 Minutes | 140 | 2.2% |
| 40 to 44 Minutes | 133 | 2.1% |
| 45 to 59 Minutes | 286 | 4.5% |
| 60 to 89 Minutes | 146 | 2.3% |
| 90 or more Minutes | 54 | 0.9% |
Commute Time by Sex in Lumberton
The most common commute times in Lumberton are 10 to 14 minutes (628 commuters, 20.2%) for males and 10 to 14 minutes (882 commuters, 27.3%) for females.
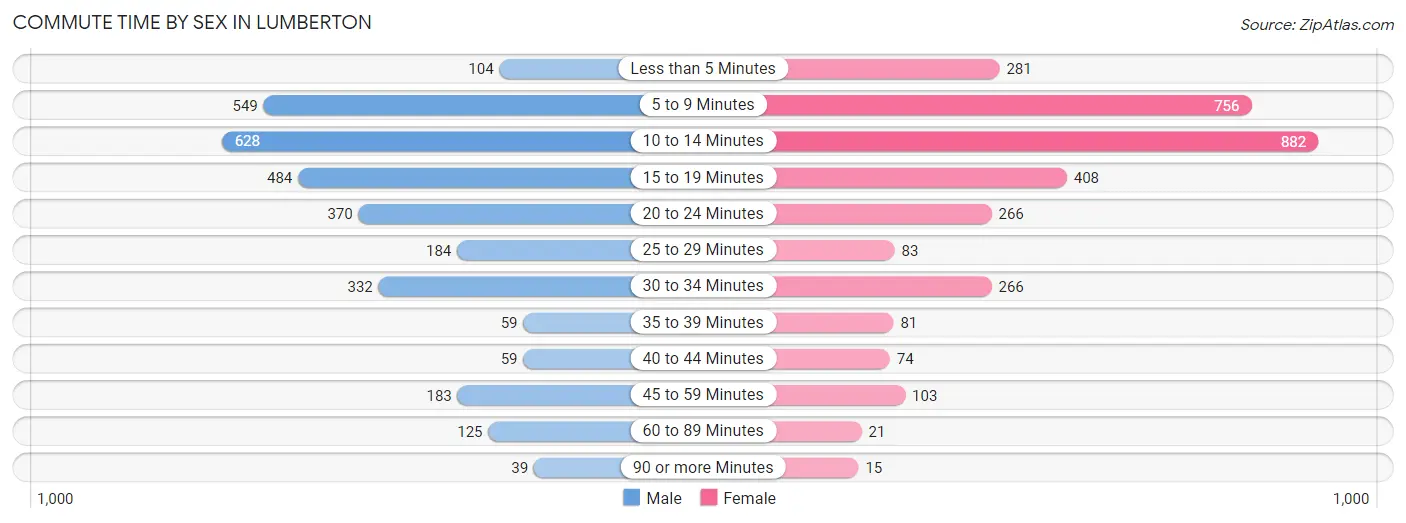
| Commute Time | Male | Female |
| Less than 5 Minutes | 104 (3.3%) | 281 (8.7%) |
| 5 to 9 Minutes | 549 (17.6%) | 756 (23.4%) |
| 10 to 14 Minutes | 628 (20.2%) | 882 (27.3%) |
| 15 to 19 Minutes | 484 (15.5%) | 408 (12.6%) |
| 20 to 24 Minutes | 370 (11.9%) | 266 (8.2%) |
| 25 to 29 Minutes | 184 (5.9%) | 83 (2.6%) |
| 30 to 34 Minutes | 332 (10.6%) | 266 (8.2%) |
| 35 to 39 Minutes | 59 (1.9%) | 81 (2.5%) |
| 40 to 44 Minutes | 59 (1.9%) | 74 (2.3%) |
| 45 to 59 Minutes | 183 (5.9%) | 103 (3.2%) |
| 60 to 89 Minutes | 125 (4.0%) | 21 (0.6%) |
| 90 or more Minutes | 39 (1.3%) | 15 (0.5%) |
Time of Departure to Work by Sex in Lumberton
The most frequent times of departure to work in Lumberton are 7:30 AM to 7:59 AM (504, 16.2%) for males and 7:30 AM to 7:59 AM (590, 18.2%) for females.
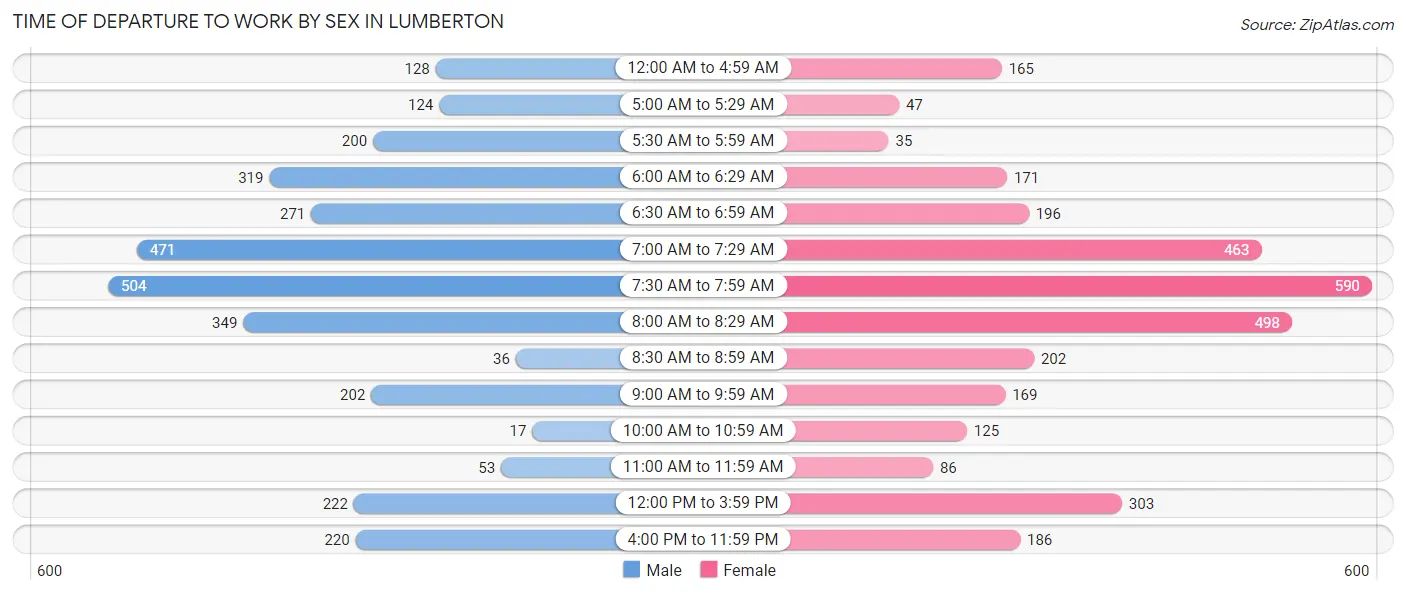
| Time of Departure | Male | Female |
| 12:00 AM to 4:59 AM | 128 (4.1%) | 165 (5.1%) |
| 5:00 AM to 5:29 AM | 124 (4.0%) | 47 (1.5%) |
| 5:30 AM to 5:59 AM | 200 (6.4%) | 35 (1.1%) |
| 6:00 AM to 6:29 AM | 319 (10.2%) | 171 (5.3%) |
| 6:30 AM to 6:59 AM | 271 (8.7%) | 196 (6.1%) |
| 7:00 AM to 7:29 AM | 471 (15.1%) | 463 (14.3%) |
| 7:30 AM to 7:59 AM | 504 (16.2%) | 590 (18.2%) |
| 8:00 AM to 8:29 AM | 349 (11.2%) | 498 (15.4%) |
| 8:30 AM to 8:59 AM | 36 (1.2%) | 202 (6.2%) |
| 9:00 AM to 9:59 AM | 202 (6.5%) | 169 (5.2%) |
| 10:00 AM to 10:59 AM | 17 (0.5%) | 125 (3.9%) |
| 11:00 AM to 11:59 AM | 53 (1.7%) | 86 (2.7%) |
| 12:00 PM to 3:59 PM | 222 (7.1%) | 303 (9.4%) |
| 4:00 PM to 11:59 PM | 220 (7.1%) | 186 (5.8%) |
| Total | 3,116 (100.0%) | 3,236 (100.0%) |
Housing Occupancy in Lumberton
Occupancy by Ownership in Lumberton
Of the total 6,947 dwellings in Lumberton, owner-occupied units account for 3,251 (46.8%), while renter-occupied units make up 3,696 (53.2%).
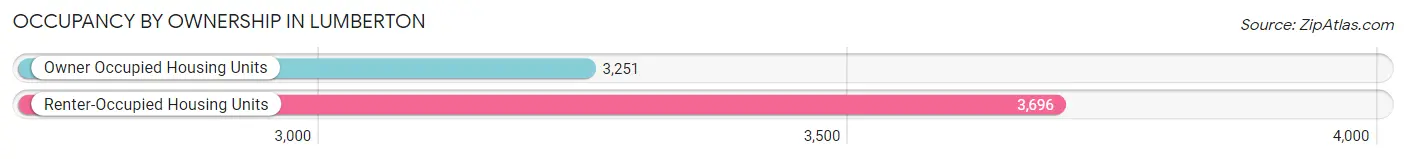
| Occupancy | # Housing Units | % Housing Units |
| Owner Occupied Housing Units | 3,251 | 46.8% |
| Renter-Occupied Housing Units | 3,696 | 53.2% |
| Total Occupied Housing Units | 6,947 | 100.0% |
Occupancy by Household Size in Lumberton
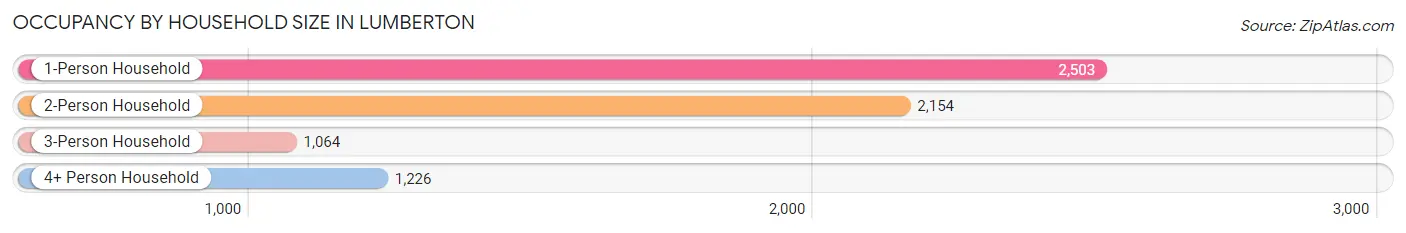
| Household Size | # Housing Units | % Housing Units |
| 1-Person Household | 2,503 | 36.0% |
| 2-Person Household | 2,154 | 31.0% |
| 3-Person Household | 1,064 | 15.3% |
| 4+ Person Household | 1,226 | 17.6% |
| Total Housing Units | 6,947 | 100.0% |
Occupancy by Ownership by Household Size in Lumberton
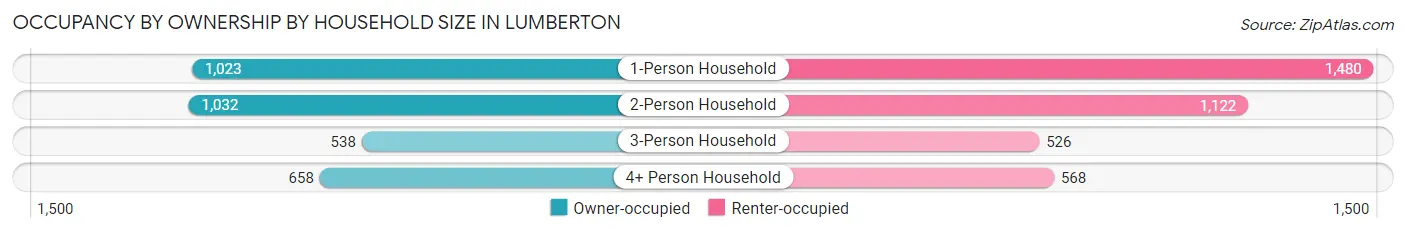
| Household Size | Owner-occupied | Renter-occupied |
| 1-Person Household | 1,023 (40.9%) | 1,480 (59.1%) |
| 2-Person Household | 1,032 (47.9%) | 1,122 (52.1%) |
| 3-Person Household | 538 (50.6%) | 526 (49.4%) |
| 4+ Person Household | 658 (53.7%) | 568 (46.3%) |
| Total Housing Units | 3,251 (46.8%) | 3,696 (53.2%) |
Occupancy by Educational Attainment in Lumberton
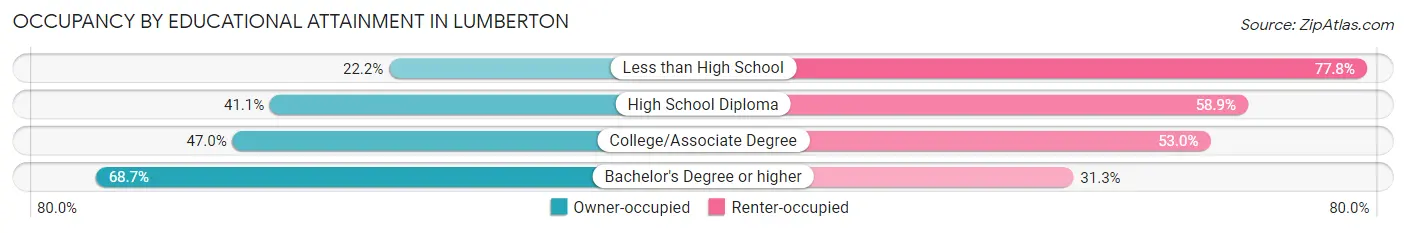
| Household Size | Owner-occupied | Renter-occupied |
| Less than High School | 249 (22.2%) | 873 (77.8%) |
| High School Diploma | 740 (41.1%) | 1,062 (58.9%) |
| College/Associate Degree | 1,089 (47.0%) | 1,227 (53.0%) |
| Bachelor's Degree or higher | 1,173 (68.7%) | 534 (31.3%) |
Occupancy by Age of Householder in Lumberton
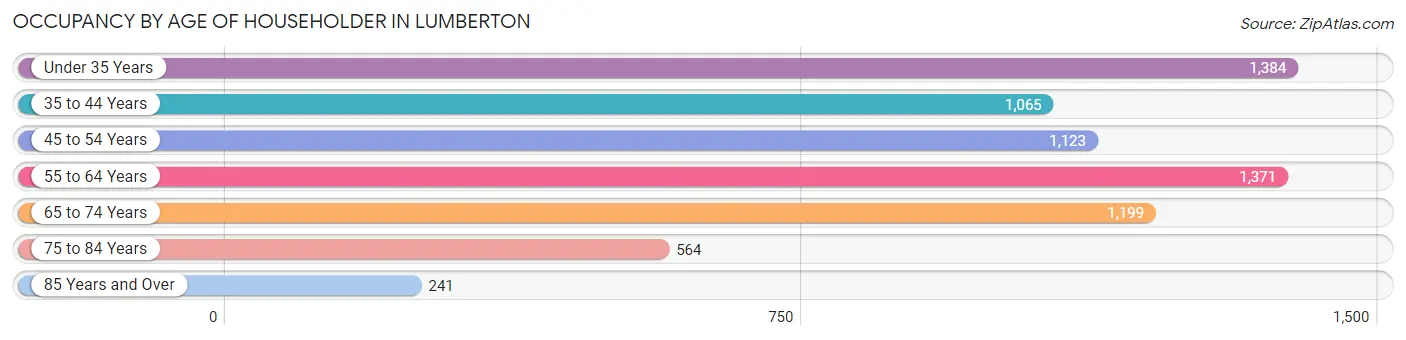
| Age Bracket | # Households | % Households |
| Under 35 Years | 1,384 | 19.9% |
| 35 to 44 Years | 1,065 | 15.3% |
| 45 to 54 Years | 1,123 | 16.2% |
| 55 to 64 Years | 1,371 | 19.7% |
| 65 to 74 Years | 1,199 | 17.3% |
| 75 to 84 Years | 564 | 8.1% |
| 85 Years and Over | 241 | 3.5% |
| Total | 6,947 | 100.0% |
Housing Finances in Lumberton
Median Income by Occupancy in Lumberton
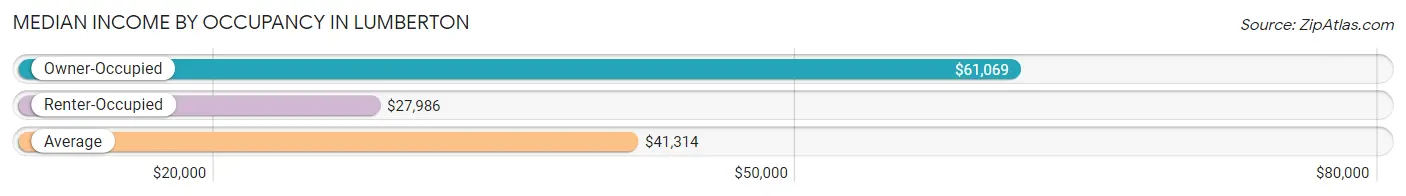
| Occupancy Type | # Households | Median Income |
| Owner-Occupied | 3,251 (46.8%) | $61,069 |
| Renter-Occupied | 3,696 (53.2%) | $27,986 |
| Average | 6,947 (100.0%) | $41,314 |
Occupancy by Householder Income Bracket in Lumberton
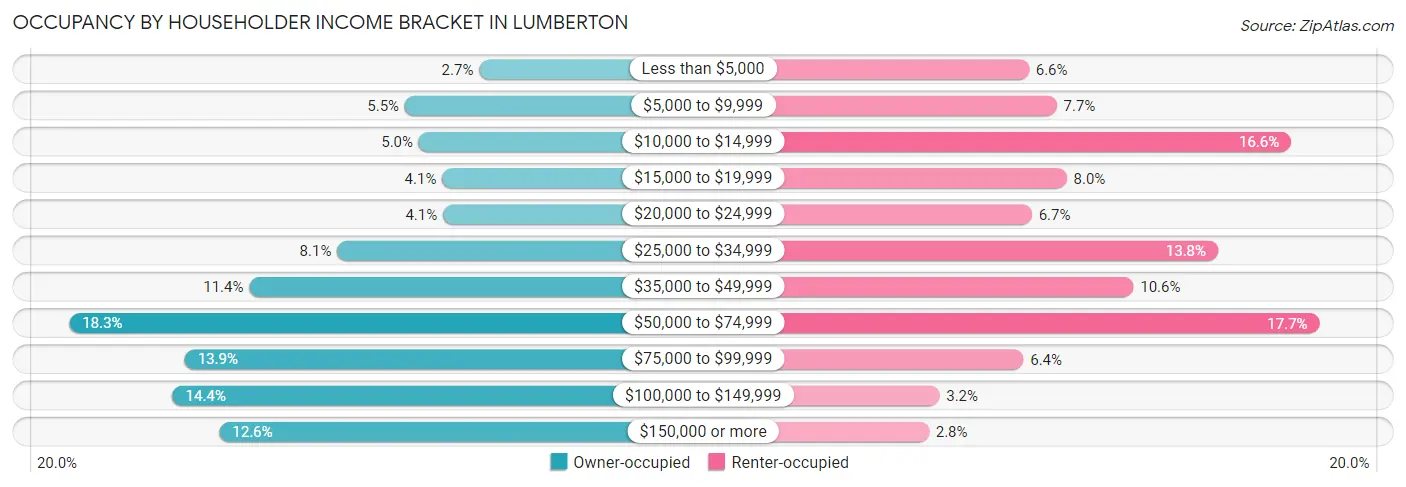
| Income Bracket | Owner-occupied | Renter-occupied |
| Less than $5,000 | 87 (2.7%) | 244 (6.6%) |
| $5,000 to $9,999 | 179 (5.5%) | 283 (7.7%) |
| $10,000 to $14,999 | 162 (5.0%) | 613 (16.6%) |
| $15,000 to $19,999 | 133 (4.1%) | 297 (8.0%) |
| $20,000 to $24,999 | 132 (4.1%) | 248 (6.7%) |
| $25,000 to $34,999 | 263 (8.1%) | 510 (13.8%) |
| $35,000 to $49,999 | 372 (11.4%) | 391 (10.6%) |
| $50,000 to $74,999 | 595 (18.3%) | 653 (17.7%) |
| $75,000 to $99,999 | 452 (13.9%) | 236 (6.4%) |
| $100,000 to $149,999 | 467 (14.4%) | 118 (3.2%) |
| $150,000 or more | 409 (12.6%) | 103 (2.8%) |
| Total | 3,251 (100.0%) | 3,696 (100.0%) |
Monthly Housing Cost Tiers in Lumberton
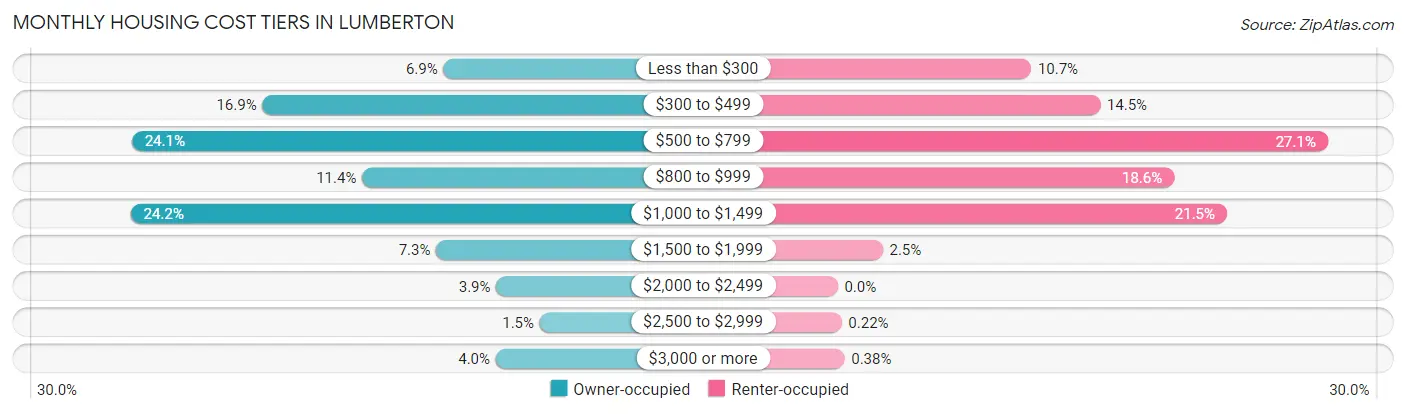
| Monthly Cost | Owner-occupied | Renter-occupied |
| Less than $300 | 223 (6.9%) | 395 (10.7%) |
| $300 to $499 | 548 (16.9%) | 536 (14.5%) |
| $500 to $799 | 783 (24.1%) | 1,001 (27.1%) |
| $800 to $999 | 369 (11.4%) | 687 (18.6%) |
| $1,000 to $1,499 | 785 (24.1%) | 795 (21.5%) |
| $1,500 to $1,999 | 236 (7.3%) | 92 (2.5%) |
| $2,000 to $2,499 | 128 (3.9%) | 0 (0.0%) |
| $2,500 to $2,999 | 50 (1.5%) | 8 (0.2%) |
| $3,000 or more | 129 (4.0%) | 14 (0.4%) |
| Total | 3,251 (100.0%) | 3,696 (100.0%) |
Physical Housing Characteristics in Lumberton
Housing Structures in Lumberton
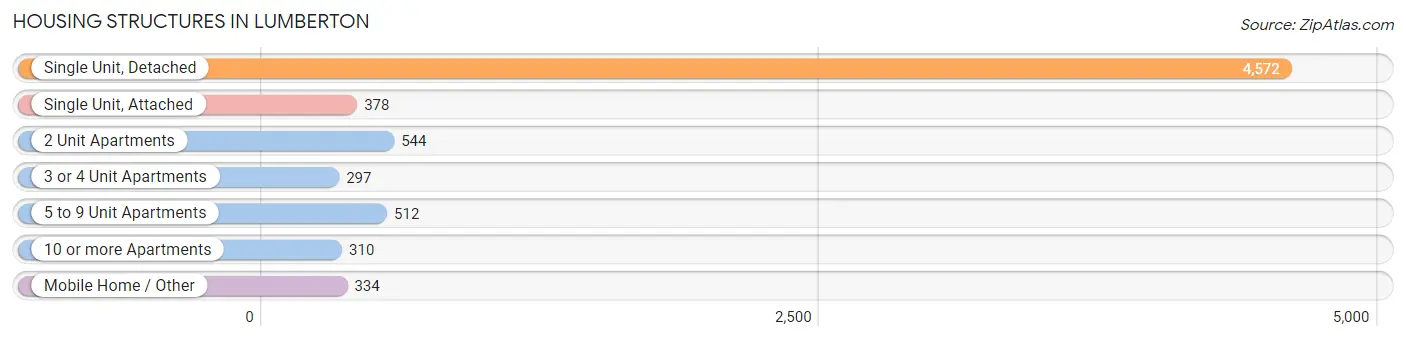
| Structure Type | # Housing Units | % Housing Units |
| Single Unit, Detached | 4,572 | 65.8% |
| Single Unit, Attached | 378 | 5.4% |
| 2 Unit Apartments | 544 | 7.8% |
| 3 or 4 Unit Apartments | 297 | 4.3% |
| 5 to 9 Unit Apartments | 512 | 7.4% |
| 10 or more Apartments | 310 | 4.5% |
| Mobile Home / Other | 334 | 4.8% |
| Total | 6,947 | 100.0% |
Housing Structures by Occupancy in Lumberton
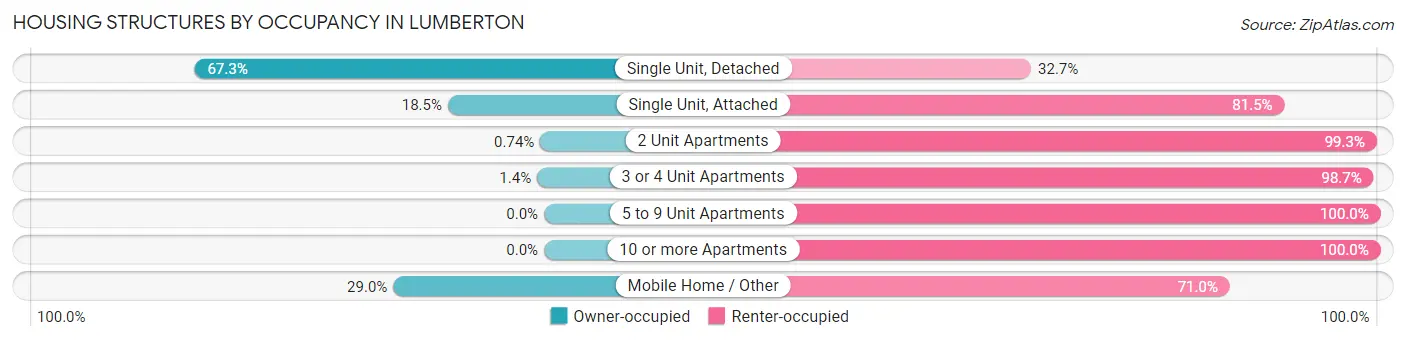
| Structure Type | Owner-occupied | Renter-occupied |
| Single Unit, Detached | 3,076 (67.3%) | 1,496 (32.7%) |
| Single Unit, Attached | 70 (18.5%) | 308 (81.5%) |
| 2 Unit Apartments | 4 (0.7%) | 540 (99.3%) |
| 3 or 4 Unit Apartments | 4 (1.3%) | 293 (98.7%) |
| 5 to 9 Unit Apartments | 0 (0.0%) | 512 (100.0%) |
| 10 or more Apartments | 0 (0.0%) | 310 (100.0%) |
| Mobile Home / Other | 97 (29.0%) | 237 (71.0%) |
| Total | 3,251 (46.8%) | 3,696 (53.2%) |
Housing Structures by Number of Rooms in Lumberton
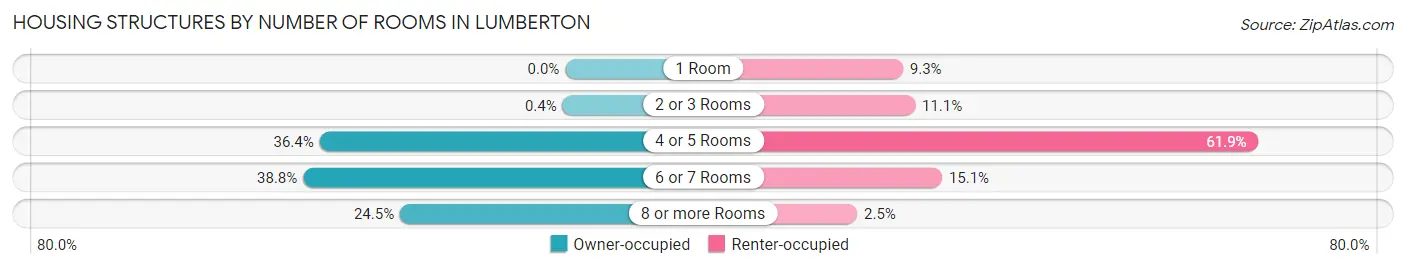
| Number of Rooms | Owner-occupied | Renter-occupied |
| 1 Room | 0 (0.0%) | 344 (9.3%) |
| 2 or 3 Rooms | 13 (0.4%) | 411 (11.1%) |
| 4 or 5 Rooms | 1,182 (36.4%) | 2,289 (61.9%) |
| 6 or 7 Rooms | 1,261 (38.8%) | 558 (15.1%) |
| 8 or more Rooms | 795 (24.4%) | 94 (2.5%) |
| Total | 3,251 (100.0%) | 3,696 (100.0%) |
Housing Structure by Heating Type in Lumberton
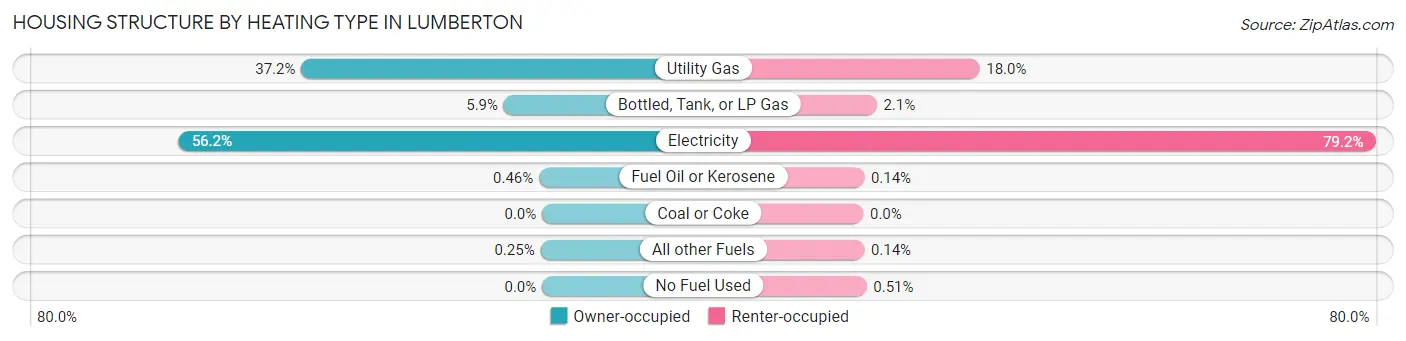
| Heating Type | Owner-occupied | Renter-occupied |
| Utility Gas | 1,210 (37.2%) | 664 (18.0%) |
| Bottled, Tank, or LP Gas | 192 (5.9%) | 77 (2.1%) |
| Electricity | 1,826 (56.2%) | 2,926 (79.2%) |
| Fuel Oil or Kerosene | 15 (0.5%) | 5 (0.1%) |
| Coal or Coke | 0 (0.0%) | 0 (0.0%) |
| All other Fuels | 8 (0.3%) | 5 (0.1%) |
| No Fuel Used | 0 (0.0%) | 19 (0.5%) |
| Total | 3,251 (100.0%) | 3,696 (100.0%) |
Household Vehicle Usage in Lumberton
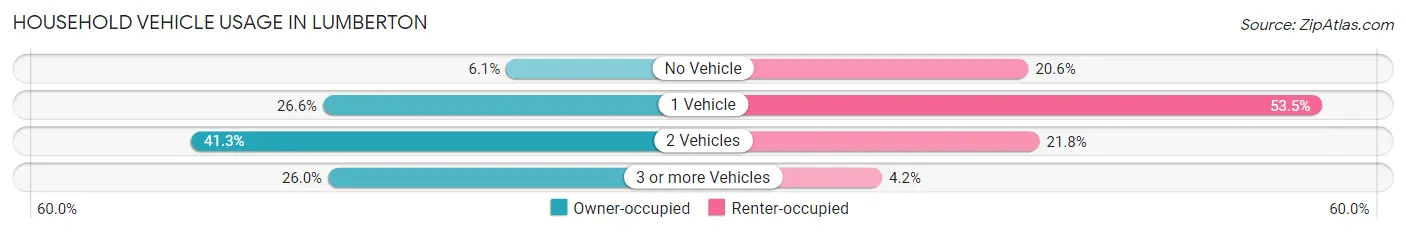
| Vehicles per Household | Owner-occupied | Renter-occupied |
| No Vehicle | 197 (6.1%) | 760 (20.6%) |
| 1 Vehicle | 864 (26.6%) | 1,976 (53.5%) |
| 2 Vehicles | 1,344 (41.3%) | 806 (21.8%) |
| 3 or more Vehicles | 846 (26.0%) | 154 (4.2%) |
| Total | 3,251 (100.0%) | 3,696 (100.0%) |
Real Estate & Mortgages in Lumberton
Real Estate and Mortgage Overview in Lumberton
| Characteristic | Without Mortgage | With Mortgage |
| Housing Units | 1,622 | 1,629 |
| Median Property Value | $98,800 | $160,400 |
| Median Household Income | $48,841 | $291 |
| Monthly Housing Costs | $526 | $123 |
| Real Estate Taxes | $1,191 | $14 |
Property Value by Mortgage Status in Lumberton
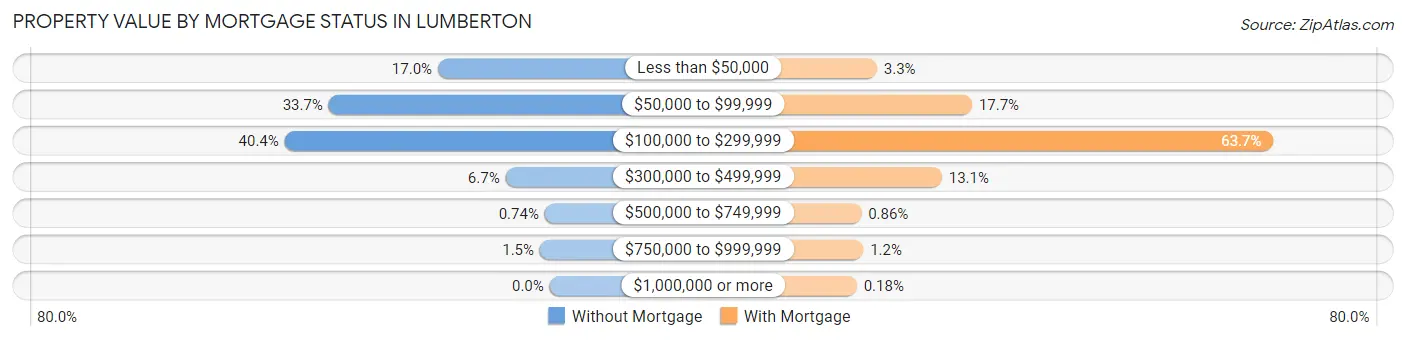
| Property Value | Without Mortgage | With Mortgage |
| Less than $50,000 | 276 (17.0%) | 53 (3.3%) |
| $50,000 to $99,999 | 546 (33.7%) | 289 (17.7%) |
| $100,000 to $299,999 | 655 (40.4%) | 1,037 (63.7%) |
| $300,000 to $499,999 | 109 (6.7%) | 214 (13.1%) |
| $500,000 to $749,999 | 12 (0.7%) | 14 (0.9%) |
| $750,000 to $999,999 | 24 (1.5%) | 19 (1.2%) |
| $1,000,000 or more | 0 (0.0%) | 3 (0.2%) |
| Total | 1,622 (100.0%) | 1,629 (100.0%) |
Household Income by Mortgage Status in Lumberton
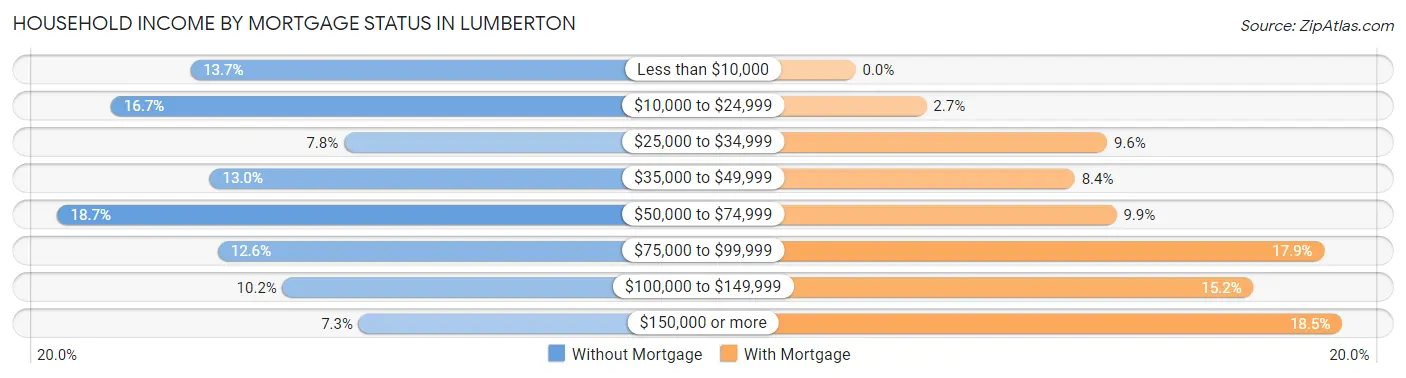
| Household Income | Without Mortgage | With Mortgage |
| Less than $10,000 | 222 (13.7%) | 0 (0.0%) |
| $10,000 to $24,999 | 271 (16.7%) | 44 (2.7%) |
| $25,000 to $34,999 | 127 (7.8%) | 156 (9.6%) |
| $35,000 to $49,999 | 210 (13.0%) | 136 (8.4%) |
| $50,000 to $74,999 | 304 (18.7%) | 162 (9.9%) |
| $75,000 to $99,999 | 205 (12.6%) | 291 (17.9%) |
| $100,000 to $149,999 | 165 (10.2%) | 247 (15.2%) |
| $150,000 or more | 118 (7.3%) | 302 (18.5%) |
| Total | 1,622 (100.0%) | 1,629 (100.0%) |
Property Value to Household Income Ratio in Lumberton
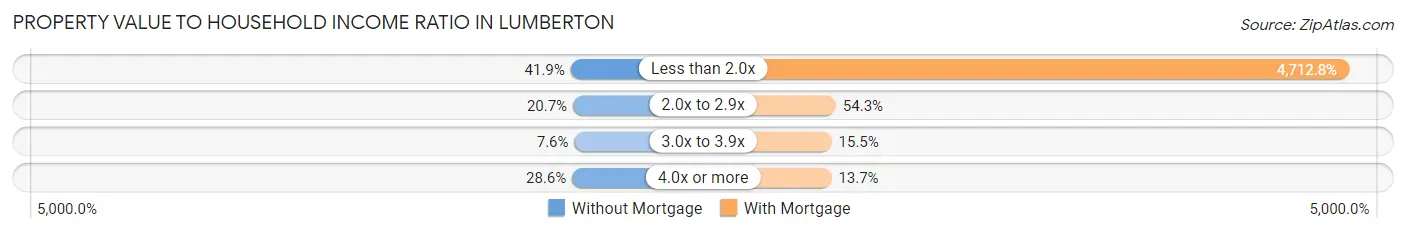
| Value-to-Income Ratio | Without Mortgage | With Mortgage |
| Less than 2.0x | 679 (41.9%) | 76,771 (4,712.8%) |
| 2.0x to 2.9x | 336 (20.7%) | 885 (54.3%) |
| 3.0x to 3.9x | 124 (7.6%) | 252 (15.5%) |
| 4.0x or more | 464 (28.6%) | 223 (13.7%) |
| Total | 1,622 (100.0%) | 1,629 (100.0%) |
Real Estate Taxes by Mortgage Status in Lumberton
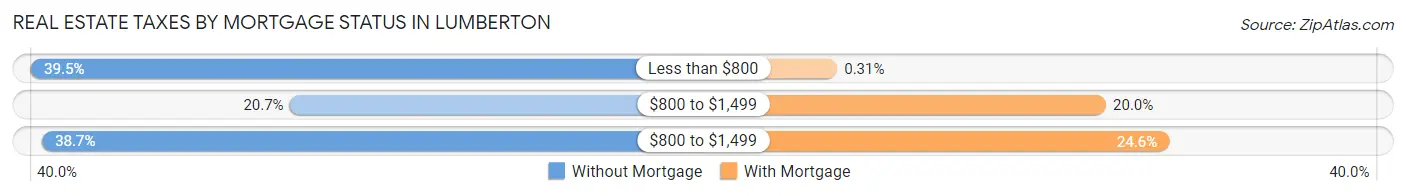
| Property Taxes | Without Mortgage | With Mortgage |
| Less than $800 | 641 (39.5%) | 5 (0.3%) |
| $800 to $1,499 | 335 (20.6%) | 325 (20.0%) |
| $800 to $1,499 | 628 (38.7%) | 400 (24.5%) |
| Total | 1,622 (100.0%) | 1,629 (100.0%) |
Health & Disability in Lumberton
Health Insurance Coverage by Age in Lumberton
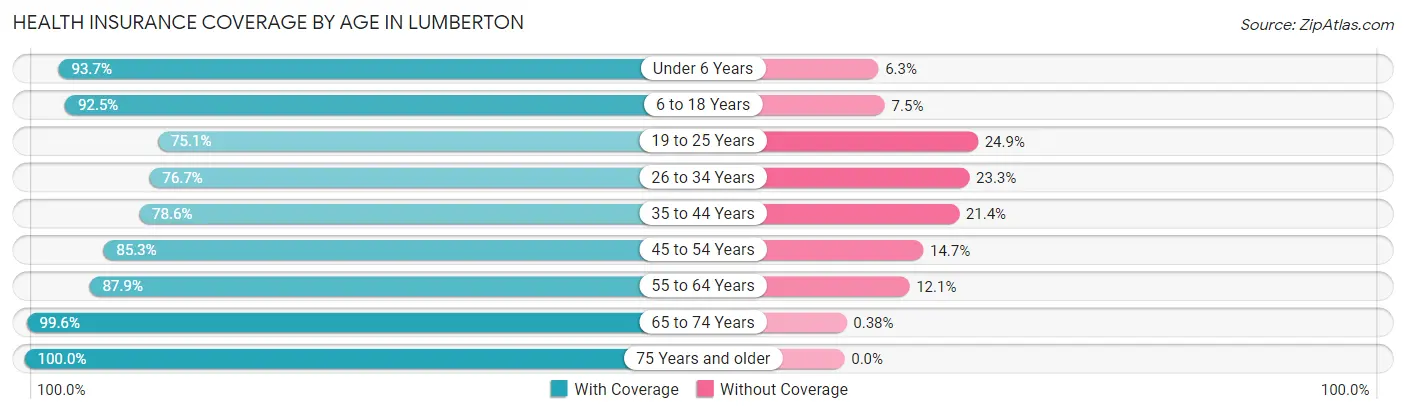
| Age Bracket | With Coverage | Without Coverage |
| Under 6 Years | 1,642 (93.7%) | 111 (6.3%) |
| 6 to 18 Years | 3,203 (92.5%) | 261 (7.5%) |
| 19 to 25 Years | 1,063 (75.1%) | 352 (24.9%) |
| 26 to 34 Years | 1,671 (76.7%) | 507 (23.3%) |
| 35 to 44 Years | 1,534 (78.6%) | 417 (21.4%) |
| 45 to 54 Years | 1,672 (85.3%) | 288 (14.7%) |
| 55 to 64 Years | 1,851 (87.9%) | 255 (12.1%) |
| 65 to 74 Years | 1,561 (99.6%) | 6 (0.4%) |
| 75 Years and older | 1,218 (100.0%) | 0 (0.0%) |
| Total | 15,415 (87.5%) | 2,197 (12.5%) |
Health Insurance Coverage by Citizenship Status in Lumberton
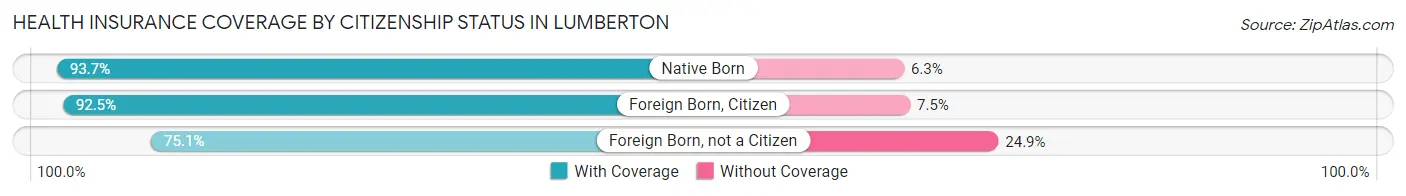
| Citizenship Status | With Coverage | Without Coverage |
| Native Born | 1,642 (93.7%) | 111 (6.3%) |
| Foreign Born, Citizen | 3,203 (92.5%) | 261 (7.5%) |
| Foreign Born, not a Citizen | 1,063 (75.1%) | 352 (24.9%) |
Health Insurance Coverage by Household Income in Lumberton
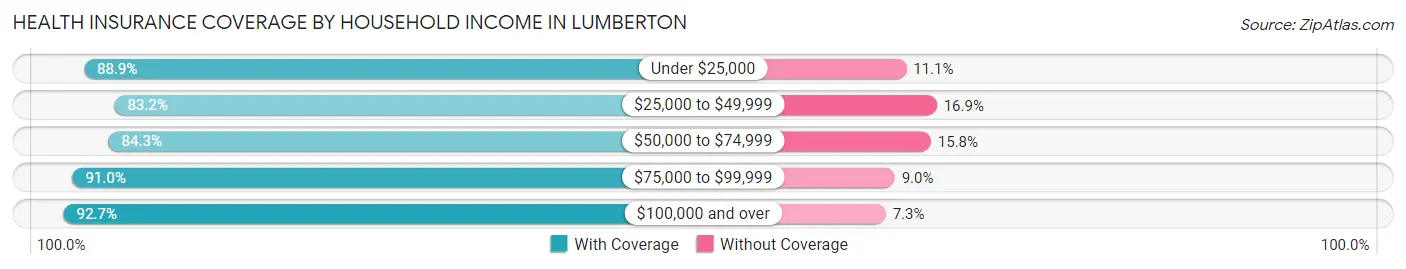
| Household Income | With Coverage | Without Coverage |
| Under $25,000 | 3,923 (88.9%) | 492 (11.1%) |
| $25,000 to $49,999 | 3,552 (83.2%) | 720 (16.9%) |
| $50,000 to $74,999 | 2,770 (84.3%) | 518 (15.8%) |
| $75,000 to $99,999 | 1,793 (91.0%) | 177 (9.0%) |
| $100,000 and over | 3,326 (92.7%) | 262 (7.3%) |
Public vs Private Health Insurance Coverage by Age in Lumberton
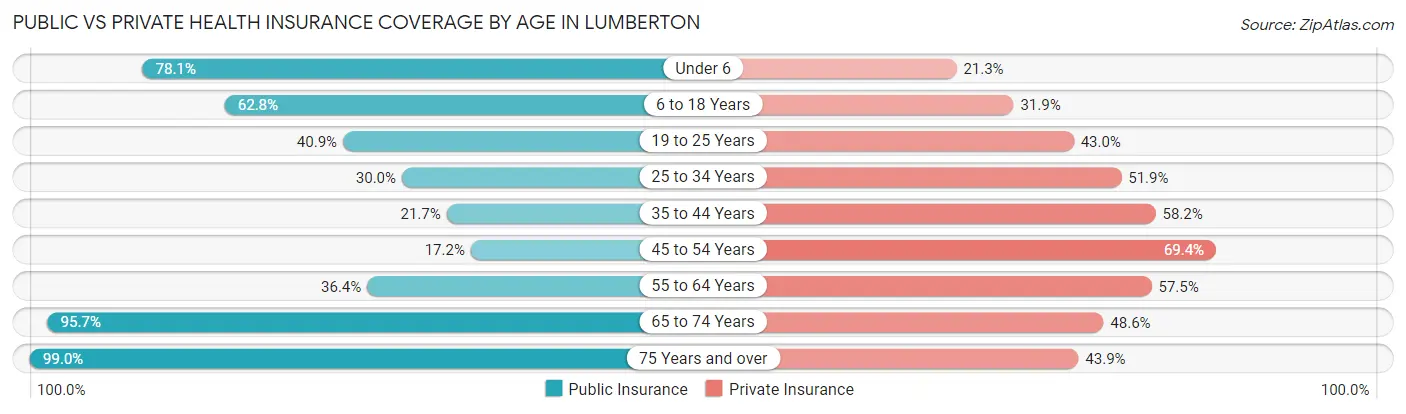
| Age Bracket | Public Insurance | Private Insurance |
| Under 6 | 1,369 (78.1%) | 373 (21.3%) |
| 6 to 18 Years | 2,176 (62.8%) | 1,104 (31.9%) |
| 19 to 25 Years | 579 (40.9%) | 609 (43.0%) |
| 25 to 34 Years | 653 (30.0%) | 1,130 (51.9%) |
| 35 to 44 Years | 423 (21.7%) | 1,136 (58.2%) |
| 45 to 54 Years | 337 (17.2%) | 1,361 (69.4%) |
| 55 to 64 Years | 767 (36.4%) | 1,211 (57.5%) |
| 65 to 74 Years | 1,500 (95.7%) | 761 (48.6%) |
| 75 Years and over | 1,206 (99.0%) | 535 (43.9%) |
| Total | 9,010 (51.2%) | 8,220 (46.7%) |
Disability Status by Sex by Age in Lumberton
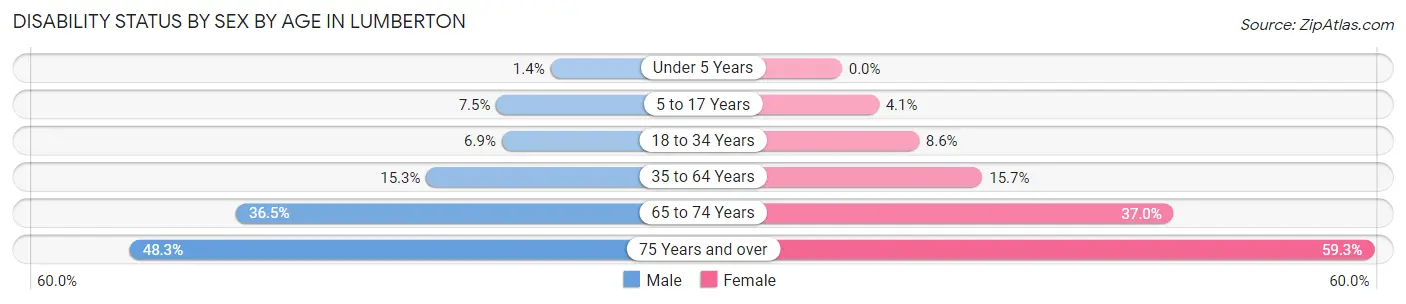
| Age Bracket | Male | Female |
| Under 5 Years | 10 (1.4%) | 0 (0.0%) |
| 5 to 17 Years | 137 (7.5%) | 70 (4.1%) |
| 18 to 34 Years | 118 (6.9%) | 177 (8.6%) |
| 35 to 64 Years | 417 (15.3%) | 514 (15.7%) |
| 65 to 74 Years | 218 (36.4%) | 358 (36.9%) |
| 75 Years and over | 211 (48.3%) | 463 (59.3%) |
Disability Class by Sex by Age in Lumberton
Disability Class: Hearing Difficulty
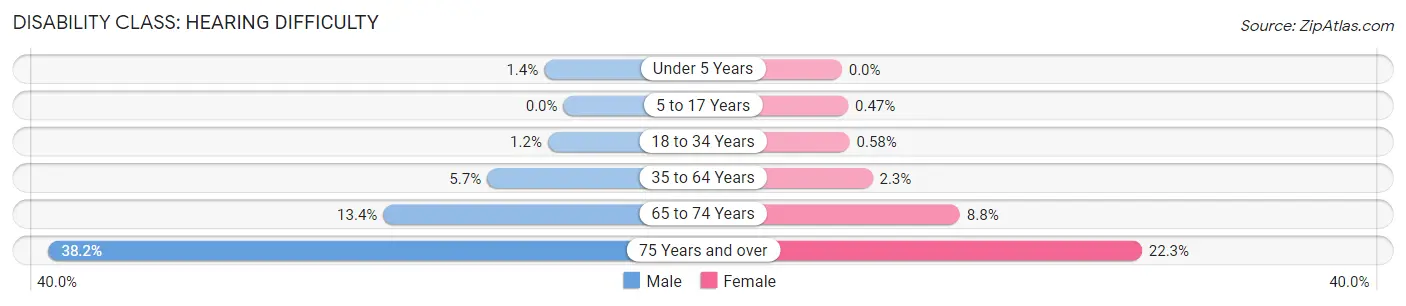
| Age Bracket | Male | Female |
| Under 5 Years | 10 (1.4%) | 0 (0.0%) |
| 5 to 17 Years | 0 (0.0%) | 8 (0.5%) |
| 18 to 34 Years | 20 (1.2%) | 12 (0.6%) |
| 35 to 64 Years | 155 (5.7%) | 75 (2.3%) |
| 65 to 74 Years | 80 (13.4%) | 85 (8.8%) |
| 75 Years and over | 167 (38.2%) | 174 (22.3%) |
Disability Class: Vision Difficulty
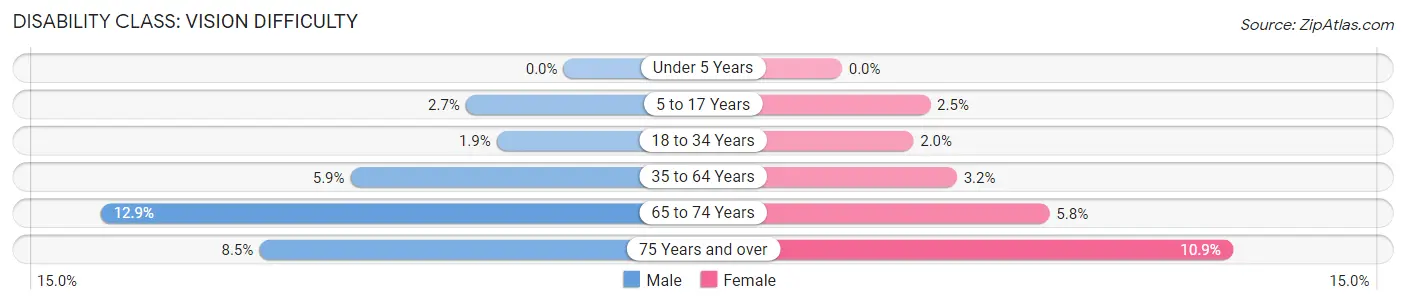
| Age Bracket | Male | Female |
| Under 5 Years | 0 (0.0%) | 0 (0.0%) |
| 5 to 17 Years | 50 (2.7%) | 42 (2.5%) |
| 18 to 34 Years | 32 (1.9%) | 41 (2.0%) |
| 35 to 64 Years | 162 (5.9%) | 105 (3.2%) |
| 65 to 74 Years | 77 (12.9%) | 56 (5.8%) |
| 75 Years and over | 37 (8.5%) | 85 (10.9%) |
Disability Class: Cognitive Difficulty
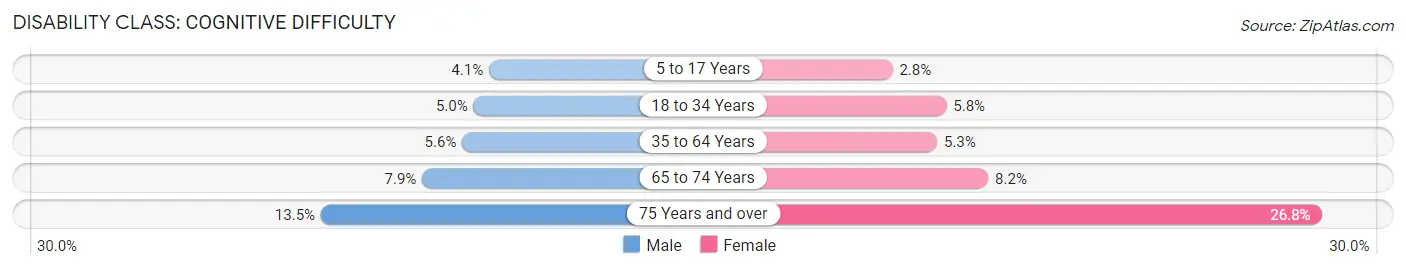
| Age Bracket | Male | Female |
| 5 to 17 Years | 76 (4.1%) | 48 (2.8%) |
| 18 to 34 Years | 86 (5.0%) | 120 (5.8%) |
| 35 to 64 Years | 154 (5.6%) | 174 (5.3%) |
| 65 to 74 Years | 47 (7.9%) | 79 (8.2%) |
| 75 Years and over | 59 (13.5%) | 209 (26.8%) |
Disability Class: Ambulatory Difficulty
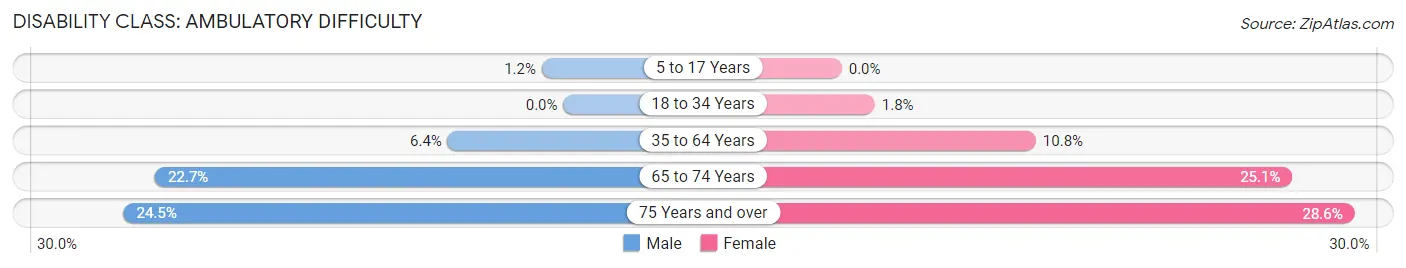
| Age Bracket | Male | Female |
| 5 to 17 Years | 22 (1.2%) | 0 (0.0%) |
| 18 to 34 Years | 0 (0.0%) | 38 (1.8%) |
| 35 to 64 Years | 176 (6.4%) | 355 (10.8%) |
| 65 to 74 Years | 136 (22.7%) | 243 (25.1%) |
| 75 Years and over | 107 (24.5%) | 223 (28.5%) |
Disability Class: Self-Care Difficulty
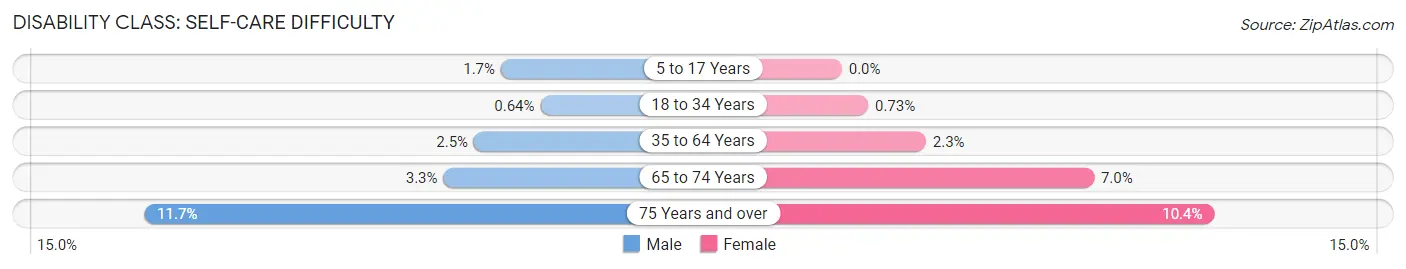
| Age Bracket | Male | Female |
| 5 to 17 Years | 32 (1.7%) | 0 (0.0%) |
| 18 to 34 Years | 11 (0.6%) | 15 (0.7%) |
| 35 to 64 Years | 68 (2.5%) | 77 (2.3%) |
| 65 to 74 Years | 20 (3.3%) | 68 (7.0%) |
| 75 Years and over | 51 (11.7%) | 81 (10.4%) |
Technology Access in Lumberton
Computing Device Access in Lumberton
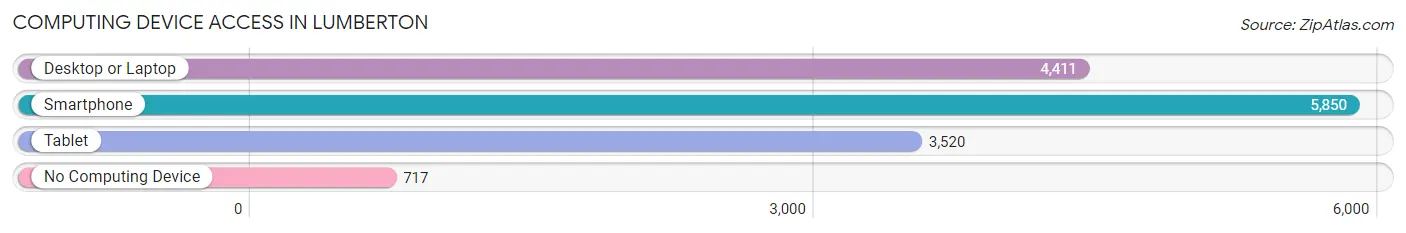
| Device Type | # Households | % Households |
| Desktop or Laptop | 4,411 | 63.5% |
| Smartphone | 5,850 | 84.2% |
| Tablet | 3,520 | 50.7% |
| No Computing Device | 717 | 10.3% |
| Total | 6,947 | 100.0% |
Internet Access in Lumberton
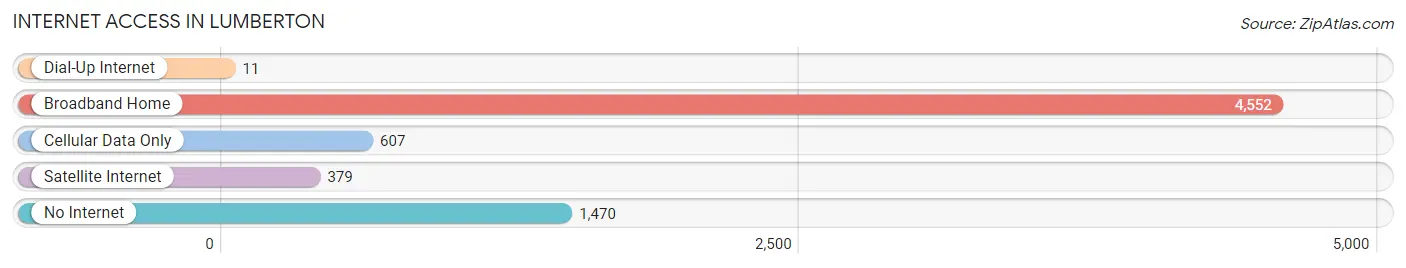
| Internet Type | # Households | % Households |
| Dial-Up Internet | 11 | 0.2% |
| Broadband Home | 4,552 | 65.5% |
| Cellular Data Only | 607 | 8.7% |
| Satellite Internet | 379 | 5.5% |
| No Internet | 1,470 | 21.2% |
| Total | 6,947 | 100.0% |
Lumberton Summary
Lumberton is a city located in Robeson County, North Carolina, United States. It is the county seat of Robeson County and is located in the southeastern part of the state. The population of Lumberton was 21,542 at the 2010 census, making it the tenth-largest city in North Carolina.
Geography
Lumberton is located at 34°41'N 79°00'W (34.68, -79.00). According to the United States Census Bureau, the city has a total area of 16.2 square miles (41.8 km2), of which 16.1 square miles (41.6 km2) is land and 0.1 square miles (0.2 km2) (0.62%) is water.
Lumberton is located in the Coastal Plain region of North Carolina, and is bordered by the Lumber River to the east. The city is located approximately 75 miles (121 km) south of Raleigh, the state capital, and is located near the intersection of Interstate 95 and US Highway 74.
History
The area around Lumberton was first settled in the early 1700s by Scots-Irish immigrants. The town was officially founded in 1787 and was named after the nearby Lumber River. The river was named for the abundance of lumber in the area.
The town grew rapidly in the 19th century, and by the time of the Civil War, it was a thriving center of commerce and industry. During the war, the town was the site of several battles, including the Battle of Lumberton in 1865.
After the war, the town continued to grow and by the early 20th century, it was a major center for the lumber and textile industries. The city was also home to several large manufacturing plants, including a cotton mill, a paper mill, and a furniture factory.
Economy
Lumberton's economy is largely based on the lumber and textile industries. The city is home to several large manufacturing plants, including a cotton mill, a paper mill, and a furniture factory. The city is also home to several retail stores, restaurants, and other businesses.
The city is also home to Southeastern Regional Medical Center, a major medical center in the region. The hospital is the largest employer in the city, with over 2,000 employees.
Demographics
As of the 2010 census, there were 21,542 people, 8,093 households, and 5,541 families residing in the city. The population density was 1,334.2 people per square mile (515.7/km2). There were 8,890 housing units at an average density of 553.2 per square mile (213.3/km2). The racial makeup of the city was 54.2% White, 37.3% African American, 0.4% Native American, 0.7% Asian, 0.1% Pacific Islander, 5.7% from other races, and 1.5% from two or more races. Hispanic or Latino of any race were 9.2% of the population.
The median income for a household in the city was $30,945, and the median income for a family was $37,945. Males had a median income of $30,945 versus $22,945 for females. The per capita income for the city was $16,945. About 17.2% of families and 20.7% of the population were below the poverty line, including 28.2% of those under age 18 and 16.2% of those age 65 or over.
Common Questions
What is Per Capita Income in Lumberton?
Per Capita income in Lumberton is $23,858.
What is the Median Family Income in Lumberton?
Median Family Income in Lumberton is $53,468.
What is the Median Household income in Lumberton?
Median Household Income in Lumberton is $41,314.
What is Income or Wage Gap in Lumberton?
Income or Wage Gap in Lumberton is 23.5%.
Women in Lumberton earn 76.5 cents for every dollar earned by a man.
What is Family Income Deficit in Lumberton?
Family Income Deficit in Lumberton is $11,231.
Families that are below poverty line in Lumberton earn $11,231 less on average than the poverty threshold level.
What is Inequality or Gini Index in Lumberton?
Inequality or Gini Index in Lumberton is 0.52.
What is the Total Population of Lumberton?
Total Population of Lumberton is 19,099.
What is the Total Male Population of Lumberton?
Total Male Population of Lumberton is 9,135.
What is the Total Female Population of Lumberton?
Total Female Population of Lumberton is 9,964.
What is the Ratio of Males per 100 Females in Lumberton?
There are 91.68 Males per 100 Females in Lumberton.
What is the Ratio of Females per 100 Males in Lumberton?
There are 109.07 Females per 100 Males in Lumberton.
What is the Median Population Age in Lumberton?
Median Population Age in Lumberton is 37.2 Years.
What is the Average Family Size in Lumberton
Average Family Size in Lumberton is 3.4 People.
What is the Average Household Size in Lumberton
Average Household Size in Lumberton is 2.5 People.
How Large is the Labor Force in Lumberton?
There are 7,227 People in the Labor Forcein in Lumberton.
What is the Percentage of People in the Labor Force in Lumberton?
49.5% of People are in the Labor Force in Lumberton.
What is the Unemployment Rate in Lumberton?
Unemployment Rate in Lumberton is 6.7%.