Vander, NC Map & Demographics
Vander Map
Vander Overview
$24,131
PER CAPITA INCOME
$68,618
AVG FAMILY INCOME
$45,875
AVG HOUSEHOLD INCOME
0.44
INEQUALITY / GINI INDEX
1,481
TOTAL POPULATION
748
MALE POPULATION
733
FEMALE POPULATION
102.05
MALES / 100 FEMALES
97.99
FEMALES / 100 MALES
48.8
MEDIAN AGE
3.0
AVG FAMILY SIZE
2.5
AVG HOUSEHOLD SIZE
498
LABOR FORCE [ PEOPLE ]
42.3%
PERCENT IN LABOR FORCE
10.2%
UNEMPLOYMENT RATE
Income in Vander
Income Overview in Vander
Per Capita Income in Vander is $24,131, while median incomes of families and households are $68,618 and $45,875 respectively.
| Characteristic | Number | Measure |
| Per Capita Income | 1,481 | $24,131 |
| Median Family Income | 431 | $68,618 |
| Mean Family Income | 431 | $69,277 |
| Median Household Income | 591 | $45,875 |
| Mean Household Income | 591 | $57,809 |
| Income Deficit | 431 | $0 |
| Wage / Income Gap (%) | 1,481 | 0.00% |
| Wage / Income Gap ($) | 1,481 | 100.00¢ per $1 |
| Gini / Inequality Index | 1,481 | 0.44 |
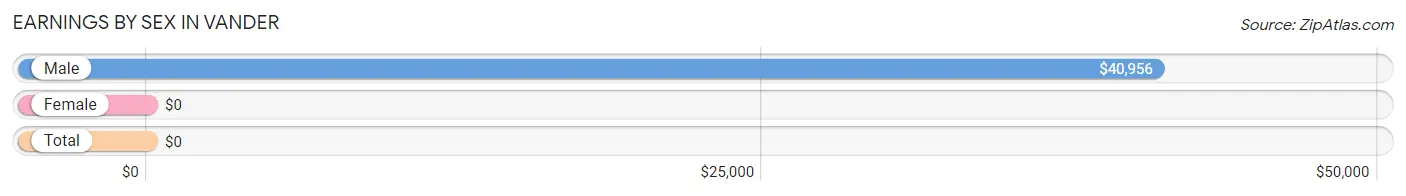
Earnings by Sex in Vander
| Sex | Number | Average Earnings |
| Male | 163 (33.8%) | $40,956 |
| Female | 319 (66.2%) | $0 |
| Total | 482 (100.0%) | $0 |
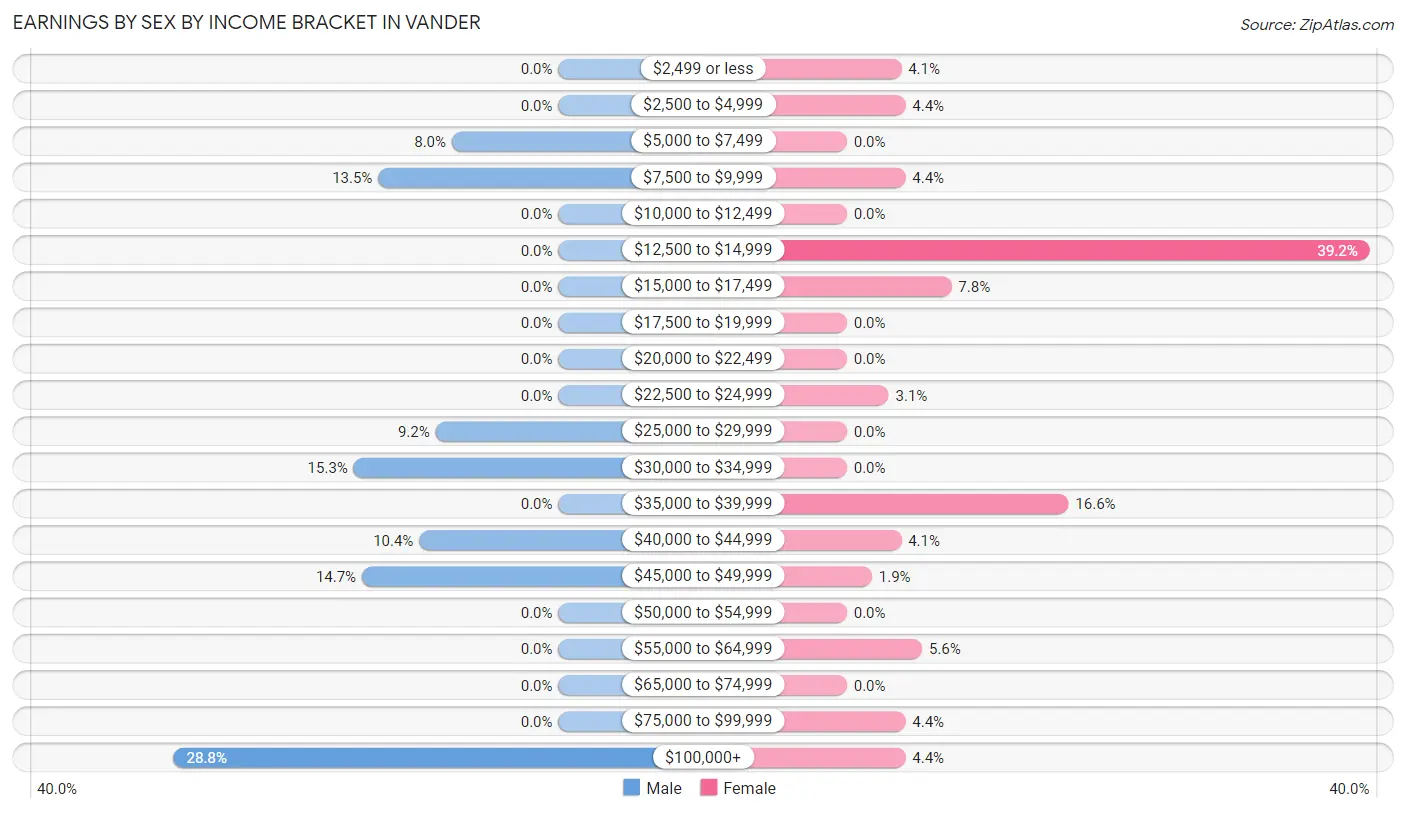
Earnings by Sex by Income Bracket in Vander
The most common earnings brackets in Vander are $100,000+ for men (47 | 28.8%) and $12,500 to $14,999 for women (125 | 39.2%).
| Income | Male | Female |
| $2,499 or less | 0 (0.0%) | 13 (4.1%) |
| $2,500 to $4,999 | 0 (0.0%) | 14 (4.4%) |
| $5,000 to $7,499 | 13 (8.0%) | 0 (0.0%) |
| $7,500 to $9,999 | 22 (13.5%) | 14 (4.4%) |
| $10,000 to $12,499 | 0 (0.0%) | 0 (0.0%) |
| $12,500 to $14,999 | 0 (0.0%) | 125 (39.2%) |
| $15,000 to $17,499 | 0 (0.0%) | 25 (7.8%) |
| $17,500 to $19,999 | 0 (0.0%) | 0 (0.0%) |
| $20,000 to $22,499 | 0 (0.0%) | 0 (0.0%) |
| $22,500 to $24,999 | 0 (0.0%) | 10 (3.1%) |
| $25,000 to $29,999 | 15 (9.2%) | 0 (0.0%) |
| $30,000 to $34,999 | 25 (15.3%) | 0 (0.0%) |
| $35,000 to $39,999 | 0 (0.0%) | 53 (16.6%) |
| $40,000 to $44,999 | 17 (10.4%) | 13 (4.1%) |
| $45,000 to $49,999 | 24 (14.7%) | 6 (1.9%) |
| $50,000 to $54,999 | 0 (0.0%) | 0 (0.0%) |
| $55,000 to $64,999 | 0 (0.0%) | 18 (5.6%) |
| $65,000 to $74,999 | 0 (0.0%) | 0 (0.0%) |
| $75,000 to $99,999 | 0 (0.0%) | 14 (4.4%) |
| $100,000+ | 47 (28.8%) | 14 (4.4%) |
| Total | 163 (100.0%) | 319 (100.0%) |
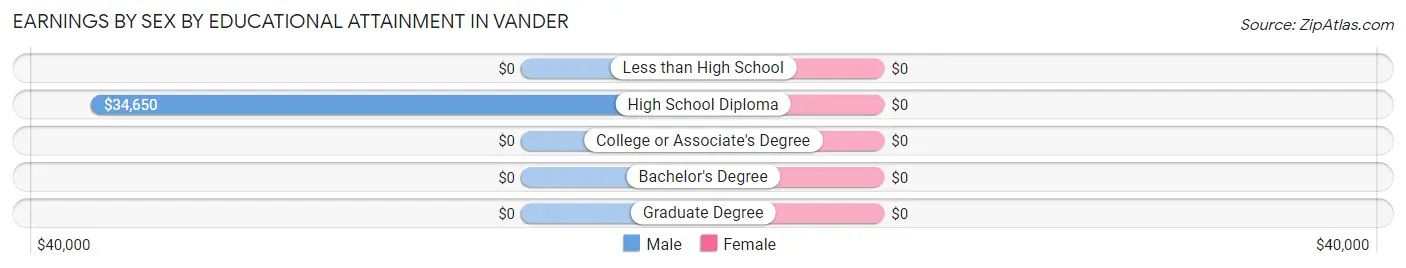
Earnings by Sex by Educational Attainment in Vander
| Educational Attainment | Male Income | Female Income |
| Less than High School | - | - |
| High School Diploma | $34,650 | $0 |
| College or Associate's Degree | - | - |
| Bachelor's Degree | - | - |
| Graduate Degree | - | - |
| Total | $45,089 | $0 |
Family Income in Vander
Family Income Brackets in Vander
According to the Vander family income data, there are 133 families falling into the $75,000 to $99,999 income range, which is the most common income bracket and makes up 30.9% of all families.
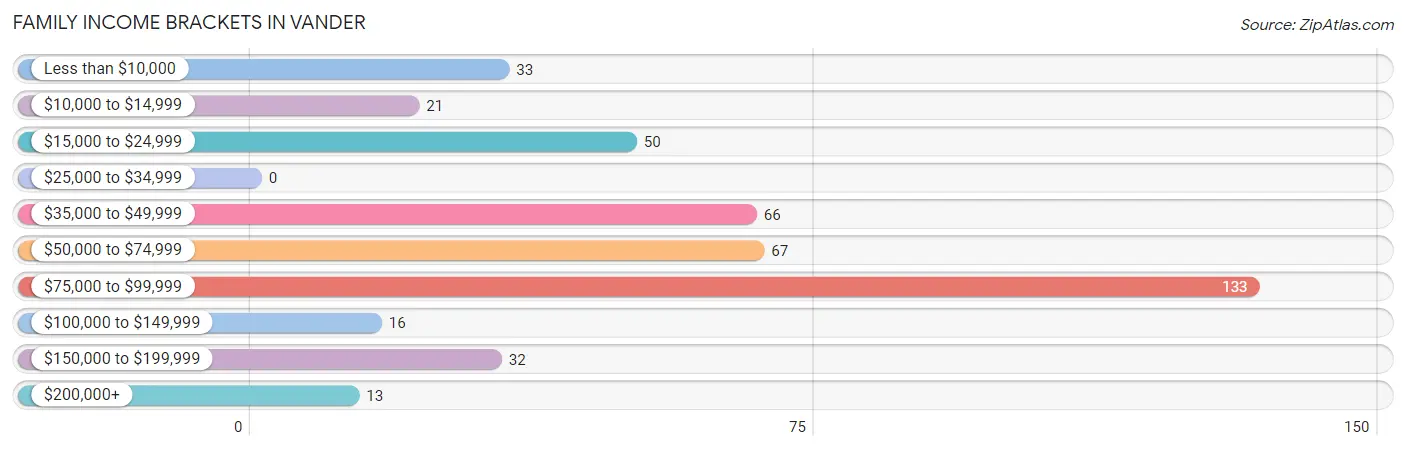
| Income Bracket | # Families | % Families |
| Less than $10,000 | 33 | 7.7% |
| $10,000 to $14,999 | 21 | 4.9% |
| $15,000 to $24,999 | 50 | 11.6% |
| $25,000 to $34,999 | 0 | 0.0% |
| $35,000 to $49,999 | 66 | 15.3% |
| $50,000 to $74,999 | 67 | 15.5% |
| $75,000 to $99,999 | 133 | 30.9% |
| $100,000 to $149,999 | 16 | 3.7% |
| $150,000 to $199,999 | 32 | 7.4% |
| $200,000+ | 13 | 3.0% |
Family Income by Famaliy Size in Vander
2-person families (263 | 61.0%) account for the highest median family income in Vander with $82,538 per family, while 2-person families (263 | 61.0%) have the highest median income of $41,269 per family member.
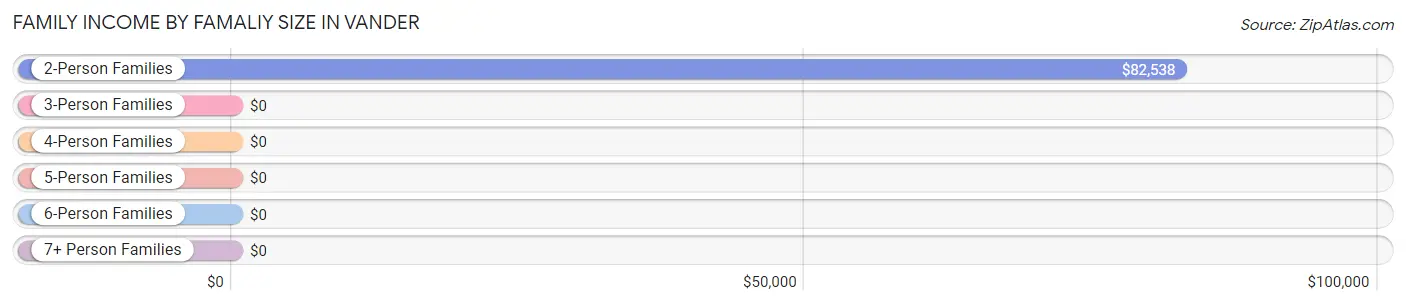
| Income Bracket | # Families | Median Income |
| 2-Person Families | 263 (61.0%) | $82,538 |
| 3-Person Families | 122 (28.3%) | $0 |
| 4-Person Families | 32 (7.4%) | $0 |
| 5-Person Families | 14 (3.3%) | $0 |
| 6-Person Families | 0 (0.0%) | $0 |
| 7+ Person Families | 0 (0.0%) | $0 |
| Total | 431 (100.0%) | $68,618 |
Family Income by Number of Earners in Vander
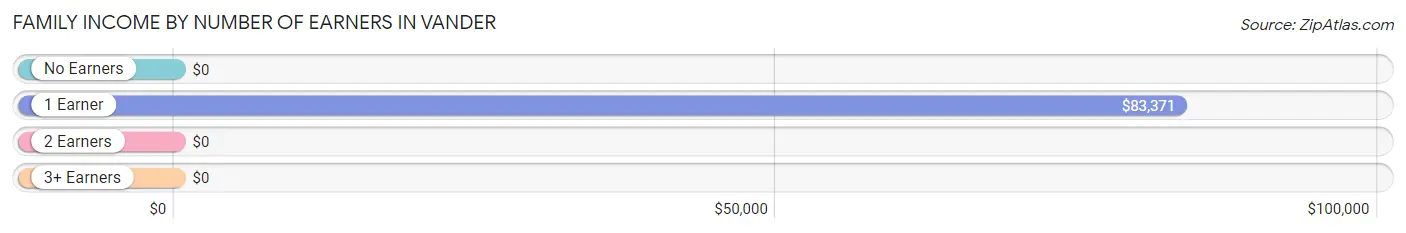
| Number of Earners | # Families | Median Income |
| No Earners | 146 (33.9%) | $0 |
| 1 Earner | 225 (52.2%) | $83,371 |
| 2 Earners | 60 (13.9%) | $0 |
| 3+ Earners | 0 (0.0%) | $0 |
| Total | 431 (100.0%) | $68,618 |
Household Income in Vander
Household Income Brackets in Vander
With 151 households falling in the category, the $75,000 to $99,999 income range is the most frequent in Vander, accounting for 25.6% of all households. In contrast, only 13 households (2.2%) fall into the $25,000 to $34,999 income bracket, making it the least populous group.
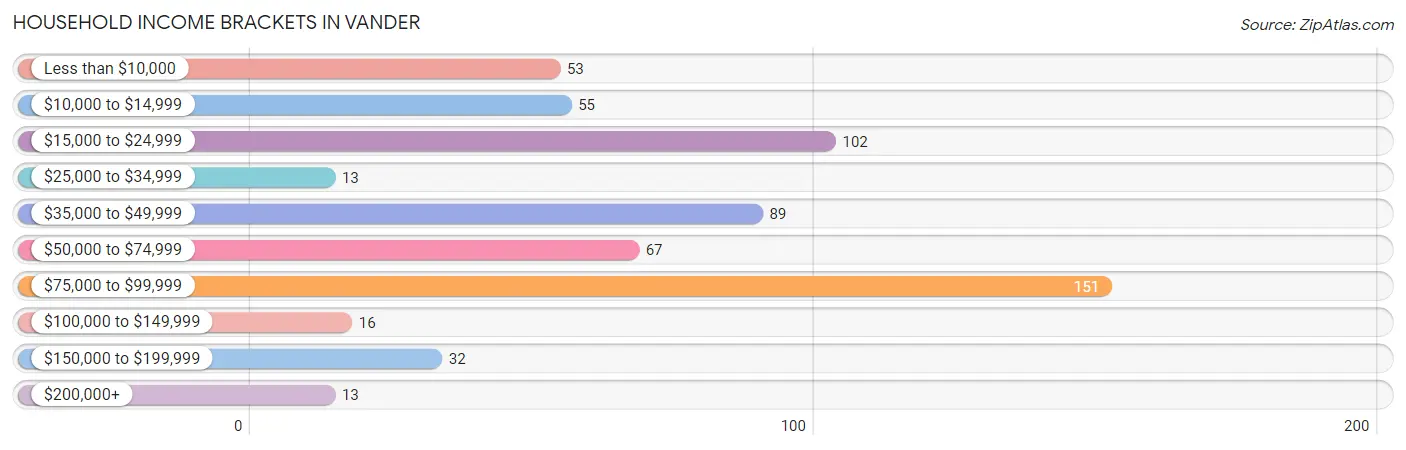
| Income Bracket | # Households | % Households |
| Less than $10,000 | 53 | 9.0% |
| $10,000 to $14,999 | 55 | 9.3% |
| $15,000 to $24,999 | 102 | 17.3% |
| $25,000 to $34,999 | 13 | 2.2% |
| $35,000 to $49,999 | 89 | 15.1% |
| $50,000 to $74,999 | 67 | 11.3% |
| $75,000 to $99,999 | 151 | 25.5% |
| $100,000 to $149,999 | 16 | 2.7% |
| $150,000 to $199,999 | 32 | 5.4% |
| $200,000+ | 13 | 2.2% |
Household Income by Householder Age in Vander
The median household income in Vander is $45,875, with the highest median household income of $82,992 found in the 45 to 64 years age bracket for the primary householder. A total of 225 households (38.1%) fall into this category. Meanwhile, the 15 to 24 years age bracket for the primary householder has the lowest median household income of $0, with 13 households (2.2%) in this group.
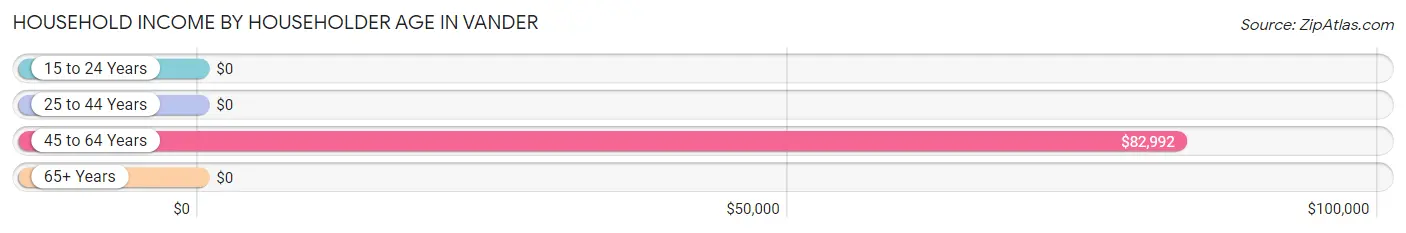
| Income Bracket | # Households | Median Income |
| 15 to 24 Years | 13 (2.2%) | $0 |
| 25 to 44 Years | 134 (22.7%) | $0 |
| 45 to 64 Years | 225 (38.1%) | $82,992 |
| 65+ Years | 219 (37.1%) | $0 |
| Total | 591 (100.0%) | $45,875 |
Poverty in Vander
Income Below Poverty by Sex and Age in Vander
With 35.6% poverty level for males and 25.5% for females among the residents of Vander, 15 year old males and 18 to 24 year old females are the most vulnerable to poverty, with 90 males (100.0%) and 13 females (100.0%) in their respective age groups living below the poverty level.
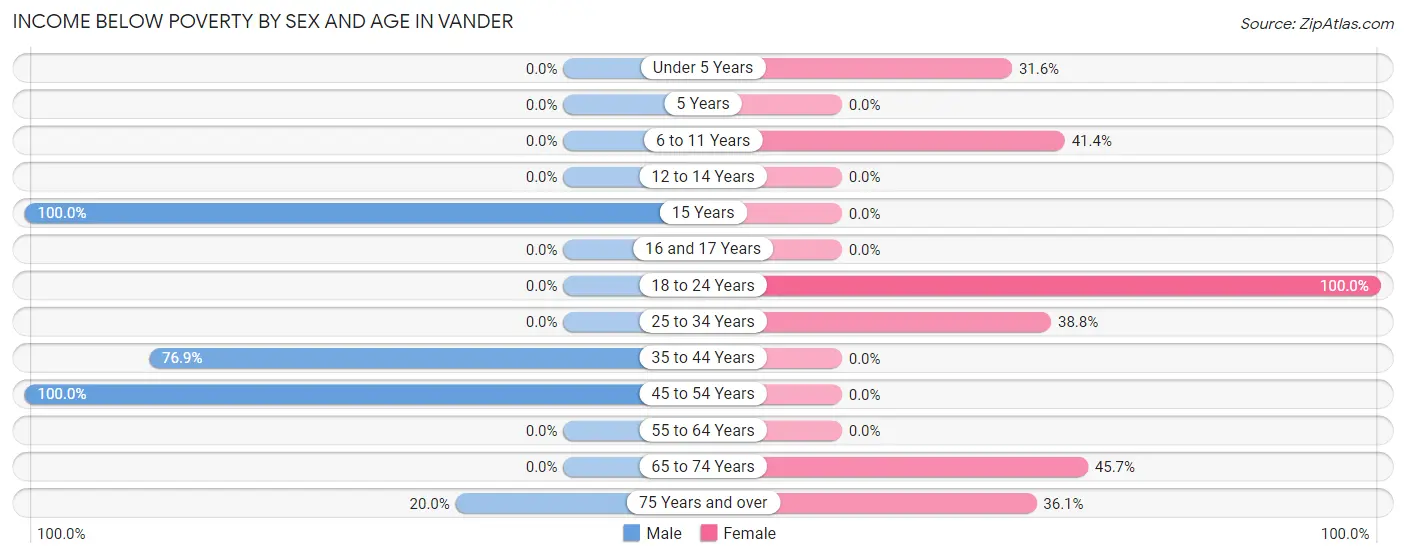
| Age Bracket | Male | Female |
| Under 5 Years | 0 (0.0%) | 18 (31.6%) |
| 5 Years | 0 (0.0%) | 0 (0.0%) |
| 6 to 11 Years | 0 (0.0%) | 12 (41.4%) |
| 12 to 14 Years | 0 (0.0%) | 0 (0.0%) |
| 15 Years | 90 (100.0%) | 0 (0.0%) |
| 16 and 17 Years | 0 (0.0%) | 0 (0.0%) |
| 18 to 24 Years | 0 (0.0%) | 13 (100.0%) |
| 25 to 34 Years | 0 (0.0%) | 47 (38.8%) |
| 35 to 44 Years | 143 (76.9%) | 0 (0.0%) |
| 45 to 54 Years | 21 (100.0%) | 0 (0.0%) |
| 55 to 64 Years | 0 (0.0%) | 0 (0.0%) |
| 65 to 74 Years | 0 (0.0%) | 58 (45.7%) |
| 75 Years and over | 12 (20.0%) | 39 (36.1%) |
| Total | 266 (35.6%) | 187 (25.5%) |
Income Above Poverty by Sex and Age in Vander
According to the poverty statistics in Vander, males aged under 5 years and females aged 12 to 14 years are the age groups that are most secure financially, with 100.0% of males and 100.0% of females in these age groups living above the poverty line.
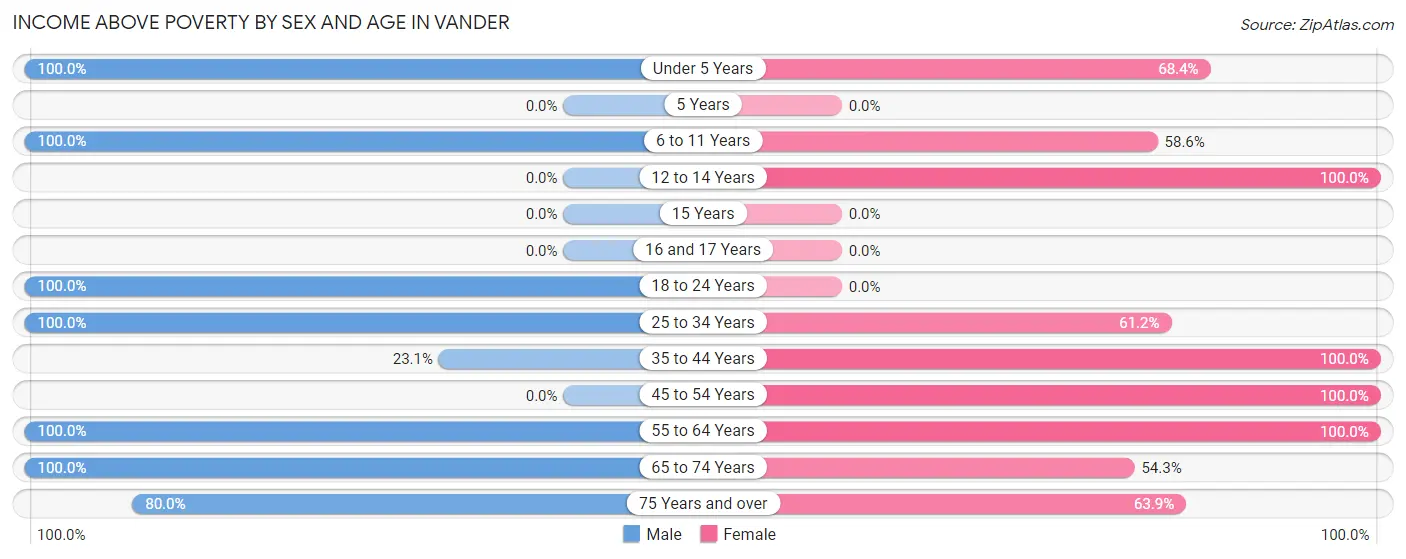
| Age Bracket | Male | Female |
| Under 5 Years | 38 (100.0%) | 39 (68.4%) |
| 5 Years | 0 (0.0%) | 0 (0.0%) |
| 6 to 11 Years | 57 (100.0%) | 17 (58.6%) |
| 12 to 14 Years | 0 (0.0%) | 32 (100.0%) |
| 15 Years | 0 (0.0%) | 0 (0.0%) |
| 16 and 17 Years | 0 (0.0%) | 0 (0.0%) |
| 18 to 24 Years | 40 (100.0%) | 0 (0.0%) |
| 25 to 34 Years | 33 (100.0%) | 74 (61.2%) |
| 35 to 44 Years | 43 (23.1%) | 28 (100.0%) |
| 45 to 54 Years | 0 (0.0%) | 148 (100.0%) |
| 55 to 64 Years | 195 (100.0%) | 70 (100.0%) |
| 65 to 74 Years | 28 (100.0%) | 69 (54.3%) |
| 75 Years and over | 48 (80.0%) | 69 (63.9%) |
| Total | 482 (64.4%) | 546 (74.5%) |
Income Below Poverty Among Married-Couple Families in Vander
The poverty statistics for married-couple families in Vander show that 11.2% or 33 of the total 296 families live below the poverty line. Families with no children have the highest poverty rate of 13.3%, comprising of 33 families. On the other hand, families with 1 or 2 children have the lowest poverty rate of 0.0%, which includes 0 families.
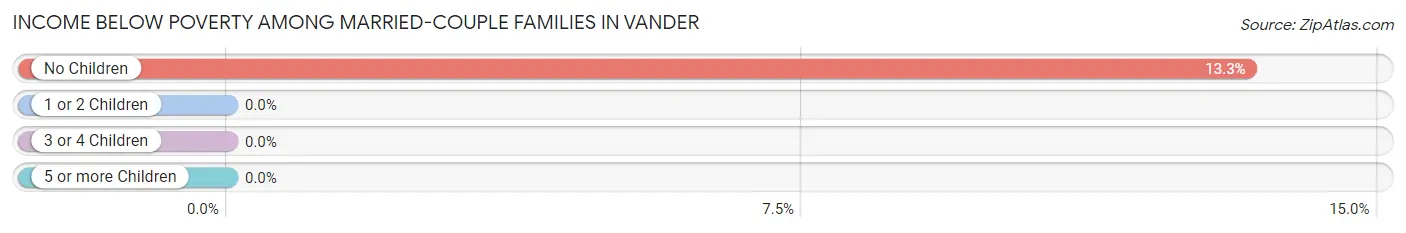
| Children | Above Poverty | Below Poverty |
| No Children | 215 (86.7%) | 33 (13.3%) |
| 1 or 2 Children | 34 (100.0%) | 0 (0.0%) |
| 3 or 4 Children | 14 (100.0%) | 0 (0.0%) |
| 5 or more Children | 0 (0.0%) | 0 (0.0%) |
| Total | 263 (88.8%) | 33 (11.2%) |
Income Below Poverty Among Single-Parent Households in Vander
According to the poverty data in Vander, 100.0% or 20 single-father households and 44.4% or 51 single-mother households are living below the poverty line. Among single-father households, those with 1 or 2 children have the highest poverty rate, with 20 households (100.0%) experiencing poverty. Likewise, among single-mother households, those with 1 or 2 children have the highest poverty rate, with 51 households (79.7%) falling below the poverty line.
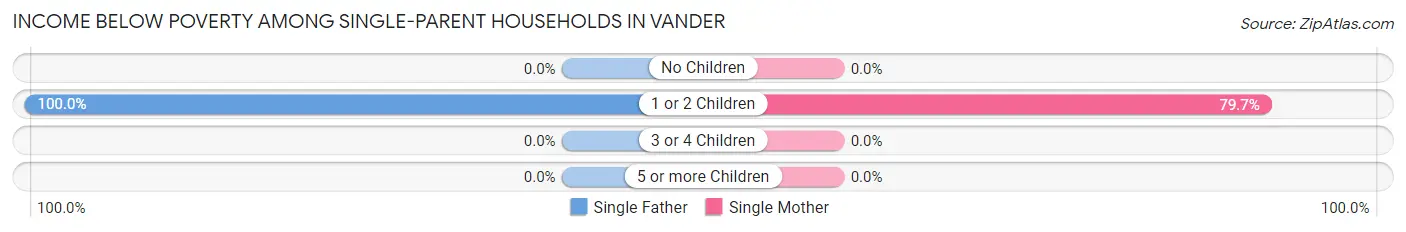
| Children | Single Father | Single Mother |
| No Children | 0 (0.0%) | 0 (0.0%) |
| 1 or 2 Children | 20 (100.0%) | 51 (79.7%) |
| 3 or 4 Children | 0 (0.0%) | 0 (0.0%) |
| 5 or more Children | 0 (0.0%) | 0 (0.0%) |
| Total | 20 (100.0%) | 51 (44.4%) |
Income Below Poverty Among Married-Couple vs Single-Parent Households in Vander
The poverty data for Vander shows that 33 of the married-couple family households (11.2%) and 71 of the single-parent households (52.6%) are living below the poverty level. Within the married-couple family households, those with no children have the highest poverty rate, with 33 households (13.3%) falling below the poverty line. Among the single-parent households, those with 1 or 2 children have the highest poverty rate, with 71 household (84.5%) living below poverty.
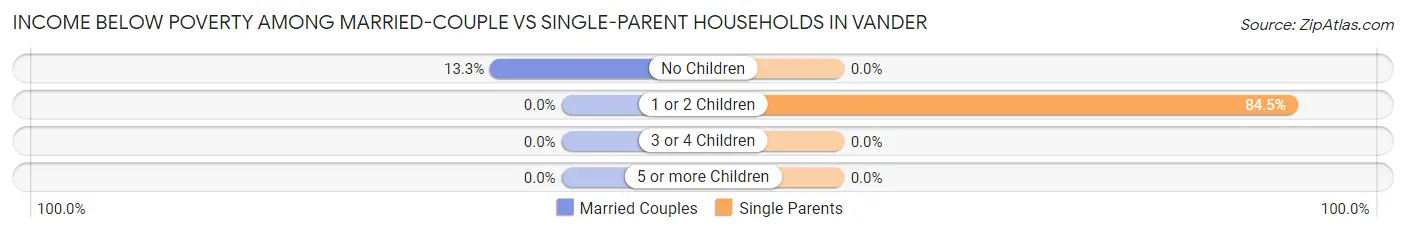
| Children | Married-Couple Families | Single-Parent Households |
| No Children | 33 (13.3%) | 0 (0.0%) |
| 1 or 2 Children | 0 (0.0%) | 71 (84.5%) |
| 3 or 4 Children | 0 (0.0%) | 0 (0.0%) |
| 5 or more Children | 0 (0.0%) | 0 (0.0%) |
| Total | 33 (11.2%) | 71 (52.6%) |
Race in Vander
The most populous races in Vander are White / Caucasian (754 | 50.9%), Black / African American (565 | 38.2%), and Two or more Races (120 | 8.1%).
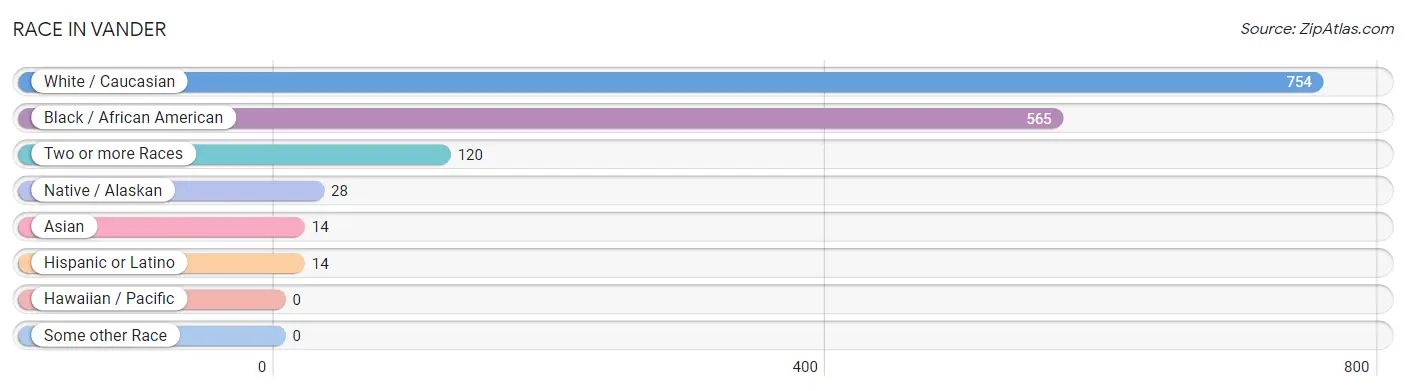
| Race | # Population | % Population |
| Asian | 14 | 0.9% |
| Black / African American | 565 | 38.2% |
| Hawaiian / Pacific | 0 | 0.0% |
| Hispanic or Latino | 14 | 0.9% |
| Native / Alaskan | 28 | 1.9% |
| White / Caucasian | 754 | 50.9% |
| Two or more Races | 120 | 8.1% |
| Some other Race | 0 | 0.0% |
| Total | 1,481 | 100.0% |
Ancestry in Vander
The most populous ancestries reported in Vander are American (242 | 16.3%), German (136 | 9.2%), English (104 | 7.0%), Irish (104 | 7.0%), and Scottish (43 | 2.9%), together accounting for 42.5% of all Vander residents.
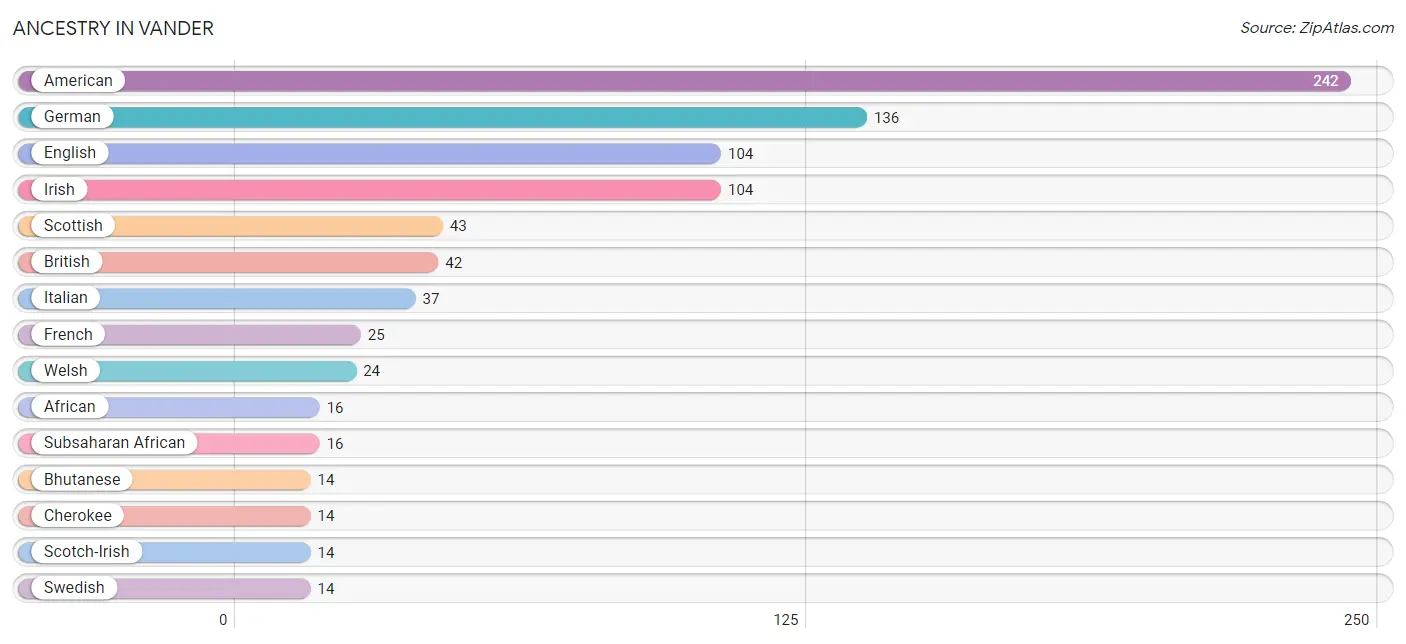
| Ancestry | # Population | % Population |
| African | 16 | 1.1% |
| American | 242 | 16.3% |
| Bhutanese | 14 | 0.9% |
| British | 42 | 2.8% |
| Cherokee | 14 | 0.9% |
| English | 104 | 7.0% |
| French | 25 | 1.7% |
| German | 136 | 9.2% |
| Irish | 104 | 7.0% |
| Italian | 37 | 2.5% |
| Scotch-Irish | 14 | 0.9% |
| Scottish | 43 | 2.9% |
| Subsaharan African | 16 | 1.1% |
| Swedish | 14 | 0.9% |
| Welsh | 24 | 1.6% | View All 15 Rows |
Immigrants in Vander
The most numerous immigrant groups reported in Vander came from Europe (27 | 1.8%), England (15 | 1.0%), Northern Europe (15 | 1.0%), Asia (14 | 0.9%), and Eastern Asia (14 | 0.9%), together accounting for 5.7% of all Vander residents.
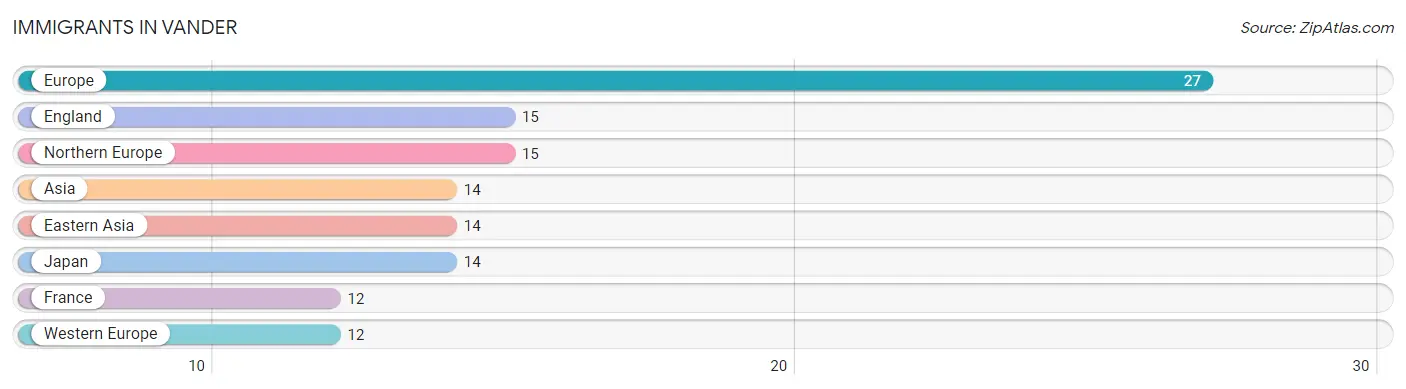
| Immigration Origin | # Population | % Population |
| Asia | 14 | 0.9% |
| Eastern Asia | 14 | 0.9% |
| England | 15 | 1.0% |
| Europe | 27 | 1.8% |
| France | 12 | 0.8% |
| Japan | 14 | 0.9% |
| Northern Europe | 15 | 1.0% |
| Western Europe | 12 | 0.8% | View All 8 Rows |
Sex and Age in Vander
Sex and Age in Vander
The most populous age groups in Vander are 40 to 44 Years (149 | 19.9%) for men and 50 to 54 Years (135 | 18.4%) for women.
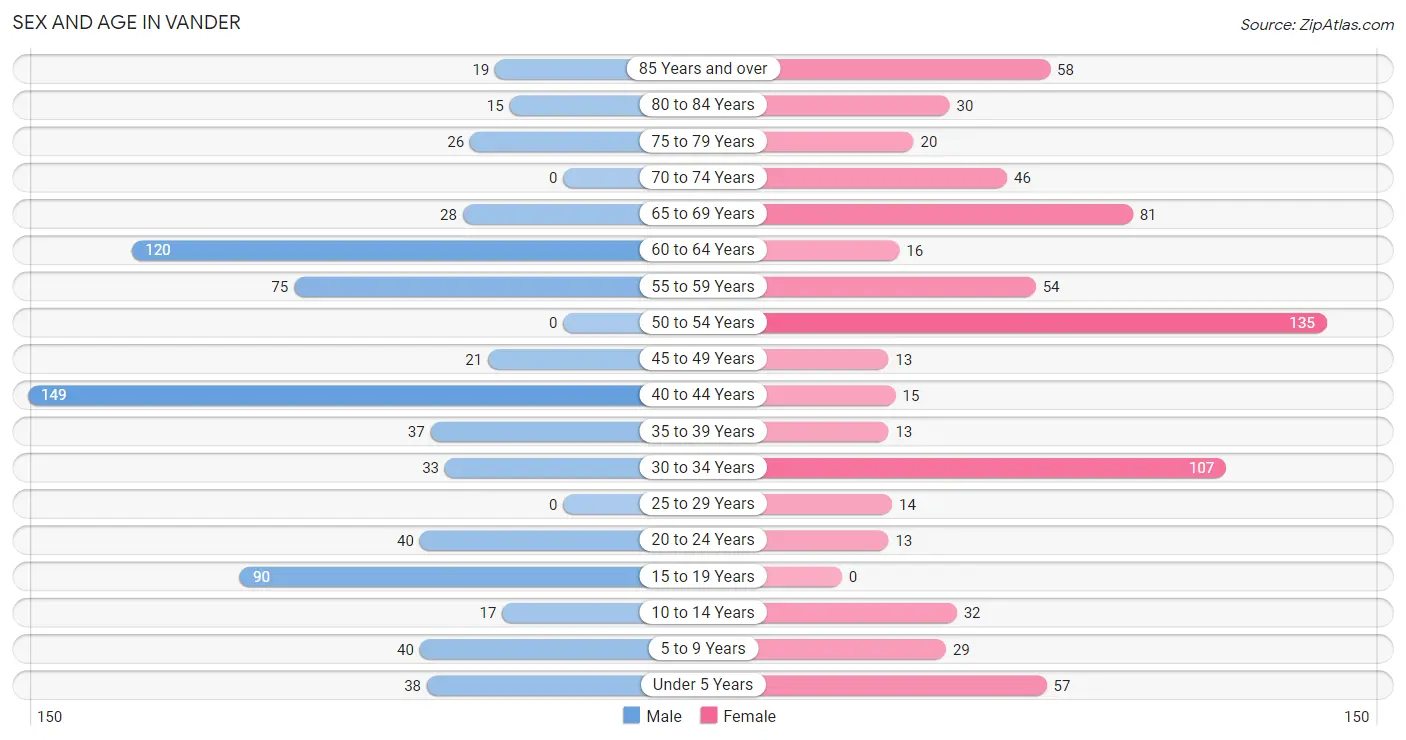
| Age Bracket | Male | Female |
| Under 5 Years | 38 (5.1%) | 57 (7.8%) |
| 5 to 9 Years | 40 (5.3%) | 29 (4.0%) |
| 10 to 14 Years | 17 (2.3%) | 32 (4.4%) |
| 15 to 19 Years | 90 (12.0%) | 0 (0.0%) |
| 20 to 24 Years | 40 (5.3%) | 13 (1.8%) |
| 25 to 29 Years | 0 (0.0%) | 14 (1.9%) |
| 30 to 34 Years | 33 (4.4%) | 107 (14.6%) |
| 35 to 39 Years | 37 (5.0%) | 13 (1.8%) |
| 40 to 44 Years | 149 (19.9%) | 15 (2.1%) |
| 45 to 49 Years | 21 (2.8%) | 13 (1.8%) |
| 50 to 54 Years | 0 (0.0%) | 135 (18.4%) |
| 55 to 59 Years | 75 (10.0%) | 54 (7.4%) |
| 60 to 64 Years | 120 (16.0%) | 16 (2.2%) |
| 65 to 69 Years | 28 (3.7%) | 81 (11.1%) |
| 70 to 74 Years | 0 (0.0%) | 46 (6.3%) |
| 75 to 79 Years | 26 (3.5%) | 20 (2.7%) |
| 80 to 84 Years | 15 (2.0%) | 30 (4.1%) |
| 85 Years and over | 19 (2.5%) | 58 (7.9%) |
| Total | 748 (100.0%) | 733 (100.0%) |
Families and Households in Vander
Median Family Size in Vander
The median family size in Vander is 2.97 persons per family, with single female/mother families (115 | 26.7%) accounting for the largest median family size of 4 persons per family. On the other hand, single male/father families (20 | 4.6%) represent the smallest median family size with 2.10 persons per family.
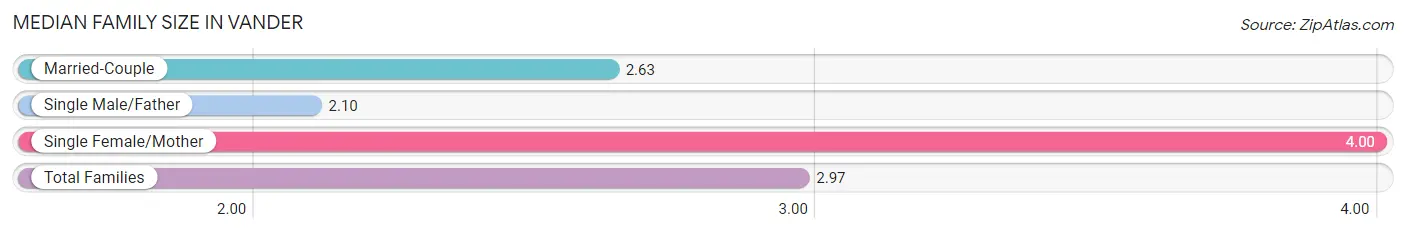
| Family Type | # Families | Family Size |
| Married-Couple | 296 (68.7%) | 2.63 |
| Single Male/Father | 20 (4.6%) | 2.10 |
| Single Female/Mother | 115 (26.7%) | 4.00 |
| Total Families | 431 (100.0%) | 2.97 |
Median Household Size in Vander
The median household size in Vander is 2.51 persons per household, with single female/mother households (115 | 19.5%) accounting for the largest median household size of 4.13 persons per household. non-family households (160 | 27.1%) represent the smallest median household size with 1.17 persons per household.
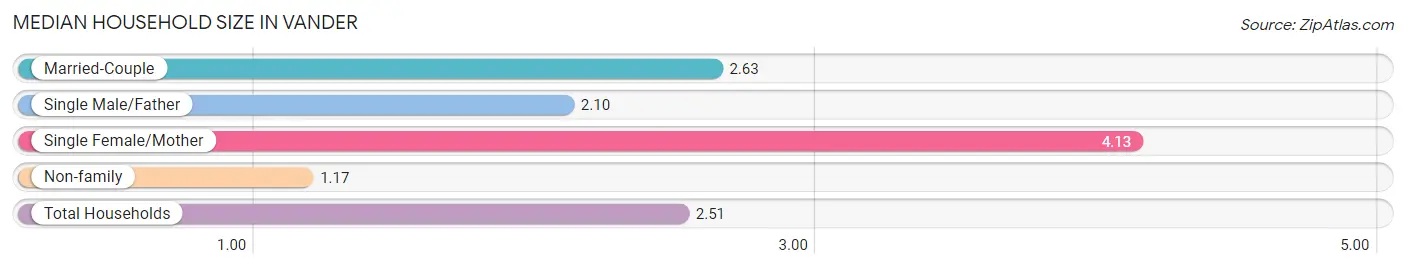
| Household Type | # Households | Household Size |
| Married-Couple | 296 (50.1%) | 2.63 |
| Single Male/Father | 20 (3.4%) | 2.10 |
| Single Female/Mother | 115 (19.5%) | 4.13 |
| Non-family | 160 (27.1%) | 1.17 |
| Total Households | 591 (100.0%) | 2.51 |
Household Size by Marriage Status in Vander
Out of a total of 591 households in Vander, 431 (72.9%) are family households, while 160 (27.1%) are nonfamily households. The most numerous type of family households are 2-person households, comprising 250, and the most common type of nonfamily households are 1-person households, comprising 137.
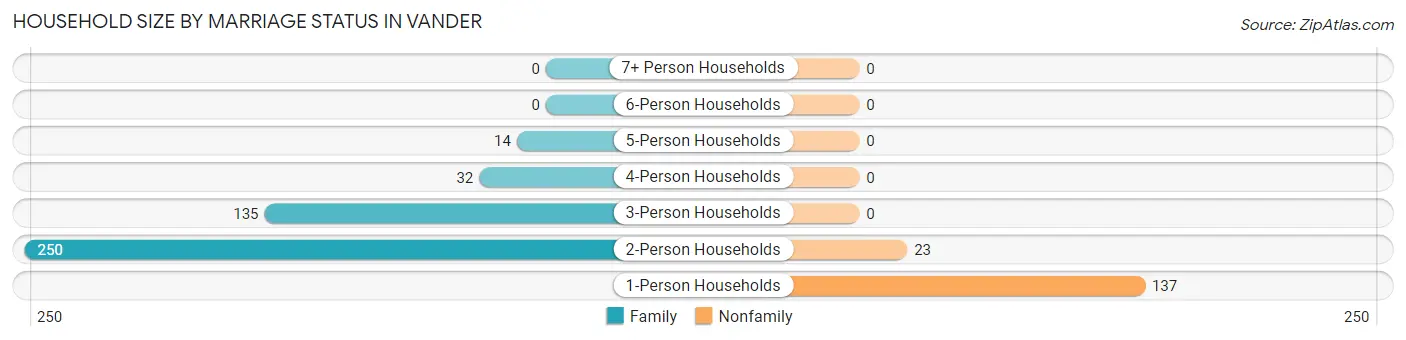
| Household Size | Family Households | Nonfamily Households |
| 1-Person Households | - | 137 (23.2%) |
| 2-Person Households | 250 (42.3%) | 23 (3.9%) |
| 3-Person Households | 135 (22.8%) | 0 (0.0%) |
| 4-Person Households | 32 (5.4%) | 0 (0.0%) |
| 5-Person Households | 14 (2.4%) | 0 (0.0%) |
| 6-Person Households | 0 (0.0%) | 0 (0.0%) |
| 7+ Person Households | 0 (0.0%) | 0 (0.0%) |
| Total | 431 (72.9%) | 160 (27.1%) |
Female Fertility in Vander
Fertility by Age in Vander
Average fertility rate in Vander is 257.0 births per 1,000 women. Women in the age bracket of 35 to 50 years have the highest fertility rate with 634.0 births per 1,000 women. Women in the age bracket of 35 to 50 years acount for 57.8% of all women with births.

| Age Bracket | Women with Births | Births / 1,000 Women |
| 15 to 19 years | 0 (0.0%) | 0.0 |
| 20 to 34 years | 19 (42.2%) | 142.0 |
| 35 to 50 years | 26 (57.8%) | 634.0 |
| Total | 45 (100.0%) | 257.0 |
Fertility by Age by Marriage Status in Vander
71.1% of women with births (45) in Vander are married. The highest percentage of unmarried women with births falls into 35 to 50 years age bracket with 50.0% of them unmarried at the time of birth, while the lowest percentage of unmarried women with births belong to 20 to 34 years age bracket with 0.0% of them unmarried.
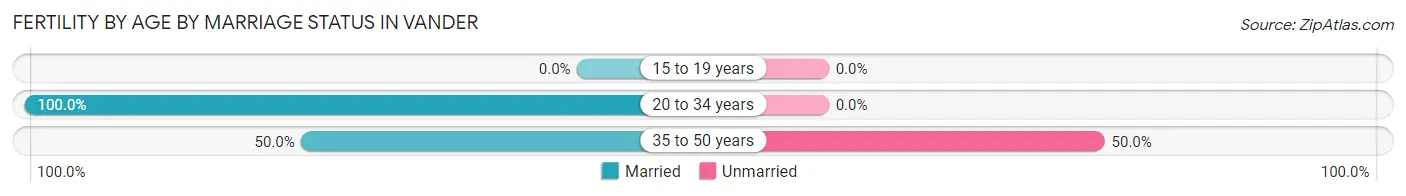
| Age Bracket | Married | Unmarried |
| 15 to 19 years | 0 (0.0%) | 0 (0.0%) |
| 20 to 34 years | 19 (100.0%) | 0 (0.0%) |
| 35 to 50 years | 13 (50.0%) | 13 (50.0%) |
| Total | 32 (71.1%) | 13 (28.9%) |
Fertility by Education in Vander
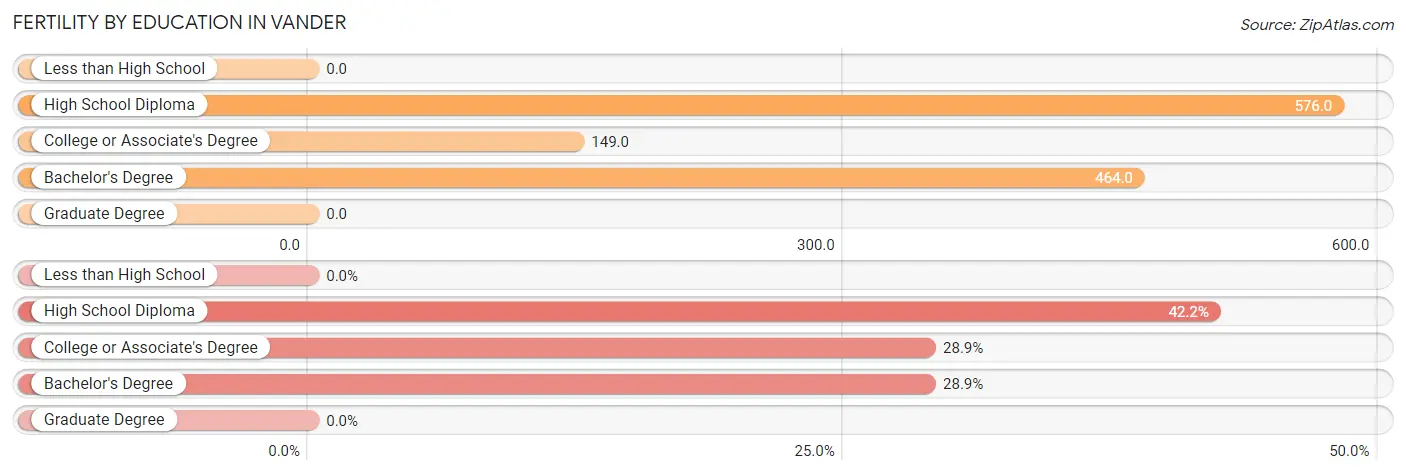
| Educational Attainment | Women with Births | Births / 1,000 Women |
| Less than High School | 0 (0.0%) | 0.0 |
| High School Diploma | 19 (42.2%) | 576.0 |
| College or Associate's Degree | 13 (28.9%) | 149.0 |
| Bachelor's Degree | 13 (28.9%) | 464.0 |
| Graduate Degree | 0 (0.0%) | 0.0 |
| Total | 45 (100.0%) | 257.0 |
Fertility by Education by Marriage Status in Vander
28.9% of women with births in Vander are unmarried. Women with the educational attainment of high school diploma are most likely to be married with 100.0% of them married at childbirth, while women with the educational attainment of bachelor's degree are least likely to be married with 100.0% of them unmarried at childbirth.
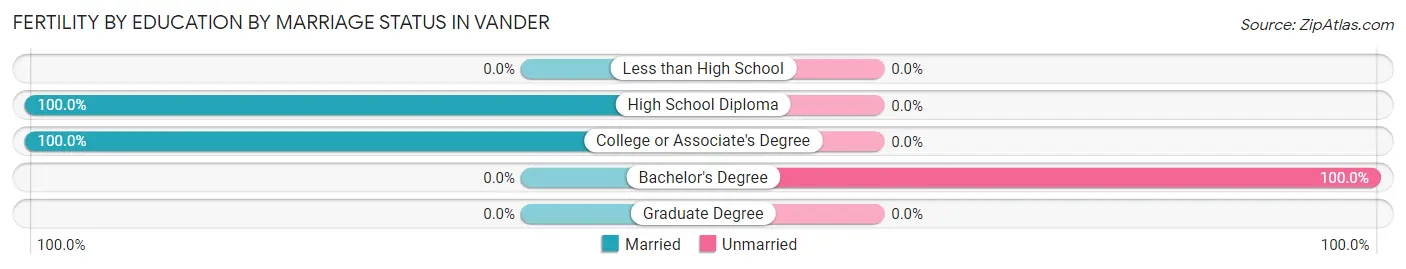
| Educational Attainment | Married | Unmarried |
| Less than High School | 0 (0.0%) | 0 (0.0%) |
| High School Diploma | 19 (100.0%) | 0 (0.0%) |
| College or Associate's Degree | 13 (100.0%) | 0 (0.0%) |
| Bachelor's Degree | 0 (0.0%) | 13 (100.0%) |
| Graduate Degree | 0 (0.0%) | 0 (0.0%) |
| Total | 32 (71.1%) | 13 (28.9%) |
Employment Characteristics in Vander
Employment by Class of Employer in Vander
Among the 447 employed individuals in Vander, private company employees (378 | 84.6%), not-for-profit organizations (29 | 6.5%), and federal government employees (16 | 3.6%) make up the most common classes of employment.
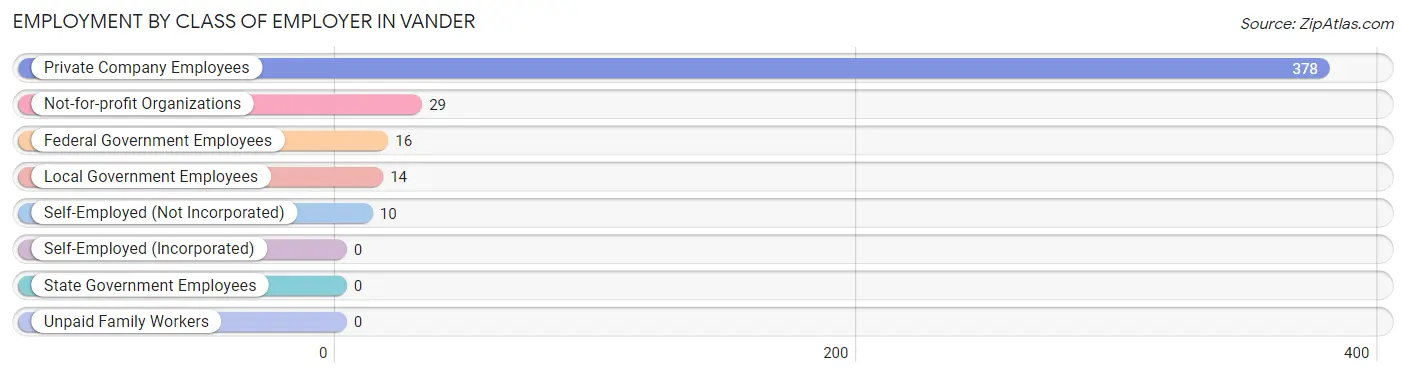
| Employer Class | # Employees | % Employees |
| Private Company Employees | 378 | 84.6% |
| Self-Employed (Incorporated) | 0 | 0.0% |
| Self-Employed (Not Incorporated) | 10 | 2.2% |
| Not-for-profit Organizations | 29 | 6.5% |
| Local Government Employees | 14 | 3.1% |
| State Government Employees | 0 | 0.0% |
| Federal Government Employees | 16 | 3.6% |
| Unpaid Family Workers | 0 | 0.0% |
| Total | 447 | 100.0% |
Employment Status by Age in Vander
According to the labor force statistics for Vander, out of the total population over 16 years of age (1,178), 42.3% or 498 individuals are in the labor force, with 10.2% or 51 of them unemployed. The age group with the highest labor force participation rate is 25 to 29 years, with 100.0% or 14 individuals in the labor force. Within the labor force, the 20 to 24 years age range has the highest percentage of unemployed individuals, with 100.0% or 22 of them being unemployed.
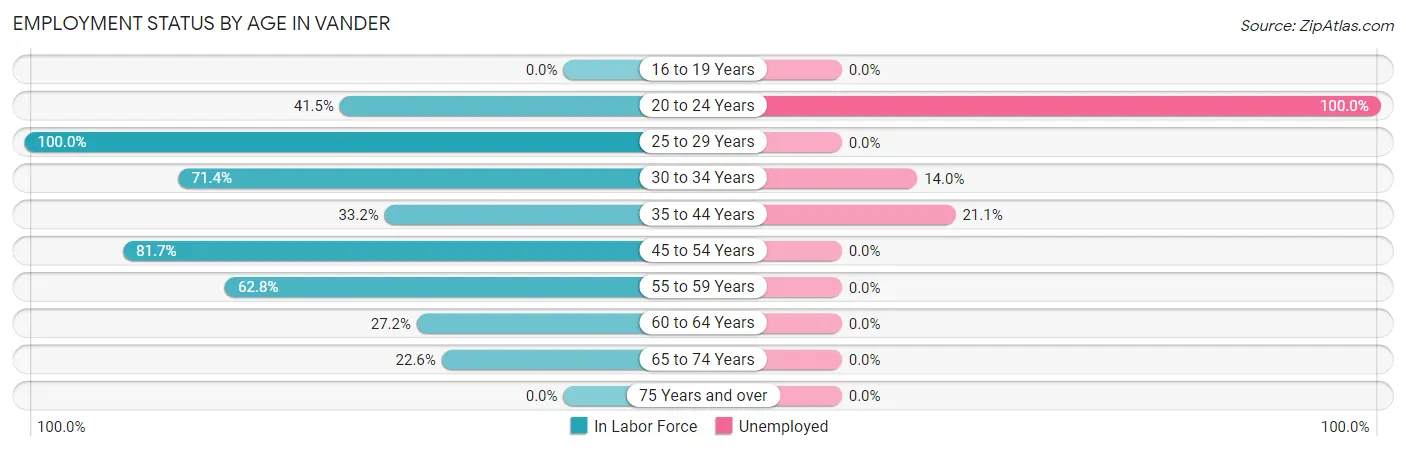
| Age Bracket | In Labor Force | Unemployed |
| 16 to 19 Years | 0 (0.0%) | 0 (0.0%) |
| 20 to 24 Years | 22 (41.5%) | 22 (100.0%) |
| 25 to 29 Years | 14 (100.0%) | 0 (0.0%) |
| 30 to 34 Years | 100 (71.4%) | 14 (14.0%) |
| 35 to 44 Years | 71 (33.2%) | 15 (21.1%) |
| 45 to 54 Years | 138 (81.7%) | 0 (0.0%) |
| 55 to 59 Years | 81 (62.8%) | 0 (0.0%) |
| 60 to 64 Years | 37 (27.2%) | 0 (0.0%) |
| 65 to 74 Years | 35 (22.6%) | 0 (0.0%) |
| 75 Years and over | 0 (0.0%) | 0 (0.0%) |
| Total | 498 (42.3%) | 51 (10.2%) |
Employment Status by Educational Attainment in Vander
According to labor force statistics for Vander, 55.0% of individuals (441) out of the total population between 25 and 64 years of age (802) are in the labor force, with 6.6% or 29 of them being unemployed. The group with the highest labor force participation rate are those with the educational attainment of college / associate degree, with 68.2% or 279 individuals in the labor force. Within the labor force, individuals with bachelor's degree or higher education have the highest percentage of unemployment, with 21.1% or 15 of them being unemployed.
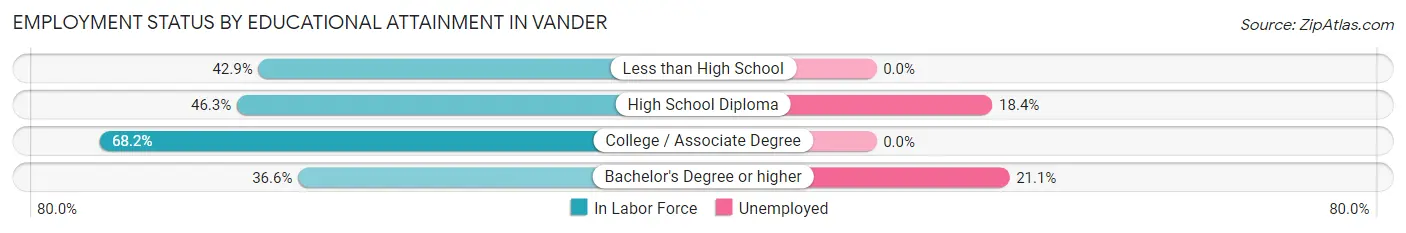
| Educational Attainment | In Labor Force | Unemployed |
| Less than High School | 15 (42.9%) | 0 (0.0%) |
| High School Diploma | 76 (46.3%) | 30 (18.4%) |
| College / Associate Degree | 279 (68.2%) | 0 (0.0%) |
| Bachelor's Degree or higher | 71 (36.6%) | 41 (21.1%) |
| Total | 441 (55.0%) | 53 (6.6%) |
Employment Occupations by Sex in Vander
Management, Business, Science and Arts Occupations
The most common Management, Business, Science and Arts occupations in Vander are Business & Financial (125 | 28.0%), Management (42 | 9.4%), Community & Social Service (29 | 6.5%), Education, Arts & Media (29 | 6.5%), and Health Diagnosing & Treating (14 | 3.1%).
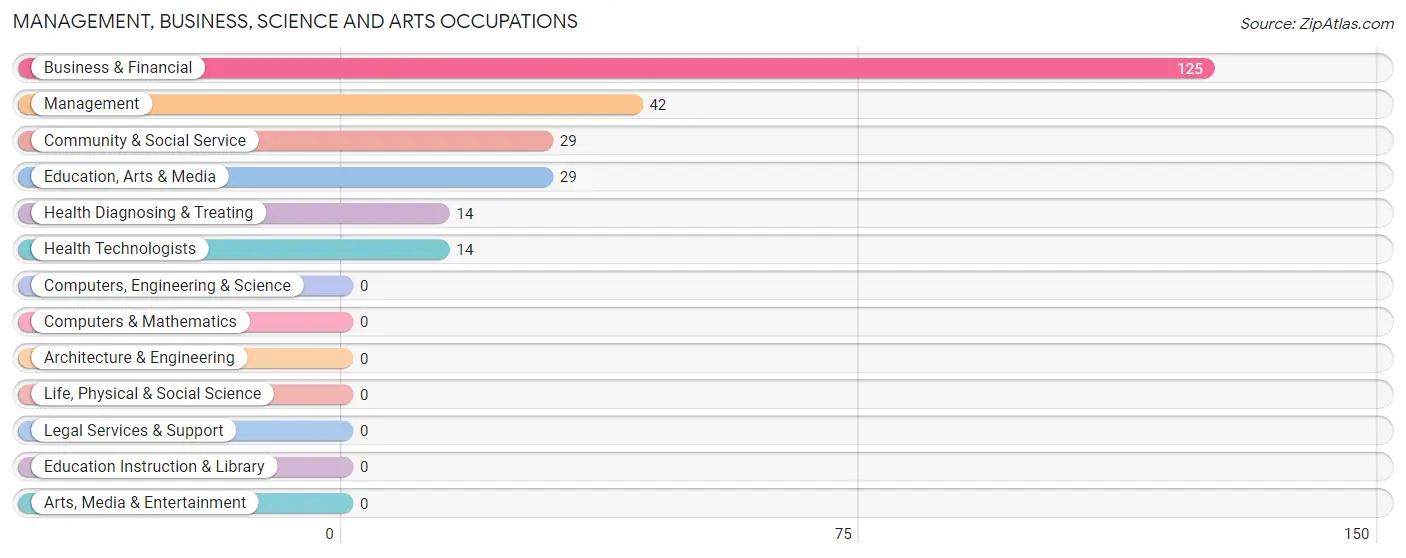
Management, Business, Science and Arts Occupations by Sex
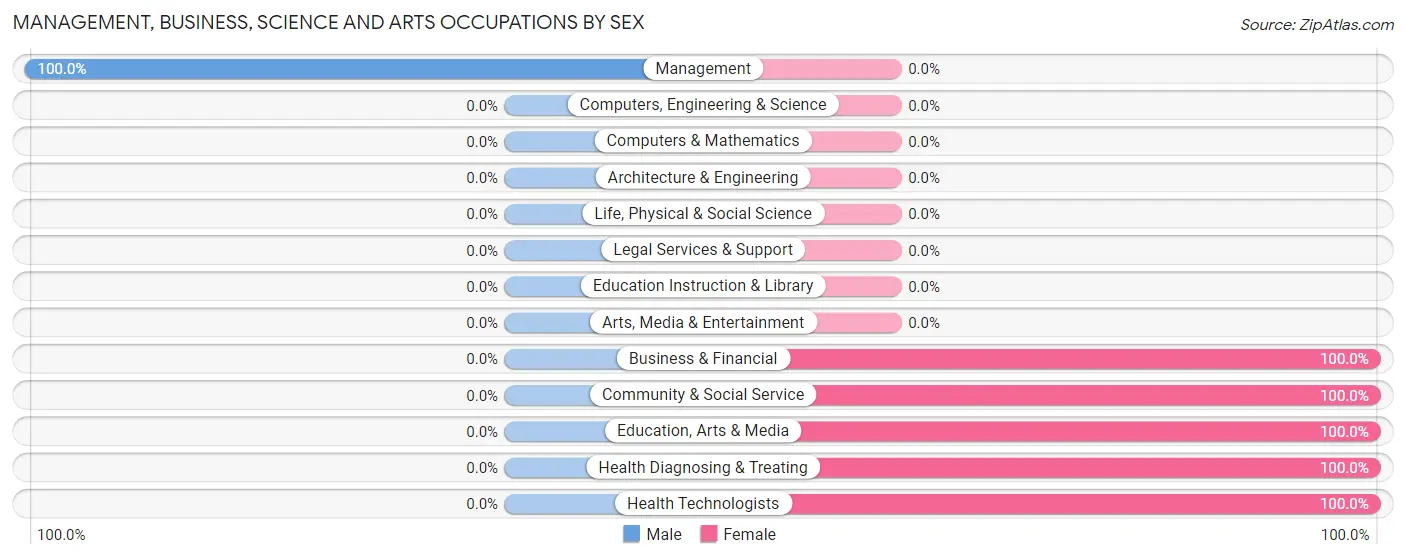
| Occupation | Male | Female |
| Management | 42 (100.0%) | 0 (0.0%) |
| Business & Financial | 0 (0.0%) | 125 (100.0%) |
| Computers, Engineering & Science | 0 (0.0%) | 0 (0.0%) |
| Computers & Mathematics | 0 (0.0%) | 0 (0.0%) |
| Architecture & Engineering | 0 (0.0%) | 0 (0.0%) |
| Life, Physical & Social Science | 0 (0.0%) | 0 (0.0%) |
| Community & Social Service | 0 (0.0%) | 29 (100.0%) |
| Education, Arts & Media | 0 (0.0%) | 29 (100.0%) |
| Legal Services & Support | 0 (0.0%) | 0 (0.0%) |
| Education Instruction & Library | 0 (0.0%) | 0 (0.0%) |
| Arts, Media & Entertainment | 0 (0.0%) | 0 (0.0%) |
| Health Diagnosing & Treating | 0 (0.0%) | 14 (100.0%) |
| Health Technologists | 0 (0.0%) | 14 (100.0%) |
| Total (Category) | 42 (20.0%) | 168 (80.0%) |
| Total (Overall) | 141 (31.5%) | 306 (68.5%) |
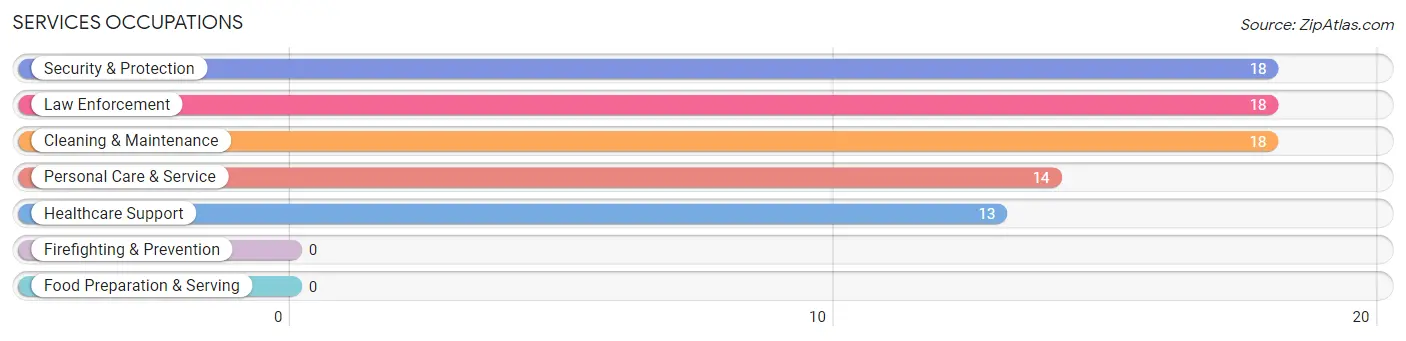
Services Occupations
The most common Services occupations in Vander are Security & Protection (18 | 4.0%), Law Enforcement (18 | 4.0%), Cleaning & Maintenance (18 | 4.0%), Personal Care & Service (14 | 3.1%), and Healthcare Support (13 | 2.9%).
Services Occupations by Sex
Within the Services occupations in Vander, the most male-oriented occupations are Security & Protection (100.0%), Law Enforcement (100.0%), and Cleaning & Maintenance (44.4%), while the most female-oriented occupations are Healthcare Support (100.0%), Personal Care & Service (100.0%), and Cleaning & Maintenance (55.6%).
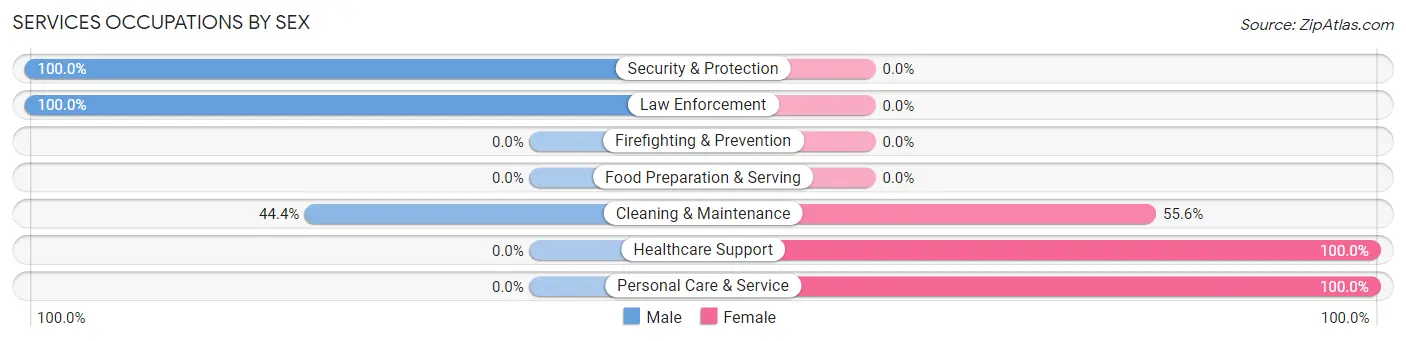
| Occupation | Male | Female |
| Healthcare Support | 0 (0.0%) | 13 (100.0%) |
| Security & Protection | 18 (100.0%) | 0 (0.0%) |
| Firefighting & Prevention | 0 (0.0%) | 0 (0.0%) |
| Law Enforcement | 18 (100.0%) | 0 (0.0%) |
| Food Preparation & Serving | 0 (0.0%) | 0 (0.0%) |
| Cleaning & Maintenance | 8 (44.4%) | 10 (55.6%) |
| Personal Care & Service | 0 (0.0%) | 14 (100.0%) |
| Total (Category) | 26 (41.3%) | 37 (58.7%) |
| Total (Overall) | 141 (31.5%) | 306 (68.5%) |
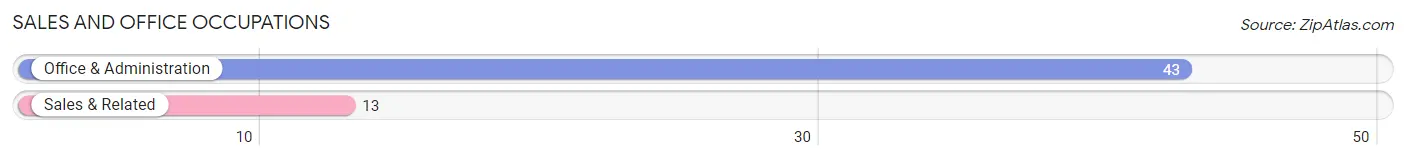
Sales and Office Occupations
The most common Sales and Office occupations in Vander are Office & Administration (43 | 9.6%), and Sales & Related (13 | 2.9%).
Sales and Office Occupations by Sex
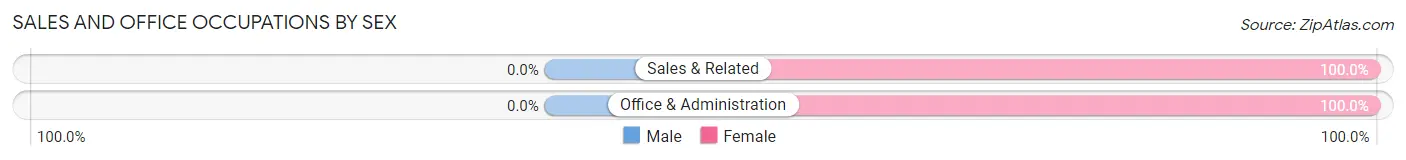
| Occupation | Male | Female |
| Sales & Related | 0 (0.0%) | 13 (100.0%) |
| Office & Administration | 0 (0.0%) | 43 (100.0%) |
| Total (Category) | 0 (0.0%) | 56 (100.0%) |
| Total (Overall) | 141 (31.5%) | 306 (68.5%) |
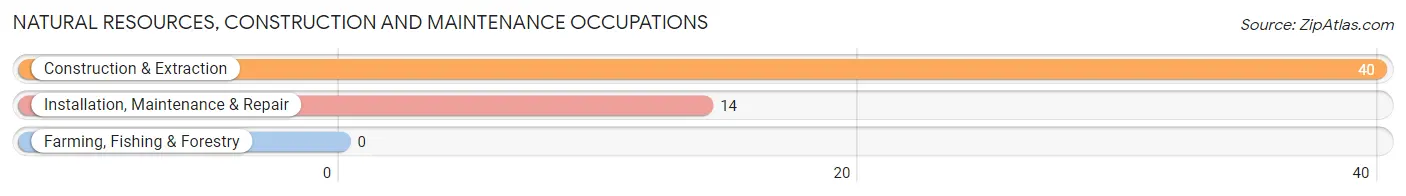
Natural Resources, Construction and Maintenance Occupations
The most common Natural Resources, Construction and Maintenance occupations in Vander are Construction & Extraction (40 | 8.9%), and Installation, Maintenance & Repair (14 | 3.1%).
Natural Resources, Construction and Maintenance Occupations by Sex
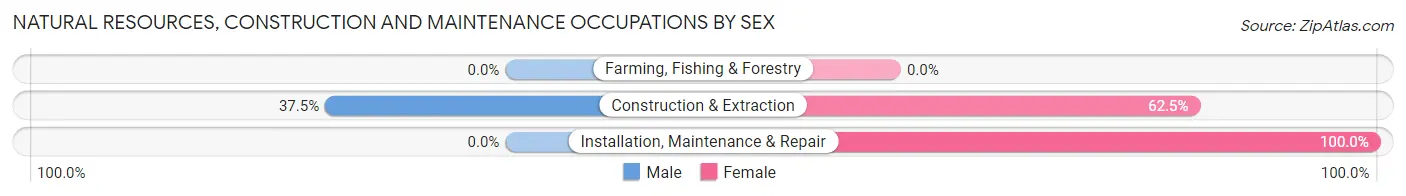
| Occupation | Male | Female |
| Farming, Fishing & Forestry | 0 (0.0%) | 0 (0.0%) |
| Construction & Extraction | 15 (37.5%) | 25 (62.5%) |
| Installation, Maintenance & Repair | 0 (0.0%) | 14 (100.0%) |
| Total (Category) | 15 (27.8%) | 39 (72.2%) |
| Total (Overall) | 141 (31.5%) | 306 (68.5%) |
Production, Transportation and Moving Occupations
The most common Production, Transportation and Moving occupations in Vander are Production (47 | 10.5%), and Material Moving (17 | 3.8%).
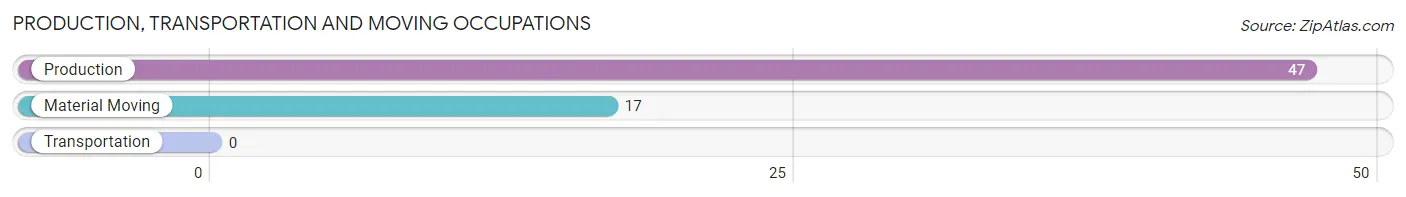
Production, Transportation and Moving Occupations by Sex
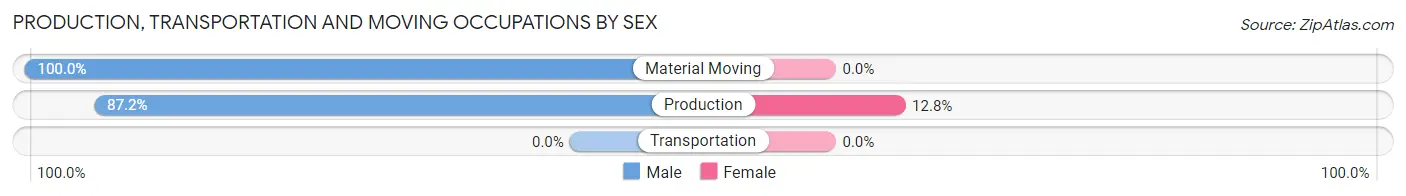
| Occupation | Male | Female |
| Production | 41 (87.2%) | 6 (12.8%) |
| Transportation | 0 (0.0%) | 0 (0.0%) |
| Material Moving | 17 (100.0%) | 0 (0.0%) |
| Total (Category) | 58 (90.6%) | 6 (9.4%) |
| Total (Overall) | 141 (31.5%) | 306 (68.5%) |
Employment Industries by Sex in Vander
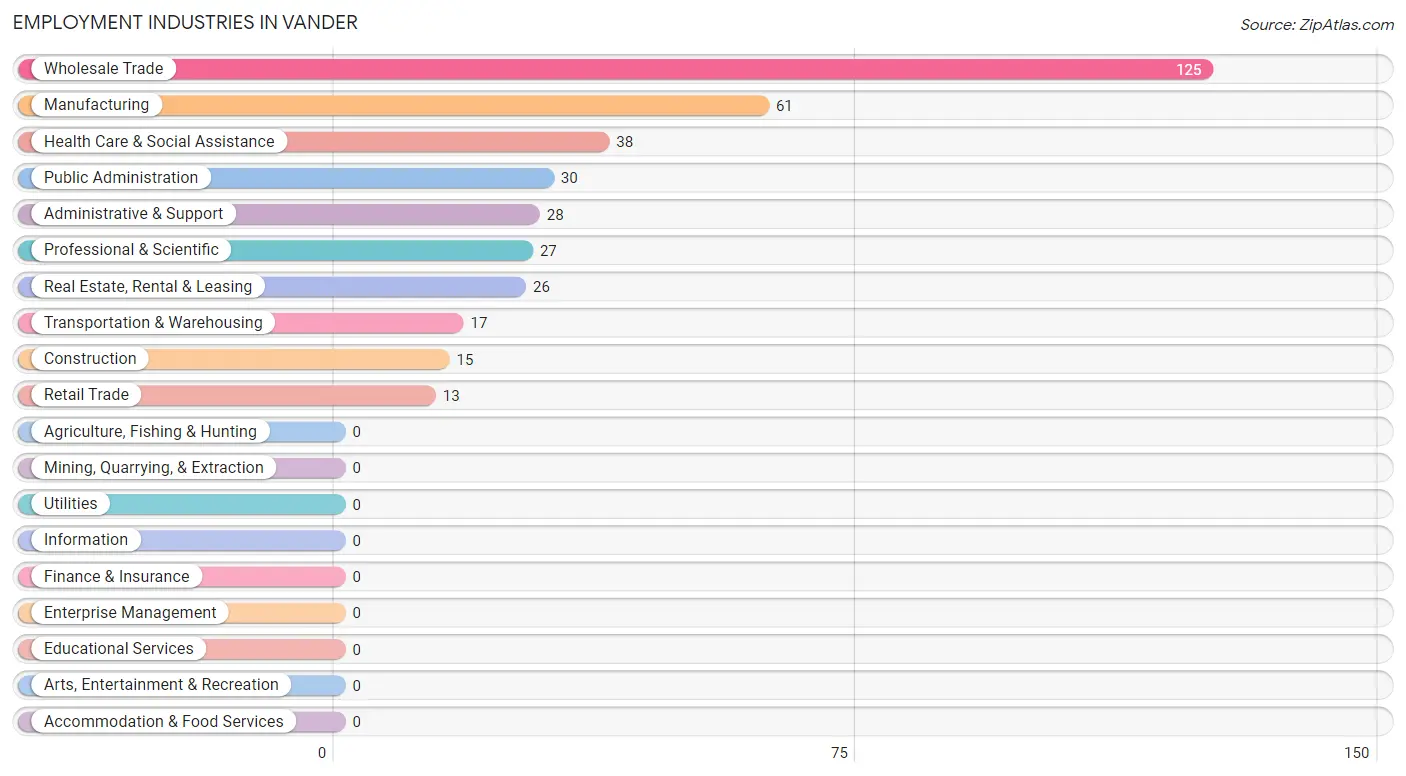
Employment Industries in Vander
The major employment industries in Vander include Wholesale Trade (125 | 28.0%), Manufacturing (61 | 13.7%), Health Care & Social Assistance (38 | 8.5%), Public Administration (30 | 6.7%), and Administrative & Support (28 | 6.3%).
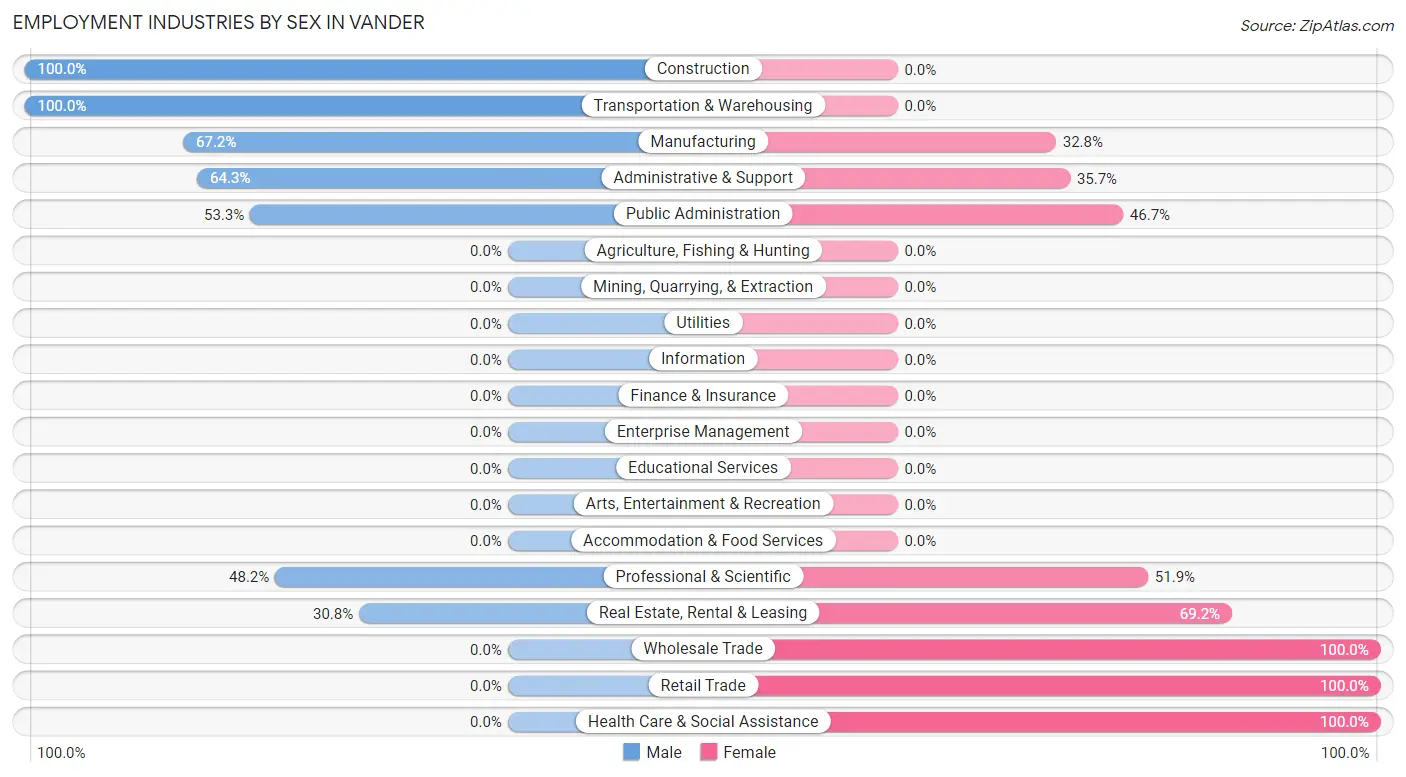
Employment Industries by Sex in Vander
The Vander industries that see more men than women are Construction (100.0%), Transportation & Warehousing (100.0%), and Manufacturing (67.2%), whereas the industries that tend to have a higher number of women are Wholesale Trade (100.0%), Retail Trade (100.0%), and Health Care & Social Assistance (100.0%).
| Industry | Male | Female |
| Agriculture, Fishing & Hunting | 0 (0.0%) | 0 (0.0%) |
| Mining, Quarrying, & Extraction | 0 (0.0%) | 0 (0.0%) |
| Construction | 15 (100.0%) | 0 (0.0%) |
| Manufacturing | 41 (67.2%) | 20 (32.8%) |
| Wholesale Trade | 0 (0.0%) | 125 (100.0%) |
| Retail Trade | 0 (0.0%) | 13 (100.0%) |
| Transportation & Warehousing | 17 (100.0%) | 0 (0.0%) |
| Utilities | 0 (0.0%) | 0 (0.0%) |
| Information | 0 (0.0%) | 0 (0.0%) |
| Finance & Insurance | 0 (0.0%) | 0 (0.0%) |
| Real Estate, Rental & Leasing | 8 (30.8%) | 18 (69.2%) |
| Professional & Scientific | 13 (48.1%) | 14 (51.8%) |
| Enterprise Management | 0 (0.0%) | 0 (0.0%) |
| Administrative & Support | 18 (64.3%) | 10 (35.7%) |
| Educational Services | 0 (0.0%) | 0 (0.0%) |
| Health Care & Social Assistance | 0 (0.0%) | 38 (100.0%) |
| Arts, Entertainment & Recreation | 0 (0.0%) | 0 (0.0%) |
| Accommodation & Food Services | 0 (0.0%) | 0 (0.0%) |
| Public Administration | 16 (53.3%) | 14 (46.7%) |
| Total | 141 (31.5%) | 306 (68.5%) |
Education in Vander
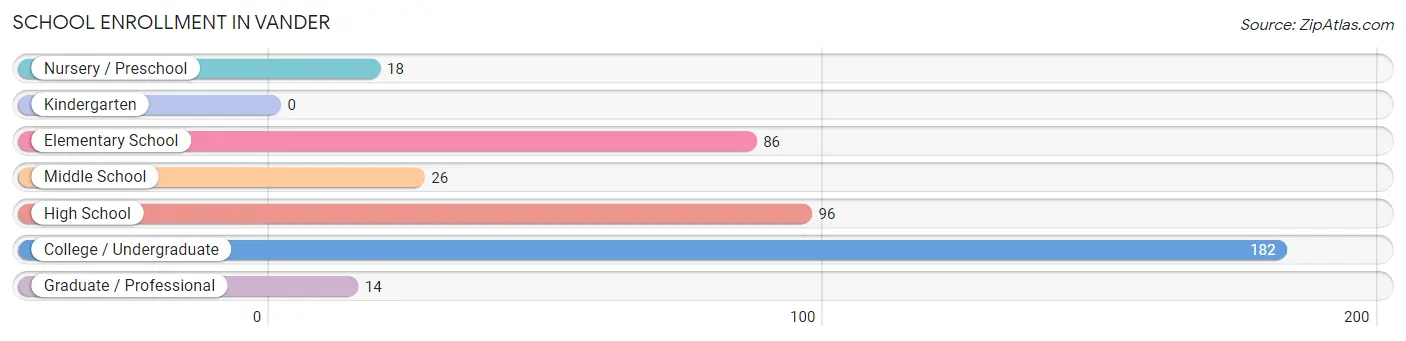
School Enrollment in Vander
The most common levels of schooling among the 422 students in Vander are college / undergraduate (182 | 43.1%), high school (96 | 22.8%), and elementary school (86 | 20.4%).
| School Level | # Students | % Students |
| Nursery / Preschool | 18 | 4.3% |
| Kindergarten | 0 | 0.0% |
| Elementary School | 86 | 20.4% |
| Middle School | 26 | 6.2% |
| High School | 96 | 22.8% |
| College / Undergraduate | 182 | 43.1% |
| Graduate / Professional | 14 | 3.3% |
| Total | 422 | 100.0% |
School Enrollment by Age by Funding Source in Vander
Out of a total of 422 students who are enrolled in schools in Vander, 13 (3.1%) attend a private institution, while the remaining 409 (96.9%) are enrolled in public schools. The age group of 35 years and over has the highest likelihood of being enrolled in private schools, with 13 (9.1% in the age bracket) enrolled. Conversely, the age group of 3 to 4 year olds has the lowest likelihood of being enrolled in a private school, with 18 (100.0% in the age bracket) attending a public institution.
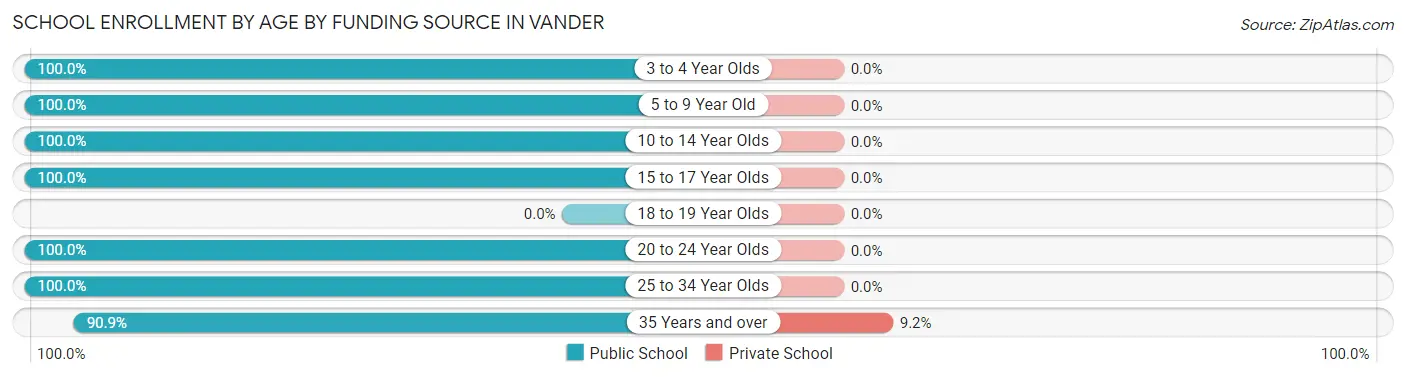
| Age Bracket | Public School | Private School |
| 3 to 4 Year Olds | 18 (100.0%) | 0 (0.0%) |
| 5 to 9 Year Old | 69 (100.0%) | 0 (0.0%) |
| 10 to 14 Year Olds | 49 (100.0%) | 0 (0.0%) |
| 15 to 17 Year Olds | 90 (100.0%) | 0 (0.0%) |
| 18 to 19 Year Olds | 0 (0.0%) | 0 (0.0%) |
| 20 to 24 Year Olds | 22 (100.0%) | 0 (0.0%) |
| 25 to 34 Year Olds | 32 (100.0%) | 0 (0.0%) |
| 35 Years and over | 129 (90.8%) | 13 (9.1%) |
| Total | 409 (96.9%) | 13 (3.1%) |
Educational Attainment by Field of Study in Vander
Social sciences (142 | 62.0%), computers & mathematics (29 | 12.7%), education (16 | 7.0%), science & technology (15 | 6.6%), and psychology (14 | 6.1%) are the most common fields of study among 229 individuals in Vander who have obtained a bachelor's degree or higher.
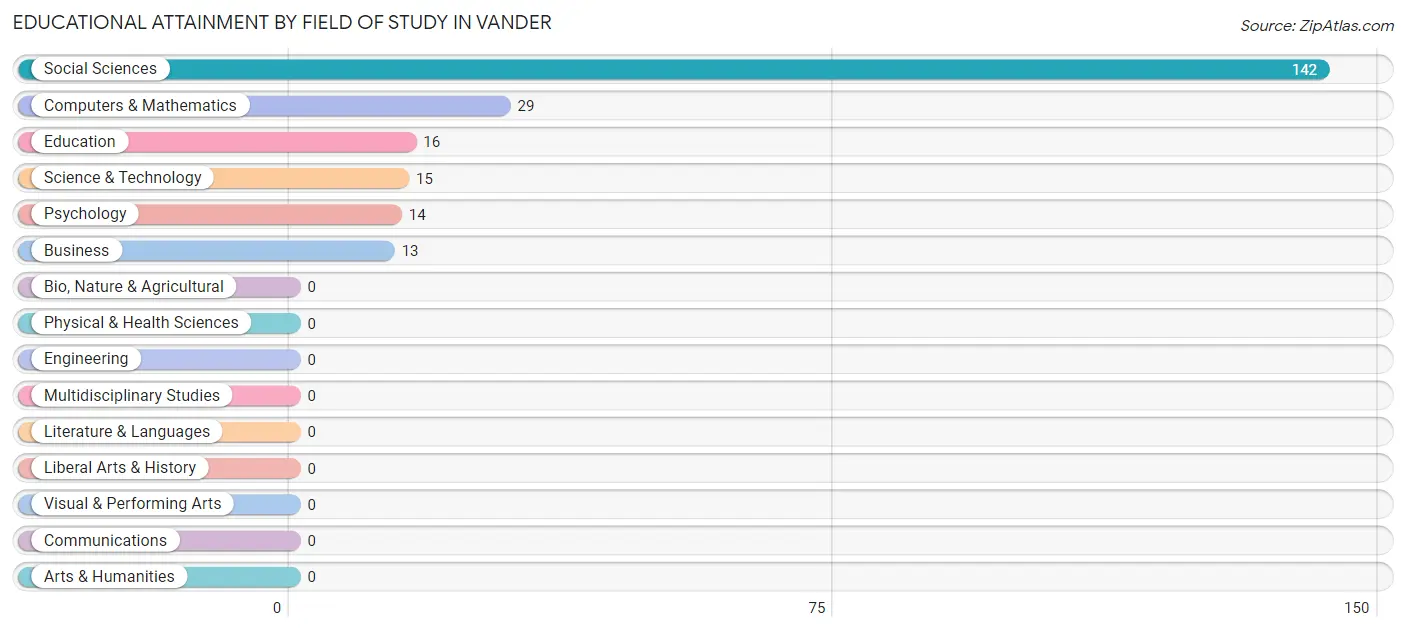
| Field of Study | # Graduates | % Graduates |
| Computers & Mathematics | 29 | 12.7% |
| Bio, Nature & Agricultural | 0 | 0.0% |
| Physical & Health Sciences | 0 | 0.0% |
| Psychology | 14 | 6.1% |
| Social Sciences | 142 | 62.0% |
| Engineering | 0 | 0.0% |
| Multidisciplinary Studies | 0 | 0.0% |
| Science & Technology | 15 | 6.6% |
| Business | 13 | 5.7% |
| Education | 16 | 7.0% |
| Literature & Languages | 0 | 0.0% |
| Liberal Arts & History | 0 | 0.0% |
| Visual & Performing Arts | 0 | 0.0% |
| Communications | 0 | 0.0% |
| Arts & Humanities | 0 | 0.0% |
| Total | 229 | 100.0% |
Transportation & Commute in Vander
Vehicle Availability by Sex in Vander
The most prevalent vehicle ownership categories in Vander are males with 3 vehicles (66, accounting for 46.8%) and females with 3 vehicles (31, making up 21.6%).
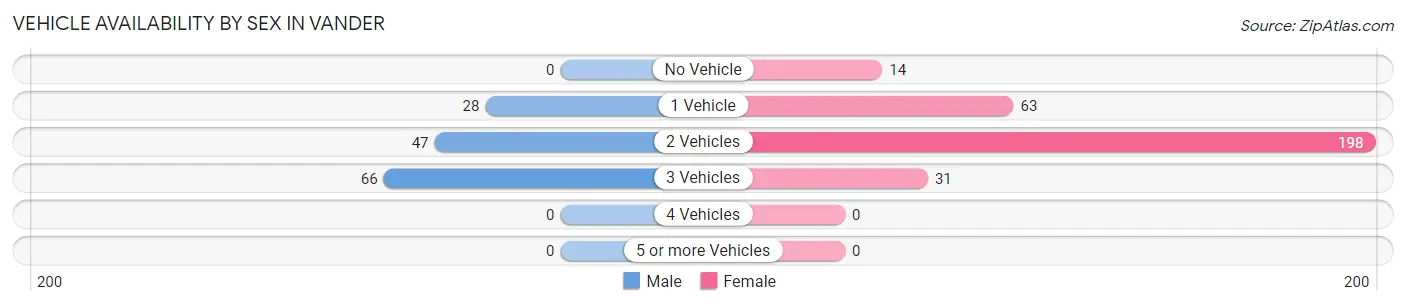
| Vehicles Available | Male | Female |
| No Vehicle | 0 (0.0%) | 14 (4.6%) |
| 1 Vehicle | 28 (19.9%) | 63 (20.6%) |
| 2 Vehicles | 47 (33.3%) | 198 (64.7%) |
| 3 Vehicles | 66 (46.8%) | 31 (10.1%) |
| 4 Vehicles | 0 (0.0%) | 0 (0.0%) |
| 5 or more Vehicles | 0 (0.0%) | 0 (0.0%) |
| Total | 141 (100.0%) | 306 (100.0%) |
Commute Time in Vander
The most frequently occuring commute durations in Vander are 25 to 29 minutes (155 commuters, 38.5%), 20 to 24 minutes (110 commuters, 27.3%), and less than 5 minutes (32 commuters, 7.9%).
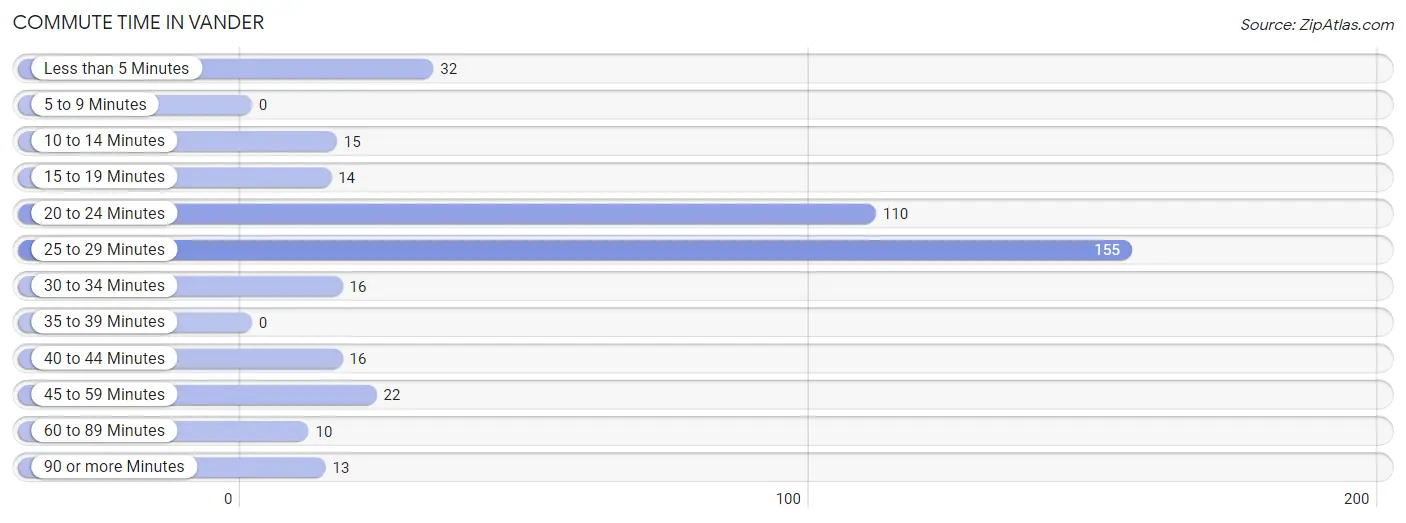
| Commute Time | # Commuters | % Commuters |
| Less than 5 Minutes | 32 | 7.9% |
| 5 to 9 Minutes | 0 | 0.0% |
| 10 to 14 Minutes | 15 | 3.7% |
| 15 to 19 Minutes | 14 | 3.5% |
| 20 to 24 Minutes | 110 | 27.3% |
| 25 to 29 Minutes | 155 | 38.5% |
| 30 to 34 Minutes | 16 | 4.0% |
| 35 to 39 Minutes | 0 | 0.0% |
| 40 to 44 Minutes | 16 | 4.0% |
| 45 to 59 Minutes | 22 | 5.5% |
| 60 to 89 Minutes | 10 | 2.5% |
| 90 or more Minutes | 13 | 3.2% |
Commute Time by Sex in Vander
The most common commute times in Vander are 45 to 59 minutes (22 commuters, 19.8%) for males and 25 to 29 minutes (138 commuters, 47.3%) for females.
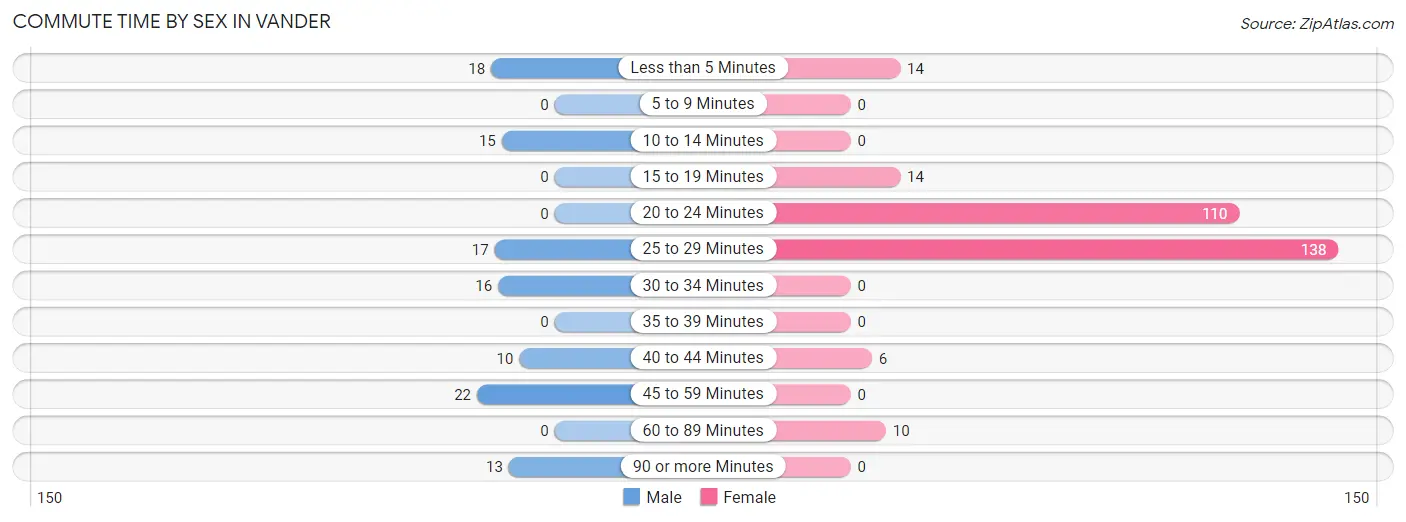
| Commute Time | Male | Female |
| Less than 5 Minutes | 18 (16.2%) | 14 (4.8%) |
| 5 to 9 Minutes | 0 (0.0%) | 0 (0.0%) |
| 10 to 14 Minutes | 15 (13.5%) | 0 (0.0%) |
| 15 to 19 Minutes | 0 (0.0%) | 14 (4.8%) |
| 20 to 24 Minutes | 0 (0.0%) | 110 (37.7%) |
| 25 to 29 Minutes | 17 (15.3%) | 138 (47.3%) |
| 30 to 34 Minutes | 16 (14.4%) | 0 (0.0%) |
| 35 to 39 Minutes | 0 (0.0%) | 0 (0.0%) |
| 40 to 44 Minutes | 10 (9.0%) | 6 (2.1%) |
| 45 to 59 Minutes | 22 (19.8%) | 0 (0.0%) |
| 60 to 89 Minutes | 0 (0.0%) | 10 (3.4%) |
| 90 or more Minutes | 13 (11.7%) | 0 (0.0%) |
Time of Departure to Work by Sex in Vander
The most frequent times of departure to work in Vander are 6:00 AM to 6:29 AM (31, 27.9%) for males and 10:00 AM to 10:59 AM (125, 42.8%) for females.
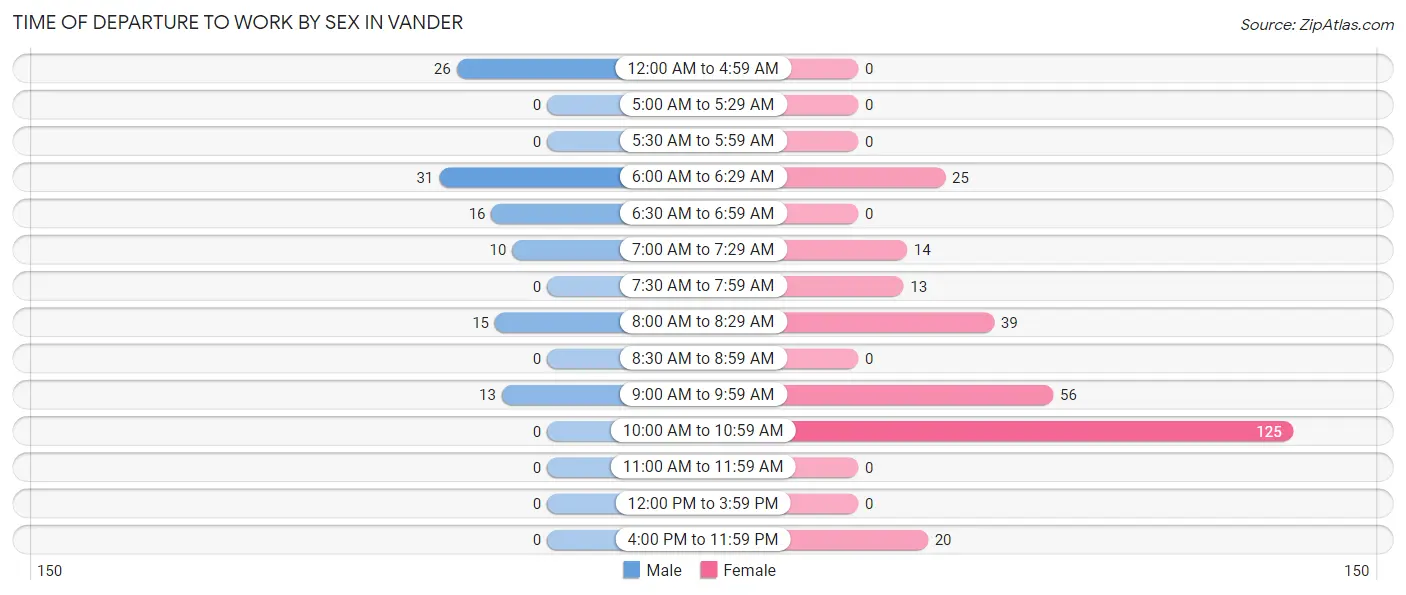
| Time of Departure | Male | Female |
| 12:00 AM to 4:59 AM | 26 (23.4%) | 0 (0.0%) |
| 5:00 AM to 5:29 AM | 0 (0.0%) | 0 (0.0%) |
| 5:30 AM to 5:59 AM | 0 (0.0%) | 0 (0.0%) |
| 6:00 AM to 6:29 AM | 31 (27.9%) | 25 (8.6%) |
| 6:30 AM to 6:59 AM | 16 (14.4%) | 0 (0.0%) |
| 7:00 AM to 7:29 AM | 10 (9.0%) | 14 (4.8%) |
| 7:30 AM to 7:59 AM | 0 (0.0%) | 13 (4.4%) |
| 8:00 AM to 8:29 AM | 15 (13.5%) | 39 (13.4%) |
| 8:30 AM to 8:59 AM | 0 (0.0%) | 0 (0.0%) |
| 9:00 AM to 9:59 AM | 13 (11.7%) | 56 (19.2%) |
| 10:00 AM to 10:59 AM | 0 (0.0%) | 125 (42.8%) |
| 11:00 AM to 11:59 AM | 0 (0.0%) | 0 (0.0%) |
| 12:00 PM to 3:59 PM | 0 (0.0%) | 0 (0.0%) |
| 4:00 PM to 11:59 PM | 0 (0.0%) | 20 (6.9%) |
| Total | 111 (100.0%) | 292 (100.0%) |
Housing Occupancy in Vander
Occupancy by Ownership in Vander
Of the total 591 dwellings in Vander, owner-occupied units account for 443 (75.0%), while renter-occupied units make up 148 (25.0%).
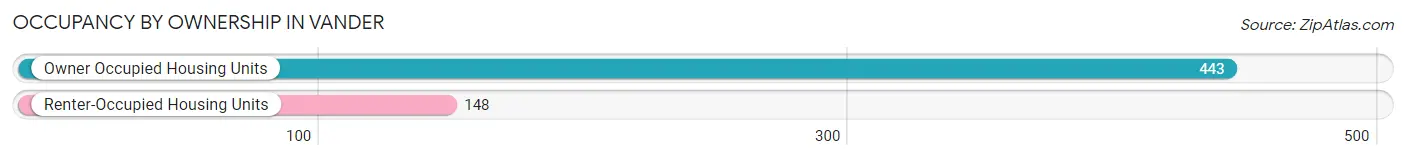
| Occupancy | # Housing Units | % Housing Units |
| Owner Occupied Housing Units | 443 | 75.0% |
| Renter-Occupied Housing Units | 148 | 25.0% |
| Total Occupied Housing Units | 591 | 100.0% |
Occupancy by Household Size in Vander
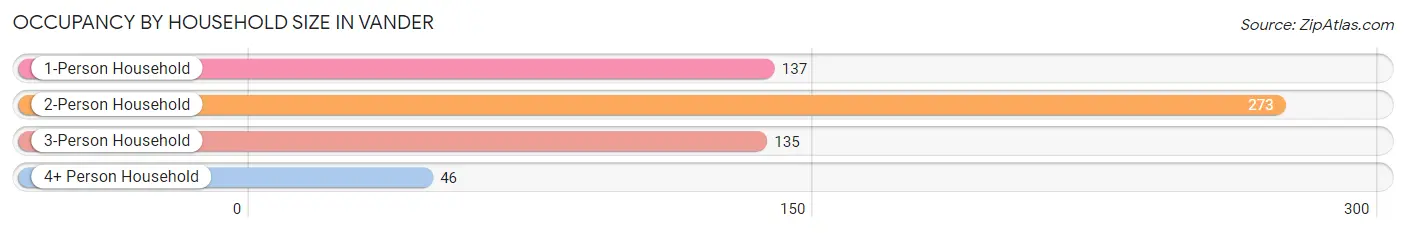
| Household Size | # Housing Units | % Housing Units |
| 1-Person Household | 137 | 23.2% |
| 2-Person Household | 273 | 46.2% |
| 3-Person Household | 135 | 22.8% |
| 4+ Person Household | 46 | 7.8% |
| Total Housing Units | 591 | 100.0% |
Occupancy by Ownership by Household Size in Vander
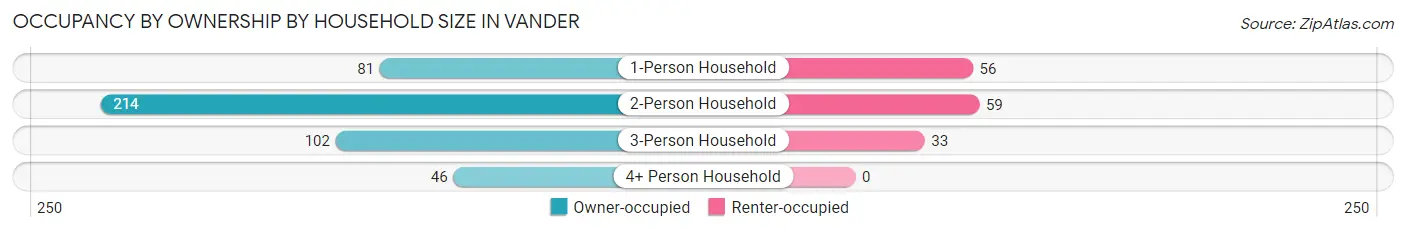
| Household Size | Owner-occupied | Renter-occupied |
| 1-Person Household | 81 (59.1%) | 56 (40.9%) |
| 2-Person Household | 214 (78.4%) | 59 (21.6%) |
| 3-Person Household | 102 (75.6%) | 33 (24.4%) |
| 4+ Person Household | 46 (100.0%) | 0 (0.0%) |
| Total Housing Units | 443 (75.0%) | 148 (25.0%) |
Occupancy by Educational Attainment in Vander
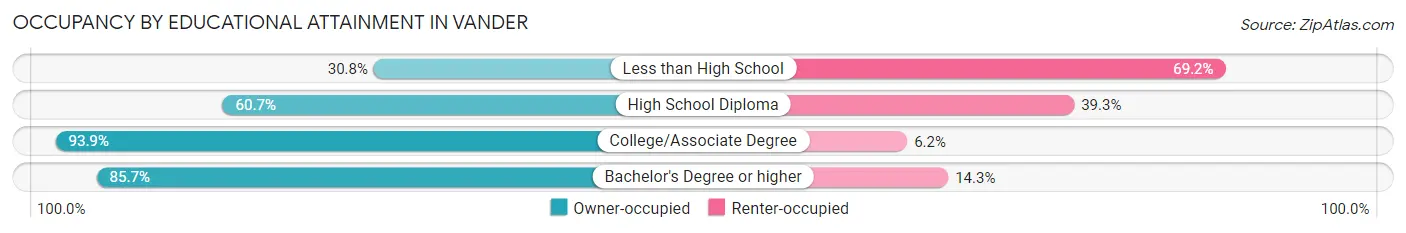
| Household Size | Owner-occupied | Renter-occupied |
| Less than High School | 20 (30.8%) | 45 (69.2%) |
| High School Diploma | 116 (60.7%) | 75 (39.3%) |
| College/Associate Degree | 229 (93.9%) | 15 (6.1%) |
| Bachelor's Degree or higher | 78 (85.7%) | 13 (14.3%) |
Occupancy by Age of Householder in Vander
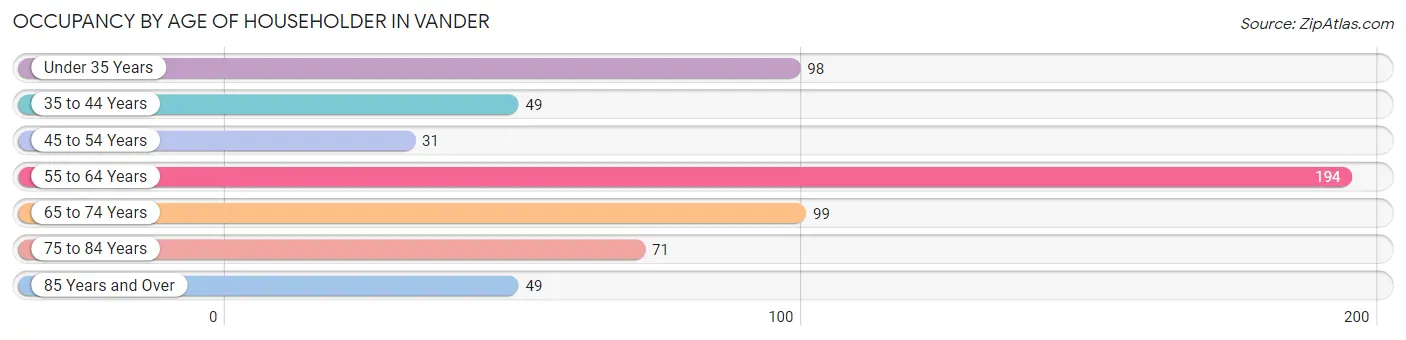
| Age Bracket | # Households | % Households |
| Under 35 Years | 98 | 16.6% |
| 35 to 44 Years | 49 | 8.3% |
| 45 to 54 Years | 31 | 5.2% |
| 55 to 64 Years | 194 | 32.8% |
| 65 to 74 Years | 99 | 16.8% |
| 75 to 84 Years | 71 | 12.0% |
| 85 Years and Over | 49 | 8.3% |
| Total | 591 | 100.0% |
Housing Finances in Vander
Median Income by Occupancy in Vander
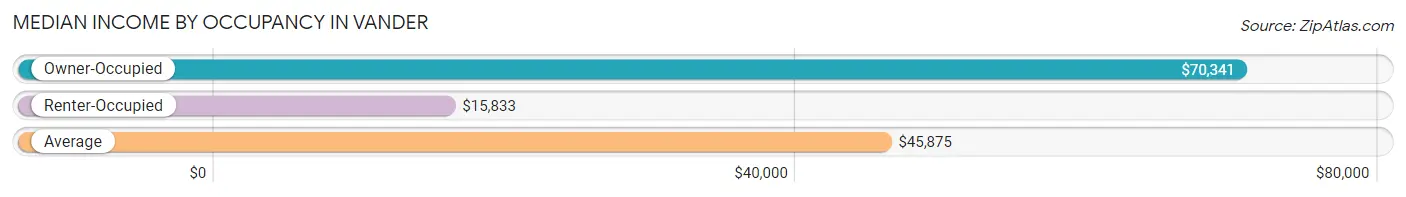
| Occupancy Type | # Households | Median Income |
| Owner-Occupied | 443 (75.0%) | $70,341 |
| Renter-Occupied | 148 (25.0%) | $15,833 |
| Average | 591 (100.0%) | $45,875 |
Occupancy by Householder Income Bracket in Vander
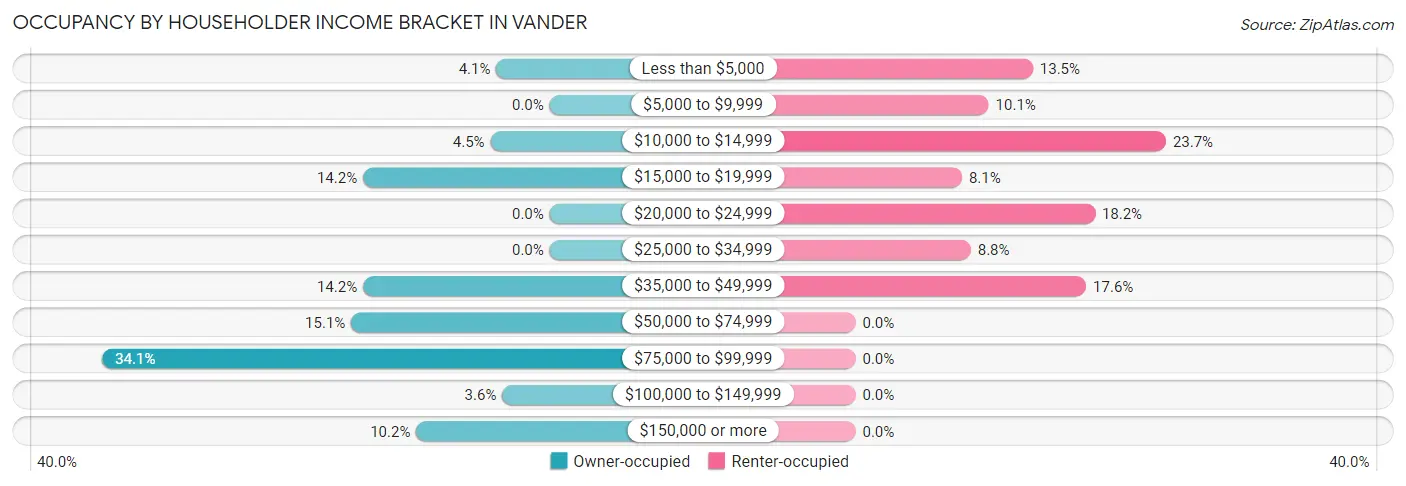
| Income Bracket | Owner-occupied | Renter-occupied |
| Less than $5,000 | 18 (4.1%) | 20 (13.5%) |
| $5,000 to $9,999 | 0 (0.0%) | 15 (10.1%) |
| $10,000 to $14,999 | 20 (4.5%) | 35 (23.6%) |
| $15,000 to $19,999 | 63 (14.2%) | 12 (8.1%) |
| $20,000 to $24,999 | 0 (0.0%) | 27 (18.2%) |
| $25,000 to $34,999 | 0 (0.0%) | 13 (8.8%) |
| $35,000 to $49,999 | 63 (14.2%) | 26 (17.6%) |
| $50,000 to $74,999 | 67 (15.1%) | 0 (0.0%) |
| $75,000 to $99,999 | 151 (34.1%) | 0 (0.0%) |
| $100,000 to $149,999 | 16 (3.6%) | 0 (0.0%) |
| $150,000 or more | 45 (10.2%) | 0 (0.0%) |
| Total | 443 (100.0%) | 148 (100.0%) |
Monthly Housing Cost Tiers in Vander
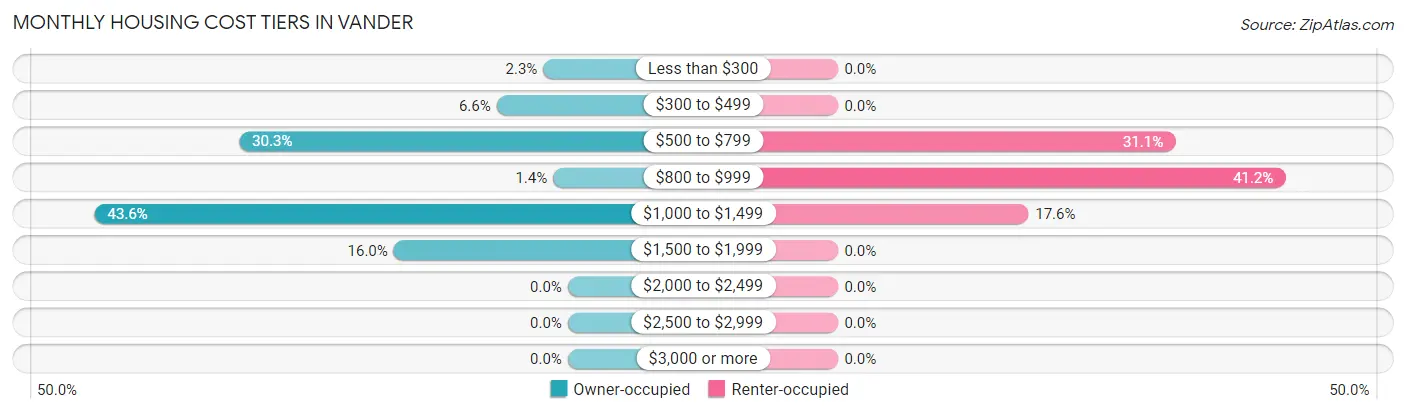
| Monthly Cost | Owner-occupied | Renter-occupied |
| Less than $300 | 10 (2.3%) | 0 (0.0%) |
| $300 to $499 | 29 (6.6%) | 0 (0.0%) |
| $500 to $799 | 134 (30.2%) | 46 (31.1%) |
| $800 to $999 | 6 (1.3%) | 61 (41.2%) |
| $1,000 to $1,499 | 193 (43.6%) | 26 (17.6%) |
| $1,500 to $1,999 | 71 (16.0%) | 0 (0.0%) |
| $2,000 to $2,499 | 0 (0.0%) | 0 (0.0%) |
| $2,500 to $2,999 | 0 (0.0%) | 0 (0.0%) |
| $3,000 or more | 0 (0.0%) | 0 (0.0%) |
| Total | 443 (100.0%) | 148 (100.0%) |
Physical Housing Characteristics in Vander
Housing Structures in Vander
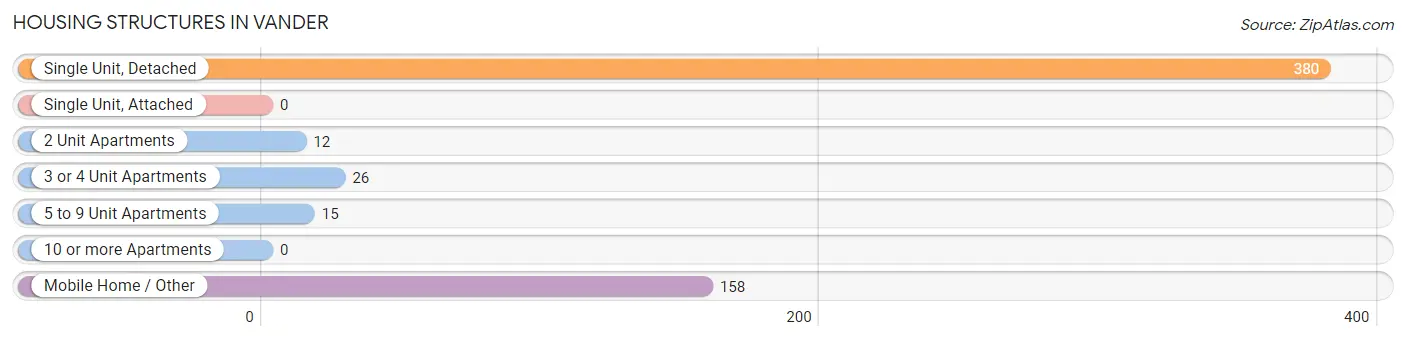
| Structure Type | # Housing Units | % Housing Units |
| Single Unit, Detached | 380 | 64.3% |
| Single Unit, Attached | 0 | 0.0% |
| 2 Unit Apartments | 12 | 2.0% |
| 3 or 4 Unit Apartments | 26 | 4.4% |
| 5 to 9 Unit Apartments | 15 | 2.5% |
| 10 or more Apartments | 0 | 0.0% |
| Mobile Home / Other | 158 | 26.7% |
| Total | 591 | 100.0% |
Housing Structures by Occupancy in Vander
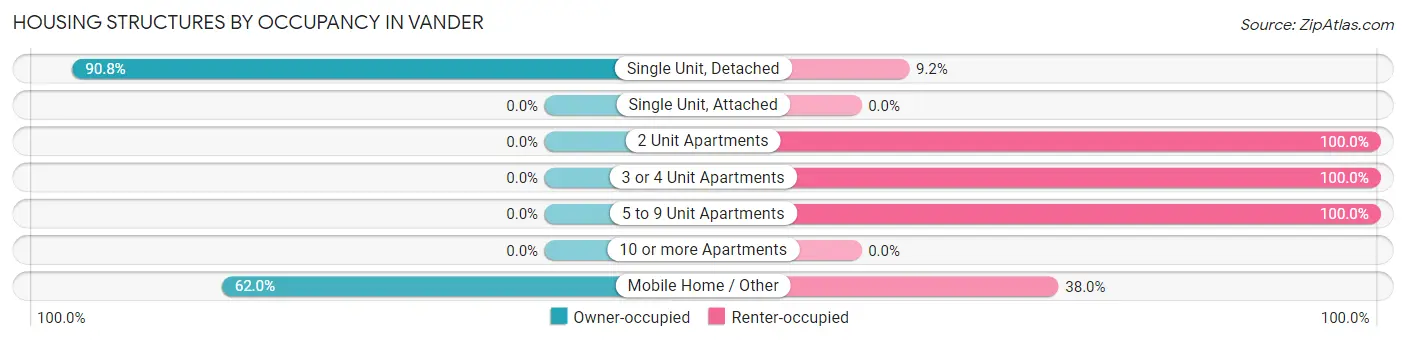
| Structure Type | Owner-occupied | Renter-occupied |
| Single Unit, Detached | 345 (90.8%) | 35 (9.2%) |
| Single Unit, Attached | 0 (0.0%) | 0 (0.0%) |
| 2 Unit Apartments | 0 (0.0%) | 12 (100.0%) |
| 3 or 4 Unit Apartments | 0 (0.0%) | 26 (100.0%) |
| 5 to 9 Unit Apartments | 0 (0.0%) | 15 (100.0%) |
| 10 or more Apartments | 0 (0.0%) | 0 (0.0%) |
| Mobile Home / Other | 98 (62.0%) | 60 (38.0%) |
| Total | 443 (75.0%) | 148 (25.0%) |
Housing Structures by Number of Rooms in Vander
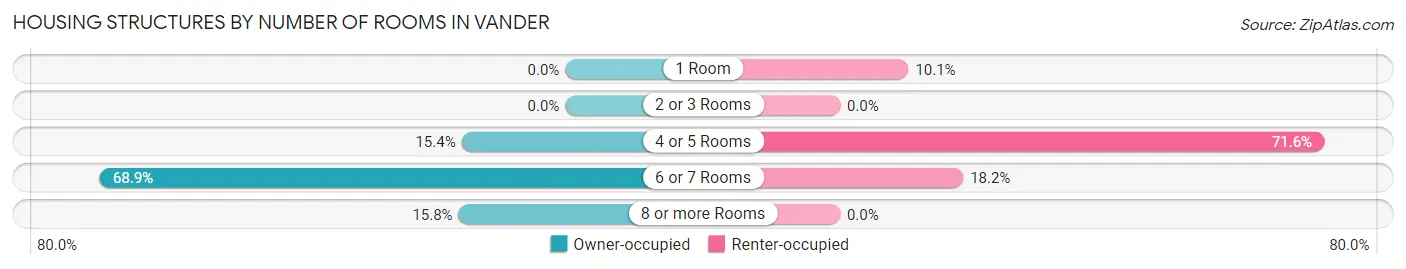
| Number of Rooms | Owner-occupied | Renter-occupied |
| 1 Room | 0 (0.0%) | 15 (10.1%) |
| 2 or 3 Rooms | 0 (0.0%) | 0 (0.0%) |
| 4 or 5 Rooms | 68 (15.3%) | 106 (71.6%) |
| 6 or 7 Rooms | 305 (68.9%) | 27 (18.2%) |
| 8 or more Rooms | 70 (15.8%) | 0 (0.0%) |
| Total | 443 (100.0%) | 148 (100.0%) |
Housing Structure by Heating Type in Vander
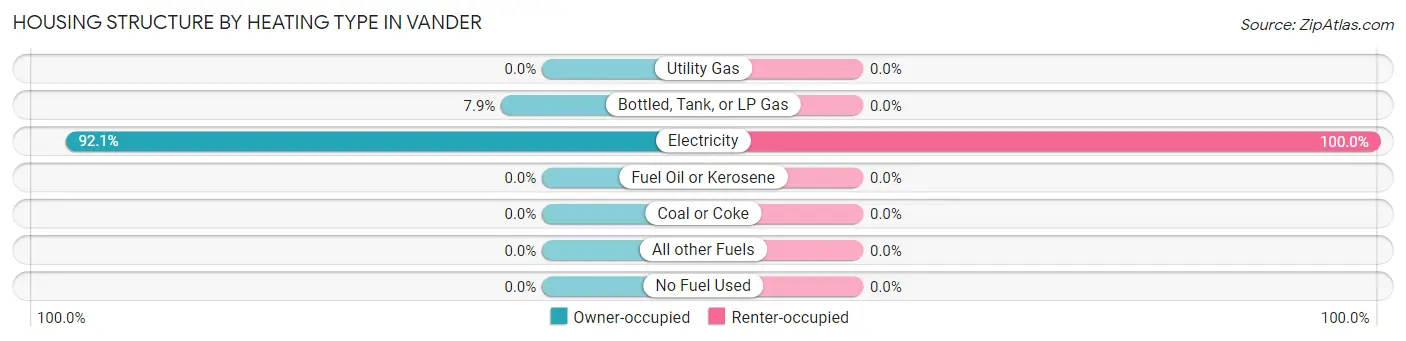
| Heating Type | Owner-occupied | Renter-occupied |
| Utility Gas | 0 (0.0%) | 0 (0.0%) |
| Bottled, Tank, or LP Gas | 35 (7.9%) | 0 (0.0%) |
| Electricity | 408 (92.1%) | 148 (100.0%) |
| Fuel Oil or Kerosene | 0 (0.0%) | 0 (0.0%) |
| Coal or Coke | 0 (0.0%) | 0 (0.0%) |
| All other Fuels | 0 (0.0%) | 0 (0.0%) |
| No Fuel Used | 0 (0.0%) | 0 (0.0%) |
| Total | 443 (100.0%) | 148 (100.0%) |
Household Vehicle Usage in Vander
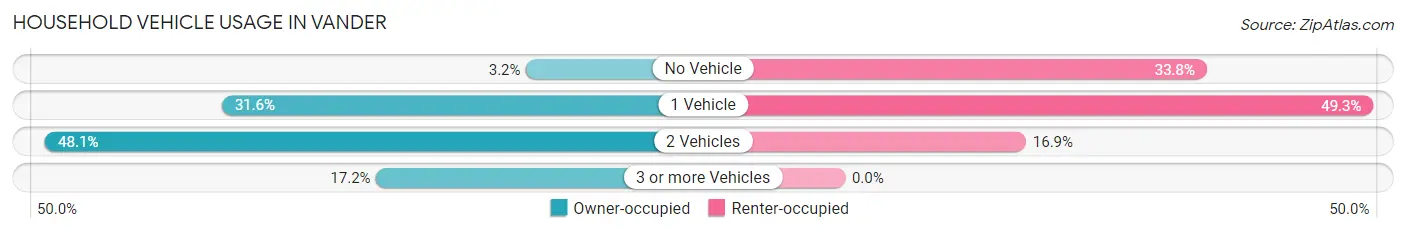
| Vehicles per Household | Owner-occupied | Renter-occupied |
| No Vehicle | 14 (3.2%) | 50 (33.8%) |
| 1 Vehicle | 140 (31.6%) | 73 (49.3%) |
| 2 Vehicles | 213 (48.1%) | 25 (16.9%) |
| 3 or more Vehicles | 76 (17.2%) | 0 (0.0%) |
| Total | 443 (100.0%) | 148 (100.0%) |
Real Estate & Mortgages in Vander
Real Estate and Mortgage Overview in Vander
| Characteristic | Without Mortgage | With Mortgage |
| Housing Units | 138 | 305 |
| Median Property Value | $57,600 | $271,200 |
| Median Household Income | - | - |
| Monthly Housing Costs | $559 | $0 |
| Real Estate Taxes | $1,670 | $15 |
Property Value by Mortgage Status in Vander
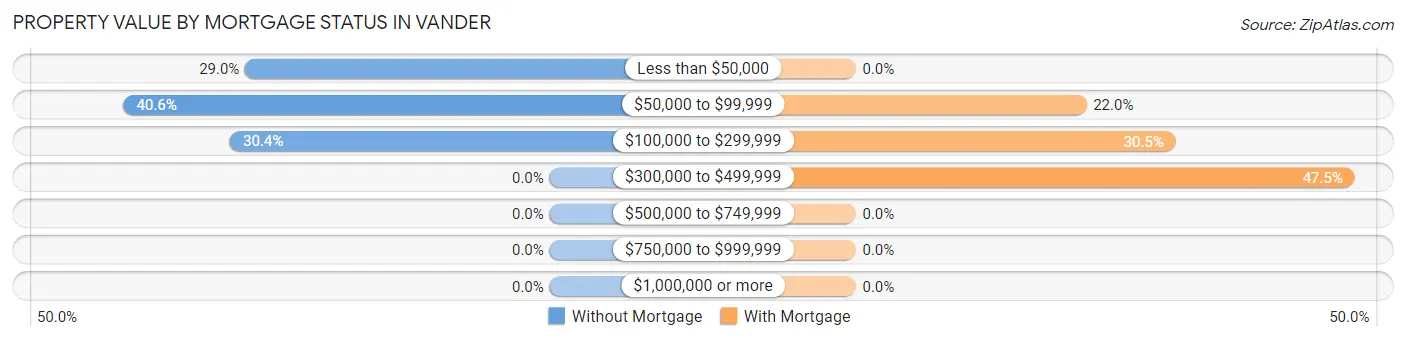
| Property Value | Without Mortgage | With Mortgage |
| Less than $50,000 | 40 (29.0%) | 0 (0.0%) |
| $50,000 to $99,999 | 56 (40.6%) | 67 (22.0%) |
| $100,000 to $299,999 | 42 (30.4%) | 93 (30.5%) |
| $300,000 to $499,999 | 0 (0.0%) | 145 (47.5%) |
| $500,000 to $749,999 | 0 (0.0%) | 0 (0.0%) |
| $750,000 to $999,999 | 0 (0.0%) | 0 (0.0%) |
| $1,000,000 or more | 0 (0.0%) | 0 (0.0%) |
| Total | 138 (100.0%) | 305 (100.0%) |
Household Income by Mortgage Status in Vander
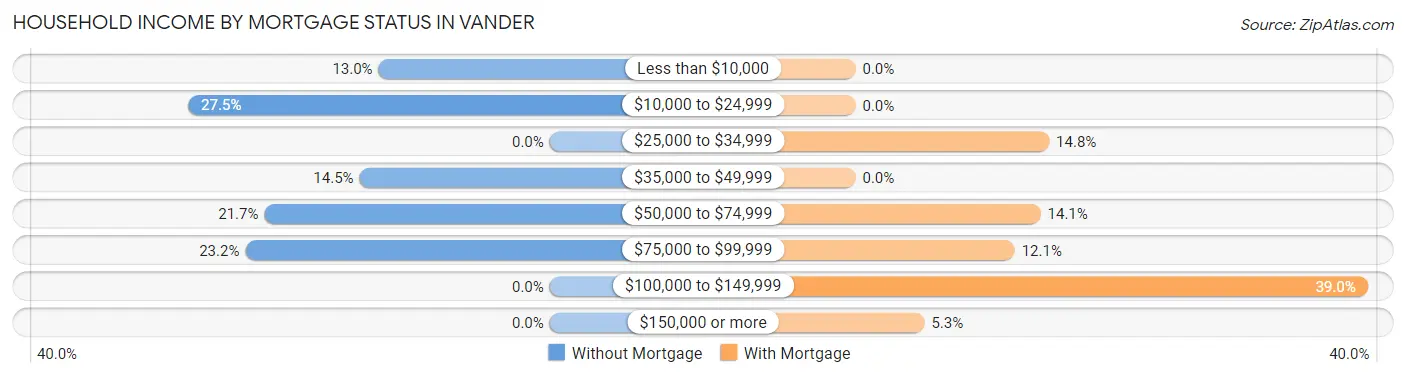
| Household Income | Without Mortgage | With Mortgage |
| Less than $10,000 | 18 (13.0%) | 0 (0.0%) |
| $10,000 to $24,999 | 38 (27.5%) | 0 (0.0%) |
| $25,000 to $34,999 | 0 (0.0%) | 45 (14.7%) |
| $35,000 to $49,999 | 20 (14.5%) | 0 (0.0%) |
| $50,000 to $74,999 | 30 (21.7%) | 43 (14.1%) |
| $75,000 to $99,999 | 32 (23.2%) | 37 (12.1%) |
| $100,000 to $149,999 | 0 (0.0%) | 119 (39.0%) |
| $150,000 or more | 0 (0.0%) | 16 (5.2%) |
| Total | 138 (100.0%) | 305 (100.0%) |
Property Value to Household Income Ratio in Vander
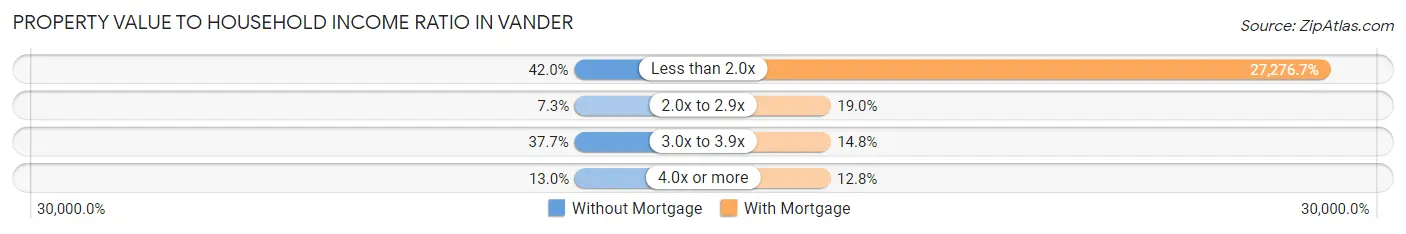
| Value-to-Income Ratio | Without Mortgage | With Mortgage |
| Less than 2.0x | 58 (42.0%) | 83,194 (27,276.7%) |
| 2.0x to 2.9x | 10 (7.2%) | 58 (19.0%) |
| 3.0x to 3.9x | 52 (37.7%) | 45 (14.7%) |
| 4.0x or more | 18 (13.0%) | 39 (12.8%) |
| Total | 138 (100.0%) | 305 (100.0%) |
Real Estate Taxes by Mortgage Status in Vander
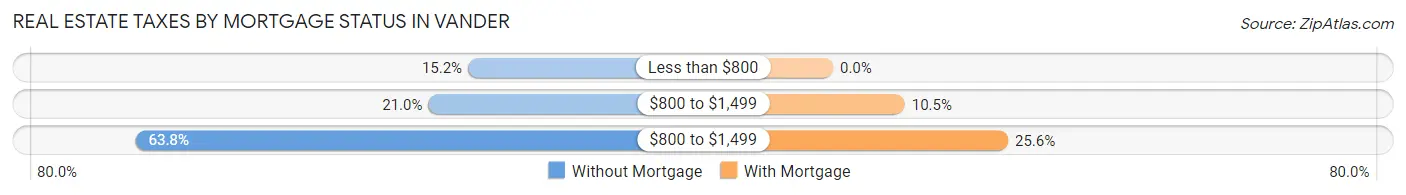
| Property Taxes | Without Mortgage | With Mortgage |
| Less than $800 | 21 (15.2%) | 0 (0.0%) |
| $800 to $1,499 | 29 (21.0%) | 32 (10.5%) |
| $800 to $1,499 | 88 (63.8%) | 78 (25.6%) |
| Total | 138 (100.0%) | 305 (100.0%) |
Health & Disability in Vander
Health Insurance Coverage by Age in Vander
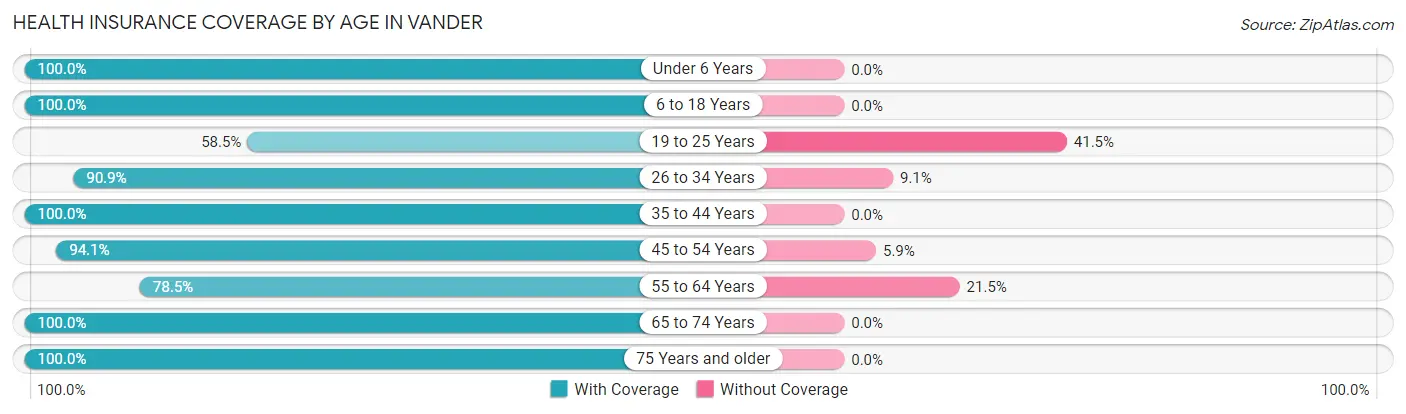
| Age Bracket | With Coverage | Without Coverage |
| Under 6 Years | 95 (100.0%) | 0 (0.0%) |
| 6 to 18 Years | 208 (100.0%) | 0 (0.0%) |
| 19 to 25 Years | 31 (58.5%) | 22 (41.5%) |
| 26 to 34 Years | 140 (90.9%) | 14 (9.1%) |
| 35 to 44 Years | 214 (100.0%) | 0 (0.0%) |
| 45 to 54 Years | 159 (94.1%) | 10 (5.9%) |
| 55 to 64 Years | 208 (78.5%) | 57 (21.5%) |
| 65 to 74 Years | 155 (100.0%) | 0 (0.0%) |
| 75 Years and older | 168 (100.0%) | 0 (0.0%) |
| Total | 1,378 (93.0%) | 103 (7.0%) |
Health Insurance Coverage by Citizenship Status in Vander
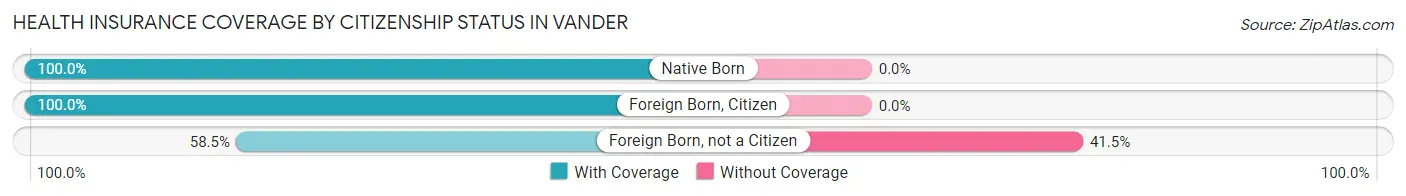
| Citizenship Status | With Coverage | Without Coverage |
| Native Born | 95 (100.0%) | 0 (0.0%) |
| Foreign Born, Citizen | 208 (100.0%) | 0 (0.0%) |
| Foreign Born, not a Citizen | 31 (58.5%) | 22 (41.5%) |
Health Insurance Coverage by Household Income in Vander
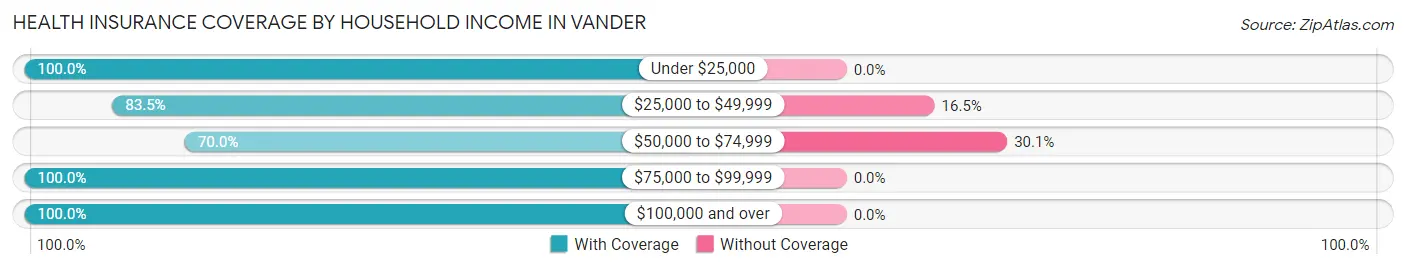
| Household Income | With Coverage | Without Coverage |
| Under $25,000 | 460 (100.0%) | 0 (0.0%) |
| $25,000 to $49,999 | 198 (83.5%) | 39 (16.5%) |
| $50,000 to $74,999 | 149 (70.0%) | 64 (30.0%) |
| $75,000 to $99,999 | 316 (100.0%) | 0 (0.0%) |
| $100,000 and over | 255 (100.0%) | 0 (0.0%) |
Public vs Private Health Insurance Coverage by Age in Vander
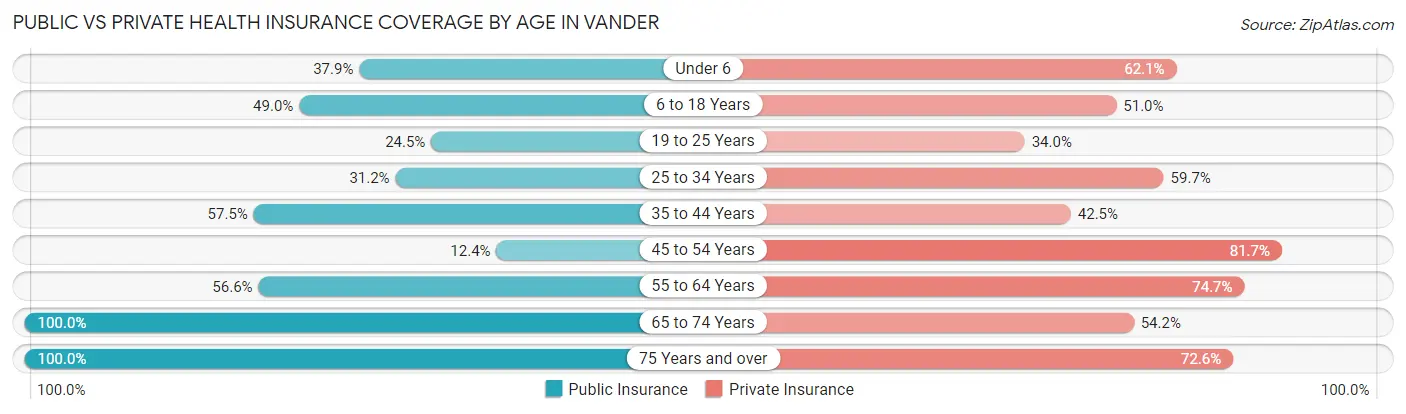
| Age Bracket | Public Insurance | Private Insurance |
| Under 6 | 36 (37.9%) | 59 (62.1%) |
| 6 to 18 Years | 102 (49.0%) | 106 (51.0%) |
| 19 to 25 Years | 13 (24.5%) | 18 (34.0%) |
| 25 to 34 Years | 48 (31.2%) | 92 (59.7%) |
| 35 to 44 Years | 123 (57.5%) | 91 (42.5%) |
| 45 to 54 Years | 21 (12.4%) | 138 (81.7%) |
| 55 to 64 Years | 150 (56.6%) | 198 (74.7%) |
| 65 to 74 Years | 155 (100.0%) | 84 (54.2%) |
| 75 Years and over | 168 (100.0%) | 122 (72.6%) |
| Total | 816 (55.1%) | 908 (61.3%) |
Disability Status by Sex by Age in Vander
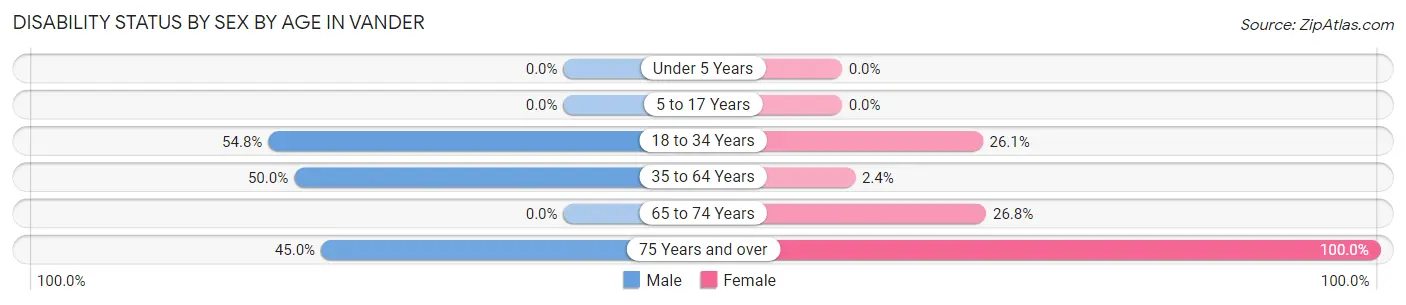
| Age Bracket | Male | Female |
| Under 5 Years | 0 (0.0%) | 0 (0.0%) |
| 5 to 17 Years | 0 (0.0%) | 0 (0.0%) |
| 18 to 34 Years | 40 (54.8%) | 35 (26.1%) |
| 35 to 64 Years | 201 (50.0%) | 6 (2.4%) |
| 65 to 74 Years | 0 (0.0%) | 34 (26.8%) |
| 75 Years and over | 27 (45.0%) | 108 (100.0%) |
Disability Class by Sex by Age in Vander
Disability Class: Hearing Difficulty
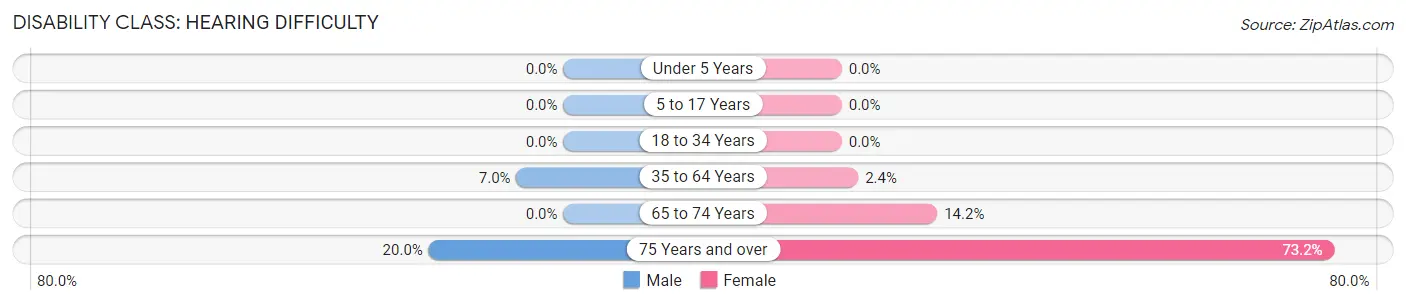
| Age Bracket | Male | Female |
| Under 5 Years | 0 (0.0%) | 0 (0.0%) |
| 5 to 17 Years | 0 (0.0%) | 0 (0.0%) |
| 18 to 34 Years | 0 (0.0%) | 0 (0.0%) |
| 35 to 64 Years | 28 (7.0%) | 6 (2.4%) |
| 65 to 74 Years | 0 (0.0%) | 18 (14.2%) |
| 75 Years and over | 12 (20.0%) | 79 (73.2%) |
Disability Class: Vision Difficulty
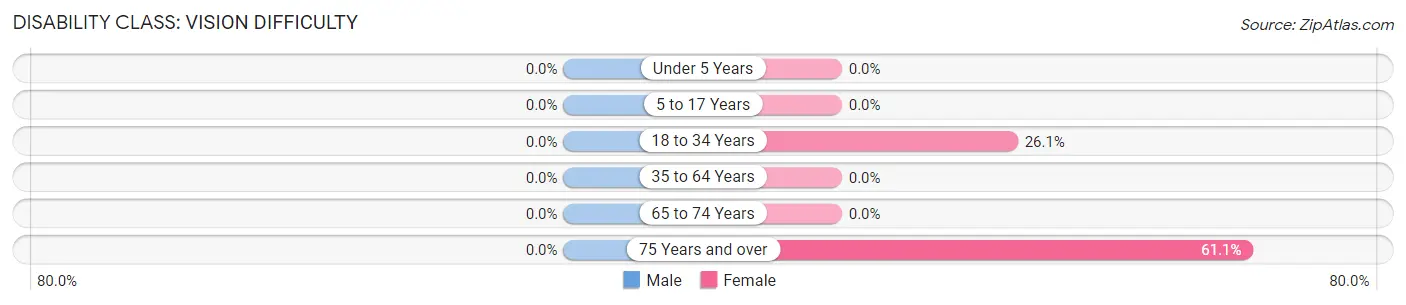
| Age Bracket | Male | Female |
| Under 5 Years | 0 (0.0%) | 0 (0.0%) |
| 5 to 17 Years | 0 (0.0%) | 0 (0.0%) |
| 18 to 34 Years | 0 (0.0%) | 35 (26.1%) |
| 35 to 64 Years | 0 (0.0%) | 0 (0.0%) |
| 65 to 74 Years | 0 (0.0%) | 0 (0.0%) |
| 75 Years and over | 0 (0.0%) | 66 (61.1%) |
Disability Class: Cognitive Difficulty
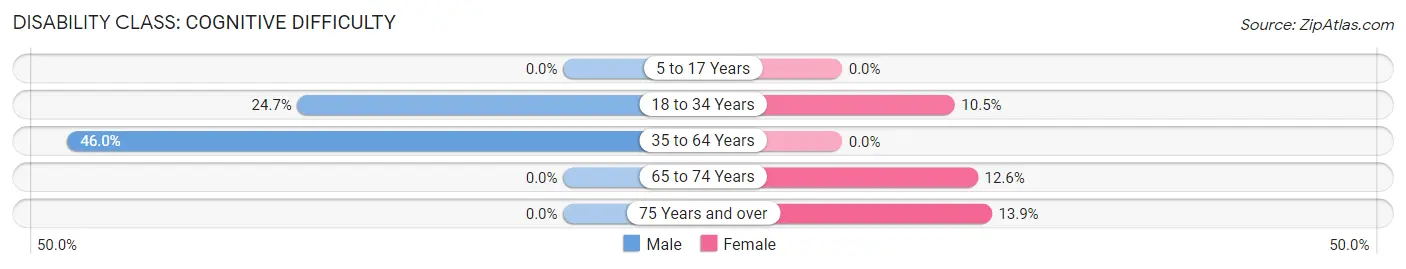
| Age Bracket | Male | Female |
| 5 to 17 Years | 0 (0.0%) | 0 (0.0%) |
| 18 to 34 Years | 18 (24.7%) | 14 (10.4%) |
| 35 to 64 Years | 185 (46.0%) | 0 (0.0%) |
| 65 to 74 Years | 0 (0.0%) | 16 (12.6%) |
| 75 Years and over | 0 (0.0%) | 15 (13.9%) |
Disability Class: Ambulatory Difficulty
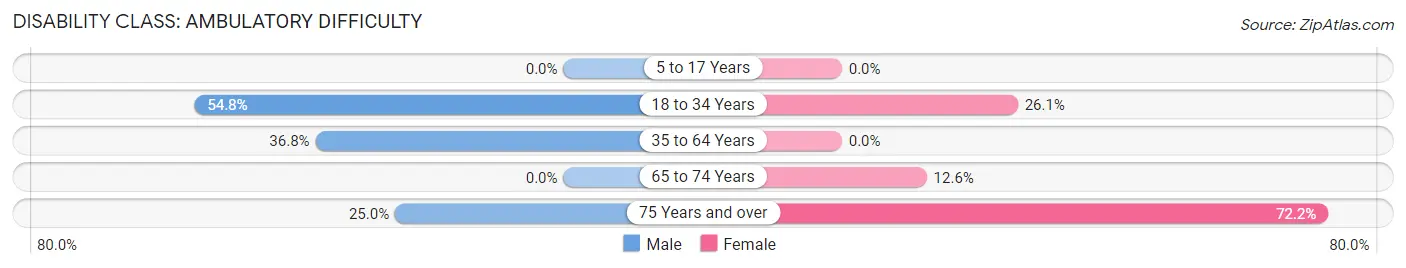
| Age Bracket | Male | Female |
| 5 to 17 Years | 0 (0.0%) | 0 (0.0%) |
| 18 to 34 Years | 40 (54.8%) | 35 (26.1%) |
| 35 to 64 Years | 148 (36.8%) | 0 (0.0%) |
| 65 to 74 Years | 0 (0.0%) | 16 (12.6%) |
| 75 Years and over | 15 (25.0%) | 78 (72.2%) |
Disability Class: Self-Care Difficulty
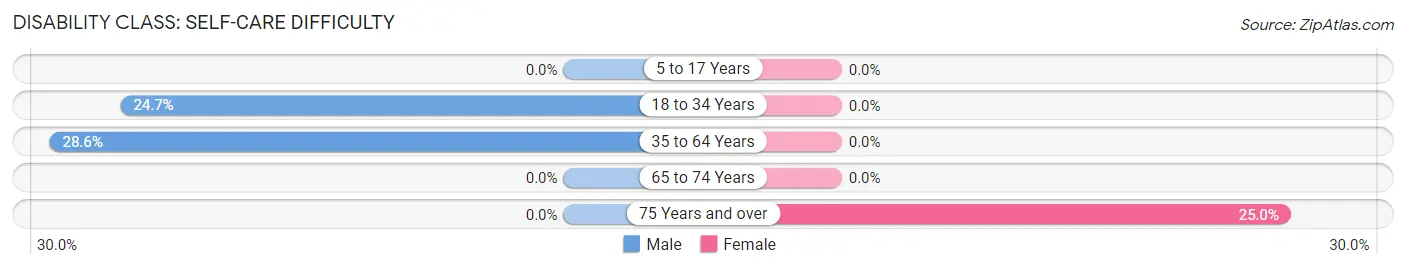
| Age Bracket | Male | Female |
| 5 to 17 Years | 0 (0.0%) | 0 (0.0%) |
| 18 to 34 Years | 18 (24.7%) | 0 (0.0%) |
| 35 to 64 Years | 115 (28.6%) | 0 (0.0%) |
| 65 to 74 Years | 0 (0.0%) | 0 (0.0%) |
| 75 Years and over | 0 (0.0%) | 27 (25.0%) |
Technology Access in Vander
Computing Device Access in Vander
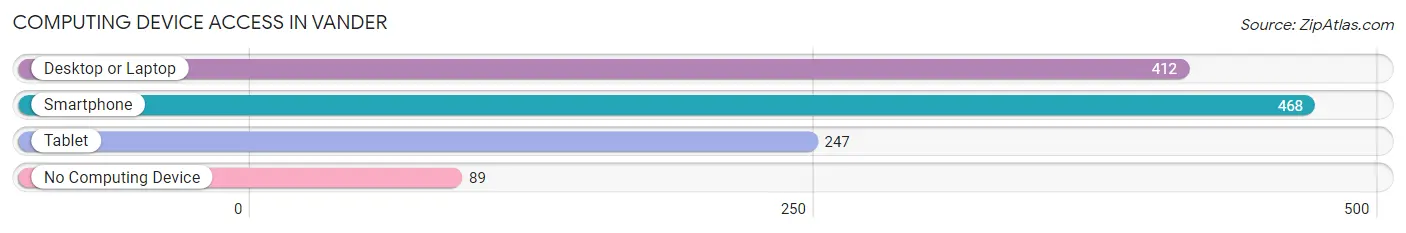
| Device Type | # Households | % Households |
| Desktop or Laptop | 412 | 69.7% |
| Smartphone | 468 | 79.2% |
| Tablet | 247 | 41.8% |
| No Computing Device | 89 | 15.1% |
| Total | 591 | 100.0% |
Internet Access in Vander
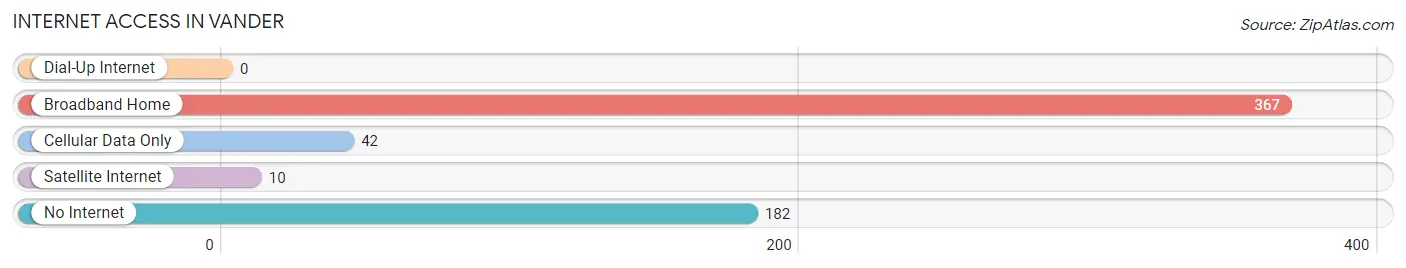
| Internet Type | # Households | % Households |
| Dial-Up Internet | 0 | 0.0% |
| Broadband Home | 367 | 62.1% |
| Cellular Data Only | 42 | 7.1% |
| Satellite Internet | 10 | 1.7% |
| No Internet | 182 | 30.8% |
| Total | 591 | 100.0% |
Vander Summary
NC History
North Carolina is a state located in the southeastern United States. It is bordered by South Carolina to the south, Virginia to the north, and the Atlantic Ocean to the east. The state was one of the original Thirteen Colonies that formed the United States. It was the first state to ratify the U.S. Constitution, becoming the 12th state to join the Union on November 21, 1789.
The history of North Carolina dates back to the 16th century, when the first European settlers arrived in the area. The first permanent settlement was established in 1585 by Sir Walter Raleigh, who named the area Virginia in honor of Queen Elizabeth I. The area was later renamed North Carolina in 1663.
The state was a major player in the American Revolution, providing troops and supplies to the Continental Army. After the war, North Carolina became the 12th state to ratify the U.S. Constitution.
In the 19th century, North Carolina was a major producer of cotton, tobacco, and naval stores. The state also played a major role in the Civil War, providing troops and supplies to the Confederate Army. After the war, the state experienced a period of Reconstruction, during which it was readmitted to the Union in 1868.
In the 20th century, North Carolina experienced a period of industrialization and economic growth. The state also became a major center for research and development, particularly in the fields of biotechnology and pharmaceuticals.
NC Geography
North Carolina is located in the southeastern United States, bordered by South Carolina to the south, Virginia to the north, and the Atlantic Ocean to the east. The state has a total area of 53,819 square miles, making it the 28th largest state in the country.
The state is divided into three distinct geographic regions: the Coastal Plain, the Piedmont, and the Appalachian Mountains. The Coastal Plain is a flat, low-lying area that stretches along the Atlantic coast. The Piedmont is a hilly region located in the central part of the state. The Appalachian Mountains are located in the western part of the state and are the highest mountains in the eastern United States.
The state has a humid subtropical climate, with hot, humid summers and mild winters. The average annual temperature is around 60°F, with temperatures ranging from the low 30s in the winter to the mid-90s in the summer.
NC Economy
North Carolina has a diverse economy that is driven by a variety of industries. The state is a major producer of tobacco, cotton, and other agricultural products. It is also a major producer of furniture, textiles, and other manufactured goods.
The state is home to a number of major corporations, including Bank of America, Duke Energy, and Lowe’s. The state is also a major center for research and development, particularly in the fields of biotechnology and pharmaceuticals.
The state’s economy has experienced steady growth in recent years, with the unemployment rate falling to 4.2% in 2019. The state’s GDP was estimated at $541.3 billion in 2019, making it the 10th largest economy in the country.
NC Demographics
As of 2019, North Carolina had an estimated population of 10.5 million people. The state is racially and ethnically diverse, with the largest racial groups being White (68.5%), Black or African American (21.5%), and Hispanic or Latino (9.2%).
The state is also home to a large number of immigrants, with the largest groups being from Mexico (3.2%), India (1.2%), and China (1.1%). The state’s largest religious group is Christianity, with the largest denominations being Baptist (25.2%), Methodist (13.2%), and Presbyterian (7.2%).
The median household income in North Carolina was $53,945 in 2019, and the poverty rate was 11.7%. The state’s largest cities are Charlotte (872,498), Raleigh (464,758), and Greensboro (279,639).
Common Questions
What is Per Capita Income in Vander?
Per Capita income in Vander is $24,131.
What is the Median Family Income in Vander?
Median Family Income in Vander is $68,618.
What is the Median Household income in Vander?
Median Household Income in Vander is $45,875.
What is Inequality or Gini Index in Vander?
Inequality or Gini Index in Vander is 0.44.
What is the Total Population of Vander?
Total Population of Vander is 1,481.
What is the Total Male Population of Vander?
Total Male Population of Vander is 748.
What is the Total Female Population of Vander?
Total Female Population of Vander is 733.
What is the Ratio of Males per 100 Females in Vander?
There are 102.05 Males per 100 Females in Vander.
What is the Ratio of Females per 100 Males in Vander?
There are 97.99 Females per 100 Males in Vander.
What is the Median Population Age in Vander?
Median Population Age in Vander is 48.8 Years.
What is the Average Family Size in Vander
Average Family Size in Vander is 3.0 People.
What is the Average Household Size in Vander
Average Household Size in Vander is 2.5 People.
How Large is the Labor Force in Vander?
There are 498 People in the Labor Forcein in Vander.
What is the Percentage of People in the Labor Force in Vander?
42.3% of People are in the Labor Force in Vander.
What is the Unemployment Rate in Vander?
Unemployment Rate in Vander is 10.2%.