Lebanon, MO Map & Demographics
Lebanon Map
Lebanon Overview
$26,971
PER CAPITA INCOME
$60,054
AVG FAMILY INCOME
$45,634
AVG HOUSEHOLD INCOME
33.9%
WAGE / INCOME GAP [ % ]
66.1¢/ $1
WAGE / INCOME GAP [ $ ]
0.49
INEQUALITY / GINI INDEX
15,023
TOTAL POPULATION
7,514
MALE POPULATION
7,509
FEMALE POPULATION
100.07
MALES / 100 FEMALES
99.93
FEMALES / 100 MALES
35.1
MEDIAN AGE
3.1
AVG FAMILY SIZE
2.4
AVG HOUSEHOLD SIZE
7,398
LABOR FORCE [ PEOPLE ]
63.9%
PERCENT IN LABOR FORCE
8.0%
UNEMPLOYMENT RATE
Lebanon Zip Codes
Lebanon Area Codes
Income in Lebanon
Income Overview in Lebanon
Per Capita Income in Lebanon is $26,971, while median incomes of families and households are $60,054 and $45,634 respectively.
| Characteristic | Number | Measure |
| Per Capita Income | 15,023 | $26,971 |
| Median Family Income | 3,688 | $60,054 |
| Mean Family Income | 3,688 | $80,971 |
| Median Household Income | 6,114 | $45,634 |
| Mean Household Income | 6,114 | $63,991 |
| Income Deficit | 3,688 | $0 |
| Wage / Income Gap (%) | 15,023 | 33.88% |
| Wage / Income Gap ($) | 15,023 | 66.12¢ per $1 |
| Gini / Inequality Index | 15,023 | 0.49 |
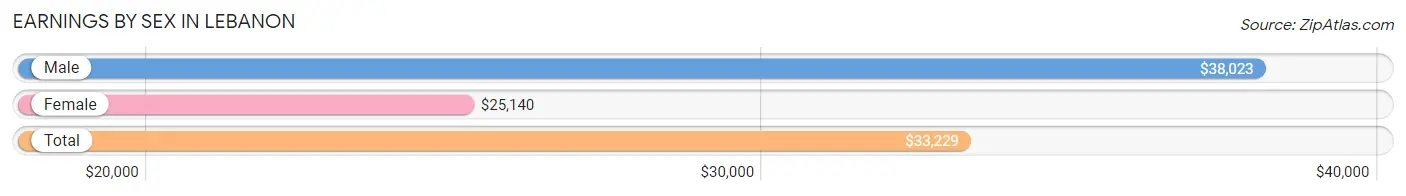
Earnings by Sex in Lebanon
Average Earnings in Lebanon are $33,229, $38,023 for men and $25,140 for women, a difference of 33.9%.
| Sex | Number | Average Earnings |
| Male | 4,254 (56.6%) | $38,023 |
| Female | 3,257 (43.4%) | $25,140 |
| Total | 7,511 (100.0%) | $33,229 |
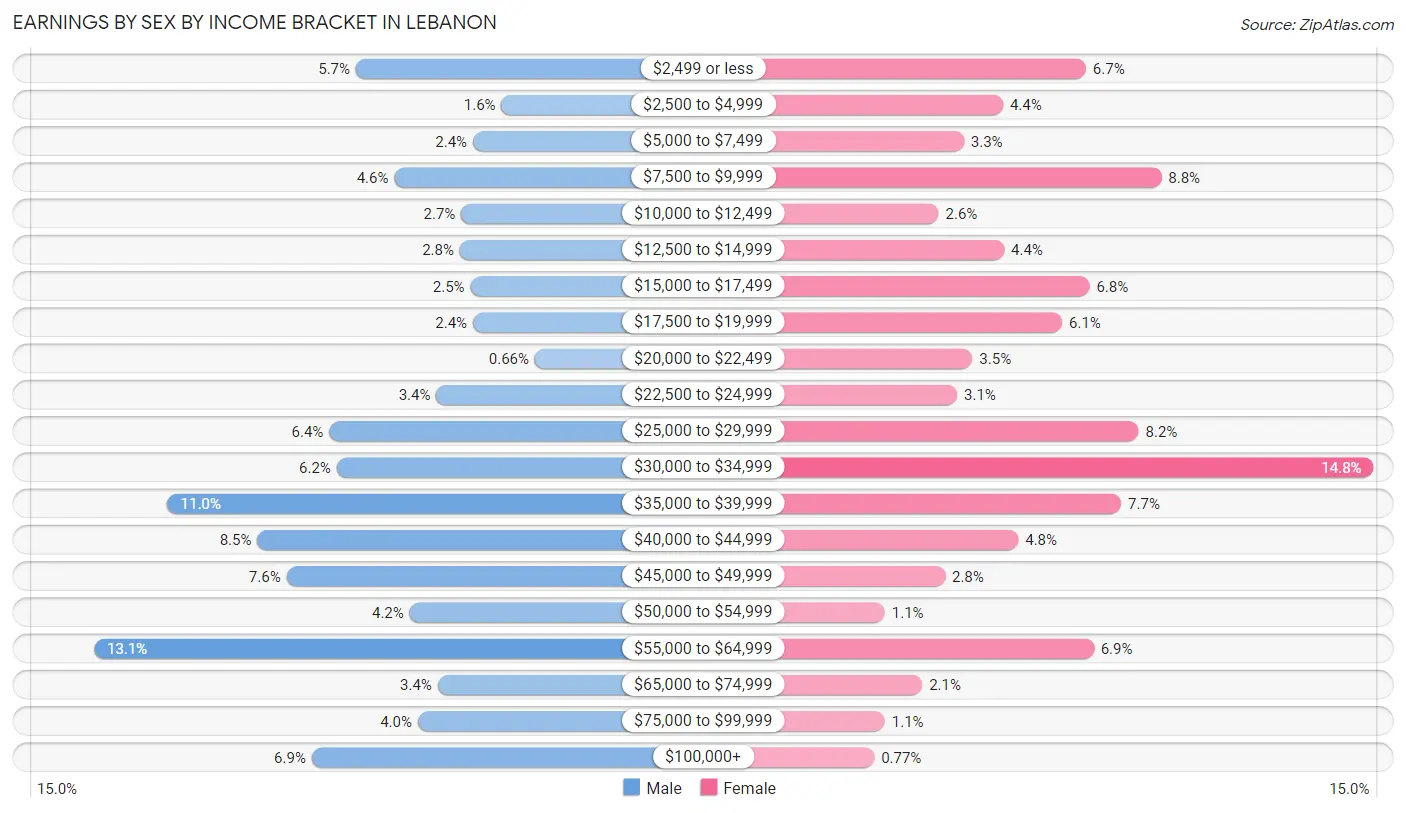
Earnings by Sex by Income Bracket in Lebanon
The most common earnings brackets in Lebanon are $55,000 to $64,999 for men (555 | 13.1%) and $30,000 to $34,999 for women (482 | 14.8%).
| Income | Male | Female |
| $2,499 or less | 242 (5.7%) | 219 (6.7%) |
| $2,500 to $4,999 | 68 (1.6%) | 143 (4.4%) |
| $5,000 to $7,499 | 102 (2.4%) | 107 (3.3%) |
| $7,500 to $9,999 | 196 (4.6%) | 288 (8.8%) |
| $10,000 to $12,499 | 116 (2.7%) | 84 (2.6%) |
| $12,500 to $14,999 | 118 (2.8%) | 144 (4.4%) |
| $15,000 to $17,499 | 105 (2.5%) | 222 (6.8%) |
| $17,500 to $19,999 | 102 (2.4%) | 197 (6.0%) |
| $20,000 to $22,499 | 28 (0.7%) | 115 (3.5%) |
| $22,500 to $24,999 | 146 (3.4%) | 101 (3.1%) |
| $25,000 to $29,999 | 274 (6.4%) | 267 (8.2%) |
| $30,000 to $34,999 | 265 (6.2%) | 482 (14.8%) |
| $35,000 to $39,999 | 467 (11.0%) | 251 (7.7%) |
| $40,000 to $44,999 | 360 (8.5%) | 157 (4.8%) |
| $45,000 to $49,999 | 325 (7.6%) | 90 (2.8%) |
| $50,000 to $54,999 | 178 (4.2%) | 35 (1.1%) |
| $55,000 to $64,999 | 555 (13.1%) | 226 (6.9%) |
| $65,000 to $74,999 | 144 (3.4%) | 69 (2.1%) |
| $75,000 to $99,999 | 168 (4.0%) | 35 (1.1%) |
| $100,000+ | 295 (6.9%) | 25 (0.8%) |
| Total | 4,254 (100.0%) | 3,257 (100.0%) |
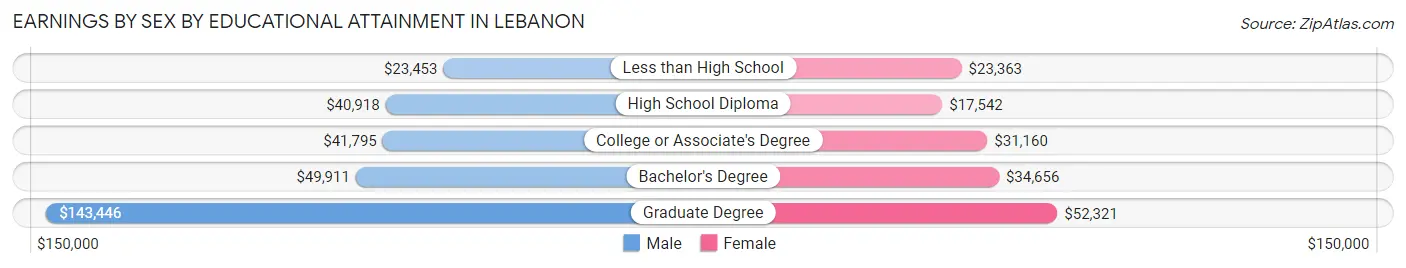
Earnings by Sex by Educational Attainment in Lebanon
Average earnings in Lebanon are $42,188 for men and $28,891 for women, a difference of 31.5%. Men with an educational attainment of graduate degree enjoy the highest average annual earnings of $143,446, while those with less than high school education earn the least with $23,453. Women with an educational attainment of graduate degree earn the most with the average annual earnings of $52,321, while those with high school diploma education have the smallest earnings of $17,542.
| Educational Attainment | Male Income | Female Income |
| Less than High School | $23,453 | $23,363 |
| High School Diploma | $40,918 | $17,542 |
| College or Associate's Degree | $41,795 | $31,160 |
| Bachelor's Degree | $49,911 | $34,656 |
| Graduate Degree | $143,446 | $52,321 |
| Total | $42,188 | $28,891 |
Family Income in Lebanon
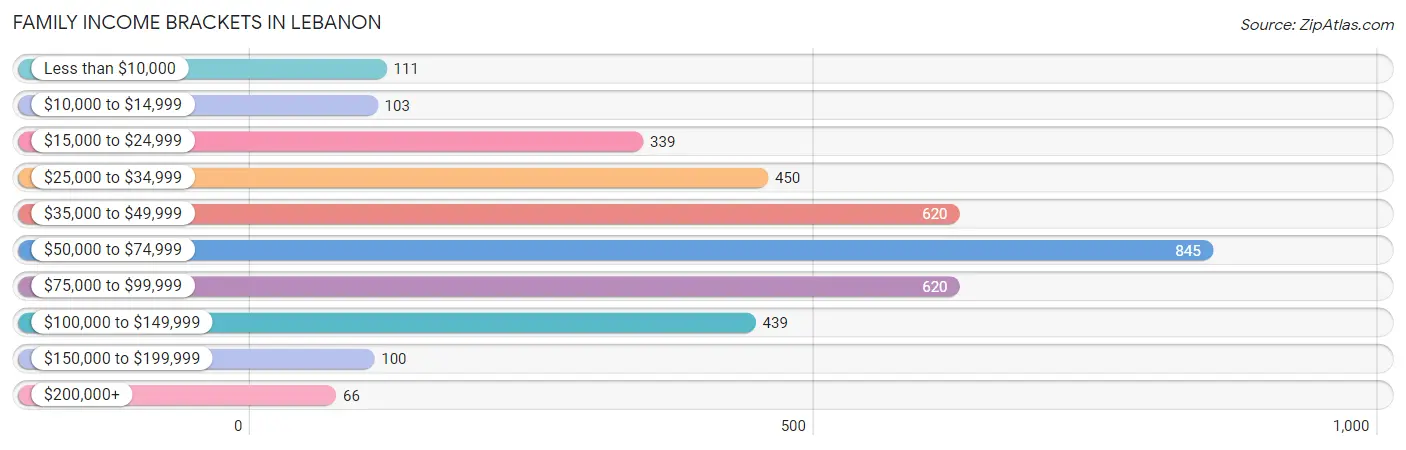
Family Income Brackets in Lebanon
According to the Lebanon family income data, there are 845 families falling into the $50,000 to $74,999 income range, which is the most common income bracket and makes up 22.9% of all families. Conversely, the $200,000+ income bracket is the least frequent group with only 66 families (1.8%) belonging to this category.
| Income Bracket | # Families | % Families |
| Less than $10,000 | 111 | 3.0% |
| $10,000 to $14,999 | 103 | 2.8% |
| $15,000 to $24,999 | 339 | 9.2% |
| $25,000 to $34,999 | 450 | 12.2% |
| $35,000 to $49,999 | 620 | 16.8% |
| $50,000 to $74,999 | 845 | 22.9% |
| $75,000 to $99,999 | 620 | 16.8% |
| $100,000 to $149,999 | 439 | 11.9% |
| $150,000 to $199,999 | 100 | 2.7% |
| $200,000+ | 66 | 1.8% |
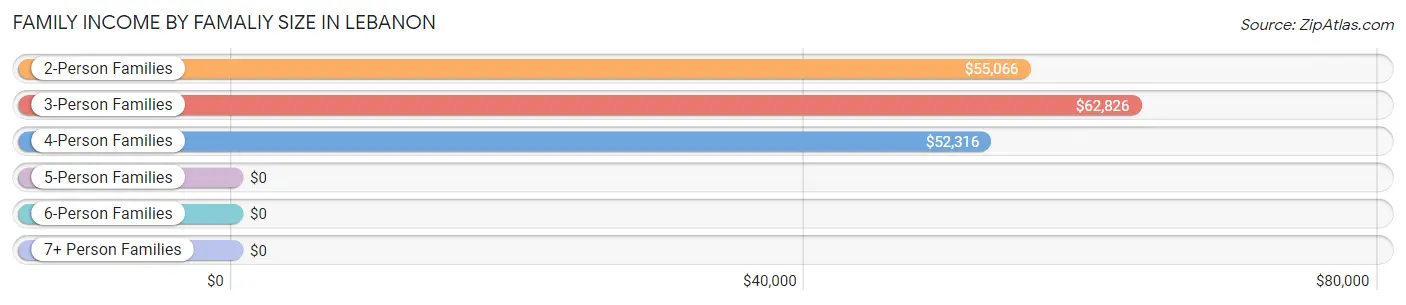
Family Income by Famaliy Size in Lebanon
3-person families (906 | 24.6%) account for the highest median family income in Lebanon with $62,826 per family, while 2-person families (1,643 | 44.6%) have the highest median income of $27,533 per family member.
| Income Bracket | # Families | Median Income |
| 2-Person Families | 1,643 (44.6%) | $55,066 |
| 3-Person Families | 906 (24.6%) | $62,826 |
| 4-Person Families | 705 (19.1%) | $52,316 |
| 5-Person Families | 285 (7.7%) | $0 |
| 6-Person Families | 137 (3.7%) | $0 |
| 7+ Person Families | 12 (0.3%) | $0 |
| Total | 3,688 (100.0%) | $60,054 |
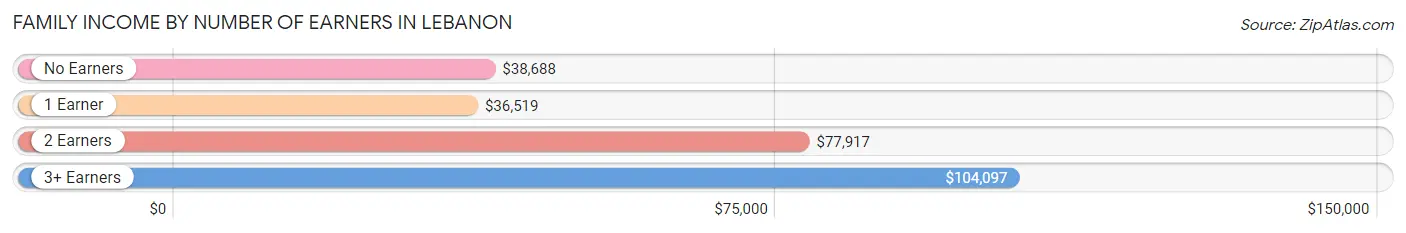
Family Income by Number of Earners in Lebanon
The median family income in Lebanon is $60,054, with families comprising 3+ earners (341) having the highest median family income of $104,097, while families with 1 earner (1,541) have the lowest median family income of $36,519, accounting for 9.2% and 41.8% of families, respectively.
| Number of Earners | # Families | Median Income |
| No Earners | 485 (13.2%) | $38,688 |
| 1 Earner | 1,541 (41.8%) | $36,519 |
| 2 Earners | 1,321 (35.8%) | $77,917 |
| 3+ Earners | 341 (9.2%) | $104,097 |
| Total | 3,688 (100.0%) | $60,054 |
Household Income in Lebanon
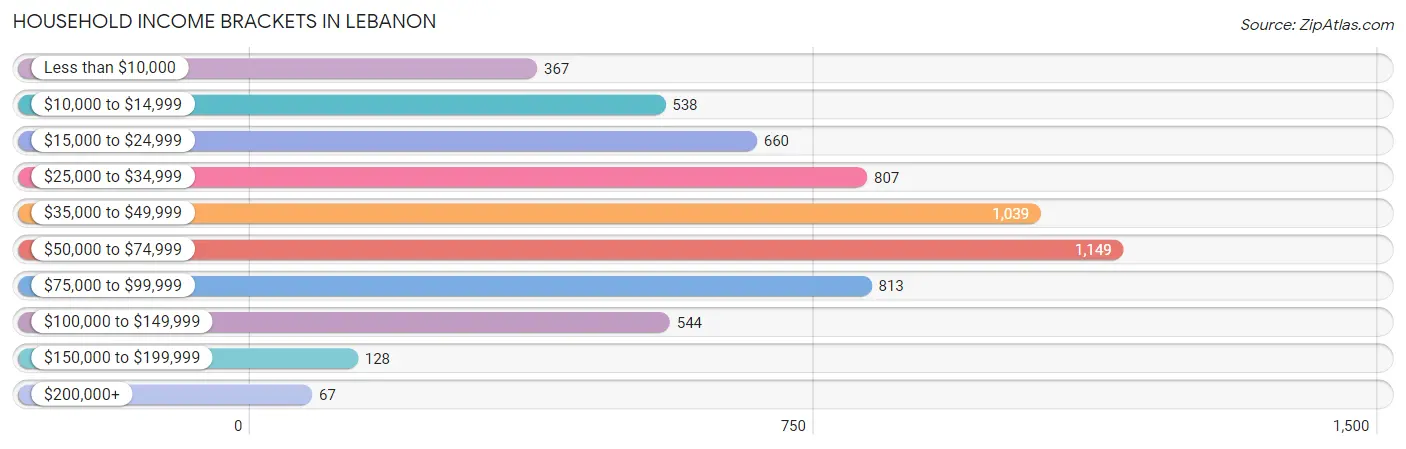
Household Income Brackets in Lebanon
With 1,149 households falling in the category, the $50,000 to $74,999 income range is the most frequent in Lebanon, accounting for 18.8% of all households. In contrast, only 67 households (1.1%) fall into the $200,000+ income bracket, making it the least populous group.
| Income Bracket | # Households | % Households |
| Less than $10,000 | 367 | 6.0% |
| $10,000 to $14,999 | 538 | 8.8% |
| $15,000 to $24,999 | 660 | 10.8% |
| $25,000 to $34,999 | 807 | 13.2% |
| $35,000 to $49,999 | 1,039 | 17.0% |
| $50,000 to $74,999 | 1,149 | 18.8% |
| $75,000 to $99,999 | 813 | 13.3% |
| $100,000 to $149,999 | 544 | 8.9% |
| $150,000 to $199,999 | 128 | 2.1% |
| $200,000+ | 67 | 1.1% |
Household Income by Householder Age in Lebanon
The median household income in Lebanon is $45,634, with the highest median household income of $59,268 found in the 25 to 44 years age bracket for the primary householder. A total of 2,106 households (34.4%) fall into this category. Meanwhile, the 65+ years age bracket for the primary householder has the lowest median household income of $29,427, with 1,643 households (26.9%) in this group.
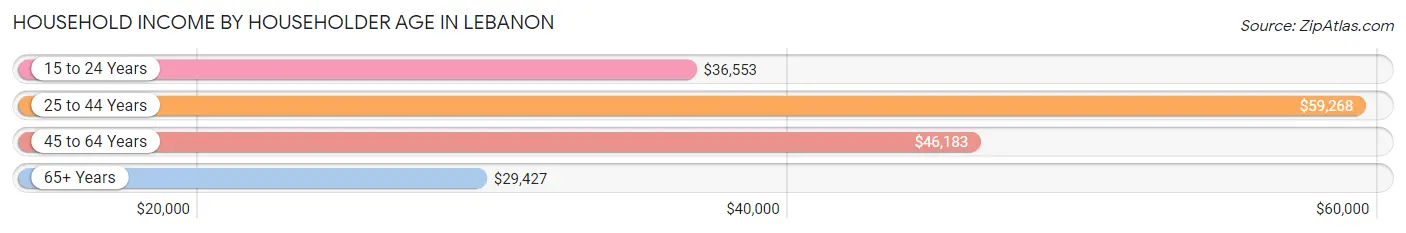
| Income Bracket | # Households | Median Income |
| 15 to 24 Years | 267 (4.4%) | $36,553 |
| 25 to 44 Years | 2,106 (34.4%) | $59,268 |
| 45 to 64 Years | 2,098 (34.3%) | $46,183 |
| 65+ Years | 1,643 (26.9%) | $29,427 |
| Total | 6,114 (100.0%) | $45,634 |
Poverty in Lebanon
Income Below Poverty by Sex and Age in Lebanon
With 16.1% poverty level for males and 24.7% for females among the residents of Lebanon, under 5 year old males and 15 year old females are the most vulnerable to poverty, with 201 males (45.8%) and 52 females (58.4%) in their respective age groups living below the poverty level.
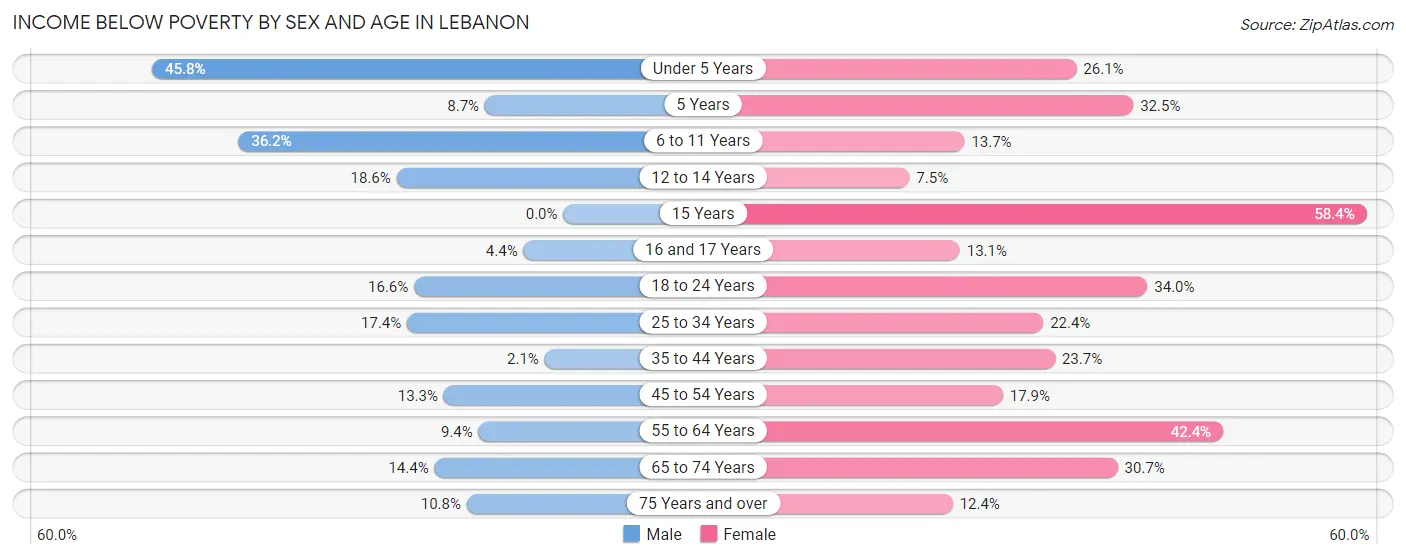
| Age Bracket | Male | Female |
| Under 5 Years | 201 (45.8%) | 133 (26.1%) |
| 5 Years | 11 (8.7%) | 37 (32.5%) |
| 6 to 11 Years | 282 (36.2%) | 65 (13.7%) |
| 12 to 14 Years | 57 (18.6%) | 22 (7.5%) |
| 15 Years | 0 (0.0%) | 52 (58.4%) |
| 16 and 17 Years | 13 (4.4%) | 23 (13.1%) |
| 18 to 24 Years | 111 (16.6%) | 211 (34.0%) |
| 25 to 34 Years | 197 (17.4%) | 249 (22.4%) |
| 35 to 44 Years | 21 (2.1%) | 170 (23.7%) |
| 45 to 54 Years | 130 (13.3%) | 151 (17.9%) |
| 55 to 64 Years | 56 (9.4%) | 390 (42.4%) |
| 65 to 74 Years | 69 (14.3%) | 196 (30.7%) |
| 75 Years and over | 40 (10.7%) | 93 (12.3%) |
| Total | 1,188 (16.1%) | 1,792 (24.7%) |
Income Above Poverty by Sex and Age in Lebanon
According to the poverty statistics in Lebanon, males aged 15 years and females aged 12 to 14 years are the age groups that are most secure financially, with 100.0% of males and 92.5% of females in these age groups living above the poverty line.
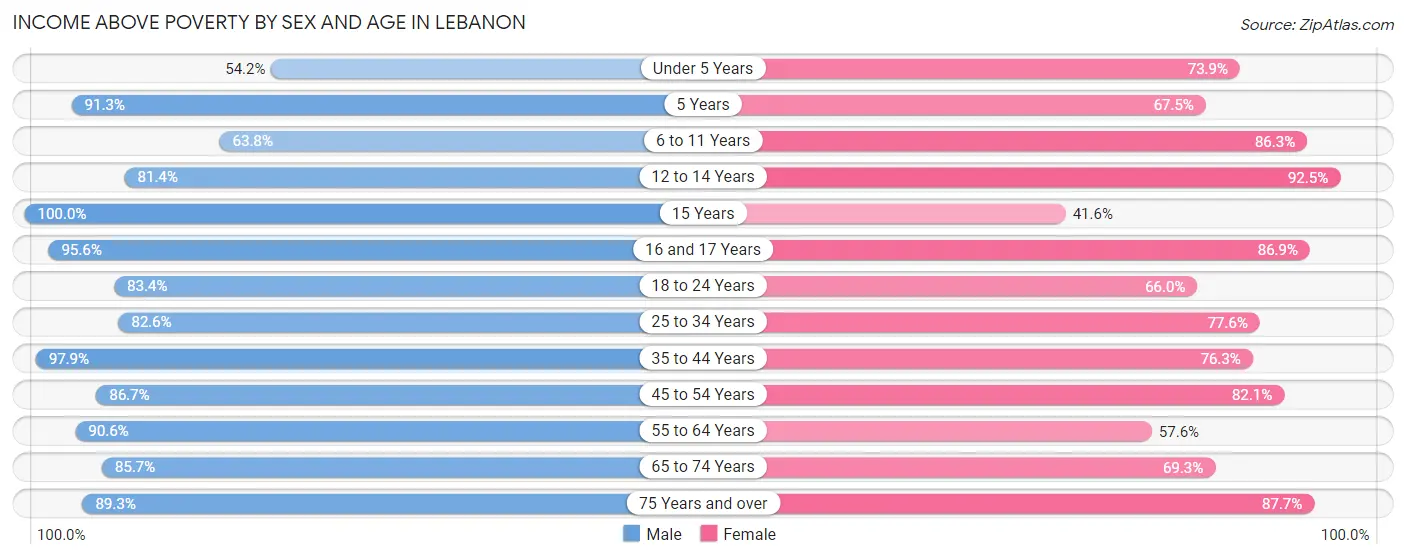
| Age Bracket | Male | Female |
| Under 5 Years | 238 (54.2%) | 376 (73.9%) |
| 5 Years | 115 (91.3%) | 77 (67.5%) |
| 6 to 11 Years | 497 (63.8%) | 411 (86.3%) |
| 12 to 14 Years | 250 (81.4%) | 270 (92.5%) |
| 15 Years | 192 (100.0%) | 37 (41.6%) |
| 16 and 17 Years | 280 (95.6%) | 152 (86.9%) |
| 18 to 24 Years | 557 (83.4%) | 409 (66.0%) |
| 25 to 34 Years | 935 (82.6%) | 861 (77.6%) |
| 35 to 44 Years | 991 (97.9%) | 546 (76.3%) |
| 45 to 54 Years | 847 (86.7%) | 691 (82.1%) |
| 55 to 64 Years | 537 (90.6%) | 529 (57.6%) |
| 65 to 74 Years | 412 (85.7%) | 442 (69.3%) |
| 75 Years and over | 332 (89.2%) | 660 (87.6%) |
| Total | 6,183 (83.9%) | 5,461 (75.3%) |
Income Below Poverty Among Married-Couple Families in Lebanon
The poverty statistics for married-couple families in Lebanon show that 7.4% or 169 of the total 2,292 families live below the poverty line. Families with no children have the highest poverty rate of 9.4%, comprising of 102 families. On the other hand, families with 3 or 4 children have the lowest poverty rate of 0.0%, which includes 0 families.
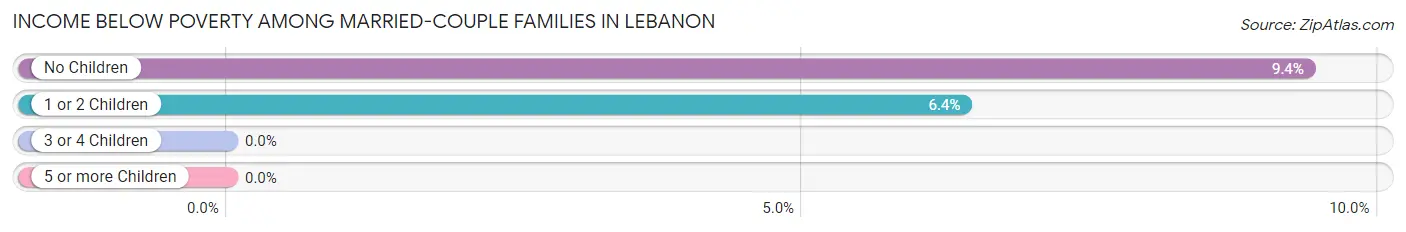
| Children | Above Poverty | Below Poverty |
| No Children | 986 (90.6%) | 102 (9.4%) |
| 1 or 2 Children | 981 (93.6%) | 67 (6.4%) |
| 3 or 4 Children | 144 (100.0%) | 0 (0.0%) |
| 5 or more Children | 12 (100.0%) | 0 (0.0%) |
| Total | 2,123 (92.6%) | 169 (7.4%) |
Income Below Poverty Among Single-Parent Households in Lebanon
According to the poverty data in Lebanon, 8.0% or 40 single-father households and 39.0% or 349 single-mother households are living below the poverty line. Among single-father households, those with no children have the highest poverty rate, with 15 households (15.8%) experiencing poverty. Likewise, among single-mother households, those with 3 or 4 children have the highest poverty rate, with 166 households (96.0%) falling below the poverty line.
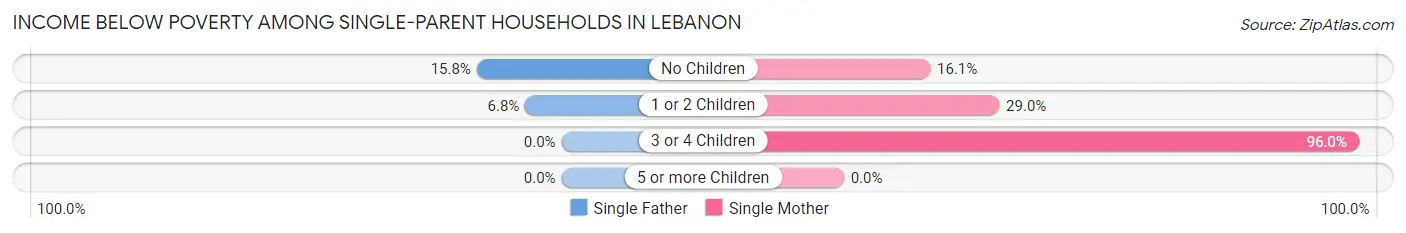
| Children | Single Father | Single Mother |
| No Children | 15 (15.8%) | 33 (16.1%) |
| 1 or 2 Children | 25 (6.8%) | 150 (29.0%) |
| 3 or 4 Children | 0 (0.0%) | 166 (96.0%) |
| 5 or more Children | 0 (0.0%) | 0 (0.0%) |
| Total | 40 (8.0%) | 349 (39.0%) |
Income Below Poverty Among Married-Couple vs Single-Parent Households in Lebanon
The poverty data for Lebanon shows that 169 of the married-couple family households (7.4%) and 389 of the single-parent households (27.9%) are living below the poverty level. Within the married-couple family households, those with no children have the highest poverty rate, with 102 households (9.4%) falling below the poverty line. Among the single-parent households, those with 3 or 4 children have the highest poverty rate, with 166 household (79.8%) living below poverty.
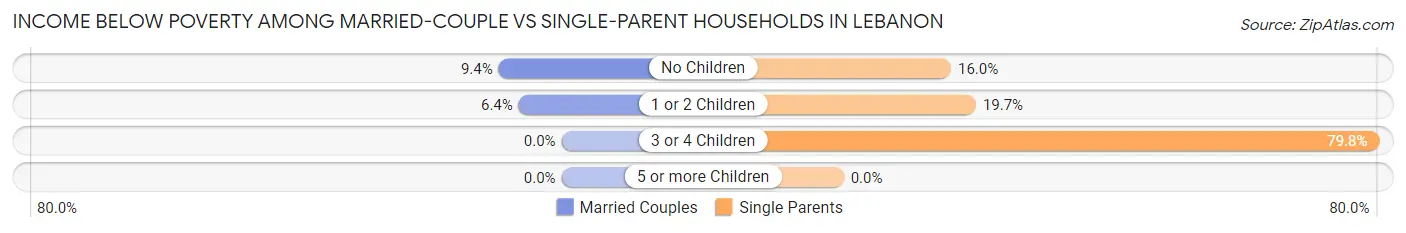
| Children | Married-Couple Families | Single-Parent Households |
| No Children | 102 (9.4%) | 48 (16.0%) |
| 1 or 2 Children | 67 (6.4%) | 175 (19.7%) |
| 3 or 4 Children | 0 (0.0%) | 166 (79.8%) |
| 5 or more Children | 0 (0.0%) | 0 (0.0%) |
| Total | 169 (7.4%) | 389 (27.9%) |
Race in Lebanon
The most populous races in Lebanon are White / Caucasian (13,384 | 89.1%), Two or more Races (840 | 5.6%), and Hispanic or Latino (626 | 4.2%).
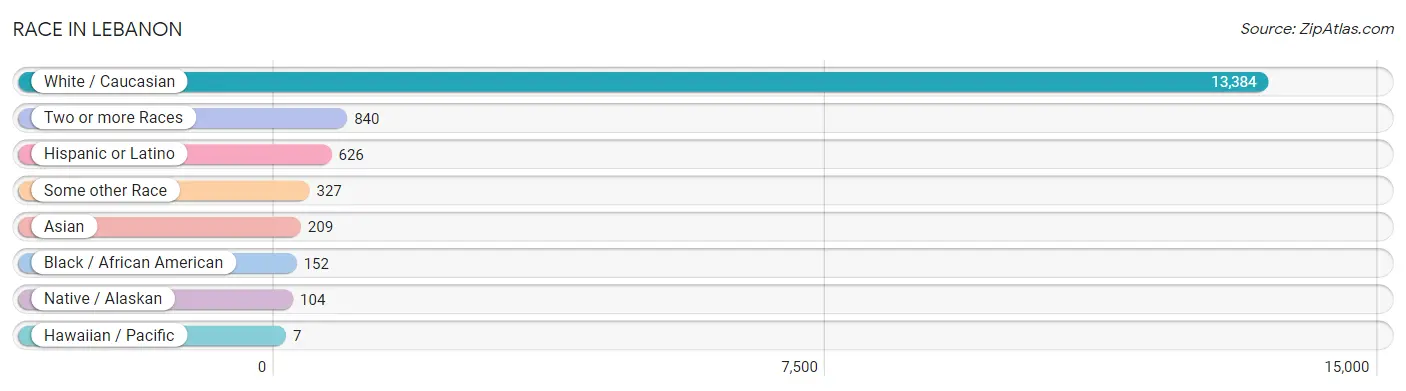
| Race | # Population | % Population |
| Asian | 209 | 1.4% |
| Black / African American | 152 | 1.0% |
| Hawaiian / Pacific | 7 | 0.1% |
| Hispanic or Latino | 626 | 4.2% |
| Native / Alaskan | 104 | 0.7% |
| White / Caucasian | 13,384 | 89.1% |
| Two or more Races | 840 | 5.6% |
| Some other Race | 327 | 2.2% |
| Total | 15,023 | 100.0% |
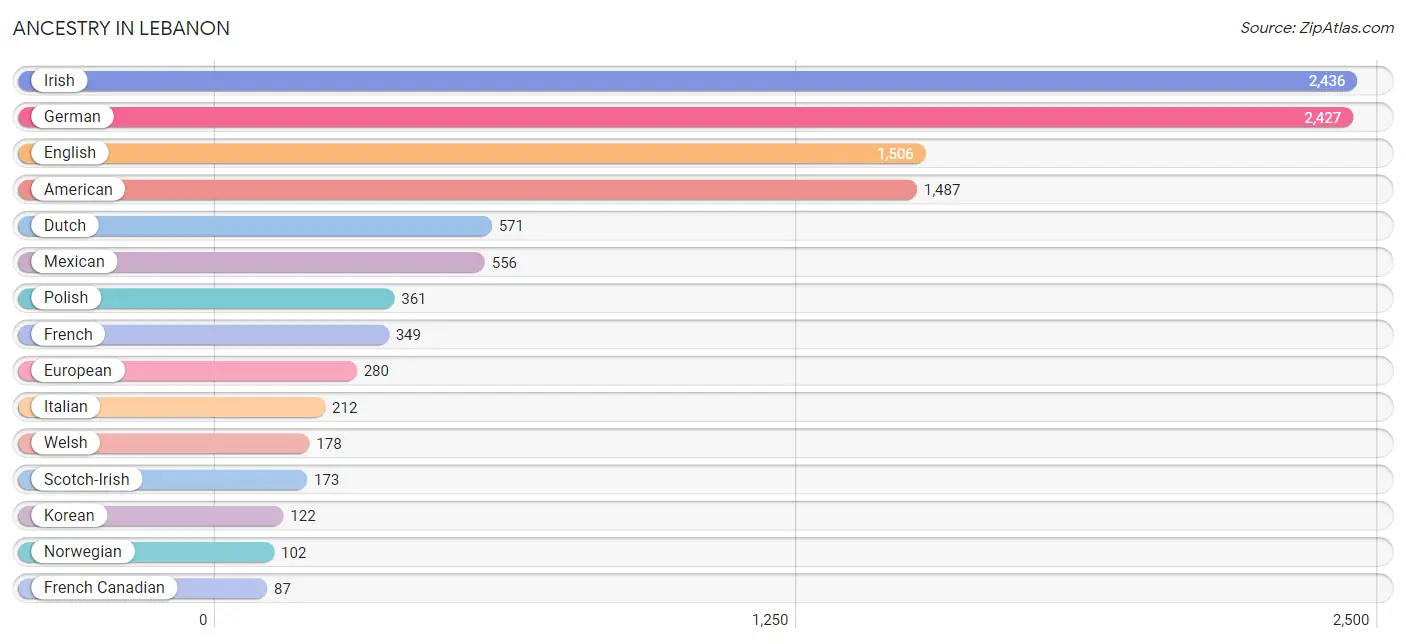
Ancestry in Lebanon
The most populous ancestries reported in Lebanon are Irish (2,436 | 16.2%), German (2,427 | 16.2%), English (1,506 | 10.0%), American (1,487 | 9.9%), and Dutch (571 | 3.8%), together accounting for 56.1% of all Lebanon residents.
| Ancestry | # Population | % Population |
| American | 1,487 | 9.9% |
| Apache | 47 | 0.3% |
| Arab | 17 | 0.1% |
| Bhutanese | 15 | 0.1% |
| Blackfeet | 1 | 0.0% |
| British | 76 | 0.5% |
| Burmese | 76 | 0.5% |
| Cajun | 10 | 0.1% |
| Celtic | 22 | 0.2% |
| Cherokee | 69 | 0.5% |
| Czechoslovakian | 28 | 0.2% |
| Danish | 28 | 0.2% |
| Dutch | 571 | 3.8% |
| Eastern European | 14 | 0.1% |
| English | 1,506 | 10.0% |
| European | 280 | 1.9% |
| Finnish | 12 | 0.1% |
| French | 349 | 2.3% |
| French Canadian | 87 | 0.6% |
| German | 2,427 | 16.2% |
| Greek | 6 | 0.0% |
| Hungarian | 25 | 0.2% |
| Indian (Asian) | 78 | 0.5% |
| Irish | 2,436 | 16.2% |
| Iroquois | 11 | 0.1% |
| Italian | 212 | 1.4% |
| Korean | 122 | 0.8% |
| Mexican | 556 | 3.7% |
| Navajo | 13 | 0.1% |
| Norwegian | 102 | 0.7% |
| Pakistani | 23 | 0.2% |
| Pennsylvania German | 11 | 0.1% |
| Polish | 361 | 2.4% |
| Romanian | 10 | 0.1% |
| Russian | 37 | 0.3% |
| Samoan | 7 | 0.1% |
| Scandinavian | 10 | 0.1% |
| Scotch-Irish | 173 | 1.1% |
| Scottish | 58 | 0.4% |
| Seminole | 2 | 0.0% |
| Spaniard | 70 | 0.5% |
| Swedish | 31 | 0.2% |
| Syrian | 17 | 0.1% |
| Ukrainian | 9 | 0.1% |
| Welsh | 178 | 1.2% | View All 45 Rows |
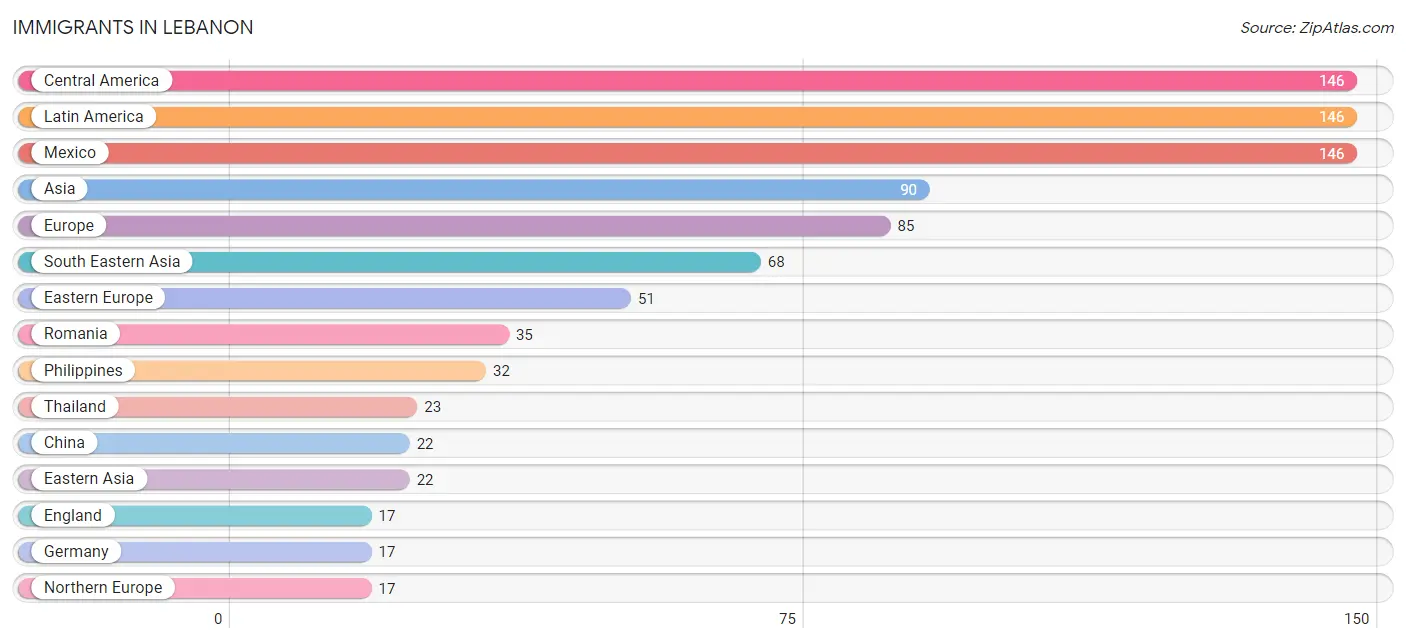
Immigrants in Lebanon
The most numerous immigrant groups reported in Lebanon came from Central America (146 | 1.0%), Latin America (146 | 1.0%), Mexico (146 | 1.0%), Asia (90 | 0.6%), and Europe (85 | 0.6%), together accounting for 4.1% of all Lebanon residents.
| Immigration Origin | # Population | % Population |
| Asia | 90 | 0.6% |
| Cambodia | 13 | 0.1% |
| Central America | 146 | 1.0% |
| China | 22 | 0.2% |
| Eastern Asia | 22 | 0.2% |
| Eastern Europe | 51 | 0.3% |
| England | 17 | 0.1% |
| Europe | 85 | 0.6% |
| Germany | 17 | 0.1% |
| Hong Kong | 6 | 0.0% |
| Latin America | 146 | 1.0% |
| Mexico | 146 | 1.0% |
| Northern Europe | 17 | 0.1% |
| Philippines | 32 | 0.2% |
| Romania | 35 | 0.2% |
| Russia | 16 | 0.1% |
| South Eastern Asia | 68 | 0.4% |
| Thailand | 23 | 0.2% |
| Western Europe | 17 | 0.1% | View All 19 Rows |
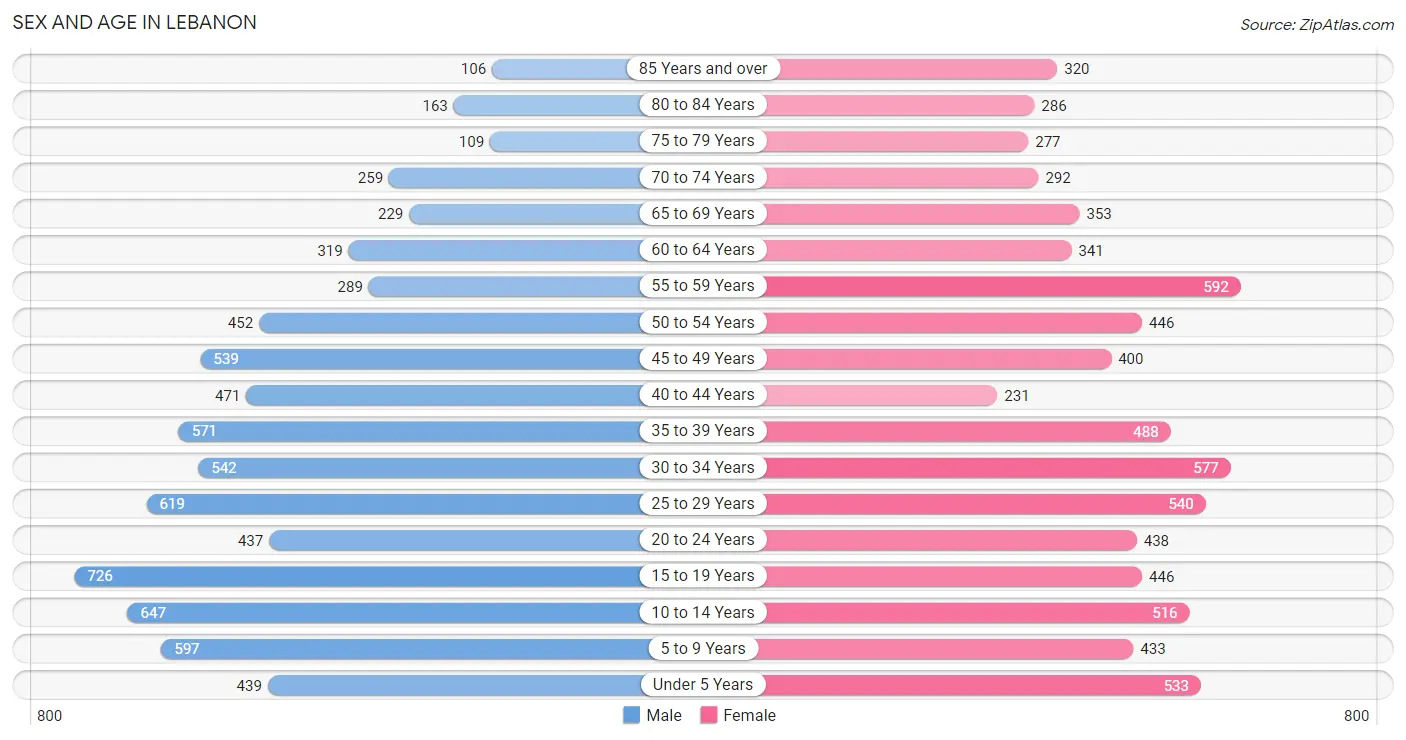
Sex and Age in Lebanon
Sex and Age in Lebanon
The most populous age groups in Lebanon are 15 to 19 Years (726 | 9.7%) for men and 55 to 59 Years (592 | 7.9%) for women.
| Age Bracket | Male | Female |
| Under 5 Years | 439 (5.8%) | 533 (7.1%) |
| 5 to 9 Years | 597 (8.0%) | 433 (5.8%) |
| 10 to 14 Years | 647 (8.6%) | 516 (6.9%) |
| 15 to 19 Years | 726 (9.7%) | 446 (5.9%) |
| 20 to 24 Years | 437 (5.8%) | 438 (5.8%) |
| 25 to 29 Years | 619 (8.2%) | 540 (7.2%) |
| 30 to 34 Years | 542 (7.2%) | 577 (7.7%) |
| 35 to 39 Years | 571 (7.6%) | 488 (6.5%) |
| 40 to 44 Years | 471 (6.3%) | 231 (3.1%) |
| 45 to 49 Years | 539 (7.2%) | 400 (5.3%) |
| 50 to 54 Years | 452 (6.0%) | 446 (5.9%) |
| 55 to 59 Years | 289 (3.8%) | 592 (7.9%) |
| 60 to 64 Years | 319 (4.3%) | 341 (4.5%) |
| 65 to 69 Years | 229 (3.0%) | 353 (4.7%) |
| 70 to 74 Years | 259 (3.5%) | 292 (3.9%) |
| 75 to 79 Years | 109 (1.5%) | 277 (3.7%) |
| 80 to 84 Years | 163 (2.2%) | 286 (3.8%) |
| 85 Years and over | 106 (1.4%) | 320 (4.3%) |
| Total | 7,514 (100.0%) | 7,509 (100.0%) |
Families and Households in Lebanon
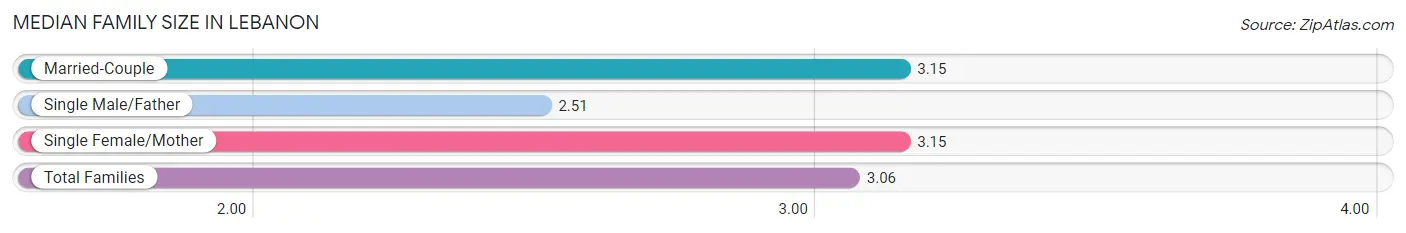
Median Family Size in Lebanon
The median family size in Lebanon is 3.06 persons per family, with married-couple families (2,292 | 62.2%) accounting for the largest median family size of 3.15 persons per family. On the other hand, single male/father families (500 | 13.6%) represent the smallest median family size with 2.51 persons per family.
| Family Type | # Families | Family Size |
| Married-Couple | 2,292 (62.2%) | 3.15 |
| Single Male/Father | 500 (13.6%) | 2.51 |
| Single Female/Mother | 896 (24.3%) | 3.15 |
| Total Families | 3,688 (100.0%) | 3.06 |
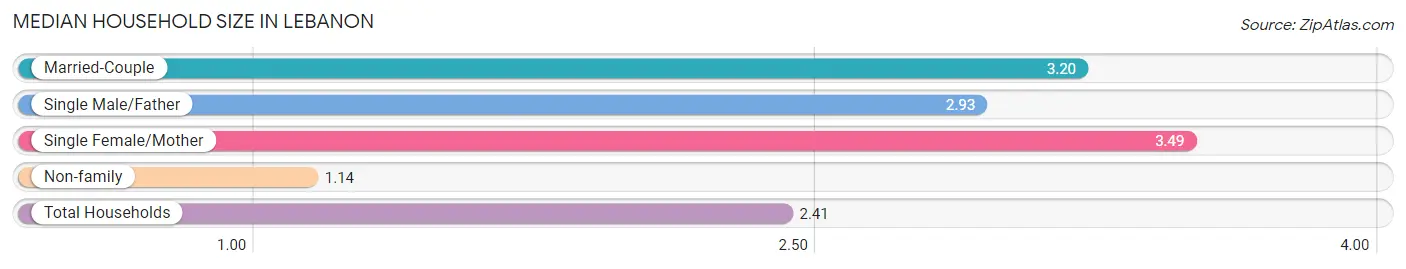
Median Household Size in Lebanon
The median household size in Lebanon is 2.41 persons per household, with single female/mother households (896 | 14.6%) accounting for the largest median household size of 3.49 persons per household. non-family households (2,426 | 39.7%) represent the smallest median household size with 1.14 persons per household.
| Household Type | # Households | Household Size |
| Married-Couple | 2,292 (37.5%) | 3.20 |
| Single Male/Father | 500 (8.2%) | 2.93 |
| Single Female/Mother | 896 (14.6%) | 3.49 |
| Non-family | 2,426 (39.7%) | 1.14 |
| Total Households | 6,114 (100.0%) | 2.41 |
Household Size by Marriage Status in Lebanon
Out of a total of 6,114 households in Lebanon, 3,688 (60.3%) are family households, while 2,426 (39.7%) are nonfamily households. The most numerous type of family households are 2-person households, comprising 1,587, and the most common type of nonfamily households are 1-person households, comprising 2,010.
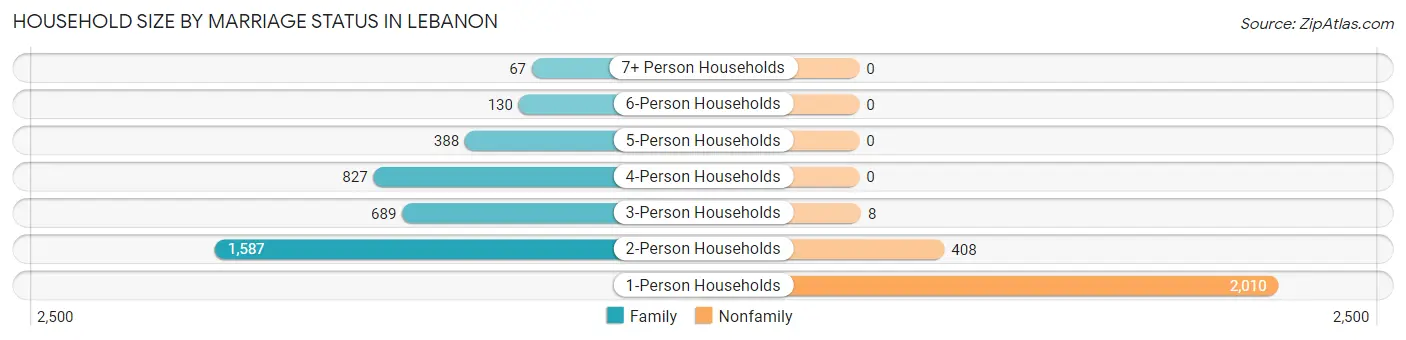
| Household Size | Family Households | Nonfamily Households |
| 1-Person Households | - | 2,010 (32.9%) |
| 2-Person Households | 1,587 (26.0%) | 408 (6.7%) |
| 3-Person Households | 689 (11.3%) | 8 (0.1%) |
| 4-Person Households | 827 (13.5%) | 0 (0.0%) |
| 5-Person Households | 388 (6.4%) | 0 (0.0%) |
| 6-Person Households | 130 (2.1%) | 0 (0.0%) |
| 7+ Person Households | 67 (1.1%) | 0 (0.0%) |
| Total | 3,688 (60.3%) | 2,426 (39.7%) |
Female Fertility in Lebanon
Fertility by Age in Lebanon
Average fertility rate in Lebanon is 81.0 births per 1,000 women. Women in the age bracket of 20 to 34 years have the highest fertility rate with 127.0 births per 1,000 women. Women in the age bracket of 20 to 34 years acount for 75.8% of all women with births.
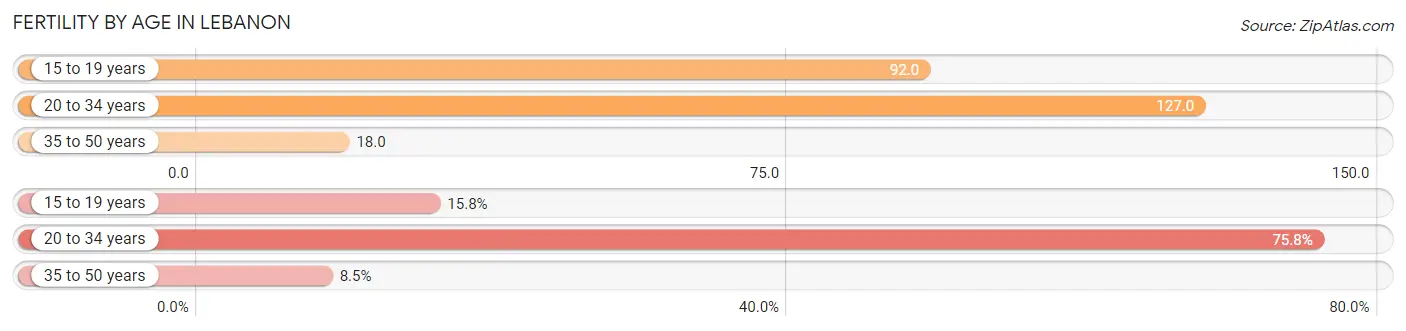
| Age Bracket | Women with Births | Births / 1,000 Women |
| 15 to 19 years | 41 (15.8%) | 92.0 |
| 20 to 34 years | 197 (75.8%) | 127.0 |
| 35 to 50 years | 22 (8.5%) | 18.0 |
| Total | 260 (100.0%) | 81.0 |
Fertility by Age by Marriage Status in Lebanon
60.4% of women with births (260) in Lebanon are married. The highest percentage of unmarried women with births falls into 15 to 19 years age bracket with 100.0% of them unmarried at the time of birth, while the lowest percentage of unmarried women with births belong to 20 to 34 years age bracket with 20.3% of them unmarried.
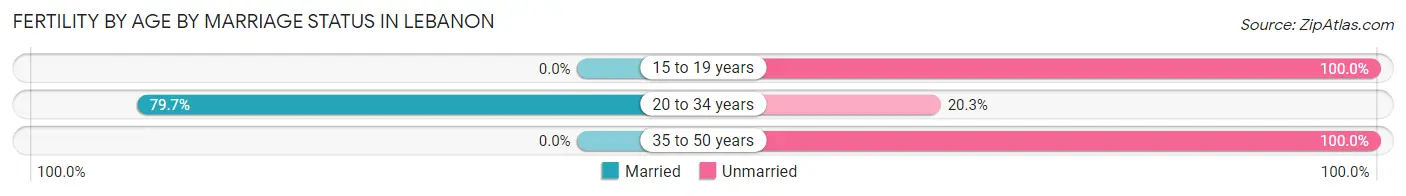
| Age Bracket | Married | Unmarried |
| 15 to 19 years | 0 (0.0%) | 41 (100.0%) |
| 20 to 34 years | 157 (79.7%) | 40 (20.3%) |
| 35 to 50 years | 0 (0.0%) | 22 (100.0%) |
| Total | 157 (60.4%) | 103 (39.6%) |
Fertility by Education in Lebanon
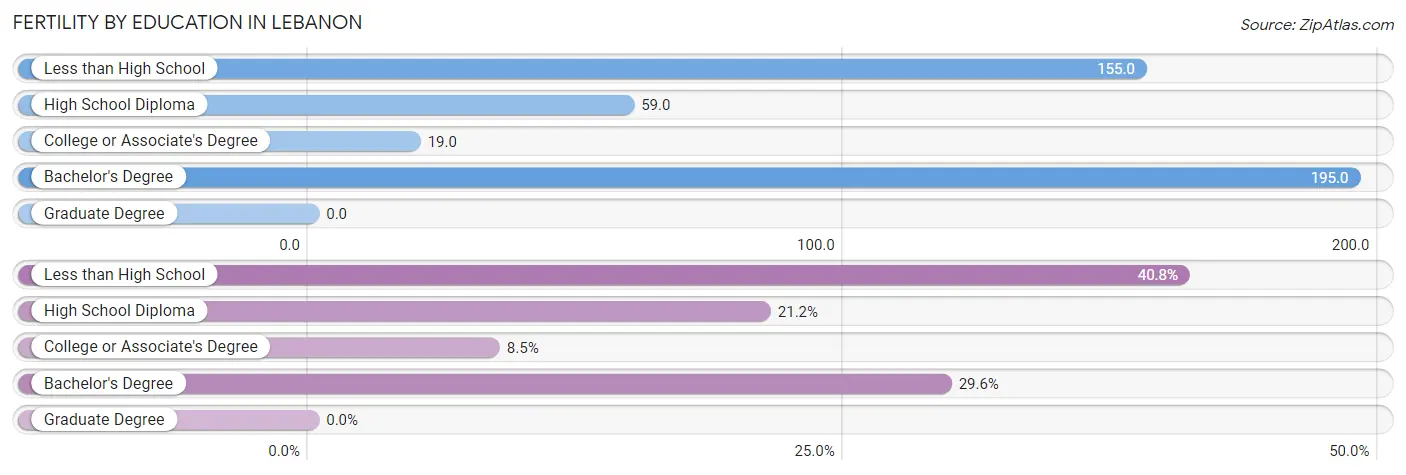
| Educational Attainment | Women with Births | Births / 1,000 Women |
| Less than High School | 106 (40.8%) | 155.0 |
| High School Diploma | 55 (21.1%) | 59.0 |
| College or Associate's Degree | 22 (8.5%) | 19.0 |
| Bachelor's Degree | 77 (29.6%) | 195.0 |
| Graduate Degree | 0 (0.0%) | 0.0 |
| Total | 260 (100.0%) | 81.0 |
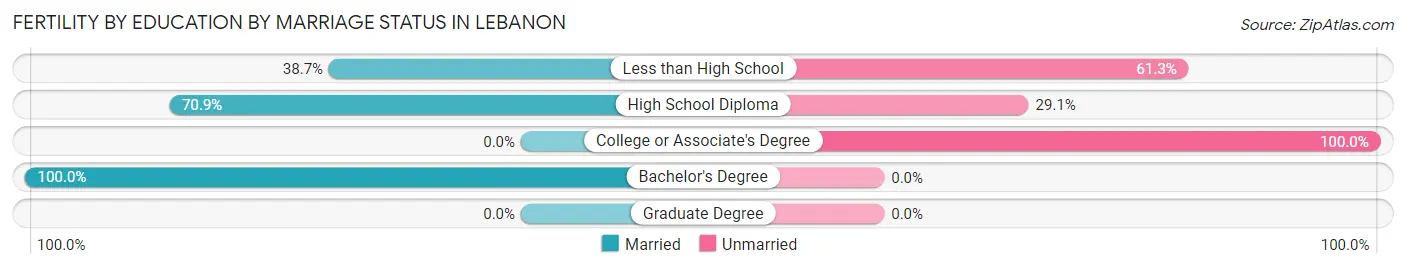
Fertility by Education by Marriage Status in Lebanon
39.6% of women with births in Lebanon are unmarried. Women with the educational attainment of bachelor's degree are most likely to be married with 100.0% of them married at childbirth, while women with the educational attainment of college or associate's degree are least likely to be married with 100.0% of them unmarried at childbirth.
| Educational Attainment | Married | Unmarried |
| Less than High School | 41 (38.7%) | 65 (61.3%) |
| High School Diploma | 39 (70.9%) | 16 (29.1%) |
| College or Associate's Degree | 0 (0.0%) | 22 (100.0%) |
| Bachelor's Degree | 77 (100.0%) | 0 (0.0%) |
| Graduate Degree | 0 (0.0%) | 0 (0.0%) |
| Total | 157 (60.4%) | 103 (39.6%) |
Employment Characteristics in Lebanon
Employment by Class of Employer in Lebanon
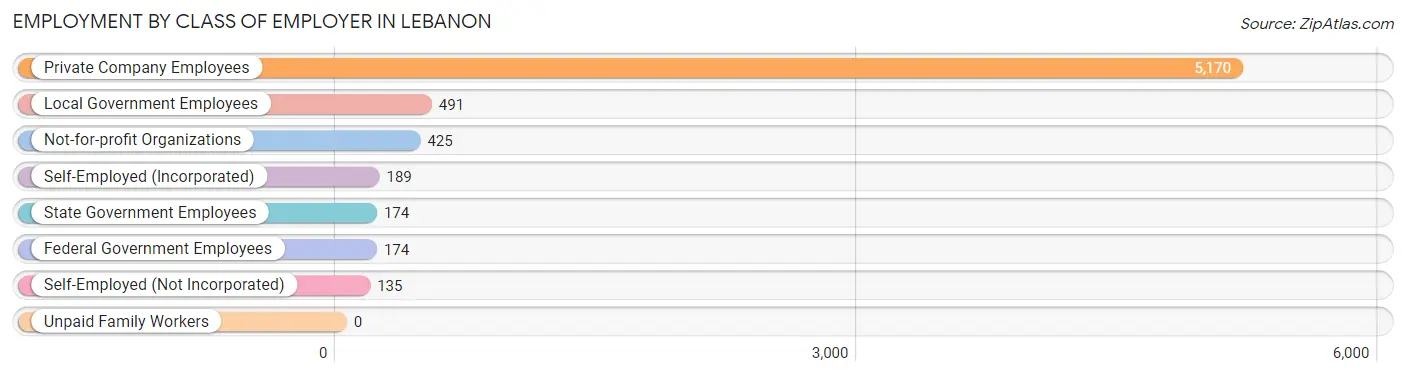
Among the 6,758 employed individuals in Lebanon, private company employees (5,170 | 76.5%), local government employees (491 | 7.3%), and not-for-profit organizations (425 | 6.3%) make up the most common classes of employment.
| Employer Class | # Employees | % Employees |
| Private Company Employees | 5,170 | 76.5% |
| Self-Employed (Incorporated) | 189 | 2.8% |
| Self-Employed (Not Incorporated) | 135 | 2.0% |
| Not-for-profit Organizations | 425 | 6.3% |
| Local Government Employees | 491 | 7.3% |
| State Government Employees | 174 | 2.6% |
| Federal Government Employees | 174 | 2.6% |
| Unpaid Family Workers | 0 | 0.0% |
| Total | 6,758 | 100.0% |
Employment Status by Age in Lebanon
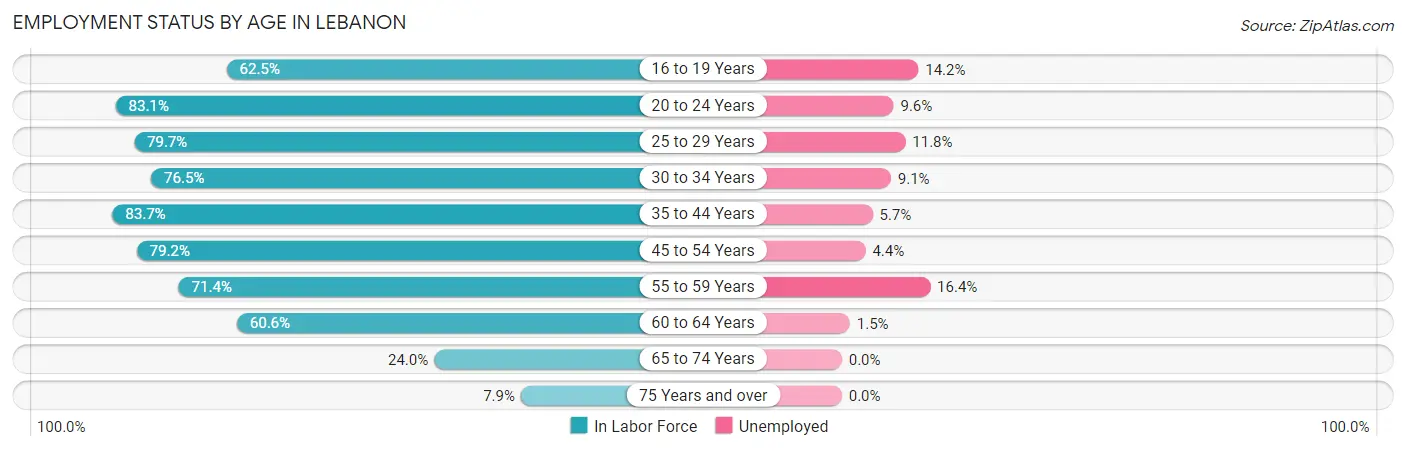
According to the labor force statistics for Lebanon, out of the total population over 16 years of age (11,577), 63.9% or 7,398 individuals are in the labor force, with 8.0% or 592 of them unemployed. The age group with the highest labor force participation rate is 35 to 44 years, with 83.7% or 1,474 individuals in the labor force. Within the labor force, the 55 to 59 years age range has the highest percentage of unemployed individuals, with 16.4% or 103 of them being unemployed.
| Age Bracket | In Labor Force | Unemployed |
| 16 to 19 Years | 557 (62.5%) | 79 (14.2%) |
| 20 to 24 Years | 727 (83.1%) | 70 (9.6%) |
| 25 to 29 Years | 924 (79.7%) | 109 (11.8%) |
| 30 to 34 Years | 856 (76.5%) | 78 (9.1%) |
| 35 to 44 Years | 1,474 (83.7%) | 84 (5.7%) |
| 45 to 54 Years | 1,455 (79.2%) | 64 (4.4%) |
| 55 to 59 Years | 629 (71.4%) | 103 (16.4%) |
| 60 to 64 Years | 400 (60.6%) | 6 (1.5%) |
| 65 to 74 Years | 272 (24.0%) | 0 (0.0%) |
| 75 Years and over | 100 (7.9%) | 0 (0.0%) |
| Total | 7,398 (63.9%) | 592 (8.0%) |
Employment Status by Educational Attainment in Lebanon
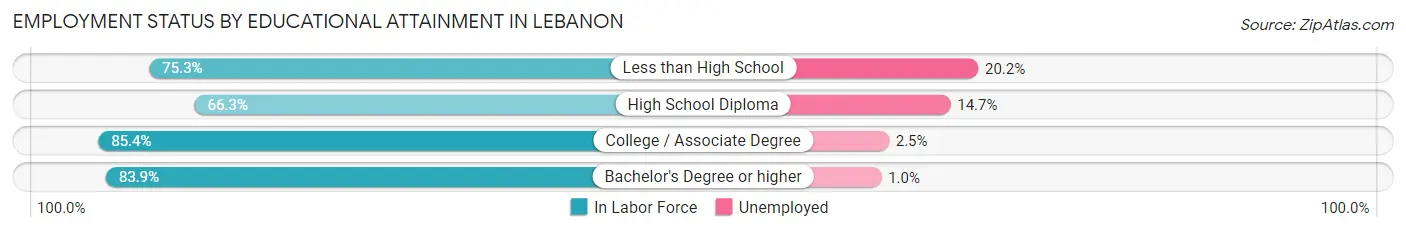
According to labor force statistics for Lebanon, 77.3% of individuals (5,733) out of the total population between 25 and 64 years of age (7,417) are in the labor force, with 7.7% or 441 of them being unemployed. The group with the highest labor force participation rate are those with the educational attainment of college / associate degree, with 85.4% or 2,135 individuals in the labor force. Within the labor force, individuals with less than high school education have the highest percentage of unemployment, with 20.2% or 127 of them being unemployed.
| Educational Attainment | In Labor Force | Unemployed |
| Less than High School | 629 (75.3%) | 169 (20.2%) |
| High School Diploma | 1,711 (66.3%) | 379 (14.7%) |
| College / Associate Degree | 2,135 (85.4%) | 62 (2.5%) |
| Bachelor's Degree or higher | 1,259 (83.9%) | 15 (1.0%) |
| Total | 5,733 (77.3%) | 571 (7.7%) |
Employment Occupations by Sex in Lebanon
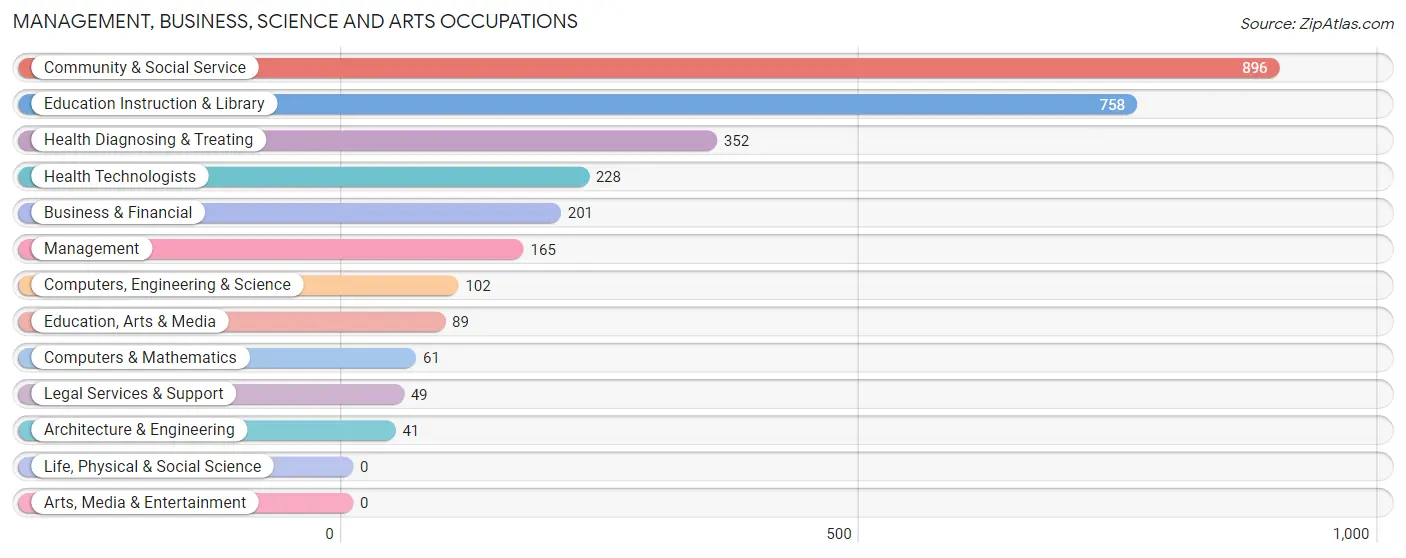
Management, Business, Science and Arts Occupations
The most common Management, Business, Science and Arts occupations in Lebanon are Community & Social Service (896 | 13.2%), Education Instruction & Library (758 | 11.2%), Health Diagnosing & Treating (352 | 5.2%), Health Technologists (228 | 3.4%), and Business & Financial (201 | 3.0%).
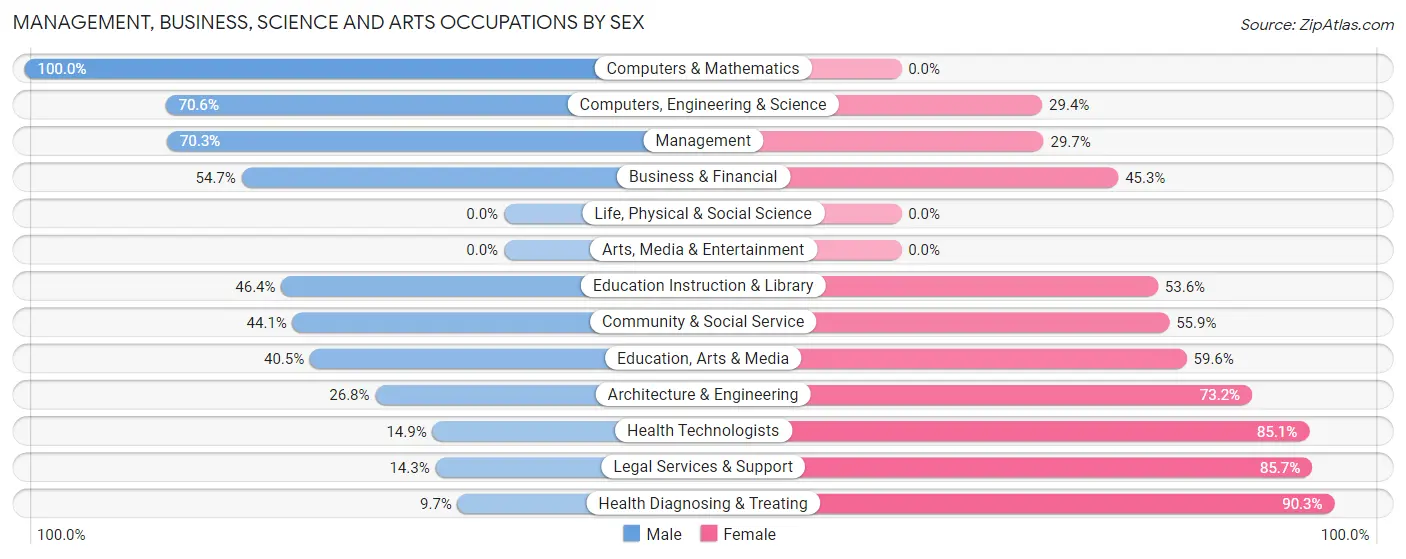
Management, Business, Science and Arts Occupations by Sex
Within the Management, Business, Science and Arts occupations in Lebanon, the most male-oriented occupations are Computers & Mathematics (100.0%), Computers, Engineering & Science (70.6%), and Management (70.3%), while the most female-oriented occupations are Health Diagnosing & Treating (90.3%), Legal Services & Support (85.7%), and Health Technologists (85.1%).
| Occupation | Male | Female |
| Management | 116 (70.3%) | 49 (29.7%) |
| Business & Financial | 110 (54.7%) | 91 (45.3%) |
| Computers, Engineering & Science | 72 (70.6%) | 30 (29.4%) |
| Computers & Mathematics | 61 (100.0%) | 0 (0.0%) |
| Architecture & Engineering | 11 (26.8%) | 30 (73.2%) |
| Life, Physical & Social Science | 0 (0.0%) | 0 (0.0%) |
| Community & Social Service | 395 (44.1%) | 501 (55.9%) |
| Education, Arts & Media | 36 (40.5%) | 53 (59.6%) |
| Legal Services & Support | 7 (14.3%) | 42 (85.7%) |
| Education Instruction & Library | 352 (46.4%) | 406 (53.6%) |
| Arts, Media & Entertainment | 0 (0.0%) | 0 (0.0%) |
| Health Diagnosing & Treating | 34 (9.7%) | 318 (90.3%) |
| Health Technologists | 34 (14.9%) | 194 (85.1%) |
| Total (Category) | 727 (42.4%) | 989 (57.6%) |
| Total (Overall) | 3,910 (57.5%) | 2,889 (42.5%) |
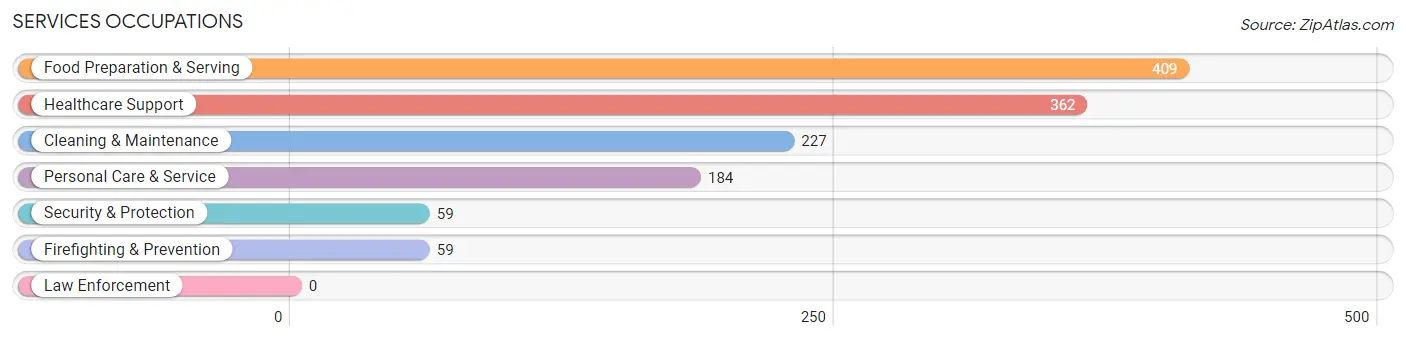
Services Occupations
The most common Services occupations in Lebanon are Food Preparation & Serving (409 | 6.0%), Healthcare Support (362 | 5.3%), Cleaning & Maintenance (227 | 3.3%), Personal Care & Service (184 | 2.7%), and Security & Protection (59 | 0.9%).
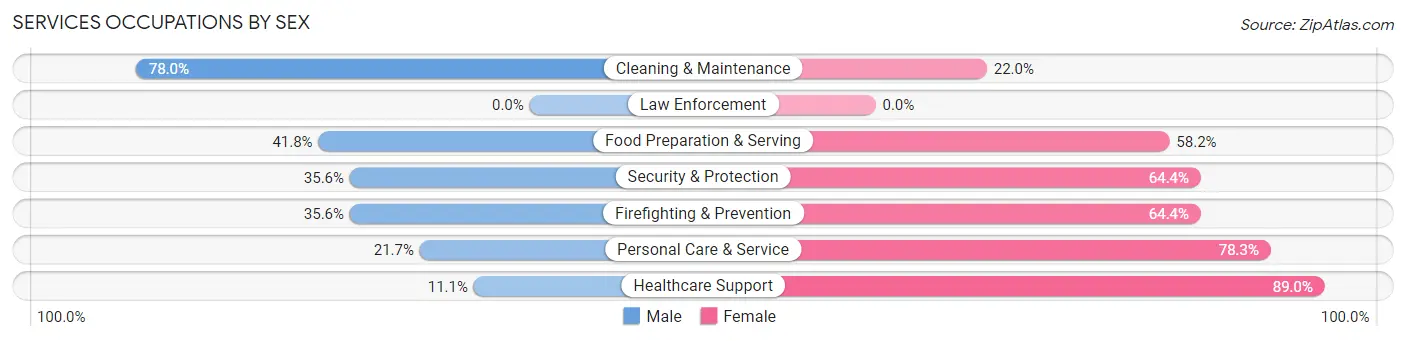
Services Occupations by Sex
Within the Services occupations in Lebanon, the most male-oriented occupations are Cleaning & Maintenance (78.0%), Food Preparation & Serving (41.8%), and Security & Protection (35.6%), while the most female-oriented occupations are Healthcare Support (88.9%), Personal Care & Service (78.3%), and Security & Protection (64.4%).
| Occupation | Male | Female |
| Healthcare Support | 40 (11.1%) | 322 (88.9%) |
| Security & Protection | 21 (35.6%) | 38 (64.4%) |
| Firefighting & Prevention | 21 (35.6%) | 38 (64.4%) |
| Law Enforcement | 0 (0.0%) | 0 (0.0%) |
| Food Preparation & Serving | 171 (41.8%) | 238 (58.2%) |
| Cleaning & Maintenance | 177 (78.0%) | 50 (22.0%) |
| Personal Care & Service | 40 (21.7%) | 144 (78.3%) |
| Total (Category) | 449 (36.2%) | 792 (63.8%) |
| Total (Overall) | 3,910 (57.5%) | 2,889 (42.5%) |
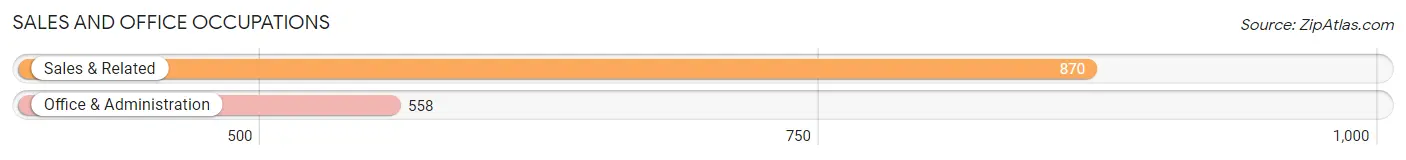
Sales and Office Occupations
The most common Sales and Office occupations in Lebanon are Sales & Related (870 | 12.8%), and Office & Administration (558 | 8.2%).
Sales and Office Occupations by Sex
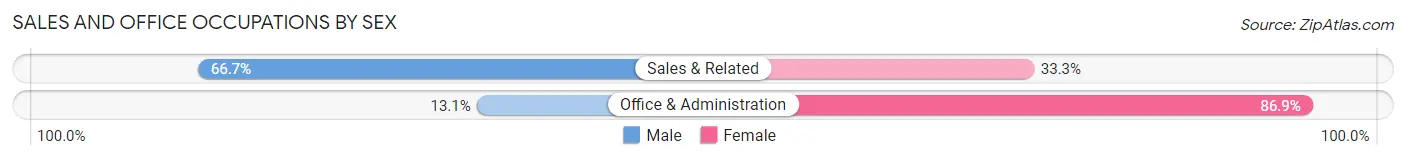
| Occupation | Male | Female |
| Sales & Related | 580 (66.7%) | 290 (33.3%) |
| Office & Administration | 73 (13.1%) | 485 (86.9%) |
| Total (Category) | 653 (45.7%) | 775 (54.3%) |
| Total (Overall) | 3,910 (57.5%) | 2,889 (42.5%) |
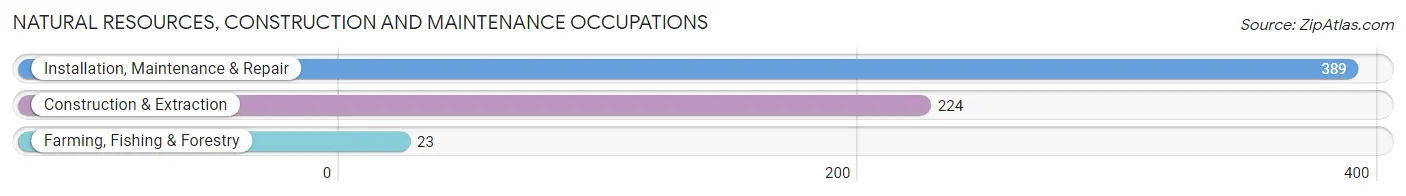
Natural Resources, Construction and Maintenance Occupations
The most common Natural Resources, Construction and Maintenance occupations in Lebanon are Installation, Maintenance & Repair (389 | 5.7%), Construction & Extraction (224 | 3.3%), and Farming, Fishing & Forestry (23 | 0.3%).
Natural Resources, Construction and Maintenance Occupations by Sex
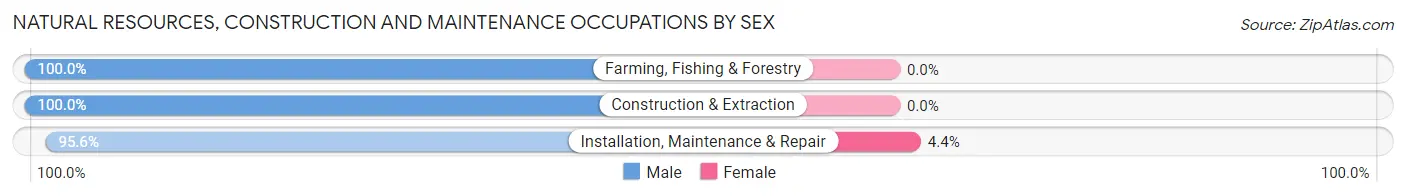
| Occupation | Male | Female |
| Farming, Fishing & Forestry | 23 (100.0%) | 0 (0.0%) |
| Construction & Extraction | 224 (100.0%) | 0 (0.0%) |
| Installation, Maintenance & Repair | 372 (95.6%) | 17 (4.4%) |
| Total (Category) | 619 (97.3%) | 17 (2.7%) |
| Total (Overall) | 3,910 (57.5%) | 2,889 (42.5%) |
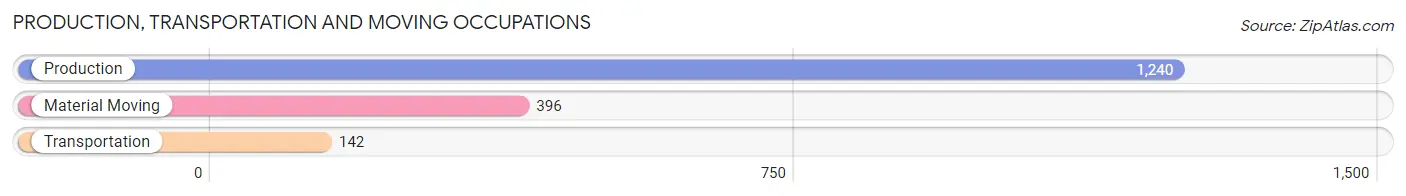
Production, Transportation and Moving Occupations
The most common Production, Transportation and Moving occupations in Lebanon are Production (1,240 | 18.2%), Material Moving (396 | 5.8%), and Transportation (142 | 2.1%).
Production, Transportation and Moving Occupations by Sex
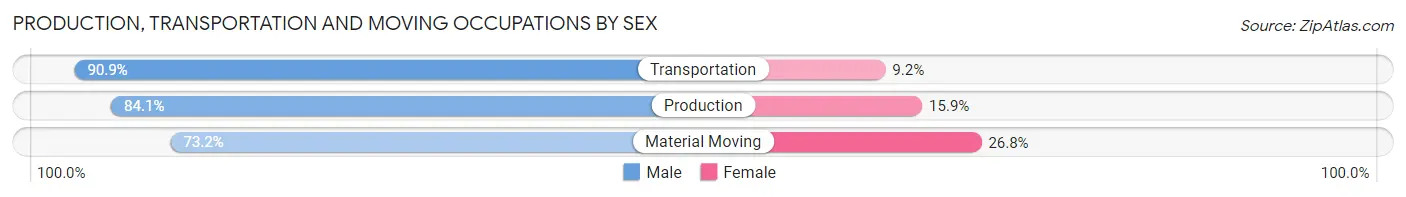
| Occupation | Male | Female |
| Production | 1,043 (84.1%) | 197 (15.9%) |
| Transportation | 129 (90.8%) | 13 (9.1%) |
| Material Moving | 290 (73.2%) | 106 (26.8%) |
| Total (Category) | 1,462 (82.2%) | 316 (17.8%) |
| Total (Overall) | 3,910 (57.5%) | 2,889 (42.5%) |
Employment Industries by Sex in Lebanon
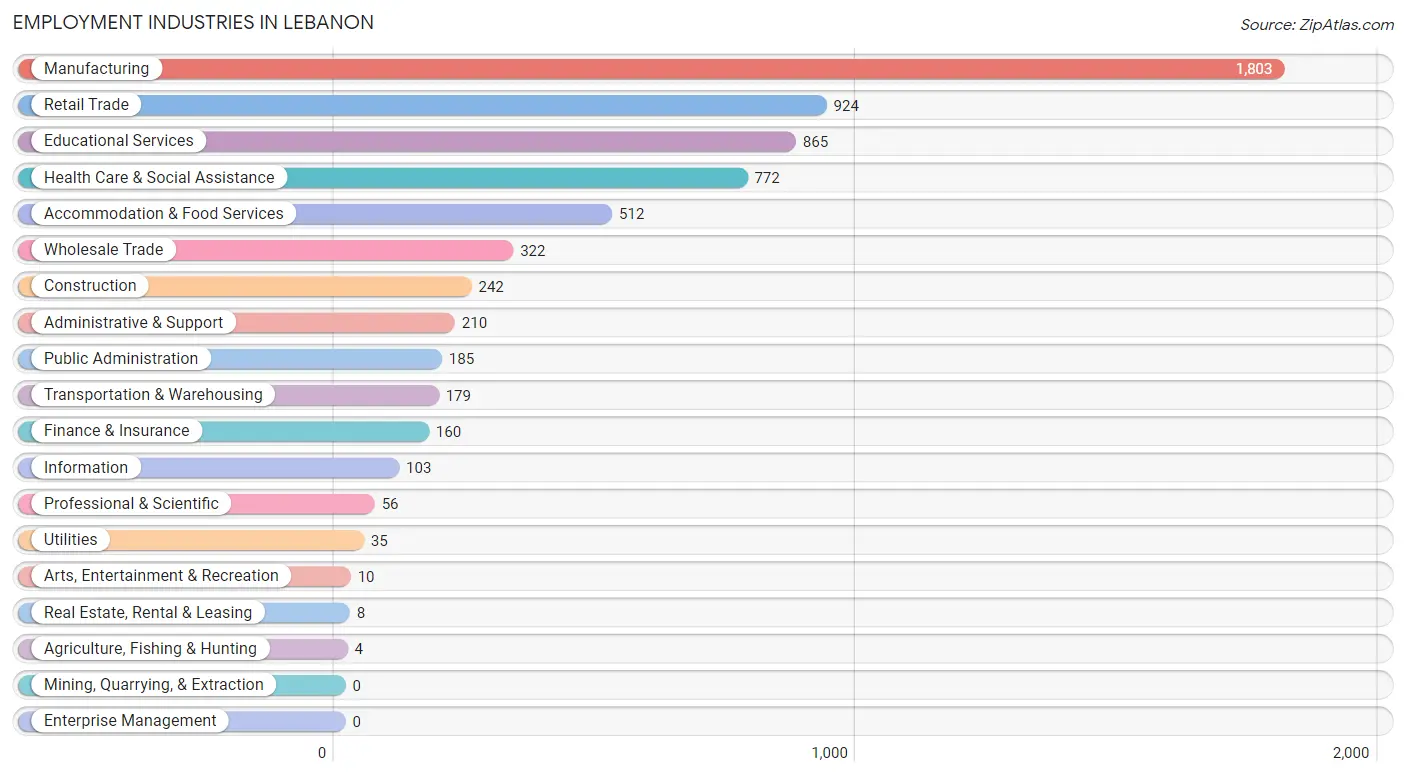
Employment Industries in Lebanon
The major employment industries in Lebanon include Manufacturing (1,803 | 26.5%), Retail Trade (924 | 13.6%), Educational Services (865 | 12.7%), Health Care & Social Assistance (772 | 11.4%), and Accommodation & Food Services (512 | 7.5%).
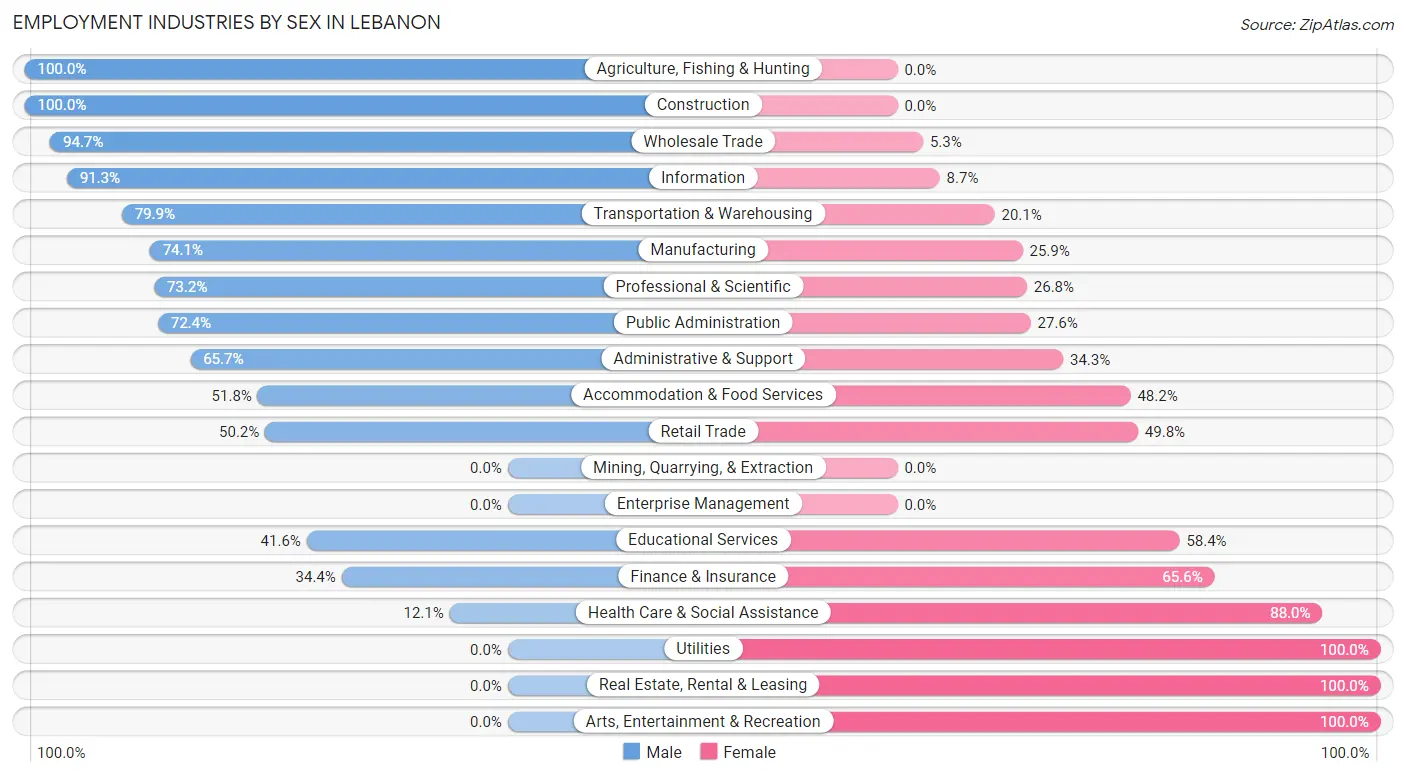
Employment Industries by Sex in Lebanon
The Lebanon industries that see more men than women are Agriculture, Fishing & Hunting (100.0%), Construction (100.0%), and Wholesale Trade (94.7%), whereas the industries that tend to have a higher number of women are Utilities (100.0%), Real Estate, Rental & Leasing (100.0%), and Arts, Entertainment & Recreation (100.0%).
| Industry | Male | Female |
| Agriculture, Fishing & Hunting | 4 (100.0%) | 0 (0.0%) |
| Mining, Quarrying, & Extraction | 0 (0.0%) | 0 (0.0%) |
| Construction | 242 (100.0%) | 0 (0.0%) |
| Manufacturing | 1,336 (74.1%) | 467 (25.9%) |
| Wholesale Trade | 305 (94.7%) | 17 (5.3%) |
| Retail Trade | 464 (50.2%) | 460 (49.8%) |
| Transportation & Warehousing | 143 (79.9%) | 36 (20.1%) |
| Utilities | 0 (0.0%) | 35 (100.0%) |
| Information | 94 (91.3%) | 9 (8.7%) |
| Finance & Insurance | 55 (34.4%) | 105 (65.6%) |
| Real Estate, Rental & Leasing | 0 (0.0%) | 8 (100.0%) |
| Professional & Scientific | 41 (73.2%) | 15 (26.8%) |
| Enterprise Management | 0 (0.0%) | 0 (0.0%) |
| Administrative & Support | 138 (65.7%) | 72 (34.3%) |
| Educational Services | 360 (41.6%) | 505 (58.4%) |
| Health Care & Social Assistance | 93 (12.0%) | 679 (87.9%) |
| Arts, Entertainment & Recreation | 0 (0.0%) | 10 (100.0%) |
| Accommodation & Food Services | 265 (51.8%) | 247 (48.2%) |
| Public Administration | 134 (72.4%) | 51 (27.6%) |
| Total | 3,910 (57.5%) | 2,889 (42.5%) |
Education in Lebanon
School Enrollment in Lebanon
The most common levels of schooling among the 3,438 students in Lebanon are middle school (1,066 | 31.0%), high school (838 | 24.4%), and elementary school (570 | 16.6%).
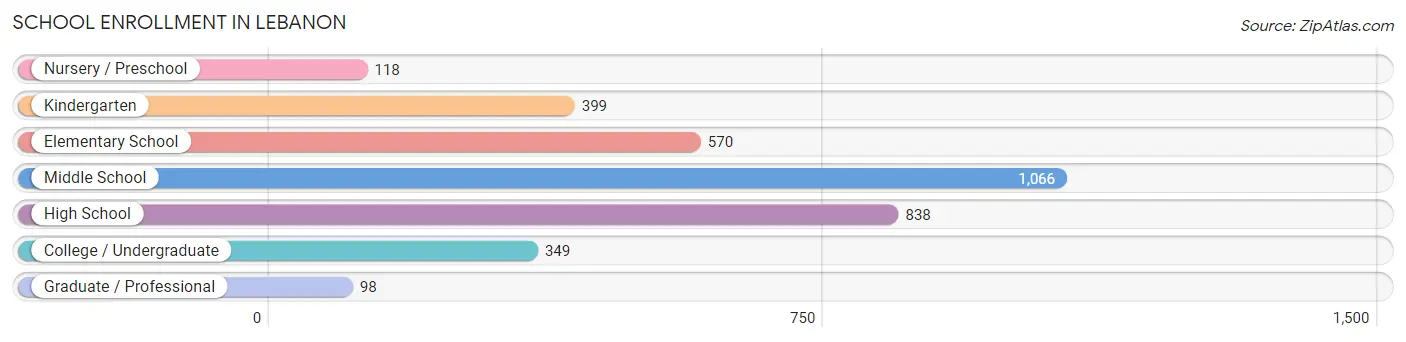
| School Level | # Students | % Students |
| Nursery / Preschool | 118 | 3.4% |
| Kindergarten | 399 | 11.6% |
| Elementary School | 570 | 16.6% |
| Middle School | 1,066 | 31.0% |
| High School | 838 | 24.4% |
| College / Undergraduate | 349 | 10.2% |
| Graduate / Professional | 98 | 2.9% |
| Total | 3,438 | 100.0% |
School Enrollment by Age by Funding Source in Lebanon
Out of a total of 3,438 students who are enrolled in schools in Lebanon, 199 (5.8%) attend a private institution, while the remaining 3,239 (94.2%) are enrolled in public schools. The age group of 25 to 34 year olds has the highest likelihood of being enrolled in private schools, with 39 (24.2% in the age bracket) enrolled. Conversely, the age group of 18 to 19 year olds has the lowest likelihood of being enrolled in a private school, with 120 (100.0% in the age bracket) attending a public institution.
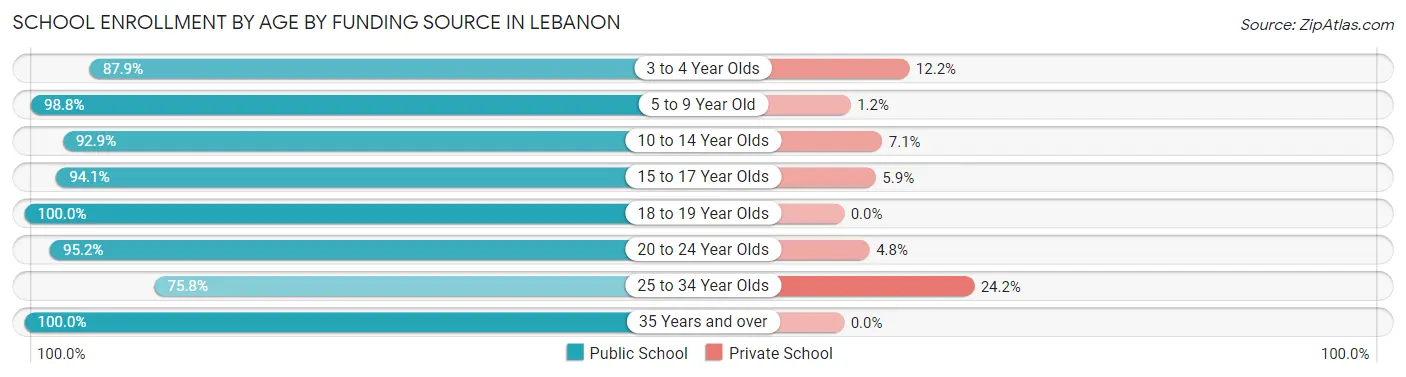
| Age Bracket | Public School | Private School |
| 3 to 4 Year Olds | 94 (87.8%) | 13 (12.1%) |
| 5 to 9 Year Old | 893 (98.8%) | 11 (1.2%) |
| 10 to 14 Year Olds | 1,071 (92.9%) | 82 (7.1%) |
| 15 to 17 Year Olds | 684 (94.1%) | 43 (5.9%) |
| 18 to 19 Year Olds | 120 (100.0%) | 0 (0.0%) |
| 20 to 24 Year Olds | 200 (95.2%) | 10 (4.8%) |
| 25 to 34 Year Olds | 122 (75.8%) | 39 (24.2%) |
| 35 Years and over | 56 (100.0%) | 0 (0.0%) |
| Total | 3,239 (94.2%) | 199 (5.8%) |
Educational Attainment by Field of Study in Lebanon
Business (552 | 30.7%), education (395 | 22.0%), computers & mathematics (203 | 11.3%), arts & humanities (178 | 9.9%), and bio, nature & agricultural (127 | 7.1%) are the most common fields of study among 1,796 individuals in Lebanon who have obtained a bachelor's degree or higher.
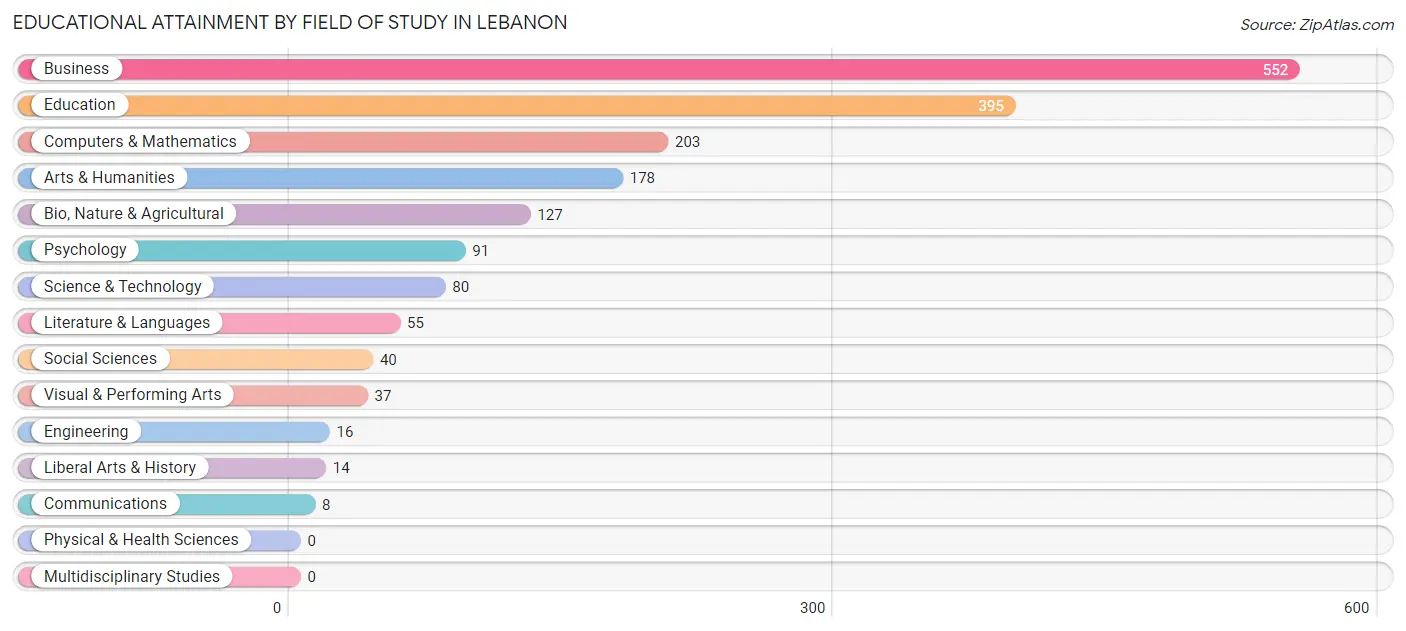
| Field of Study | # Graduates | % Graduates |
| Computers & Mathematics | 203 | 11.3% |
| Bio, Nature & Agricultural | 127 | 7.1% |
| Physical & Health Sciences | 0 | 0.0% |
| Psychology | 91 | 5.1% |
| Social Sciences | 40 | 2.2% |
| Engineering | 16 | 0.9% |
| Multidisciplinary Studies | 0 | 0.0% |
| Science & Technology | 80 | 4.4% |
| Business | 552 | 30.7% |
| Education | 395 | 22.0% |
| Literature & Languages | 55 | 3.1% |
| Liberal Arts & History | 14 | 0.8% |
| Visual & Performing Arts | 37 | 2.1% |
| Communications | 8 | 0.4% |
| Arts & Humanities | 178 | 9.9% |
| Total | 1,796 | 100.0% |
Transportation & Commute in Lebanon
Vehicle Availability by Sex in Lebanon
The most prevalent vehicle ownership categories in Lebanon are males with 2 vehicles (1,980, accounting for 51.0%) and females with 2 vehicles (1,157, making up 69.3%).
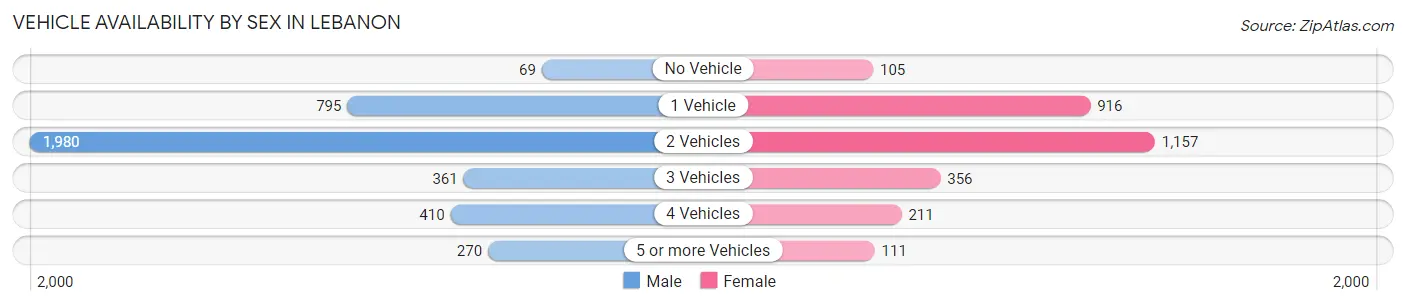
| Vehicles Available | Male | Female |
| No Vehicle | 69 (1.8%) | 105 (3.7%) |
| 1 Vehicle | 795 (20.5%) | 916 (32.1%) |
| 2 Vehicles | 1,980 (51.0%) | 1,157 (40.5%) |
| 3 Vehicles | 361 (9.3%) | 356 (12.5%) |
| 4 Vehicles | 410 (10.5%) | 211 (7.4%) |
| 5 or more Vehicles | 270 (7.0%) | 111 (3.9%) |
| Total | 3,885 (100.0%) | 2,856 (100.0%) |
Commute Time in Lebanon
The most frequently occuring commute durations in Lebanon are 10 to 14 minutes (1,797 commuters, 27.4%), 5 to 9 minutes (1,595 commuters, 24.3%), and 15 to 19 minutes (1,276 commuters, 19.5%).
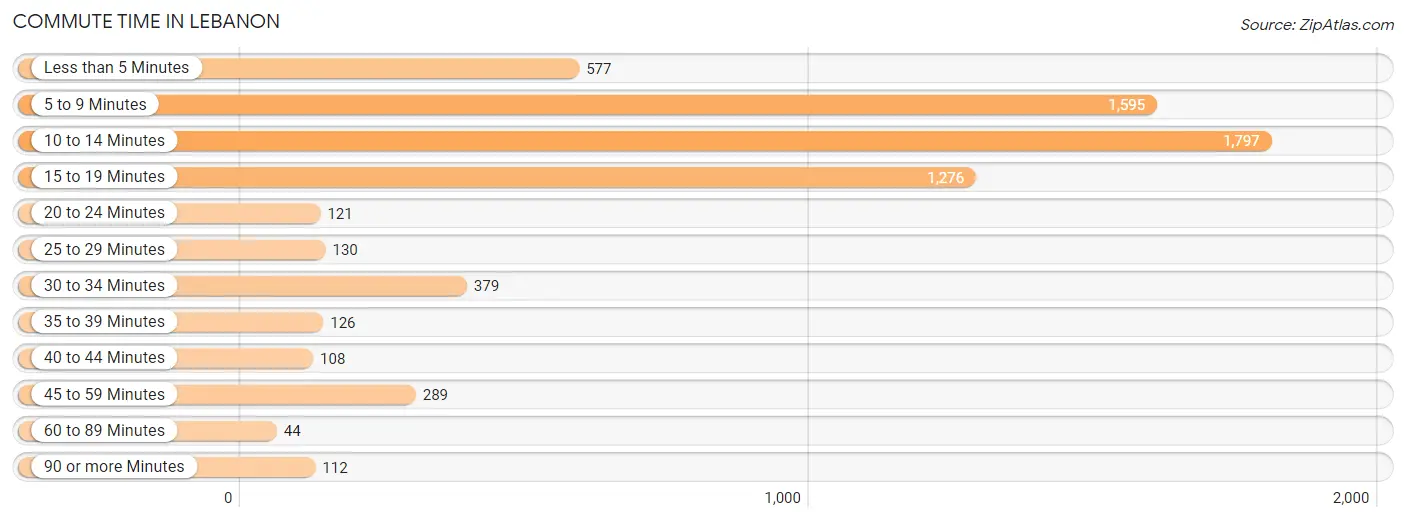
| Commute Time | # Commuters | % Commuters |
| Less than 5 Minutes | 577 | 8.8% |
| 5 to 9 Minutes | 1,595 | 24.3% |
| 10 to 14 Minutes | 1,797 | 27.4% |
| 15 to 19 Minutes | 1,276 | 19.5% |
| 20 to 24 Minutes | 121 | 1.8% |
| 25 to 29 Minutes | 130 | 2.0% |
| 30 to 34 Minutes | 379 | 5.8% |
| 35 to 39 Minutes | 126 | 1.9% |
| 40 to 44 Minutes | 108 | 1.7% |
| 45 to 59 Minutes | 289 | 4.4% |
| 60 to 89 Minutes | 44 | 0.7% |
| 90 or more Minutes | 112 | 1.7% |
Commute Time by Sex in Lebanon
The most common commute times in Lebanon are 10 to 14 minutes (989 commuters, 25.7%) for males and 10 to 14 minutes (808 commuters, 29.8%) for females.
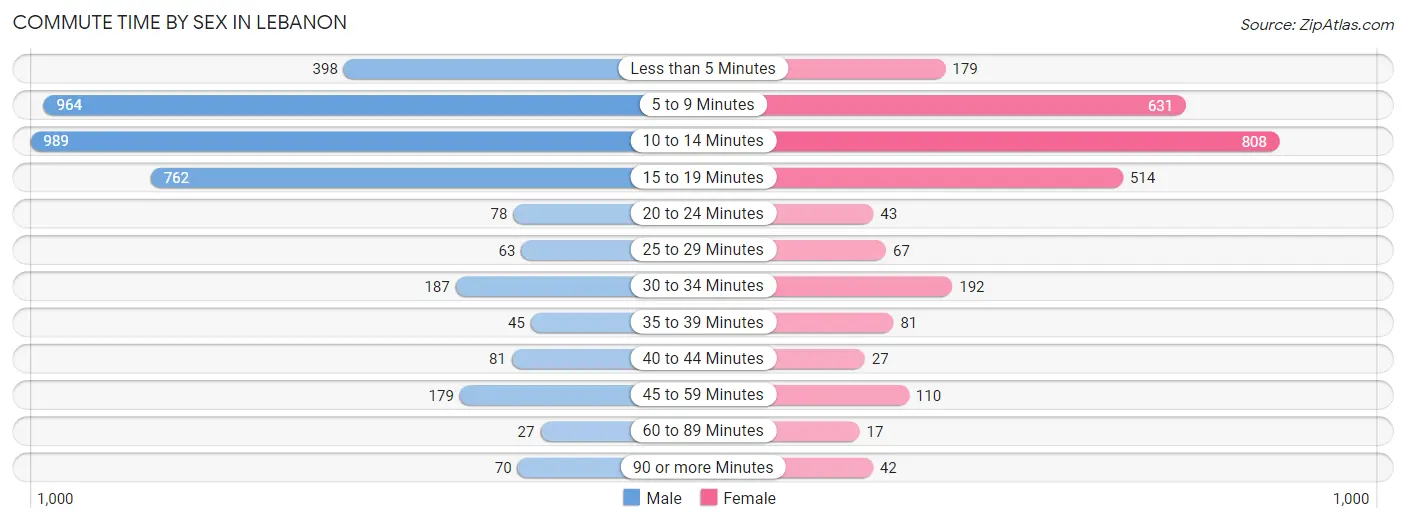
| Commute Time | Male | Female |
| Less than 5 Minutes | 398 (10.4%) | 179 (6.6%) |
| 5 to 9 Minutes | 964 (25.1%) | 631 (23.3%) |
| 10 to 14 Minutes | 989 (25.7%) | 808 (29.8%) |
| 15 to 19 Minutes | 762 (19.8%) | 514 (19.0%) |
| 20 to 24 Minutes | 78 (2.0%) | 43 (1.6%) |
| 25 to 29 Minutes | 63 (1.6%) | 67 (2.5%) |
| 30 to 34 Minutes | 187 (4.9%) | 192 (7.1%) |
| 35 to 39 Minutes | 45 (1.2%) | 81 (3.0%) |
| 40 to 44 Minutes | 81 (2.1%) | 27 (1.0%) |
| 45 to 59 Minutes | 179 (4.7%) | 110 (4.1%) |
| 60 to 89 Minutes | 27 (0.7%) | 17 (0.6%) |
| 90 or more Minutes | 70 (1.8%) | 42 (1.5%) |
Time of Departure to Work by Sex in Lebanon
The most frequent times of departure to work in Lebanon are 5:30 AM to 5:59 AM (755, 19.7%) for males and 7:00 AM to 7:29 AM (440, 16.2%) for females.
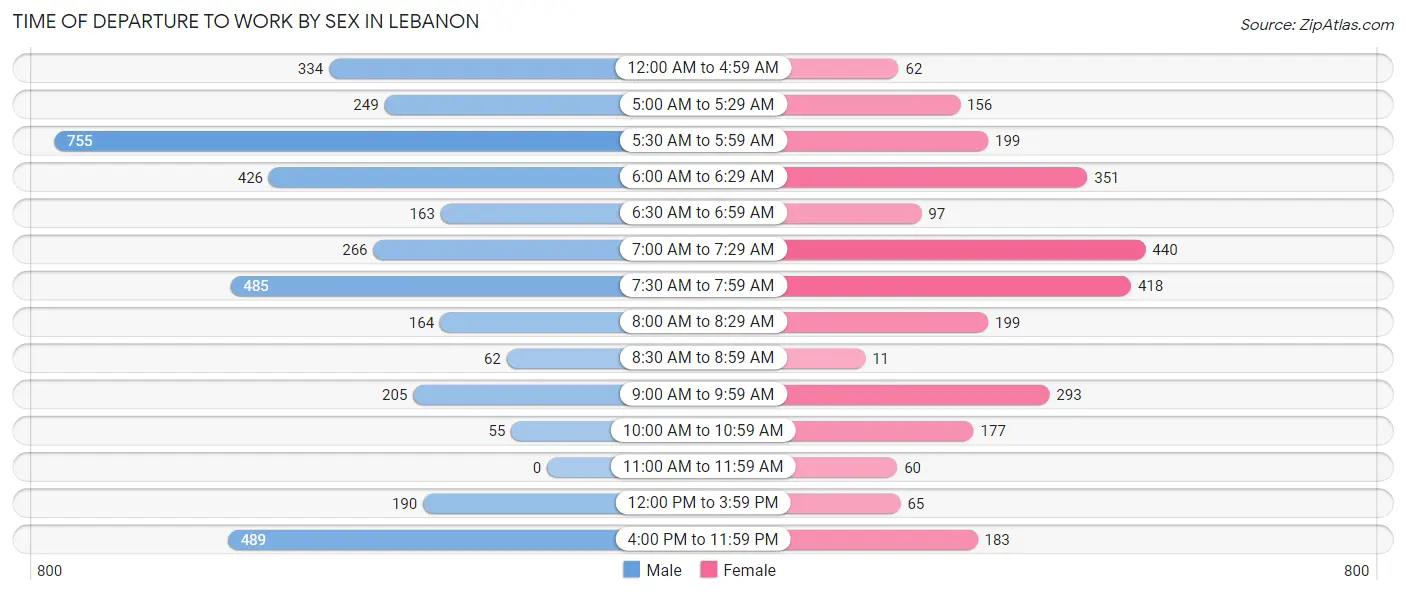
| Time of Departure | Male | Female |
| 12:00 AM to 4:59 AM | 334 (8.7%) | 62 (2.3%) |
| 5:00 AM to 5:29 AM | 249 (6.5%) | 156 (5.8%) |
| 5:30 AM to 5:59 AM | 755 (19.7%) | 199 (7.3%) |
| 6:00 AM to 6:29 AM | 426 (11.1%) | 351 (13.0%) |
| 6:30 AM to 6:59 AM | 163 (4.2%) | 97 (3.6%) |
| 7:00 AM to 7:29 AM | 266 (6.9%) | 440 (16.2%) |
| 7:30 AM to 7:59 AM | 485 (12.6%) | 418 (15.4%) |
| 8:00 AM to 8:29 AM | 164 (4.3%) | 199 (7.3%) |
| 8:30 AM to 8:59 AM | 62 (1.6%) | 11 (0.4%) |
| 9:00 AM to 9:59 AM | 205 (5.3%) | 293 (10.8%) |
| 10:00 AM to 10:59 AM | 55 (1.4%) | 177 (6.5%) |
| 11:00 AM to 11:59 AM | 0 (0.0%) | 60 (2.2%) |
| 12:00 PM to 3:59 PM | 190 (4.9%) | 65 (2.4%) |
| 4:00 PM to 11:59 PM | 489 (12.7%) | 183 (6.8%) |
| Total | 3,843 (100.0%) | 2,711 (100.0%) |
Housing Occupancy in Lebanon
Occupancy by Ownership in Lebanon
Of the total 6,114 dwellings in Lebanon, owner-occupied units account for 3,207 (52.4%), while renter-occupied units make up 2,907 (47.5%).
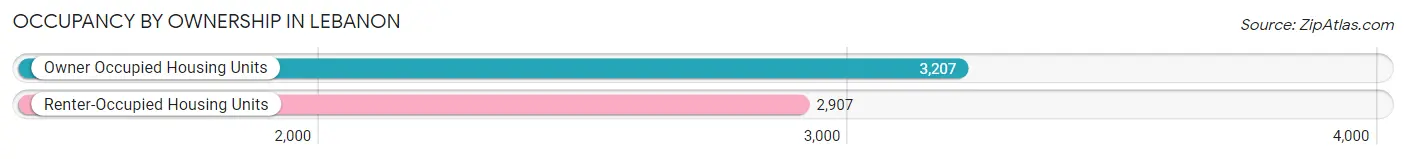
| Occupancy | # Housing Units | % Housing Units |
| Owner Occupied Housing Units | 3,207 | 52.4% |
| Renter-Occupied Housing Units | 2,907 | 47.5% |
| Total Occupied Housing Units | 6,114 | 100.0% |
Occupancy by Household Size in Lebanon
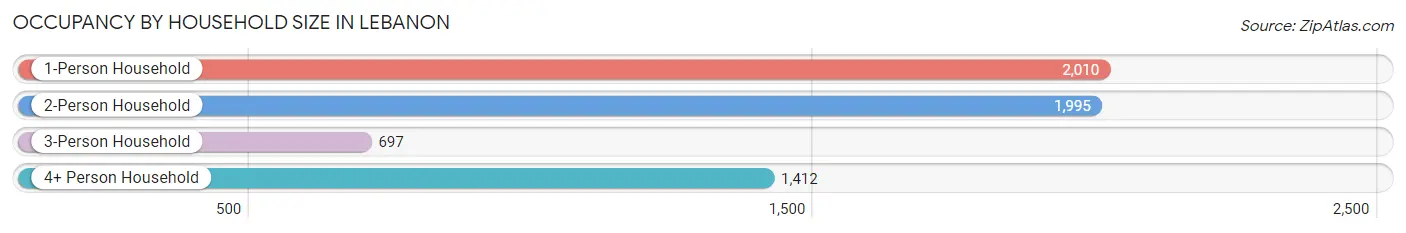
| Household Size | # Housing Units | % Housing Units |
| 1-Person Household | 2,010 | 32.9% |
| 2-Person Household | 1,995 | 32.6% |
| 3-Person Household | 697 | 11.4% |
| 4+ Person Household | 1,412 | 23.1% |
| Total Housing Units | 6,114 | 100.0% |
Occupancy by Ownership by Household Size in Lebanon
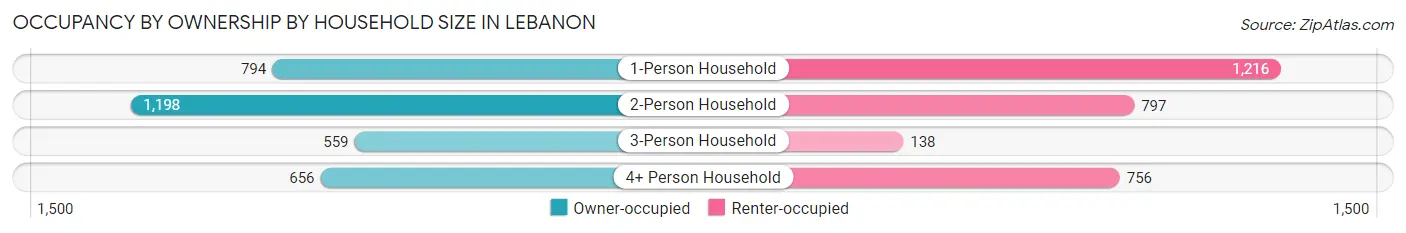
| Household Size | Owner-occupied | Renter-occupied |
| 1-Person Household | 794 (39.5%) | 1,216 (60.5%) |
| 2-Person Household | 1,198 (60.1%) | 797 (40.0%) |
| 3-Person Household | 559 (80.2%) | 138 (19.8%) |
| 4+ Person Household | 656 (46.5%) | 756 (53.5%) |
| Total Housing Units | 3,207 (52.4%) | 2,907 (47.5%) |
Occupancy by Educational Attainment in Lebanon
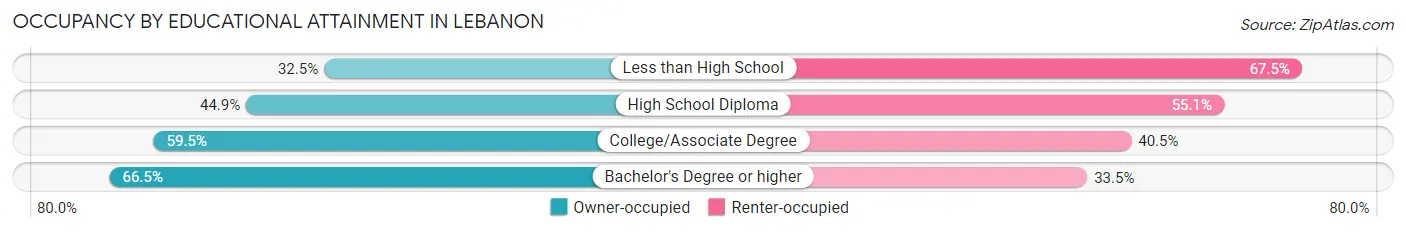
| Household Size | Owner-occupied | Renter-occupied |
| Less than High School | 249 (32.5%) | 517 (67.5%) |
| High School Diploma | 929 (44.9%) | 1,141 (55.1%) |
| College/Associate Degree | 1,290 (59.5%) | 877 (40.5%) |
| Bachelor's Degree or higher | 739 (66.5%) | 372 (33.5%) |
Occupancy by Age of Householder in Lebanon
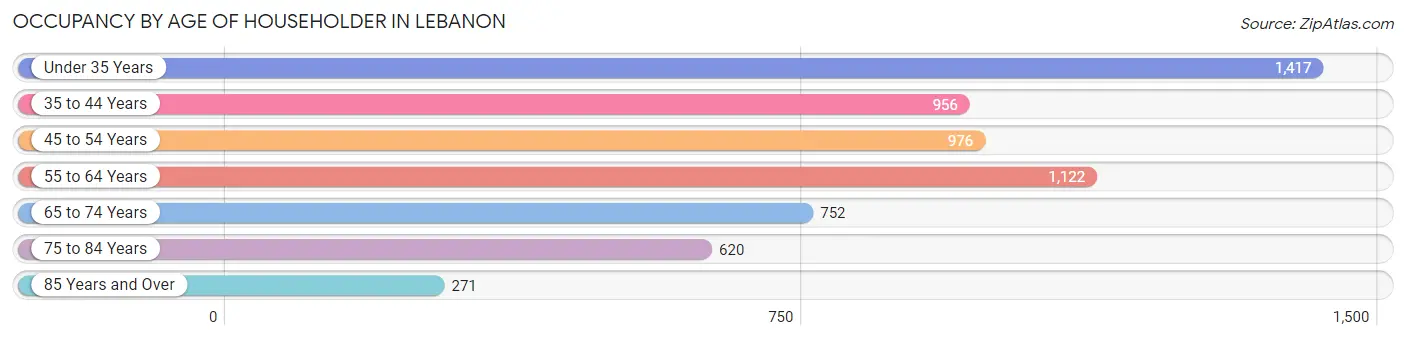
| Age Bracket | # Households | % Households |
| Under 35 Years | 1,417 | 23.2% |
| 35 to 44 Years | 956 | 15.6% |
| 45 to 54 Years | 976 | 16.0% |
| 55 to 64 Years | 1,122 | 18.3% |
| 65 to 74 Years | 752 | 12.3% |
| 75 to 84 Years | 620 | 10.1% |
| 85 Years and Over | 271 | 4.4% |
| Total | 6,114 | 100.0% |
Housing Finances in Lebanon
Median Income by Occupancy in Lebanon
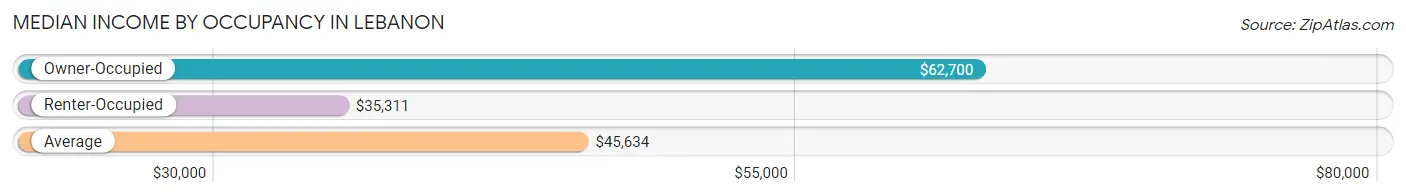
| Occupancy Type | # Households | Median Income |
| Owner-Occupied | 3,207 (52.4%) | $62,700 |
| Renter-Occupied | 2,907 (47.5%) | $35,311 |
| Average | 6,114 (100.0%) | $45,634 |
Occupancy by Householder Income Bracket in Lebanon
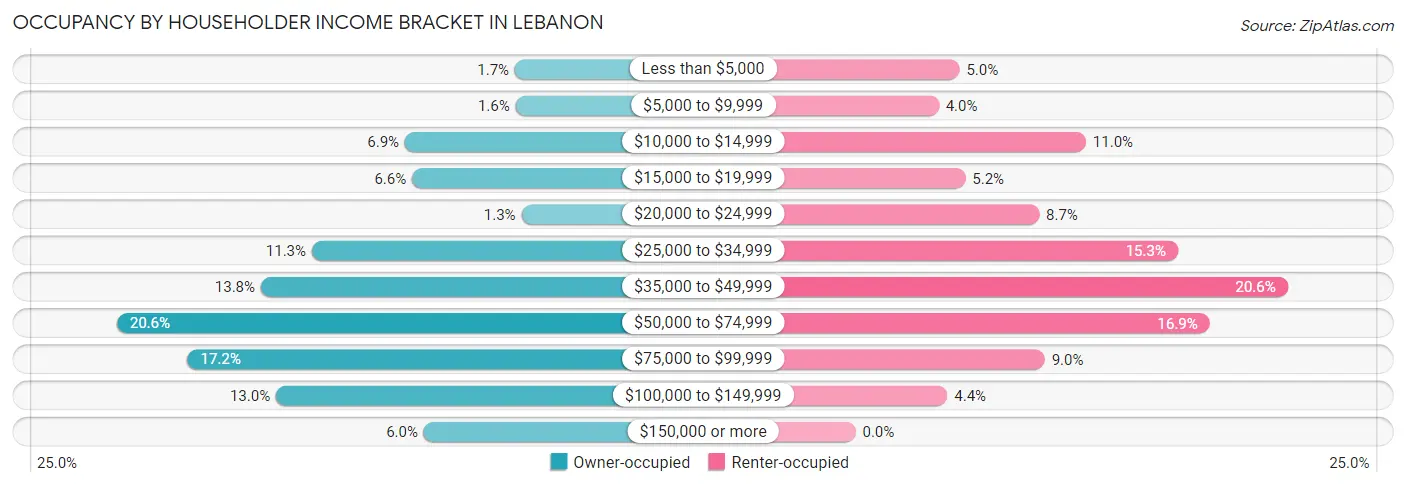
| Income Bracket | Owner-occupied | Renter-occupied |
| Less than $5,000 | 53 (1.7%) | 144 (5.0%) |
| $5,000 to $9,999 | 52 (1.6%) | 115 (4.0%) |
| $10,000 to $14,999 | 221 (6.9%) | 319 (11.0%) |
| $15,000 to $19,999 | 210 (6.6%) | 152 (5.2%) |
| $20,000 to $24,999 | 43 (1.3%) | 254 (8.7%) |
| $25,000 to $34,999 | 363 (11.3%) | 446 (15.3%) |
| $35,000 to $49,999 | 441 (13.8%) | 598 (20.6%) |
| $50,000 to $74,999 | 661 (20.6%) | 490 (16.9%) |
| $75,000 to $99,999 | 553 (17.2%) | 262 (9.0%) |
| $100,000 to $149,999 | 418 (13.0%) | 127 (4.4%) |
| $150,000 or more | 192 (6.0%) | 0 (0.0%) |
| Total | 3,207 (100.0%) | 2,907 (100.0%) |
Monthly Housing Cost Tiers in Lebanon
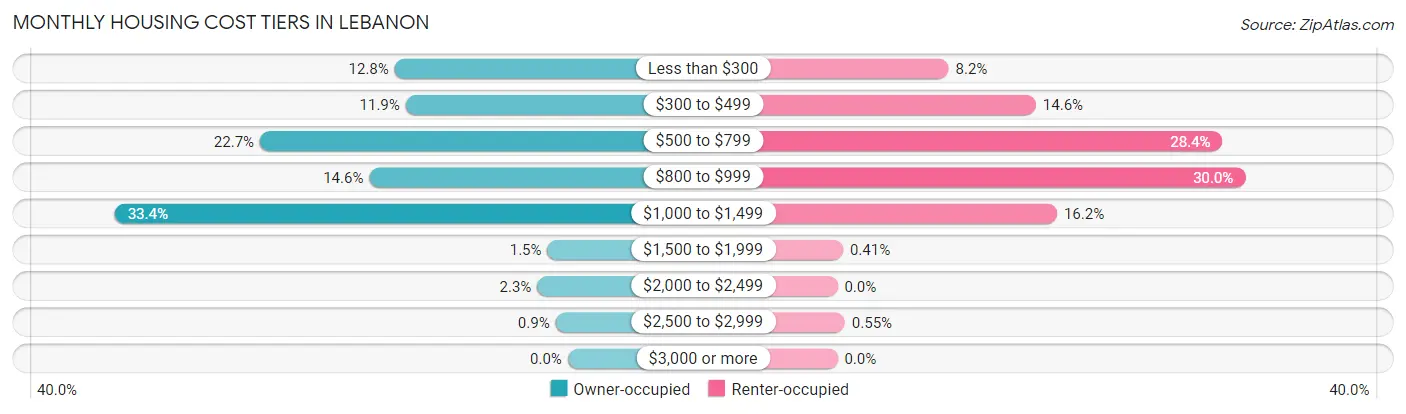
| Monthly Cost | Owner-occupied | Renter-occupied |
| Less than $300 | 409 (12.8%) | 238 (8.2%) |
| $300 to $499 | 383 (11.9%) | 425 (14.6%) |
| $500 to $799 | 727 (22.7%) | 824 (28.3%) |
| $800 to $999 | 469 (14.6%) | 873 (30.0%) |
| $1,000 to $1,499 | 1,070 (33.4%) | 470 (16.2%) |
| $1,500 to $1,999 | 48 (1.5%) | 12 (0.4%) |
| $2,000 to $2,499 | 72 (2.2%) | 0 (0.0%) |
| $2,500 to $2,999 | 29 (0.9%) | 16 (0.5%) |
| $3,000 or more | 0 (0.0%) | 0 (0.0%) |
| Total | 3,207 (100.0%) | 2,907 (100.0%) |
Physical Housing Characteristics in Lebanon
Housing Structures in Lebanon
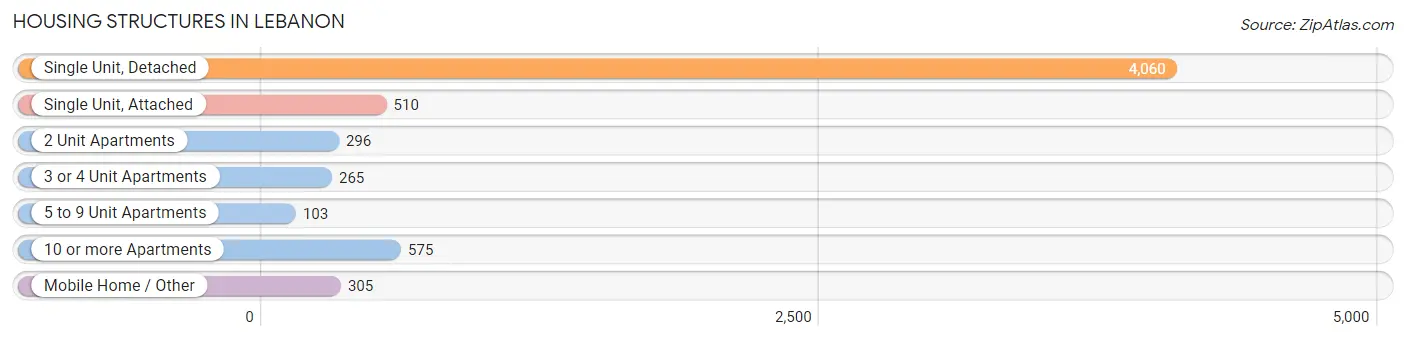
| Structure Type | # Housing Units | % Housing Units |
| Single Unit, Detached | 4,060 | 66.4% |
| Single Unit, Attached | 510 | 8.3% |
| 2 Unit Apartments | 296 | 4.8% |
| 3 or 4 Unit Apartments | 265 | 4.3% |
| 5 to 9 Unit Apartments | 103 | 1.7% |
| 10 or more Apartments | 575 | 9.4% |
| Mobile Home / Other | 305 | 5.0% |
| Total | 6,114 | 100.0% |
Housing Structures by Occupancy in Lebanon
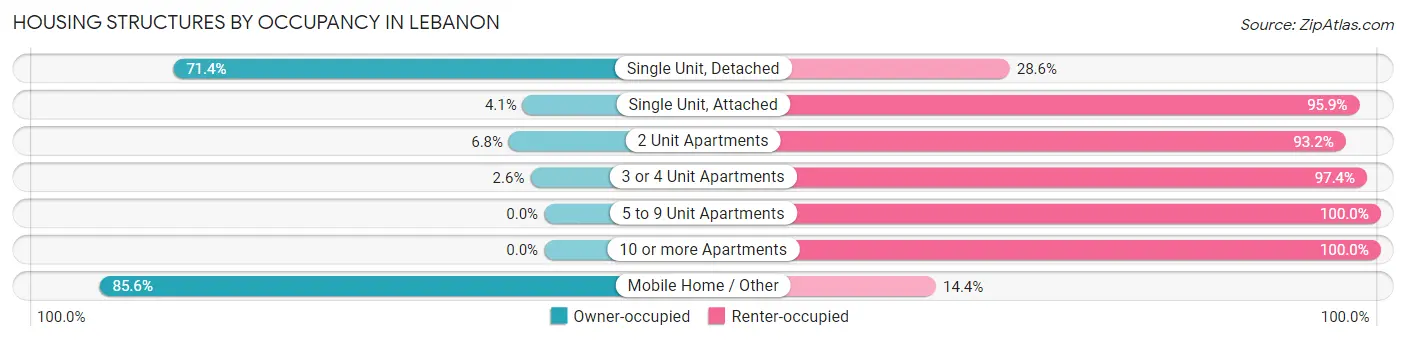
| Structure Type | Owner-occupied | Renter-occupied |
| Single Unit, Detached | 2,898 (71.4%) | 1,162 (28.6%) |
| Single Unit, Attached | 21 (4.1%) | 489 (95.9%) |
| 2 Unit Apartments | 20 (6.8%) | 276 (93.2%) |
| 3 or 4 Unit Apartments | 7 (2.6%) | 258 (97.4%) |
| 5 to 9 Unit Apartments | 0 (0.0%) | 103 (100.0%) |
| 10 or more Apartments | 0 (0.0%) | 575 (100.0%) |
| Mobile Home / Other | 261 (85.6%) | 44 (14.4%) |
| Total | 3,207 (52.4%) | 2,907 (47.5%) |
Housing Structures by Number of Rooms in Lebanon
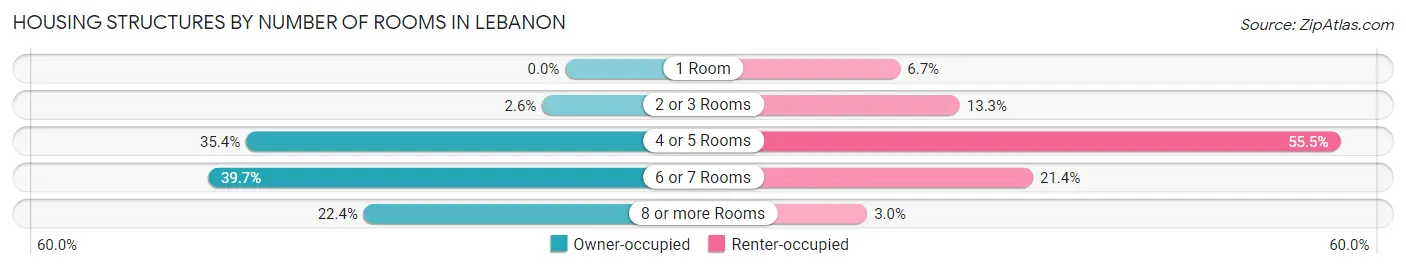
| Number of Rooms | Owner-occupied | Renter-occupied |
| 1 Room | 0 (0.0%) | 195 (6.7%) |
| 2 or 3 Rooms | 82 (2.6%) | 387 (13.3%) |
| 4 or 5 Rooms | 1,136 (35.4%) | 1,614 (55.5%) |
| 6 or 7 Rooms | 1,272 (39.7%) | 623 (21.4%) |
| 8 or more Rooms | 717 (22.4%) | 88 (3.0%) |
| Total | 3,207 (100.0%) | 2,907 (100.0%) |
Housing Structure by Heating Type in Lebanon
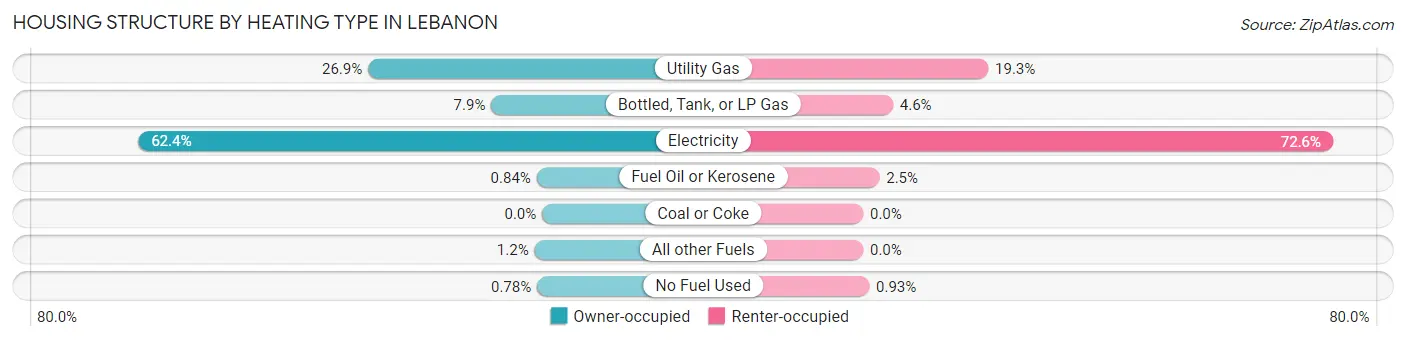
| Heating Type | Owner-occupied | Renter-occupied |
| Utility Gas | 863 (26.9%) | 562 (19.3%) |
| Bottled, Tank, or LP Gas | 252 (7.9%) | 134 (4.6%) |
| Electricity | 2,002 (62.4%) | 2,111 (72.6%) |
| Fuel Oil or Kerosene | 27 (0.8%) | 73 (2.5%) |
| Coal or Coke | 0 (0.0%) | 0 (0.0%) |
| All other Fuels | 38 (1.2%) | 0 (0.0%) |
| No Fuel Used | 25 (0.8%) | 27 (0.9%) |
| Total | 3,207 (100.0%) | 2,907 (100.0%) |
Household Vehicle Usage in Lebanon
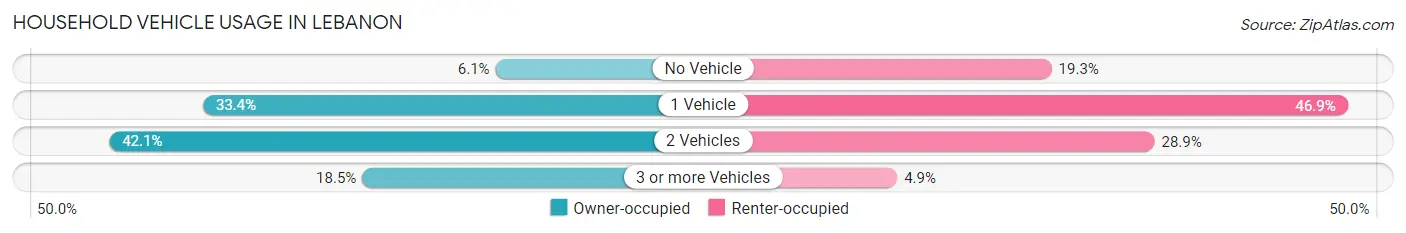
| Vehicles per Household | Owner-occupied | Renter-occupied |
| No Vehicle | 194 (6.0%) | 561 (19.3%) |
| 1 Vehicle | 1,070 (33.4%) | 1,364 (46.9%) |
| 2 Vehicles | 1,350 (42.1%) | 840 (28.9%) |
| 3 or more Vehicles | 593 (18.5%) | 142 (4.9%) |
| Total | 3,207 (100.0%) | 2,907 (100.0%) |
Real Estate & Mortgages in Lebanon
Real Estate and Mortgage Overview in Lebanon
| Characteristic | Without Mortgage | With Mortgage |
| Housing Units | 1,262 | 1,945 |
| Median Property Value | $117,000 | $150,100 |
| Median Household Income | $48,179 | $136 |
| Monthly Housing Costs | $429 | $0 |
| Real Estate Taxes | $958 | $52 |
Property Value by Mortgage Status in Lebanon
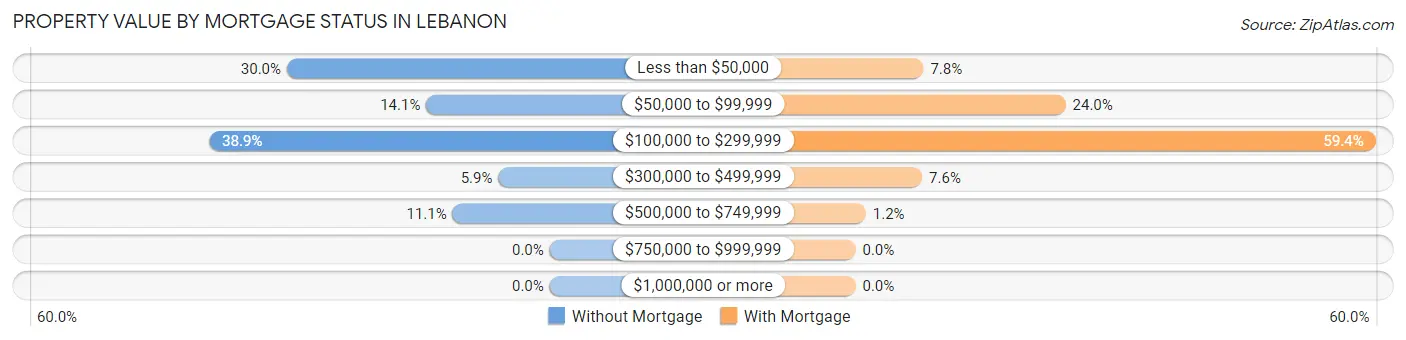
| Property Value | Without Mortgage | With Mortgage |
| Less than $50,000 | 379 (30.0%) | 151 (7.8%) |
| $50,000 to $99,999 | 178 (14.1%) | 467 (24.0%) |
| $100,000 to $299,999 | 491 (38.9%) | 1,156 (59.4%) |
| $300,000 to $499,999 | 74 (5.9%) | 148 (7.6%) |
| $500,000 to $749,999 | 140 (11.1%) | 23 (1.2%) |
| $750,000 to $999,999 | 0 (0.0%) | 0 (0.0%) |
| $1,000,000 or more | 0 (0.0%) | 0 (0.0%) |
| Total | 1,262 (100.0%) | 1,945 (100.0%) |
Household Income by Mortgage Status in Lebanon
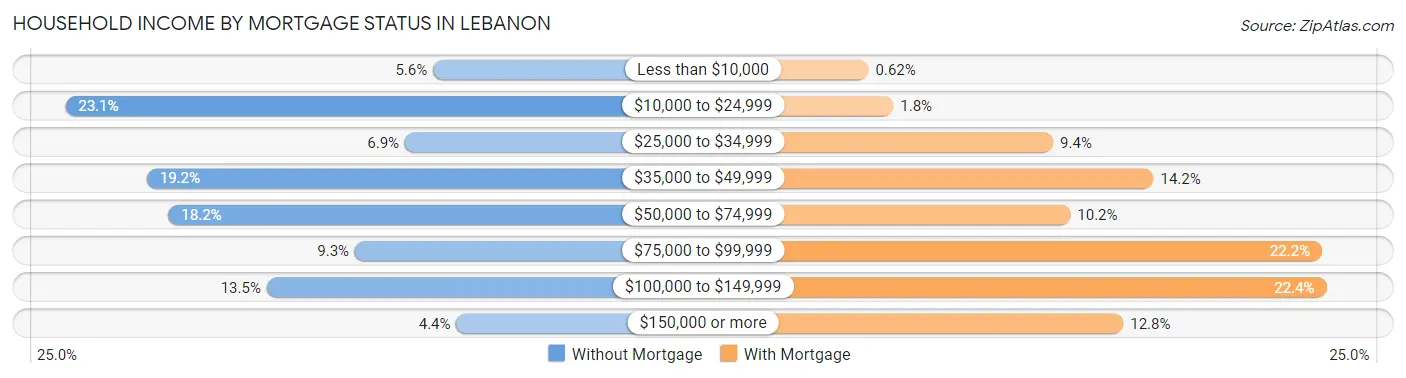
| Household Income | Without Mortgage | With Mortgage |
| Less than $10,000 | 70 (5.6%) | 12 (0.6%) |
| $10,000 to $24,999 | 291 (23.1%) | 35 (1.8%) |
| $25,000 to $34,999 | 87 (6.9%) | 183 (9.4%) |
| $35,000 to $49,999 | 242 (19.2%) | 276 (14.2%) |
| $50,000 to $74,999 | 229 (18.1%) | 199 (10.2%) |
| $75,000 to $99,999 | 117 (9.3%) | 432 (22.2%) |
| $100,000 to $149,999 | 170 (13.5%) | 436 (22.4%) |
| $150,000 or more | 56 (4.4%) | 248 (12.8%) |
| Total | 1,262 (100.0%) | 1,945 (100.0%) |
Property Value to Household Income Ratio in Lebanon
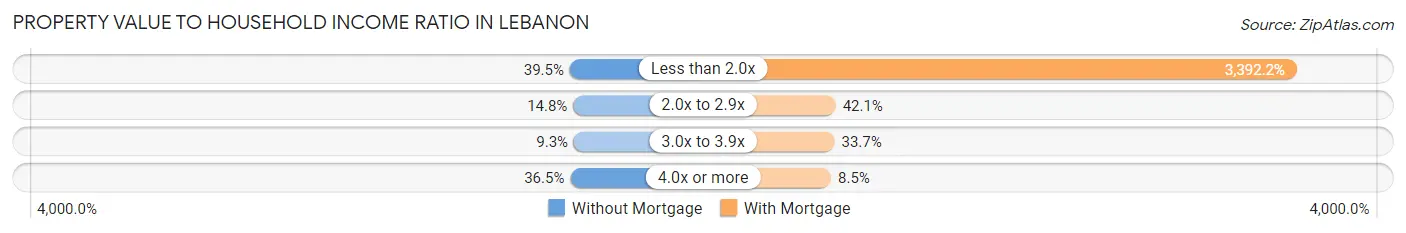
| Value-to-Income Ratio | Without Mortgage | With Mortgage |
| Less than 2.0x | 498 (39.5%) | 65,978 (3,392.2%) |
| 2.0x to 2.9x | 187 (14.8%) | 819 (42.1%) |
| 3.0x to 3.9x | 117 (9.3%) | 655 (33.7%) |
| 4.0x or more | 460 (36.4%) | 166 (8.5%) |
| Total | 1,262 (100.0%) | 1,945 (100.0%) |
Real Estate Taxes by Mortgage Status in Lebanon
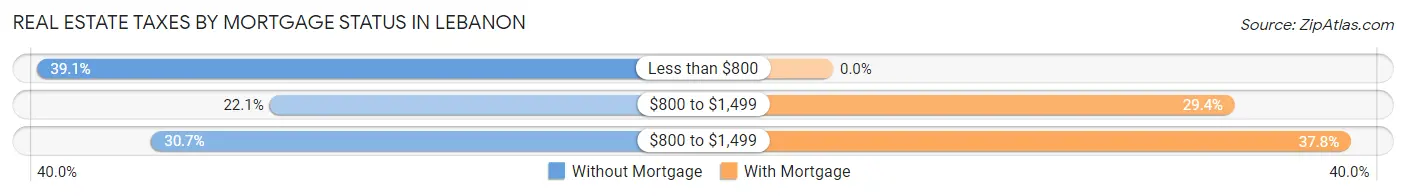
| Property Taxes | Without Mortgage | With Mortgage |
| Less than $800 | 493 (39.1%) | 0 (0.0%) |
| $800 to $1,499 | 279 (22.1%) | 571 (29.4%) |
| $800 to $1,499 | 388 (30.7%) | 736 (37.8%) |
| Total | 1,262 (100.0%) | 1,945 (100.0%) |
Health & Disability in Lebanon
Health Insurance Coverage by Age in Lebanon
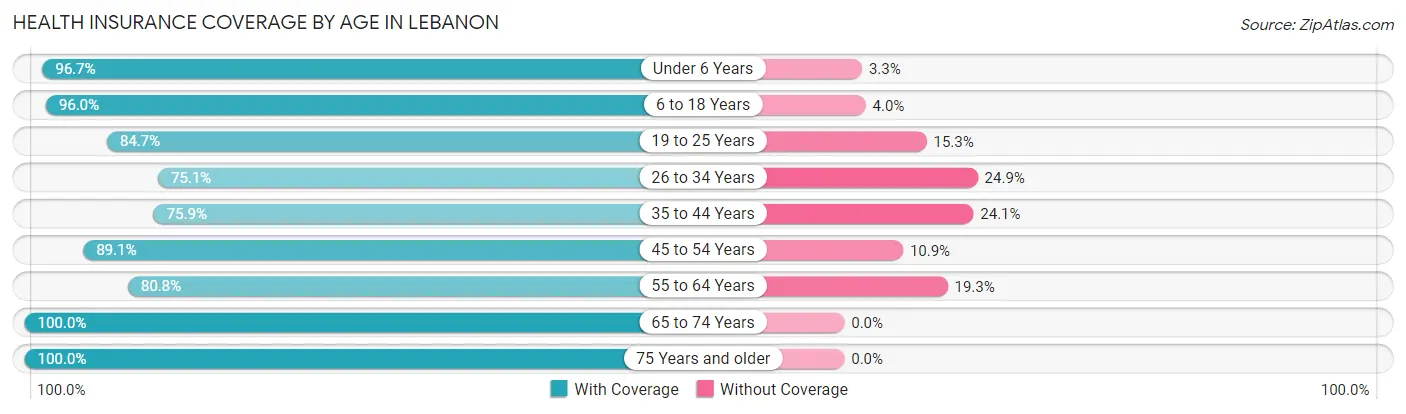
| Age Bracket | With Coverage | Without Coverage |
| Under 6 Years | 1,172 (96.7%) | 40 (3.3%) |
| 6 to 18 Years | 2,852 (96.0%) | 118 (4.0%) |
| 19 to 25 Years | 988 (84.7%) | 179 (15.3%) |
| 26 to 34 Years | 1,574 (75.1%) | 521 (24.9%) |
| 35 to 44 Years | 1,312 (75.9%) | 416 (24.1%) |
| 45 to 54 Years | 1,620 (89.1%) | 199 (10.9%) |
| 55 to 64 Years | 1,221 (80.7%) | 291 (19.3%) |
| 65 to 74 Years | 1,119 (100.0%) | 0 (0.0%) |
| 75 Years and older | 1,125 (100.0%) | 0 (0.0%) |
| Total | 12,983 (88.0%) | 1,764 (12.0%) |
Health Insurance Coverage by Citizenship Status in Lebanon
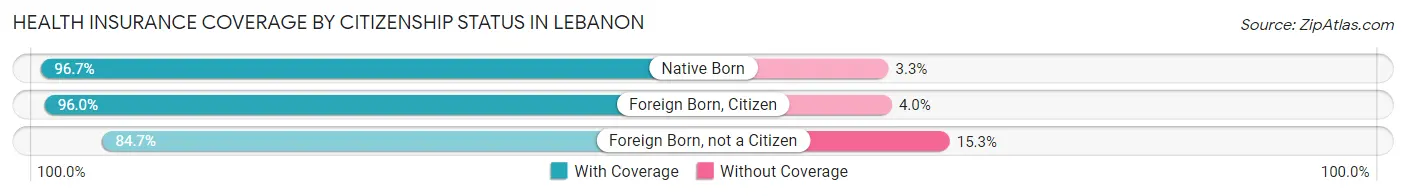
| Citizenship Status | With Coverage | Without Coverage |
| Native Born | 1,172 (96.7%) | 40 (3.3%) |
| Foreign Born, Citizen | 2,852 (96.0%) | 118 (4.0%) |
| Foreign Born, not a Citizen | 988 (84.7%) | 179 (15.3%) |
Health Insurance Coverage by Household Income in Lebanon
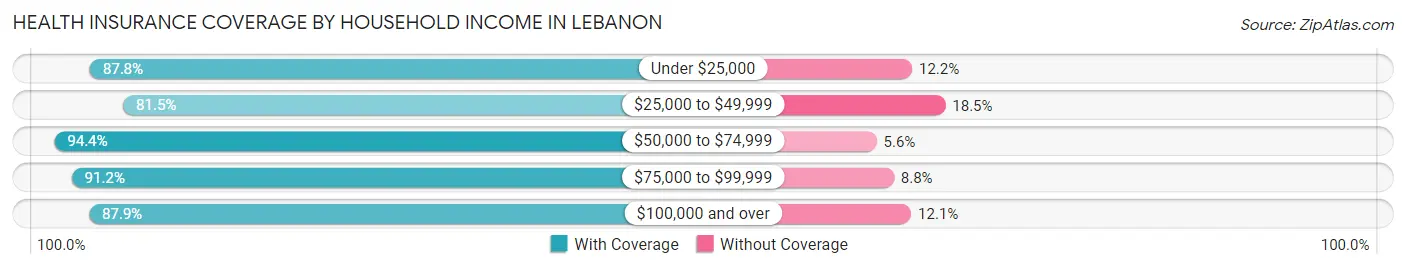
| Household Income | With Coverage | Without Coverage |
| Under $25,000 | 1,995 (87.8%) | 278 (12.2%) |
| $25,000 to $49,999 | 3,487 (81.5%) | 790 (18.5%) |
| $50,000 to $74,999 | 2,997 (94.4%) | 177 (5.6%) |
| $75,000 to $99,999 | 2,318 (91.2%) | 224 (8.8%) |
| $100,000 and over | 2,151 (87.9%) | 295 (12.1%) |
Public vs Private Health Insurance Coverage by Age in Lebanon
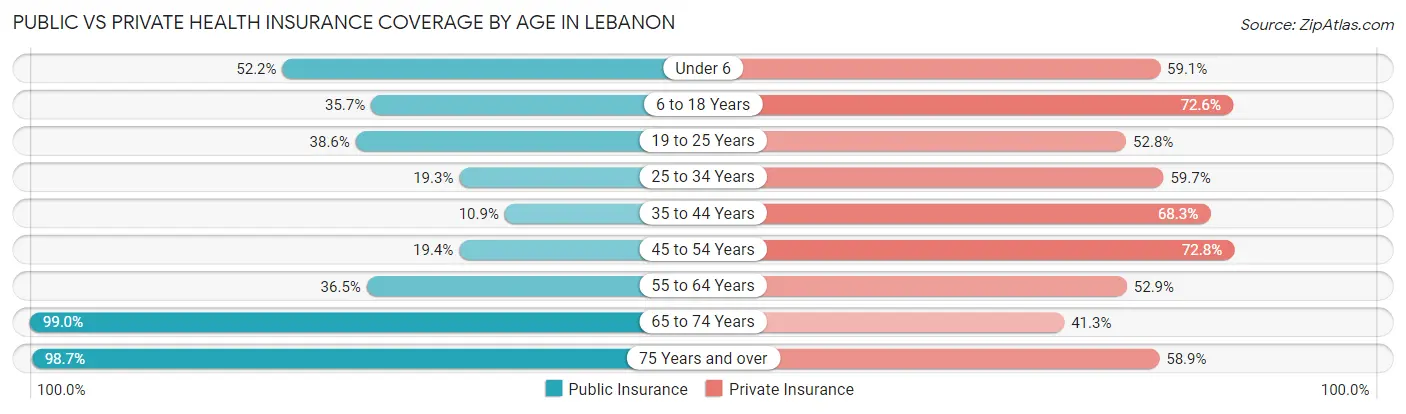
| Age Bracket | Public Insurance | Private Insurance |
| Under 6 | 632 (52.1%) | 716 (59.1%) |
| 6 to 18 Years | 1,060 (35.7%) | 2,155 (72.6%) |
| 19 to 25 Years | 450 (38.6%) | 616 (52.8%) |
| 25 to 34 Years | 405 (19.3%) | 1,251 (59.7%) |
| 35 to 44 Years | 188 (10.9%) | 1,181 (68.3%) |
| 45 to 54 Years | 352 (19.4%) | 1,324 (72.8%) |
| 55 to 64 Years | 552 (36.5%) | 800 (52.9%) |
| 65 to 74 Years | 1,108 (99.0%) | 462 (41.3%) |
| 75 Years and over | 1,110 (98.7%) | 663 (58.9%) |
| Total | 5,857 (39.7%) | 9,168 (62.2%) |
Disability Status by Sex by Age in Lebanon
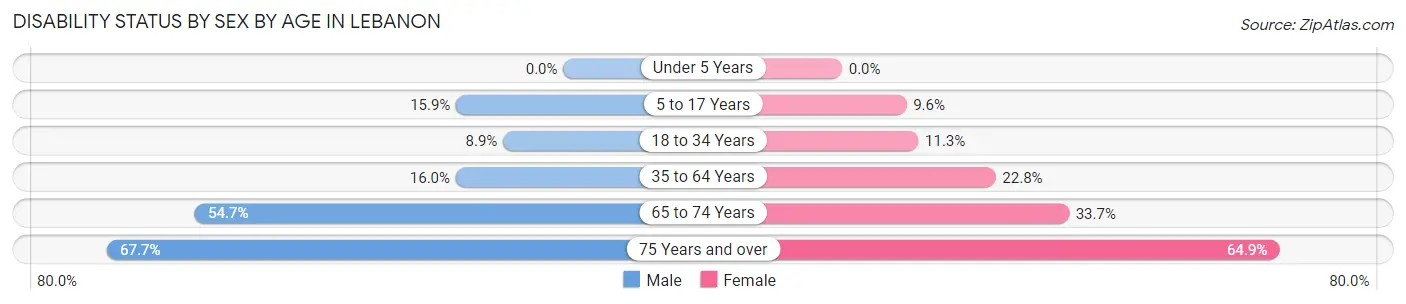
| Age Bracket | Male | Female |
| Under 5 Years | 0 (0.0%) | 0 (0.0%) |
| 5 to 17 Years | 275 (15.9%) | 116 (9.6%) |
| 18 to 34 Years | 161 (8.9%) | 196 (11.3%) |
| 35 to 64 Years | 412 (16.0%) | 565 (22.8%) |
| 65 to 74 Years | 263 (54.7%) | 215 (33.7%) |
| 75 Years and over | 252 (67.7%) | 489 (64.9%) |
Disability Class by Sex by Age in Lebanon
Disability Class: Hearing Difficulty
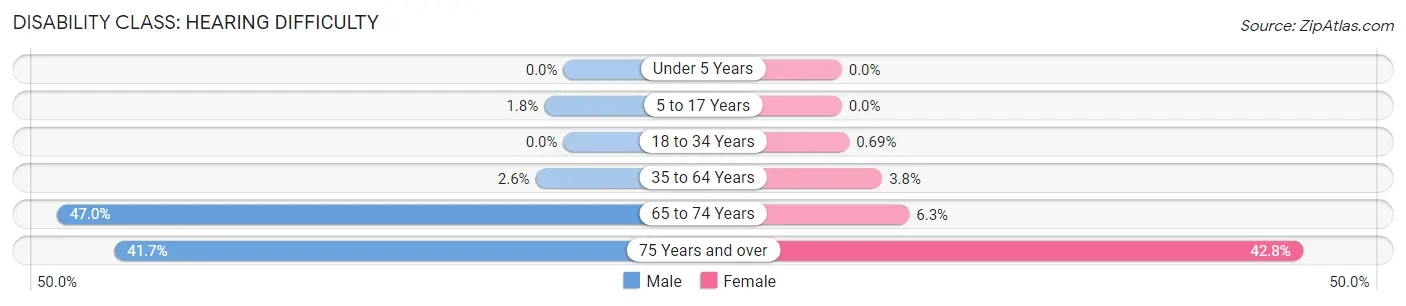
| Age Bracket | Male | Female |
| Under 5 Years | 0 (0.0%) | 0 (0.0%) |
| 5 to 17 Years | 31 (1.8%) | 0 (0.0%) |
| 18 to 34 Years | 0 (0.0%) | 12 (0.7%) |
| 35 to 64 Years | 67 (2.6%) | 93 (3.7%) |
| 65 to 74 Years | 226 (47.0%) | 40 (6.3%) |
| 75 Years and over | 155 (41.7%) | 322 (42.8%) |
Disability Class: Vision Difficulty
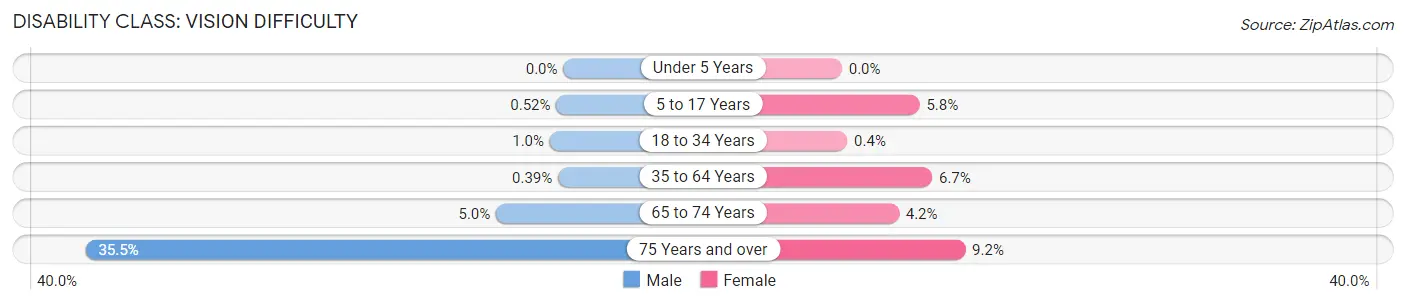
| Age Bracket | Male | Female |
| Under 5 Years | 0 (0.0%) | 0 (0.0%) |
| 5 to 17 Years | 9 (0.5%) | 70 (5.8%) |
| 18 to 34 Years | 18 (1.0%) | 7 (0.4%) |
| 35 to 64 Years | 10 (0.4%) | 166 (6.7%) |
| 65 to 74 Years | 24 (5.0%) | 27 (4.2%) |
| 75 Years and over | 132 (35.5%) | 69 (9.2%) |
Disability Class: Cognitive Difficulty
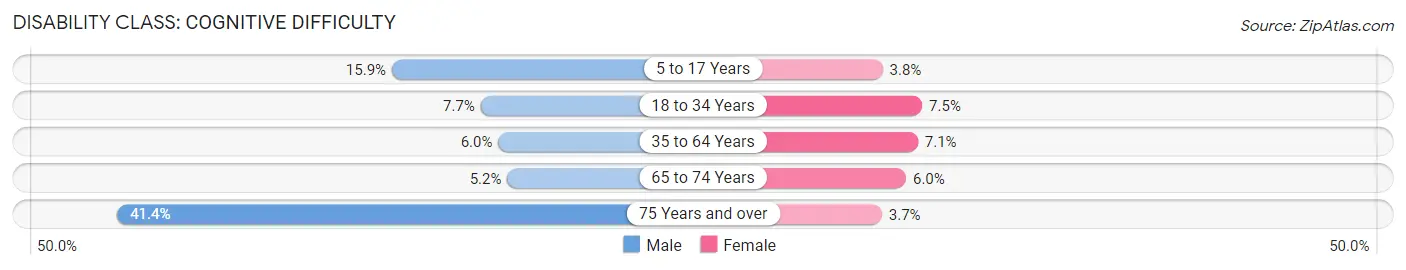
| Age Bracket | Male | Female |
| 5 to 17 Years | 275 (15.9%) | 46 (3.8%) |
| 18 to 34 Years | 138 (7.7%) | 129 (7.5%) |
| 35 to 64 Years | 156 (6.0%) | 175 (7.1%) |
| 65 to 74 Years | 25 (5.2%) | 38 (6.0%) |
| 75 Years and over | 154 (41.4%) | 28 (3.7%) |
Disability Class: Ambulatory Difficulty
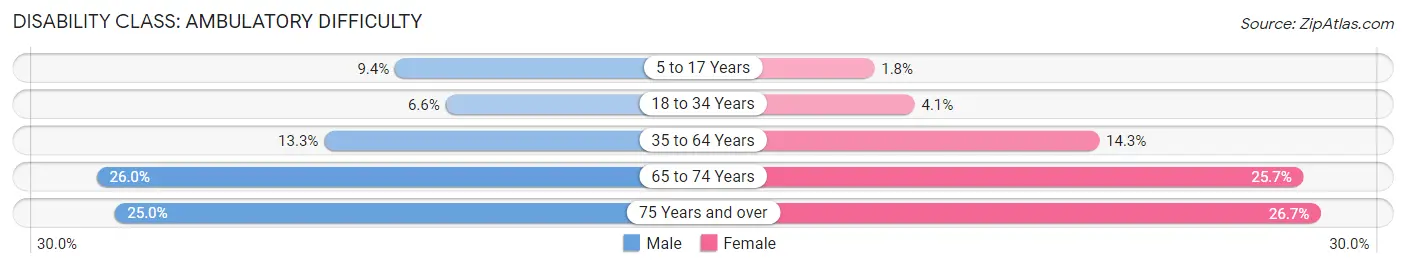
| Age Bracket | Male | Female |
| 5 to 17 Years | 162 (9.4%) | 22 (1.8%) |
| 18 to 34 Years | 118 (6.6%) | 70 (4.1%) |
| 35 to 64 Years | 344 (13.3%) | 355 (14.3%) |
| 65 to 74 Years | 125 (26.0%) | 164 (25.7%) |
| 75 Years and over | 93 (25.0%) | 201 (26.7%) |
Disability Class: Self-Care Difficulty
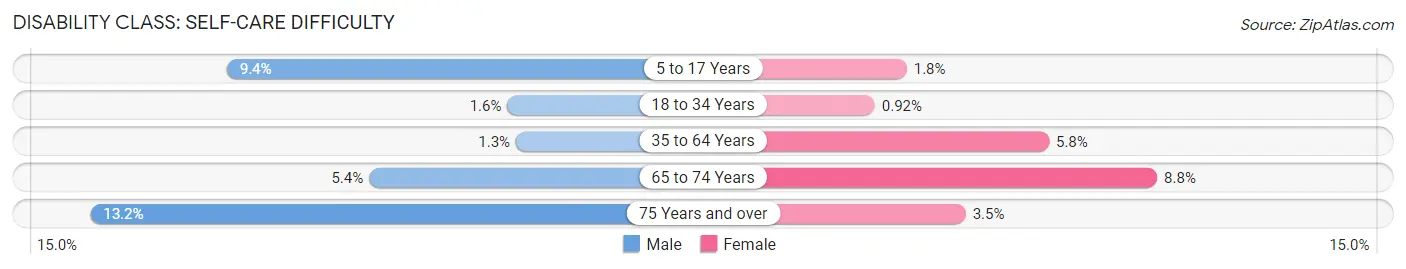
| Age Bracket | Male | Female |
| 5 to 17 Years | 162 (9.4%) | 22 (1.8%) |
| 18 to 34 Years | 28 (1.6%) | 16 (0.9%) |
| 35 to 64 Years | 34 (1.3%) | 143 (5.8%) |
| 65 to 74 Years | 26 (5.4%) | 56 (8.8%) |
| 75 Years and over | 49 (13.2%) | 26 (3.5%) |
Technology Access in Lebanon
Computing Device Access in Lebanon
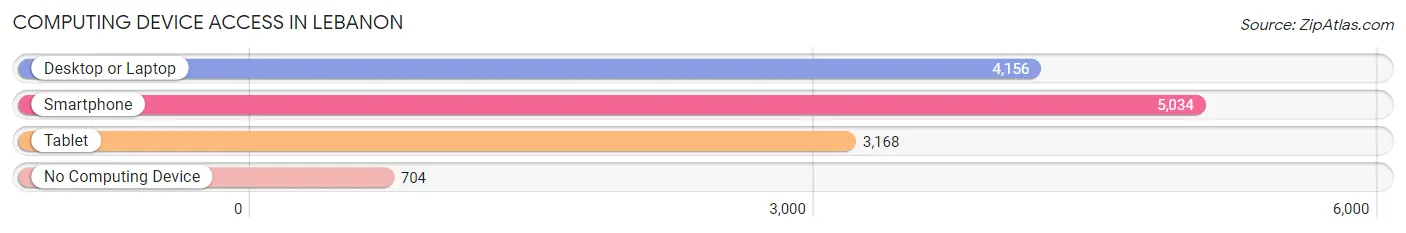
| Device Type | # Households | % Households |
| Desktop or Laptop | 4,156 | 68.0% |
| Smartphone | 5,034 | 82.3% |
| Tablet | 3,168 | 51.8% |
| No Computing Device | 704 | 11.5% |
| Total | 6,114 | 100.0% |
Internet Access in Lebanon
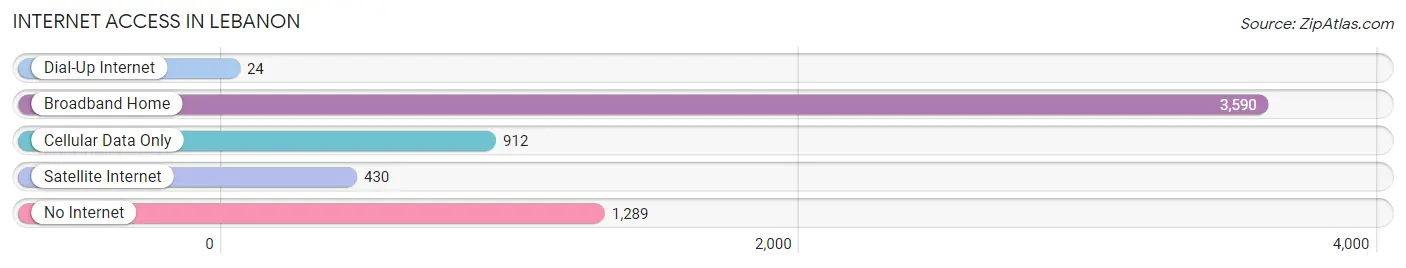
| Internet Type | # Households | % Households |
| Dial-Up Internet | 24 | 0.4% |
| Broadband Home | 3,590 | 58.7% |
| Cellular Data Only | 912 | 14.9% |
| Satellite Internet | 430 | 7.0% |
| No Internet | 1,289 | 21.1% |
| Total | 6,114 | 100.0% |
Lebanon Summary
Lebanon, Missouri is a city located in Laclede County, Missouri, United States. It is the county seat of Laclede County and is located in the Ozarks region of the state. The population of Lebanon was 14,474 at the 2010 census, making it the largest city in Laclede County.
History
Lebanon was founded in 1849 by a group of settlers from Lebanon, Tennessee. The city was named after the original settlers’ hometown. The city was incorporated in 1855 and has since grown to become the largest city in Laclede County.
Lebanon was an important stop on the Butterfield Overland Mail route, which ran from St. Louis to San Francisco. The route passed through Lebanon on its way to Springfield, Missouri. The city was also an important stop on the Ozark Trail, which ran from St. Louis to Oklahoma.
The city was also an important stop on the St. Louis-San Francisco Railway, which ran through the city from 1881 to 1932. The railway was an important factor in the growth of the city, as it allowed for the transportation of goods and people to and from the city.
Geography
Lebanon is located in the Ozarks region of Missouri. The city is situated in the foothills of the Ozark Mountains, and is surrounded by rolling hills and forests. The city is located at the intersection of Interstate 44 and U.S. Route 66.
The city has a total area of 11.2 square miles, of which 11.1 square miles is land and 0.1 square miles is water. The city is located at an elevation of 1,068 feet above sea level.
Economy
Lebanon’s economy is largely based on agriculture and manufacturing. The city is home to several large manufacturing companies, including Tyson Foods, which produces chicken products, and Ozark Mountain Poultry, which produces turkey products.
The city is also home to several large agricultural operations, including dairy farms, beef cattle farms, and hog farms. The city is also home to several large retail stores, including Walmart, Lowe’s, and Home Depot.
Demographics
As of the 2010 census, the population of Lebanon was 14,474. The racial makeup of the city was 92.3% White, 4.2% African American, 0.4% Native American, 0.7% Asian, 0.1% Pacific Islander, 0.7% from other races, and 1.6% from two or more races. Hispanic or Latino of any race were 2.2% of the population.
The median income for a household in the city was $35,945, and the median income for a family was $45,945. The per capita income for the city was $19,945. About 11.3% of families and 14.2% of the population were below the poverty line, including 19.2% of those under age 18 and 8.7% of those age 65 or over.
Lebanon is a diverse city with a rich history and a vibrant economy. The city is home to several large manufacturing and agricultural operations, as well as several large retail stores. The city is also home to a diverse population, with a median income that is slightly higher than the national average.
Common Questions
What is Per Capita Income in Lebanon?
Per Capita income in Lebanon is $26,971.
What is the Median Family Income in Lebanon?
Median Family Income in Lebanon is $60,054.
What is the Median Household income in Lebanon?
Median Household Income in Lebanon is $45,634.
What is Income or Wage Gap in Lebanon?
Income or Wage Gap in Lebanon is 33.9%.
Women in Lebanon earn 66.1 cents for every dollar earned by a man.
What is Inequality or Gini Index in Lebanon?
Inequality or Gini Index in Lebanon is 0.49.
What is the Total Population of Lebanon?
Total Population of Lebanon is 15,023.
What is the Total Male Population of Lebanon?
Total Male Population of Lebanon is 7,514.
What is the Total Female Population of Lebanon?
Total Female Population of Lebanon is 7,509.
What is the Ratio of Males per 100 Females in Lebanon?
There are 100.07 Males per 100 Females in Lebanon.
What is the Ratio of Females per 100 Males in Lebanon?
There are 99.93 Females per 100 Males in Lebanon.
What is the Median Population Age in Lebanon?
Median Population Age in Lebanon is 35.1 Years.
What is the Average Family Size in Lebanon
Average Family Size in Lebanon is 3.1 People.
What is the Average Household Size in Lebanon
Average Household Size in Lebanon is 2.4 People.
How Large is the Labor Force in Lebanon?
There are 7,398 People in the Labor Forcein in Lebanon.
What is the Percentage of People in the Labor Force in Lebanon?
63.9% of People are in the Labor Force in Lebanon.
What is the Unemployment Rate in Lebanon?
Unemployment Rate in Lebanon is 8.0%.