Lemay, MO Map & Demographics
Lemay Map
Lemay Overview
$29,555
PER CAPITA INCOME
$71,920
AVG FAMILY INCOME
$56,591
AVG HOUSEHOLD INCOME
30.8%
WAGE / INCOME GAP [ % ]
69.2¢/ $1
WAGE / INCOME GAP [ $ ]
0.41
INEQUALITY / GINI INDEX
16,211
TOTAL POPULATION
7,973
MALE POPULATION
8,238
FEMALE POPULATION
96.78
MALES / 100 FEMALES
103.32
FEMALES / 100 MALES
36.0
MEDIAN AGE
3.2
AVG FAMILY SIZE
2.5
AVG HOUSEHOLD SIZE
8,292
LABOR FORCE [ PEOPLE ]
65.8%
PERCENT IN LABOR FORCE
4.3%
UNEMPLOYMENT RATE
Lemay Area Codes
Income in Lemay
Income Overview in Lemay
Per Capita Income in Lemay is $29,555, while median incomes of families and households are $71,920 and $56,591 respectively.
| Characteristic | Number | Measure |
| Per Capita Income | 16,211 | $29,555 |
| Median Family Income | 3,915 | $71,920 |
| Mean Family Income | 3,915 | $87,395 |
| Median Household Income | 6,353 | $56,591 |
| Mean Household Income | 6,353 | $72,905 |
| Income Deficit | 3,915 | $0 |
| Wage / Income Gap (%) | 16,211 | 30.77% |
| Wage / Income Gap ($) | 16,211 | 69.23¢ per $1 |
| Gini / Inequality Index | 16,211 | 0.41 |
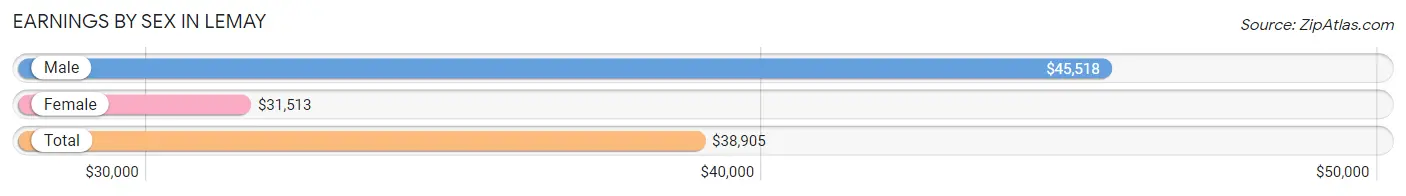
Earnings by Sex in Lemay
Average Earnings in Lemay are $38,905, $45,518 for men and $31,513 for women, a difference of 30.8%.
| Sex | Number | Average Earnings |
| Male | 4,710 (55.8%) | $45,518 |
| Female | 3,728 (44.2%) | $31,513 |
| Total | 8,438 (100.0%) | $38,905 |
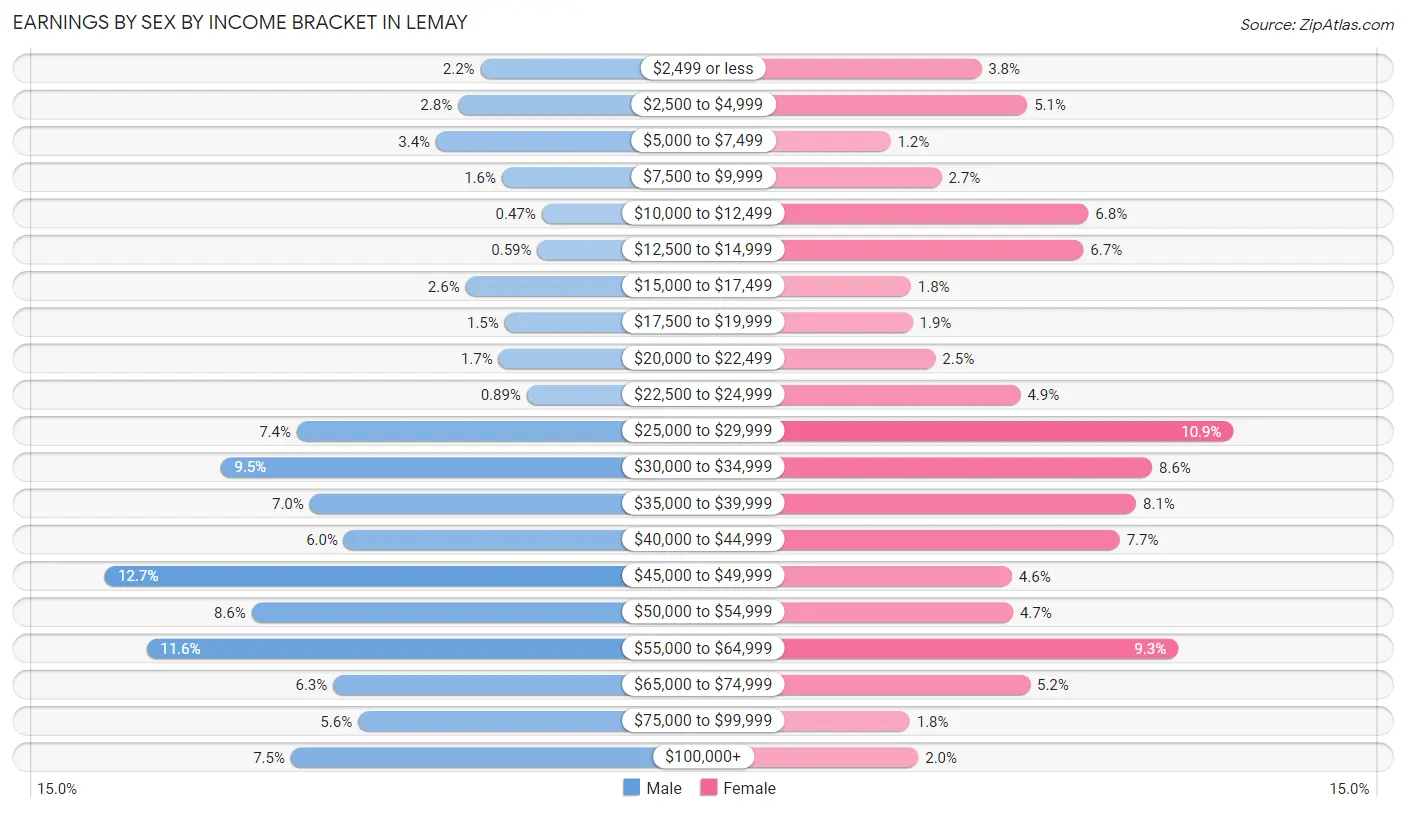
Earnings by Sex by Income Bracket in Lemay
The most common earnings brackets in Lemay are $45,000 to $49,999 for men (600 | 12.7%) and $25,000 to $29,999 for women (405 | 10.9%).
| Income | Male | Female |
| $2,499 or less | 103 (2.2%) | 141 (3.8%) |
| $2,500 to $4,999 | 133 (2.8%) | 189 (5.1%) |
| $5,000 to $7,499 | 162 (3.4%) | 46 (1.2%) |
| $7,500 to $9,999 | 75 (1.6%) | 99 (2.7%) |
| $10,000 to $12,499 | 22 (0.5%) | 253 (6.8%) |
| $12,500 to $14,999 | 28 (0.6%) | 248 (6.7%) |
| $15,000 to $17,499 | 123 (2.6%) | 67 (1.8%) |
| $17,500 to $19,999 | 71 (1.5%) | 69 (1.8%) |
| $20,000 to $22,499 | 79 (1.7%) | 93 (2.5%) |
| $22,500 to $24,999 | 42 (0.9%) | 182 (4.9%) |
| $25,000 to $29,999 | 346 (7.3%) | 405 (10.9%) |
| $30,000 to $34,999 | 446 (9.5%) | 320 (8.6%) |
| $35,000 to $39,999 | 329 (7.0%) | 303 (8.1%) |
| $40,000 to $44,999 | 284 (6.0%) | 286 (7.7%) |
| $45,000 to $49,999 | 600 (12.7%) | 173 (4.6%) |
| $50,000 to $54,999 | 406 (8.6%) | 174 (4.7%) |
| $55,000 to $64,999 | 544 (11.6%) | 347 (9.3%) |
| $65,000 to $74,999 | 298 (6.3%) | 192 (5.1%) |
| $75,000 to $99,999 | 265 (5.6%) | 66 (1.8%) |
| $100,000+ | 354 (7.5%) | 75 (2.0%) |
| Total | 4,710 (100.0%) | 3,728 (100.0%) |
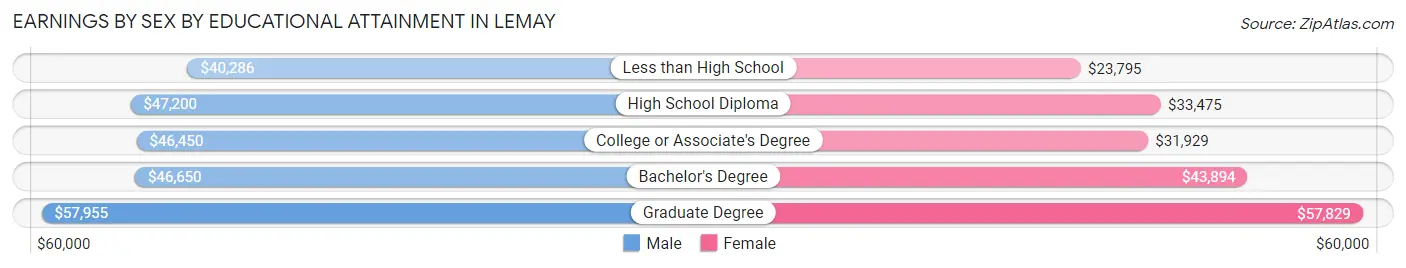
Earnings by Sex by Educational Attainment in Lemay
Average earnings in Lemay are $46,554 for men and $35,278 for women, a difference of 24.2%. Men with an educational attainment of graduate degree enjoy the highest average annual earnings of $57,955, while those with less than high school education earn the least with $40,286. Women with an educational attainment of graduate degree earn the most with the average annual earnings of $57,829, while those with less than high school education have the smallest earnings of $23,795.
| Educational Attainment | Male Income | Female Income |
| Less than High School | $40,286 | $23,795 |
| High School Diploma | $47,200 | $33,475 |
| College or Associate's Degree | $46,450 | $31,929 |
| Bachelor's Degree | $46,650 | $43,894 |
| Graduate Degree | $57,955 | $57,829 |
| Total | $46,554 | $35,278 |
Family Income in Lemay
Family Income Brackets in Lemay
According to the Lemay family income data, there are 971 families falling into the $50,000 to $74,999 income range, which is the most common income bracket and makes up 24.8% of all families. Conversely, the $15,000 to $24,999 income bracket is the least frequent group with only 110 families (2.8%) belonging to this category.
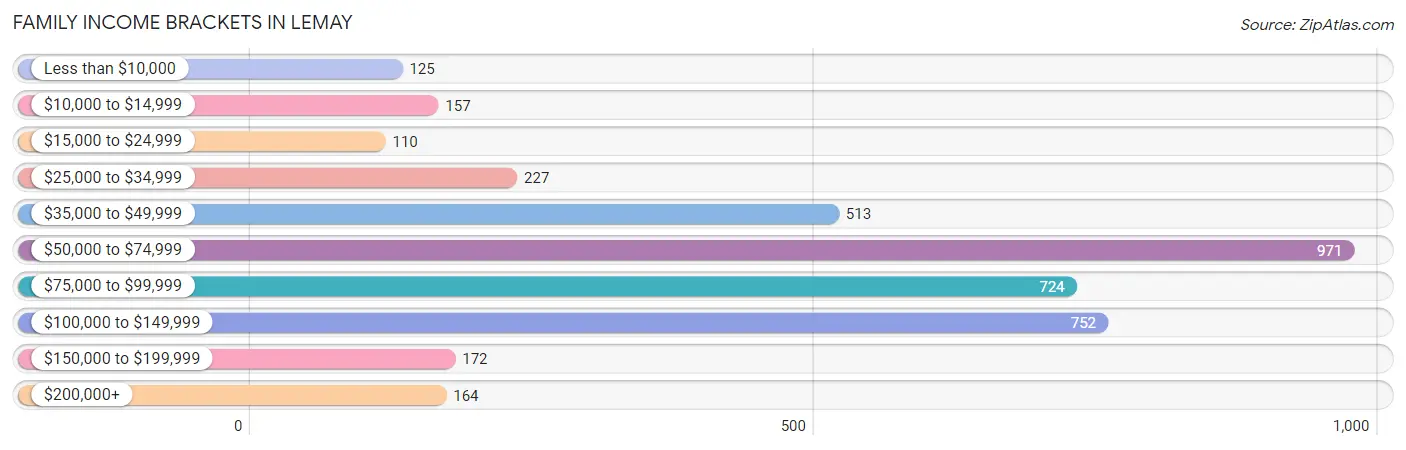
| Income Bracket | # Families | % Families |
| Less than $10,000 | 125 | 3.2% |
| $10,000 to $14,999 | 157 | 4.0% |
| $15,000 to $24,999 | 110 | 2.8% |
| $25,000 to $34,999 | 227 | 5.8% |
| $35,000 to $49,999 | 513 | 13.1% |
| $50,000 to $74,999 | 971 | 24.8% |
| $75,000 to $99,999 | 724 | 18.5% |
| $100,000 to $149,999 | 752 | 19.2% |
| $150,000 to $199,999 | 172 | 4.4% |
| $200,000+ | 164 | 4.2% |
Family Income by Famaliy Size in Lemay
6-person families (83 | 2.1%) account for the highest median family income in Lemay with $118,015 per family, while 2-person families (1,816 | 46.4%) have the highest median income of $30,632 per family member.
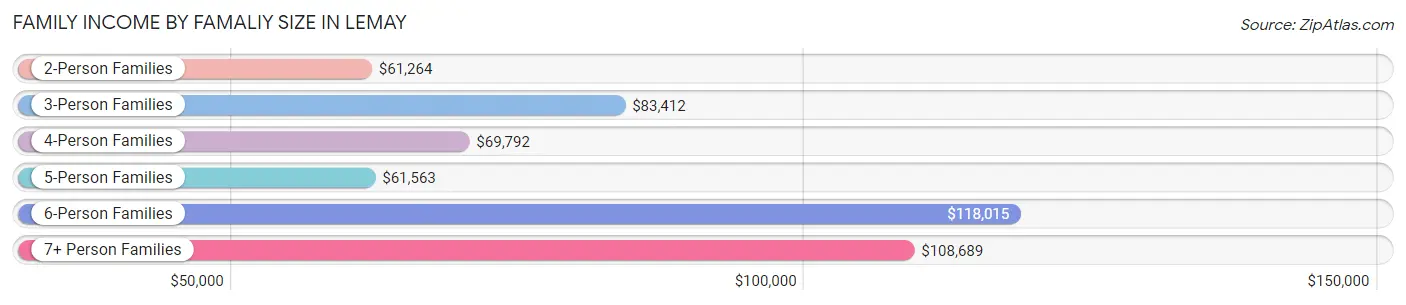
| Income Bracket | # Families | Median Income |
| 2-Person Families | 1,816 (46.4%) | $61,264 |
| 3-Person Families | 986 (25.2%) | $83,412 |
| 4-Person Families | 686 (17.5%) | $69,792 |
| 5-Person Families | 266 (6.8%) | $61,563 |
| 6-Person Families | 83 (2.1%) | $118,015 |
| 7+ Person Families | 78 (2.0%) | $108,689 |
| Total | 3,915 (100.0%) | $71,920 |
Family Income by Number of Earners in Lemay
The median family income in Lemay is $71,920, with families comprising 3+ earners (387) having the highest median family income of $109,852, while families with no earners (624) have the lowest median family income of $40,098, accounting for 9.9% and 15.9% of families, respectively.
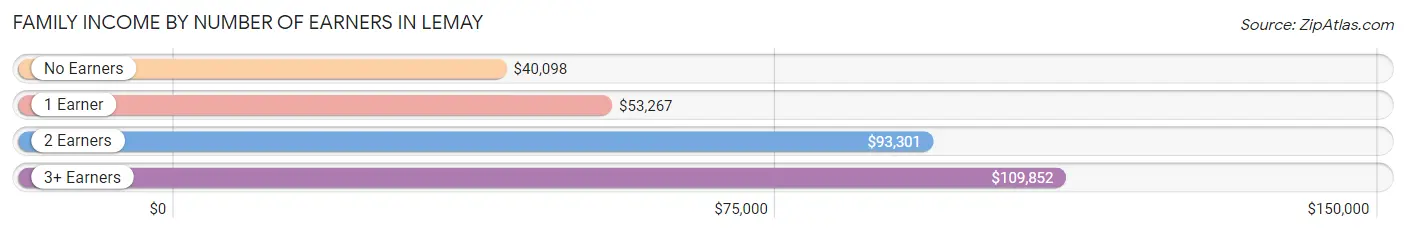
| Number of Earners | # Families | Median Income |
| No Earners | 624 (15.9%) | $40,098 |
| 1 Earner | 1,361 (34.8%) | $53,267 |
| 2 Earners | 1,543 (39.4%) | $93,301 |
| 3+ Earners | 387 (9.9%) | $109,852 |
| Total | 3,915 (100.0%) | $71,920 |
Household Income in Lemay
Household Income Brackets in Lemay
With 1,734 households falling in the category, the $50,000 to $74,999 income range is the most frequent in Lemay, accounting for 27.3% of all households. In contrast, only 191 households (3.0%) fall into the $150,000 to $199,999 income bracket, making it the least populous group.
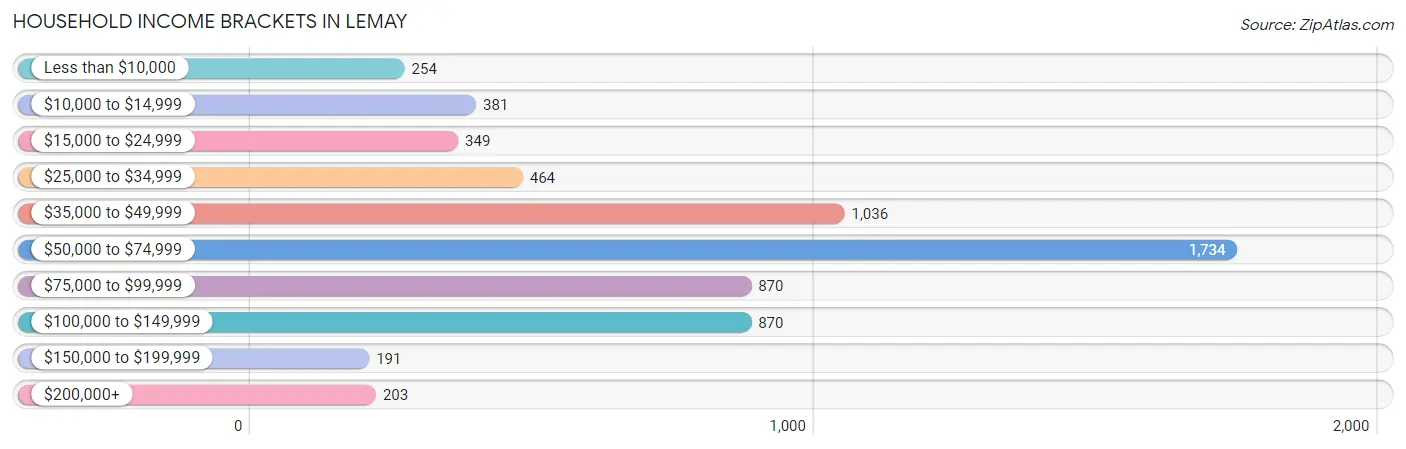
| Income Bracket | # Households | % Households |
| Less than $10,000 | 254 | 4.0% |
| $10,000 to $14,999 | 381 | 6.0% |
| $15,000 to $24,999 | 349 | 5.5% |
| $25,000 to $34,999 | 464 | 7.3% |
| $35,000 to $49,999 | 1,036 | 16.3% |
| $50,000 to $74,999 | 1,734 | 27.3% |
| $75,000 to $99,999 | 870 | 13.7% |
| $100,000 to $149,999 | 870 | 13.7% |
| $150,000 to $199,999 | 191 | 3.0% |
| $200,000+ | 203 | 3.2% |
Household Income by Householder Age in Lemay
The median household income in Lemay is $56,591, with the highest median household income of $63,549 found in the 25 to 44 years age bracket for the primary householder. A total of 2,524 households (39.7%) fall into this category. Meanwhile, the 65+ years age bracket for the primary householder has the lowest median household income of $46,105, with 1,268 households (20.0%) in this group.
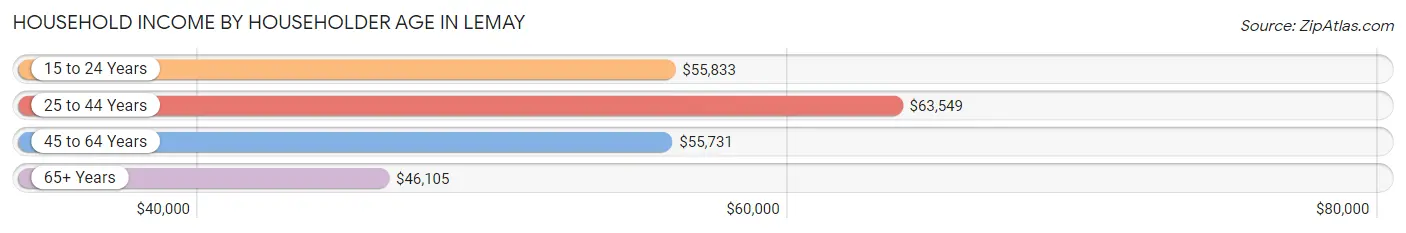
| Income Bracket | # Households | Median Income |
| 15 to 24 Years | 160 (2.5%) | $55,833 |
| 25 to 44 Years | 2,524 (39.7%) | $63,549 |
| 45 to 64 Years | 2,401 (37.8%) | $55,731 |
| 65+ Years | 1,268 (20.0%) | $46,105 |
| Total | 6,353 (100.0%) | $56,591 |
Poverty in Lemay
Income Below Poverty by Sex and Age in Lemay
With 9.3% poverty level for males and 21.3% for females among the residents of Lemay, 6 to 11 year old males and 15 year old females are the most vulnerable to poverty, with 118 males (18.0%) and 29 females (74.4%) in their respective age groups living below the poverty level.
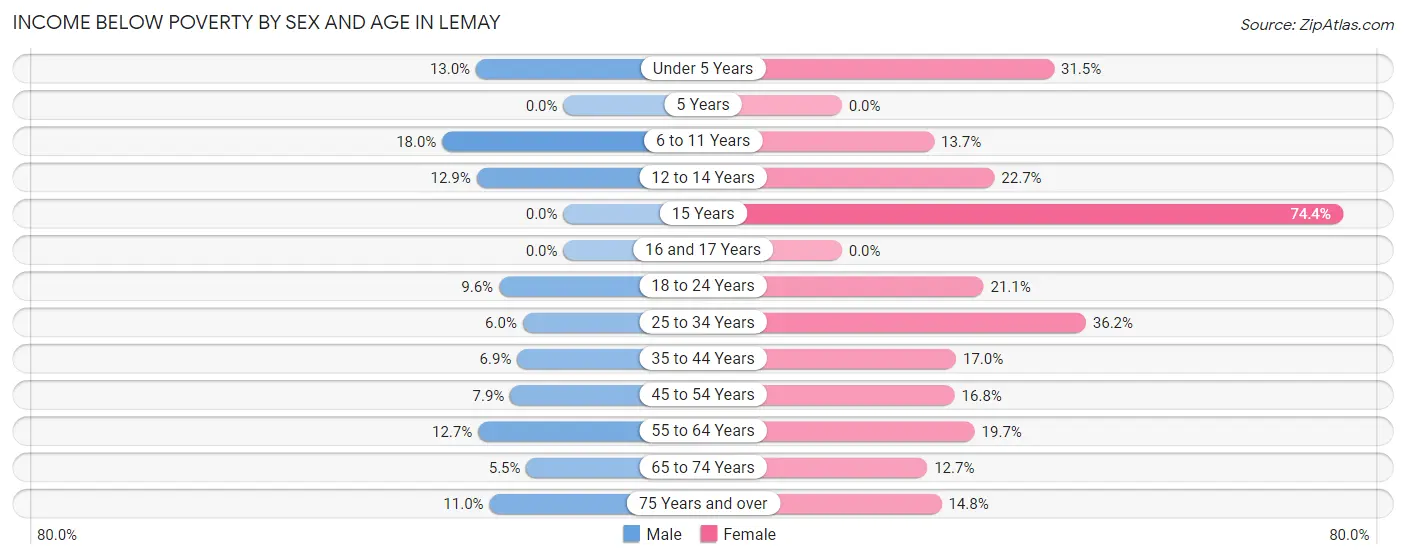
| Age Bracket | Male | Female |
| Under 5 Years | 75 (13.0%) | 220 (31.5%) |
| 5 Years | 0 (0.0%) | 0 (0.0%) |
| 6 to 11 Years | 118 (18.0%) | 77 (13.7%) |
| 12 to 14 Years | 50 (12.9%) | 87 (22.7%) |
| 15 Years | 0 (0.0%) | 29 (74.4%) |
| 16 and 17 Years | 0 (0.0%) | 0 (0.0%) |
| 18 to 24 Years | 56 (9.6%) | 148 (21.0%) |
| 25 to 34 Years | 89 (6.0%) | 470 (36.2%) |
| 35 to 44 Years | 86 (6.9%) | 176 (17.0%) |
| 45 to 54 Years | 67 (7.9%) | 156 (16.8%) |
| 55 to 64 Years | 130 (12.7%) | 235 (19.7%) |
| 65 to 74 Years | 39 (5.5%) | 77 (12.7%) |
| 75 Years and over | 27 (11.0%) | 58 (14.8%) |
| Total | 737 (9.3%) | 1,733 (21.3%) |
Income Above Poverty by Sex and Age in Lemay
According to the poverty statistics in Lemay, males aged 5 years and females aged 5 years are the age groups that are most secure financially, with 100.0% of males and 100.0% of females in these age groups living above the poverty line.
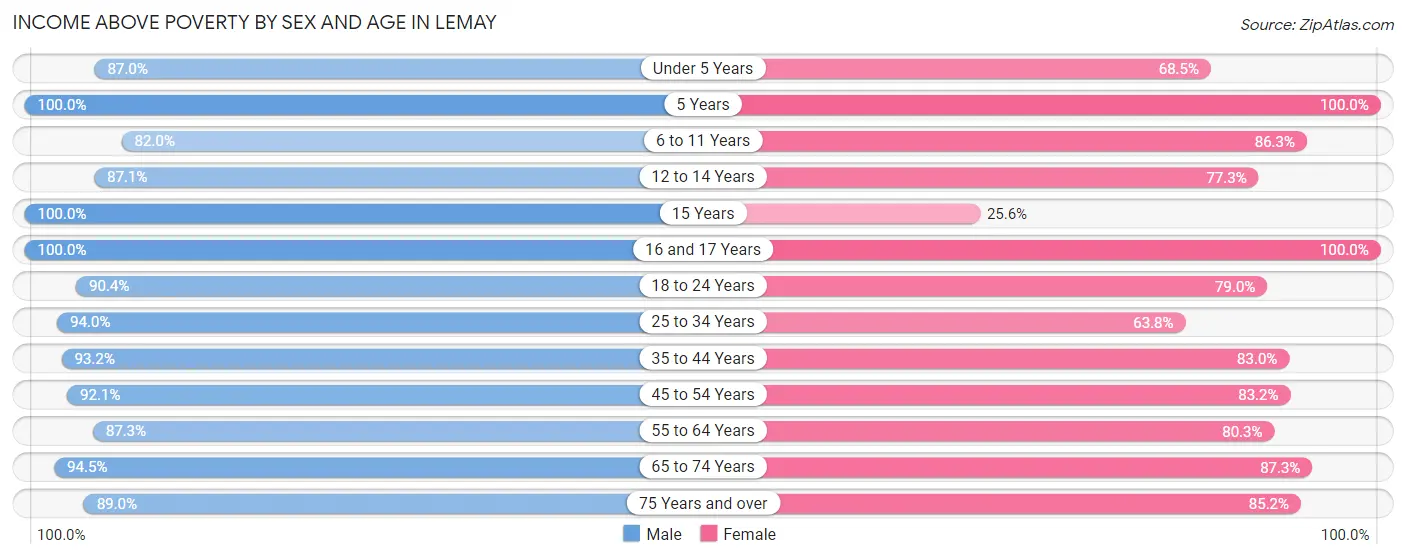
| Age Bracket | Male | Female |
| Under 5 Years | 503 (87.0%) | 478 (68.5%) |
| 5 Years | 6 (100.0%) | 254 (100.0%) |
| 6 to 11 Years | 538 (82.0%) | 485 (86.3%) |
| 12 to 14 Years | 338 (87.1%) | 297 (77.3%) |
| 15 Years | 29 (100.0%) | 10 (25.6%) |
| 16 and 17 Years | 80 (100.0%) | 50 (100.0%) |
| 18 to 24 Years | 530 (90.4%) | 555 (78.9%) |
| 25 to 34 Years | 1,386 (94.0%) | 827 (63.8%) |
| 35 to 44 Years | 1,170 (93.1%) | 861 (83.0%) |
| 45 to 54 Years | 781 (92.1%) | 775 (83.2%) |
| 55 to 64 Years | 896 (87.3%) | 956 (80.3%) |
| 65 to 74 Years | 671 (94.5%) | 530 (87.3%) |
| 75 Years and over | 219 (89.0%) | 334 (85.2%) |
| Total | 7,147 (90.6%) | 6,412 (78.7%) |
Income Below Poverty Among Married-Couple Families in Lemay
The poverty statistics for married-couple families in Lemay show that 3.9% or 88 of the total 2,265 families live below the poverty line. Families with 1 or 2 children have the highest poverty rate of 8.2%, comprising of 54 families. On the other hand, families with 5 or more children have the lowest poverty rate of 0.0%, which includes 0 families.
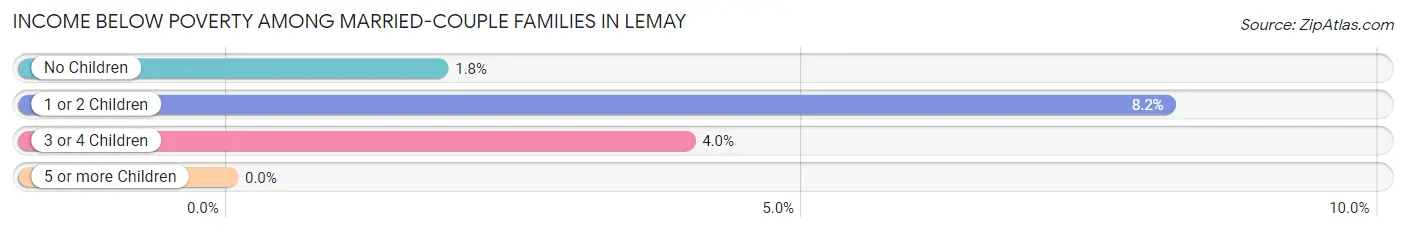
| Children | Above Poverty | Below Poverty |
| No Children | 1,342 (98.2%) | 25 (1.8%) |
| 1 or 2 Children | 608 (91.8%) | 54 (8.2%) |
| 3 or 4 Children | 217 (96.0%) | 9 (4.0%) |
| 5 or more Children | 10 (100.0%) | 0 (0.0%) |
| Total | 2,177 (96.1%) | 88 (3.9%) |
Income Below Poverty Among Single-Parent Households in Lemay
According to the poverty data in Lemay, 3.3% or 28 single-father households and 34.2% or 276 single-mother households are living below the poverty line. Among single-father households, those with 1 or 2 children have the highest poverty rate, with 28 households (10.0%) experiencing poverty. Likewise, among single-mother households, those with 3 or 4 children have the highest poverty rate, with 75 households (68.8%) falling below the poverty line.
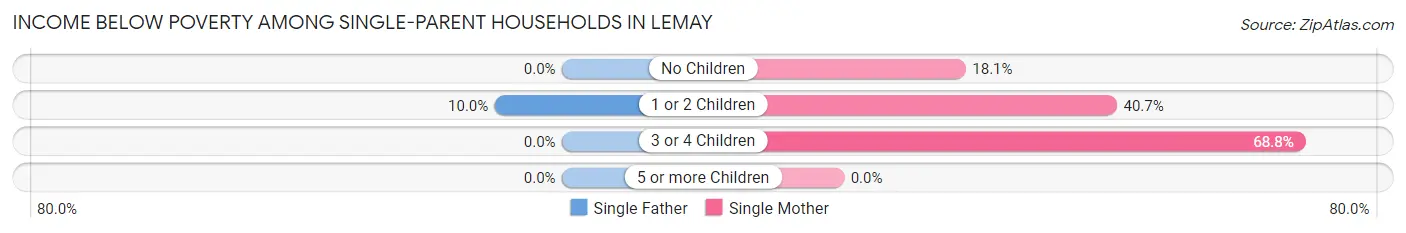
| Children | Single Father | Single Mother |
| No Children | 0 (0.0%) | 66 (18.1%) |
| 1 or 2 Children | 28 (10.0%) | 135 (40.7%) |
| 3 or 4 Children | 0 (0.0%) | 75 (68.8%) |
| 5 or more Children | 0 (0.0%) | 0 (0.0%) |
| Total | 28 (3.3%) | 276 (34.2%) |
Income Below Poverty Among Married-Couple vs Single-Parent Households in Lemay
The poverty data for Lemay shows that 88 of the married-couple family households (3.9%) and 304 of the single-parent households (18.4%) are living below the poverty level. Within the married-couple family households, those with 1 or 2 children have the highest poverty rate, with 54 households (8.2%) falling below the poverty line. Among the single-parent households, those with 3 or 4 children have the highest poverty rate, with 75 household (26.8%) living below poverty.
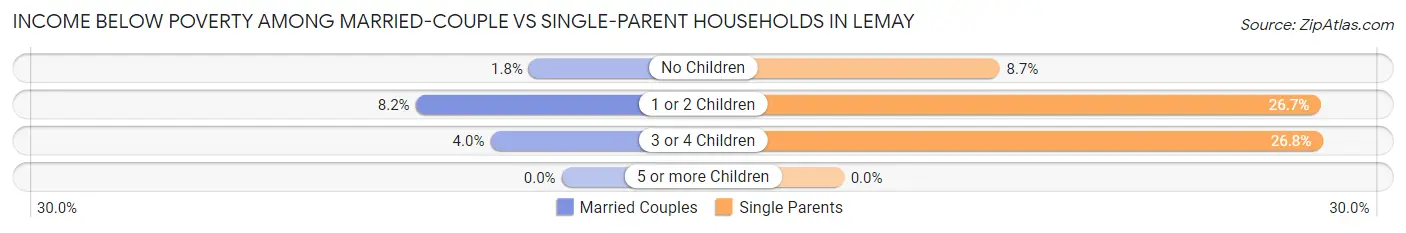
| Children | Married-Couple Families | Single-Parent Households |
| No Children | 25 (1.8%) | 66 (8.7%) |
| 1 or 2 Children | 54 (8.2%) | 163 (26.7%) |
| 3 or 4 Children | 9 (4.0%) | 75 (26.8%) |
| 5 or more Children | 0 (0.0%) | 0 (0.0%) |
| Total | 88 (3.9%) | 304 (18.4%) |
Race in Lemay
The most populous races in Lemay are White / Caucasian (13,996 | 86.3%), Two or more Races (1,212 | 7.5%), and Hispanic or Latino (479 | 2.9%).
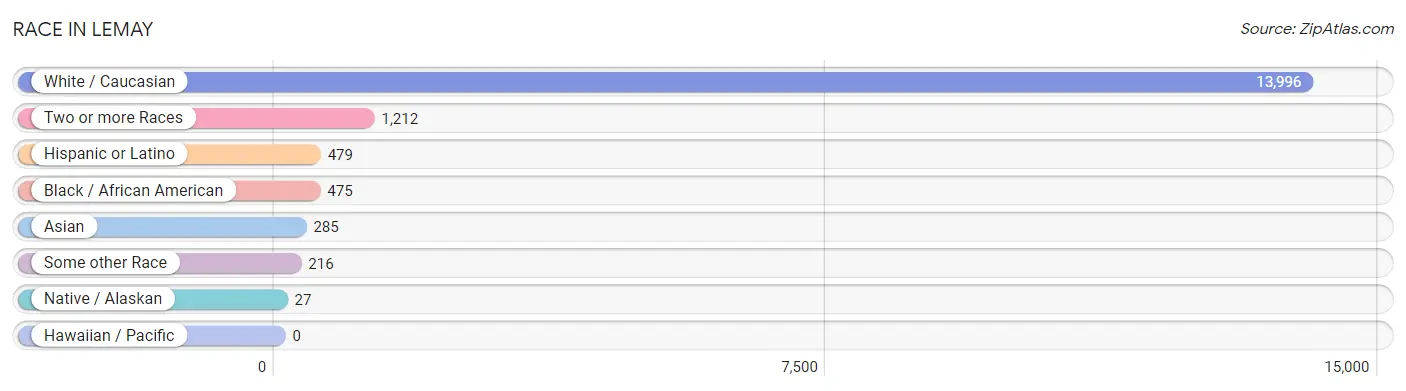
| Race | # Population | % Population |
| Asian | 285 | 1.8% |
| Black / African American | 475 | 2.9% |
| Hawaiian / Pacific | 0 | 0.0% |
| Hispanic or Latino | 479 | 2.9% |
| Native / Alaskan | 27 | 0.2% |
| White / Caucasian | 13,996 | 86.3% |
| Two or more Races | 1,212 | 7.5% |
| Some other Race | 216 | 1.3% |
| Total | 16,211 | 100.0% |
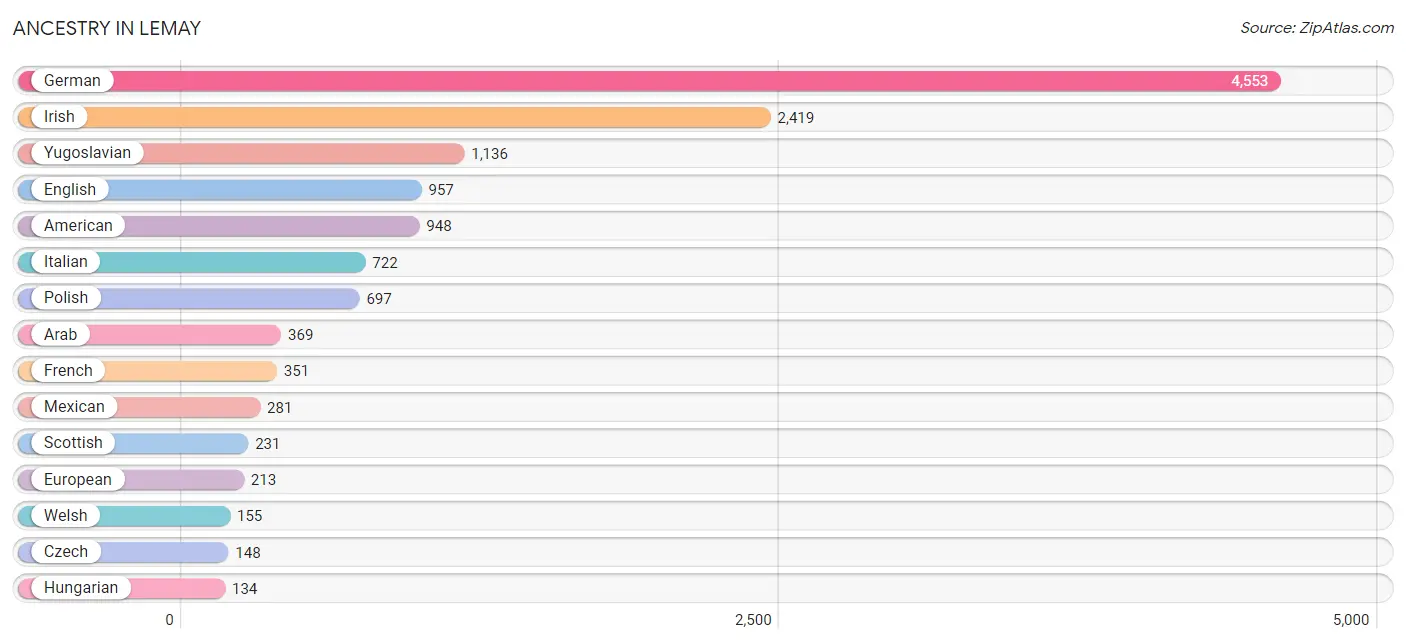
Ancestry in Lemay
The most populous ancestries reported in Lemay are German (4,553 | 28.1%), Irish (2,419 | 14.9%), Yugoslavian (1,136 | 7.0%), English (957 | 5.9%), and American (948 | 5.9%), together accounting for 61.8% of all Lemay residents.
| Ancestry | # Population | % Population |
| African | 15 | 0.1% |
| Albanian | 49 | 0.3% |
| American | 948 | 5.9% |
| Apache | 10 | 0.1% |
| Arab | 369 | 2.3% |
| Austrian | 51 | 0.3% |
| Bhutanese | 38 | 0.2% |
| Blackfeet | 6 | 0.0% |
| British | 47 | 0.3% |
| Burmese | 24 | 0.2% |
| Central American | 6 | 0.0% |
| Cherokee | 31 | 0.2% |
| Chilean | 71 | 0.4% |
| Chinese | 15 | 0.1% |
| Croatian | 10 | 0.1% |
| Czech | 148 | 0.9% |
| Czechoslovakian | 48 | 0.3% |
| Dutch | 102 | 0.6% |
| English | 957 | 5.9% |
| European | 213 | 1.3% |
| French | 351 | 2.2% |
| German | 4,553 | 28.1% |
| Greek | 74 | 0.5% |
| Guatemalan | 6 | 0.0% |
| Hungarian | 134 | 0.8% |
| Indonesian | 17 | 0.1% |
| Iraqi | 9 | 0.1% |
| Irish | 2,419 | 14.9% |
| Iroquois | 1 | 0.0% |
| Italian | 722 | 4.4% |
| Jamaican | 14 | 0.1% |
| Korean | 19 | 0.1% |
| Lebanese | 64 | 0.4% |
| Lithuanian | 13 | 0.1% |
| Mexican | 281 | 1.7% |
| Mexican American Indian | 23 | 0.1% |
| Norwegian | 11 | 0.1% |
| Polish | 697 | 4.3% |
| Puerto Rican | 19 | 0.1% |
| Romanian | 18 | 0.1% |
| Scandinavian | 28 | 0.2% |
| Scotch-Irish | 71 | 0.4% |
| Scottish | 231 | 1.4% |
| Serbian | 20 | 0.1% |
| Slovak | 16 | 0.1% |
| South American | 71 | 0.4% |
| Spanish | 55 | 0.3% |
| Sri Lankan | 88 | 0.5% |
| Subsaharan African | 101 | 0.6% |
| Swiss | 4 | 0.0% |
| Ukrainian | 62 | 0.4% |
| Welsh | 155 | 1.0% |
| Yugoslavian | 1,136 | 7.0% | View All 53 Rows |
Immigrants in Lemay
The most numerous immigrant groups reported in Lemay came from Europe (1,170 | 7.2%), Eastern Europe (1,112 | 6.9%), Bosnia and Herzegovina (1,007 | 6.2%), Asia (581 | 3.6%), and Iraq (373 | 2.3%), together accounting for 26.2% of all Lemay residents.
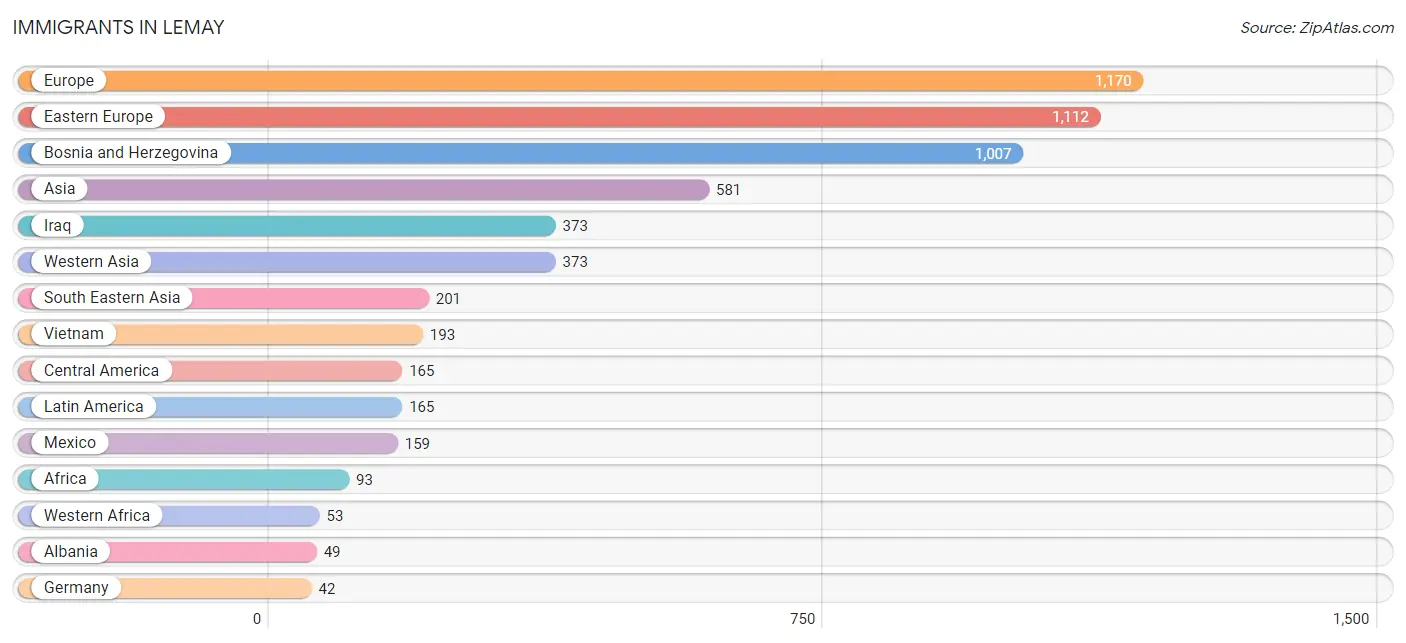
| Immigration Origin | # Population | % Population |
| Africa | 93 | 0.6% |
| Albania | 49 | 0.3% |
| Asia | 581 | 3.6% |
| Belarus | 26 | 0.2% |
| Bosnia and Herzegovina | 1,007 | 6.2% |
| Central America | 165 | 1.0% |
| Croatia | 15 | 0.1% |
| Eastern Asia | 7 | 0.0% |
| Eastern Europe | 1,112 | 6.9% |
| Europe | 1,170 | 7.2% |
| Fiji | 13 | 0.1% |
| Germany | 42 | 0.3% |
| Guatemala | 6 | 0.0% |
| Iraq | 373 | 2.3% |
| Italy | 16 | 0.1% |
| Korea | 7 | 0.0% |
| Latin America | 165 | 1.0% |
| Mexico | 159 | 1.0% |
| Middle Africa | 40 | 0.3% |
| Oceania | 13 | 0.1% |
| South Eastern Asia | 201 | 1.2% |
| Southern Europe | 16 | 0.1% |
| Thailand | 3 | 0.0% |
| Vietnam | 193 | 1.2% |
| Western Africa | 53 | 0.3% |
| Western Asia | 373 | 2.3% |
| Western Europe | 42 | 0.3% |
| Zaire | 40 | 0.3% | View All 28 Rows |
Sex and Age in Lemay
Sex and Age in Lemay
The most populous age groups in Lemay are 25 to 29 Years (793 | 10.0%) for men and 30 to 34 Years (730 | 8.9%) for women.
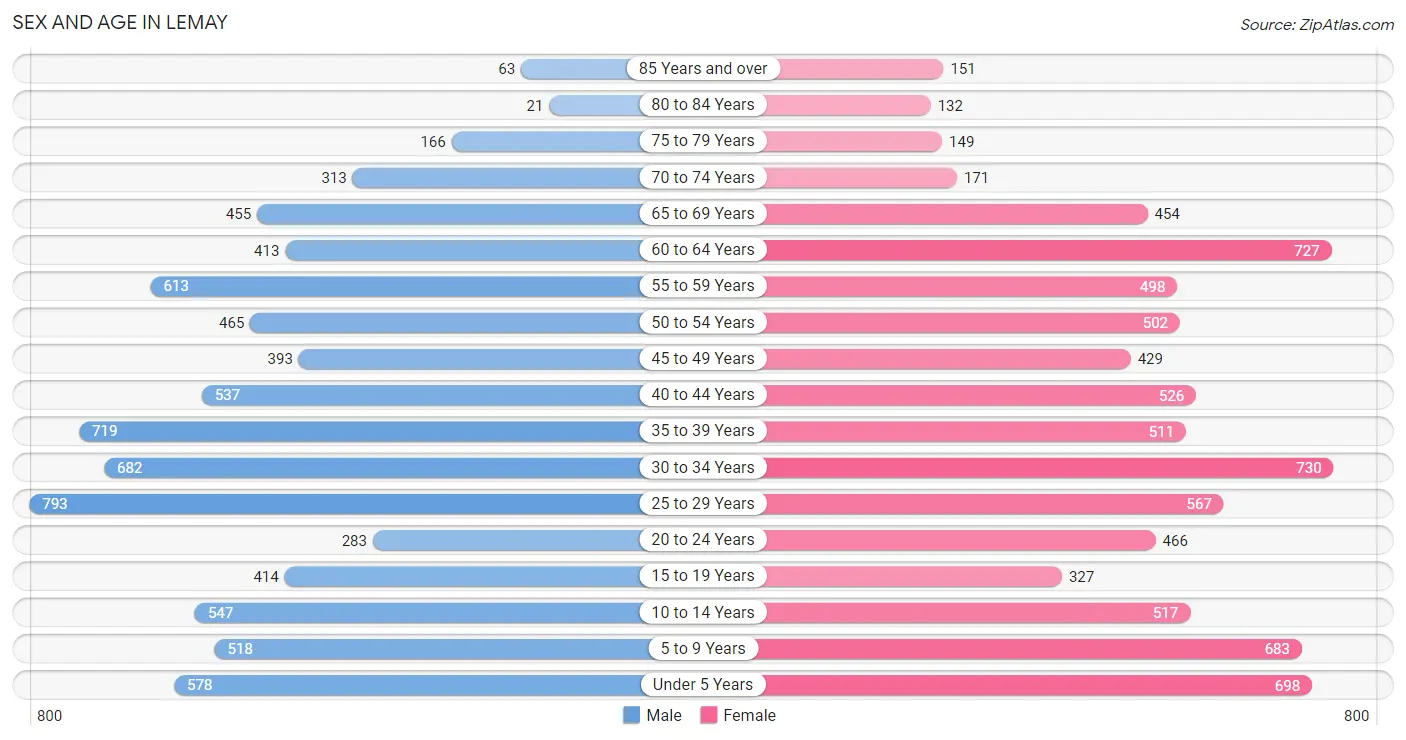
| Age Bracket | Male | Female |
| Under 5 Years | 578 (7.2%) | 698 (8.5%) |
| 5 to 9 Years | 518 (6.5%) | 683 (8.3%) |
| 10 to 14 Years | 547 (6.9%) | 517 (6.3%) |
| 15 to 19 Years | 414 (5.2%) | 327 (4.0%) |
| 20 to 24 Years | 283 (3.5%) | 466 (5.7%) |
| 25 to 29 Years | 793 (10.0%) | 567 (6.9%) |
| 30 to 34 Years | 682 (8.6%) | 730 (8.9%) |
| 35 to 39 Years | 719 (9.0%) | 511 (6.2%) |
| 40 to 44 Years | 537 (6.7%) | 526 (6.4%) |
| 45 to 49 Years | 393 (4.9%) | 429 (5.2%) |
| 50 to 54 Years | 465 (5.8%) | 502 (6.1%) |
| 55 to 59 Years | 613 (7.7%) | 498 (6.0%) |
| 60 to 64 Years | 413 (5.2%) | 727 (8.8%) |
| 65 to 69 Years | 455 (5.7%) | 454 (5.5%) |
| 70 to 74 Years | 313 (3.9%) | 171 (2.1%) |
| 75 to 79 Years | 166 (2.1%) | 149 (1.8%) |
| 80 to 84 Years | 21 (0.3%) | 132 (1.6%) |
| 85 Years and over | 63 (0.8%) | 151 (1.8%) |
| Total | 7,973 (100.0%) | 8,238 (100.0%) |
Families and Households in Lemay
Median Family Size in Lemay
The median family size in Lemay is 3.16 persons per family, with married-couple families (2,265 | 57.9%) accounting for the largest median family size of 3.23 persons per family. On the other hand, single female/mother families (806 | 20.6%) represent the smallest median family size with 3.05 persons per family.
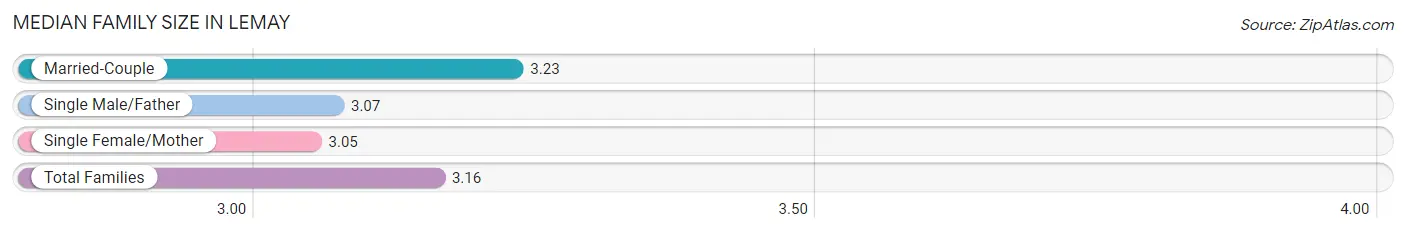
| Family Type | # Families | Family Size |
| Married-Couple | 2,265 (57.9%) | 3.23 |
| Single Male/Father | 844 (21.6%) | 3.07 |
| Single Female/Mother | 806 (20.6%) | 3.05 |
| Total Families | 3,915 (100.0%) | 3.16 |
Median Household Size in Lemay
The median household size in Lemay is 2.51 persons per household, with single male/father households (844 | 13.3%) accounting for the largest median household size of 3.61 persons per household. non-family households (2,438 | 38.4%) represent the smallest median household size with 1.18 persons per household.
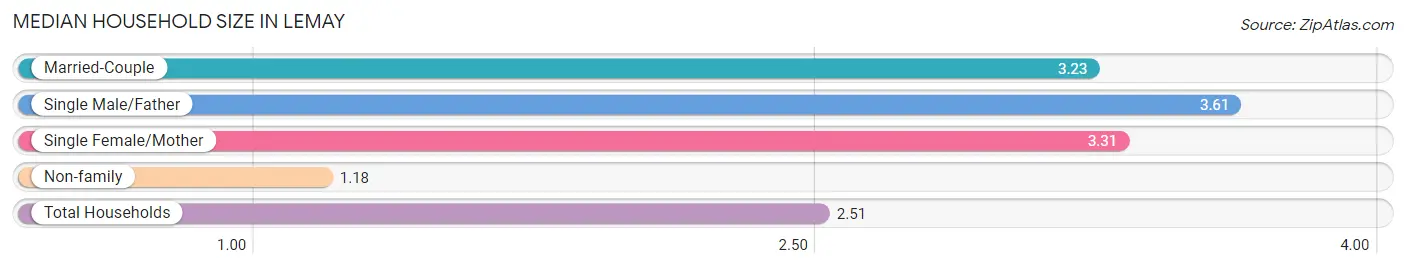
| Household Type | # Households | Household Size |
| Married-Couple | 2,265 (35.6%) | 3.23 |
| Single Male/Father | 844 (13.3%) | 3.61 |
| Single Female/Mother | 806 (12.7%) | 3.31 |
| Non-family | 2,438 (38.4%) | 1.18 |
| Total Households | 6,353 (100.0%) | 2.51 |
Household Size by Marriage Status in Lemay
Out of a total of 6,353 households in Lemay, 3,915 (61.6%) are family households, while 2,438 (38.4%) are nonfamily households. The most numerous type of family households are 2-person households, comprising 1,721, and the most common type of nonfamily households are 1-person households, comprising 2,014.
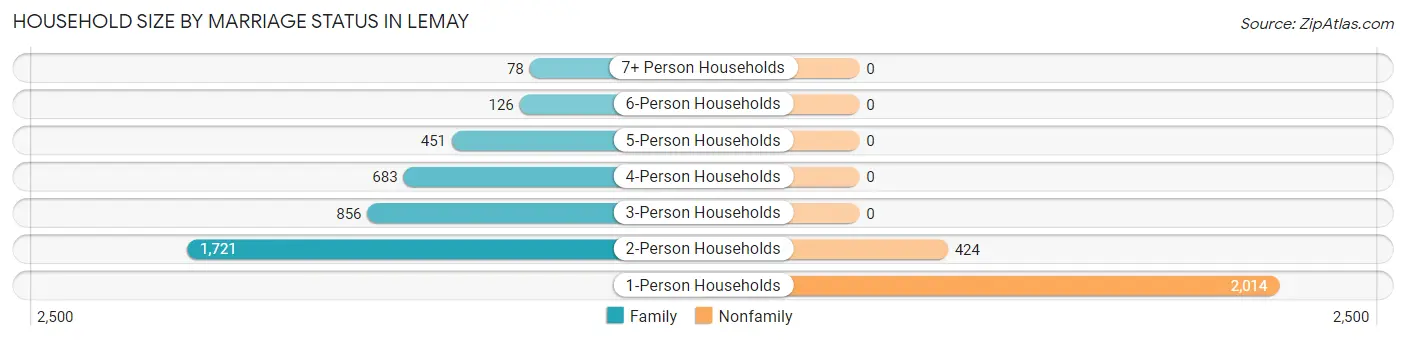
| Household Size | Family Households | Nonfamily Households |
| 1-Person Households | - | 2,014 (31.7%) |
| 2-Person Households | 1,721 (27.1%) | 424 (6.7%) |
| 3-Person Households | 856 (13.5%) | 0 (0.0%) |
| 4-Person Households | 683 (10.7%) | 0 (0.0%) |
| 5-Person Households | 451 (7.1%) | 0 (0.0%) |
| 6-Person Households | 126 (2.0%) | 0 (0.0%) |
| 7+ Person Households | 78 (1.2%) | 0 (0.0%) |
| Total | 3,915 (61.6%) | 2,438 (38.4%) |
Female Fertility in Lemay
Fertility by Age in Lemay
Average fertility rate in Lemay is 87.0 births per 1,000 women. Women in the age bracket of 20 to 34 years have the highest fertility rate with 151.0 births per 1,000 women. Women in the age bracket of 20 to 34 years acount for 83.4% of all women with births.
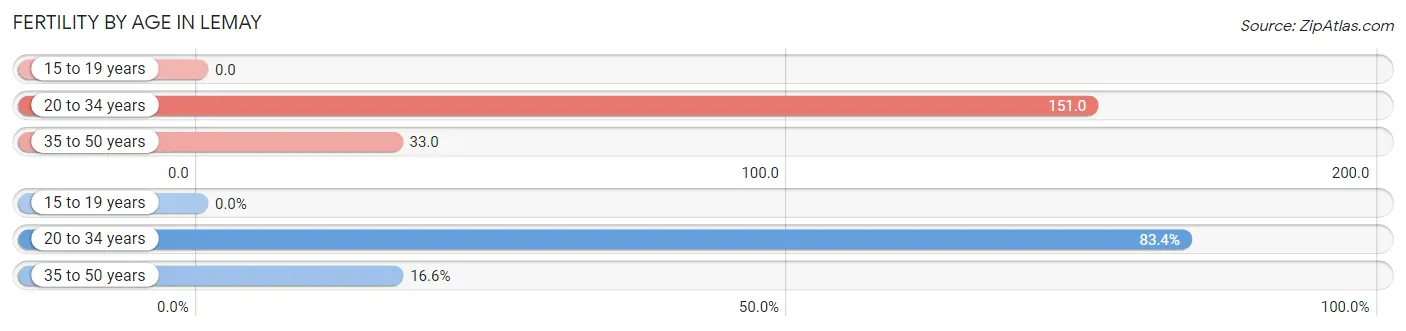
| Age Bracket | Women with Births | Births / 1,000 Women |
| 15 to 19 years | 0 (0.0%) | 0.0 |
| 20 to 34 years | 267 (83.4%) | 151.0 |
| 35 to 50 years | 53 (16.6%) | 33.0 |
| Total | 320 (100.0%) | 87.0 |
Fertility by Age by Marriage Status in Lemay
76.2% of women with births (320) in Lemay are married. The highest percentage of unmarried women with births falls into 35 to 50 years age bracket with 30.2% of them unmarried at the time of birth, while the lowest percentage of unmarried women with births belong to 20 to 34 years age bracket with 22.5% of them unmarried.
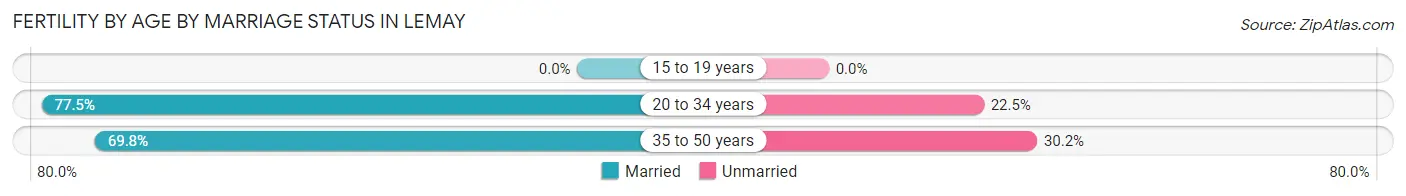
| Age Bracket | Married | Unmarried |
| 15 to 19 years | 0 (0.0%) | 0 (0.0%) |
| 20 to 34 years | 207 (77.5%) | 60 (22.5%) |
| 35 to 50 years | 37 (69.8%) | 16 (30.2%) |
| Total | 244 (76.2%) | 76 (23.7%) |
Fertility by Education in Lemay
Average fertility rate in Lemay is 87.0 births per 1,000 women. Women with the education attainment of high school diploma have the highest fertility rate of 134.0 births per 1,000 women, while women with the education attainment of bachelor's degree have the lowest fertility at 54.0 births per 1,000 women. Women with the education attainment of college or associate's degree represent 34.7% of all women with births.
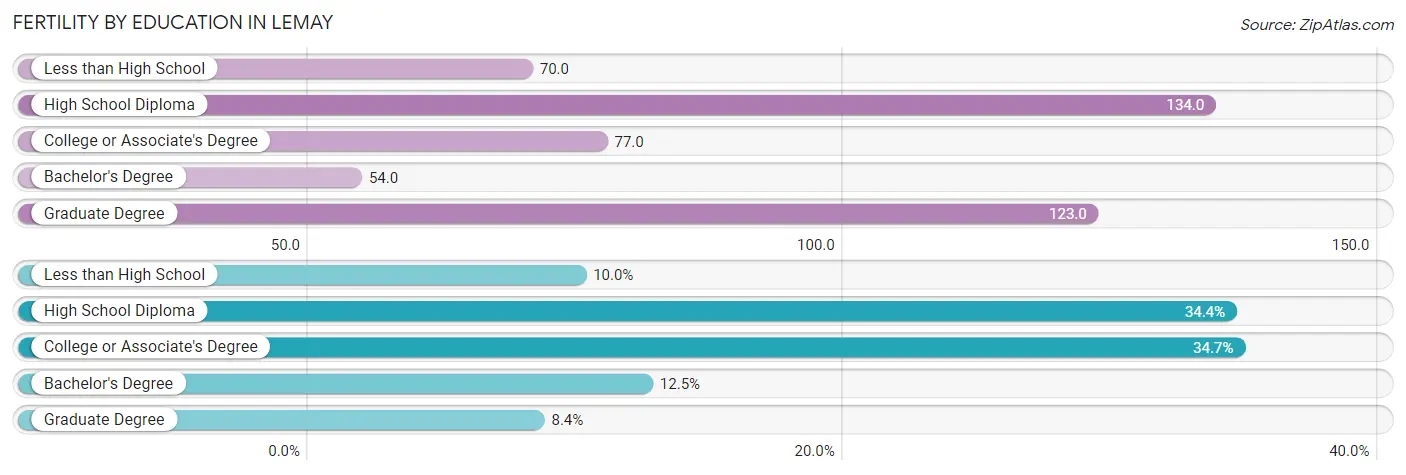
| Educational Attainment | Women with Births | Births / 1,000 Women |
| Less than High School | 32 (10.0%) | 70.0 |
| High School Diploma | 110 (34.4%) | 134.0 |
| College or Associate's Degree | 111 (34.7%) | 77.0 |
| Bachelor's Degree | 40 (12.5%) | 54.0 |
| Graduate Degree | 27 (8.4%) | 123.0 |
| Total | 320 (100.0%) | 87.0 |
Fertility by Education by Marriage Status in Lemay
23.7% of women with births in Lemay are unmarried. Women with the educational attainment of less than high school are most likely to be married with 100.0% of them married at childbirth, while women with the educational attainment of college or associate's degree are least likely to be married with 44.1% of them unmarried at childbirth.
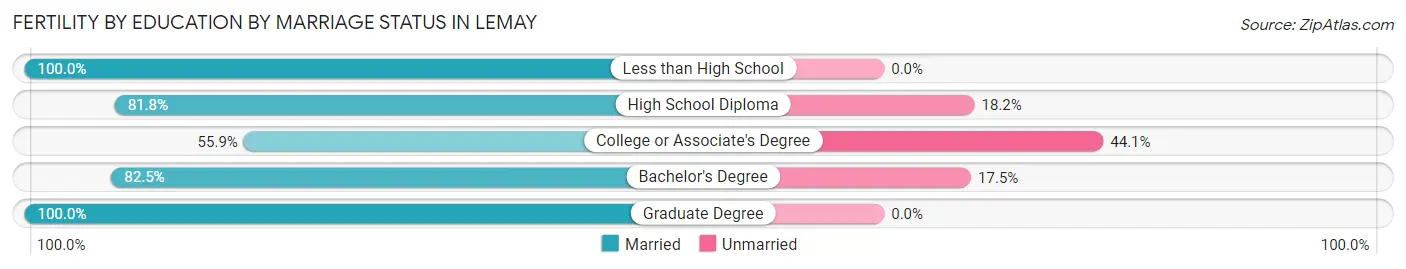
| Educational Attainment | Married | Unmarried |
| Less than High School | 32 (100.0%) | 0 (0.0%) |
| High School Diploma | 90 (81.8%) | 20 (18.2%) |
| College or Associate's Degree | 62 (55.9%) | 49 (44.1%) |
| Bachelor's Degree | 33 (82.5%) | 7 (17.5%) |
| Graduate Degree | 27 (100.0%) | 0 (0.0%) |
| Total | 244 (76.2%) | 76 (23.7%) |
Employment Characteristics in Lemay
Employment by Class of Employer in Lemay
Among the 7,719 employed individuals in Lemay, private company employees (5,429 | 70.3%), not-for-profit organizations (964 | 12.5%), and local government employees (471 | 6.1%) make up the most common classes of employment.
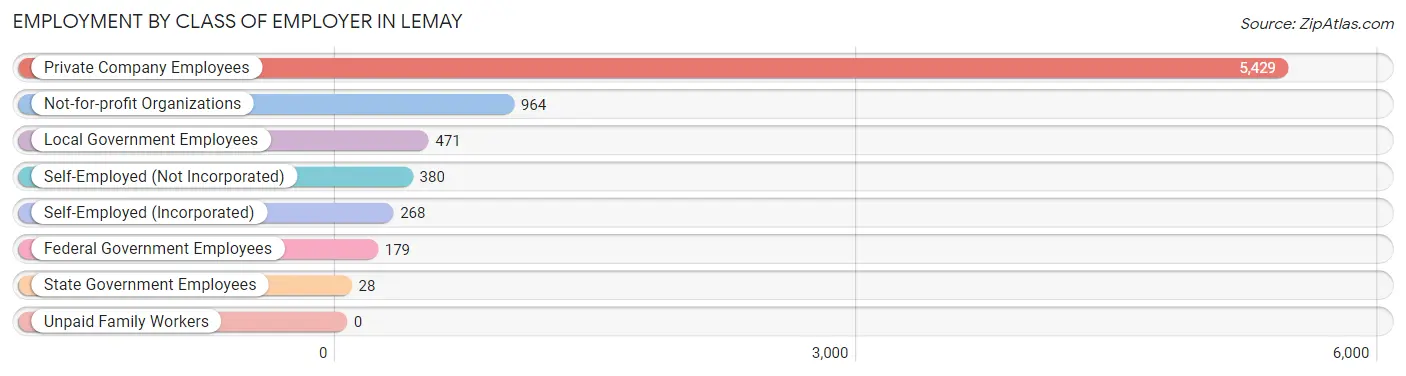
| Employer Class | # Employees | % Employees |
| Private Company Employees | 5,429 | 70.3% |
| Self-Employed (Incorporated) | 268 | 3.5% |
| Self-Employed (Not Incorporated) | 380 | 4.9% |
| Not-for-profit Organizations | 964 | 12.5% |
| Local Government Employees | 471 | 6.1% |
| State Government Employees | 28 | 0.4% |
| Federal Government Employees | 179 | 2.3% |
| Unpaid Family Workers | 0 | 0.0% |
| Total | 7,719 | 100.0% |
Employment Status by Age in Lemay
According to the labor force statistics for Lemay, out of the total population over 16 years of age (12,602), 65.8% or 8,292 individuals are in the labor force, with 4.3% or 357 of them unemployed. The age group with the highest labor force participation rate is 25 to 29 years, with 89.7% or 1,220 individuals in the labor force. Within the labor force, the 20 to 24 years age range has the highest percentage of unemployed individuals, with 12.9% or 82 of them being unemployed.
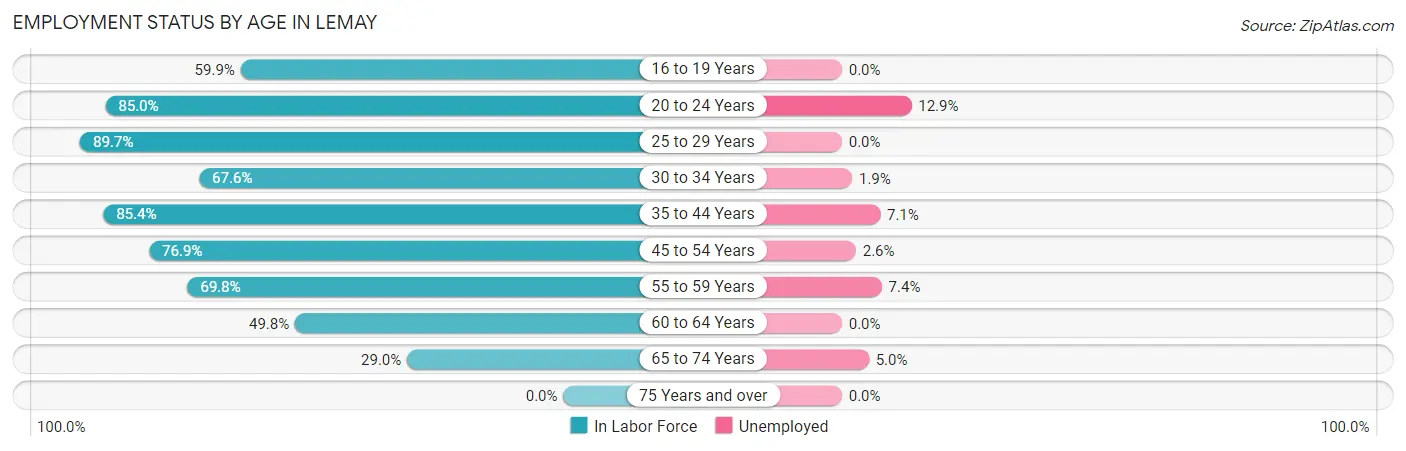
| Age Bracket | In Labor Force | Unemployed |
| 16 to 19 Years | 403 (59.9%) | 0 (0.0%) |
| 20 to 24 Years | 637 (85.0%) | 82 (12.9%) |
| 25 to 29 Years | 1,220 (89.7%) | 0 (0.0%) |
| 30 to 34 Years | 955 (67.6%) | 18 (1.9%) |
| 35 to 44 Years | 1,958 (85.4%) | 139 (7.1%) |
| 45 to 54 Years | 1,376 (76.9%) | 36 (2.6%) |
| 55 to 59 Years | 775 (69.8%) | 57 (7.4%) |
| 60 to 64 Years | 568 (49.8%) | 0 (0.0%) |
| 65 to 74 Years | 404 (29.0%) | 20 (5.0%) |
| 75 Years and over | 0 (0.0%) | 0 (0.0%) |
| Total | 8,292 (65.8%) | 357 (4.3%) |
Employment Status by Educational Attainment in Lemay
According to labor force statistics for Lemay, 75.3% of individuals (6,856) out of the total population between 25 and 64 years of age (9,105) are in the labor force, with 3.7% or 254 of them being unemployed. The group with the highest labor force participation rate are those with the educational attainment of bachelor's degree or higher, with 93.9% or 1,775 individuals in the labor force. Within the labor force, individuals with less than high school education have the highest percentage of unemployment, with 13.2% or 71 of them being unemployed.
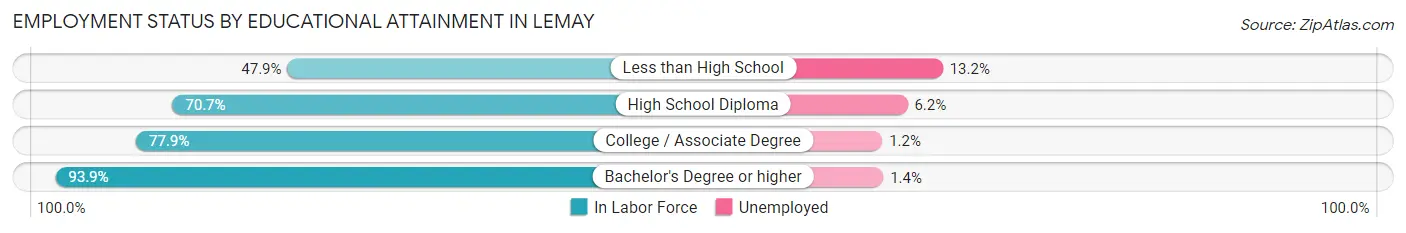
| Educational Attainment | In Labor Force | Unemployed |
| Less than High School | 536 (47.9%) | 148 (13.2%) |
| High School Diploma | 2,045 (70.7%) | 179 (6.2%) |
| College / Associate Degree | 2,495 (77.9%) | 38 (1.2%) |
| Bachelor's Degree or higher | 1,775 (93.9%) | 26 (1.4%) |
| Total | 6,856 (75.3%) | 337 (3.7%) |
Employment Occupations by Sex in Lemay
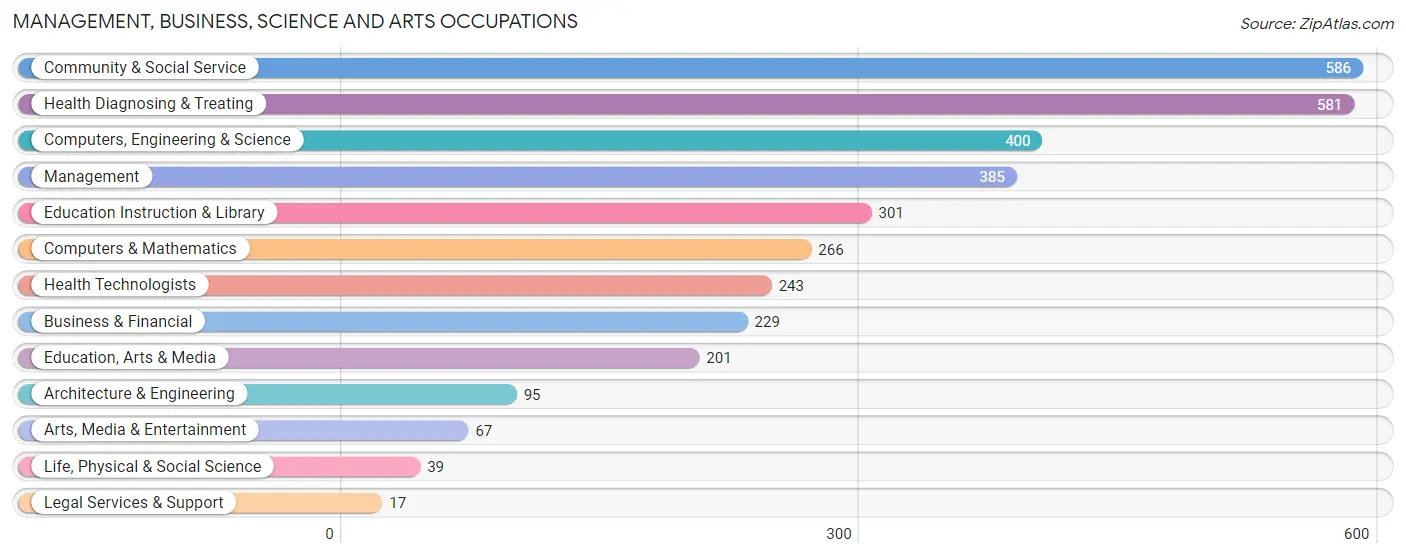
Management, Business, Science and Arts Occupations
The most common Management, Business, Science and Arts occupations in Lemay are Community & Social Service (586 | 7.4%), Health Diagnosing & Treating (581 | 7.4%), Computers, Engineering & Science (400 | 5.1%), Management (385 | 4.9%), and Education Instruction & Library (301 | 3.8%).
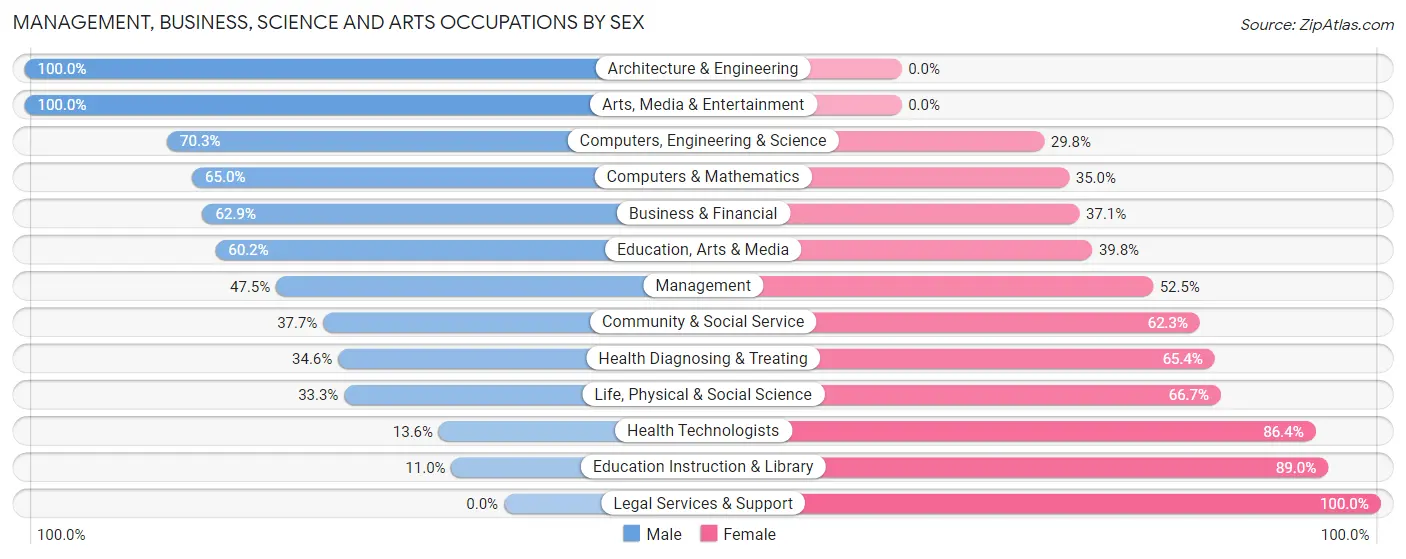
Management, Business, Science and Arts Occupations by Sex
Within the Management, Business, Science and Arts occupations in Lemay, the most male-oriented occupations are Architecture & Engineering (100.0%), Arts, Media & Entertainment (100.0%), and Computers, Engineering & Science (70.3%), while the most female-oriented occupations are Legal Services & Support (100.0%), Education Instruction & Library (89.0%), and Health Technologists (86.4%).
| Occupation | Male | Female |
| Management | 183 (47.5%) | 202 (52.5%) |
| Business & Financial | 144 (62.9%) | 85 (37.1%) |
| Computers, Engineering & Science | 281 (70.3%) | 119 (29.7%) |
| Computers & Mathematics | 173 (65.0%) | 93 (35.0%) |
| Architecture & Engineering | 95 (100.0%) | 0 (0.0%) |
| Life, Physical & Social Science | 13 (33.3%) | 26 (66.7%) |
| Community & Social Service | 221 (37.7%) | 365 (62.3%) |
| Education, Arts & Media | 121 (60.2%) | 80 (39.8%) |
| Legal Services & Support | 0 (0.0%) | 17 (100.0%) |
| Education Instruction & Library | 33 (11.0%) | 268 (89.0%) |
| Arts, Media & Entertainment | 67 (100.0%) | 0 (0.0%) |
| Health Diagnosing & Treating | 201 (34.6%) | 380 (65.4%) |
| Health Technologists | 33 (13.6%) | 210 (86.4%) |
| Total (Category) | 1,030 (47.2%) | 1,151 (52.8%) |
| Total (Overall) | 4,377 (55.4%) | 3,517 (44.6%) |
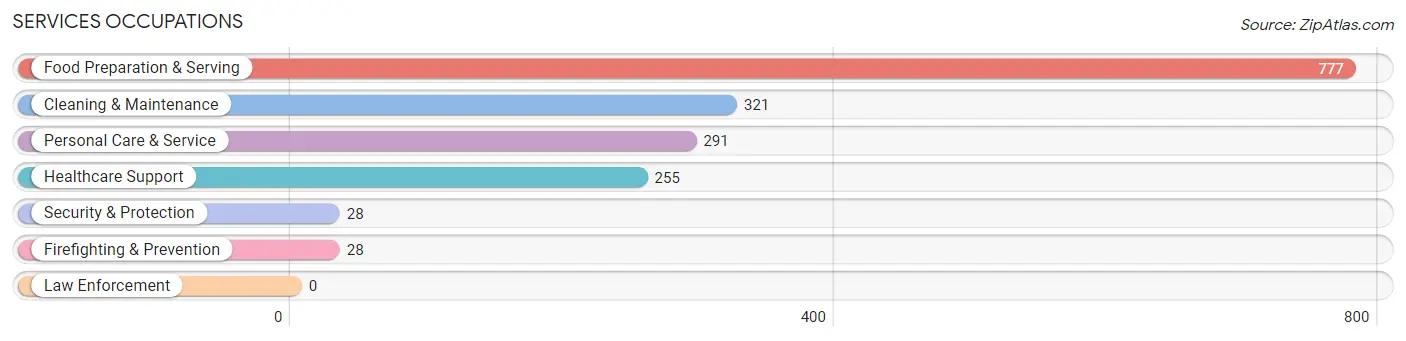
Services Occupations
The most common Services occupations in Lemay are Food Preparation & Serving (777 | 9.8%), Cleaning & Maintenance (321 | 4.1%), Personal Care & Service (291 | 3.7%), Healthcare Support (255 | 3.2%), and Security & Protection (28 | 0.4%).
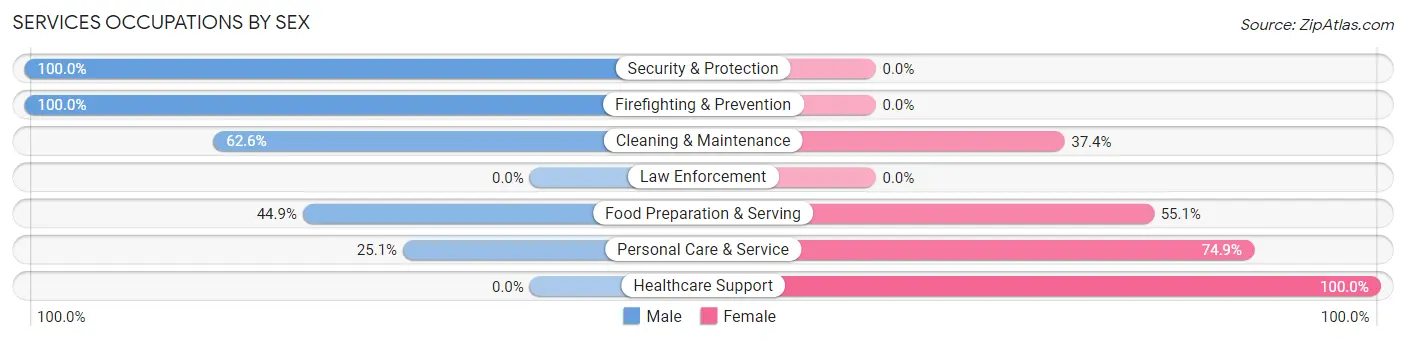
Services Occupations by Sex
Within the Services occupations in Lemay, the most male-oriented occupations are Security & Protection (100.0%), Firefighting & Prevention (100.0%), and Cleaning & Maintenance (62.6%), while the most female-oriented occupations are Healthcare Support (100.0%), Personal Care & Service (74.9%), and Food Preparation & Serving (55.1%).
| Occupation | Male | Female |
| Healthcare Support | 0 (0.0%) | 255 (100.0%) |
| Security & Protection | 28 (100.0%) | 0 (0.0%) |
| Firefighting & Prevention | 28 (100.0%) | 0 (0.0%) |
| Law Enforcement | 0 (0.0%) | 0 (0.0%) |
| Food Preparation & Serving | 349 (44.9%) | 428 (55.1%) |
| Cleaning & Maintenance | 201 (62.6%) | 120 (37.4%) |
| Personal Care & Service | 73 (25.1%) | 218 (74.9%) |
| Total (Category) | 651 (38.9%) | 1,021 (61.1%) |
| Total (Overall) | 4,377 (55.4%) | 3,517 (44.6%) |
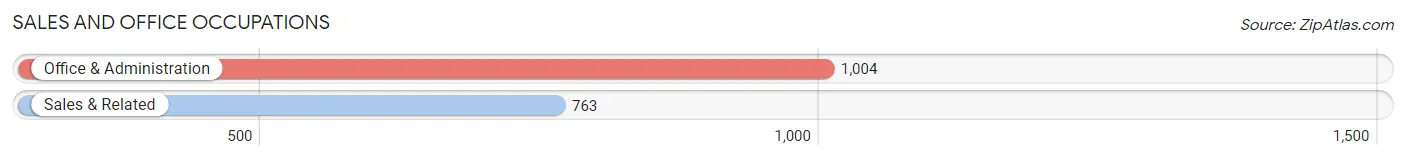
Sales and Office Occupations
The most common Sales and Office occupations in Lemay are Office & Administration (1,004 | 12.7%), and Sales & Related (763 | 9.7%).
Sales and Office Occupations by Sex
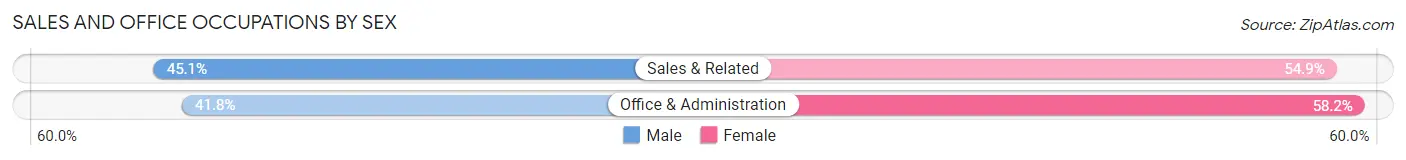
| Occupation | Male | Female |
| Sales & Related | 344 (45.1%) | 419 (54.9%) |
| Office & Administration | 420 (41.8%) | 584 (58.2%) |
| Total (Category) | 764 (43.2%) | 1,003 (56.8%) |
| Total (Overall) | 4,377 (55.4%) | 3,517 (44.6%) |
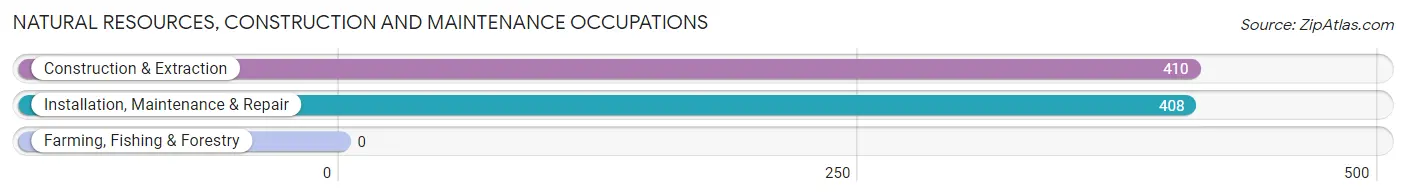
Natural Resources, Construction and Maintenance Occupations
The most common Natural Resources, Construction and Maintenance occupations in Lemay are Construction & Extraction (410 | 5.2%), and Installation, Maintenance & Repair (408 | 5.2%).
Natural Resources, Construction and Maintenance Occupations by Sex
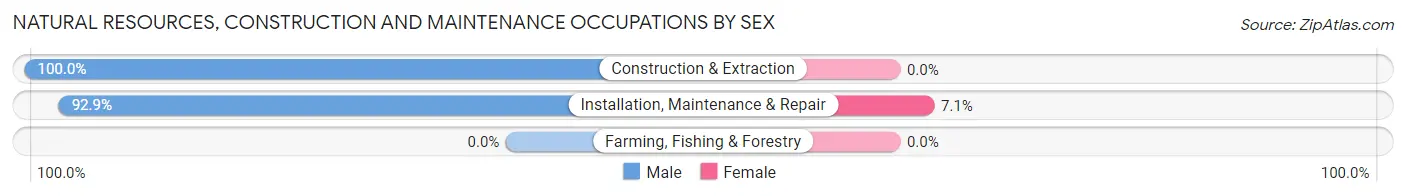
| Occupation | Male | Female |
| Farming, Fishing & Forestry | 0 (0.0%) | 0 (0.0%) |
| Construction & Extraction | 410 (100.0%) | 0 (0.0%) |
| Installation, Maintenance & Repair | 379 (92.9%) | 29 (7.1%) |
| Total (Category) | 789 (96.5%) | 29 (3.5%) |
| Total (Overall) | 4,377 (55.4%) | 3,517 (44.6%) |
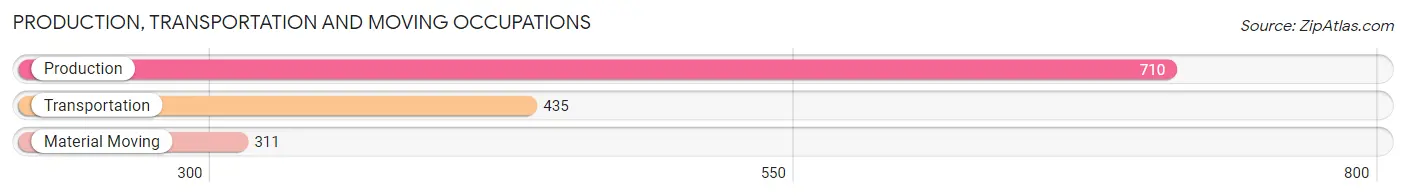
Production, Transportation and Moving Occupations
The most common Production, Transportation and Moving occupations in Lemay are Production (710 | 9.0%), Transportation (435 | 5.5%), and Material Moving (311 | 3.9%).
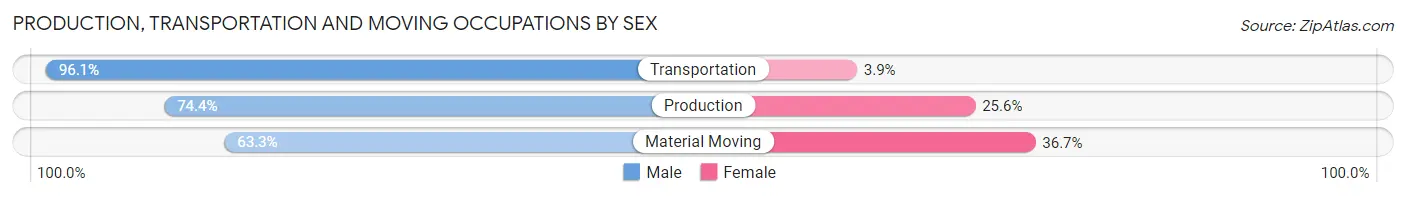
Production, Transportation and Moving Occupations by Sex
| Occupation | Male | Female |
| Production | 528 (74.4%) | 182 (25.6%) |
| Transportation | 418 (96.1%) | 17 (3.9%) |
| Material Moving | 197 (63.3%) | 114 (36.7%) |
| Total (Category) | 1,143 (78.5%) | 313 (21.5%) |
| Total (Overall) | 4,377 (55.4%) | 3,517 (44.6%) |
Employment Industries by Sex in Lemay
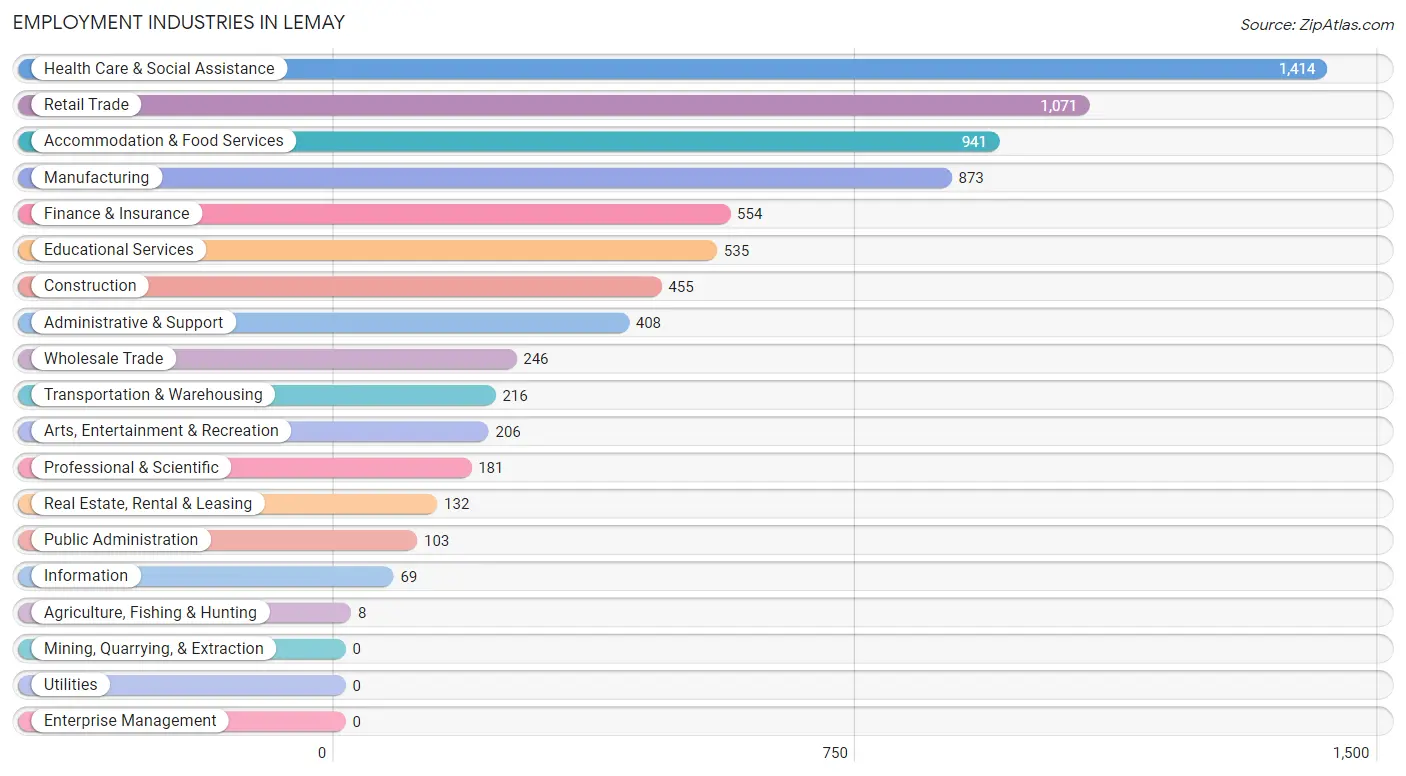
Employment Industries in Lemay
The major employment industries in Lemay include Health Care & Social Assistance (1,414 | 17.9%), Retail Trade (1,071 | 13.6%), Accommodation & Food Services (941 | 11.9%), Manufacturing (873 | 11.1%), and Finance & Insurance (554 | 7.0%).
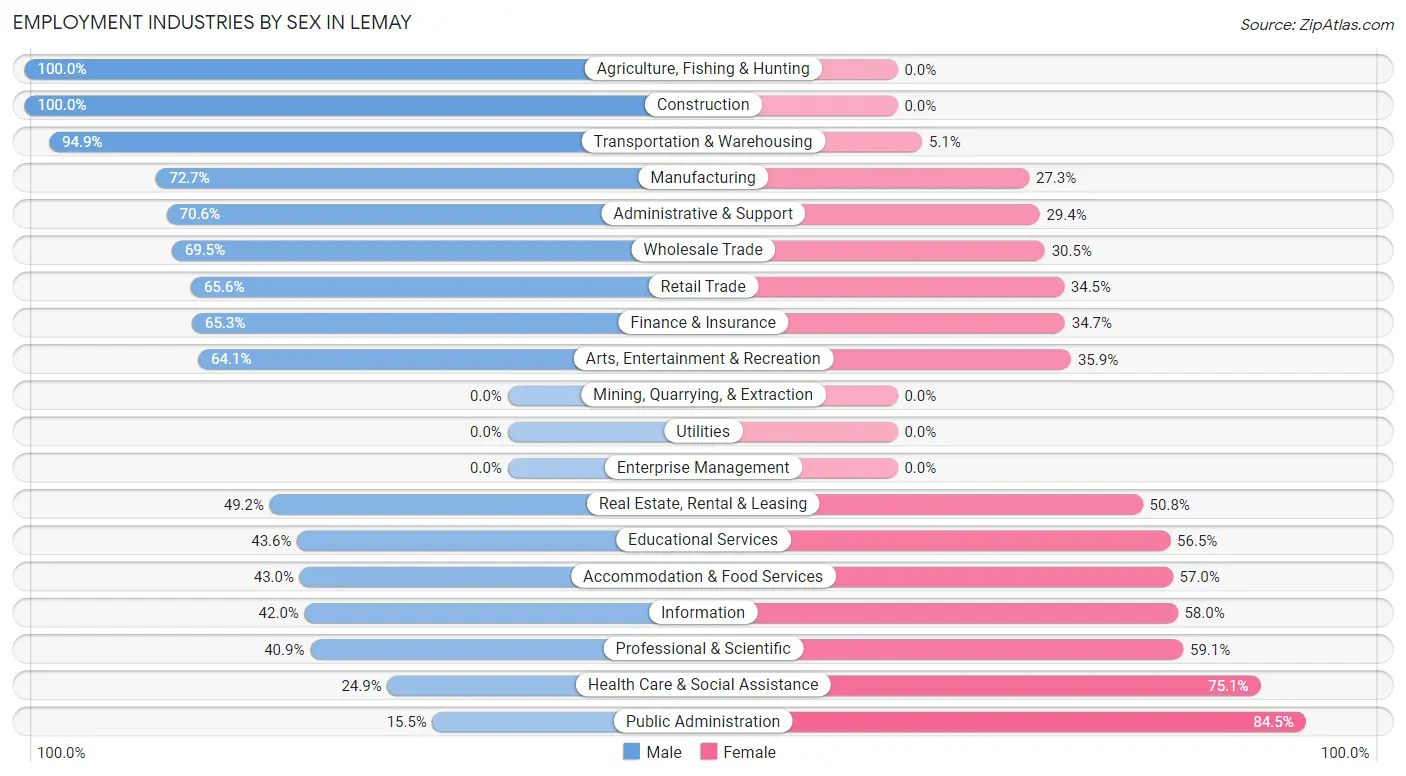
Employment Industries by Sex in Lemay
The Lemay industries that see more men than women are Agriculture, Fishing & Hunting (100.0%), Construction (100.0%), and Transportation & Warehousing (94.9%), whereas the industries that tend to have a higher number of women are Public Administration (84.5%), Health Care & Social Assistance (75.1%), and Professional & Scientific (59.1%).
| Industry | Male | Female |
| Agriculture, Fishing & Hunting | 8 (100.0%) | 0 (0.0%) |
| Mining, Quarrying, & Extraction | 0 (0.0%) | 0 (0.0%) |
| Construction | 455 (100.0%) | 0 (0.0%) |
| Manufacturing | 635 (72.7%) | 238 (27.3%) |
| Wholesale Trade | 171 (69.5%) | 75 (30.5%) |
| Retail Trade | 702 (65.5%) | 369 (34.4%) |
| Transportation & Warehousing | 205 (94.9%) | 11 (5.1%) |
| Utilities | 0 (0.0%) | 0 (0.0%) |
| Information | 29 (42.0%) | 40 (58.0%) |
| Finance & Insurance | 362 (65.3%) | 192 (34.7%) |
| Real Estate, Rental & Leasing | 65 (49.2%) | 67 (50.8%) |
| Professional & Scientific | 74 (40.9%) | 107 (59.1%) |
| Enterprise Management | 0 (0.0%) | 0 (0.0%) |
| Administrative & Support | 288 (70.6%) | 120 (29.4%) |
| Educational Services | 233 (43.5%) | 302 (56.5%) |
| Health Care & Social Assistance | 352 (24.9%) | 1,062 (75.1%) |
| Arts, Entertainment & Recreation | 132 (64.1%) | 74 (35.9%) |
| Accommodation & Food Services | 405 (43.0%) | 536 (57.0%) |
| Public Administration | 16 (15.5%) | 87 (84.5%) |
| Total | 4,377 (55.4%) | 3,517 (44.6%) |
Education in Lemay
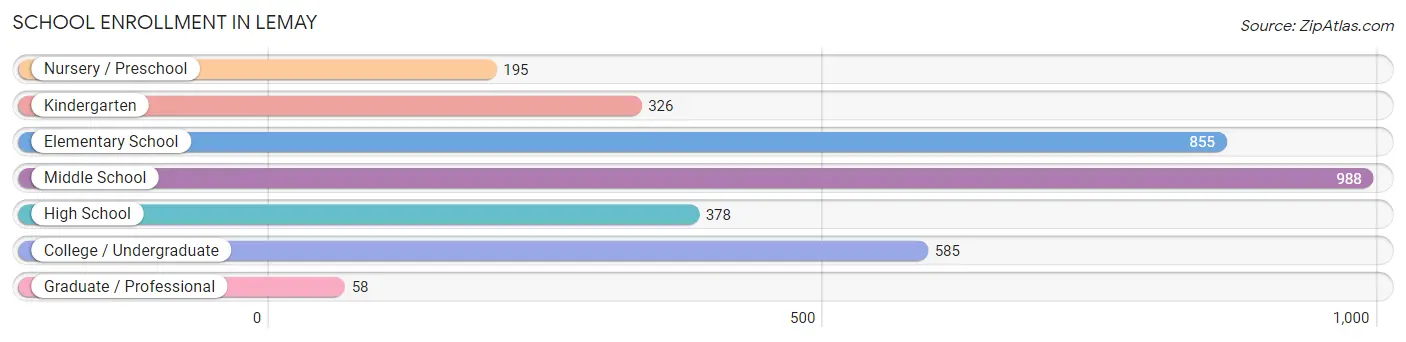
School Enrollment in Lemay
The most common levels of schooling among the 3,385 students in Lemay are middle school (988 | 29.2%), elementary school (855 | 25.3%), and college / undergraduate (585 | 17.3%).
| School Level | # Students | % Students |
| Nursery / Preschool | 195 | 5.8% |
| Kindergarten | 326 | 9.6% |
| Elementary School | 855 | 25.3% |
| Middle School | 988 | 29.2% |
| High School | 378 | 11.2% |
| College / Undergraduate | 585 | 17.3% |
| Graduate / Professional | 58 | 1.7% |
| Total | 3,385 | 100.0% |
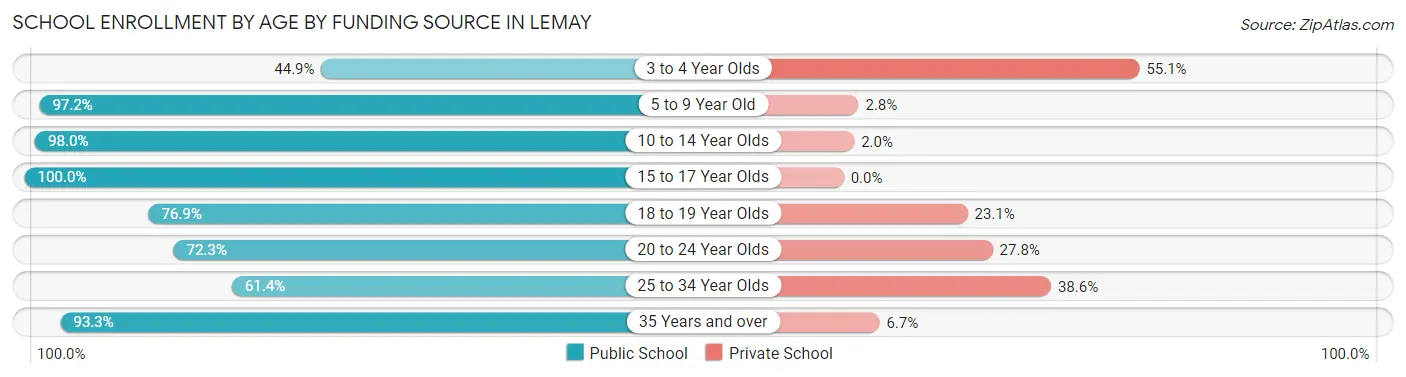
School Enrollment by Age by Funding Source in Lemay
Out of a total of 3,385 students who are enrolled in schools in Lemay, 332 (9.8%) attend a private institution, while the remaining 3,053 (90.2%) are enrolled in public schools. The age group of 3 to 4 year olds has the highest likelihood of being enrolled in private schools, with 92 (55.1% in the age bracket) enrolled. Conversely, the age group of 15 to 17 year olds has the lowest likelihood of being enrolled in a private school, with 198 (100.0% in the age bracket) attending a public institution.
| Age Bracket | Public School | Private School |
| 3 to 4 Year Olds | 75 (44.9%) | 92 (55.1%) |
| 5 to 9 Year Old | 1,124 (97.2%) | 32 (2.8%) |
| 10 to 14 Year Olds | 1,043 (98.0%) | 21 (2.0%) |
| 15 to 17 Year Olds | 198 (100.0%) | 0 (0.0%) |
| 18 to 19 Year Olds | 150 (76.9%) | 45 (23.1%) |
| 20 to 24 Year Olds | 138 (72.3%) | 53 (27.8%) |
| 25 to 34 Year Olds | 116 (61.4%) | 73 (38.6%) |
| 35 Years and over | 210 (93.3%) | 15 (6.7%) |
| Total | 3,053 (90.2%) | 332 (9.8%) |
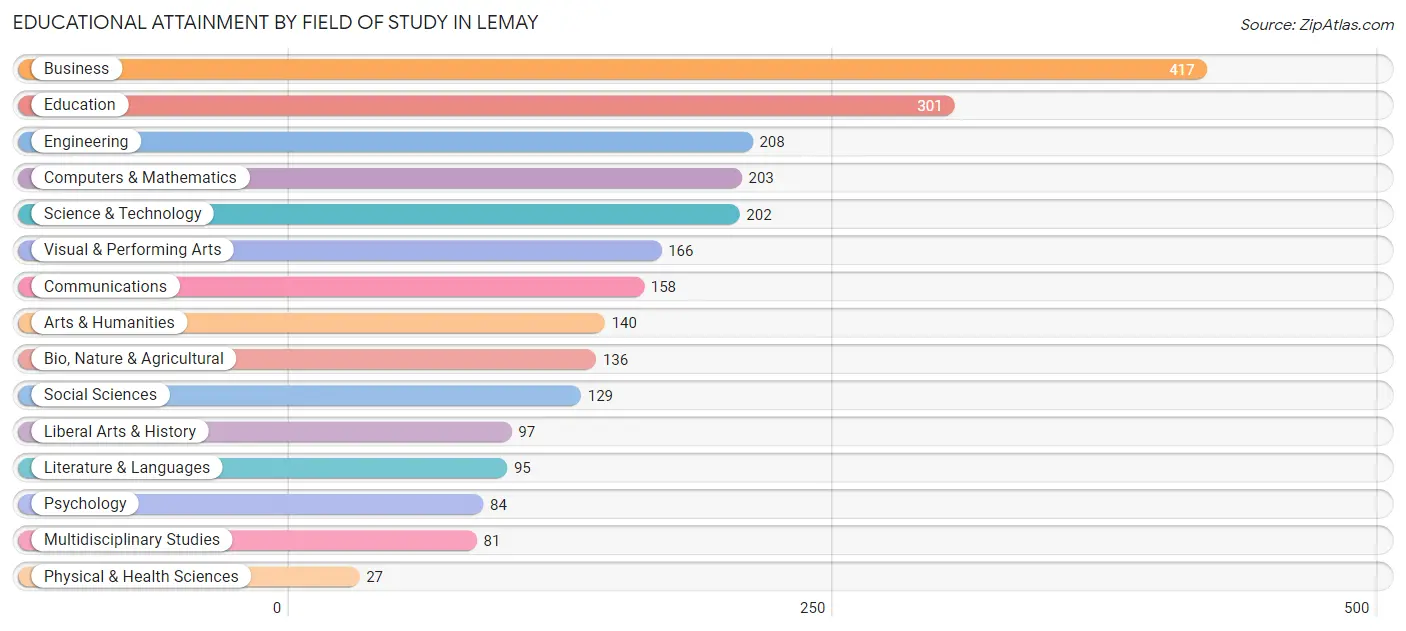
Educational Attainment by Field of Study in Lemay
Business (417 | 17.1%), education (301 | 12.3%), engineering (208 | 8.5%), computers & mathematics (203 | 8.3%), and science & technology (202 | 8.3%) are the most common fields of study among 2,444 individuals in Lemay who have obtained a bachelor's degree or higher.
| Field of Study | # Graduates | % Graduates |
| Computers & Mathematics | 203 | 8.3% |
| Bio, Nature & Agricultural | 136 | 5.6% |
| Physical & Health Sciences | 27 | 1.1% |
| Psychology | 84 | 3.4% |
| Social Sciences | 129 | 5.3% |
| Engineering | 208 | 8.5% |
| Multidisciplinary Studies | 81 | 3.3% |
| Science & Technology | 202 | 8.3% |
| Business | 417 | 17.1% |
| Education | 301 | 12.3% |
| Literature & Languages | 95 | 3.9% |
| Liberal Arts & History | 97 | 4.0% |
| Visual & Performing Arts | 166 | 6.8% |
| Communications | 158 | 6.5% |
| Arts & Humanities | 140 | 5.7% |
| Total | 2,444 | 100.0% |
Transportation & Commute in Lemay
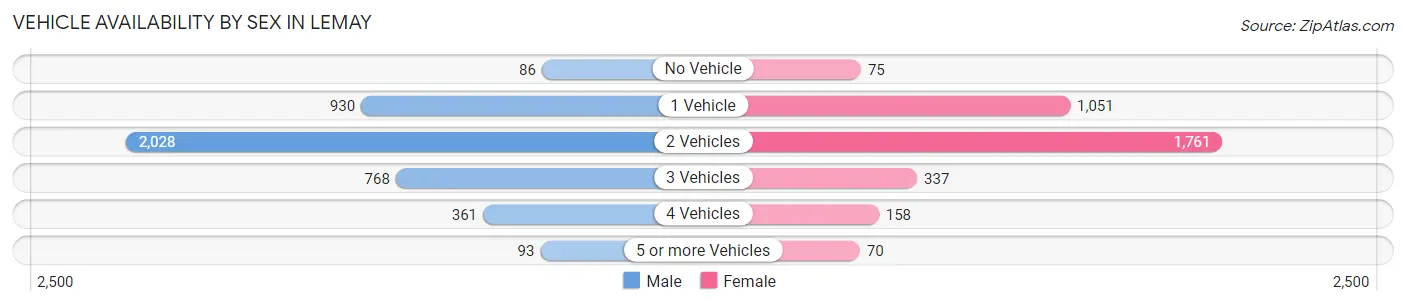
Vehicle Availability by Sex in Lemay
The most prevalent vehicle ownership categories in Lemay are males with 2 vehicles (2,028, accounting for 47.5%) and females with 2 vehicles (1,761, making up 58.8%).
| Vehicles Available | Male | Female |
| No Vehicle | 86 (2.0%) | 75 (2.2%) |
| 1 Vehicle | 930 (21.8%) | 1,051 (30.4%) |
| 2 Vehicles | 2,028 (47.5%) | 1,761 (51.0%) |
| 3 Vehicles | 768 (18.0%) | 337 (9.8%) |
| 4 Vehicles | 361 (8.5%) | 158 (4.6%) |
| 5 or more Vehicles | 93 (2.2%) | 70 (2.0%) |
| Total | 4,266 (100.0%) | 3,452 (100.0%) |
Commute Time in Lemay
The most frequently occuring commute durations in Lemay are 20 to 24 minutes (1,517 commuters, 21.5%), 30 to 34 minutes (1,319 commuters, 18.7%), and 15 to 19 minutes (1,269 commuters, 18.0%).
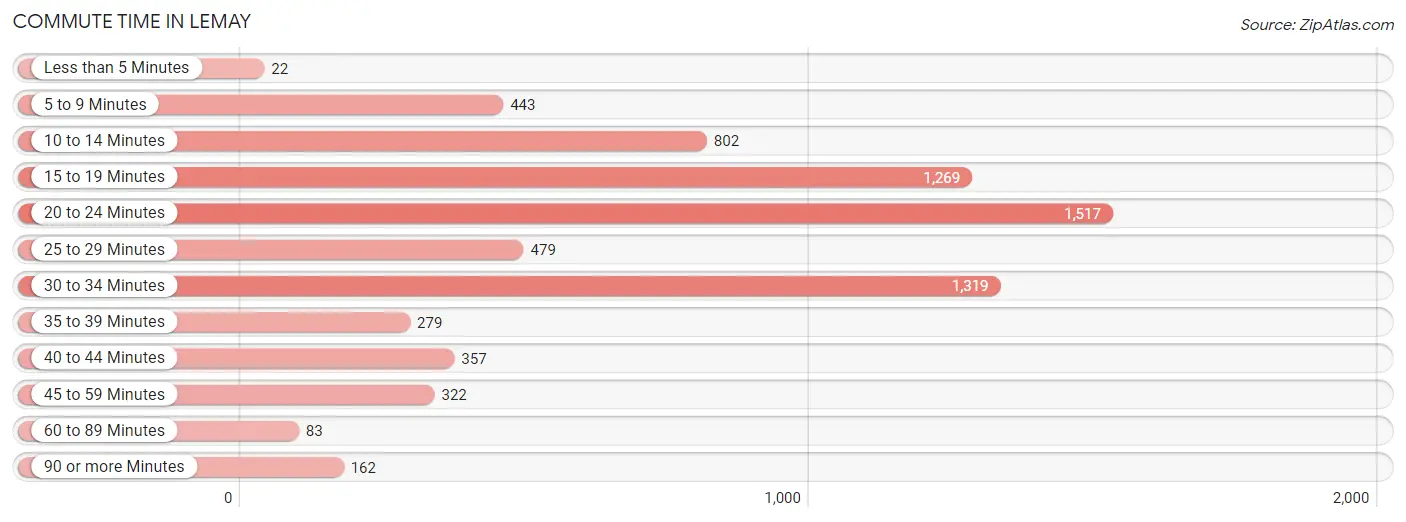
| Commute Time | # Commuters | % Commuters |
| Less than 5 Minutes | 22 | 0.3% |
| 5 to 9 Minutes | 443 | 6.3% |
| 10 to 14 Minutes | 802 | 11.4% |
| 15 to 19 Minutes | 1,269 | 18.0% |
| 20 to 24 Minutes | 1,517 | 21.5% |
| 25 to 29 Minutes | 479 | 6.8% |
| 30 to 34 Minutes | 1,319 | 18.7% |
| 35 to 39 Minutes | 279 | 4.0% |
| 40 to 44 Minutes | 357 | 5.1% |
| 45 to 59 Minutes | 322 | 4.6% |
| 60 to 89 Minutes | 83 | 1.2% |
| 90 or more Minutes | 162 | 2.3% |
Commute Time by Sex in Lemay
The most common commute times in Lemay are 30 to 34 minutes (827 commuters, 21.3%) for males and 20 to 24 minutes (774 commuters, 24.4%) for females.
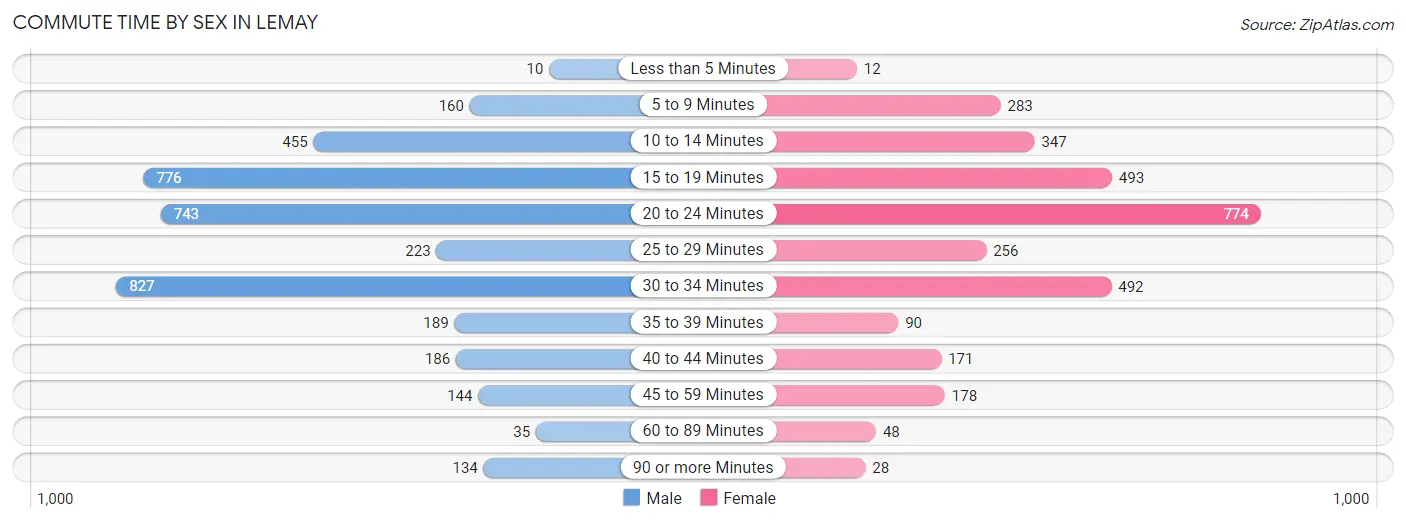
| Commute Time | Male | Female |
| Less than 5 Minutes | 10 (0.3%) | 12 (0.4%) |
| 5 to 9 Minutes | 160 (4.1%) | 283 (8.9%) |
| 10 to 14 Minutes | 455 (11.7%) | 347 (10.9%) |
| 15 to 19 Minutes | 776 (20.0%) | 493 (15.5%) |
| 20 to 24 Minutes | 743 (19.1%) | 774 (24.4%) |
| 25 to 29 Minutes | 223 (5.7%) | 256 (8.1%) |
| 30 to 34 Minutes | 827 (21.3%) | 492 (15.5%) |
| 35 to 39 Minutes | 189 (4.9%) | 90 (2.8%) |
| 40 to 44 Minutes | 186 (4.8%) | 171 (5.4%) |
| 45 to 59 Minutes | 144 (3.7%) | 178 (5.6%) |
| 60 to 89 Minutes | 35 (0.9%) | 48 (1.5%) |
| 90 or more Minutes | 134 (3.5%) | 28 (0.9%) |
Time of Departure to Work by Sex in Lemay
The most frequent times of departure to work in Lemay are 7:30 AM to 7:59 AM (572, 14.7%) for males and 6:30 AM to 6:59 AM (535, 16.9%) for females.
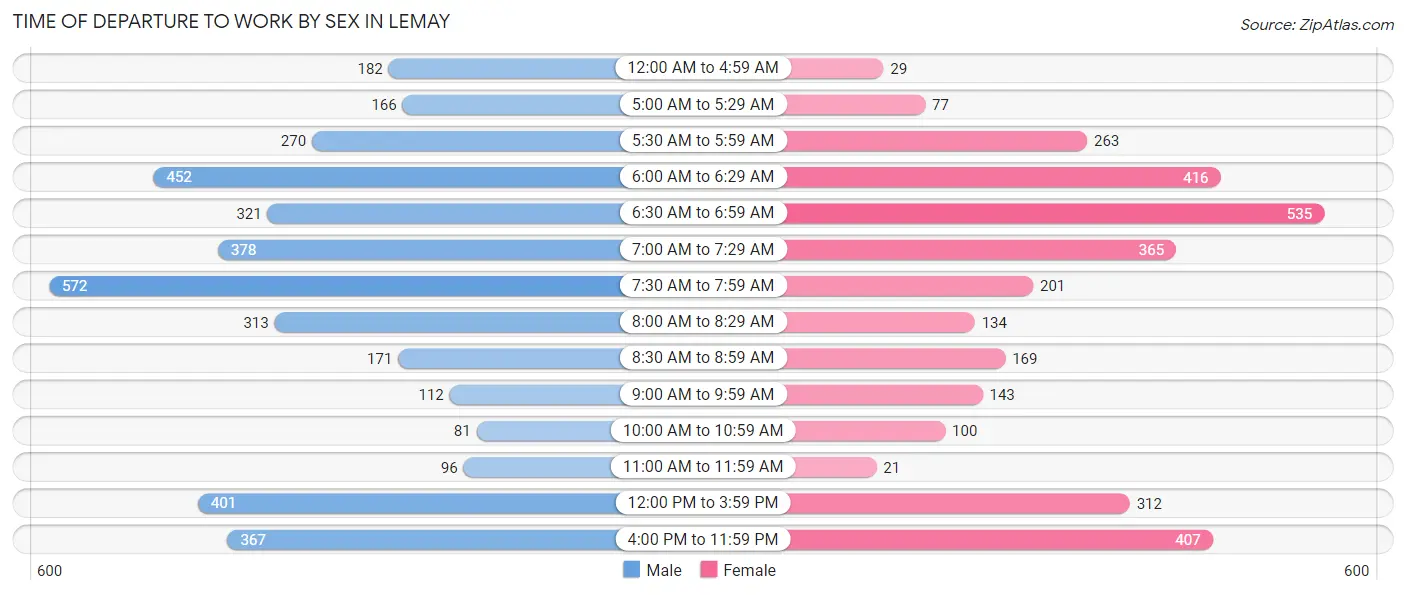
| Time of Departure | Male | Female |
| 12:00 AM to 4:59 AM | 182 (4.7%) | 29 (0.9%) |
| 5:00 AM to 5:29 AM | 166 (4.3%) | 77 (2.4%) |
| 5:30 AM to 5:59 AM | 270 (7.0%) | 263 (8.3%) |
| 6:00 AM to 6:29 AM | 452 (11.6%) | 416 (13.1%) |
| 6:30 AM to 6:59 AM | 321 (8.3%) | 535 (16.9%) |
| 7:00 AM to 7:29 AM | 378 (9.7%) | 365 (11.5%) |
| 7:30 AM to 7:59 AM | 572 (14.7%) | 201 (6.3%) |
| 8:00 AM to 8:29 AM | 313 (8.1%) | 134 (4.2%) |
| 8:30 AM to 8:59 AM | 171 (4.4%) | 169 (5.3%) |
| 9:00 AM to 9:59 AM | 112 (2.9%) | 143 (4.5%) |
| 10:00 AM to 10:59 AM | 81 (2.1%) | 100 (3.2%) |
| 11:00 AM to 11:59 AM | 96 (2.5%) | 21 (0.7%) |
| 12:00 PM to 3:59 PM | 401 (10.3%) | 312 (9.8%) |
| 4:00 PM to 11:59 PM | 367 (9.5%) | 407 (12.8%) |
| Total | 3,882 (100.0%) | 3,172 (100.0%) |
Housing Occupancy in Lemay
Occupancy by Ownership in Lemay
Of the total 6,353 dwellings in Lemay, owner-occupied units account for 4,898 (77.1%), while renter-occupied units make up 1,455 (22.9%).
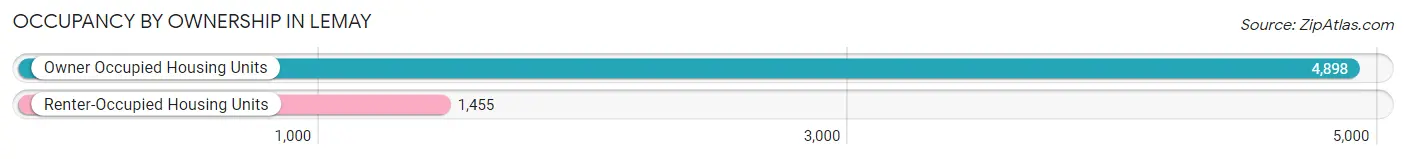
| Occupancy | # Housing Units | % Housing Units |
| Owner Occupied Housing Units | 4,898 | 77.1% |
| Renter-Occupied Housing Units | 1,455 | 22.9% |
| Total Occupied Housing Units | 6,353 | 100.0% |
Occupancy by Household Size in Lemay
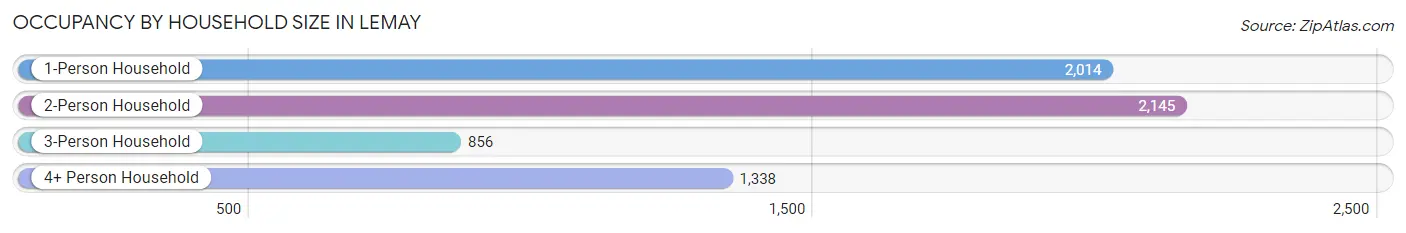
| Household Size | # Housing Units | % Housing Units |
| 1-Person Household | 2,014 | 31.7% |
| 2-Person Household | 2,145 | 33.8% |
| 3-Person Household | 856 | 13.5% |
| 4+ Person Household | 1,338 | 21.1% |
| Total Housing Units | 6,353 | 100.0% |
Occupancy by Ownership by Household Size in Lemay
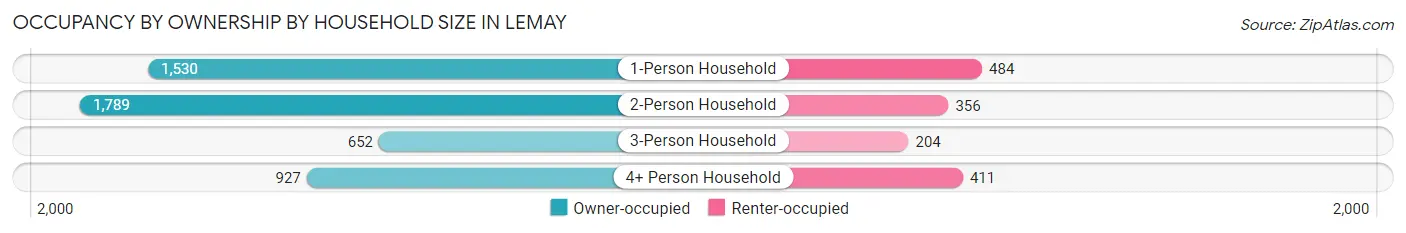
| Household Size | Owner-occupied | Renter-occupied |
| 1-Person Household | 1,530 (76.0%) | 484 (24.0%) |
| 2-Person Household | 1,789 (83.4%) | 356 (16.6%) |
| 3-Person Household | 652 (76.2%) | 204 (23.8%) |
| 4+ Person Household | 927 (69.3%) | 411 (30.7%) |
| Total Housing Units | 4,898 (77.1%) | 1,455 (22.9%) |
Occupancy by Educational Attainment in Lemay
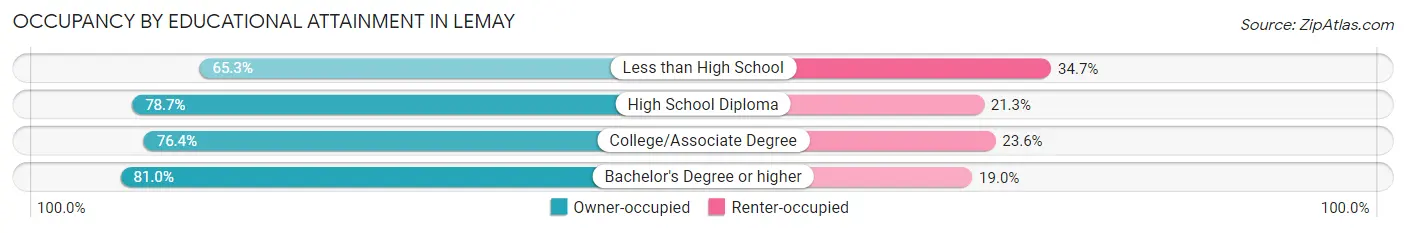
| Household Size | Owner-occupied | Renter-occupied |
| Less than High School | 450 (65.3%) | 239 (34.7%) |
| High School Diploma | 1,626 (78.7%) | 441 (21.3%) |
| College/Associate Degree | 1,499 (76.4%) | 464 (23.6%) |
| Bachelor's Degree or higher | 1,323 (81.0%) | 311 (19.0%) |
Occupancy by Age of Householder in Lemay
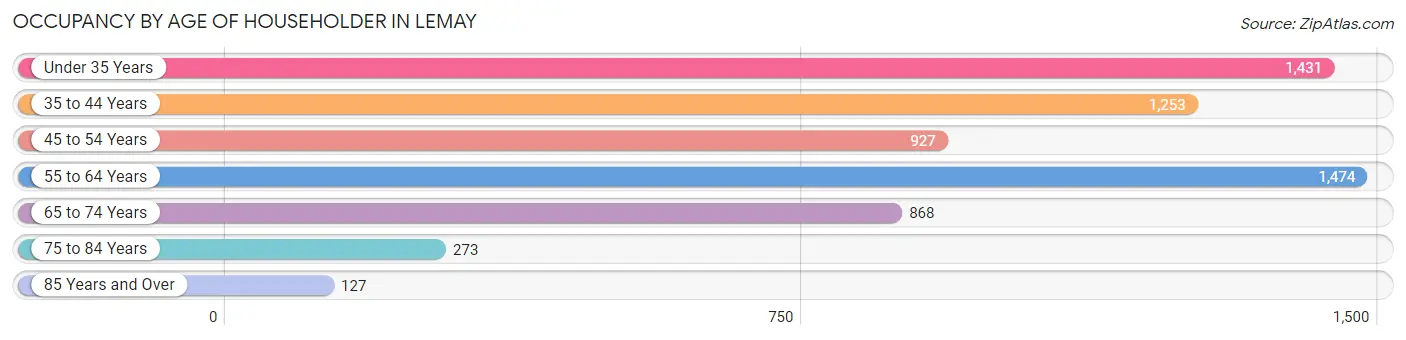
| Age Bracket | # Households | % Households |
| Under 35 Years | 1,431 | 22.5% |
| 35 to 44 Years | 1,253 | 19.7% |
| 45 to 54 Years | 927 | 14.6% |
| 55 to 64 Years | 1,474 | 23.2% |
| 65 to 74 Years | 868 | 13.7% |
| 75 to 84 Years | 273 | 4.3% |
| 85 Years and Over | 127 | 2.0% |
| Total | 6,353 | 100.0% |
Housing Finances in Lemay
Median Income by Occupancy in Lemay
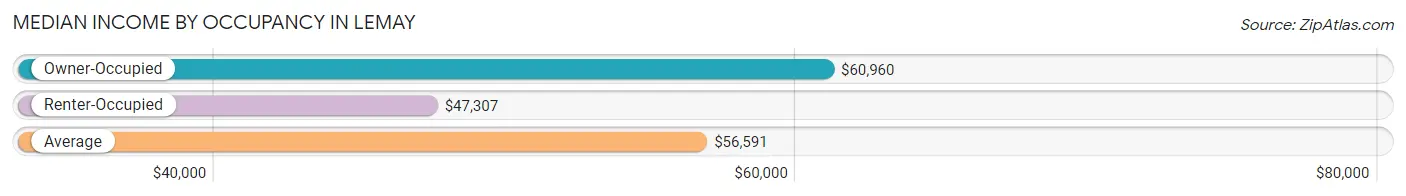
| Occupancy Type | # Households | Median Income |
| Owner-Occupied | 4,898 (77.1%) | $60,960 |
| Renter-Occupied | 1,455 (22.9%) | $47,307 |
| Average | 6,353 (100.0%) | $56,591 |
Occupancy by Householder Income Bracket in Lemay
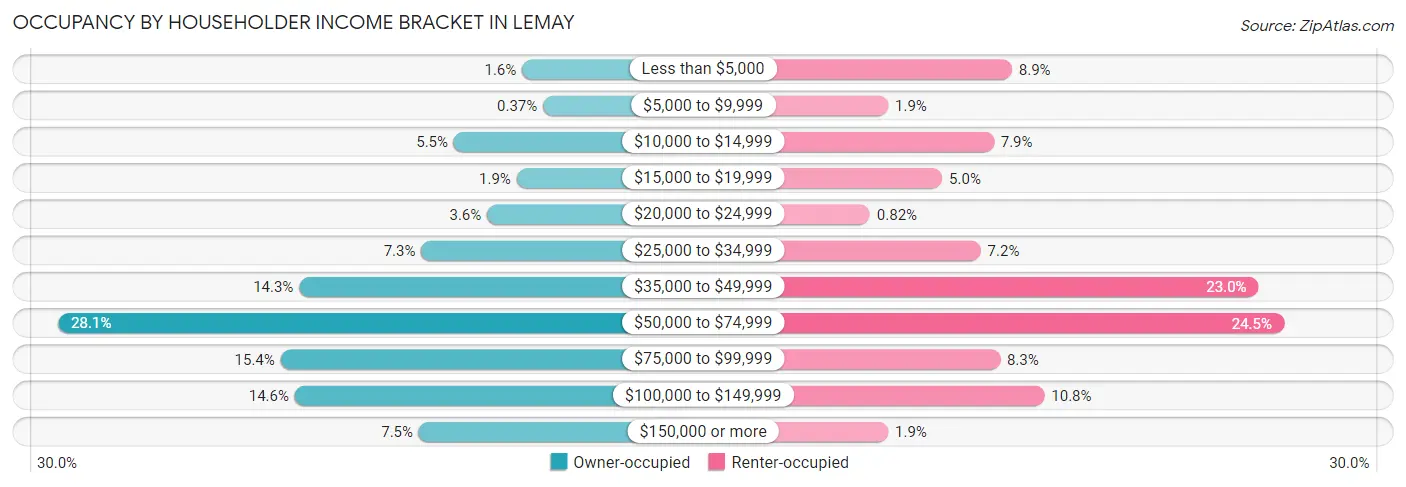
| Income Bracket | Owner-occupied | Renter-occupied |
| Less than $5,000 | 77 (1.6%) | 130 (8.9%) |
| $5,000 to $9,999 | 18 (0.4%) | 27 (1.9%) |
| $10,000 to $14,999 | 268 (5.5%) | 115 (7.9%) |
| $15,000 to $19,999 | 92 (1.9%) | 72 (5.0%) |
| $20,000 to $24,999 | 175 (3.6%) | 12 (0.8%) |
| $25,000 to $34,999 | 359 (7.3%) | 104 (7.1%) |
| $35,000 to $49,999 | 701 (14.3%) | 335 (23.0%) |
| $50,000 to $74,999 | 1,376 (28.1%) | 356 (24.5%) |
| $75,000 to $99,999 | 753 (15.4%) | 120 (8.3%) |
| $100,000 to $149,999 | 713 (14.6%) | 157 (10.8%) |
| $150,000 or more | 366 (7.5%) | 27 (1.9%) |
| Total | 4,898 (100.0%) | 1,455 (100.0%) |
Monthly Housing Cost Tiers in Lemay
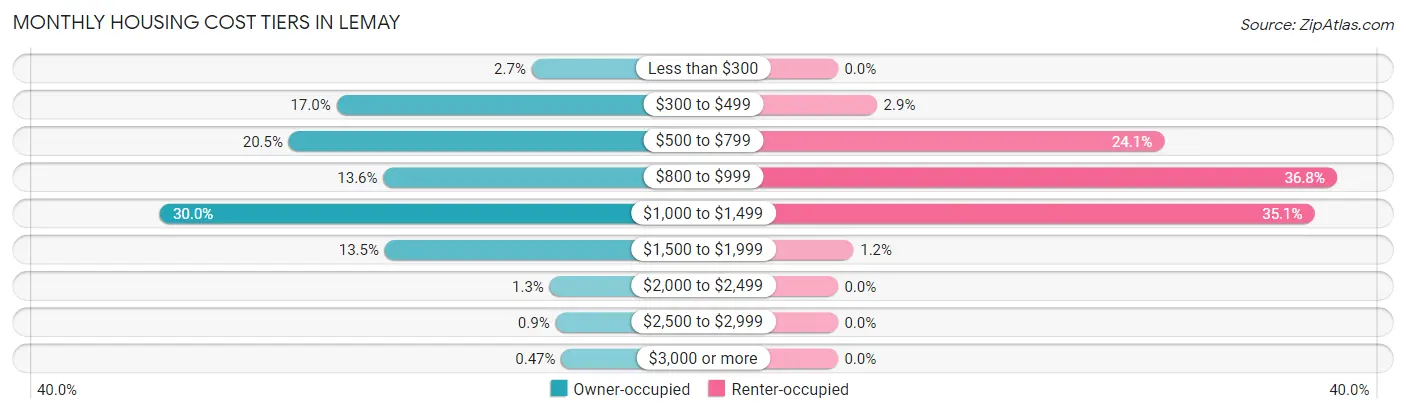
| Monthly Cost | Owner-occupied | Renter-occupied |
| Less than $300 | 130 (2.6%) | 0 (0.0%) |
| $300 to $499 | 834 (17.0%) | 42 (2.9%) |
| $500 to $799 | 1,006 (20.5%) | 350 (24.0%) |
| $800 to $999 | 665 (13.6%) | 535 (36.8%) |
| $1,000 to $1,499 | 1,471 (30.0%) | 511 (35.1%) |
| $1,500 to $1,999 | 660 (13.5%) | 17 (1.2%) |
| $2,000 to $2,499 | 65 (1.3%) | 0 (0.0%) |
| $2,500 to $2,999 | 44 (0.9%) | 0 (0.0%) |
| $3,000 or more | 23 (0.5%) | 0 (0.0%) |
| Total | 4,898 (100.0%) | 1,455 (100.0%) |
Physical Housing Characteristics in Lemay
Housing Structures in Lemay
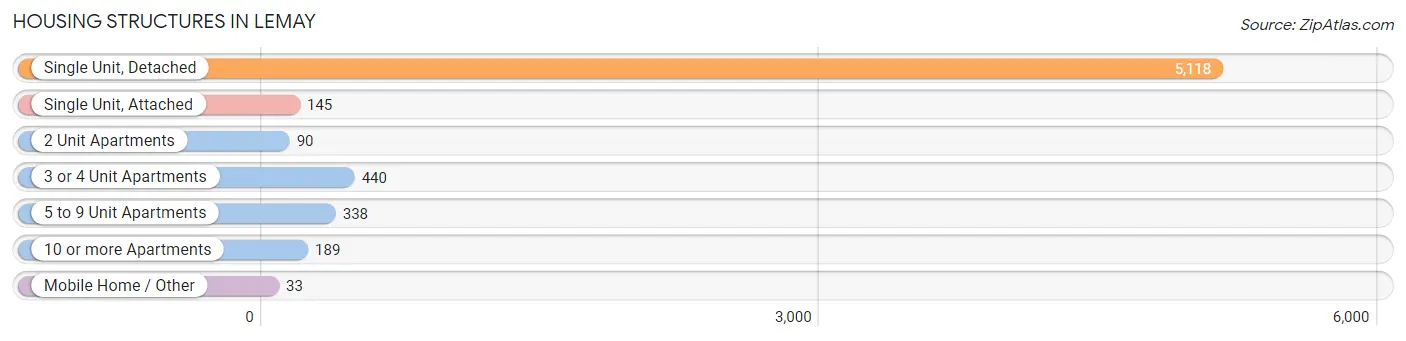
| Structure Type | # Housing Units | % Housing Units |
| Single Unit, Detached | 5,118 | 80.6% |
| Single Unit, Attached | 145 | 2.3% |
| 2 Unit Apartments | 90 | 1.4% |
| 3 or 4 Unit Apartments | 440 | 6.9% |
| 5 to 9 Unit Apartments | 338 | 5.3% |
| 10 or more Apartments | 189 | 3.0% |
| Mobile Home / Other | 33 | 0.5% |
| Total | 6,353 | 100.0% |
Housing Structures by Occupancy in Lemay
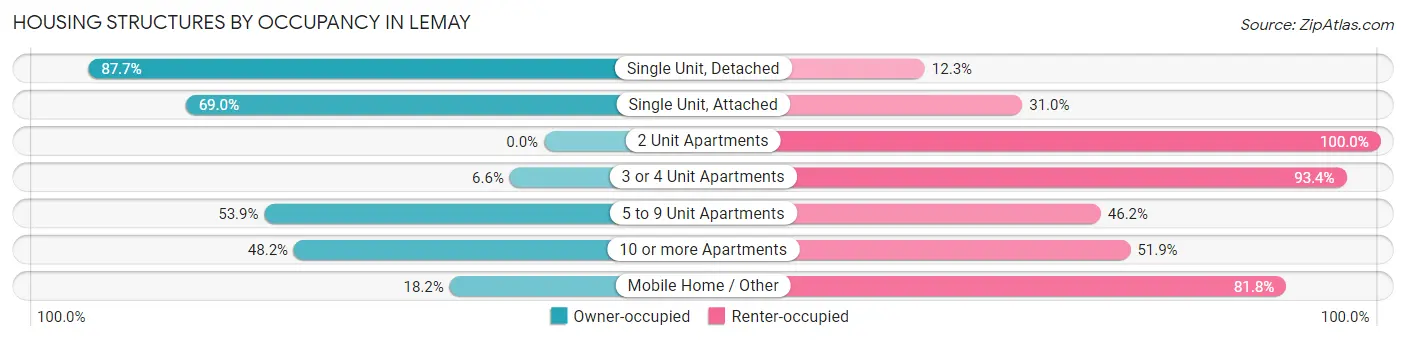
| Structure Type | Owner-occupied | Renter-occupied |
| Single Unit, Detached | 4,490 (87.7%) | 628 (12.3%) |
| Single Unit, Attached | 100 (69.0%) | 45 (31.0%) |
| 2 Unit Apartments | 0 (0.0%) | 90 (100.0%) |
| 3 or 4 Unit Apartments | 29 (6.6%) | 411 (93.4%) |
| 5 to 9 Unit Apartments | 182 (53.8%) | 156 (46.2%) |
| 10 or more Apartments | 91 (48.1%) | 98 (51.8%) |
| Mobile Home / Other | 6 (18.2%) | 27 (81.8%) |
| Total | 4,898 (77.1%) | 1,455 (22.9%) |
Housing Structures by Number of Rooms in Lemay
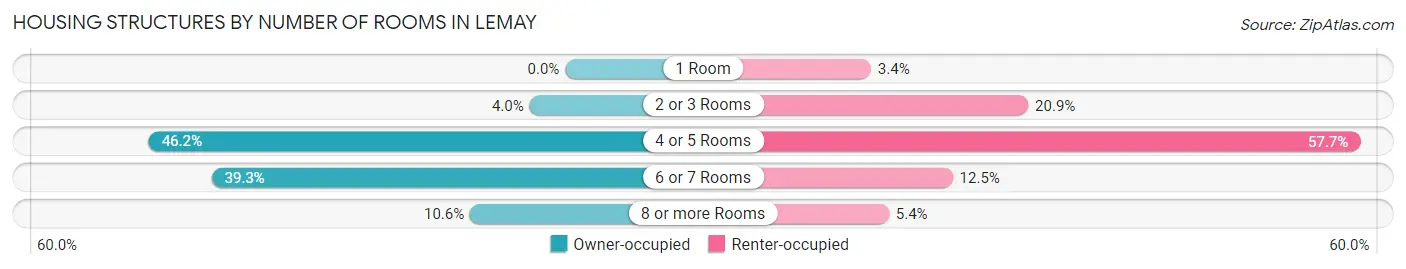
| Number of Rooms | Owner-occupied | Renter-occupied |
| 1 Room | 0 (0.0%) | 50 (3.4%) |
| 2 or 3 Rooms | 194 (4.0%) | 304 (20.9%) |
| 4 or 5 Rooms | 2,264 (46.2%) | 840 (57.7%) |
| 6 or 7 Rooms | 1,923 (39.3%) | 182 (12.5%) |
| 8 or more Rooms | 517 (10.6%) | 79 (5.4%) |
| Total | 4,898 (100.0%) | 1,455 (100.0%) |
Housing Structure by Heating Type in Lemay
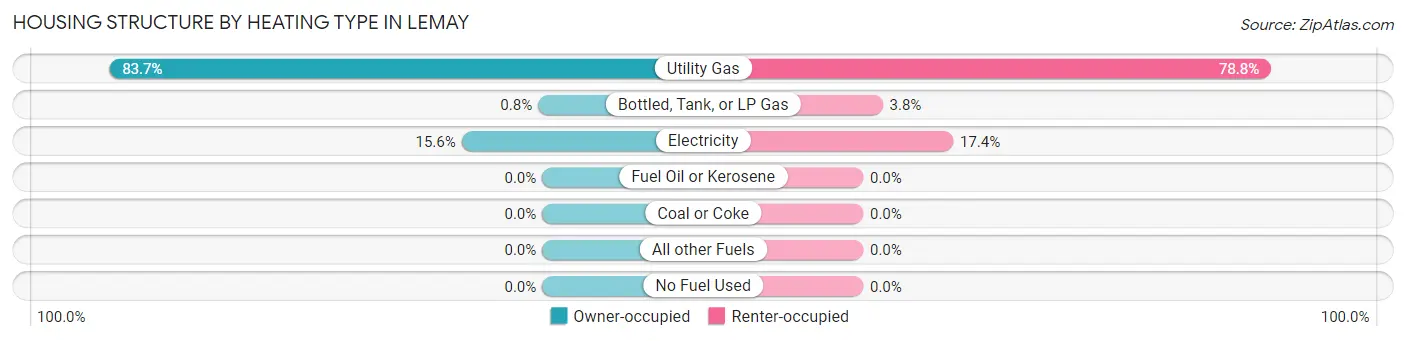
| Heating Type | Owner-occupied | Renter-occupied |
| Utility Gas | 4,097 (83.7%) | 1,147 (78.8%) |
| Bottled, Tank, or LP Gas | 39 (0.8%) | 55 (3.8%) |
| Electricity | 762 (15.6%) | 253 (17.4%) |
| Fuel Oil or Kerosene | 0 (0.0%) | 0 (0.0%) |
| Coal or Coke | 0 (0.0%) | 0 (0.0%) |
| All other Fuels | 0 (0.0%) | 0 (0.0%) |
| No Fuel Used | 0 (0.0%) | 0 (0.0%) |
| Total | 4,898 (100.0%) | 1,455 (100.0%) |
Household Vehicle Usage in Lemay
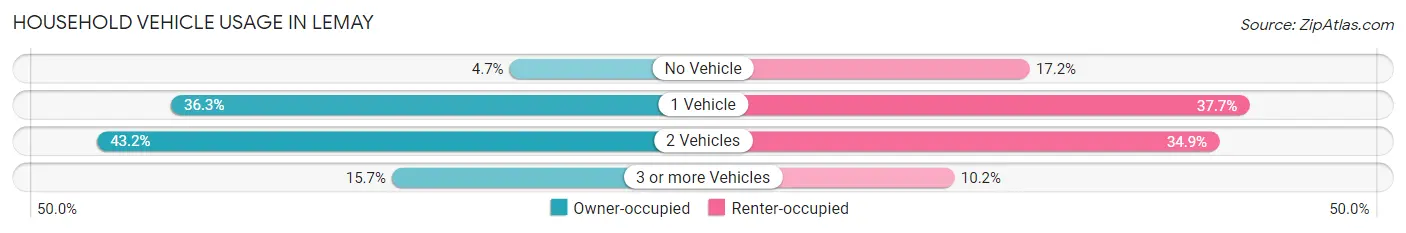
| Vehicles per Household | Owner-occupied | Renter-occupied |
| No Vehicle | 232 (4.7%) | 250 (17.2%) |
| 1 Vehicle | 1,779 (36.3%) | 549 (37.7%) |
| 2 Vehicles | 2,117 (43.2%) | 508 (34.9%) |
| 3 or more Vehicles | 770 (15.7%) | 148 (10.2%) |
| Total | 4,898 (100.0%) | 1,455 (100.0%) |
Real Estate & Mortgages in Lemay
Real Estate and Mortgage Overview in Lemay
| Characteristic | Without Mortgage | With Mortgage |
| Housing Units | 1,811 | 3,087 |
| Median Property Value | $133,700 | $136,000 |
| Median Household Income | $50,866 | $140 |
| Monthly Housing Costs | $497 | $23 |
| Real Estate Taxes | $1,770 | $40 |
Property Value by Mortgage Status in Lemay
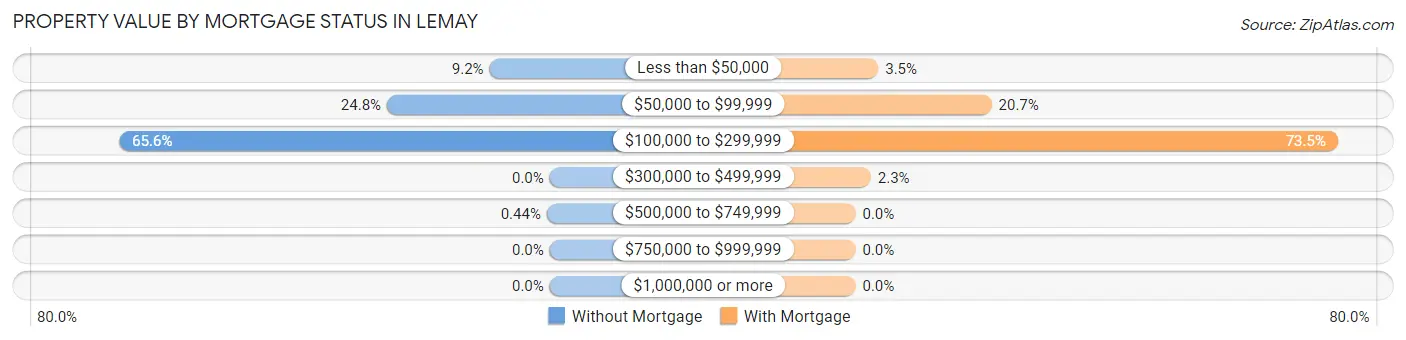
| Property Value | Without Mortgage | With Mortgage |
| Less than $50,000 | 166 (9.2%) | 107 (3.5%) |
| $50,000 to $99,999 | 449 (24.8%) | 640 (20.7%) |
| $100,000 to $299,999 | 1,188 (65.6%) | 2,268 (73.5%) |
| $300,000 to $499,999 | 0 (0.0%) | 72 (2.3%) |
| $500,000 to $749,999 | 8 (0.4%) | 0 (0.0%) |
| $750,000 to $999,999 | 0 (0.0%) | 0 (0.0%) |
| $1,000,000 or more | 0 (0.0%) | 0 (0.0%) |
| Total | 1,811 (100.0%) | 3,087 (100.0%) |
Household Income by Mortgage Status in Lemay
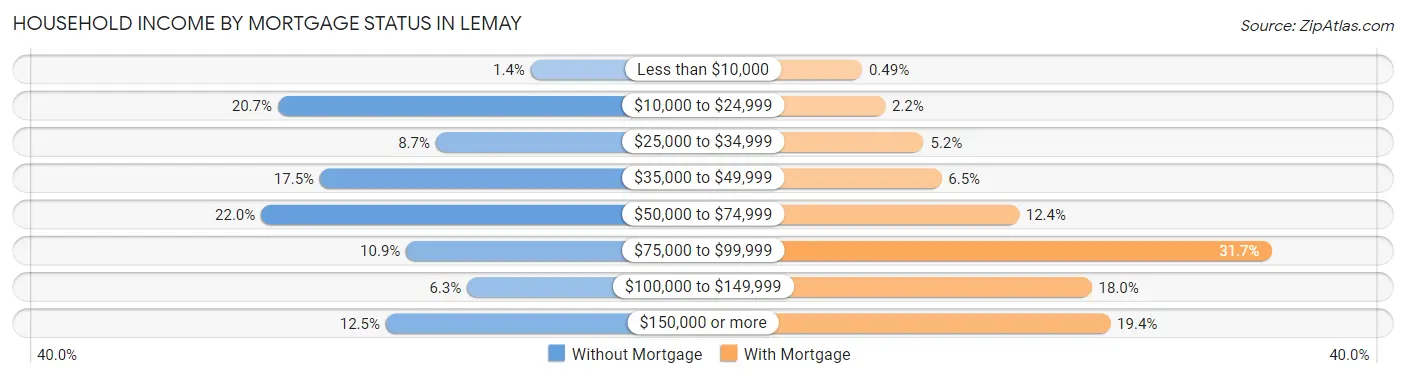
| Household Income | Without Mortgage | With Mortgage |
| Less than $10,000 | 26 (1.4%) | 15 (0.5%) |
| $10,000 to $24,999 | 375 (20.7%) | 69 (2.2%) |
| $25,000 to $34,999 | 157 (8.7%) | 160 (5.2%) |
| $35,000 to $49,999 | 317 (17.5%) | 202 (6.5%) |
| $50,000 to $74,999 | 398 (22.0%) | 384 (12.4%) |
| $75,000 to $99,999 | 198 (10.9%) | 978 (31.7%) |
| $100,000 to $149,999 | 114 (6.3%) | 555 (18.0%) |
| $150,000 or more | 226 (12.5%) | 599 (19.4%) |
| Total | 1,811 (100.0%) | 3,087 (100.0%) |
Property Value to Household Income Ratio in Lemay
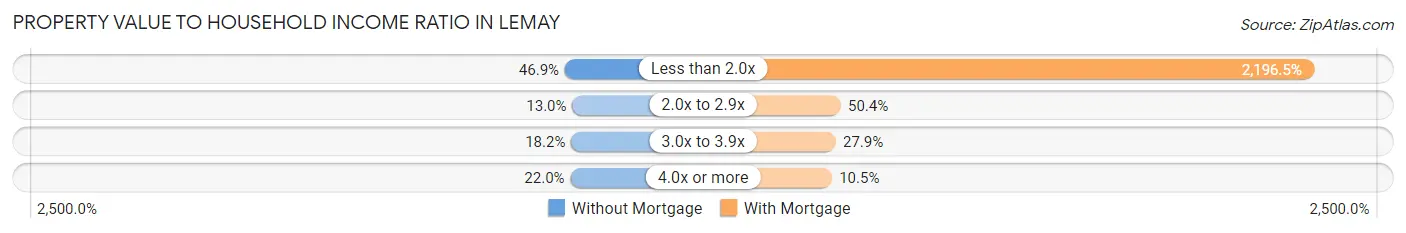
| Value-to-Income Ratio | Without Mortgage | With Mortgage |
| Less than 2.0x | 849 (46.9%) | 67,805 (2,196.5%) |
| 2.0x to 2.9x | 235 (13.0%) | 1,556 (50.4%) |
| 3.0x to 3.9x | 329 (18.2%) | 860 (27.9%) |
| 4.0x or more | 398 (22.0%) | 323 (10.5%) |
| Total | 1,811 (100.0%) | 3,087 (100.0%) |
Real Estate Taxes by Mortgage Status in Lemay
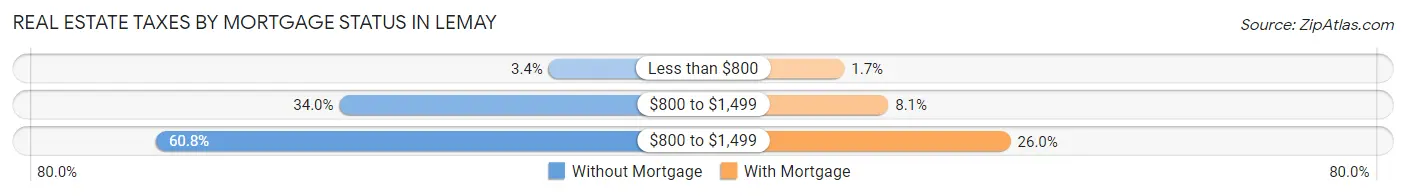
| Property Taxes | Without Mortgage | With Mortgage |
| Less than $800 | 62 (3.4%) | 51 (1.7%) |
| $800 to $1,499 | 616 (34.0%) | 249 (8.1%) |
| $800 to $1,499 | 1,101 (60.8%) | 801 (26.0%) |
| Total | 1,811 (100.0%) | 3,087 (100.0%) |
Health & Disability in Lemay
Health Insurance Coverage by Age in Lemay
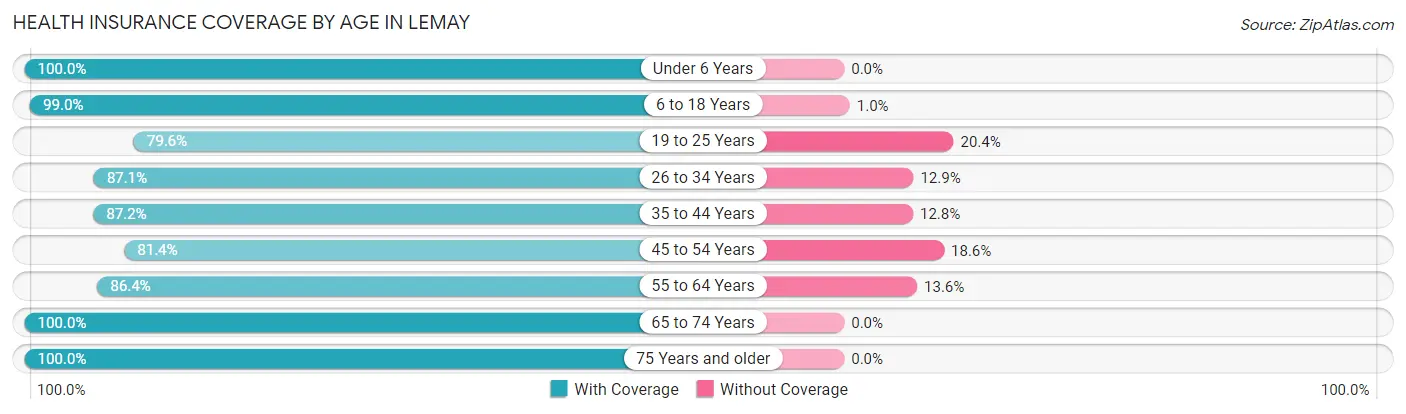
| Age Bracket | With Coverage | Without Coverage |
| Under 6 Years | 1,536 (100.0%) | 0 (0.0%) |
| 6 to 18 Years | 2,294 (99.0%) | 24 (1.0%) |
| 19 to 25 Years | 1,141 (79.6%) | 292 (20.4%) |
| 26 to 34 Years | 2,148 (87.1%) | 318 (12.9%) |
| 35 to 44 Years | 1,999 (87.2%) | 294 (12.8%) |
| 45 to 54 Years | 1,448 (81.4%) | 331 (18.6%) |
| 55 to 64 Years | 1,916 (86.4%) | 301 (13.6%) |
| 65 to 74 Years | 1,317 (100.0%) | 0 (0.0%) |
| 75 Years and older | 638 (100.0%) | 0 (0.0%) |
| Total | 14,437 (90.2%) | 1,560 (9.8%) |
Health Insurance Coverage by Citizenship Status in Lemay
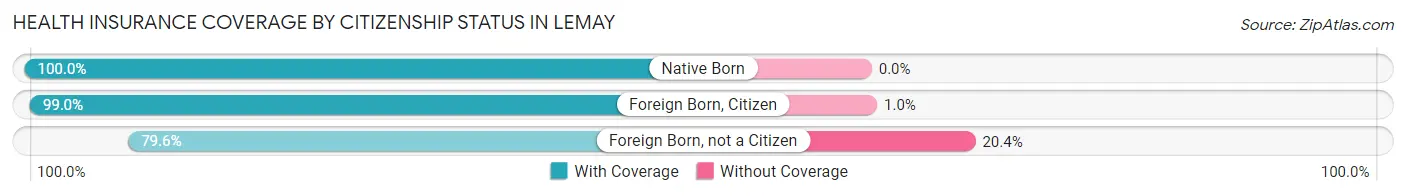
| Citizenship Status | With Coverage | Without Coverage |
| Native Born | 1,536 (100.0%) | 0 (0.0%) |
| Foreign Born, Citizen | 2,294 (99.0%) | 24 (1.0%) |
| Foreign Born, not a Citizen | 1,141 (79.6%) | 292 (20.4%) |
Health Insurance Coverage by Household Income in Lemay
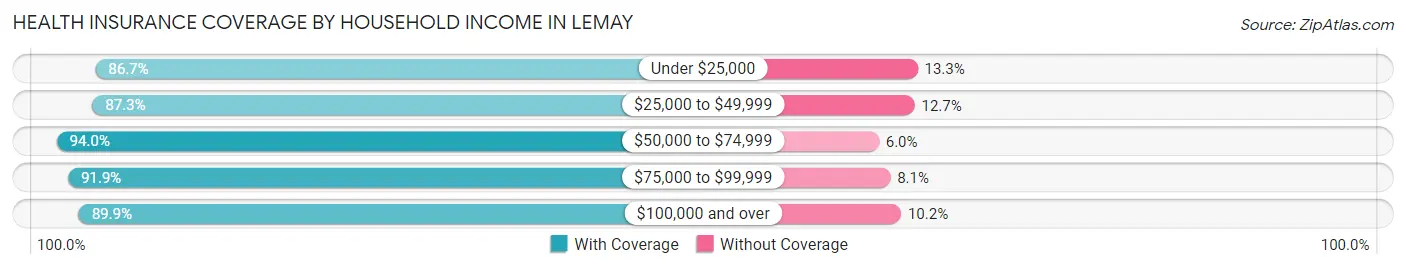
| Household Income | With Coverage | Without Coverage |
| Under $25,000 | 1,465 (86.7%) | 224 (13.3%) |
| $25,000 to $49,999 | 2,821 (87.3%) | 410 (12.7%) |
| $50,000 to $74,999 | 3,814 (94.0%) | 243 (6.0%) |
| $75,000 to $99,999 | 2,157 (91.9%) | 191 (8.1%) |
| $100,000 and over | 4,083 (89.8%) | 461 (10.2%) |
Public vs Private Health Insurance Coverage by Age in Lemay
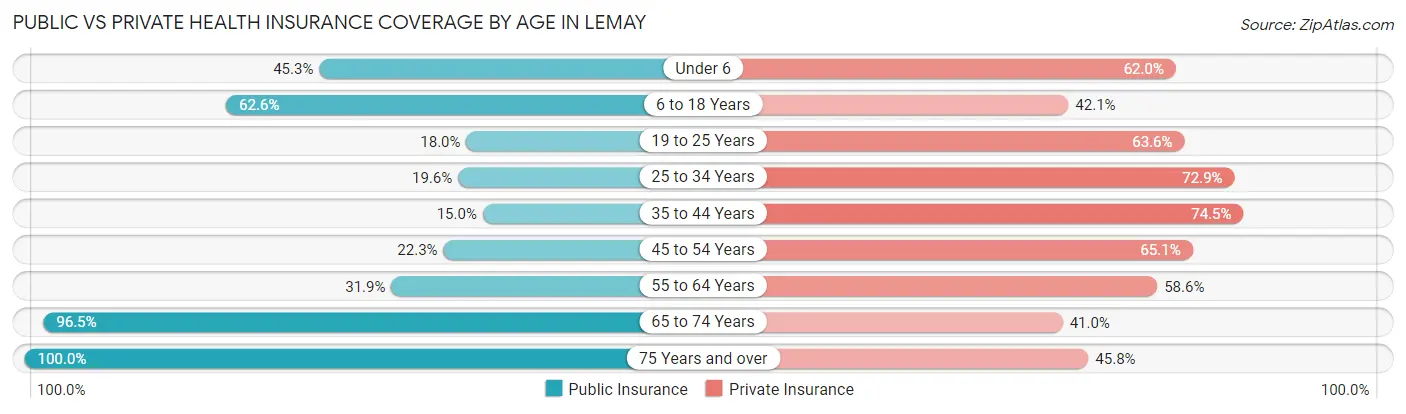
| Age Bracket | Public Insurance | Private Insurance |
| Under 6 | 696 (45.3%) | 952 (62.0%) |
| 6 to 18 Years | 1,451 (62.6%) | 975 (42.1%) |
| 19 to 25 Years | 258 (18.0%) | 911 (63.6%) |
| 25 to 34 Years | 482 (19.6%) | 1,797 (72.9%) |
| 35 to 44 Years | 343 (15.0%) | 1,709 (74.5%) |
| 45 to 54 Years | 396 (22.3%) | 1,158 (65.1%) |
| 55 to 64 Years | 708 (31.9%) | 1,298 (58.6%) |
| 65 to 74 Years | 1,271 (96.5%) | 540 (41.0%) |
| 75 Years and over | 638 (100.0%) | 292 (45.8%) |
| Total | 6,243 (39.0%) | 9,632 (60.2%) |
Disability Status by Sex by Age in Lemay
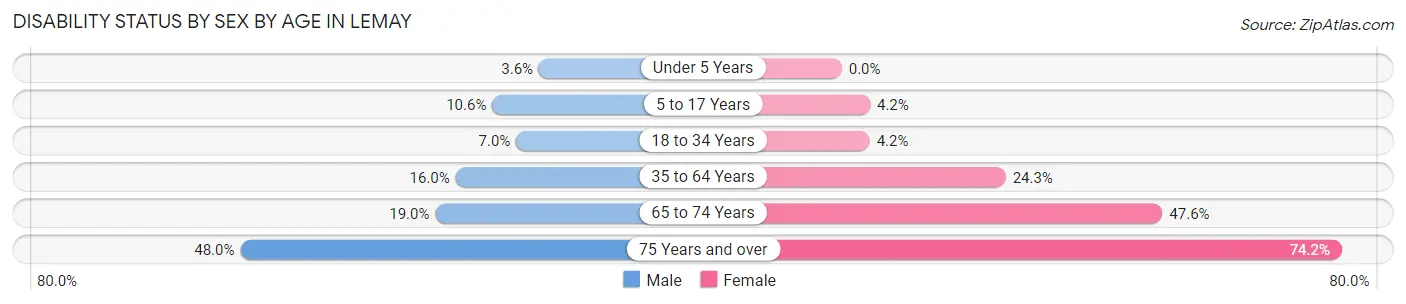
| Age Bracket | Male | Female |
| Under 5 Years | 21 (3.6%) | 0 (0.0%) |
| 5 to 17 Years | 124 (10.6%) | 54 (4.2%) |
| 18 to 34 Years | 141 (7.0%) | 83 (4.2%) |
| 35 to 64 Years | 501 (16.0%) | 769 (24.3%) |
| 65 to 74 Years | 135 (19.0%) | 289 (47.6%) |
| 75 Years and over | 118 (48.0%) | 291 (74.2%) |
Disability Class by Sex by Age in Lemay
Disability Class: Hearing Difficulty
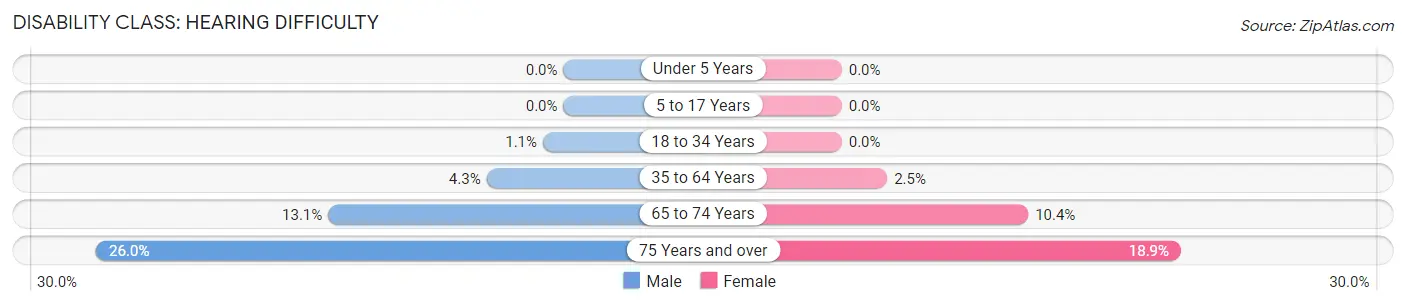
| Age Bracket | Male | Female |
| Under 5 Years | 0 (0.0%) | 0 (0.0%) |
| 5 to 17 Years | 0 (0.0%) | 0 (0.0%) |
| 18 to 34 Years | 23 (1.1%) | 0 (0.0%) |
| 35 to 64 Years | 134 (4.3%) | 80 (2.5%) |
| 65 to 74 Years | 93 (13.1%) | 63 (10.4%) |
| 75 Years and over | 64 (26.0%) | 74 (18.9%) |
Disability Class: Vision Difficulty
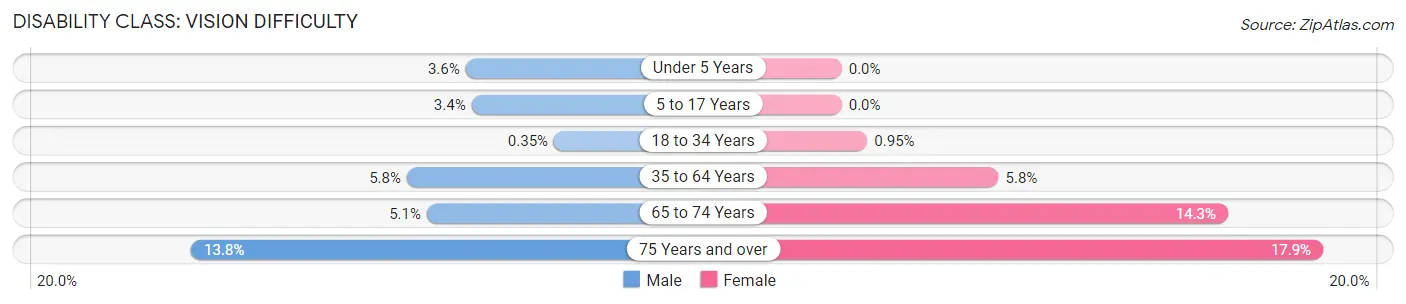
| Age Bracket | Male | Female |
| Under 5 Years | 21 (3.6%) | 0 (0.0%) |
| 5 to 17 Years | 40 (3.4%) | 0 (0.0%) |
| 18 to 34 Years | 7 (0.4%) | 19 (0.9%) |
| 35 to 64 Years | 182 (5.8%) | 184 (5.8%) |
| 65 to 74 Years | 36 (5.1%) | 87 (14.3%) |
| 75 Years and over | 34 (13.8%) | 70 (17.9%) |
Disability Class: Cognitive Difficulty
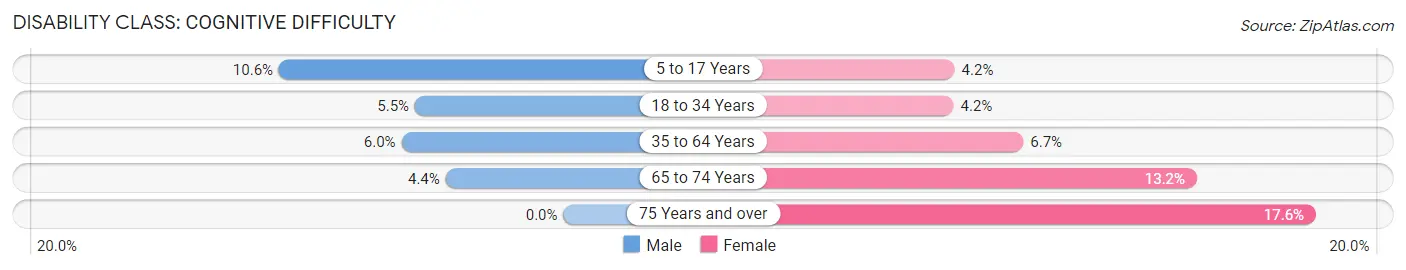
| Age Bracket | Male | Female |
| 5 to 17 Years | 124 (10.6%) | 54 (4.2%) |
| 18 to 34 Years | 111 (5.5%) | 83 (4.2%) |
| 35 to 64 Years | 188 (6.0%) | 213 (6.7%) |
| 65 to 74 Years | 31 (4.4%) | 80 (13.2%) |
| 75 Years and over | 0 (0.0%) | 69 (17.6%) |
Disability Class: Ambulatory Difficulty
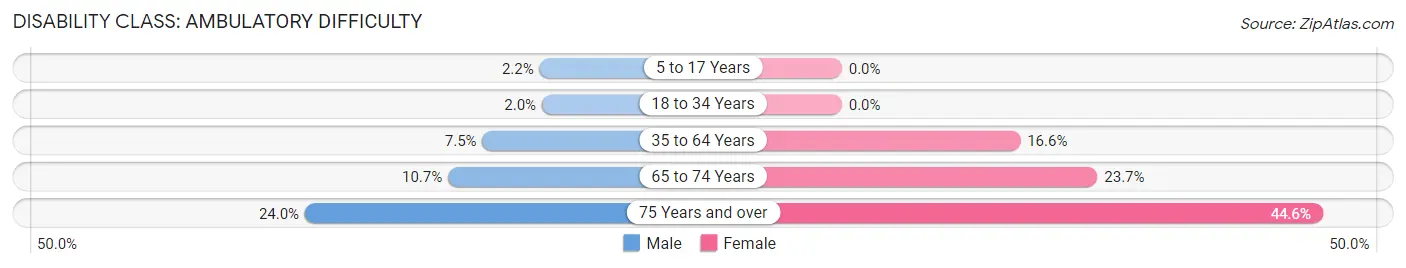
| Age Bracket | Male | Female |
| 5 to 17 Years | 26 (2.2%) | 0 (0.0%) |
| 18 to 34 Years | 40 (2.0%) | 0 (0.0%) |
| 35 to 64 Years | 235 (7.5%) | 523 (16.6%) |
| 65 to 74 Years | 76 (10.7%) | 144 (23.7%) |
| 75 Years and over | 59 (24.0%) | 175 (44.6%) |
Disability Class: Self-Care Difficulty
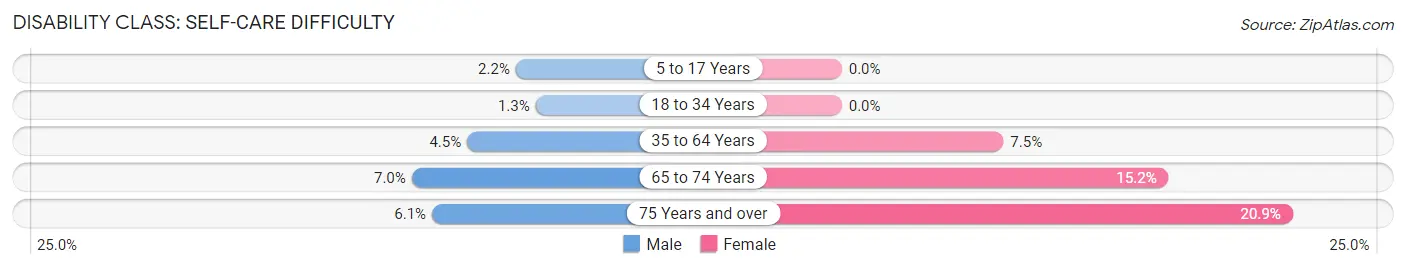
| Age Bracket | Male | Female |
| 5 to 17 Years | 26 (2.2%) | 0 (0.0%) |
| 18 to 34 Years | 26 (1.3%) | 0 (0.0%) |
| 35 to 64 Years | 140 (4.5%) | 237 (7.5%) |
| 65 to 74 Years | 50 (7.0%) | 92 (15.2%) |
| 75 Years and over | 15 (6.1%) | 82 (20.9%) |
Technology Access in Lemay
Computing Device Access in Lemay
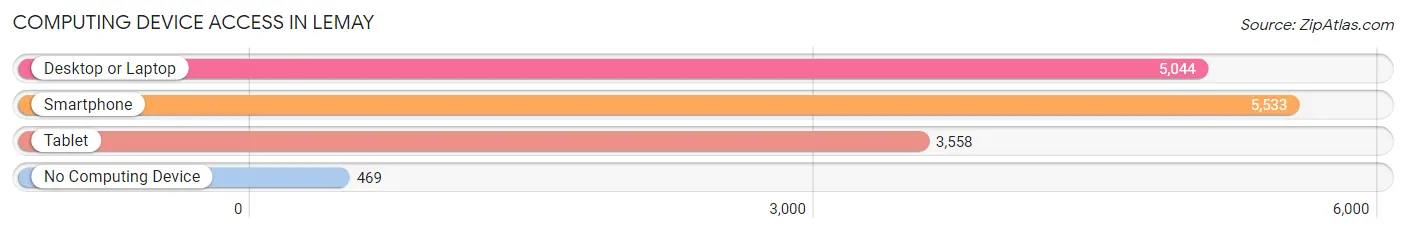
| Device Type | # Households | % Households |
| Desktop or Laptop | 5,044 | 79.4% |
| Smartphone | 5,533 | 87.1% |
| Tablet | 3,558 | 56.0% |
| No Computing Device | 469 | 7.4% |
| Total | 6,353 | 100.0% |
Internet Access in Lemay
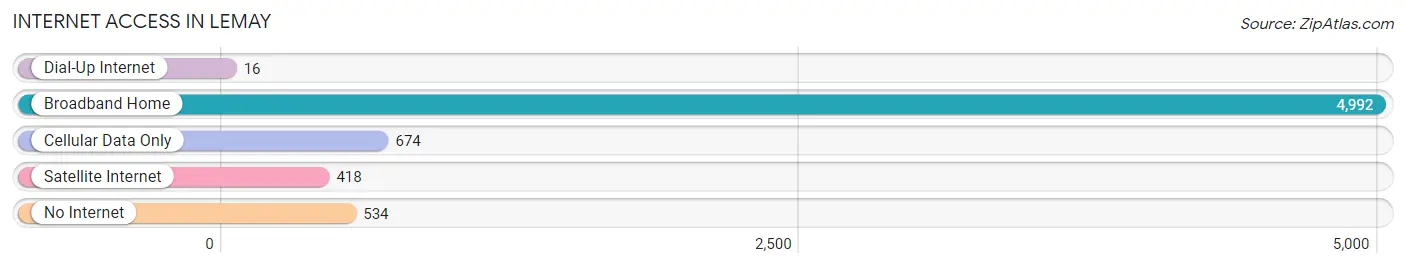
| Internet Type | # Households | % Households |
| Dial-Up Internet | 16 | 0.3% |
| Broadband Home | 4,992 | 78.6% |
| Cellular Data Only | 674 | 10.6% |
| Satellite Internet | 418 | 6.6% |
| No Internet | 534 | 8.4% |
| Total | 6,353 | 100.0% |
Lemay Summary
Lemay is a census-designated place (CDP) located in St. Louis County, Missouri, United States. It is located approximately 10 miles south of downtown St. Louis and is part of the Greater St. Louis metropolitan area. As of the 2010 census, the population of Lemay was 28,608.
History
Lemay was first settled in the early 1800s by French-Canadian immigrants. The area was originally known as "Lemay's Settlement" and was named after the Lemay family, who were among the first settlers. The area was annexed by St. Louis County in 1876 and was officially incorporated as a village in 1892.
In the early 1900s, Lemay was a rural farming community. The area was largely agricultural until the 1950s, when the population began to grow rapidly due to the construction of the nearby Jefferson Barracks Bridge and the opening of the nearby St. Louis County Airport.
Geography
Lemay is located at 38°30'25" North, 90°19'45" West (38.506944, -90.329167). The CDP has a total area of 8.3 square miles, all of which is land.
Economy
Lemay is home to a variety of businesses, including manufacturing, retail, and service industries. The largest employers in the area are the St. Louis County Airport, the Jefferson Barracks Bridge, and the Lemay Fire Protection District.
Demographics
As of the 2010 census, there were 28,608 people, 11,845 households, and 7,845 families residing in the CDP. The population density was 3,444.3 people per square mile. The racial makeup of the CDP was 79.2% White, 14.2% African American, 0.3% Native American, 1.7% Asian, 0.1% Pacific Islander, 1.3% from other races, and 3.2% from two or more races. Hispanic or Latino of any race were 4.2% of the population.
The median income for a household in the CDP was $50,945, and the median income for a family was $60,945. Males had a median income of $41,945 versus $31,945 for females. The per capita income for the CDP was $24,945. About 5.2% of families and 7.2% of the population were below the poverty line, including 10.2% of those under age 18 and 5.2% of those age 65 or over.
Common Questions
What is Per Capita Income in Lemay?
Per Capita income in Lemay is $29,555.
What is the Median Family Income in Lemay?
Median Family Income in Lemay is $71,920.
What is the Median Household income in Lemay?
Median Household Income in Lemay is $56,591.
What is Income or Wage Gap in Lemay?
Income or Wage Gap in Lemay is 30.8%.
Women in Lemay earn 69.2 cents for every dollar earned by a man.
What is Inequality or Gini Index in Lemay?
Inequality or Gini Index in Lemay is 0.41.
What is the Total Population of Lemay?
Total Population of Lemay is 16,211.
What is the Total Male Population of Lemay?
Total Male Population of Lemay is 7,973.
What is the Total Female Population of Lemay?
Total Female Population of Lemay is 8,238.
What is the Ratio of Males per 100 Females in Lemay?
There are 96.78 Males per 100 Females in Lemay.
What is the Ratio of Females per 100 Males in Lemay?
There are 103.32 Females per 100 Males in Lemay.
What is the Median Population Age in Lemay?
Median Population Age in Lemay is 36.0 Years.
What is the Average Family Size in Lemay
Average Family Size in Lemay is 3.2 People.
What is the Average Household Size in Lemay
Average Household Size in Lemay is 2.5 People.
How Large is the Labor Force in Lemay?
There are 8,292 People in the Labor Forcein in Lemay.
What is the Percentage of People in the Labor Force in Lemay?
65.8% of People are in the Labor Force in Lemay.
What is the Unemployment Rate in Lemay?
Unemployment Rate in Lemay is 4.3%.