Bernie, MO Map & Demographics
Bernie Map
Bernie Overview
$21,084
PER CAPITA INCOME
$45,833
AVG FAMILY INCOME
$41,477
AVG HOUSEHOLD INCOME
14.5%
WAGE / INCOME GAP [ % ]
85.5¢/ $1
WAGE / INCOME GAP [ $ ]
0.39
INEQUALITY / GINI INDEX
1,916
TOTAL POPULATION
900
MALE POPULATION
1,016
FEMALE POPULATION
88.58
MALES / 100 FEMALES
112.89
FEMALES / 100 MALES
46.8
MEDIAN AGE
3.0
AVG FAMILY SIZE
2.5
AVG HOUSEHOLD SIZE
659
LABOR FORCE [ PEOPLE ]
42.6%
PERCENT IN LABOR FORCE
2.1%
UNEMPLOYMENT RATE
Bernie Zip Codes
Bernie Area Codes
Income in Bernie
Income Overview in Bernie
Per Capita Income in Bernie is $21,084, while median incomes of families and households are $45,833 and $41,477 respectively.
| Characteristic | Number | Measure |
| Per Capita Income | 1,916 | $21,084 |
| Median Family Income | 504 | $45,833 |
| Mean Family Income | 504 | $56,906 |
| Median Household Income | 758 | $41,477 |
| Mean Household Income | 758 | $50,556 |
| Income Deficit | 504 | $0 |
| Wage / Income Gap (%) | 1,916 | 14.50% |
| Wage / Income Gap ($) | 1,916 | 85.50¢ per $1 |
| Gini / Inequality Index | 1,916 | 0.39 |
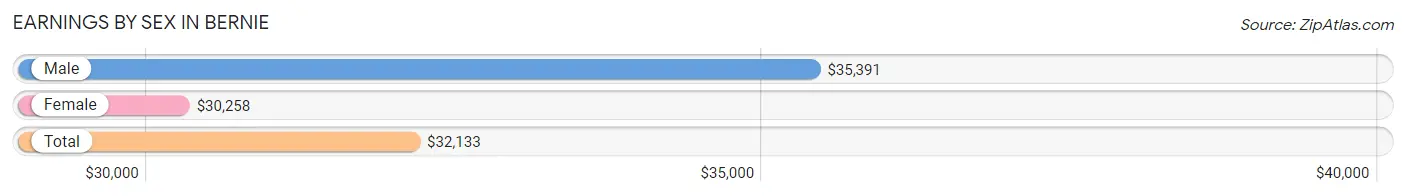
Earnings by Sex in Bernie
Average Earnings in Bernie are $32,133, $35,391 for men and $30,258 for women, a difference of 14.5%.
| Sex | Number | Average Earnings |
| Male | 357 (47.7%) | $35,391 |
| Female | 391 (52.3%) | $30,258 |
| Total | 748 (100.0%) | $32,133 |
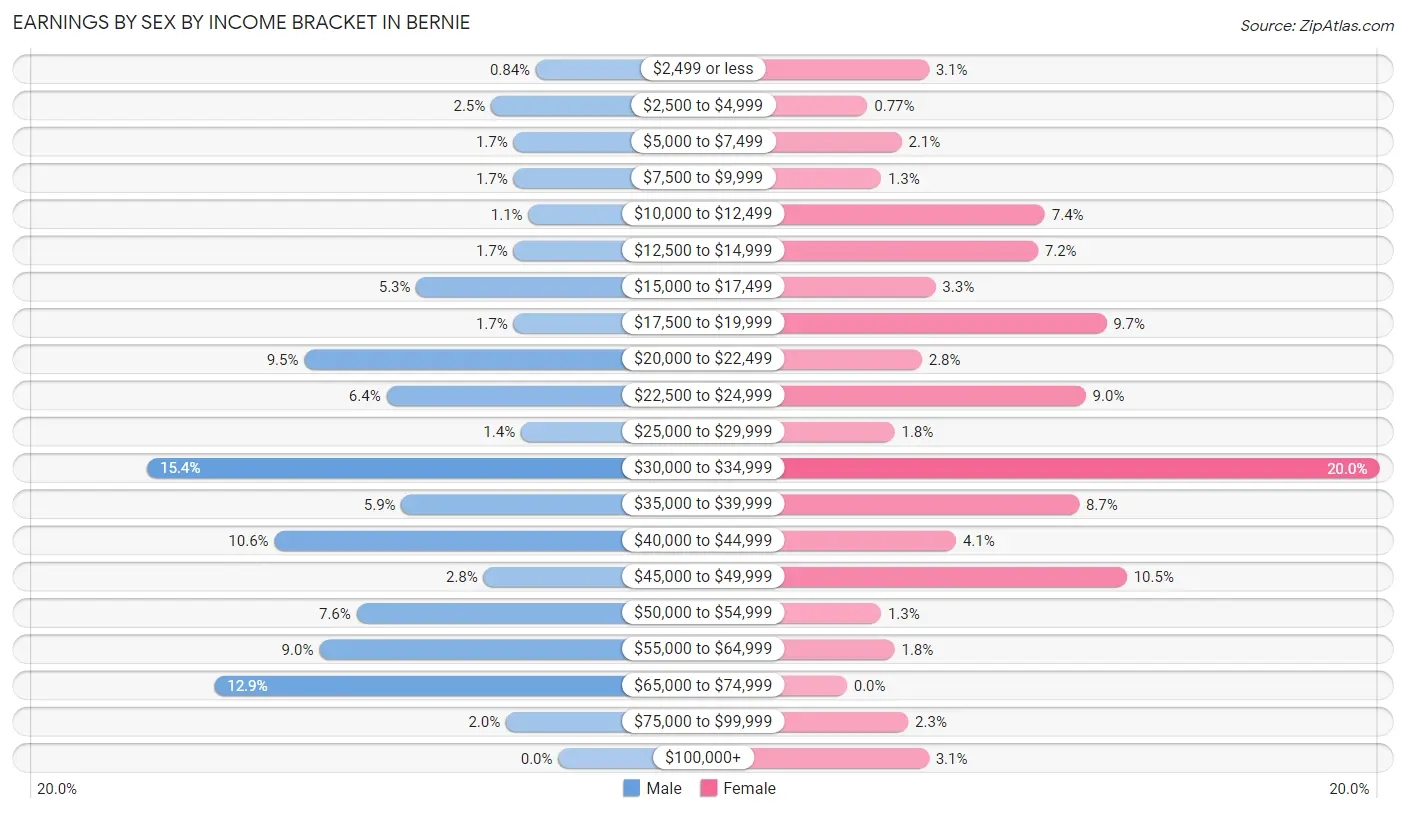
Earnings by Sex by Income Bracket in Bernie
The most common earnings brackets in Bernie are $30,000 to $34,999 for men (55 | 15.4%) and $30,000 to $34,999 for women (78 | 20.0%).
| Income | Male | Female |
| $2,499 or less | 3 (0.8%) | 12 (3.1%) |
| $2,500 to $4,999 | 9 (2.5%) | 3 (0.8%) |
| $5,000 to $7,499 | 6 (1.7%) | 8 (2.1%) |
| $7,500 to $9,999 | 6 (1.7%) | 5 (1.3%) |
| $10,000 to $12,499 | 4 (1.1%) | 29 (7.4%) |
| $12,500 to $14,999 | 6 (1.7%) | 28 (7.2%) |
| $15,000 to $17,499 | 19 (5.3%) | 13 (3.3%) |
| $17,500 to $19,999 | 6 (1.7%) | 38 (9.7%) |
| $20,000 to $22,499 | 34 (9.5%) | 11 (2.8%) |
| $22,500 to $24,999 | 23 (6.4%) | 35 (8.9%) |
| $25,000 to $29,999 | 5 (1.4%) | 7 (1.8%) |
| $30,000 to $34,999 | 55 (15.4%) | 78 (20.0%) |
| $35,000 to $39,999 | 21 (5.9%) | 34 (8.7%) |
| $40,000 to $44,999 | 38 (10.6%) | 16 (4.1%) |
| $45,000 to $49,999 | 10 (2.8%) | 41 (10.5%) |
| $50,000 to $54,999 | 27 (7.6%) | 5 (1.3%) |
| $55,000 to $64,999 | 32 (9.0%) | 7 (1.8%) |
| $65,000 to $74,999 | 46 (12.9%) | 0 (0.0%) |
| $75,000 to $99,999 | 7 (2.0%) | 9 (2.3%) |
| $100,000+ | 0 (0.0%) | 12 (3.1%) |
| Total | 357 (100.0%) | 391 (100.0%) |
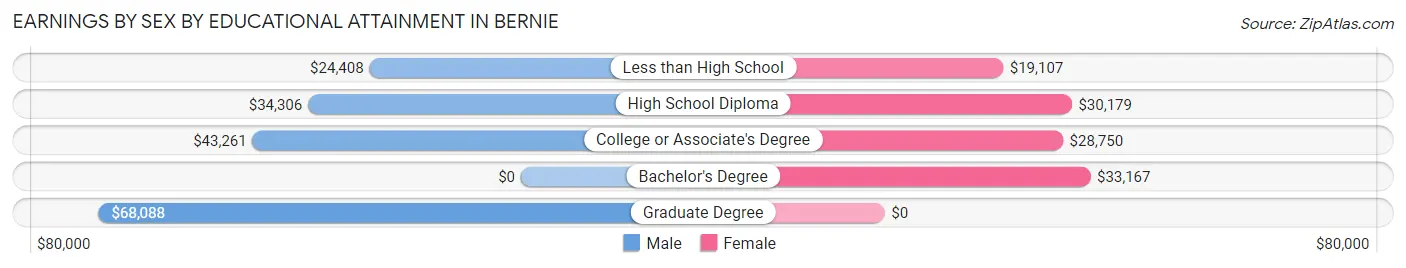
Earnings by Sex by Educational Attainment in Bernie
Average earnings in Bernie are $36,719 for men and $30,258 for women, a difference of 17.6%. Men with an educational attainment of graduate degree enjoy the highest average annual earnings of $68,088, while those with less than high school education earn the least with $24,408. Women with an educational attainment of bachelor's degree earn the most with the average annual earnings of $33,167, while those with less than high school education have the smallest earnings of $19,107.
| Educational Attainment | Male Income | Female Income |
| Less than High School | $24,408 | $19,107 |
| High School Diploma | $34,306 | $30,179 |
| College or Associate's Degree | $43,261 | $28,750 |
| Bachelor's Degree | - | - |
| Graduate Degree | $68,088 | $0 |
| Total | $36,719 | $30,258 |
Family Income in Bernie
Family Income Brackets in Bernie
According to the Bernie family income data, there are 141 families falling into the $35,000 to $49,999 income range, which is the most common income bracket and makes up 28.0% of all families. Conversely, the $200,000+ income bracket is the least frequent group with only 2 families (0.4%) belonging to this category.
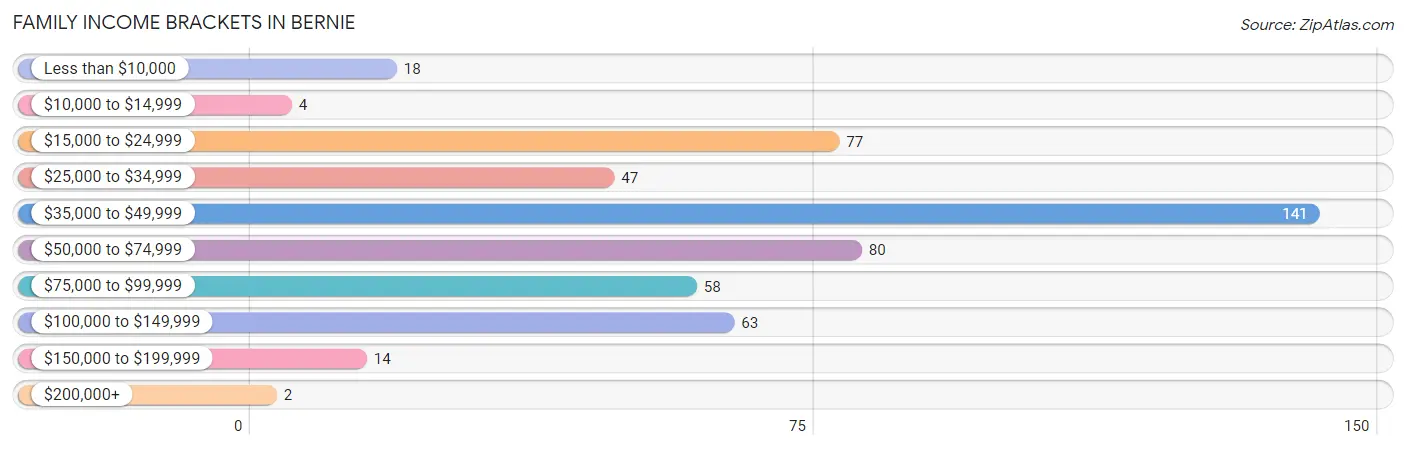
| Income Bracket | # Families | % Families |
| Less than $10,000 | 18 | 3.6% |
| $10,000 to $14,999 | 4 | 0.8% |
| $15,000 to $24,999 | 77 | 15.3% |
| $25,000 to $34,999 | 47 | 9.3% |
| $35,000 to $49,999 | 141 | 28.0% |
| $50,000 to $74,999 | 80 | 15.9% |
| $75,000 to $99,999 | 58 | 11.5% |
| $100,000 to $149,999 | 63 | 12.5% |
| $150,000 to $199,999 | 14 | 2.8% |
| $200,000+ | 2 | 0.4% |
Family Income by Famaliy Size in Bernie
4-person families (106 | 21.0%) account for the highest median family income in Bernie with $54,500 per family, while 2-person families (242 | 48.0%) have the highest median income of $22,619 per family member.
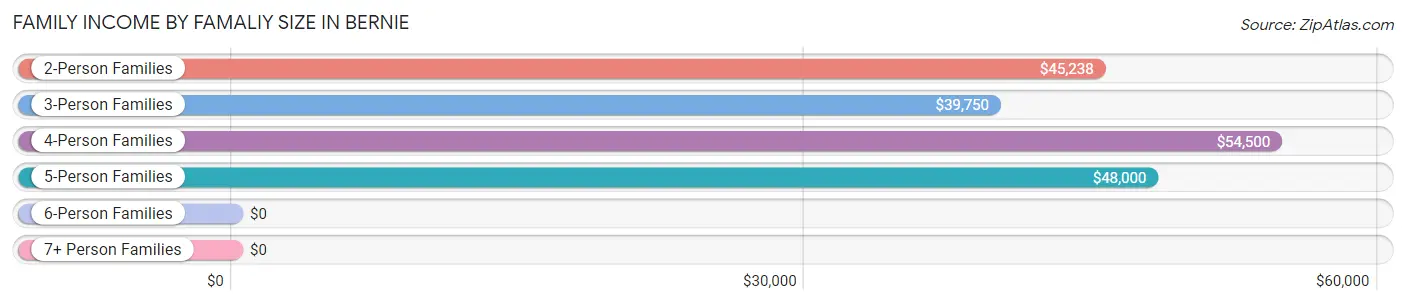
| Income Bracket | # Families | Median Income |
| 2-Person Families | 242 (48.0%) | $45,238 |
| 3-Person Families | 95 (18.9%) | $39,750 |
| 4-Person Families | 106 (21.0%) | $54,500 |
| 5-Person Families | 48 (9.5%) | $48,000 |
| 6-Person Families | 5 (1.0%) | $0 |
| 7+ Person Families | 8 (1.6%) | $0 |
| Total | 504 (100.0%) | $45,833 |
Family Income by Number of Earners in Bernie
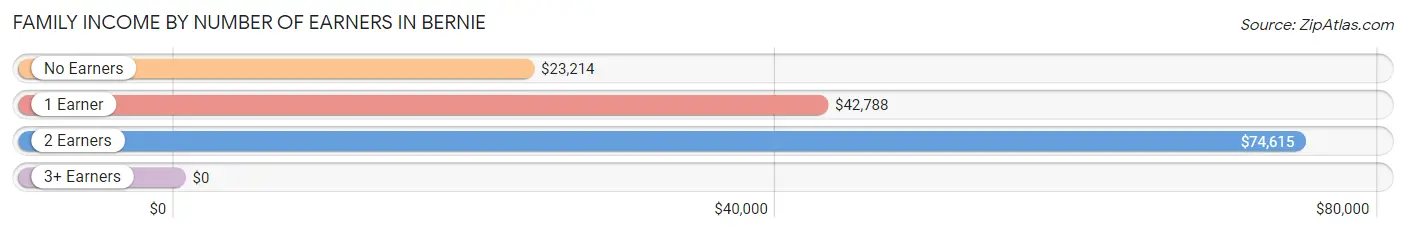
| Number of Earners | # Families | Median Income |
| No Earners | 136 (27.0%) | $23,214 |
| 1 Earner | 159 (31.6%) | $42,788 |
| 2 Earners | 194 (38.5%) | $74,615 |
| 3+ Earners | 15 (3.0%) | $0 |
| Total | 504 (100.0%) | $45,833 |
Household Income in Bernie
Household Income Brackets in Bernie
With 188 households falling in the category, the $35,000 to $49,999 income range is the most frequent in Bernie, accounting for 24.8% of all households. In contrast, only 2 households (0.3%) fall into the $200,000+ income bracket, making it the least populous group.
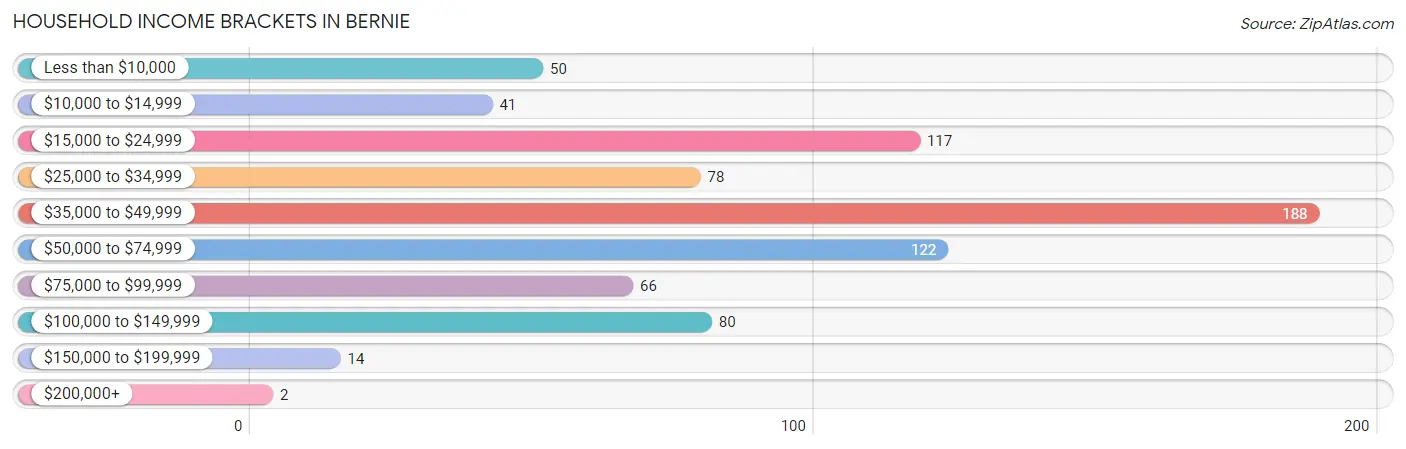
| Income Bracket | # Households | % Households |
| Less than $10,000 | 50 | 6.6% |
| $10,000 to $14,999 | 41 | 5.4% |
| $15,000 to $24,999 | 117 | 15.4% |
| $25,000 to $34,999 | 78 | 10.3% |
| $35,000 to $49,999 | 188 | 24.8% |
| $50,000 to $74,999 | 122 | 16.1% |
| $75,000 to $99,999 | 66 | 8.7% |
| $100,000 to $149,999 | 80 | 10.6% |
| $150,000 to $199,999 | 14 | 1.8% |
| $200,000+ | 2 | 0.3% |
Household Income by Householder Age in Bernie
The median household income in Bernie is $41,477, with the highest median household income of $49,138 found in the 45 to 64 years age bracket for the primary householder. A total of 276 households (36.4%) fall into this category.
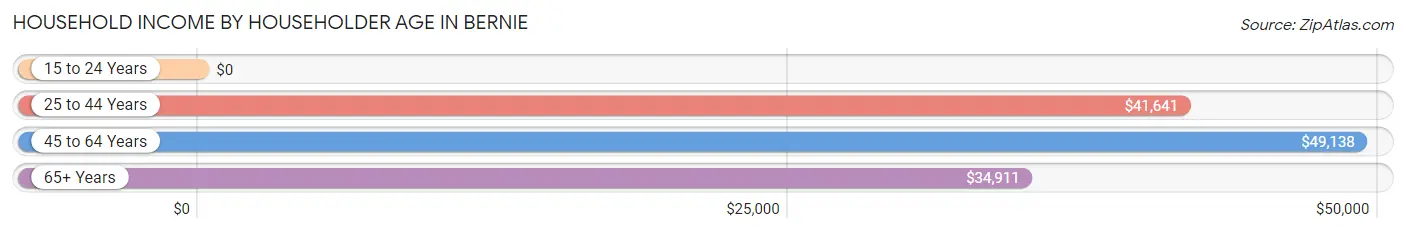
| Income Bracket | # Households | Median Income |
| 15 to 24 Years | 0 (0.0%) | $0 |
| 25 to 44 Years | 211 (27.8%) | $41,641 |
| 45 to 64 Years | 276 (36.4%) | $49,138 |
| 65+ Years | 271 (35.7%) | $34,911 |
| Total | 758 (100.0%) | $41,477 |
Poverty in Bernie
Income Below Poverty by Sex and Age in Bernie
With 24.8% poverty level for males and 22.7% for females among the residents of Bernie, 18 to 24 year old males and 18 to 24 year old females are the most vulnerable to poverty, with 52 males (83.9%) and 7 females (50.0%) in their respective age groups living below the poverty level.
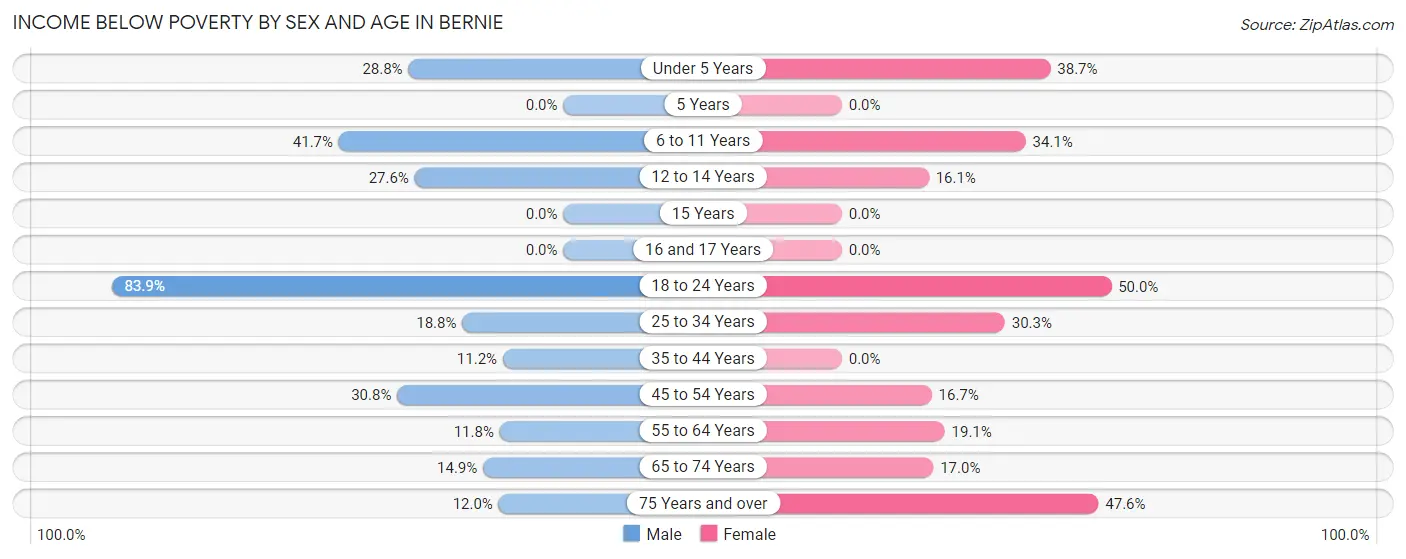
| Age Bracket | Male | Female |
| Under 5 Years | 23 (28.7%) | 24 (38.7%) |
| 5 Years | 0 (0.0%) | 0 (0.0%) |
| 6 to 11 Years | 25 (41.7%) | 29 (34.1%) |
| 12 to 14 Years | 8 (27.6%) | 5 (16.1%) |
| 15 Years | 0 (0.0%) | 0 (0.0%) |
| 16 and 17 Years | 0 (0.0%) | 0 (0.0%) |
| 18 to 24 Years | 52 (83.9%) | 7 (50.0%) |
| 25 to 34 Years | 24 (18.8%) | 36 (30.2%) |
| 35 to 44 Years | 11 (11.2%) | 0 (0.0%) |
| 45 to 54 Years | 41 (30.8%) | 31 (16.7%) |
| 55 to 64 Years | 15 (11.8%) | 29 (19.1%) |
| 65 to 74 Years | 21 (14.9%) | 28 (17.0%) |
| 75 Years and over | 3 (12.0%) | 40 (47.6%) |
| Total | 223 (24.8%) | 229 (22.7%) |
Income Above Poverty by Sex and Age in Bernie
According to the poverty statistics in Bernie, males aged 5 years and females aged 5 years are the age groups that are most secure financially, with 100.0% of males and 100.0% of females in these age groups living above the poverty line.
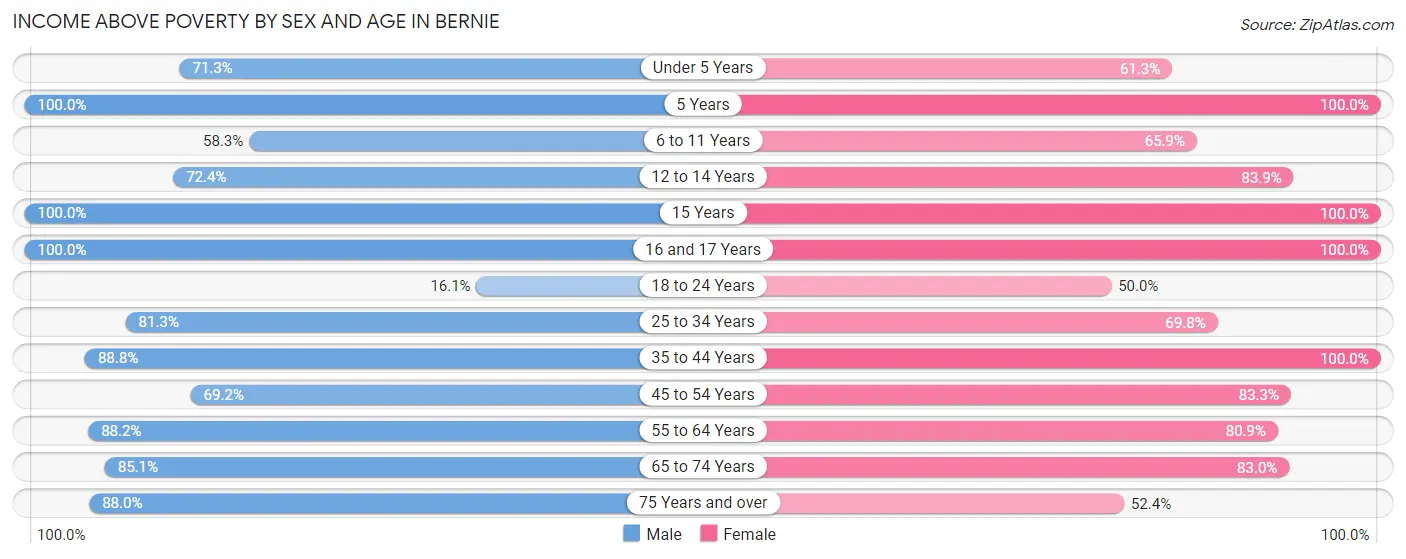
| Age Bracket | Male | Female |
| Under 5 Years | 57 (71.3%) | 38 (61.3%) |
| 5 Years | 2 (100.0%) | 4 (100.0%) |
| 6 to 11 Years | 35 (58.3%) | 56 (65.9%) |
| 12 to 14 Years | 21 (72.4%) | 26 (83.9%) |
| 15 Years | 8 (100.0%) | 8 (100.0%) |
| 16 and 17 Years | 7 (100.0%) | 25 (100.0%) |
| 18 to 24 Years | 10 (16.1%) | 7 (50.0%) |
| 25 to 34 Years | 104 (81.2%) | 83 (69.8%) |
| 35 to 44 Years | 87 (88.8%) | 75 (100.0%) |
| 45 to 54 Years | 92 (69.2%) | 155 (83.3%) |
| 55 to 64 Years | 112 (88.2%) | 123 (80.9%) |
| 65 to 74 Years | 120 (85.1%) | 137 (83.0%) |
| 75 Years and over | 22 (88.0%) | 44 (52.4%) |
| Total | 677 (75.2%) | 781 (77.3%) |
Income Below Poverty Among Married-Couple Families in Bernie
The poverty statistics for married-couple families in Bernie show that 8.2% or 32 of the total 390 families live below the poverty line. Families with 5 or more children have the highest poverty rate of 100.0%, comprising of 8 families. On the other hand, families with 1 or 2 children have the lowest poverty rate of 0.0%, which includes 0 families.
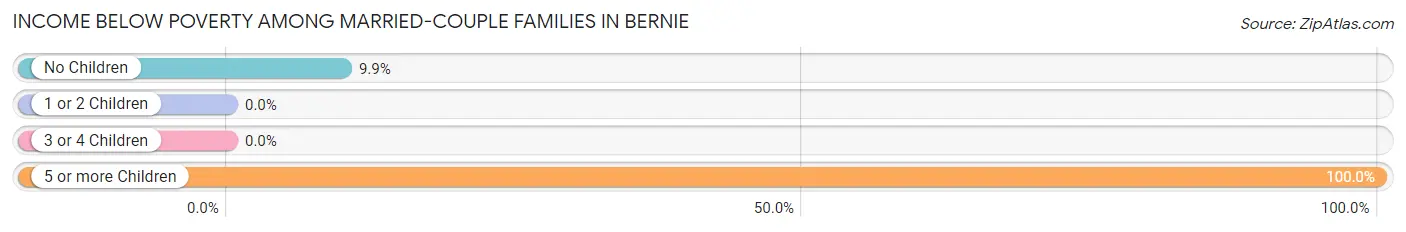
| Children | Above Poverty | Below Poverty |
| No Children | 218 (90.1%) | 24 (9.9%) |
| 1 or 2 Children | 115 (100.0%) | 0 (0.0%) |
| 3 or 4 Children | 25 (100.0%) | 0 (0.0%) |
| 5 or more Children | 0 (0.0%) | 8 (100.0%) |
| Total | 358 (91.8%) | 32 (8.2%) |
Income Below Poverty Among Single-Parent Households in Bernie
According to the poverty data in Bernie, 68.2% or 15 single-father households and 34.8% or 32 single-mother households are living below the poverty line. Among single-father households, those with 3 or 4 children have the highest poverty rate, with 15 households (68.2%) experiencing poverty. Likewise, among single-mother households, those with 3 or 4 children have the highest poverty rate, with 13 households (76.5%) falling below the poverty line.
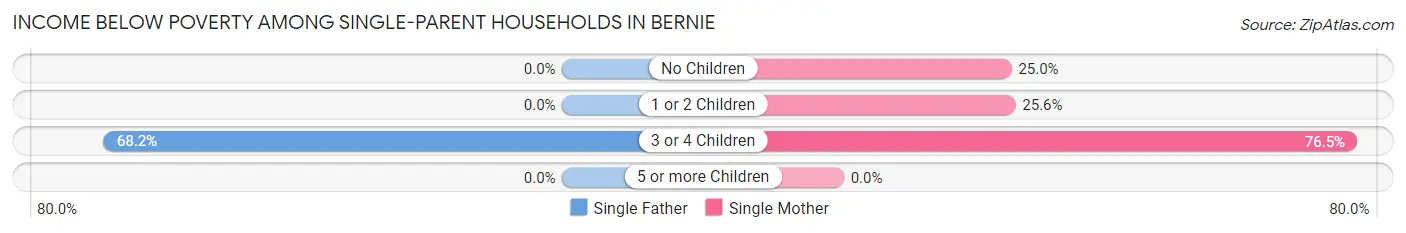
| Children | Single Father | Single Mother |
| No Children | 0 (0.0%) | 8 (25.0%) |
| 1 or 2 Children | 0 (0.0%) | 11 (25.6%) |
| 3 or 4 Children | 15 (68.2%) | 13 (76.5%) |
| 5 or more Children | 0 (0.0%) | 0 (0.0%) |
| Total | 15 (68.2%) | 32 (34.8%) |
Income Below Poverty Among Married-Couple vs Single-Parent Households in Bernie
The poverty data for Bernie shows that 32 of the married-couple family households (8.2%) and 47 of the single-parent households (41.2%) are living below the poverty level. Within the married-couple family households, those with 5 or more children have the highest poverty rate, with 8 households (100.0%) falling below the poverty line. Among the single-parent households, those with 3 or 4 children have the highest poverty rate, with 28 household (71.8%) living below poverty.
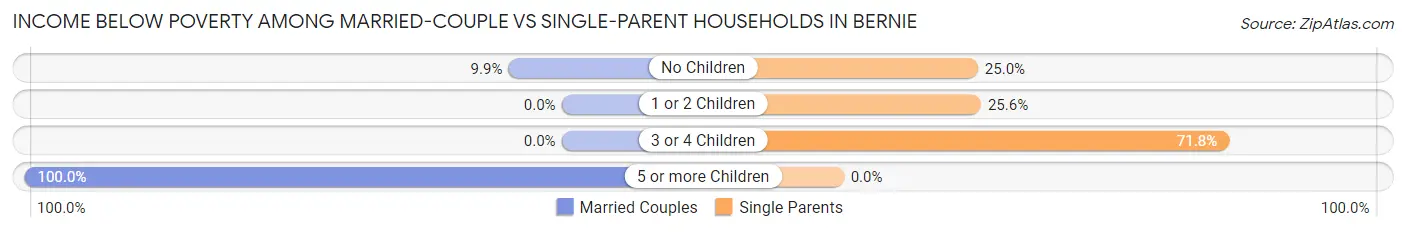
| Children | Married-Couple Families | Single-Parent Households |
| No Children | 24 (9.9%) | 8 (25.0%) |
| 1 or 2 Children | 0 (0.0%) | 11 (25.6%) |
| 3 or 4 Children | 0 (0.0%) | 28 (71.8%) |
| 5 or more Children | 8 (100.0%) | 0 (0.0%) |
| Total | 32 (8.2%) | 47 (41.2%) |
Race in Bernie
The most populous races in Bernie are White / Caucasian (1,736 | 90.6%), Two or more Races (73 | 3.8%), and Black / African American (62 | 3.2%).
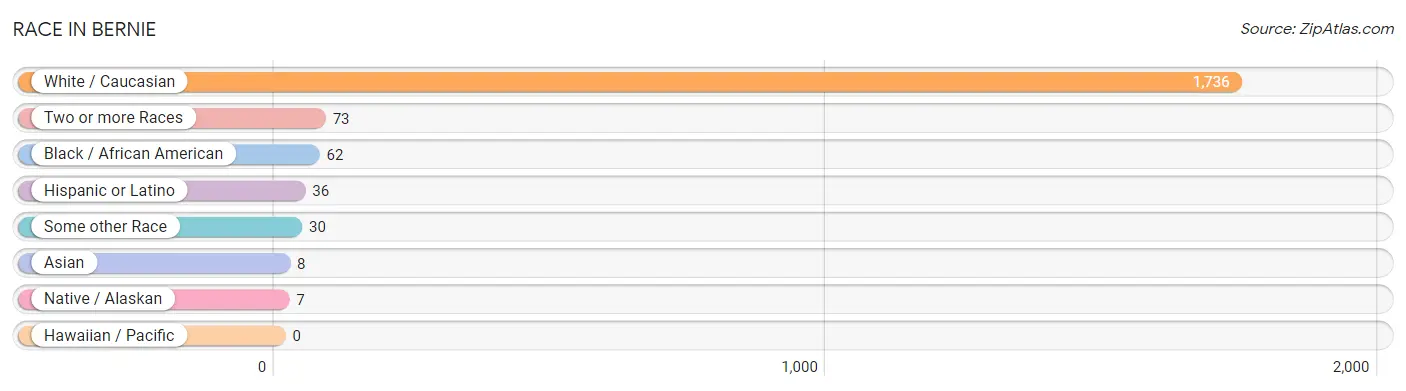
| Race | # Population | % Population |
| Asian | 8 | 0.4% |
| Black / African American | 62 | 3.2% |
| Hawaiian / Pacific | 0 | 0.0% |
| Hispanic or Latino | 36 | 1.9% |
| Native / Alaskan | 7 | 0.4% |
| White / Caucasian | 1,736 | 90.6% |
| Two or more Races | 73 | 3.8% |
| Some other Race | 30 | 1.6% |
| Total | 1,916 | 100.0% |
Ancestry in Bernie
The most populous ancestries reported in Bernie are Irish (351 | 18.3%), German (294 | 15.3%), English (261 | 13.6%), American (200 | 10.4%), and Scotch-Irish (66 | 3.4%), together accounting for 61.2% of all Bernie residents.
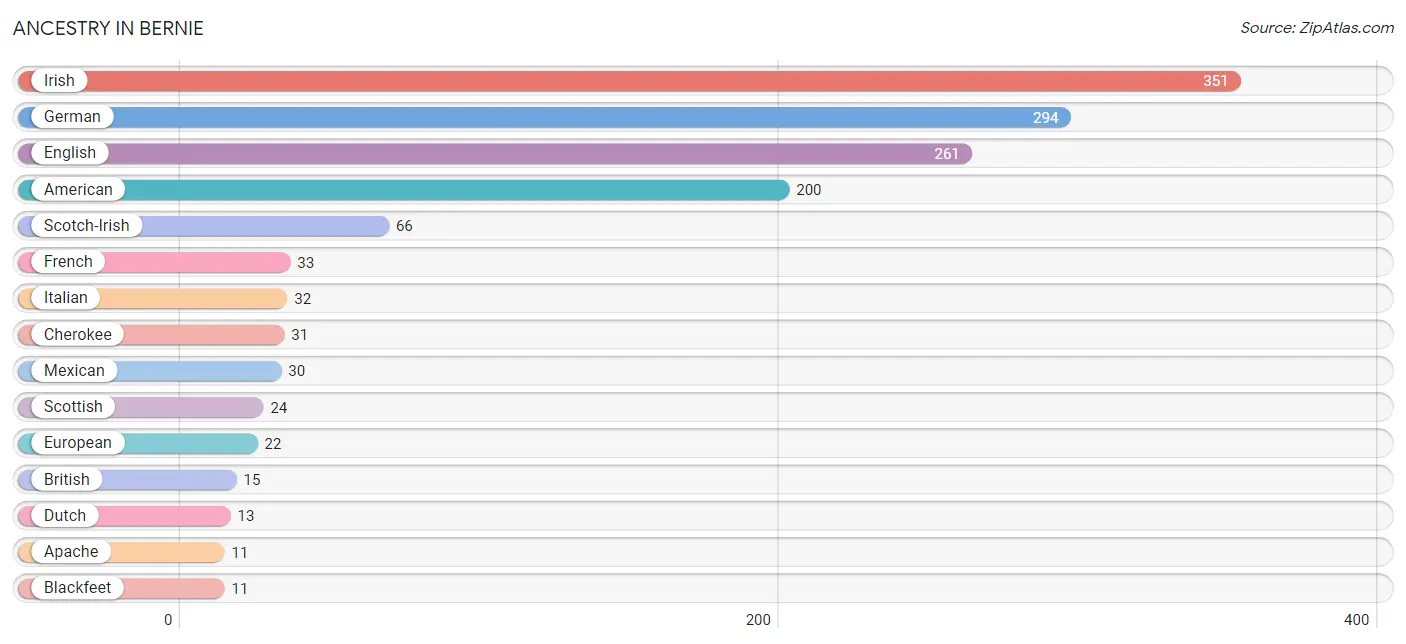
| Ancestry | # Population | % Population |
| American | 200 | 10.4% |
| Apache | 11 | 0.6% |
| Austrian | 3 | 0.2% |
| Belgian | 9 | 0.5% |
| Blackfeet | 11 | 0.6% |
| British | 15 | 0.8% |
| Central American | 4 | 0.2% |
| Cherokee | 31 | 1.6% |
| Comanche | 1 | 0.1% |
| Dutch | 13 | 0.7% |
| English | 261 | 13.6% |
| European | 22 | 1.1% |
| French | 33 | 1.7% |
| German | 294 | 15.3% |
| Guatemalan | 4 | 0.2% |
| Irish | 351 | 18.3% |
| Italian | 32 | 1.7% |
| Mexican | 30 | 1.6% |
| Norwegian | 8 | 0.4% |
| Pakistani | 4 | 0.2% |
| Polish | 10 | 0.5% |
| Scotch-Irish | 66 | 3.4% |
| Scottish | 24 | 1.3% |
| Spaniard | 2 | 0.1% |
| Welsh | 4 | 0.2% | View All 25 Rows |
Immigrants in Bernie
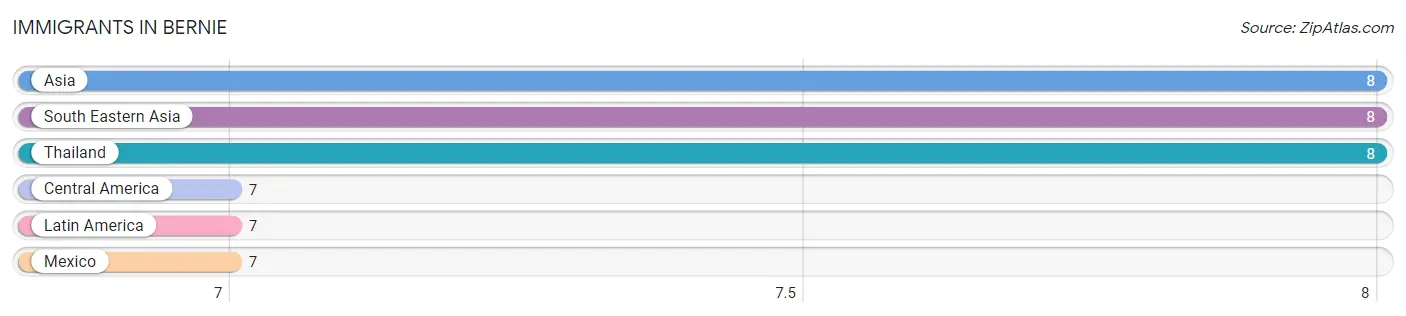
The most numerous immigrant groups reported in Bernie came from Asia (8 | 0.4%), South Eastern Asia (8 | 0.4%), Thailand (8 | 0.4%), Central America (7 | 0.4%), and Latin America (7 | 0.4%), together accounting for 2.0% of all Bernie residents.
| Immigration Origin | # Population | % Population |
| Asia | 8 | 0.4% |
| Central America | 7 | 0.4% |
| Latin America | 7 | 0.4% |
| Mexico | 7 | 0.4% |
| South Eastern Asia | 8 | 0.4% |
| Thailand | 8 | 0.4% | View All 6 Rows |
Sex and Age in Bernie
Sex and Age in Bernie
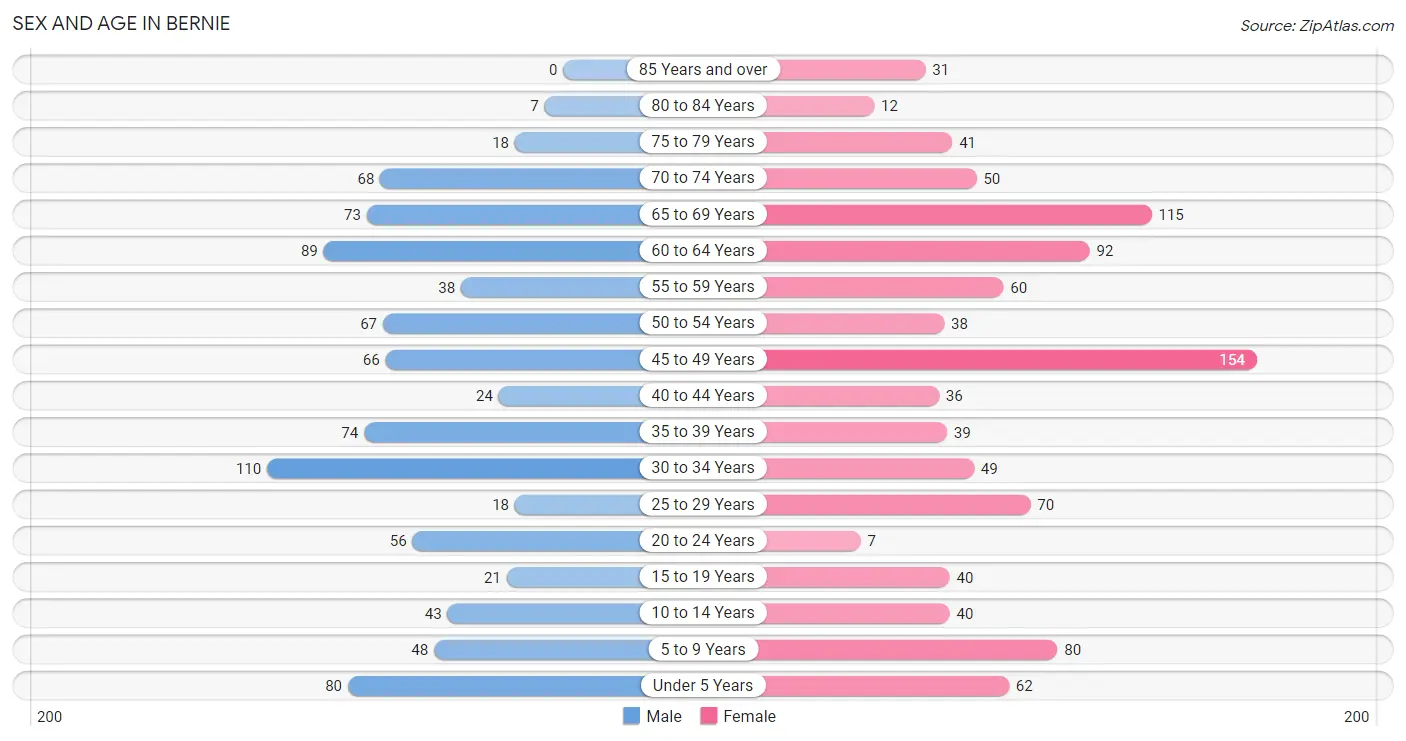
The most populous age groups in Bernie are 30 to 34 Years (110 | 12.2%) for men and 45 to 49 Years (154 | 15.2%) for women.
| Age Bracket | Male | Female |
| Under 5 Years | 80 (8.9%) | 62 (6.1%) |
| 5 to 9 Years | 48 (5.3%) | 80 (7.9%) |
| 10 to 14 Years | 43 (4.8%) | 40 (3.9%) |
| 15 to 19 Years | 21 (2.3%) | 40 (3.9%) |
| 20 to 24 Years | 56 (6.2%) | 7 (0.7%) |
| 25 to 29 Years | 18 (2.0%) | 70 (6.9%) |
| 30 to 34 Years | 110 (12.2%) | 49 (4.8%) |
| 35 to 39 Years | 74 (8.2%) | 39 (3.8%) |
| 40 to 44 Years | 24 (2.7%) | 36 (3.5%) |
| 45 to 49 Years | 66 (7.3%) | 154 (15.2%) |
| 50 to 54 Years | 67 (7.4%) | 38 (3.7%) |
| 55 to 59 Years | 38 (4.2%) | 60 (5.9%) |
| 60 to 64 Years | 89 (9.9%) | 92 (9.1%) |
| 65 to 69 Years | 73 (8.1%) | 115 (11.3%) |
| 70 to 74 Years | 68 (7.6%) | 50 (4.9%) |
| 75 to 79 Years | 18 (2.0%) | 41 (4.0%) |
| 80 to 84 Years | 7 (0.8%) | 12 (1.2%) |
| 85 Years and over | 0 (0.0%) | 31 (3.0%) |
| Total | 900 (100.0%) | 1,016 (100.0%) |
Families and Households in Bernie
Median Family Size in Bernie
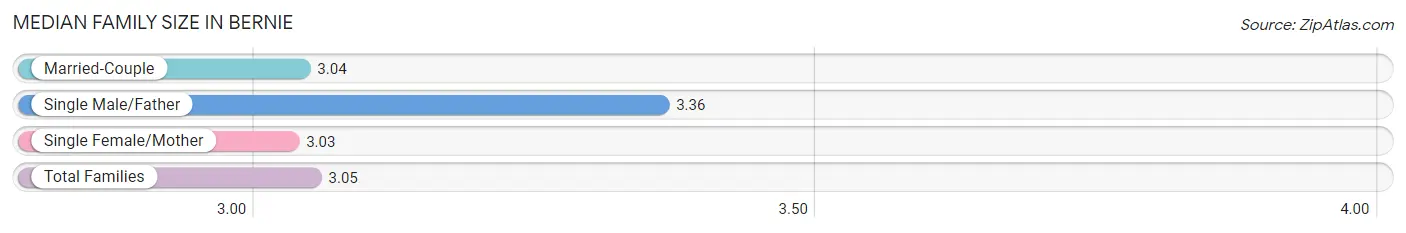
The median family size in Bernie is 3.05 persons per family, with single male/father families (22 | 4.4%) accounting for the largest median family size of 3.36 persons per family. On the other hand, single female/mother families (92 | 18.2%) represent the smallest median family size with 3.03 persons per family.
| Family Type | # Families | Family Size |
| Married-Couple | 390 (77.4%) | 3.04 |
| Single Male/Father | 22 (4.4%) | 3.36 |
| Single Female/Mother | 92 (18.2%) | 3.03 |
| Total Families | 504 (100.0%) | 3.05 |
Median Household Size in Bernie
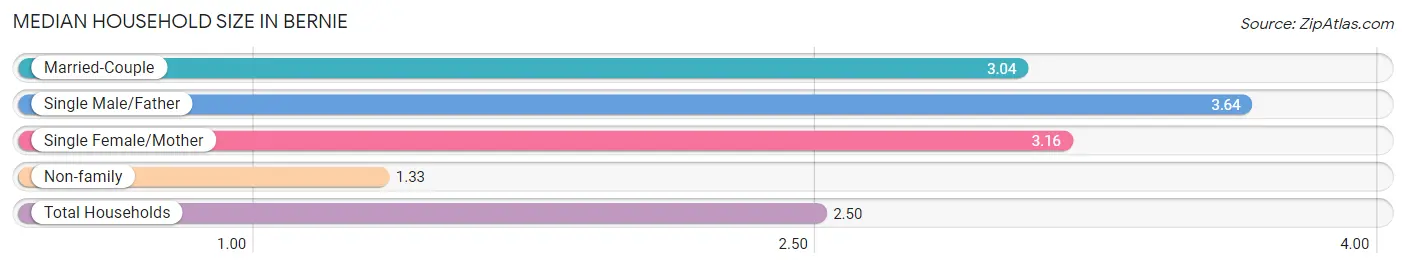
The median household size in Bernie is 2.50 persons per household, with single male/father households (22 | 2.9%) accounting for the largest median household size of 3.64 persons per household. non-family households (254 | 33.5%) represent the smallest median household size with 1.33 persons per household.
| Household Type | # Households | Household Size |
| Married-Couple | 390 (51.4%) | 3.04 |
| Single Male/Father | 22 (2.9%) | 3.64 |
| Single Female/Mother | 92 (12.1%) | 3.16 |
| Non-family | 254 (33.5%) | 1.33 |
| Total Households | 758 (100.0%) | 2.50 |
Household Size by Marriage Status in Bernie
Out of a total of 758 households in Bernie, 504 (66.5%) are family households, while 254 (33.5%) are nonfamily households. The most numerous type of family households are 2-person households, comprising 236, and the most common type of nonfamily households are 1-person households, comprising 207.
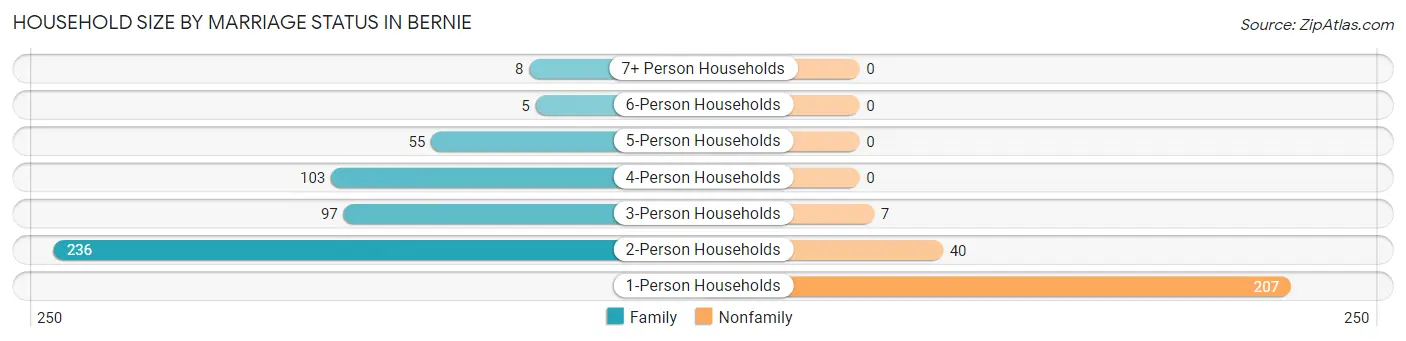
| Household Size | Family Households | Nonfamily Households |
| 1-Person Households | - | 207 (27.3%) |
| 2-Person Households | 236 (31.1%) | 40 (5.3%) |
| 3-Person Households | 97 (12.8%) | 7 (0.9%) |
| 4-Person Households | 103 (13.6%) | 0 (0.0%) |
| 5-Person Households | 55 (7.3%) | 0 (0.0%) |
| 6-Person Households | 5 (0.7%) | 0 (0.0%) |
| 7+ Person Households | 8 (1.1%) | 0 (0.0%) |
| Total | 504 (66.5%) | 254 (33.5%) |
Female Fertility in Bernie
Fertility by Age in Bernie
Average fertility rate in Bernie is 5.0 births per 1,000 women. Women in the age bracket of 20 to 34 years have the highest fertility rate with 16.0 births per 1,000 women. Women in the age bracket of 20 to 34 years acount for 100.0% of all women with births.
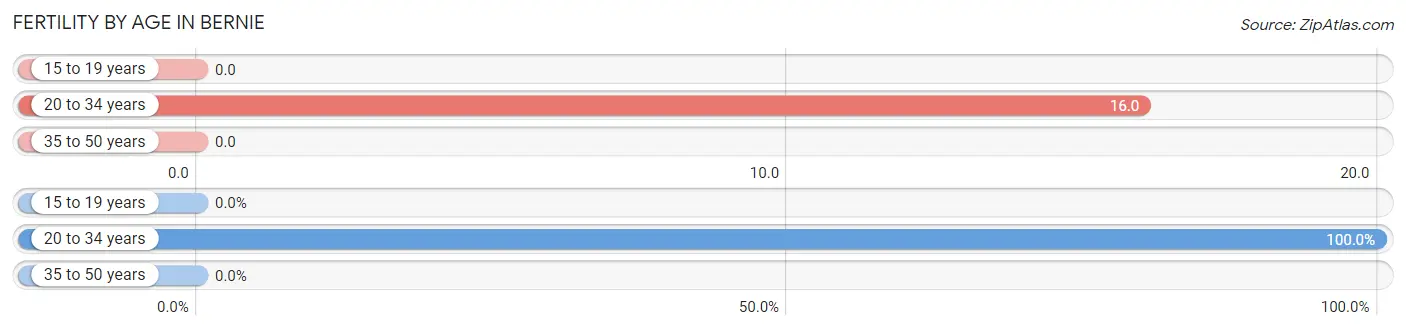
| Age Bracket | Women with Births | Births / 1,000 Women |
| 15 to 19 years | 0 (0.0%) | 0.0 |
| 20 to 34 years | 2 (100.0%) | 16.0 |
| 35 to 50 years | 0 (0.0%) | 0.0 |
| Total | 2 (100.0%) | 5.0 |
Fertility by Age by Marriage Status in Bernie
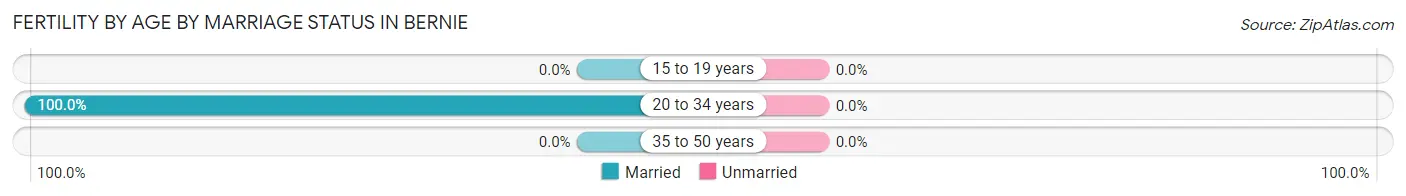
| Age Bracket | Married | Unmarried |
| 15 to 19 years | 0 (0.0%) | 0 (0.0%) |
| 20 to 34 years | 2 (100.0%) | 0 (0.0%) |
| 35 to 50 years | 0 (0.0%) | 0 (0.0%) |
| Total | 2 (100.0%) | 0 (0.0%) |
Fertility by Education in Bernie
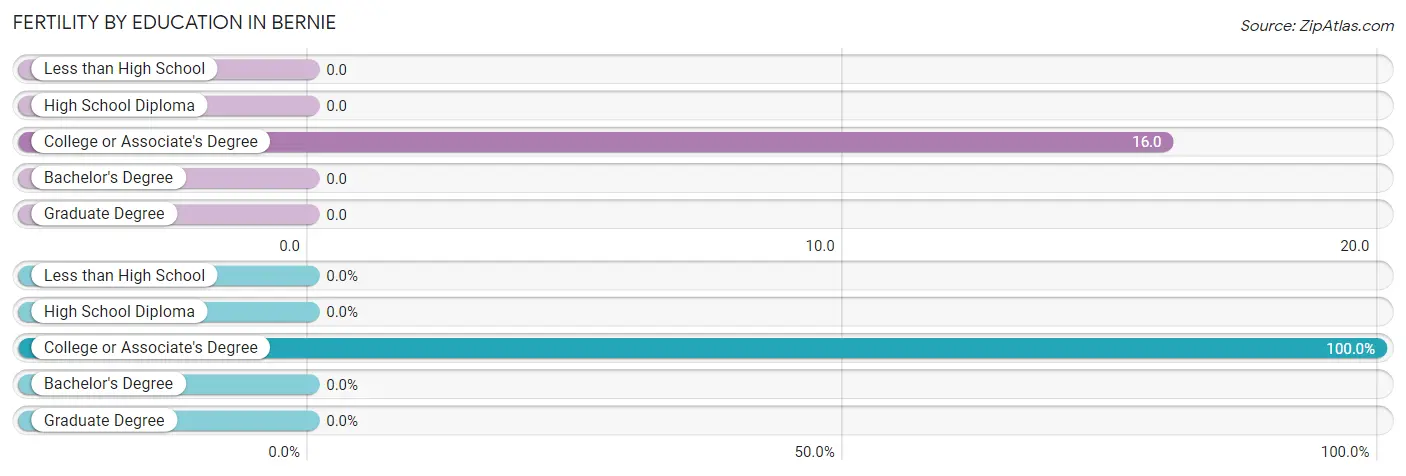
| Educational Attainment | Women with Births | Births / 1,000 Women |
| Less than High School | 0 (0.0%) | 0.0 |
| High School Diploma | 0 (0.0%) | 0.0 |
| College or Associate's Degree | 2 (100.0%) | 16.0 |
| Bachelor's Degree | 0 (0.0%) | 0.0 |
| Graduate Degree | 0 (0.0%) | 0.0 |
| Total | 2 (100.0%) | 5.0 |
Fertility by Education by Marriage Status in Bernie
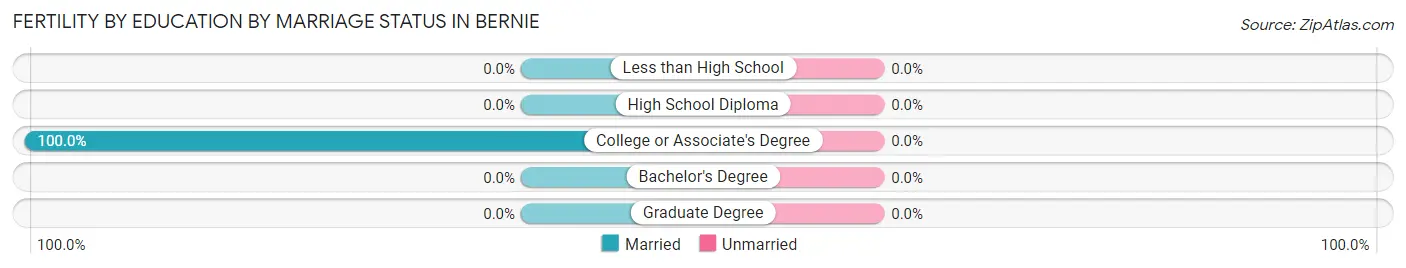
| Educational Attainment | Married | Unmarried |
| Less than High School | 0 (0.0%) | 0 (0.0%) |
| High School Diploma | 0 (0.0%) | 0 (0.0%) |
| College or Associate's Degree | 2 (100.0%) | 0 (0.0%) |
| Bachelor's Degree | 0 (0.0%) | 0 (0.0%) |
| Graduate Degree | 0 (0.0%) | 0 (0.0%) |
| Total | 2 (100.0%) | 0 (0.0%) |
Employment Characteristics in Bernie
Employment by Class of Employer in Bernie
Among the 630 employed individuals in Bernie, private company employees (459 | 72.9%), local government employees (62 | 9.8%), and self-employed (not incorporated) (44 | 7.0%) make up the most common classes of employment.
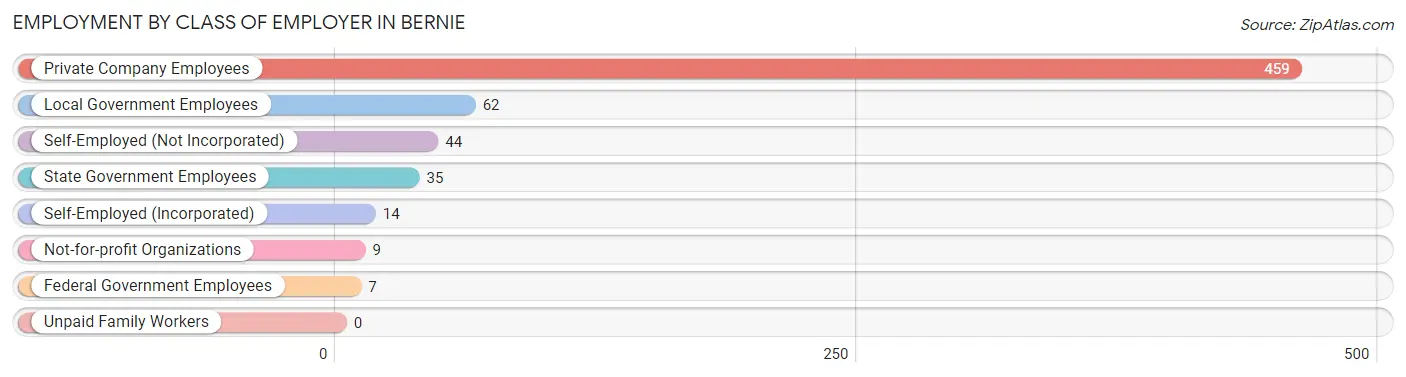
| Employer Class | # Employees | % Employees |
| Private Company Employees | 459 | 72.9% |
| Self-Employed (Incorporated) | 14 | 2.2% |
| Self-Employed (Not Incorporated) | 44 | 7.0% |
| Not-for-profit Organizations | 9 | 1.4% |
| Local Government Employees | 62 | 9.8% |
| State Government Employees | 35 | 5.6% |
| Federal Government Employees | 7 | 1.1% |
| Unpaid Family Workers | 0 | 0.0% |
| Total | 630 | 100.0% |
Employment Status by Age in Bernie
According to the labor force statistics for Bernie, out of the total population over 16 years of age (1,547), 42.6% or 659 individuals are in the labor force, with 2.1% or 14 of them unemployed. The age group with the highest labor force participation rate is 55 to 59 years, with 76.5% or 75 individuals in the labor force. Within the labor force, the 20 to 24 years age range has the highest percentage of unemployed individuals, with 60.0% or 6 of them being unemployed.
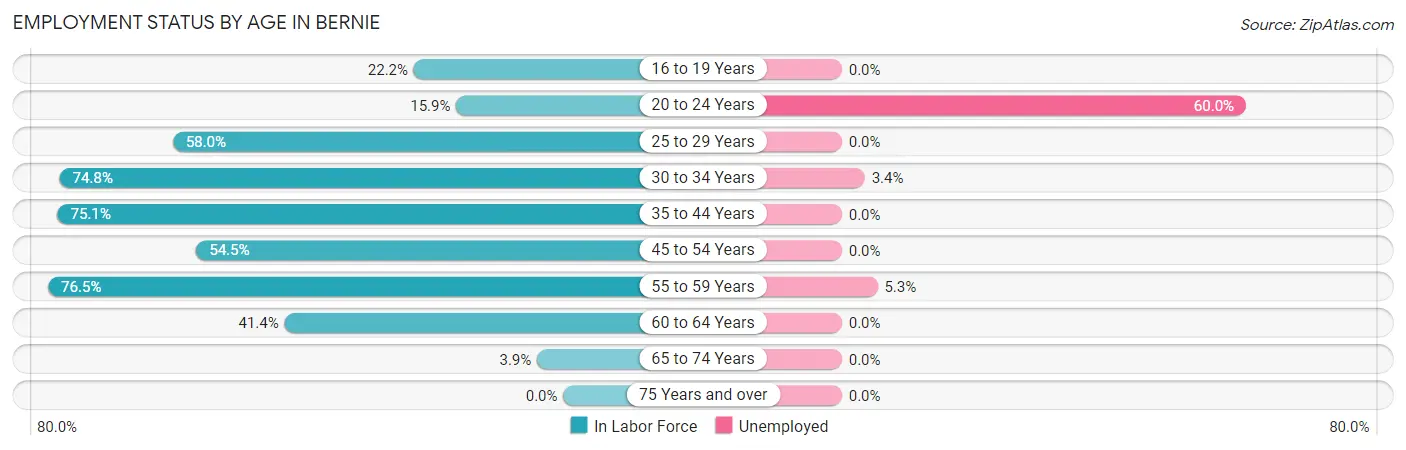
| Age Bracket | In Labor Force | Unemployed |
| 16 to 19 Years | 10 (22.2%) | 0 (0.0%) |
| 20 to 24 Years | 10 (15.9%) | 6 (60.0%) |
| 25 to 29 Years | 51 (58.0%) | 0 (0.0%) |
| 30 to 34 Years | 119 (74.8%) | 4 (3.4%) |
| 35 to 44 Years | 130 (75.1%) | 0 (0.0%) |
| 45 to 54 Years | 177 (54.5%) | 0 (0.0%) |
| 55 to 59 Years | 75 (76.5%) | 4 (5.3%) |
| 60 to 64 Years | 75 (41.4%) | 0 (0.0%) |
| 65 to 74 Years | 12 (3.9%) | 0 (0.0%) |
| 75 Years and over | 0 (0.0%) | 0 (0.0%) |
| Total | 659 (42.6%) | 14 (2.1%) |
Employment Status by Educational Attainment in Bernie
According to labor force statistics for Bernie, 61.2% of individuals (627) out of the total population between 25 and 64 years of age (1,024) are in the labor force, with 1.3% or 8 of them being unemployed. The group with the highest labor force participation rate are those with the educational attainment of bachelor's degree or higher, with 96.0% or 119 individuals in the labor force. Within the labor force, individuals with less than high school education have the highest percentage of unemployment, with 10.5% or 8 of them being unemployed.
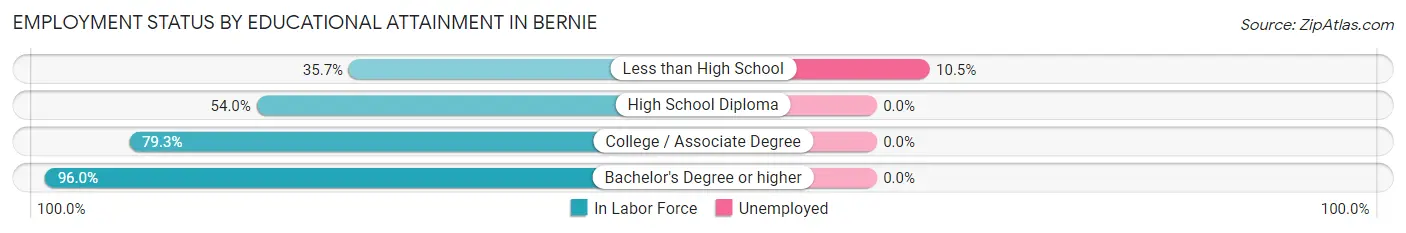
| Educational Attainment | In Labor Force | Unemployed |
| Less than High School | 76 (35.7%) | 22 (10.5%) |
| High School Diploma | 241 (54.0%) | 0 (0.0%) |
| College / Associate Degree | 191 (79.3%) | 0 (0.0%) |
| Bachelor's Degree or higher | 119 (96.0%) | 0 (0.0%) |
| Total | 627 (61.2%) | 13 (1.3%) |
Employment Occupations by Sex in Bernie
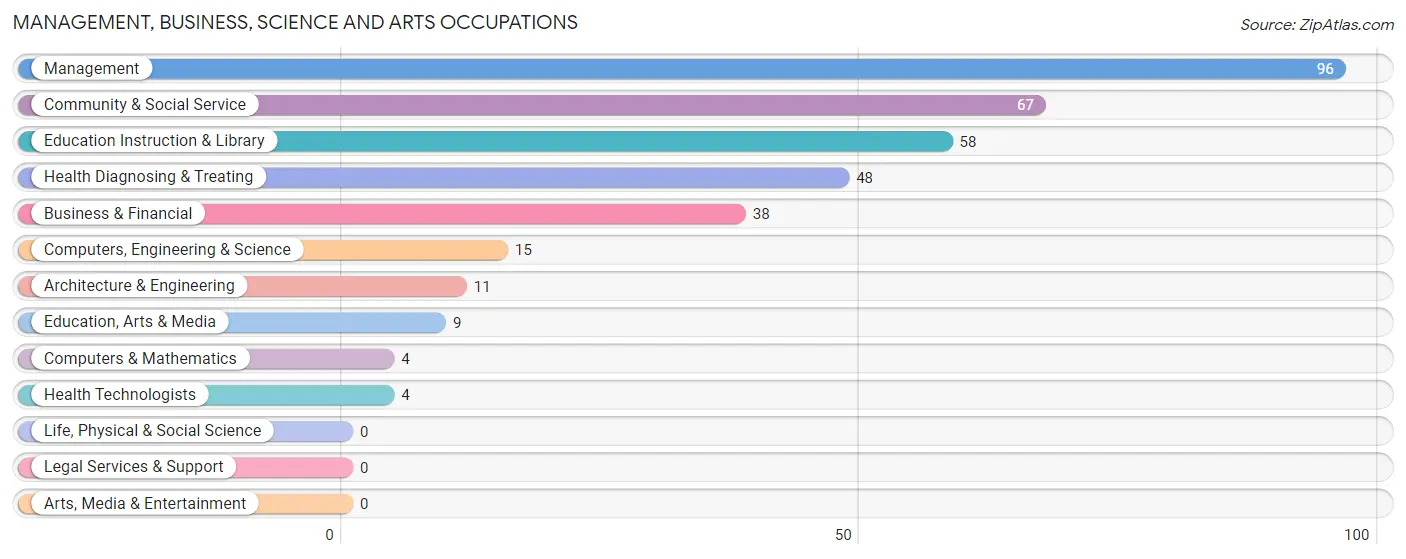
Management, Business, Science and Arts Occupations
The most common Management, Business, Science and Arts occupations in Bernie are Management (96 | 14.9%), Community & Social Service (67 | 10.4%), Education Instruction & Library (58 | 9.0%), Health Diagnosing & Treating (48 | 7.4%), and Business & Financial (38 | 5.9%).
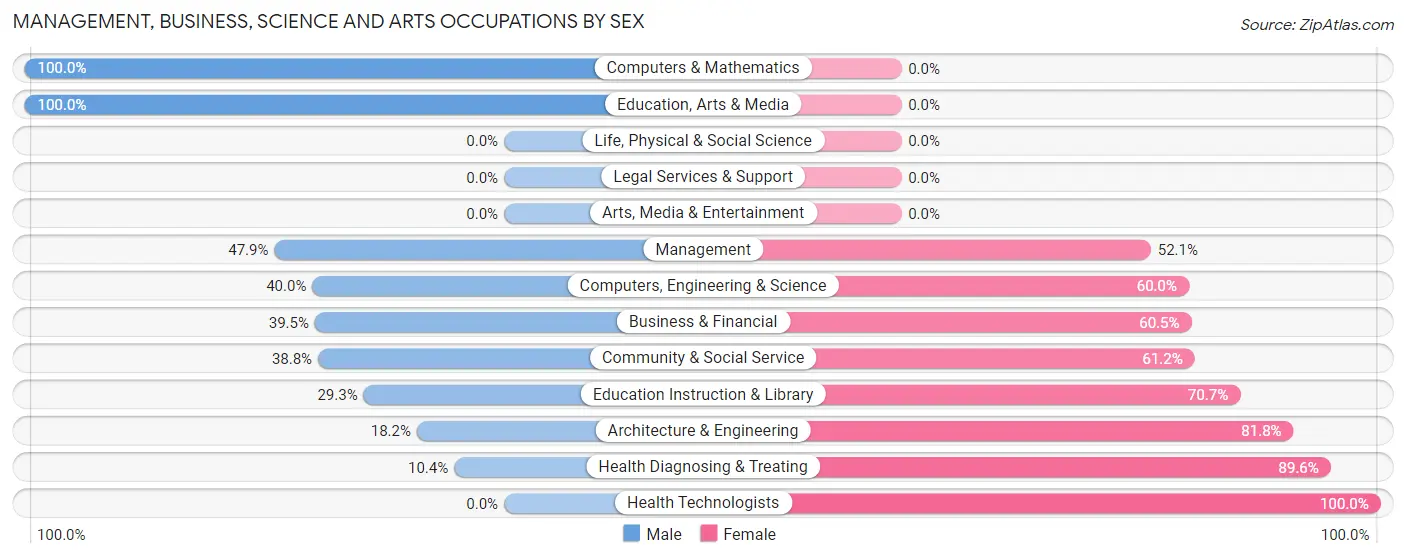
Management, Business, Science and Arts Occupations by Sex
Within the Management, Business, Science and Arts occupations in Bernie, the most male-oriented occupations are Computers & Mathematics (100.0%), Education, Arts & Media (100.0%), and Management (47.9%), while the most female-oriented occupations are Health Technologists (100.0%), Health Diagnosing & Treating (89.6%), and Architecture & Engineering (81.8%).
| Occupation | Male | Female |
| Management | 46 (47.9%) | 50 (52.1%) |
| Business & Financial | 15 (39.5%) | 23 (60.5%) |
| Computers, Engineering & Science | 6 (40.0%) | 9 (60.0%) |
| Computers & Mathematics | 4 (100.0%) | 0 (0.0%) |
| Architecture & Engineering | 2 (18.2%) | 9 (81.8%) |
| Life, Physical & Social Science | 0 (0.0%) | 0 (0.0%) |
| Community & Social Service | 26 (38.8%) | 41 (61.2%) |
| Education, Arts & Media | 9 (100.0%) | 0 (0.0%) |
| Legal Services & Support | 0 (0.0%) | 0 (0.0%) |
| Education Instruction & Library | 17 (29.3%) | 41 (70.7%) |
| Arts, Media & Entertainment | 0 (0.0%) | 0 (0.0%) |
| Health Diagnosing & Treating | 5 (10.4%) | 43 (89.6%) |
| Health Technologists | 0 (0.0%) | 4 (100.0%) |
| Total (Category) | 98 (37.1%) | 166 (62.9%) |
| Total (Overall) | 298 (46.2%) | 347 (53.8%) |
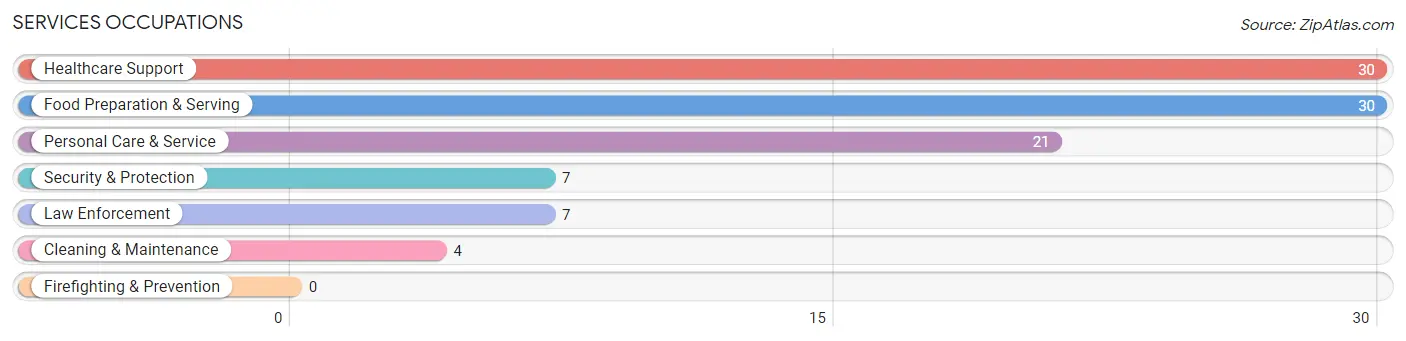
Services Occupations
The most common Services occupations in Bernie are Healthcare Support (30 | 4.6%), Food Preparation & Serving (30 | 4.6%), Personal Care & Service (21 | 3.3%), Security & Protection (7 | 1.1%), and Law Enforcement (7 | 1.1%).
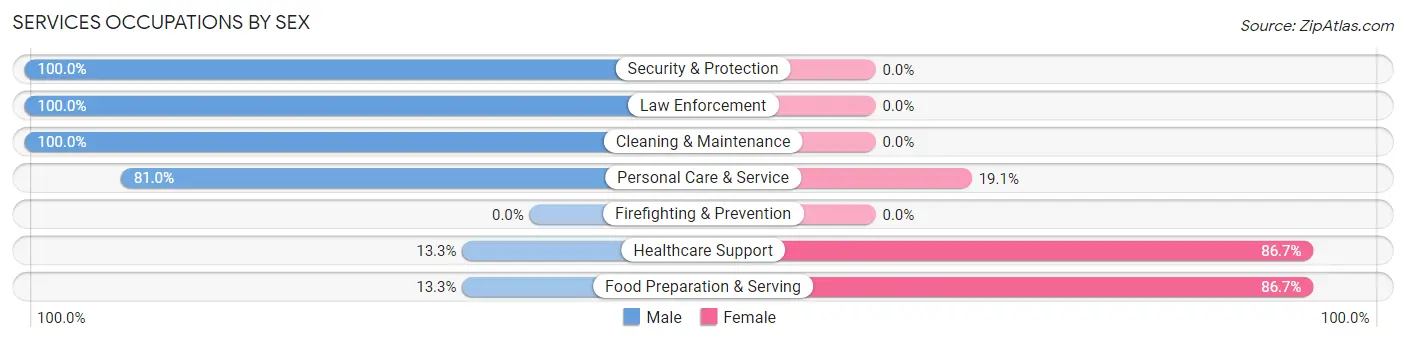
Services Occupations by Sex
Within the Services occupations in Bernie, the most male-oriented occupations are Security & Protection (100.0%), Law Enforcement (100.0%), and Cleaning & Maintenance (100.0%), while the most female-oriented occupations are Healthcare Support (86.7%), Food Preparation & Serving (86.7%), and Personal Care & Service (19.1%).
| Occupation | Male | Female |
| Healthcare Support | 4 (13.3%) | 26 (86.7%) |
| Security & Protection | 7 (100.0%) | 0 (0.0%) |
| Firefighting & Prevention | 0 (0.0%) | 0 (0.0%) |
| Law Enforcement | 7 (100.0%) | 0 (0.0%) |
| Food Preparation & Serving | 4 (13.3%) | 26 (86.7%) |
| Cleaning & Maintenance | 4 (100.0%) | 0 (0.0%) |
| Personal Care & Service | 17 (80.9%) | 4 (19.1%) |
| Total (Category) | 36 (39.1%) | 56 (60.9%) |
| Total (Overall) | 298 (46.2%) | 347 (53.8%) |
Sales and Office Occupations
The most common Sales and Office occupations in Bernie are Office & Administration (82 | 12.7%), and Sales & Related (44 | 6.8%).
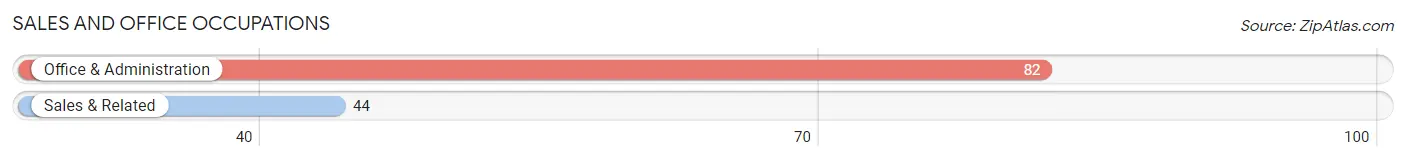
Sales and Office Occupations by Sex
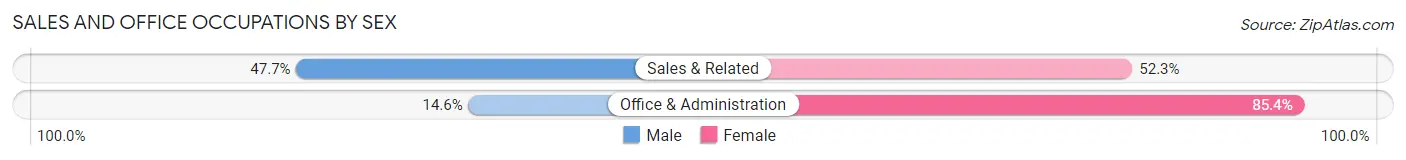
| Occupation | Male | Female |
| Sales & Related | 21 (47.7%) | 23 (52.3%) |
| Office & Administration | 12 (14.6%) | 70 (85.4%) |
| Total (Category) | 33 (26.2%) | 93 (73.8%) |
| Total (Overall) | 298 (46.2%) | 347 (53.8%) |
Natural Resources, Construction and Maintenance Occupations
The most common Natural Resources, Construction and Maintenance occupations in Bernie are Farming, Fishing & Forestry (29 | 4.5%), Construction & Extraction (24 | 3.7%), and Installation, Maintenance & Repair (2 | 0.3%).
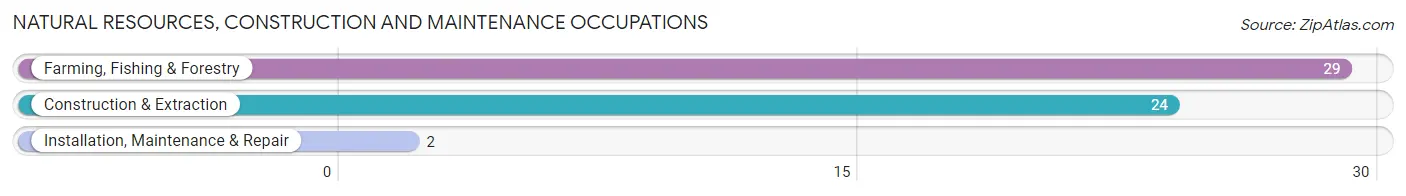
Natural Resources, Construction and Maintenance Occupations by Sex
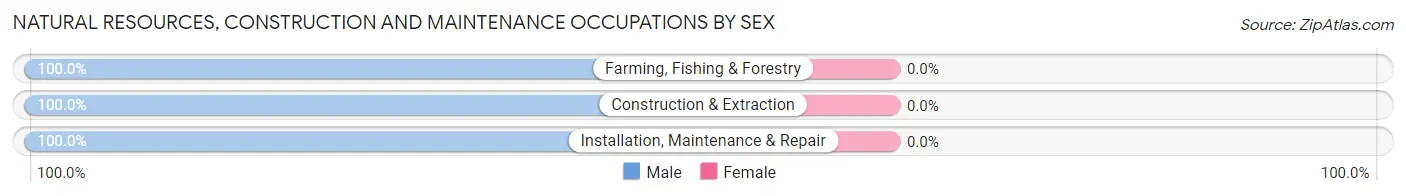
| Occupation | Male | Female |
| Farming, Fishing & Forestry | 29 (100.0%) | 0 (0.0%) |
| Construction & Extraction | 24 (100.0%) | 0 (0.0%) |
| Installation, Maintenance & Repair | 2 (100.0%) | 0 (0.0%) |
| Total (Category) | 55 (100.0%) | 0 (0.0%) |
| Total (Overall) | 298 (46.2%) | 347 (53.8%) |
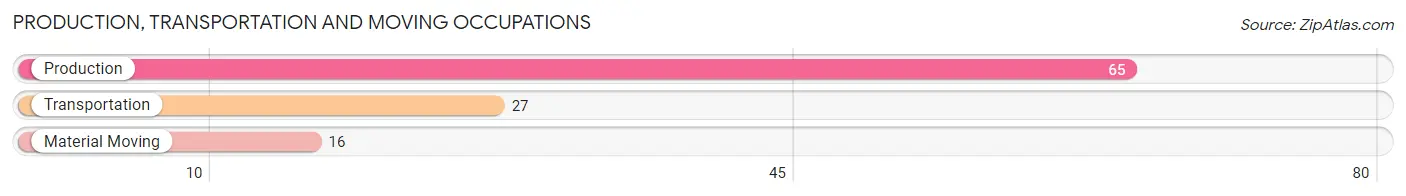
Production, Transportation and Moving Occupations
The most common Production, Transportation and Moving occupations in Bernie are Production (65 | 10.1%), Transportation (27 | 4.2%), and Material Moving (16 | 2.5%).
Production, Transportation and Moving Occupations by Sex
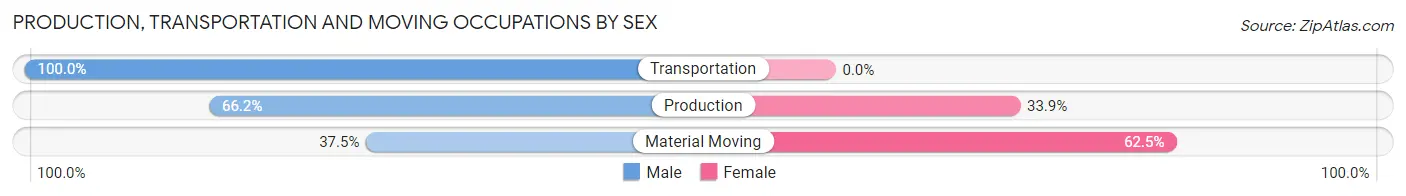
| Occupation | Male | Female |
| Production | 43 (66.1%) | 22 (33.9%) |
| Transportation | 27 (100.0%) | 0 (0.0%) |
| Material Moving | 6 (37.5%) | 10 (62.5%) |
| Total (Category) | 76 (70.4%) | 32 (29.6%) |
| Total (Overall) | 298 (46.2%) | 347 (53.8%) |
Employment Industries by Sex in Bernie
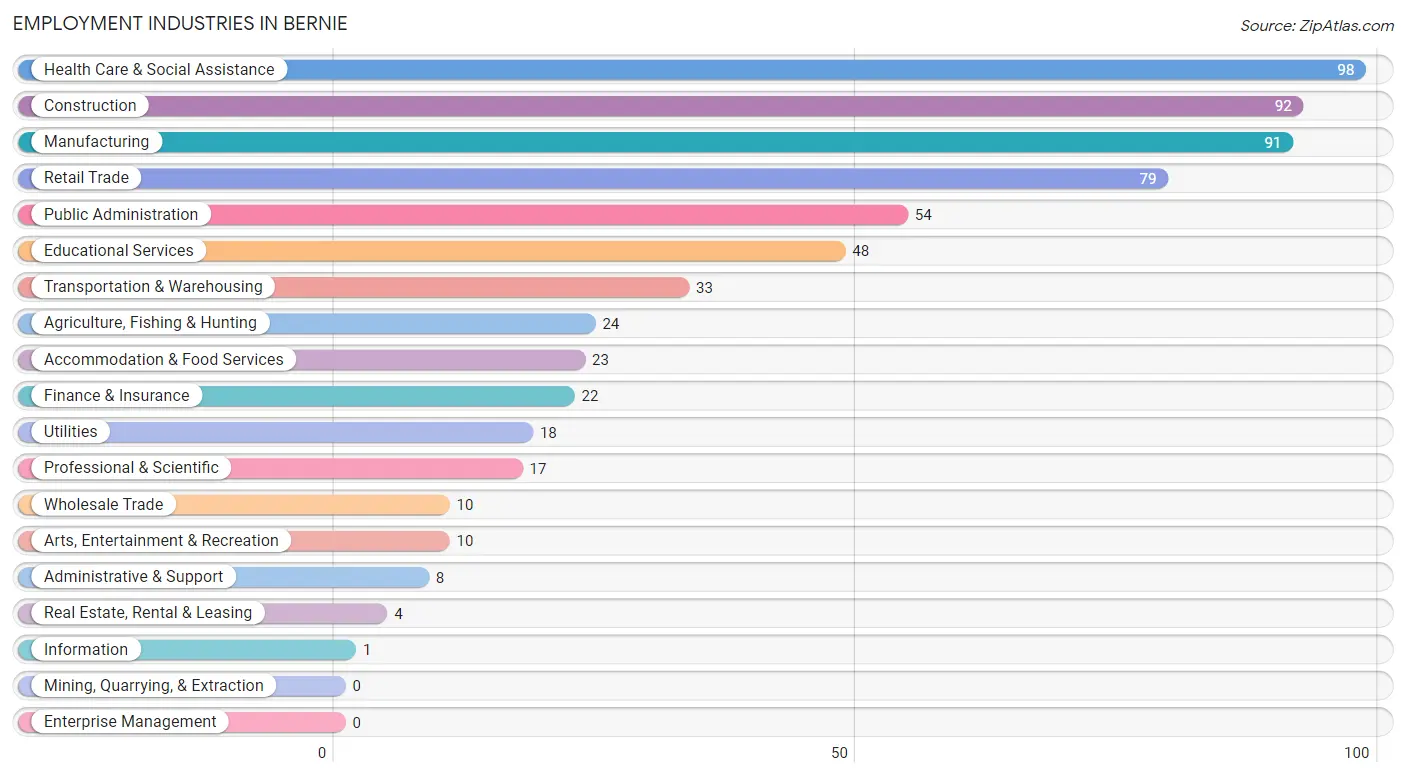
Employment Industries in Bernie
The major employment industries in Bernie include Health Care & Social Assistance (98 | 15.2%), Construction (92 | 14.3%), Manufacturing (91 | 14.1%), Retail Trade (79 | 12.2%), and Public Administration (54 | 8.4%).
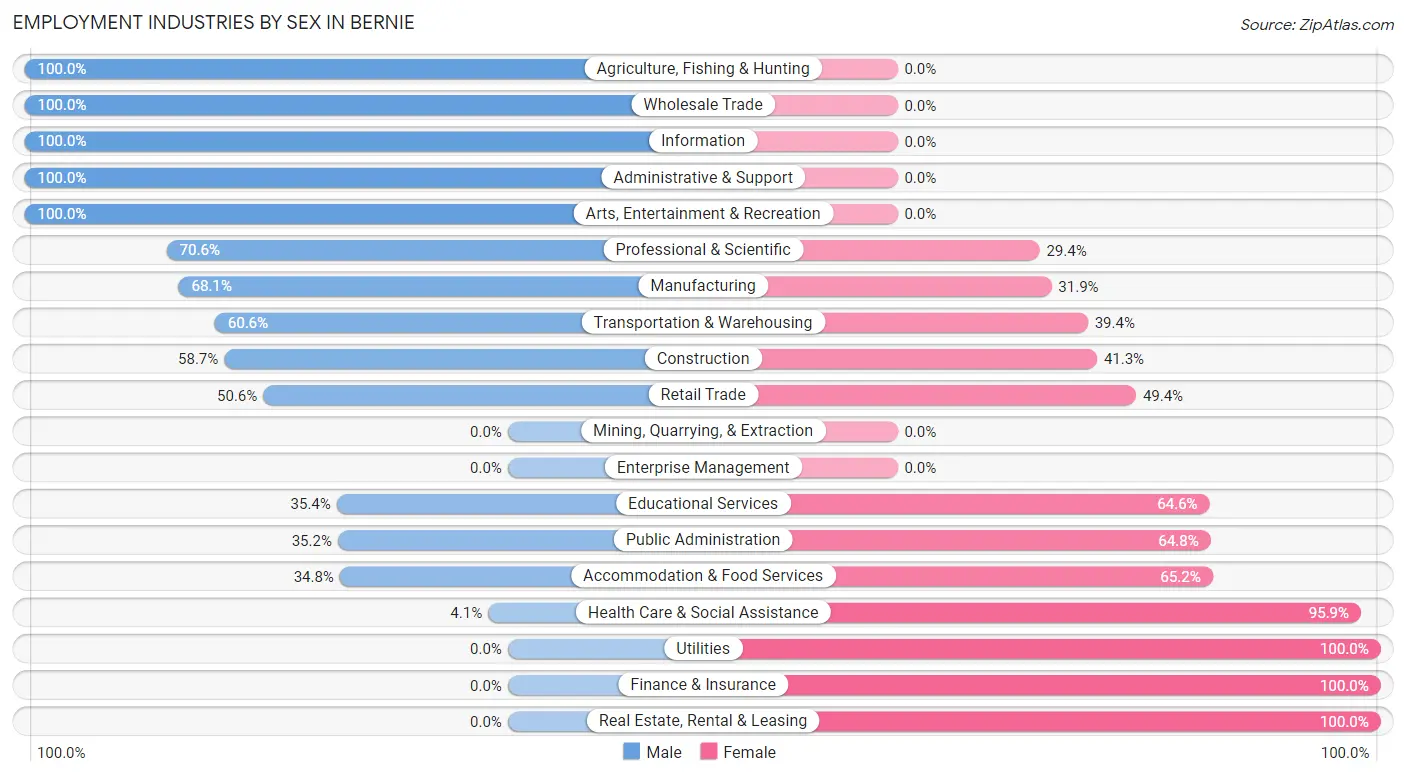
Employment Industries by Sex in Bernie
The Bernie industries that see more men than women are Agriculture, Fishing & Hunting (100.0%), Wholesale Trade (100.0%), and Information (100.0%), whereas the industries that tend to have a higher number of women are Utilities (100.0%), Finance & Insurance (100.0%), and Real Estate, Rental & Leasing (100.0%).
| Industry | Male | Female |
| Agriculture, Fishing & Hunting | 24 (100.0%) | 0 (0.0%) |
| Mining, Quarrying, & Extraction | 0 (0.0%) | 0 (0.0%) |
| Construction | 54 (58.7%) | 38 (41.3%) |
| Manufacturing | 62 (68.1%) | 29 (31.9%) |
| Wholesale Trade | 10 (100.0%) | 0 (0.0%) |
| Retail Trade | 40 (50.6%) | 39 (49.4%) |
| Transportation & Warehousing | 20 (60.6%) | 13 (39.4%) |
| Utilities | 0 (0.0%) | 18 (100.0%) |
| Information | 1 (100.0%) | 0 (0.0%) |
| Finance & Insurance | 0 (0.0%) | 22 (100.0%) |
| Real Estate, Rental & Leasing | 0 (0.0%) | 4 (100.0%) |
| Professional & Scientific | 12 (70.6%) | 5 (29.4%) |
| Enterprise Management | 0 (0.0%) | 0 (0.0%) |
| Administrative & Support | 8 (100.0%) | 0 (0.0%) |
| Educational Services | 17 (35.4%) | 31 (64.6%) |
| Health Care & Social Assistance | 4 (4.1%) | 94 (95.9%) |
| Arts, Entertainment & Recreation | 10 (100.0%) | 0 (0.0%) |
| Accommodation & Food Services | 8 (34.8%) | 15 (65.2%) |
| Public Administration | 19 (35.2%) | 35 (64.8%) |
| Total | 298 (46.2%) | 347 (53.8%) |
Education in Bernie
School Enrollment in Bernie
The most common levels of schooling among the 314 students in Bernie are elementary school (97 | 30.9%), middle school (74 | 23.6%), and high school (72 | 22.9%).
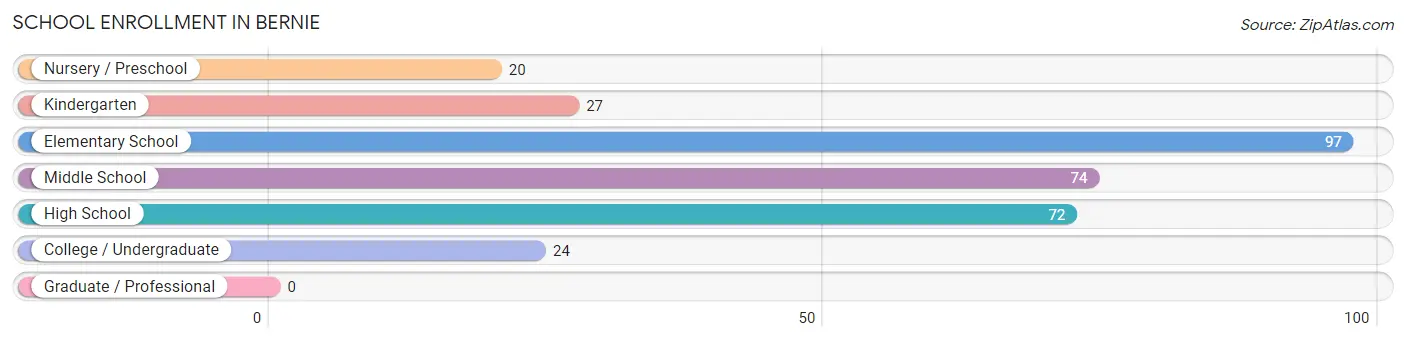
| School Level | # Students | % Students |
| Nursery / Preschool | 20 | 6.4% |
| Kindergarten | 27 | 8.6% |
| Elementary School | 97 | 30.9% |
| Middle School | 74 | 23.6% |
| High School | 72 | 22.9% |
| College / Undergraduate | 24 | 7.6% |
| Graduate / Professional | 0 | 0.0% |
| Total | 314 | 100.0% |
School Enrollment by Age by Funding Source in Bernie
Out of a total of 314 students who are enrolled in schools in Bernie, 21 (6.7%) attend a private institution, while the remaining 293 (93.3%) are enrolled in public schools. The age group of 10 to 14 year olds has the highest likelihood of being enrolled in private schools, with 16 (20.0% in the age bracket) enrolled. Conversely, the age group of 3 to 4 year olds has the lowest likelihood of being enrolled in a private school, with 18 (100.0% in the age bracket) attending a public institution.
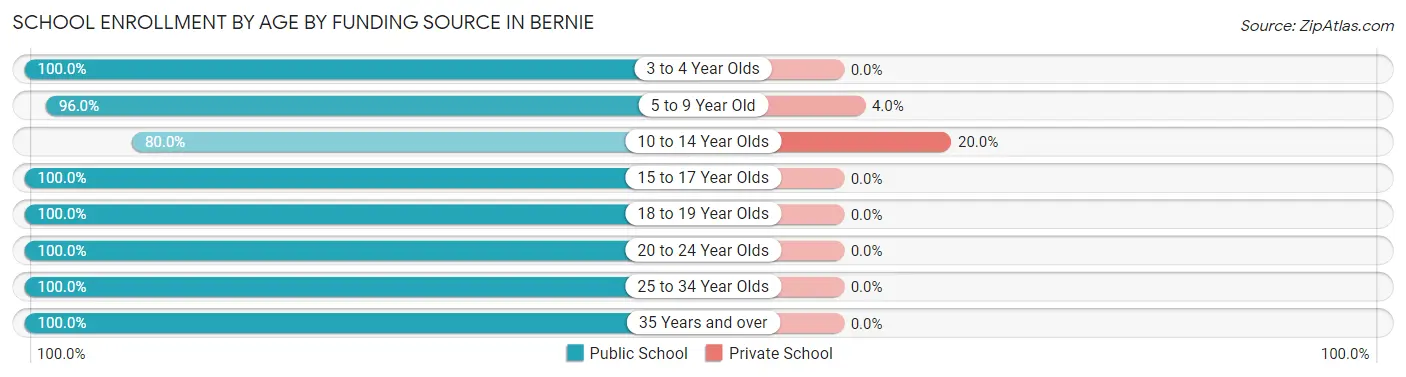
| Age Bracket | Public School | Private School |
| 3 to 4 Year Olds | 18 (100.0%) | 0 (0.0%) |
| 5 to 9 Year Old | 121 (96.0%) | 5 (4.0%) |
| 10 to 14 Year Olds | 64 (80.0%) | 16 (20.0%) |
| 15 to 17 Year Olds | 48 (100.0%) | 0 (0.0%) |
| 18 to 19 Year Olds | 7 (100.0%) | 0 (0.0%) |
| 20 to 24 Year Olds | 4 (100.0%) | 0 (0.0%) |
| 25 to 34 Year Olds | 9 (100.0%) | 0 (0.0%) |
| 35 Years and over | 22 (100.0%) | 0 (0.0%) |
| Total | 293 (93.3%) | 21 (6.7%) |
Educational Attainment by Field of Study in Bernie
Education (91 | 49.7%), business (28 | 15.3%), liberal arts & history (24 | 13.1%), science & technology (11 | 6.0%), and bio, nature & agricultural (10 | 5.5%) are the most common fields of study among 183 individuals in Bernie who have obtained a bachelor's degree or higher.
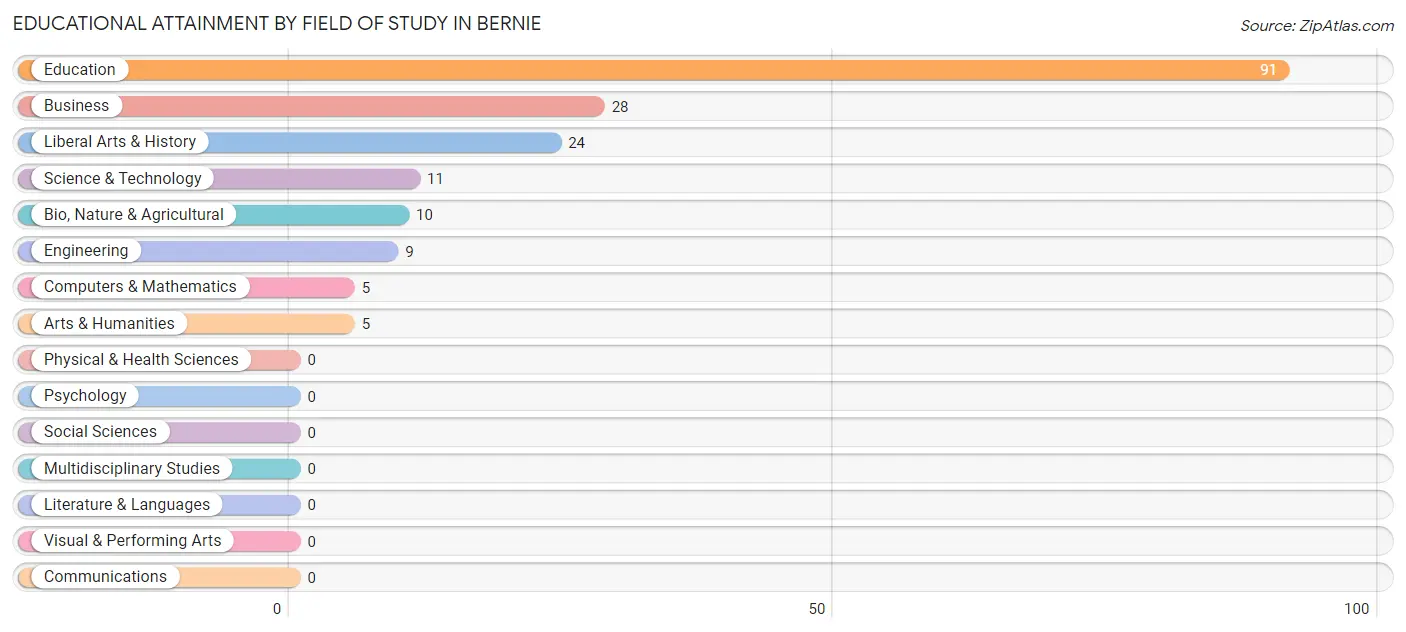
| Field of Study | # Graduates | % Graduates |
| Computers & Mathematics | 5 | 2.7% |
| Bio, Nature & Agricultural | 10 | 5.5% |
| Physical & Health Sciences | 0 | 0.0% |
| Psychology | 0 | 0.0% |
| Social Sciences | 0 | 0.0% |
| Engineering | 9 | 4.9% |
| Multidisciplinary Studies | 0 | 0.0% |
| Science & Technology | 11 | 6.0% |
| Business | 28 | 15.3% |
| Education | 91 | 49.7% |
| Literature & Languages | 0 | 0.0% |
| Liberal Arts & History | 24 | 13.1% |
| Visual & Performing Arts | 0 | 0.0% |
| Communications | 0 | 0.0% |
| Arts & Humanities | 5 | 2.7% |
| Total | 183 | 100.0% |
Transportation & Commute in Bernie
Vehicle Availability by Sex in Bernie
The most prevalent vehicle ownership categories in Bernie are males with 2 vehicles (192, accounting for 67.8%) and females with 2 vehicles (163, making up 55.3%).
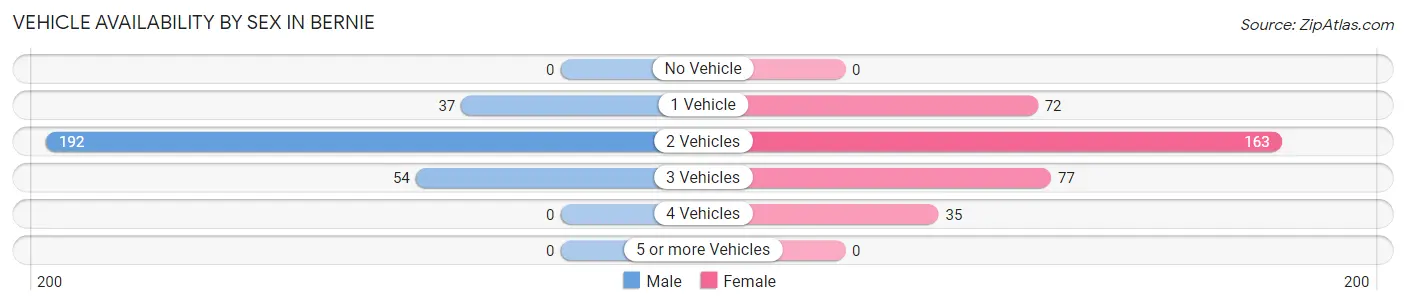
| Vehicles Available | Male | Female |
| No Vehicle | 0 (0.0%) | 0 (0.0%) |
| 1 Vehicle | 37 (13.1%) | 72 (20.7%) |
| 2 Vehicles | 192 (67.8%) | 163 (47.0%) |
| 3 Vehicles | 54 (19.1%) | 77 (22.2%) |
| 4 Vehicles | 0 (0.0%) | 35 (10.1%) |
| 5 or more Vehicles | 0 (0.0%) | 0 (0.0%) |
| Total | 283 (100.0%) | 347 (100.0%) |
Commute Time in Bernie
The most frequently occuring commute durations in Bernie are 15 to 19 minutes (138 commuters, 22.9%), less than 5 minutes (83 commuters, 13.8%), and 5 to 9 minutes (81 commuters, 13.4%).
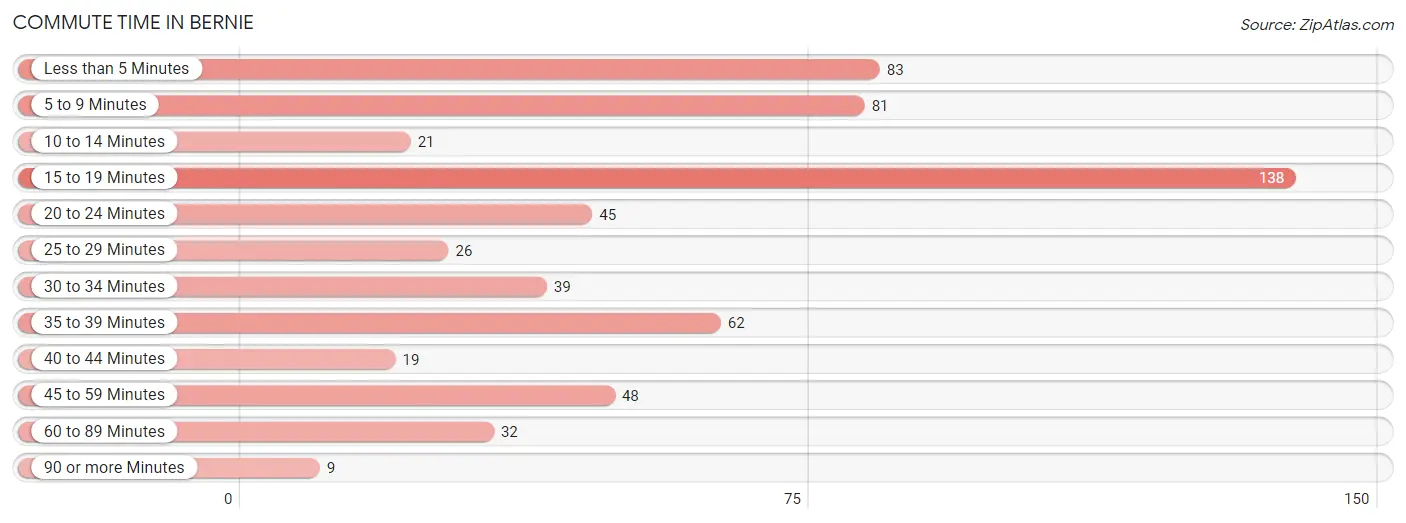
| Commute Time | # Commuters | % Commuters |
| Less than 5 Minutes | 83 | 13.8% |
| 5 to 9 Minutes | 81 | 13.4% |
| 10 to 14 Minutes | 21 | 3.5% |
| 15 to 19 Minutes | 138 | 22.9% |
| 20 to 24 Minutes | 45 | 7.5% |
| 25 to 29 Minutes | 26 | 4.3% |
| 30 to 34 Minutes | 39 | 6.5% |
| 35 to 39 Minutes | 62 | 10.3% |
| 40 to 44 Minutes | 19 | 3.2% |
| 45 to 59 Minutes | 48 | 8.0% |
| 60 to 89 Minutes | 32 | 5.3% |
| 90 or more Minutes | 9 | 1.5% |
Commute Time by Sex in Bernie
The most common commute times in Bernie are 15 to 19 minutes (50 commuters, 19.0%) for males and 15 to 19 minutes (88 commuters, 25.9%) for females.
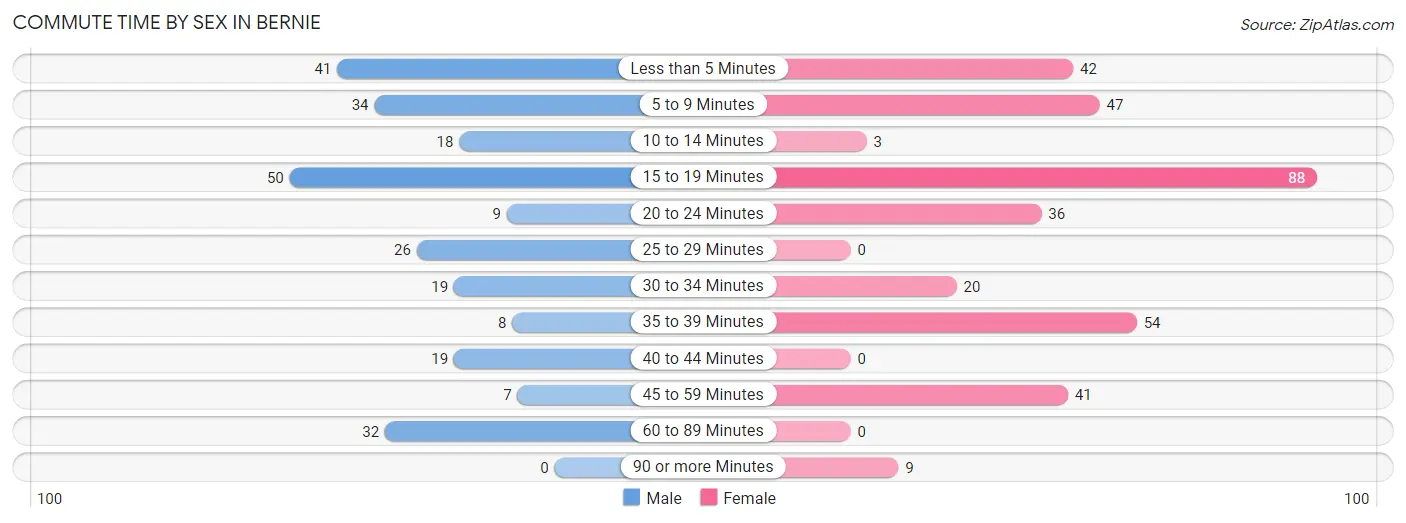
| Commute Time | Male | Female |
| Less than 5 Minutes | 41 (15.6%) | 42 (12.3%) |
| 5 to 9 Minutes | 34 (12.9%) | 47 (13.8%) |
| 10 to 14 Minutes | 18 (6.8%) | 3 (0.9%) |
| 15 to 19 Minutes | 50 (19.0%) | 88 (25.9%) |
| 20 to 24 Minutes | 9 (3.4%) | 36 (10.6%) |
| 25 to 29 Minutes | 26 (9.9%) | 0 (0.0%) |
| 30 to 34 Minutes | 19 (7.2%) | 20 (5.9%) |
| 35 to 39 Minutes | 8 (3.0%) | 54 (15.9%) |
| 40 to 44 Minutes | 19 (7.2%) | 0 (0.0%) |
| 45 to 59 Minutes | 7 (2.7%) | 41 (12.1%) |
| 60 to 89 Minutes | 32 (12.2%) | 0 (0.0%) |
| 90 or more Minutes | 0 (0.0%) | 9 (2.6%) |
Time of Departure to Work by Sex in Bernie
The most frequent times of departure to work in Bernie are 6:00 AM to 6:29 AM (67, 25.5%) for males and 7:30 AM to 7:59 AM (74, 21.8%) for females.
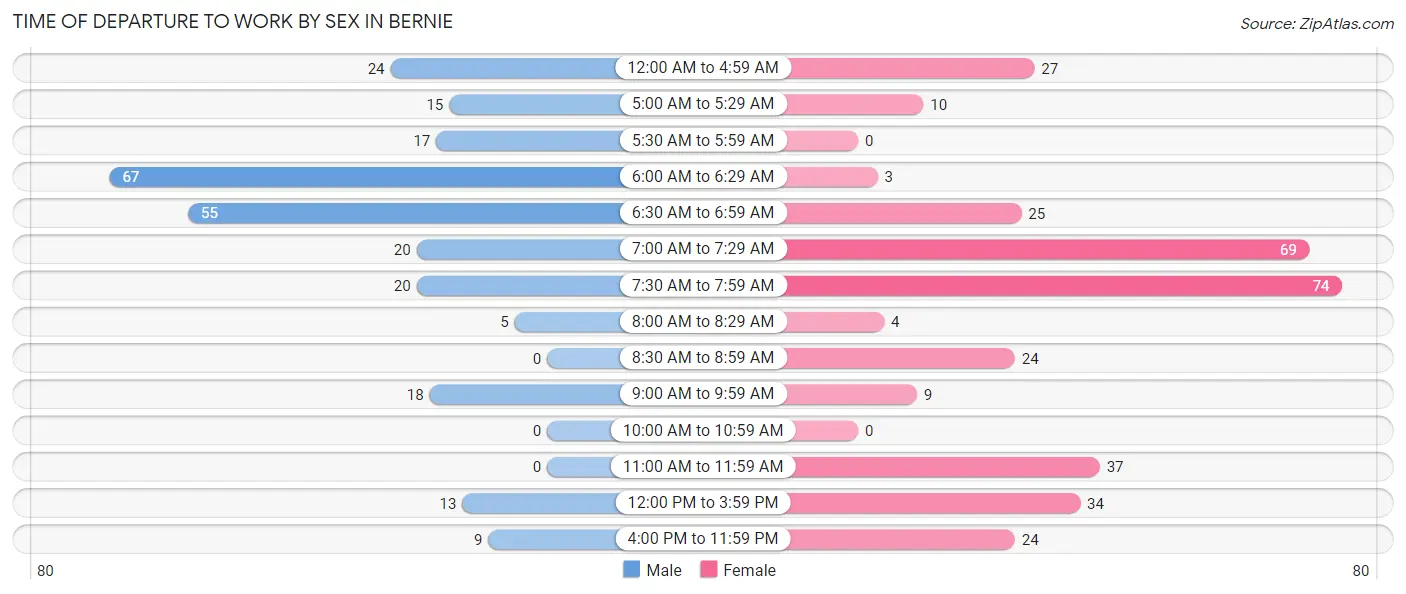
| Time of Departure | Male | Female |
| 12:00 AM to 4:59 AM | 24 (9.1%) | 27 (7.9%) |
| 5:00 AM to 5:29 AM | 15 (5.7%) | 10 (2.9%) |
| 5:30 AM to 5:59 AM | 17 (6.5%) | 0 (0.0%) |
| 6:00 AM to 6:29 AM | 67 (25.5%) | 3 (0.9%) |
| 6:30 AM to 6:59 AM | 55 (20.9%) | 25 (7.3%) |
| 7:00 AM to 7:29 AM | 20 (7.6%) | 69 (20.3%) |
| 7:30 AM to 7:59 AM | 20 (7.6%) | 74 (21.8%) |
| 8:00 AM to 8:29 AM | 5 (1.9%) | 4 (1.2%) |
| 8:30 AM to 8:59 AM | 0 (0.0%) | 24 (7.1%) |
| 9:00 AM to 9:59 AM | 18 (6.8%) | 9 (2.6%) |
| 10:00 AM to 10:59 AM | 0 (0.0%) | 0 (0.0%) |
| 11:00 AM to 11:59 AM | 0 (0.0%) | 37 (10.9%) |
| 12:00 PM to 3:59 PM | 13 (4.9%) | 34 (10.0%) |
| 4:00 PM to 11:59 PM | 9 (3.4%) | 24 (7.1%) |
| Total | 263 (100.0%) | 340 (100.0%) |
Housing Occupancy in Bernie
Occupancy by Ownership in Bernie
Of the total 758 dwellings in Bernie, owner-occupied units account for 500 (66.0%), while renter-occupied units make up 258 (34.0%).
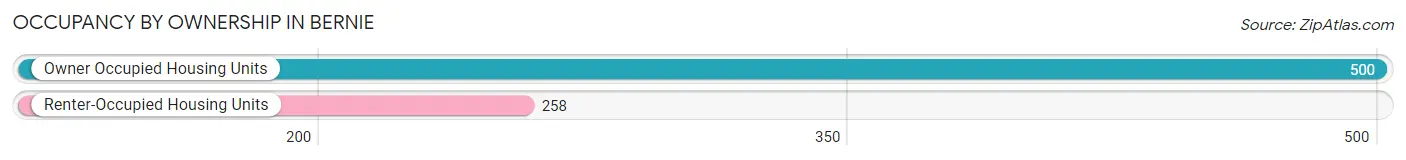
| Occupancy | # Housing Units | % Housing Units |
| Owner Occupied Housing Units | 500 | 66.0% |
| Renter-Occupied Housing Units | 258 | 34.0% |
| Total Occupied Housing Units | 758 | 100.0% |
Occupancy by Household Size in Bernie
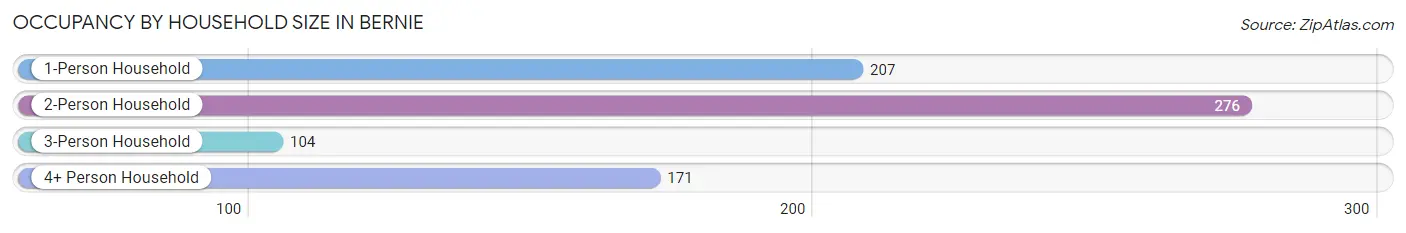
| Household Size | # Housing Units | % Housing Units |
| 1-Person Household | 207 | 27.3% |
| 2-Person Household | 276 | 36.4% |
| 3-Person Household | 104 | 13.7% |
| 4+ Person Household | 171 | 22.6% |
| Total Housing Units | 758 | 100.0% |
Occupancy by Ownership by Household Size in Bernie
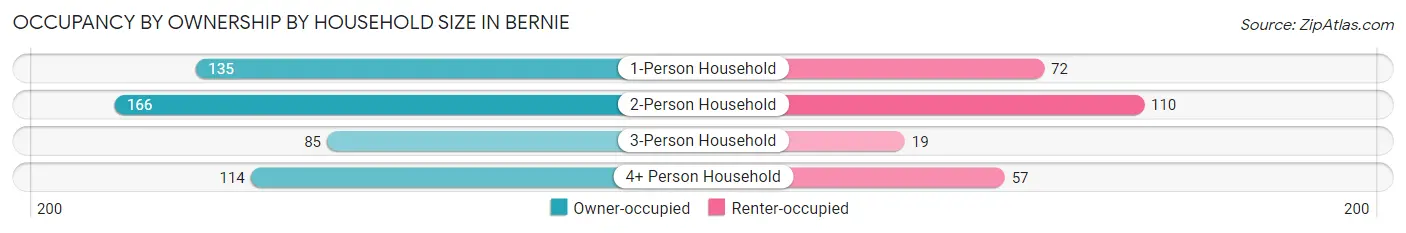
| Household Size | Owner-occupied | Renter-occupied |
| 1-Person Household | 135 (65.2%) | 72 (34.8%) |
| 2-Person Household | 166 (60.1%) | 110 (39.9%) |
| 3-Person Household | 85 (81.7%) | 19 (18.3%) |
| 4+ Person Household | 114 (66.7%) | 57 (33.3%) |
| Total Housing Units | 500 (66.0%) | 258 (34.0%) |
Occupancy by Educational Attainment in Bernie
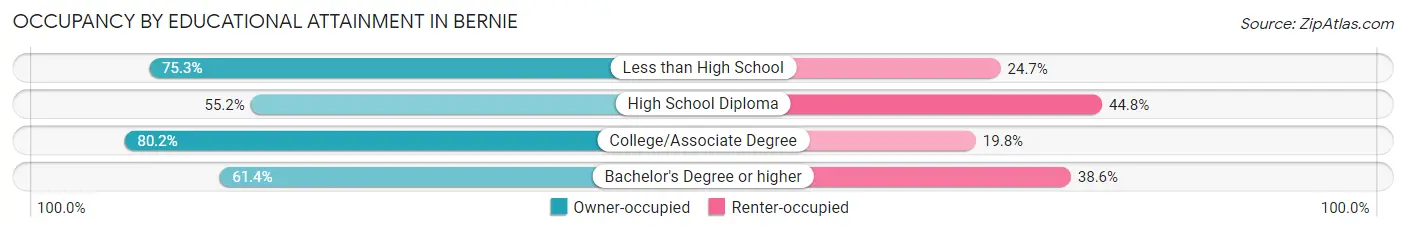
| Household Size | Owner-occupied | Renter-occupied |
| Less than High School | 113 (75.3%) | 37 (24.7%) |
| High School Diploma | 175 (55.2%) | 142 (44.8%) |
| College/Associate Degree | 142 (80.2%) | 35 (19.8%) |
| Bachelor's Degree or higher | 70 (61.4%) | 44 (38.6%) |
Occupancy by Age of Householder in Bernie
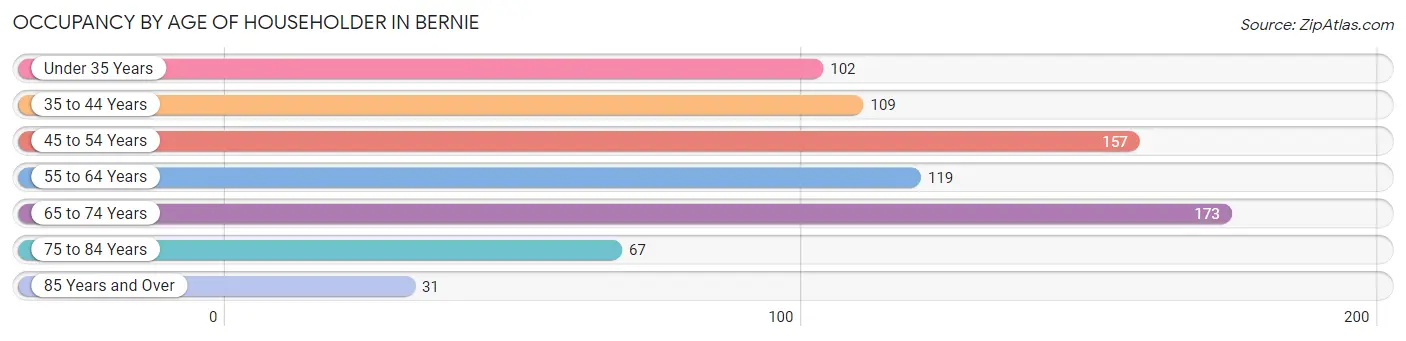
| Age Bracket | # Households | % Households |
| Under 35 Years | 102 | 13.5% |
| 35 to 44 Years | 109 | 14.4% |
| 45 to 54 Years | 157 | 20.7% |
| 55 to 64 Years | 119 | 15.7% |
| 65 to 74 Years | 173 | 22.8% |
| 75 to 84 Years | 67 | 8.8% |
| 85 Years and Over | 31 | 4.1% |
| Total | 758 | 100.0% |
Housing Finances in Bernie
Median Income by Occupancy in Bernie
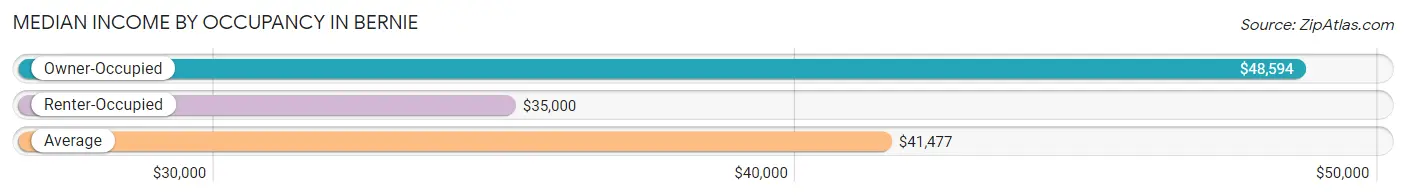
| Occupancy Type | # Households | Median Income |
| Owner-Occupied | 500 (66.0%) | $48,594 |
| Renter-Occupied | 258 (34.0%) | $35,000 |
| Average | 758 (100.0%) | $41,477 |
Occupancy by Householder Income Bracket in Bernie
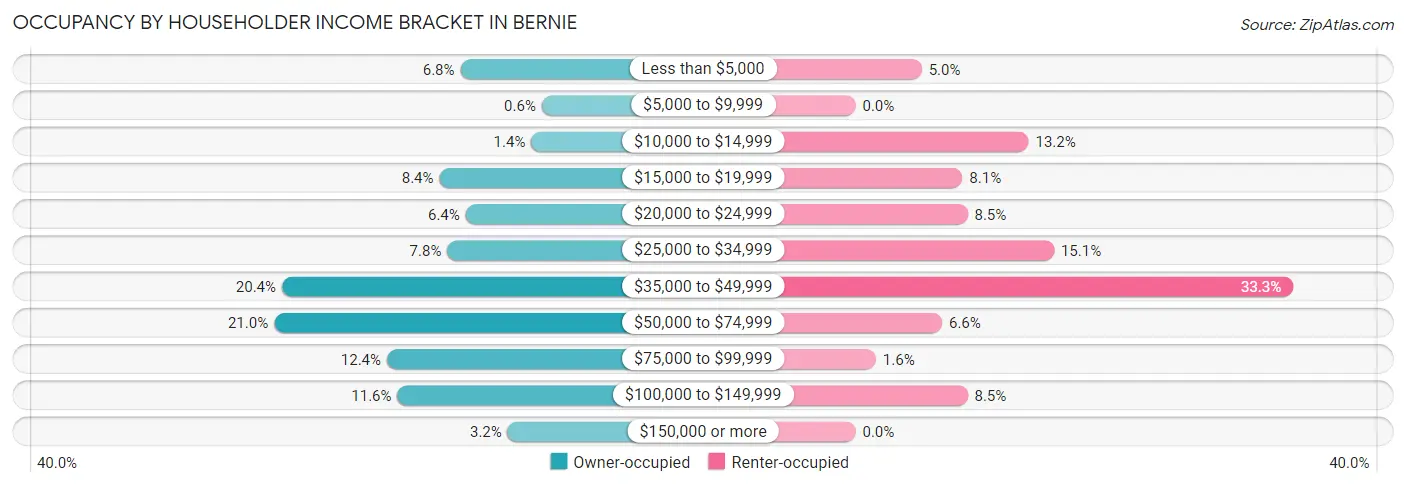
| Income Bracket | Owner-occupied | Renter-occupied |
| Less than $5,000 | 34 (6.8%) | 13 (5.0%) |
| $5,000 to $9,999 | 3 (0.6%) | 0 (0.0%) |
| $10,000 to $14,999 | 7 (1.4%) | 34 (13.2%) |
| $15,000 to $19,999 | 42 (8.4%) | 21 (8.1%) |
| $20,000 to $24,999 | 32 (6.4%) | 22 (8.5%) |
| $25,000 to $34,999 | 39 (7.8%) | 39 (15.1%) |
| $35,000 to $49,999 | 102 (20.4%) | 86 (33.3%) |
| $50,000 to $74,999 | 105 (21.0%) | 17 (6.6%) |
| $75,000 to $99,999 | 62 (12.4%) | 4 (1.5%) |
| $100,000 to $149,999 | 58 (11.6%) | 22 (8.5%) |
| $150,000 or more | 16 (3.2%) | 0 (0.0%) |
| Total | 500 (100.0%) | 258 (100.0%) |
Monthly Housing Cost Tiers in Bernie
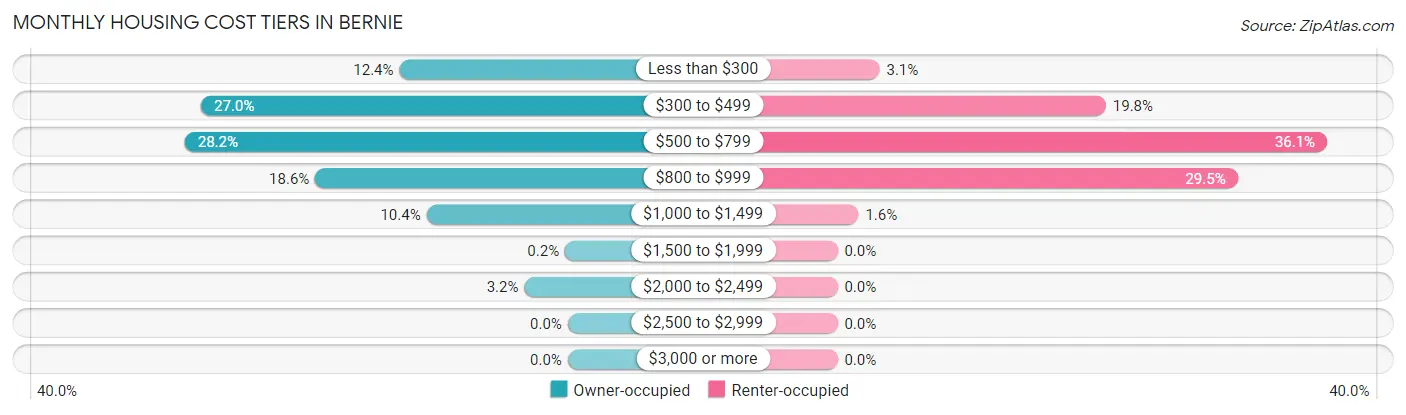
| Monthly Cost | Owner-occupied | Renter-occupied |
| Less than $300 | 62 (12.4%) | 8 (3.1%) |
| $300 to $499 | 135 (27.0%) | 51 (19.8%) |
| $500 to $799 | 141 (28.2%) | 93 (36.0%) |
| $800 to $999 | 93 (18.6%) | 76 (29.5%) |
| $1,000 to $1,499 | 52 (10.4%) | 4 (1.5%) |
| $1,500 to $1,999 | 1 (0.2%) | 0 (0.0%) |
| $2,000 to $2,499 | 16 (3.2%) | 0 (0.0%) |
| $2,500 to $2,999 | 0 (0.0%) | 0 (0.0%) |
| $3,000 or more | 0 (0.0%) | 0 (0.0%) |
| Total | 500 (100.0%) | 258 (100.0%) |
Physical Housing Characteristics in Bernie
Housing Structures in Bernie
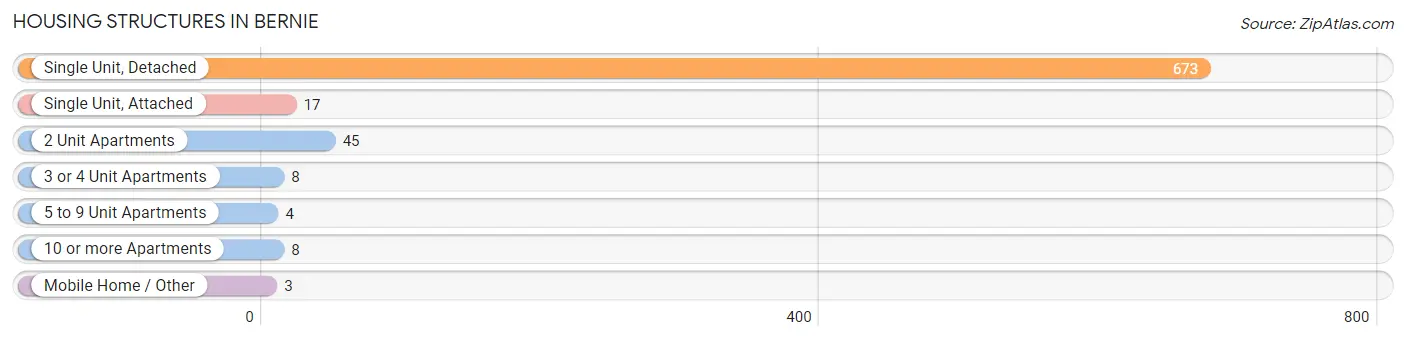
| Structure Type | # Housing Units | % Housing Units |
| Single Unit, Detached | 673 | 88.8% |
| Single Unit, Attached | 17 | 2.2% |
| 2 Unit Apartments | 45 | 5.9% |
| 3 or 4 Unit Apartments | 8 | 1.1% |
| 5 to 9 Unit Apartments | 4 | 0.5% |
| 10 or more Apartments | 8 | 1.1% |
| Mobile Home / Other | 3 | 0.4% |
| Total | 758 | 100.0% |
Housing Structures by Occupancy in Bernie
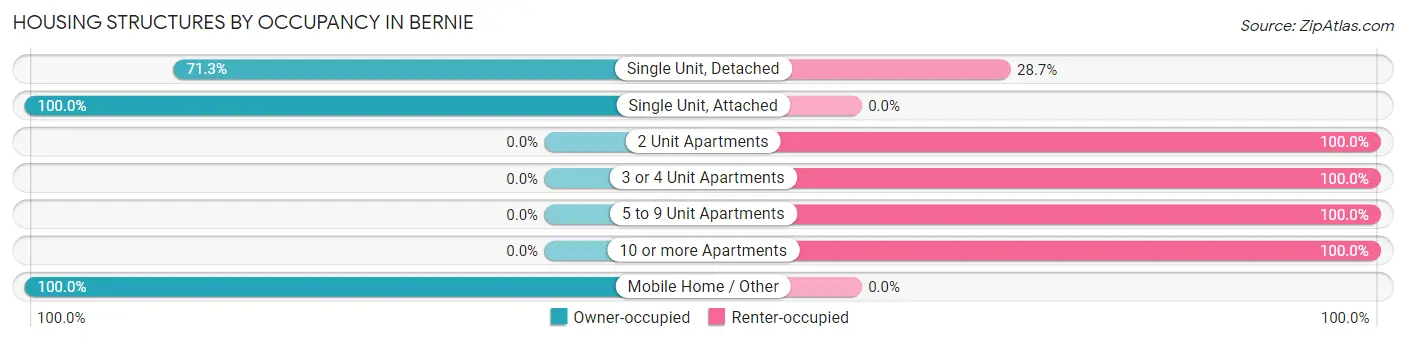
| Structure Type | Owner-occupied | Renter-occupied |
| Single Unit, Detached | 480 (71.3%) | 193 (28.7%) |
| Single Unit, Attached | 17 (100.0%) | 0 (0.0%) |
| 2 Unit Apartments | 0 (0.0%) | 45 (100.0%) |
| 3 or 4 Unit Apartments | 0 (0.0%) | 8 (100.0%) |
| 5 to 9 Unit Apartments | 0 (0.0%) | 4 (100.0%) |
| 10 or more Apartments | 0 (0.0%) | 8 (100.0%) |
| Mobile Home / Other | 3 (100.0%) | 0 (0.0%) |
| Total | 500 (66.0%) | 258 (34.0%) |
Housing Structures by Number of Rooms in Bernie
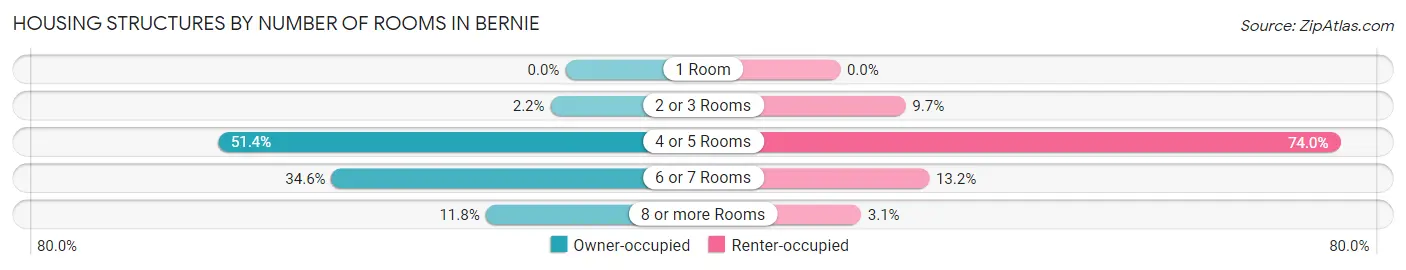
| Number of Rooms | Owner-occupied | Renter-occupied |
| 1 Room | 0 (0.0%) | 0 (0.0%) |
| 2 or 3 Rooms | 11 (2.2%) | 25 (9.7%) |
| 4 or 5 Rooms | 257 (51.4%) | 191 (74.0%) |
| 6 or 7 Rooms | 173 (34.6%) | 34 (13.2%) |
| 8 or more Rooms | 59 (11.8%) | 8 (3.1%) |
| Total | 500 (100.0%) | 258 (100.0%) |
Housing Structure by Heating Type in Bernie
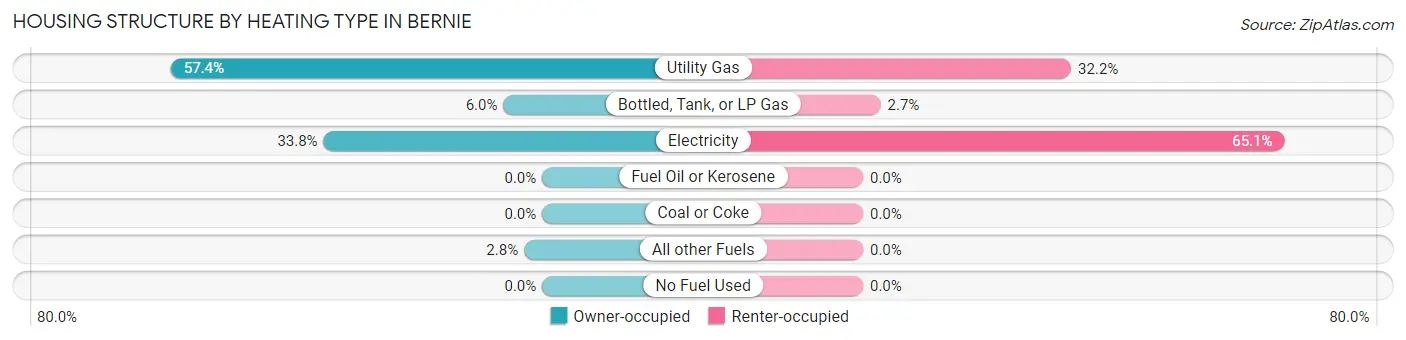
| Heating Type | Owner-occupied | Renter-occupied |
| Utility Gas | 287 (57.4%) | 83 (32.2%) |
| Bottled, Tank, or LP Gas | 30 (6.0%) | 7 (2.7%) |
| Electricity | 169 (33.8%) | 168 (65.1%) |
| Fuel Oil or Kerosene | 0 (0.0%) | 0 (0.0%) |
| Coal or Coke | 0 (0.0%) | 0 (0.0%) |
| All other Fuels | 14 (2.8%) | 0 (0.0%) |
| No Fuel Used | 0 (0.0%) | 0 (0.0%) |
| Total | 500 (100.0%) | 258 (100.0%) |
Household Vehicle Usage in Bernie
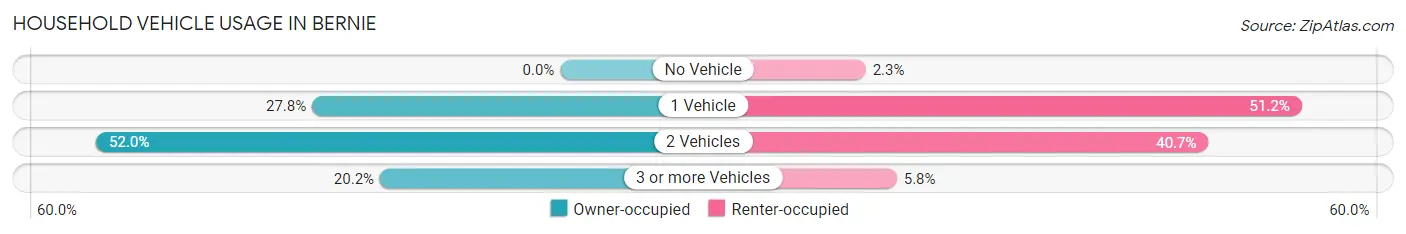
| Vehicles per Household | Owner-occupied | Renter-occupied |
| No Vehicle | 0 (0.0%) | 6 (2.3%) |
| 1 Vehicle | 139 (27.8%) | 132 (51.2%) |
| 2 Vehicles | 260 (52.0%) | 105 (40.7%) |
| 3 or more Vehicles | 101 (20.2%) | 15 (5.8%) |
| Total | 500 (100.0%) | 258 (100.0%) |
Real Estate & Mortgages in Bernie
Real Estate and Mortgage Overview in Bernie
| Characteristic | Without Mortgage | With Mortgage |
| Housing Units | 242 | 258 |
| Median Property Value | $77,900 | $95,100 |
| Median Household Income | $43,289 | $0 |
| Monthly Housing Costs | $377 | $0 |
| Real Estate Taxes | $528 | $0 |
Property Value by Mortgage Status in Bernie
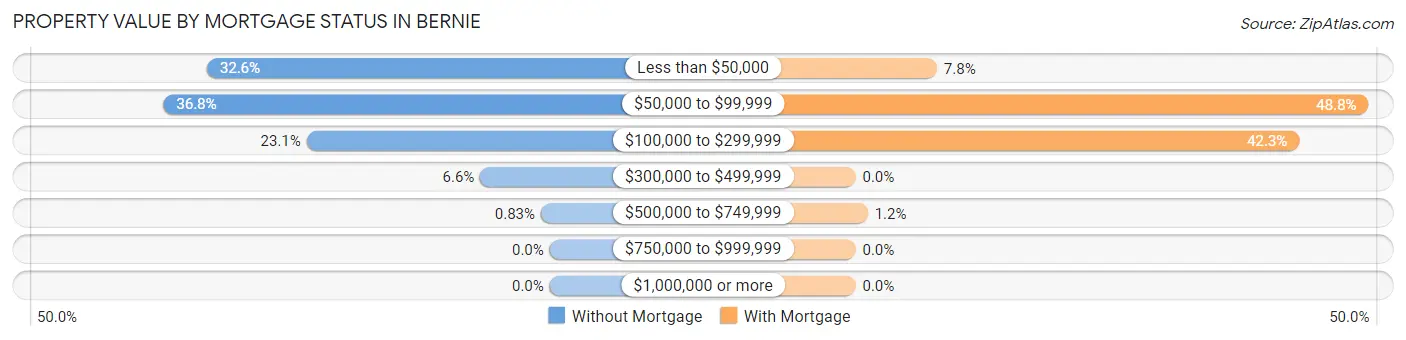
| Property Value | Without Mortgage | With Mortgage |
| Less than $50,000 | 79 (32.6%) | 20 (7.7%) |
| $50,000 to $99,999 | 89 (36.8%) | 126 (48.8%) |
| $100,000 to $299,999 | 56 (23.1%) | 109 (42.2%) |
| $300,000 to $499,999 | 16 (6.6%) | 0 (0.0%) |
| $500,000 to $749,999 | 2 (0.8%) | 3 (1.2%) |
| $750,000 to $999,999 | 0 (0.0%) | 0 (0.0%) |
| $1,000,000 or more | 0 (0.0%) | 0 (0.0%) |
| Total | 242 (100.0%) | 258 (100.0%) |
Household Income by Mortgage Status in Bernie
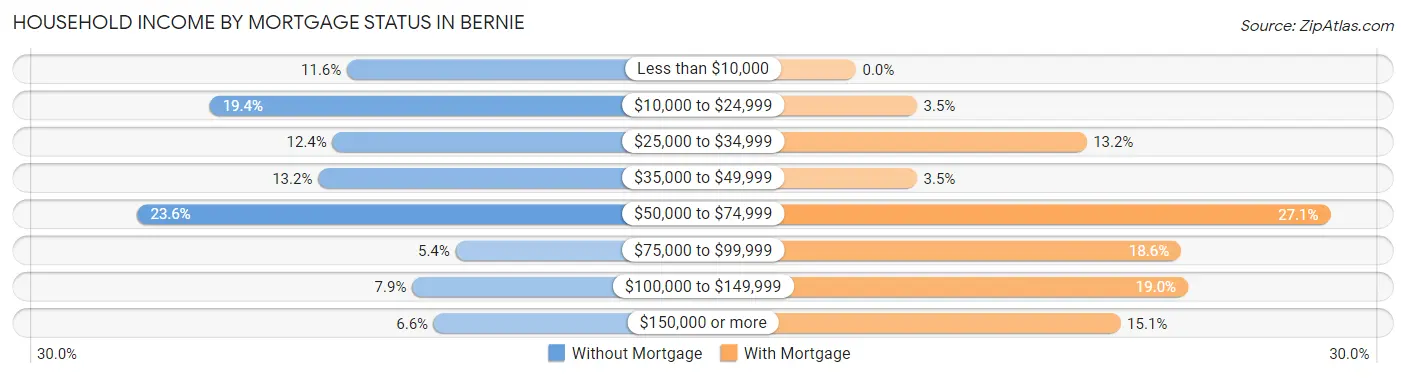
| Household Income | Without Mortgage | With Mortgage |
| Less than $10,000 | 28 (11.6%) | 0 (0.0%) |
| $10,000 to $24,999 | 47 (19.4%) | 9 (3.5%) |
| $25,000 to $34,999 | 30 (12.4%) | 34 (13.2%) |
| $35,000 to $49,999 | 32 (13.2%) | 9 (3.5%) |
| $50,000 to $74,999 | 57 (23.5%) | 70 (27.1%) |
| $75,000 to $99,999 | 13 (5.4%) | 48 (18.6%) |
| $100,000 to $149,999 | 19 (7.9%) | 49 (19.0%) |
| $150,000 or more | 16 (6.6%) | 39 (15.1%) |
| Total | 242 (100.0%) | 258 (100.0%) |
Property Value to Household Income Ratio in Bernie
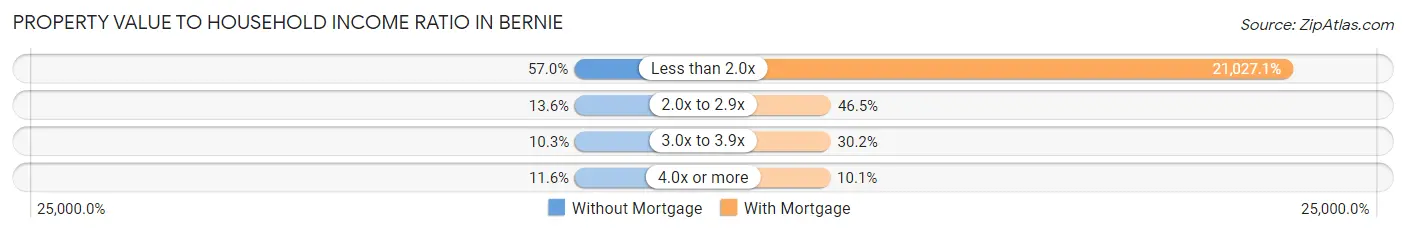
| Value-to-Income Ratio | Without Mortgage | With Mortgage |
| Less than 2.0x | 138 (57.0%) | 54,250 (21,027.1%) |
| 2.0x to 2.9x | 33 (13.6%) | 120 (46.5%) |
| 3.0x to 3.9x | 25 (10.3%) | 78 (30.2%) |
| 4.0x or more | 28 (11.6%) | 26 (10.1%) |
| Total | 242 (100.0%) | 258 (100.0%) |
Real Estate Taxes by Mortgage Status in Bernie
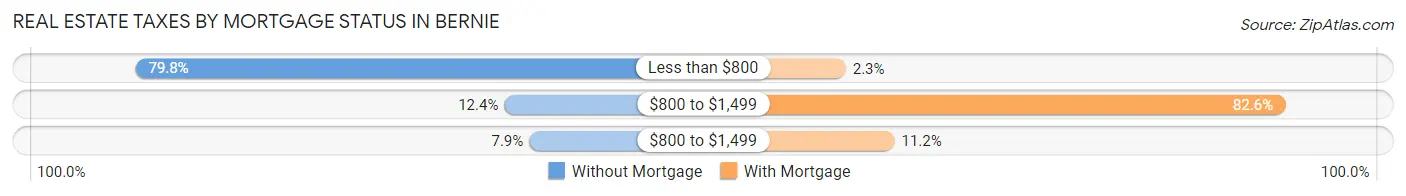
| Property Taxes | Without Mortgage | With Mortgage |
| Less than $800 | 193 (79.7%) | 6 (2.3%) |
| $800 to $1,499 | 30 (12.4%) | 213 (82.6%) |
| $800 to $1,499 | 19 (7.9%) | 29 (11.2%) |
| Total | 242 (100.0%) | 258 (100.0%) |
Health & Disability in Bernie
Health Insurance Coverage by Age in Bernie
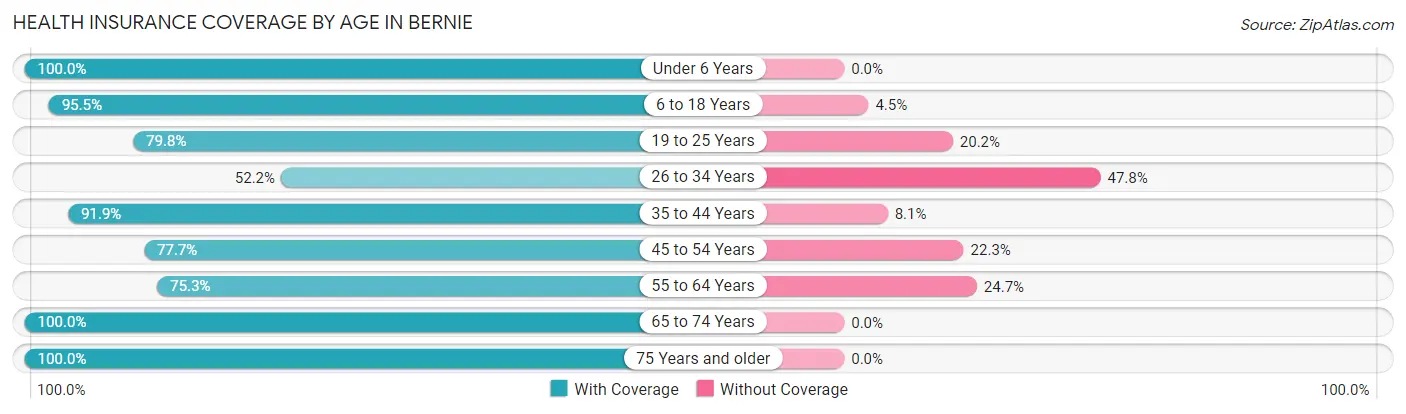
| Age Bracket | With Coverage | Without Coverage |
| Under 6 Years | 148 (100.0%) | 0 (0.0%) |
| 6 to 18 Years | 254 (95.5%) | 12 (4.5%) |
| 19 to 25 Years | 67 (79.8%) | 17 (20.2%) |
| 26 to 34 Years | 118 (52.2%) | 108 (47.8%) |
| 35 to 44 Years | 159 (91.9%) | 14 (8.1%) |
| 45 to 54 Years | 248 (77.7%) | 71 (22.3%) |
| 55 to 64 Years | 210 (75.3%) | 69 (24.7%) |
| 65 to 74 Years | 306 (100.0%) | 0 (0.0%) |
| 75 Years and older | 109 (100.0%) | 0 (0.0%) |
| Total | 1,619 (84.8%) | 291 (15.2%) |
Health Insurance Coverage by Citizenship Status in Bernie
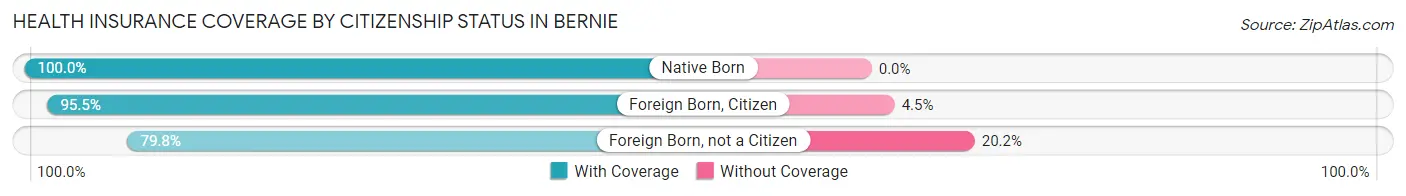
| Citizenship Status | With Coverage | Without Coverage |
| Native Born | 148 (100.0%) | 0 (0.0%) |
| Foreign Born, Citizen | 254 (95.5%) | 12 (4.5%) |
| Foreign Born, not a Citizen | 67 (79.8%) | 17 (20.2%) |
Health Insurance Coverage by Household Income in Bernie
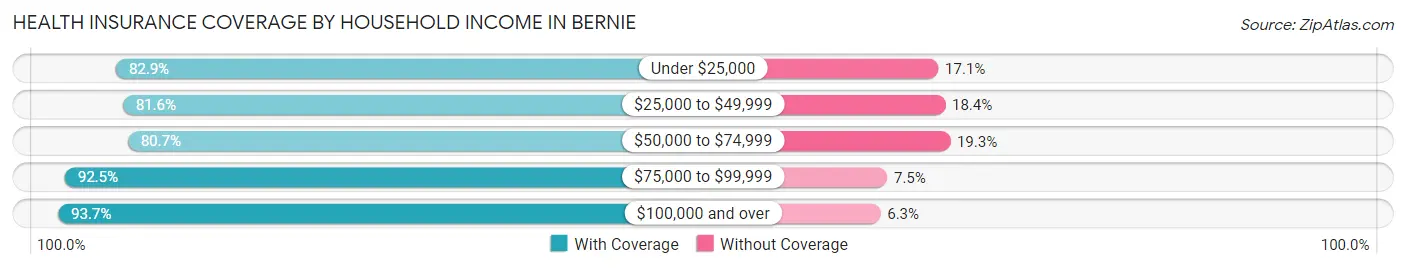
| Household Income | With Coverage | Without Coverage |
| Under $25,000 | 392 (82.9%) | 81 (17.1%) |
| $25,000 to $49,999 | 510 (81.6%) | 115 (18.4%) |
| $50,000 to $74,999 | 263 (80.7%) | 63 (19.3%) |
| $75,000 to $99,999 | 184 (92.5%) | 15 (7.5%) |
| $100,000 and over | 254 (93.7%) | 17 (6.3%) |
Public vs Private Health Insurance Coverage by Age in Bernie
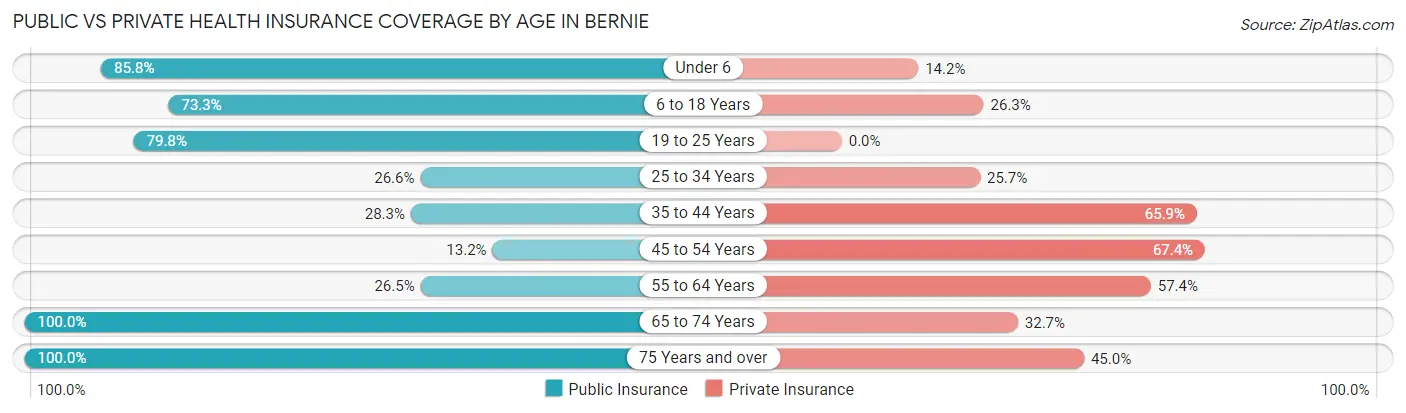
| Age Bracket | Public Insurance | Private Insurance |
| Under 6 | 127 (85.8%) | 21 (14.2%) |
| 6 to 18 Years | 195 (73.3%) | 70 (26.3%) |
| 19 to 25 Years | 67 (79.8%) | 0 (0.0%) |
| 25 to 34 Years | 60 (26.6%) | 58 (25.7%) |
| 35 to 44 Years | 49 (28.3%) | 114 (65.9%) |
| 45 to 54 Years | 42 (13.2%) | 215 (67.4%) |
| 55 to 64 Years | 74 (26.5%) | 160 (57.4%) |
| 65 to 74 Years | 306 (100.0%) | 100 (32.7%) |
| 75 Years and over | 109 (100.0%) | 49 (45.0%) |
| Total | 1,029 (53.9%) | 787 (41.2%) |
Disability Status by Sex by Age in Bernie
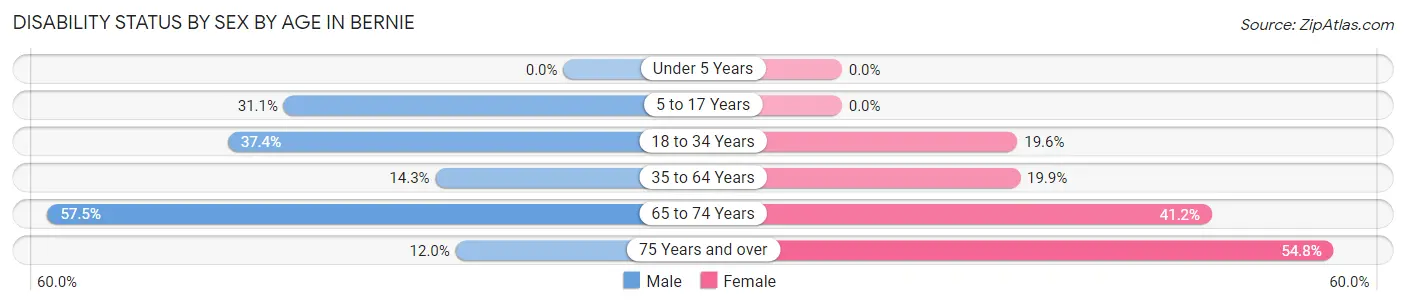
| Age Bracket | Male | Female |
| Under 5 Years | 0 (0.0%) | 0 (0.0%) |
| 5 to 17 Years | 33 (31.1%) | 0 (0.0%) |
| 18 to 34 Years | 71 (37.4%) | 26 (19.6%) |
| 35 to 64 Years | 51 (14.2%) | 82 (19.9%) |
| 65 to 74 Years | 81 (57.5%) | 68 (41.2%) |
| 75 Years and over | 3 (12.0%) | 46 (54.8%) |
Disability Class by Sex by Age in Bernie
Disability Class: Hearing Difficulty
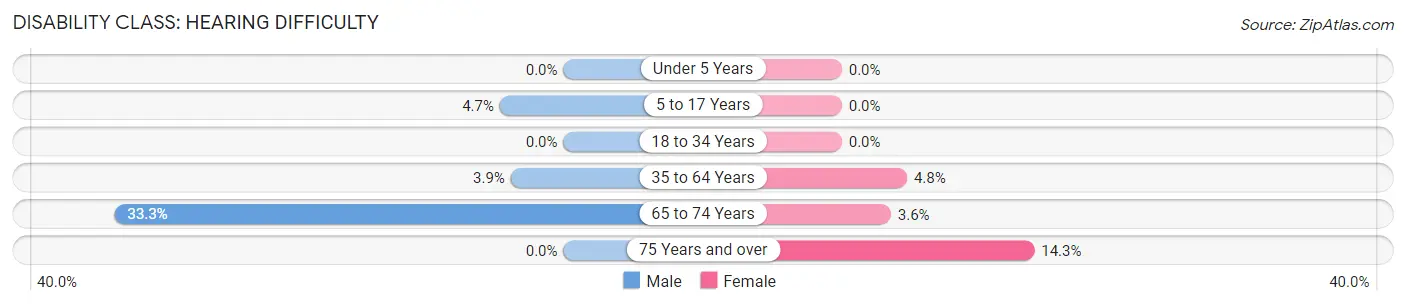
| Age Bracket | Male | Female |
| Under 5 Years | 0 (0.0%) | 0 (0.0%) |
| 5 to 17 Years | 5 (4.7%) | 0 (0.0%) |
| 18 to 34 Years | 0 (0.0%) | 0 (0.0%) |
| 35 to 64 Years | 14 (3.9%) | 20 (4.8%) |
| 65 to 74 Years | 47 (33.3%) | 6 (3.6%) |
| 75 Years and over | 0 (0.0%) | 12 (14.3%) |
Disability Class: Vision Difficulty
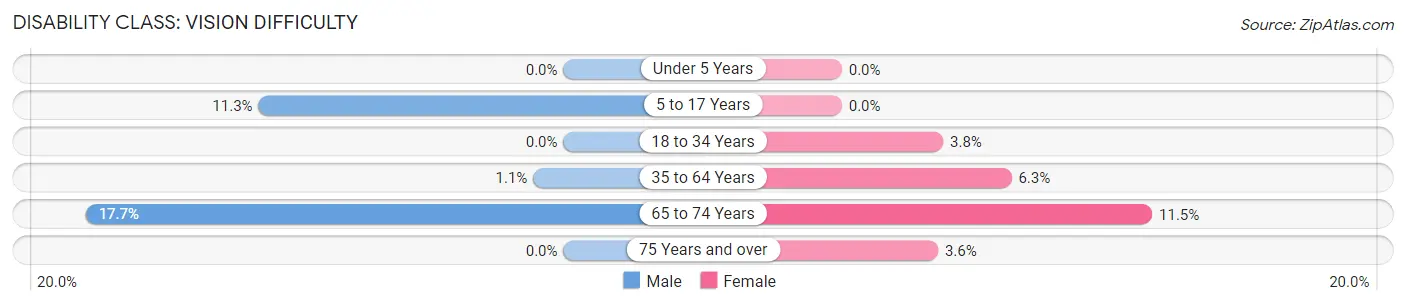
| Age Bracket | Male | Female |
| Under 5 Years | 0 (0.0%) | 0 (0.0%) |
| 5 to 17 Years | 12 (11.3%) | 0 (0.0%) |
| 18 to 34 Years | 0 (0.0%) | 5 (3.8%) |
| 35 to 64 Years | 4 (1.1%) | 26 (6.3%) |
| 65 to 74 Years | 25 (17.7%) | 19 (11.5%) |
| 75 Years and over | 0 (0.0%) | 3 (3.6%) |
Disability Class: Cognitive Difficulty
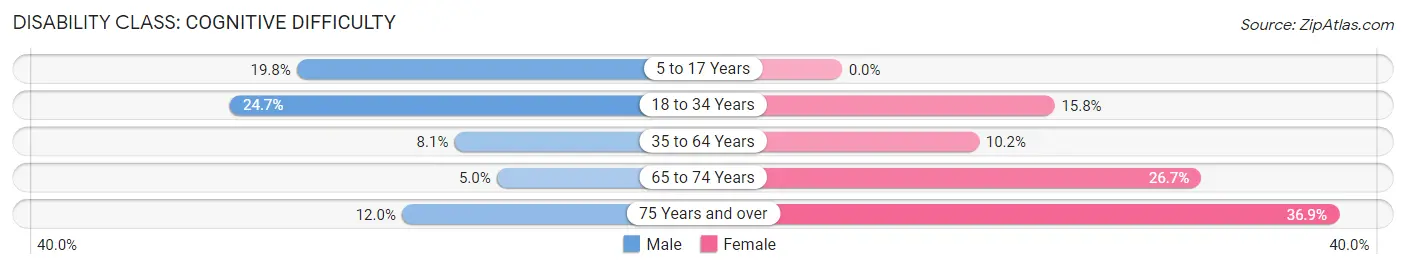
| Age Bracket | Male | Female |
| 5 to 17 Years | 21 (19.8%) | 0 (0.0%) |
| 18 to 34 Years | 47 (24.7%) | 21 (15.8%) |
| 35 to 64 Years | 29 (8.1%) | 42 (10.2%) |
| 65 to 74 Years | 7 (5.0%) | 44 (26.7%) |
| 75 Years and over | 3 (12.0%) | 31 (36.9%) |
Disability Class: Ambulatory Difficulty
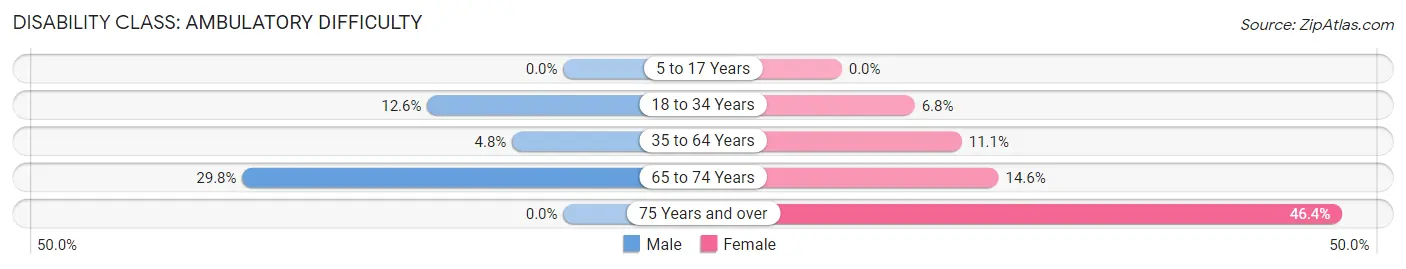
| Age Bracket | Male | Female |
| 5 to 17 Years | 0 (0.0%) | 0 (0.0%) |
| 18 to 34 Years | 24 (12.6%) | 9 (6.8%) |
| 35 to 64 Years | 17 (4.8%) | 46 (11.1%) |
| 65 to 74 Years | 42 (29.8%) | 24 (14.5%) |
| 75 Years and over | 0 (0.0%) | 39 (46.4%) |
Disability Class: Self-Care Difficulty
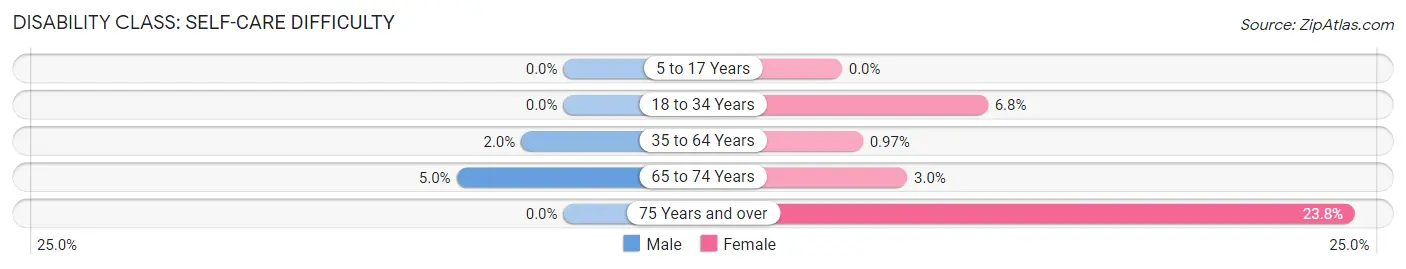
| Age Bracket | Male | Female |
| 5 to 17 Years | 0 (0.0%) | 0 (0.0%) |
| 18 to 34 Years | 0 (0.0%) | 9 (6.8%) |
| 35 to 64 Years | 7 (2.0%) | 4 (1.0%) |
| 65 to 74 Years | 7 (5.0%) | 5 (3.0%) |
| 75 Years and over | 0 (0.0%) | 20 (23.8%) |
Technology Access in Bernie
Computing Device Access in Bernie
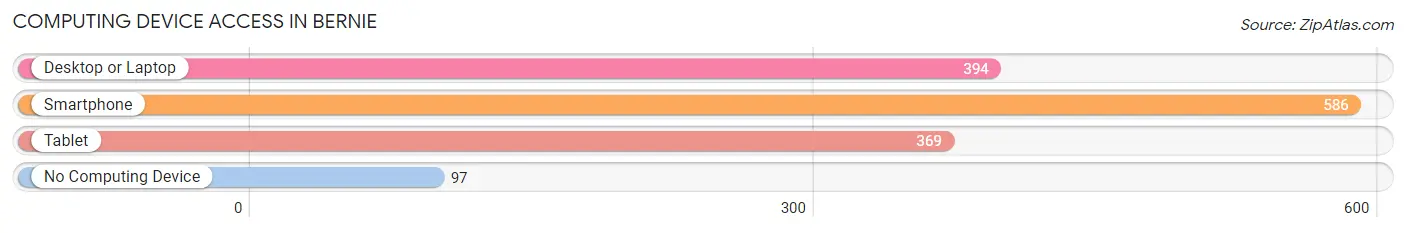
| Device Type | # Households | % Households |
| Desktop or Laptop | 394 | 52.0% |
| Smartphone | 586 | 77.3% |
| Tablet | 369 | 48.7% |
| No Computing Device | 97 | 12.8% |
| Total | 758 | 100.0% |
Internet Access in Bernie
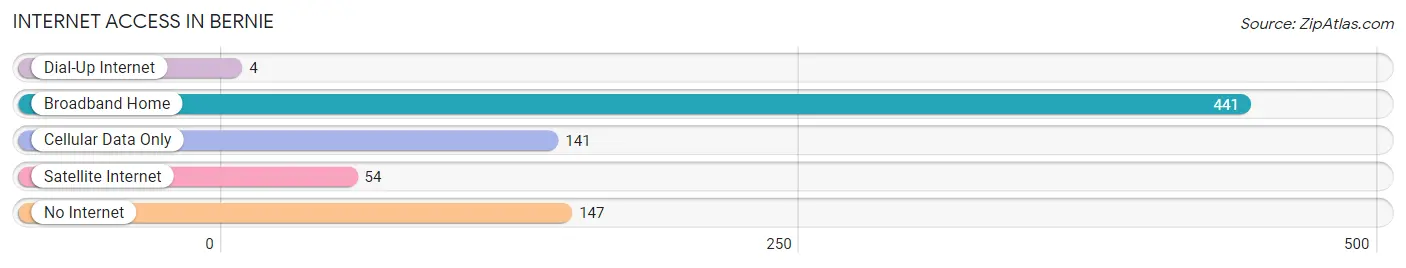
| Internet Type | # Households | % Households |
| Dial-Up Internet | 4 | 0.5% |
| Broadband Home | 441 | 58.2% |
| Cellular Data Only | 141 | 18.6% |
| Satellite Internet | 54 | 7.1% |
| No Internet | 147 | 19.4% |
| Total | 758 | 100.0% |
Bernie Summary
Bernie, Missouri is a small city located in Stoddard County in the southeastern corner of the state. It is situated on the banks of the St. Francis River, and is the county seat of Stoddard County. The city has a population of 2,717 people, according to the 2010 census.
History
Bernie was founded in 1883 by a group of settlers from the nearby town of Bloomfield. The town was named after the first settler, Bernard “Bernie” B. Smith. The town was incorporated in 1887 and quickly grew to become a thriving agricultural center. The town was known for its production of cotton, corn, and other crops.
In the early 1900s, Bernie was a major stop on the St. Louis-San Francisco Railway. The railroad brought new businesses and people to the area, and the town continued to grow. In the 1920s, the town was home to several banks, a movie theater, and a variety of stores.
Geography
Bernie is located in the southeastern corner of Missouri, in Stoddard County. It is situated on the banks of the St. Francis River, and is surrounded by rolling hills and farmland. The city is located about 30 miles from the Arkansas border, and about 90 miles from Memphis, Tennessee.
The climate in Bernie is humid subtropical, with hot, humid summers and mild winters. The average annual temperature is around 63 degrees Fahrenheit, and the average annual precipitation is around 45 inches.
Economy
The economy of Bernie is largely based on agriculture. The town is home to several large farms, and the surrounding area is known for its production of cotton, corn, soybeans, and other crops. The town is also home to several manufacturing companies, including a furniture factory and a plastics factory.
Bernie is also home to several small businesses, including restaurants, shops, and other services. The town is also home to a branch of the Stoddard County Bank, and a branch of the First National Bank of Dexter.
Demographics
According to the 2010 census, Bernie has a population of 2,717 people. The racial makeup of the town is 87.3% White, 8.7% African American, 0.3% Native American, 0.2% Asian, and 3.5% from other races. The median household income is $30,938, and the median age is 38.
Bernie is a small, rural town with a strong sense of community. The town is home to several churches, and the local school district is highly rated. The town is also home to a variety of recreational activities, including fishing, hunting, and camping.
Common Questions
What is Per Capita Income in Bernie?
Per Capita income in Bernie is $21,084.
What is the Median Family Income in Bernie?
Median Family Income in Bernie is $45,833.
What is the Median Household income in Bernie?
Median Household Income in Bernie is $41,477.
What is Income or Wage Gap in Bernie?
Income or Wage Gap in Bernie is 14.5%.
Women in Bernie earn 85.5 cents for every dollar earned by a man.
What is Inequality or Gini Index in Bernie?
Inequality or Gini Index in Bernie is 0.39.
What is the Total Population of Bernie?
Total Population of Bernie is 1,916.
What is the Total Male Population of Bernie?
Total Male Population of Bernie is 900.
What is the Total Female Population of Bernie?
Total Female Population of Bernie is 1,016.
What is the Ratio of Males per 100 Females in Bernie?
There are 88.58 Males per 100 Females in Bernie.
What is the Ratio of Females per 100 Males in Bernie?
There are 112.89 Females per 100 Males in Bernie.
What is the Median Population Age in Bernie?
Median Population Age in Bernie is 46.8 Years.
What is the Average Family Size in Bernie
Average Family Size in Bernie is 3.0 People.
What is the Average Household Size in Bernie
Average Household Size in Bernie is 2.5 People.
How Large is the Labor Force in Bernie?
There are 659 People in the Labor Forcein in Bernie.
What is the Percentage of People in the Labor Force in Bernie?
42.6% of People are in the Labor Force in Bernie.
What is the Unemployment Rate in Bernie?
Unemployment Rate in Bernie is 2.1%.