Grand Falls Plaza, MO Map & Demographics
Grand Falls Plaza Map
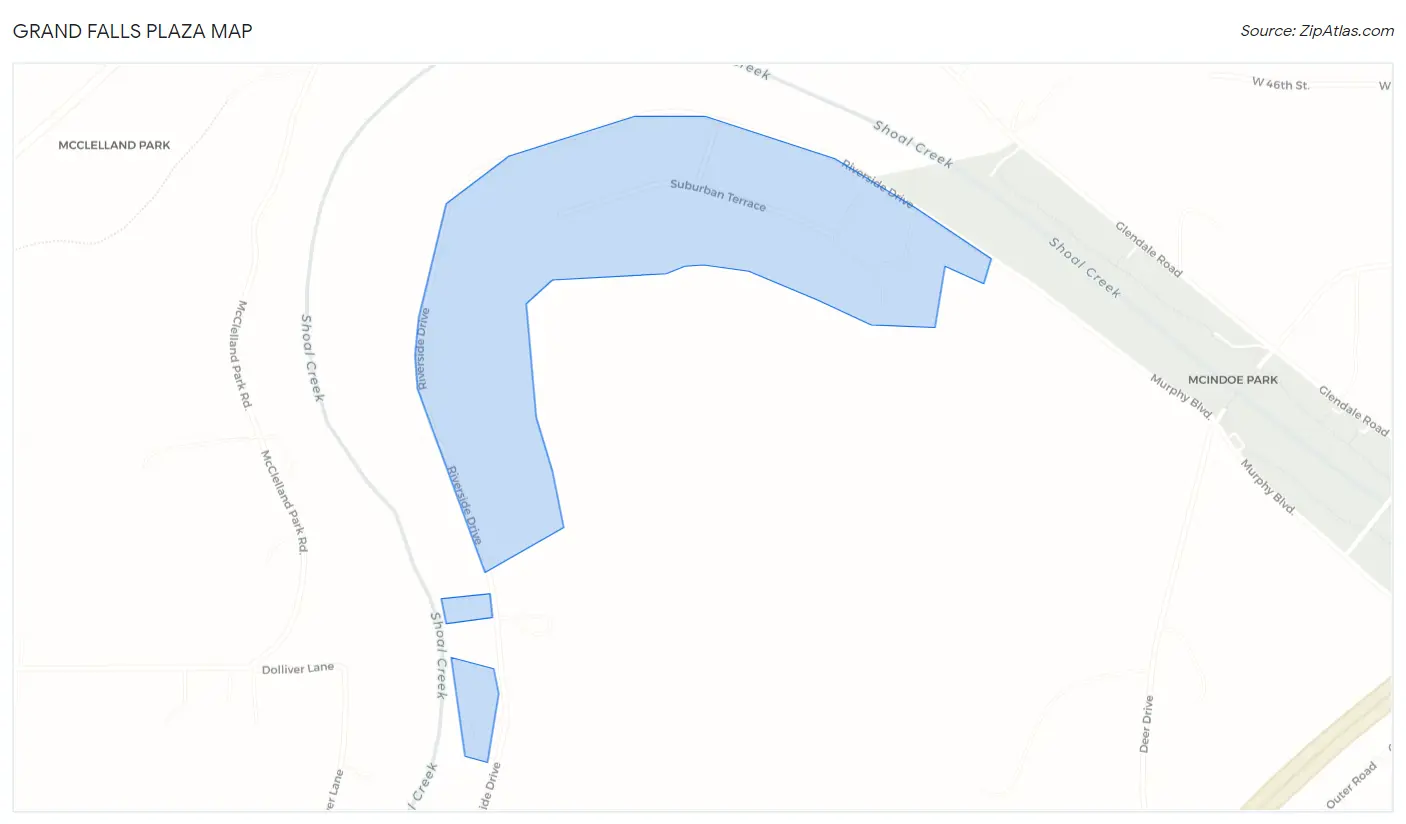
Grand Falls Plaza Overview
$20,547
PER CAPITA INCOME
$72,679
AVG FAMILY INCOME
$75,250
AVG HOUSEHOLD INCOME
37.9%
WAGE / INCOME GAP [ % ]
62.1¢/ $1
WAGE / INCOME GAP [ $ ]
0.26
INEQUALITY / GINI INDEX
214
TOTAL POPULATION
112
MALE POPULATION
102
FEMALE POPULATION
109.80
MALES / 100 FEMALES
91.07
FEMALES / 100 MALES
27.0
MEDIAN AGE
4.3
AVG FAMILY SIZE
4.3
AVG HOUSEHOLD SIZE
89
LABOR FORCE [ PEOPLE ]
66.9%
PERCENT IN LABOR FORCE
19.1%
UNEMPLOYMENT RATE
Income in Grand Falls Plaza
Income Overview in Grand Falls Plaza
Per Capita Income in Grand Falls Plaza is $20,547, while median incomes of families and households are $72,679 and $75,250 respectively.
| Characteristic | Number | Measure |
| Per Capita Income | 214 | $20,547 |
| Median Family Income | 43 | $72,679 |
| Mean Family Income | 43 | $75,642 |
| Median Household Income | 50 | $75,250 |
| Mean Household Income | 50 | $76,150 |
| Income Deficit | 43 | $0 |
| Wage / Income Gap (%) | 214 | 37.87% |
| Wage / Income Gap ($) | 214 | 62.13¢ per $1 |
| Gini / Inequality Index | 214 | 0.26 |
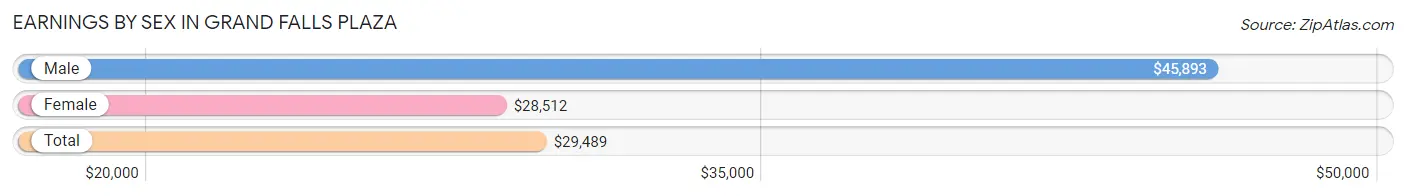
Earnings by Sex in Grand Falls Plaza
Average Earnings in Grand Falls Plaza are $29,489, $45,893 for men and $28,512 for women, a difference of 37.9%.
| Sex | Number | Average Earnings |
| Male | 24 (25.8%) | $45,893 |
| Female | 69 (74.2%) | $28,512 |
| Total | 93 (100.0%) | $29,489 |
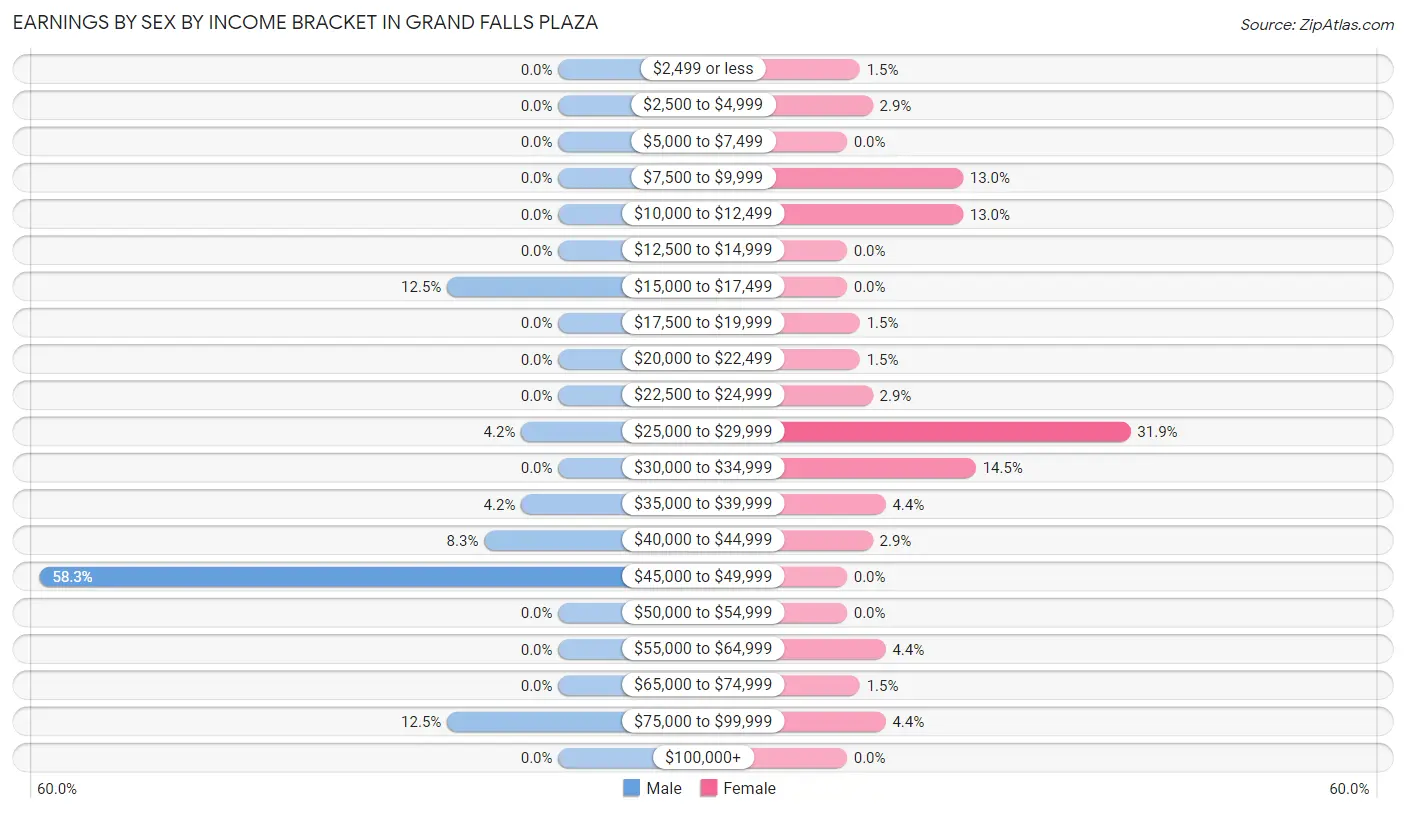
Earnings by Sex by Income Bracket in Grand Falls Plaza
The most common earnings brackets in Grand Falls Plaza are $45,000 to $49,999 for men (14 | 58.3%) and $25,000 to $29,999 for women (22 | 31.9%).
| Income | Male | Female |
| $2,499 or less | 0 (0.0%) | 1 (1.5%) |
| $2,500 to $4,999 | 0 (0.0%) | 2 (2.9%) |
| $5,000 to $7,499 | 0 (0.0%) | 0 (0.0%) |
| $7,500 to $9,999 | 0 (0.0%) | 9 (13.0%) |
| $10,000 to $12,499 | 0 (0.0%) | 9 (13.0%) |
| $12,500 to $14,999 | 0 (0.0%) | 0 (0.0%) |
| $15,000 to $17,499 | 3 (12.5%) | 0 (0.0%) |
| $17,500 to $19,999 | 0 (0.0%) | 1 (1.5%) |
| $20,000 to $22,499 | 0 (0.0%) | 1 (1.5%) |
| $22,500 to $24,999 | 0 (0.0%) | 2 (2.9%) |
| $25,000 to $29,999 | 1 (4.2%) | 22 (31.9%) |
| $30,000 to $34,999 | 0 (0.0%) | 10 (14.5%) |
| $35,000 to $39,999 | 1 (4.2%) | 3 (4.3%) |
| $40,000 to $44,999 | 2 (8.3%) | 2 (2.9%) |
| $45,000 to $49,999 | 14 (58.3%) | 0 (0.0%) |
| $50,000 to $54,999 | 0 (0.0%) | 0 (0.0%) |
| $55,000 to $64,999 | 0 (0.0%) | 3 (4.3%) |
| $65,000 to $74,999 | 0 (0.0%) | 1 (1.5%) |
| $75,000 to $99,999 | 3 (12.5%) | 3 (4.3%) |
| $100,000+ | 0 (0.0%) | 0 (0.0%) |
| Total | 24 (100.0%) | 69 (100.0%) |
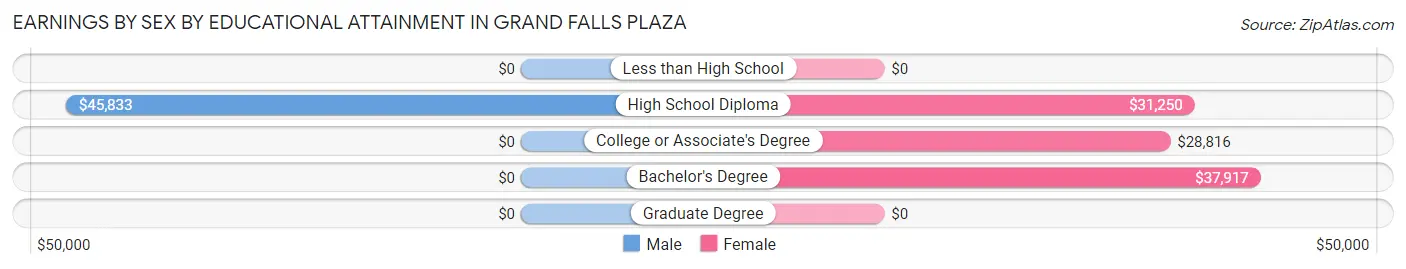
Earnings by Sex by Educational Attainment in Grand Falls Plaza
Average earnings in Grand Falls Plaza are $45,893 for men and $29,702 for women, a difference of 35.3%. Men with an educational attainment of high school diploma enjoy the highest average annual earnings of $45,833, while those with high school diploma education earn the least with $45,833. Women with an educational attainment of bachelor's degree earn the most with the average annual earnings of $37,917, while those with college or associate's degree education have the smallest earnings of $28,816.
| Educational Attainment | Male Income | Female Income |
| Less than High School | - | - |
| High School Diploma | $45,833 | $31,250 |
| College or Associate's Degree | - | - |
| Bachelor's Degree | - | - |
| Graduate Degree | - | - |
| Total | $45,893 | $29,702 |
Family Income in Grand Falls Plaza
Family Income Brackets in Grand Falls Plaza
According to the Grand Falls Plaza family income data, there are 16 families falling into the $35,000 to $49,999 income range, which is the most common income bracket and makes up 37.2% of all families.
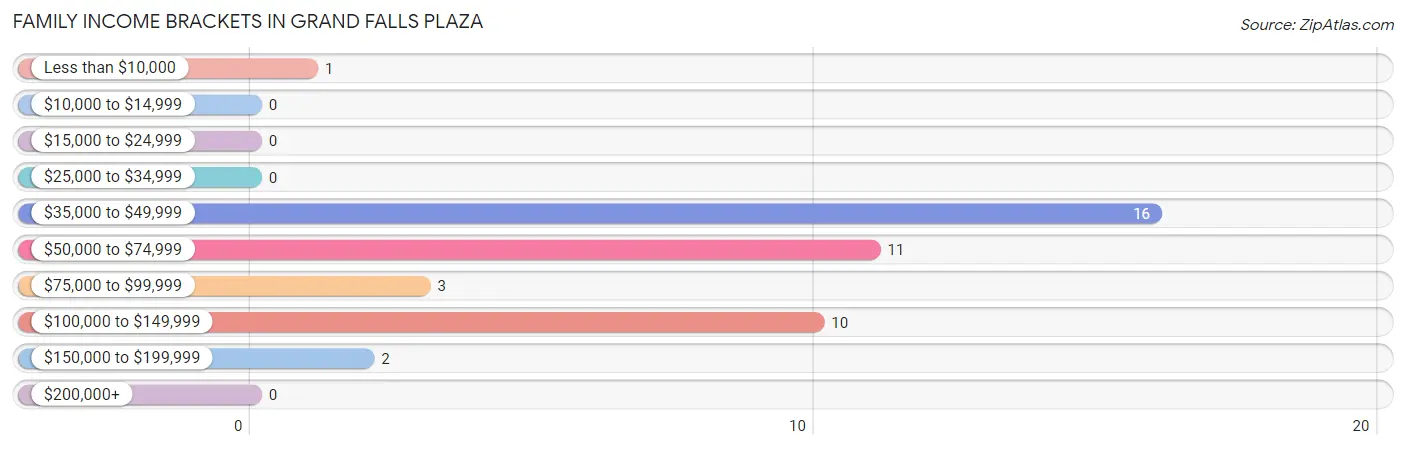
| Income Bracket | # Families | % Families |
| Less than $10,000 | 1 | 2.3% |
| $10,000 to $14,999 | 0 | 0.0% |
| $15,000 to $24,999 | 0 | 0.0% |
| $25,000 to $34,999 | 0 | 0.0% |
| $35,000 to $49,999 | 16 | 37.2% |
| $50,000 to $74,999 | 11 | 25.6% |
| $75,000 to $99,999 | 3 | 7.0% |
| $100,000 to $149,999 | 10 | 23.3% |
| $150,000 to $199,999 | 2 | 4.7% |
| $200,000+ | 0 | 0.0% |
Family Income by Famaliy Size in Grand Falls Plaza
2-person families (12 | 27.9%) account for the highest median family income in Grand Falls Plaza with $53,750 per family, while 2-person families (12 | 27.9%) have the highest median income of $26,875 per family member.
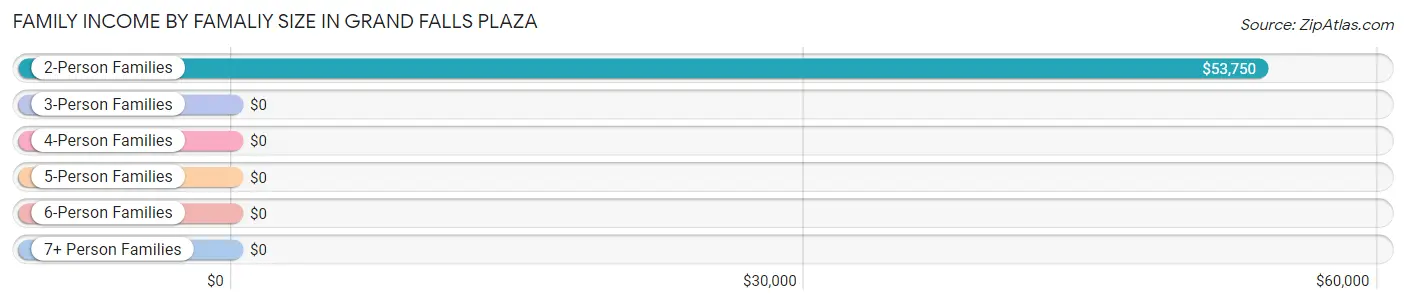
| Income Bracket | # Families | Median Income |
| 2-Person Families | 12 (27.9%) | $53,750 |
| 3-Person Families | 20 (46.5%) | $0 |
| 4-Person Families | 2 (4.6%) | $0 |
| 5-Person Families | 9 (20.9%) | $0 |
| 6-Person Families | 0 (0.0%) | $0 |
| 7+ Person Families | 0 (0.0%) | $0 |
| Total | 43 (100.0%) | $72,679 |
Family Income by Number of Earners in Grand Falls Plaza
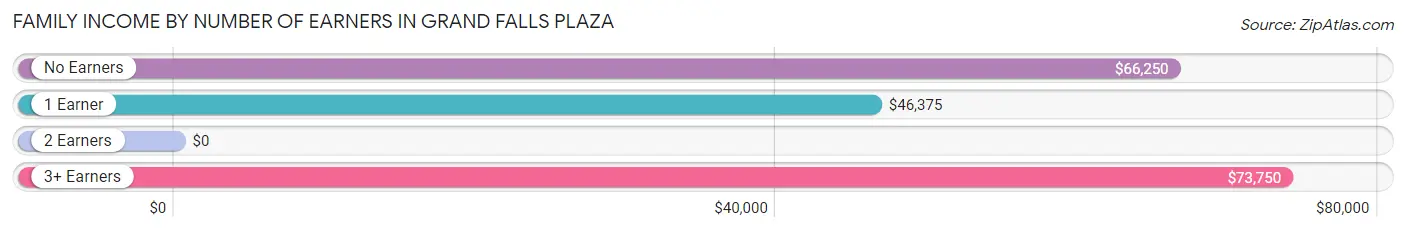
| Number of Earners | # Families | Median Income |
| No Earners | 10 (23.3%) | $66,250 |
| 1 Earner | 17 (39.5%) | $46,375 |
| 2 Earners | 5 (11.6%) | $0 |
| 3+ Earners | 11 (25.6%) | $73,750 |
| Total | 43 (100.0%) | $72,679 |
Household Income in Grand Falls Plaza
Household Income Brackets in Grand Falls Plaza
With 14 households falling in the category, the $75,000 to $99,999 income range is the most frequent in Grand Falls Plaza, accounting for 28.0% of all households.
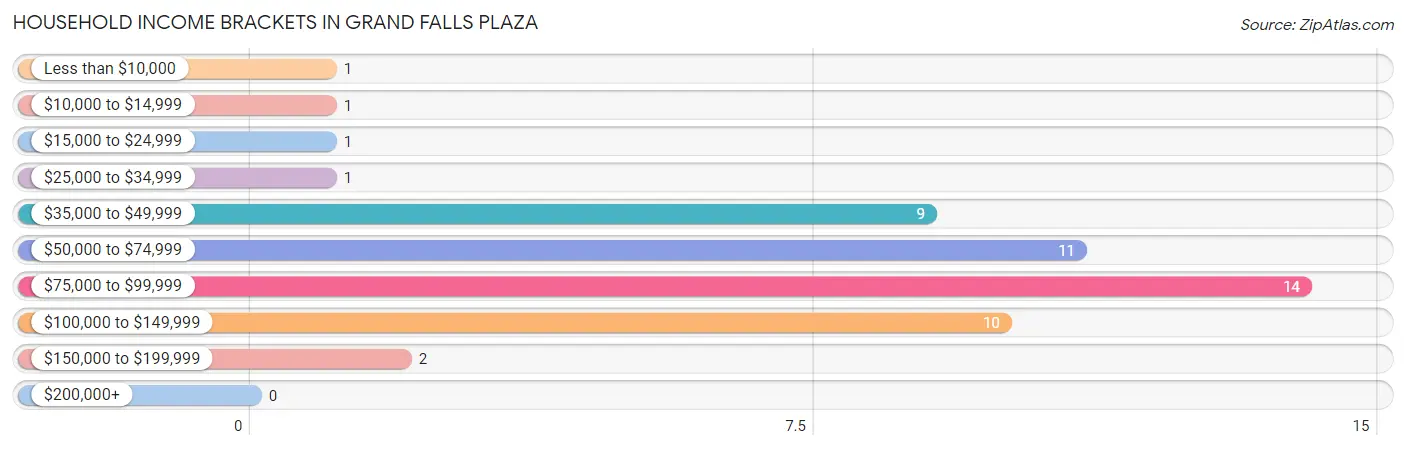
| Income Bracket | # Households | % Households |
| Less than $10,000 | 1 | 2.0% |
| $10,000 to $14,999 | 1 | 2.0% |
| $15,000 to $24,999 | 1 | 2.0% |
| $25,000 to $34,999 | 1 | 2.0% |
| $35,000 to $49,999 | 9 | 18.0% |
| $50,000 to $74,999 | 11 | 22.0% |
| $75,000 to $99,999 | 14 | 28.0% |
| $100,000 to $149,999 | 10 | 20.0% |
| $150,000 to $199,999 | 2 | 4.0% |
| $200,000+ | 0 | 0.0% |
Household Income by Householder Age in Grand Falls Plaza
The median household income in Grand Falls Plaza is $75,250, with the highest median household income of $75,500 found in the 25 to 44 years age bracket for the primary householder. A total of 26 households (52.0%) fall into this category.
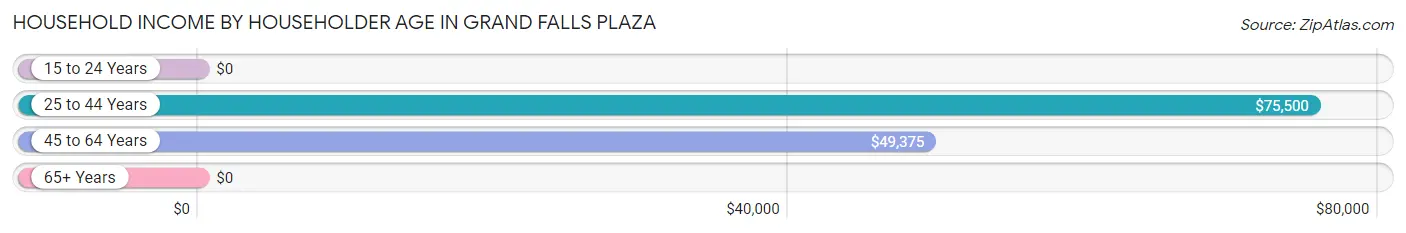
| Income Bracket | # Households | Median Income |
| 15 to 24 Years | 0 (0.0%) | $0 |
| 25 to 44 Years | 26 (52.0%) | $75,500 |
| 45 to 64 Years | 13 (26.0%) | $49,375 |
| 65+ Years | 11 (22.0%) | $0 |
| Total | 50 (100.0%) | $75,250 |
Poverty in Grand Falls Plaza
Income Below Poverty by Sex and Age in Grand Falls Plaza
With 0.9% poverty level for males and 4.9% for females among the residents of Grand Falls Plaza, 45 to 54 year old males and 45 to 54 year old females are the most vulnerable to poverty, with 1 males (14.3%) and 2 females (28.6%) in their respective age groups living below the poverty level.
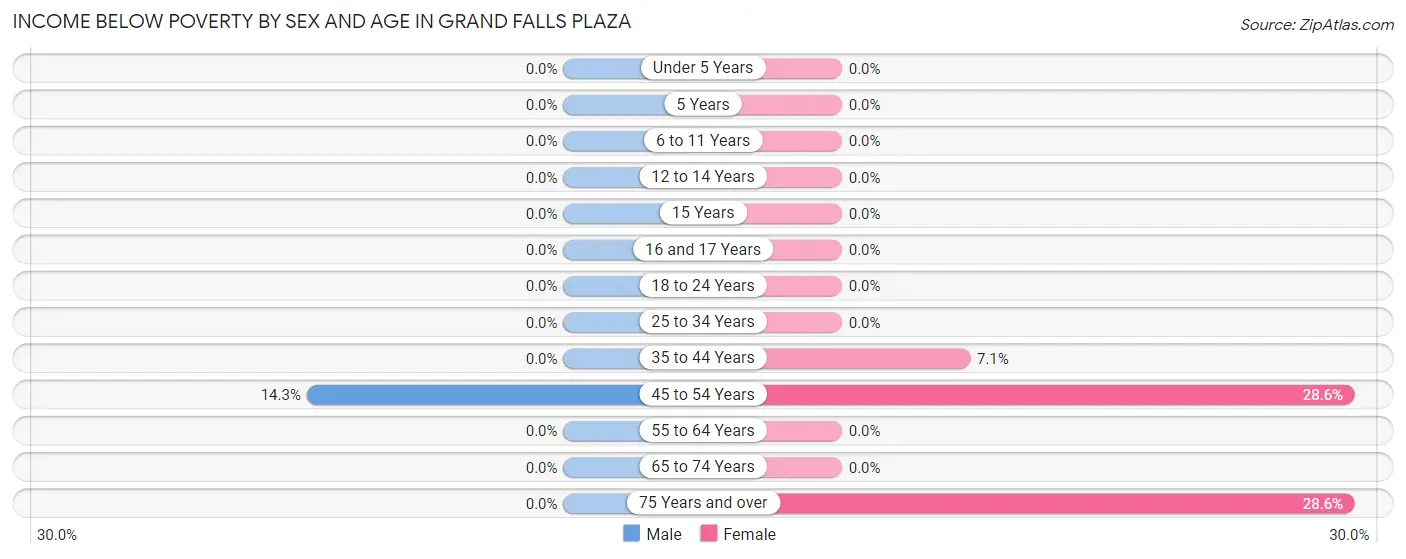
| Age Bracket | Male | Female |
| Under 5 Years | 0 (0.0%) | 0 (0.0%) |
| 5 Years | 0 (0.0%) | 0 (0.0%) |
| 6 to 11 Years | 0 (0.0%) | 0 (0.0%) |
| 12 to 14 Years | 0 (0.0%) | 0 (0.0%) |
| 15 Years | 0 (0.0%) | 0 (0.0%) |
| 16 and 17 Years | 0 (0.0%) | 0 (0.0%) |
| 18 to 24 Years | 0 (0.0%) | 0 (0.0%) |
| 25 to 34 Years | 0 (0.0%) | 0 (0.0%) |
| 35 to 44 Years | 0 (0.0%) | 1 (7.1%) |
| 45 to 54 Years | 1 (14.3%) | 2 (28.6%) |
| 55 to 64 Years | 0 (0.0%) | 0 (0.0%) |
| 65 to 74 Years | 0 (0.0%) | 0 (0.0%) |
| 75 Years and over | 0 (0.0%) | 2 (28.6%) |
| Total | 1 (0.9%) | 5 (4.9%) |
Income Above Poverty by Sex and Age in Grand Falls Plaza
According to the poverty statistics in Grand Falls Plaza, males aged under 5 years and females aged 6 to 11 years are the age groups that are most secure financially, with 100.0% of males and 100.0% of females in these age groups living above the poverty line.
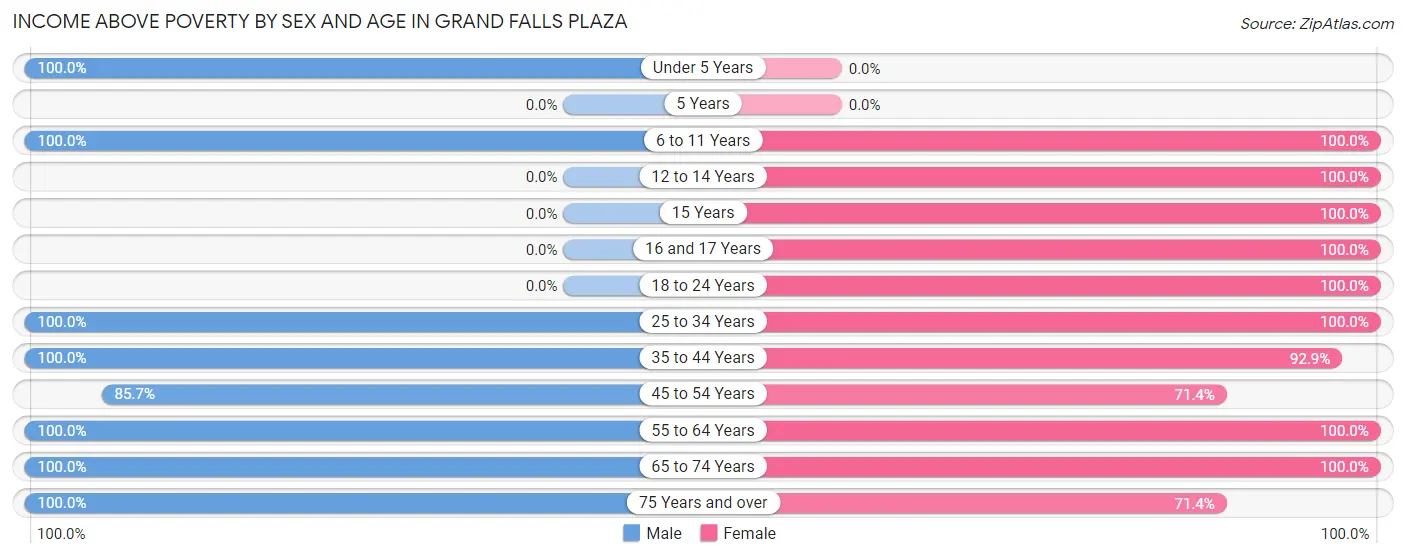
| Age Bracket | Male | Female |
| Under 5 Years | 2 (100.0%) | 0 (0.0%) |
| 5 Years | 0 (0.0%) | 0 (0.0%) |
| 6 to 11 Years | 63 (100.0%) | 5 (100.0%) |
| 12 to 14 Years | 0 (0.0%) | 2 (100.0%) |
| 15 Years | 0 (0.0%) | 9 (100.0%) |
| 16 and 17 Years | 0 (0.0%) | 9 (100.0%) |
| 18 to 24 Years | 0 (0.0%) | 11 (100.0%) |
| 25 to 34 Years | 15 (100.0%) | 22 (100.0%) |
| 35 to 44 Years | 13 (100.0%) | 13 (92.9%) |
| 45 to 54 Years | 6 (85.7%) | 5 (71.4%) |
| 55 to 64 Years | 1 (100.0%) | 14 (100.0%) |
| 65 to 74 Years | 1 (100.0%) | 2 (100.0%) |
| 75 Years and over | 10 (100.0%) | 5 (71.4%) |
| Total | 111 (99.1%) | 97 (95.1%) |
Income Below Poverty Among Married-Couple Families in Grand Falls Plaza
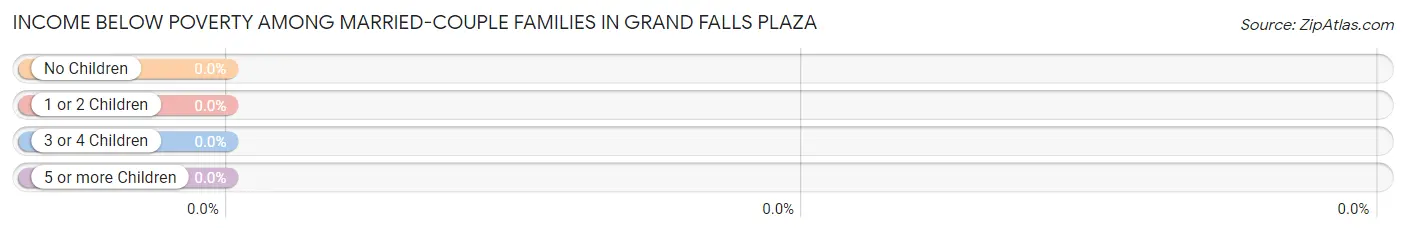
| Children | Above Poverty | Below Poverty |
| No Children | 11 (100.0%) | 0 (0.0%) |
| 1 or 2 Children | 10 (100.0%) | 0 (0.0%) |
| 3 or 4 Children | 2 (100.0%) | 0 (0.0%) |
| 5 or more Children | 0 (0.0%) | 0 (0.0%) |
| Total | 23 (100.0%) | 0 (0.0%) |
Income Below Poverty Among Single-Parent Households in Grand Falls Plaza
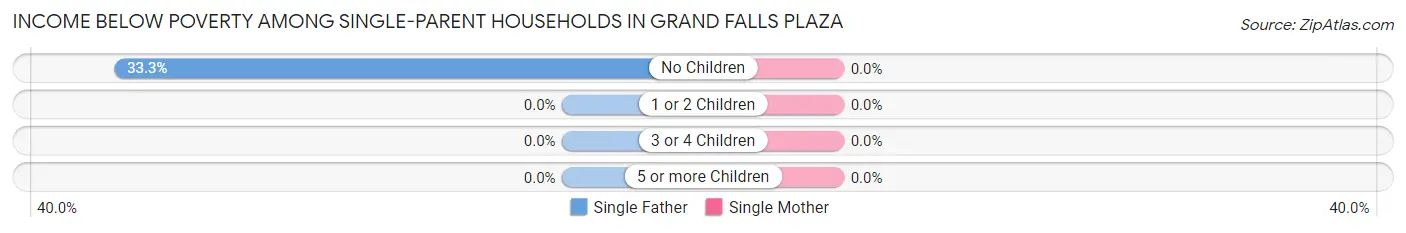
| Children | Single Father | Single Mother |
| No Children | 1 (33.3%) | 0 (0.0%) |
| 1 or 2 Children | 0 (0.0%) | 0 (0.0%) |
| 3 or 4 Children | 0 (0.0%) | 0 (0.0%) |
| 5 or more Children | 0 (0.0%) | 0 (0.0%) |
| Total | 1 (6.7%) | 0 (0.0%) |
Income Below Poverty Among Married-Couple vs Single-Parent Households in Grand Falls Plaza
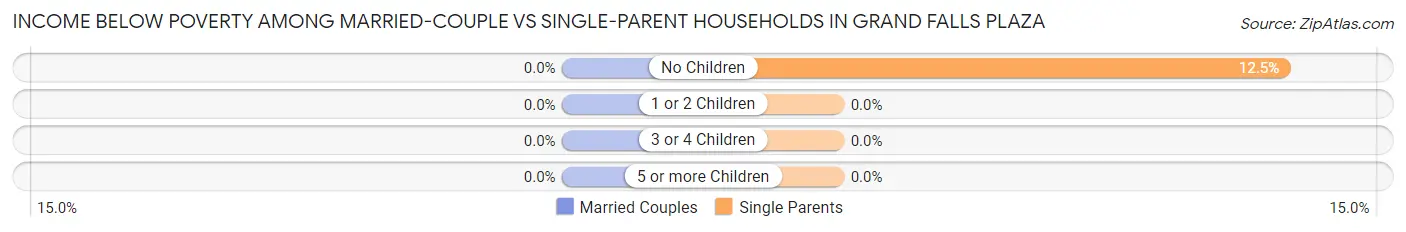
| Children | Married-Couple Families | Single-Parent Households |
| No Children | 0 (0.0%) | 1 (12.5%) |
| 1 or 2 Children | 0 (0.0%) | 0 (0.0%) |
| 3 or 4 Children | 0 (0.0%) | 0 (0.0%) |
| 5 or more Children | 0 (0.0%) | 0 (0.0%) |
| Total | 0 (0.0%) | 1 (5.0%) |
Race in Grand Falls Plaza
The most populous races in Grand Falls Plaza are White / Caucasian (126 | 58.9%), Black / African American (72 | 33.6%), and Two or more Races (14 | 6.5%).
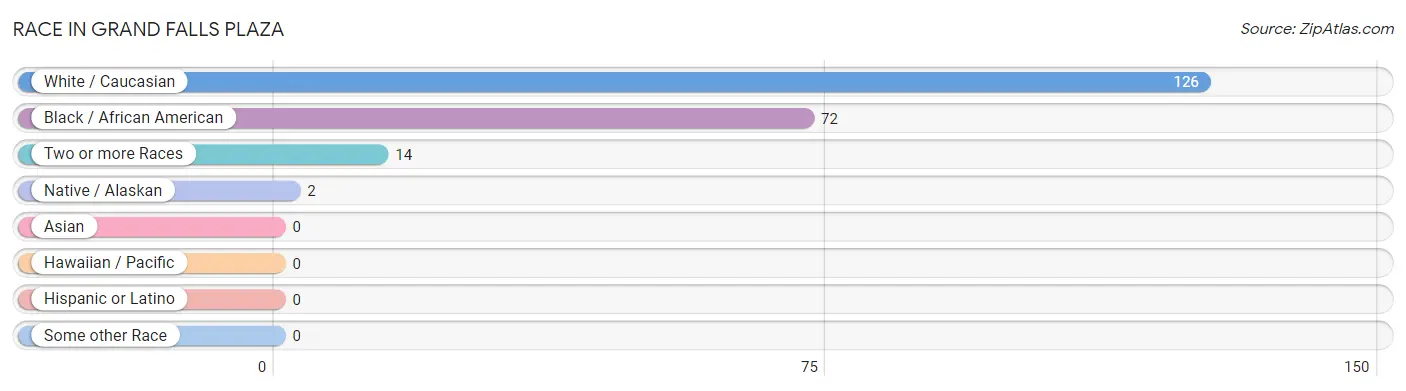
| Race | # Population | % Population |
| Asian | 0 | 0.0% |
| Black / African American | 72 | 33.6% |
| Hawaiian / Pacific | 0 | 0.0% |
| Hispanic or Latino | 0 | 0.0% |
| Native / Alaskan | 2 | 0.9% |
| White / Caucasian | 126 | 58.9% |
| Two or more Races | 14 | 6.5% |
| Some other Race | 0 | 0.0% |
| Total | 214 | 100.0% |
Ancestry in Grand Falls Plaza
The most populous ancestries reported in Grand Falls Plaza are Portuguese (41 | 19.2%), European (22 | 10.3%), American (10 | 4.7%), Italian (8 | 3.7%), and English (5 | 2.3%), together accounting for 40.2% of all Grand Falls Plaza residents.
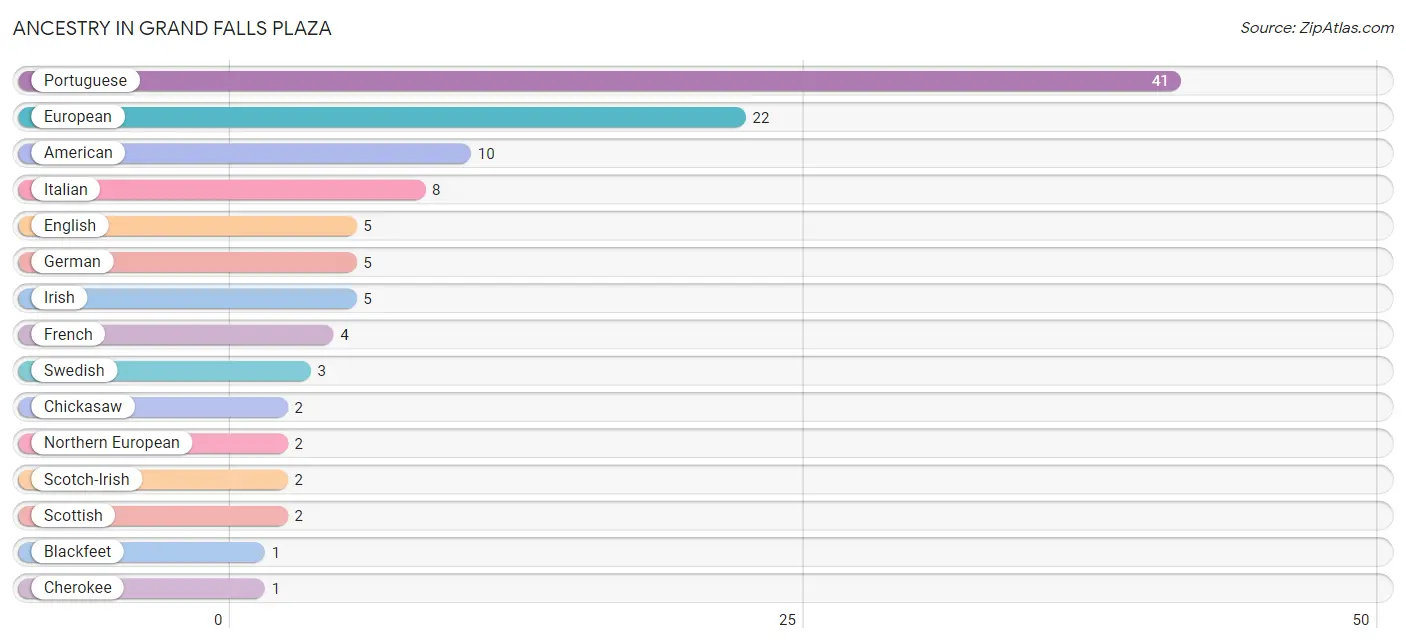
| Ancestry | # Population | % Population |
| American | 10 | 4.7% |
| Blackfeet | 1 | 0.5% |
| Cherokee | 1 | 0.5% |
| Chickasaw | 2 | 0.9% |
| Dutch | 1 | 0.5% |
| English | 5 | 2.3% |
| European | 22 | 10.3% |
| French | 4 | 1.9% |
| German | 5 | 2.3% |
| Irish | 5 | 2.3% |
| Italian | 8 | 3.7% |
| Northern European | 2 | 0.9% |
| Portuguese | 41 | 19.2% |
| Scotch-Irish | 2 | 0.9% |
| Scottish | 2 | 0.9% |
| Sioux | 1 | 0.5% |
| Swedish | 3 | 1.4% | View All 17 Rows |
Immigrants in Grand Falls Plaza

| Immigration Origin | # Population | % Population | View All 0 Rows |
Sex and Age in Grand Falls Plaza
Sex and Age in Grand Falls Plaza
The most populous age groups in Grand Falls Plaza are 5 to 9 Years (60 | 53.6%) for men and 30 to 34 Years (19 | 18.6%) for women.
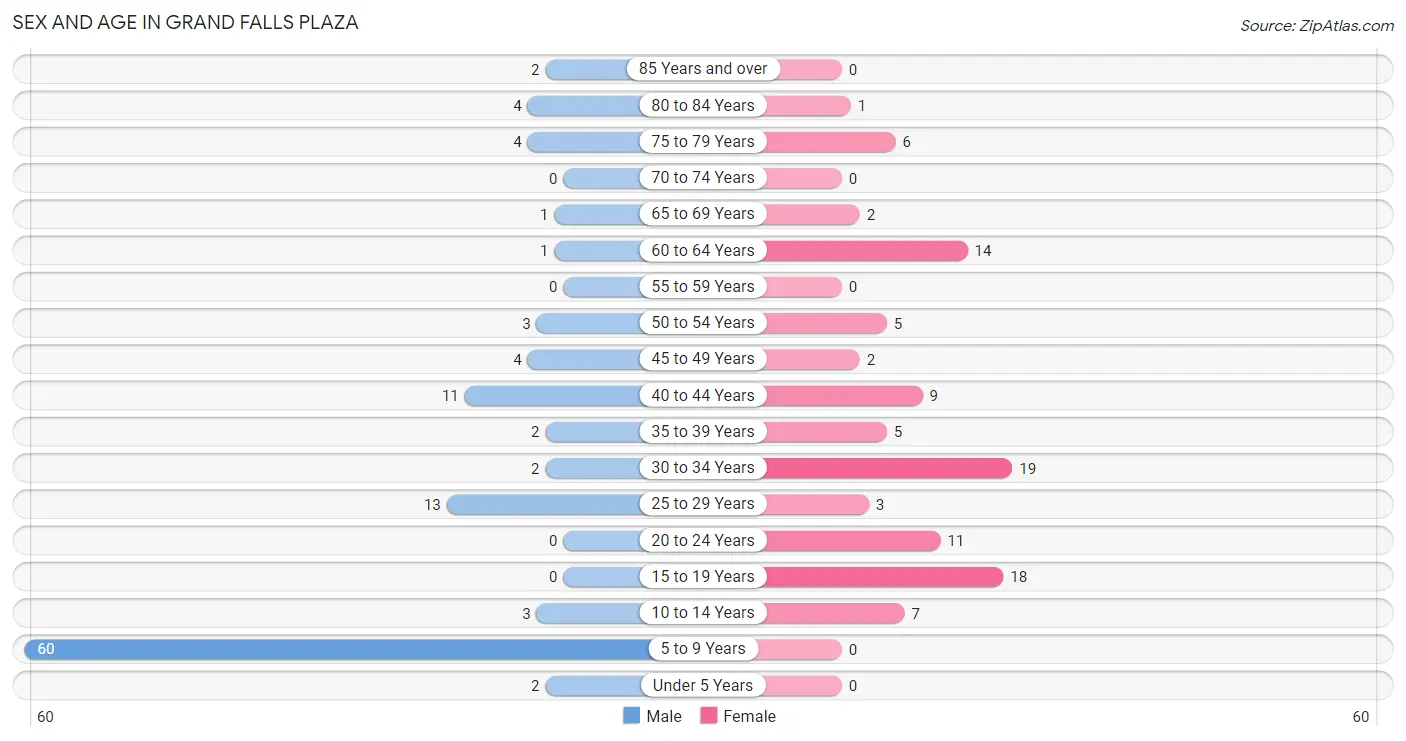
| Age Bracket | Male | Female |
| Under 5 Years | 2 (1.8%) | 0 (0.0%) |
| 5 to 9 Years | 60 (53.6%) | 0 (0.0%) |
| 10 to 14 Years | 3 (2.7%) | 7 (6.9%) |
| 15 to 19 Years | 0 (0.0%) | 18 (17.6%) |
| 20 to 24 Years | 0 (0.0%) | 11 (10.8%) |
| 25 to 29 Years | 13 (11.6%) | 3 (2.9%) |
| 30 to 34 Years | 2 (1.8%) | 19 (18.6%) |
| 35 to 39 Years | 2 (1.8%) | 5 (4.9%) |
| 40 to 44 Years | 11 (9.8%) | 9 (8.8%) |
| 45 to 49 Years | 4 (3.6%) | 2 (2.0%) |
| 50 to 54 Years | 3 (2.7%) | 5 (4.9%) |
| 55 to 59 Years | 0 (0.0%) | 0 (0.0%) |
| 60 to 64 Years | 1 (0.9%) | 14 (13.7%) |
| 65 to 69 Years | 1 (0.9%) | 2 (2.0%) |
| 70 to 74 Years | 0 (0.0%) | 0 (0.0%) |
| 75 to 79 Years | 4 (3.6%) | 6 (5.9%) |
| 80 to 84 Years | 4 (3.6%) | 1 (1.0%) |
| 85 Years and over | 2 (1.8%) | 0 (0.0%) |
| Total | 112 (100.0%) | 102 (100.0%) |
Families and Households in Grand Falls Plaza
Median Family Size in Grand Falls Plaza
The median family size in Grand Falls Plaza is 4.30 persons per family, with single male/father families (15 | 34.9%) accounting for the largest median family size of 5.4 persons per family. On the other hand, single female/mother families (5 | 11.6%) represent the smallest median family size with 3.40 persons per family.
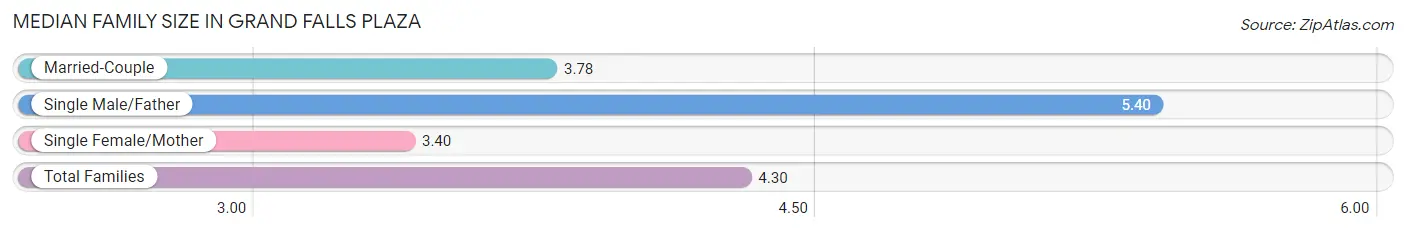
| Family Type | # Families | Family Size |
| Married-Couple | 23 (53.5%) | 3.78 |
| Single Male/Father | 15 (34.9%) | 5.40 |
| Single Female/Mother | 5 (11.6%) | 3.40 |
| Total Families | 43 (100.0%) | 4.30 |
Median Household Size in Grand Falls Plaza
The median household size in Grand Falls Plaza is 4.28 persons per household, with single male/father households (15 | 30.0%) accounting for the largest median household size of 6.67 persons per household. non-family households (7 | 14.0%) represent the smallest median household size with 1.43 persons per household.
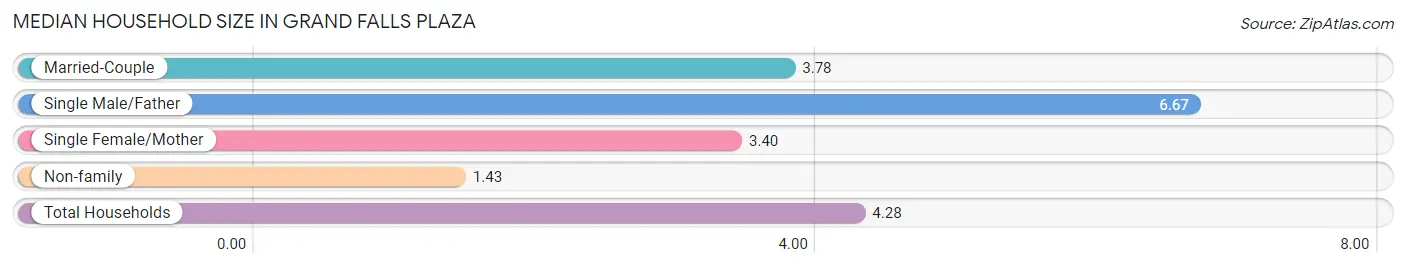
| Household Type | # Households | Household Size |
| Married-Couple | 23 (46.0%) | 3.78 |
| Single Male/Father | 15 (30.0%) | 6.67 |
| Single Female/Mother | 5 (10.0%) | 3.40 |
| Non-family | 7 (14.0%) | 1.43 |
| Total Households | 50 (100.0%) | 4.28 |
Household Size by Marriage Status in Grand Falls Plaza
Out of a total of 50 households in Grand Falls Plaza, 43 (86.0%) are family households, while 7 (14.0%) are nonfamily households. The most numerous type of family households are 2-person households, comprising 12, and the most common type of nonfamily households are 1-person households, comprising 6.
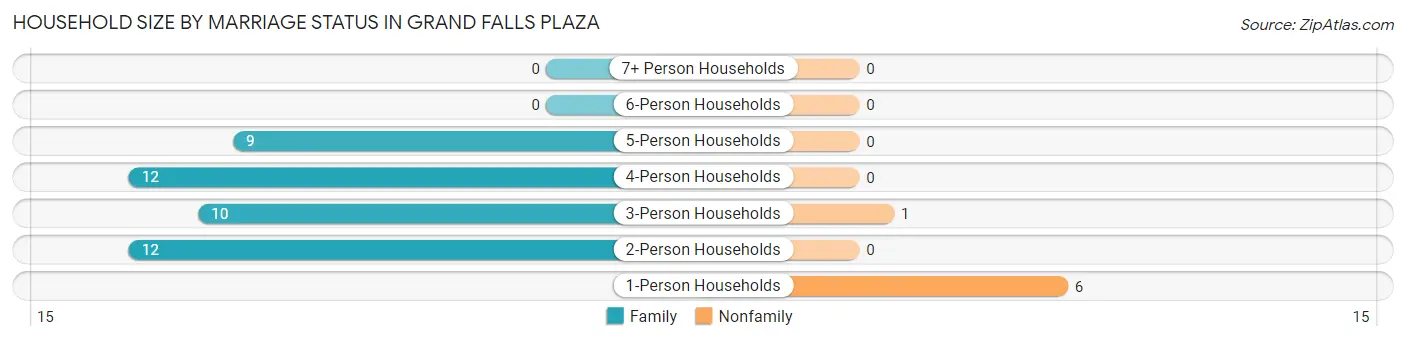
| Household Size | Family Households | Nonfamily Households |
| 1-Person Households | - | 6 (12.0%) |
| 2-Person Households | 12 (24.0%) | 0 (0.0%) |
| 3-Person Households | 10 (20.0%) | 1 (2.0%) |
| 4-Person Households | 12 (24.0%) | 0 (0.0%) |
| 5-Person Households | 9 (18.0%) | 0 (0.0%) |
| 6-Person Households | 0 (0.0%) | 0 (0.0%) |
| 7+ Person Households | 0 (0.0%) | 0 (0.0%) |
| Total | 43 (86.0%) | 7 (14.0%) |
Female Fertility in Grand Falls Plaza
Fertility by Age in Grand Falls Plaza
| Age Bracket | Women with Births | Births / 1,000 Women |
| 15 to 19 years | 0 (0.0%) | 0.0 |
| 20 to 34 years | 0 (0.0%) | 0.0 |
| 35 to 50 years | 0 (0.0%) | 0.0 |
| Total | 0 (0.0%) | 0.0 |
Fertility by Age by Marriage Status in Grand Falls Plaza
| Age Bracket | Married | Unmarried |
| 15 to 19 years | 0 (0.0%) | 0 (0.0%) |
| 20 to 34 years | 0 (0.0%) | 0 (0.0%) |
| 35 to 50 years | 0 (0.0%) | 0 (0.0%) |
| Total | 0 (0.0%) | 0 (0.0%) |
Fertility by Education in Grand Falls Plaza
| Educational Attainment | Women with Births | Births / 1,000 Women |
| Less than High School | 0 (0.0%) | 0.0 |
| High School Diploma | 0 (0.0%) | 0.0 |
| College or Associate's Degree | 0 (0.0%) | 0.0 |
| Bachelor's Degree | 0 (0.0%) | 0.0 |
| Graduate Degree | 0 (0.0%) | 0.0 |
| Total | 0 (0.0%) | 0.0 |
Fertility by Education by Marriage Status in Grand Falls Plaza
| Educational Attainment | Married | Unmarried |
| Less than High School | 0 (0.0%) | 0 (0.0%) |
| High School Diploma | 0 (0.0%) | 0 (0.0%) |
| College or Associate's Degree | 0 (0.0%) | 0 (0.0%) |
| Bachelor's Degree | 0 (0.0%) | 0 (0.0%) |
| Graduate Degree | 0 (0.0%) | 0 (0.0%) |
| Total | 0 (0.0%) | 0 (0.0%) |
Employment Characteristics in Grand Falls Plaza
Employment by Class of Employer in Grand Falls Plaza
Among the 72 employed individuals in Grand Falls Plaza, not-for-profit organizations (31 | 43.1%), private company employees (29 | 40.3%), and local government employees (4 | 5.6%) make up the most common classes of employment.
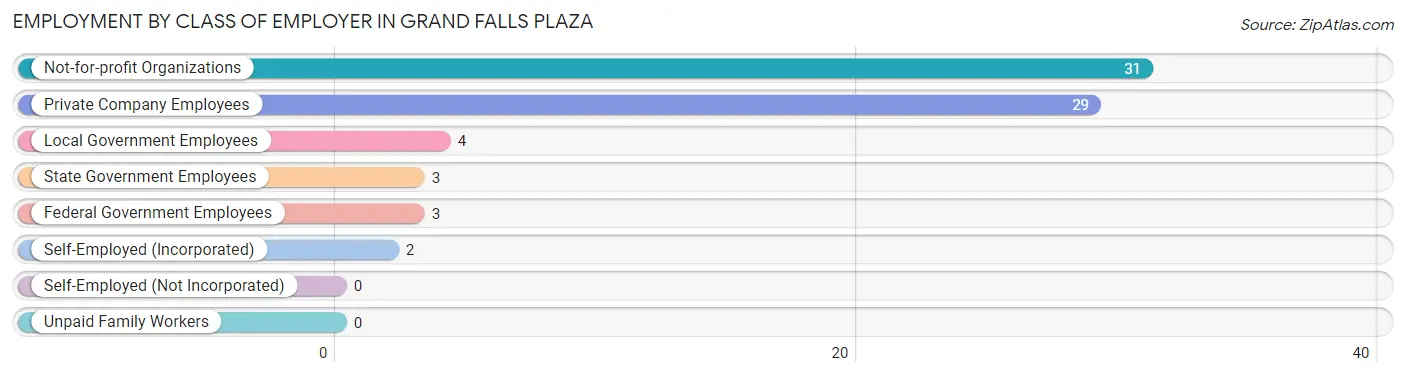
| Employer Class | # Employees | % Employees |
| Private Company Employees | 29 | 40.3% |
| Self-Employed (Incorporated) | 2 | 2.8% |
| Self-Employed (Not Incorporated) | 0 | 0.0% |
| Not-for-profit Organizations | 31 | 43.1% |
| Local Government Employees | 4 | 5.6% |
| State Government Employees | 3 | 4.2% |
| Federal Government Employees | 3 | 4.2% |
| Unpaid Family Workers | 0 | 0.0% |
| Total | 72 | 100.0% |
Employment Status by Age in Grand Falls Plaza
According to the labor force statistics for Grand Falls Plaza, out of the total population over 16 years of age (133), 66.9% or 89 individuals are in the labor force, with 19.1% or 17 of them unemployed. The age group with the highest labor force participation rate is 16 to 19 years, with 100.0% or 9 individuals in the labor force. Within the labor force, the 16 to 19 years age range has the highest percentage of unemployed individuals, with 100.0% or 9 of them being unemployed.
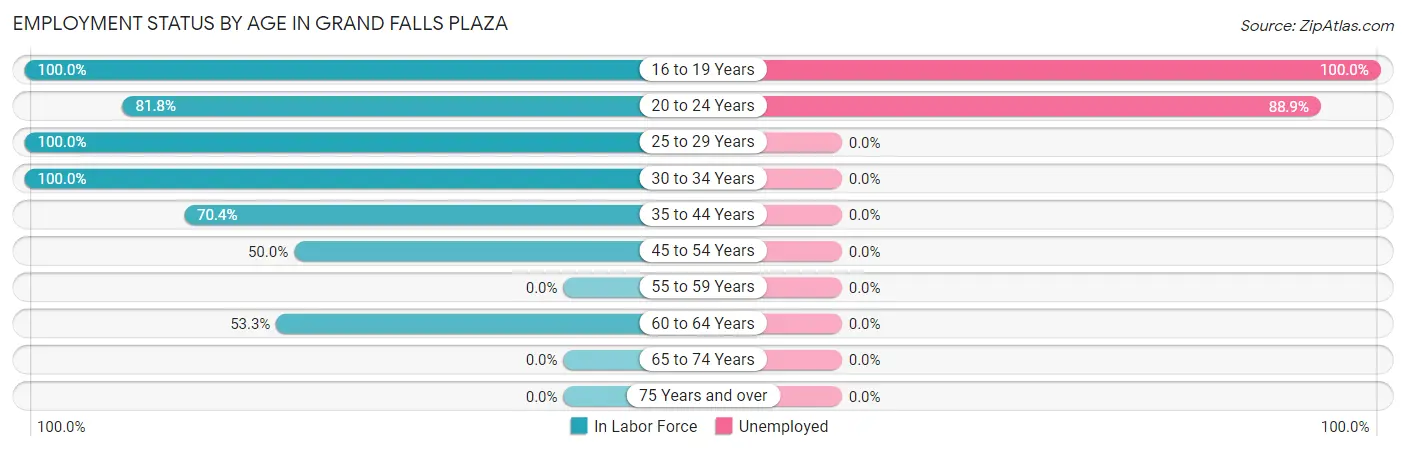
| Age Bracket | In Labor Force | Unemployed |
| 16 to 19 Years | 9 (100.0%) | 9 (100.0%) |
| 20 to 24 Years | 9 (81.8%) | 8 (88.9%) |
| 25 to 29 Years | 16 (100.0%) | 0 (0.0%) |
| 30 to 34 Years | 21 (100.0%) | 0 (0.0%) |
| 35 to 44 Years | 19 (70.4%) | 0 (0.0%) |
| 45 to 54 Years | 7 (50.0%) | 0 (0.0%) |
| 55 to 59 Years | 0 (0.0%) | 0 (0.0%) |
| 60 to 64 Years | 8 (53.3%) | 0 (0.0%) |
| 65 to 74 Years | 0 (0.0%) | 0 (0.0%) |
| 75 Years and over | 0 (0.0%) | 0 (0.0%) |
| Total | 89 (66.9%) | 17 (19.1%) |
Employment Status by Educational Attainment in Grand Falls Plaza
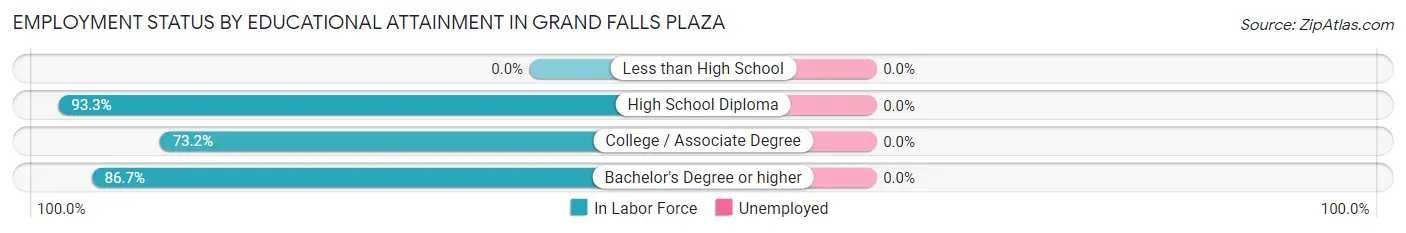
| Educational Attainment | In Labor Force | Unemployed |
| Less than High School | 0 (0.0%) | 0 (0.0%) |
| High School Diploma | 28 (93.3%) | 0 (0.0%) |
| College / Associate Degree | 30 (73.2%) | 0 (0.0%) |
| Bachelor's Degree or higher | 13 (86.7%) | 0 (0.0%) |
| Total | 71 (76.3%) | 0 (0.0%) |
Employment Occupations by Sex in Grand Falls Plaza
Management, Business, Science and Arts Occupations
The most common Management, Business, Science and Arts occupations in Grand Falls Plaza are Health Diagnosing & Treating (8 | 11.1%), Health Technologists (6 | 8.3%), Management (5 | 6.9%), Community & Social Service (3 | 4.2%), and Education, Arts & Media (3 | 4.2%).
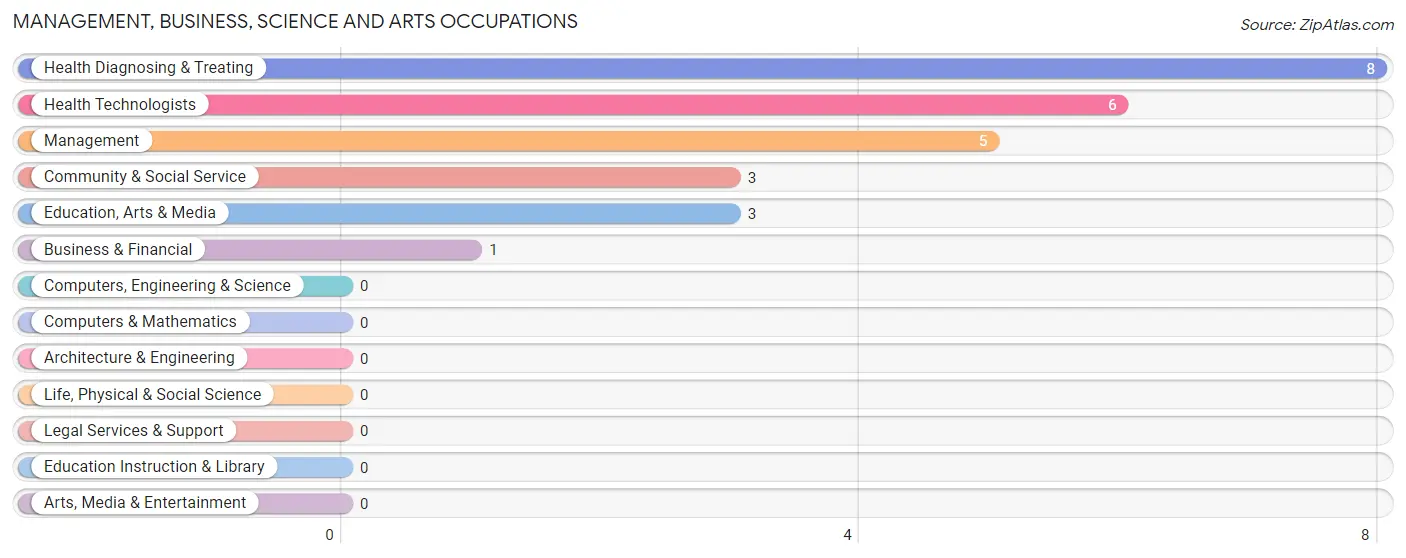
Management, Business, Science and Arts Occupations by Sex
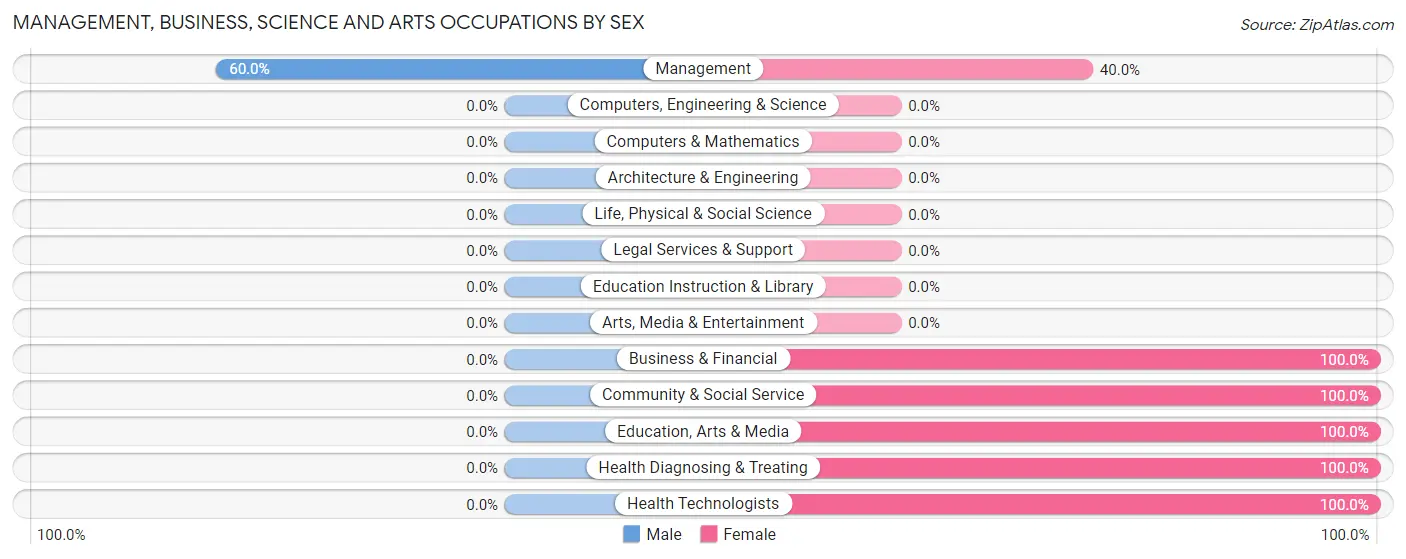
| Occupation | Male | Female |
| Management | 3 (60.0%) | 2 (40.0%) |
| Business & Financial | 0 (0.0%) | 1 (100.0%) |
| Computers, Engineering & Science | 0 (0.0%) | 0 (0.0%) |
| Computers & Mathematics | 0 (0.0%) | 0 (0.0%) |
| Architecture & Engineering | 0 (0.0%) | 0 (0.0%) |
| Life, Physical & Social Science | 0 (0.0%) | 0 (0.0%) |
| Community & Social Service | 0 (0.0%) | 3 (100.0%) |
| Education, Arts & Media | 0 (0.0%) | 3 (100.0%) |
| Legal Services & Support | 0 (0.0%) | 0 (0.0%) |
| Education Instruction & Library | 0 (0.0%) | 0 (0.0%) |
| Arts, Media & Entertainment | 0 (0.0%) | 0 (0.0%) |
| Health Diagnosing & Treating | 0 (0.0%) | 8 (100.0%) |
| Health Technologists | 0 (0.0%) | 6 (100.0%) |
| Total (Category) | 3 (17.6%) | 14 (82.4%) |
| Total (Overall) | 24 (33.3%) | 48 (66.7%) |
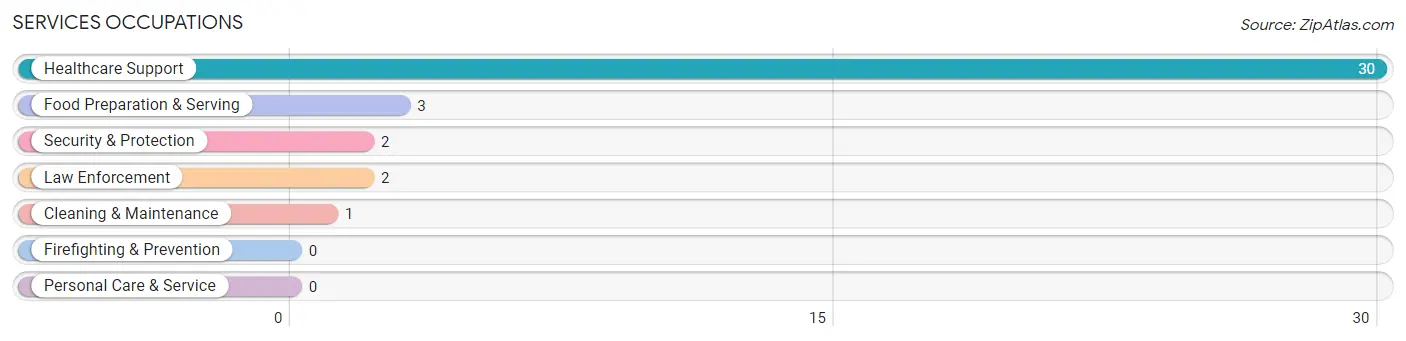
Services Occupations
The most common Services occupations in Grand Falls Plaza are Healthcare Support (30 | 41.7%), Food Preparation & Serving (3 | 4.2%), Security & Protection (2 | 2.8%), Law Enforcement (2 | 2.8%), and Cleaning & Maintenance (1 | 1.4%).
Services Occupations by Sex
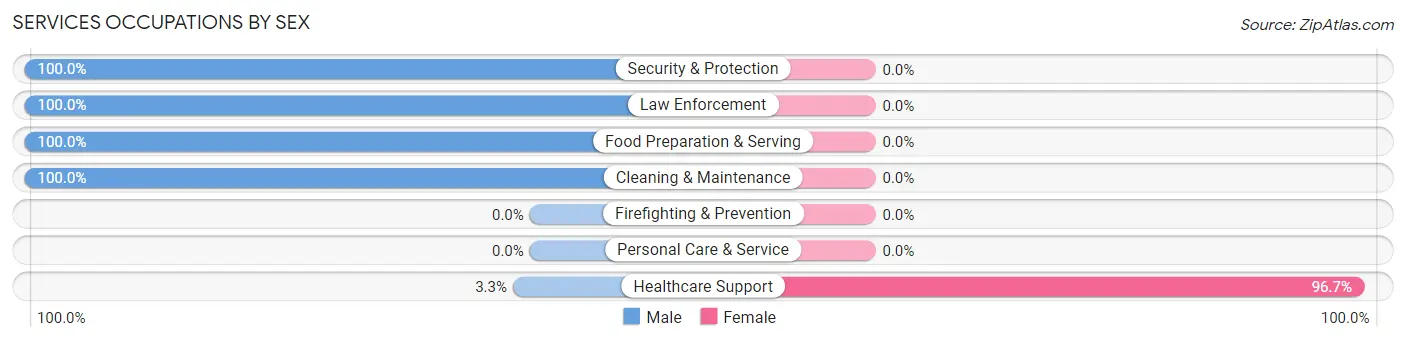
| Occupation | Male | Female |
| Healthcare Support | 1 (3.3%) | 29 (96.7%) |
| Security & Protection | 2 (100.0%) | 0 (0.0%) |
| Firefighting & Prevention | 0 (0.0%) | 0 (0.0%) |
| Law Enforcement | 2 (100.0%) | 0 (0.0%) |
| Food Preparation & Serving | 3 (100.0%) | 0 (0.0%) |
| Cleaning & Maintenance | 1 (100.0%) | 0 (0.0%) |
| Personal Care & Service | 0 (0.0%) | 0 (0.0%) |
| Total (Category) | 7 (19.4%) | 29 (80.6%) |
| Total (Overall) | 24 (33.3%) | 48 (66.7%) |
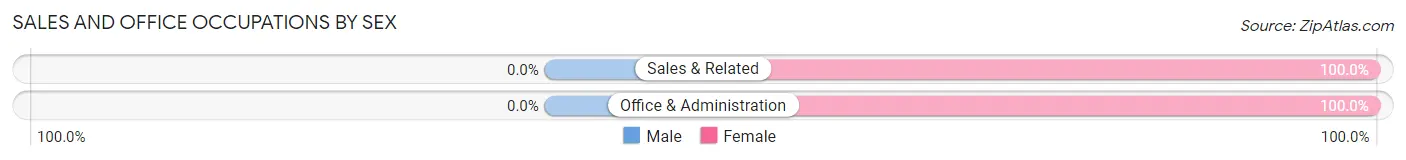
Sales and Office Occupations
The most common Sales and Office occupations in Grand Falls Plaza are Sales & Related (3 | 4.2%), and Office & Administration (1 | 1.4%).
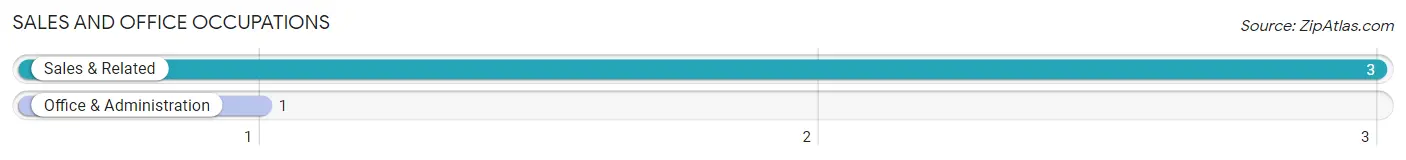
Sales and Office Occupations by Sex
| Occupation | Male | Female |
| Sales & Related | 0 (0.0%) | 3 (100.0%) |
| Office & Administration | 0 (0.0%) | 1 (100.0%) |
| Total (Category) | 0 (0.0%) | 4 (100.0%) |
| Total (Overall) | 24 (33.3%) | 48 (66.7%) |
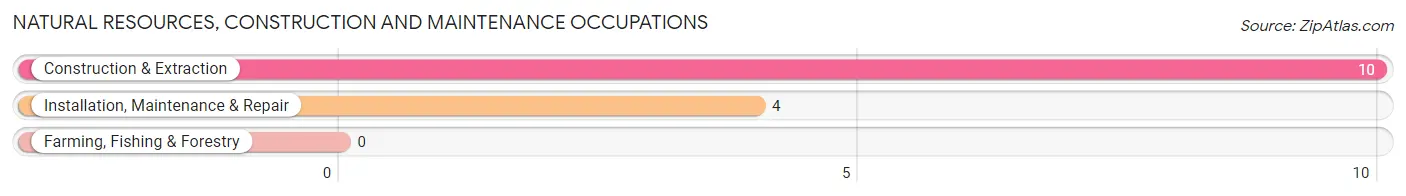
Natural Resources, Construction and Maintenance Occupations
The most common Natural Resources, Construction and Maintenance occupations in Grand Falls Plaza are Construction & Extraction (10 | 13.9%), and Installation, Maintenance & Repair (4 | 5.6%).
Natural Resources, Construction and Maintenance Occupations by Sex
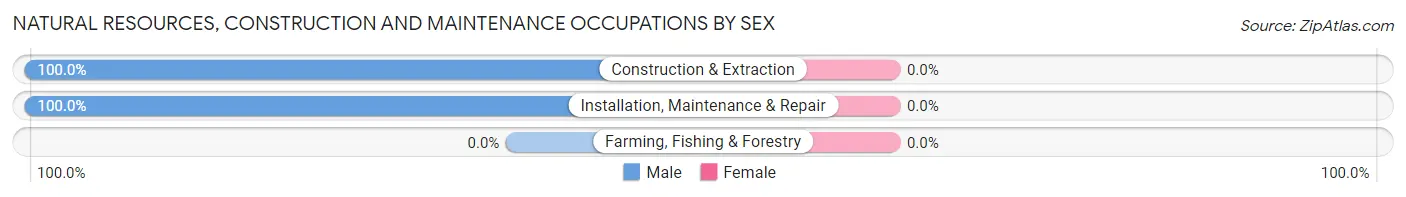
| Occupation | Male | Female |
| Farming, Fishing & Forestry | 0 (0.0%) | 0 (0.0%) |
| Construction & Extraction | 10 (100.0%) | 0 (0.0%) |
| Installation, Maintenance & Repair | 4 (100.0%) | 0 (0.0%) |
| Total (Category) | 14 (100.0%) | 0 (0.0%) |
| Total (Overall) | 24 (33.3%) | 48 (66.7%) |
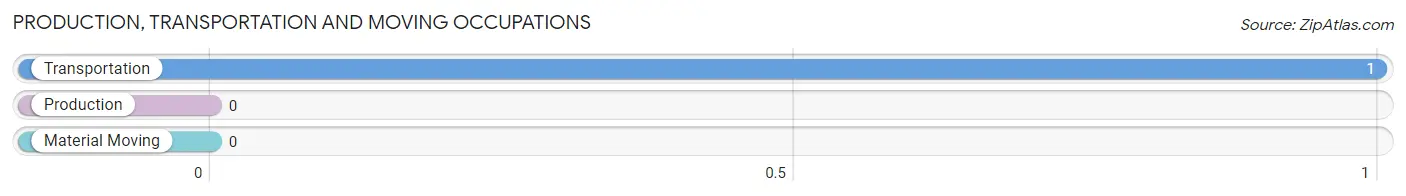
Production, Transportation and Moving Occupations
The most common Production, Transportation and Moving occupations in Grand Falls Plaza are , and Transportation (1 | 1.4%).
Production, Transportation and Moving Occupations by Sex
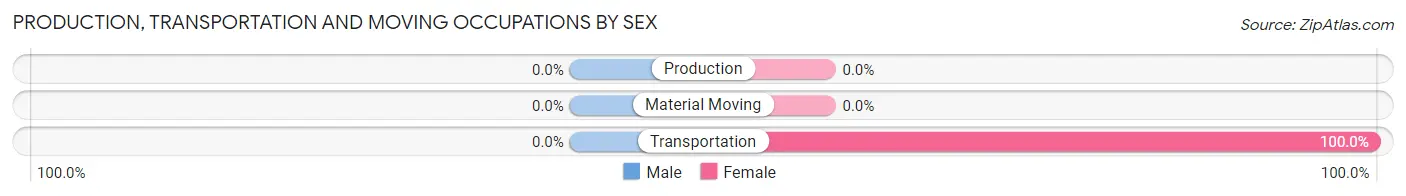
| Occupation | Male | Female |
| Production | 0 (0.0%) | 0 (0.0%) |
| Transportation | 0 (0.0%) | 1 (100.0%) |
| Material Moving | 0 (0.0%) | 0 (0.0%) |
| Total (Category) | 0 (0.0%) | 1 (100.0%) |
| Total (Overall) | 24 (33.3%) | 48 (66.7%) |
Employment Industries by Sex in Grand Falls Plaza
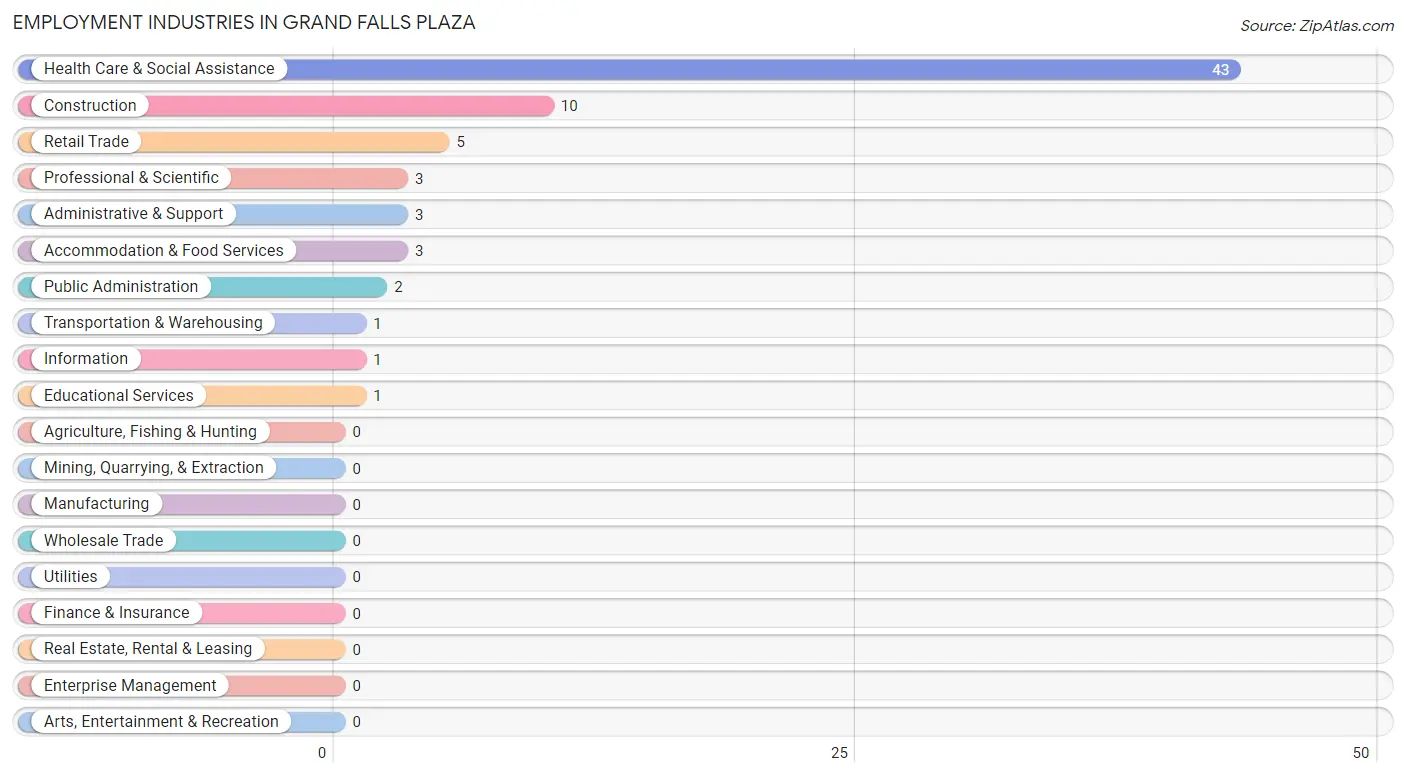
Employment Industries in Grand Falls Plaza
The major employment industries in Grand Falls Plaza include Health Care & Social Assistance (43 | 59.7%), Construction (10 | 13.9%), Retail Trade (5 | 6.9%), Professional & Scientific (3 | 4.2%), and Administrative & Support (3 | 4.2%).
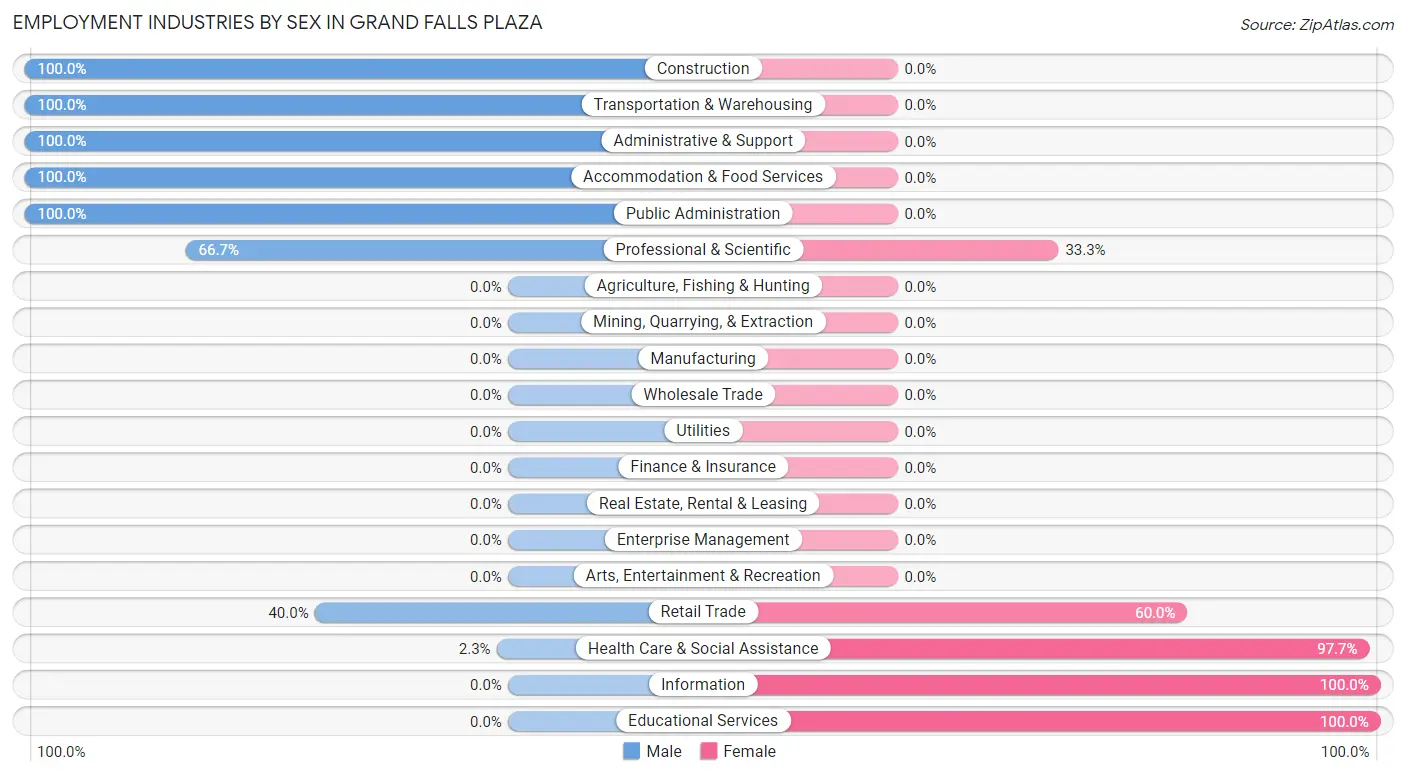
Employment Industries by Sex in Grand Falls Plaza
The Grand Falls Plaza industries that see more men than women are Construction (100.0%), Transportation & Warehousing (100.0%), and Administrative & Support (100.0%), whereas the industries that tend to have a higher number of women are Information (100.0%), Educational Services (100.0%), and Health Care & Social Assistance (97.7%).
| Industry | Male | Female |
| Agriculture, Fishing & Hunting | 0 (0.0%) | 0 (0.0%) |
| Mining, Quarrying, & Extraction | 0 (0.0%) | 0 (0.0%) |
| Construction | 10 (100.0%) | 0 (0.0%) |
| Manufacturing | 0 (0.0%) | 0 (0.0%) |
| Wholesale Trade | 0 (0.0%) | 0 (0.0%) |
| Retail Trade | 2 (40.0%) | 3 (60.0%) |
| Transportation & Warehousing | 1 (100.0%) | 0 (0.0%) |
| Utilities | 0 (0.0%) | 0 (0.0%) |
| Information | 0 (0.0%) | 1 (100.0%) |
| Finance & Insurance | 0 (0.0%) | 0 (0.0%) |
| Real Estate, Rental & Leasing | 0 (0.0%) | 0 (0.0%) |
| Professional & Scientific | 2 (66.7%) | 1 (33.3%) |
| Enterprise Management | 0 (0.0%) | 0 (0.0%) |
| Administrative & Support | 3 (100.0%) | 0 (0.0%) |
| Educational Services | 0 (0.0%) | 1 (100.0%) |
| Health Care & Social Assistance | 1 (2.3%) | 42 (97.7%) |
| Arts, Entertainment & Recreation | 0 (0.0%) | 0 (0.0%) |
| Accommodation & Food Services | 3 (100.0%) | 0 (0.0%) |
| Public Administration | 2 (100.0%) | 0 (0.0%) |
| Total | 24 (33.3%) | 48 (66.7%) |
Education in Grand Falls Plaza
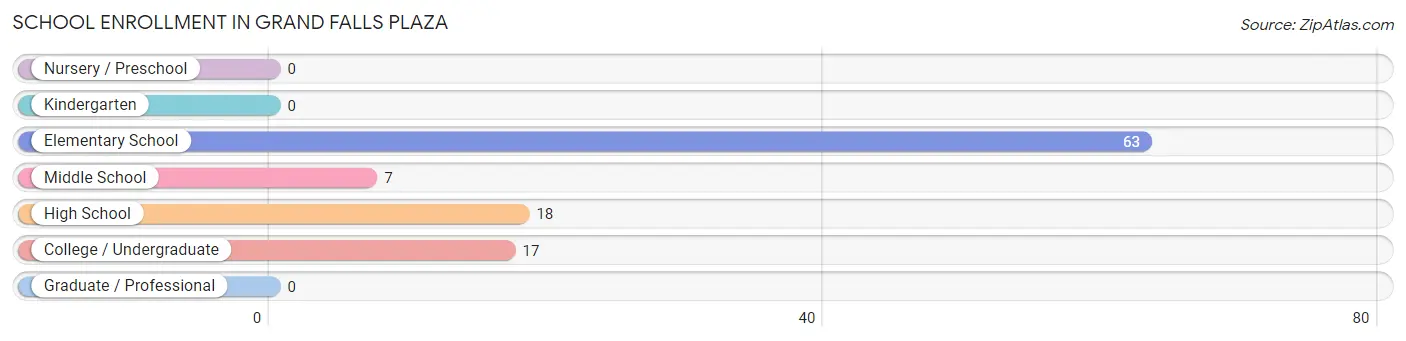
School Enrollment in Grand Falls Plaza
The most common levels of schooling among the 105 students in Grand Falls Plaza are elementary school (63 | 60.0%), high school (18 | 17.1%), and college / undergraduate (17 | 16.2%).
| School Level | # Students | % Students |
| Nursery / Preschool | 0 | 0.0% |
| Kindergarten | 0 | 0.0% |
| Elementary School | 63 | 60.0% |
| Middle School | 7 | 6.7% |
| High School | 18 | 17.1% |
| College / Undergraduate | 17 | 16.2% |
| Graduate / Professional | 0 | 0.0% |
| Total | 105 | 100.0% |
School Enrollment by Age by Funding Source in Grand Falls Plaza
Out of a total of 105 students who are enrolled in schools in Grand Falls Plaza, 9 (8.6%) attend a private institution, while the remaining 96 (91.4%) are enrolled in public schools. The age group of 15 to 17 year olds has the highest likelihood of being enrolled in private schools, with 9 (50.0% in the age bracket) enrolled. Conversely, the age group of 5 to 9 year old has the lowest likelihood of being enrolled in a private school, with 60 (100.0% in the age bracket) attending a public institution.

| Age Bracket | Public School | Private School |
| 3 to 4 Year Olds | 0 (0.0%) | 0 (0.0%) |
| 5 to 9 Year Old | 60 (100.0%) | 0 (0.0%) |
| 10 to 14 Year Olds | 10 (100.0%) | 0 (0.0%) |
| 15 to 17 Year Olds | 9 (50.0%) | 9 (50.0%) |
| 18 to 19 Year Olds | 0 (0.0%) | 0 (0.0%) |
| 20 to 24 Year Olds | 10 (100.0%) | 0 (0.0%) |
| 25 to 34 Year Olds | 0 (0.0%) | 0 (0.0%) |
| 35 Years and over | 7 (100.0%) | 0 (0.0%) |
| Total | 96 (91.4%) | 9 (8.6%) |
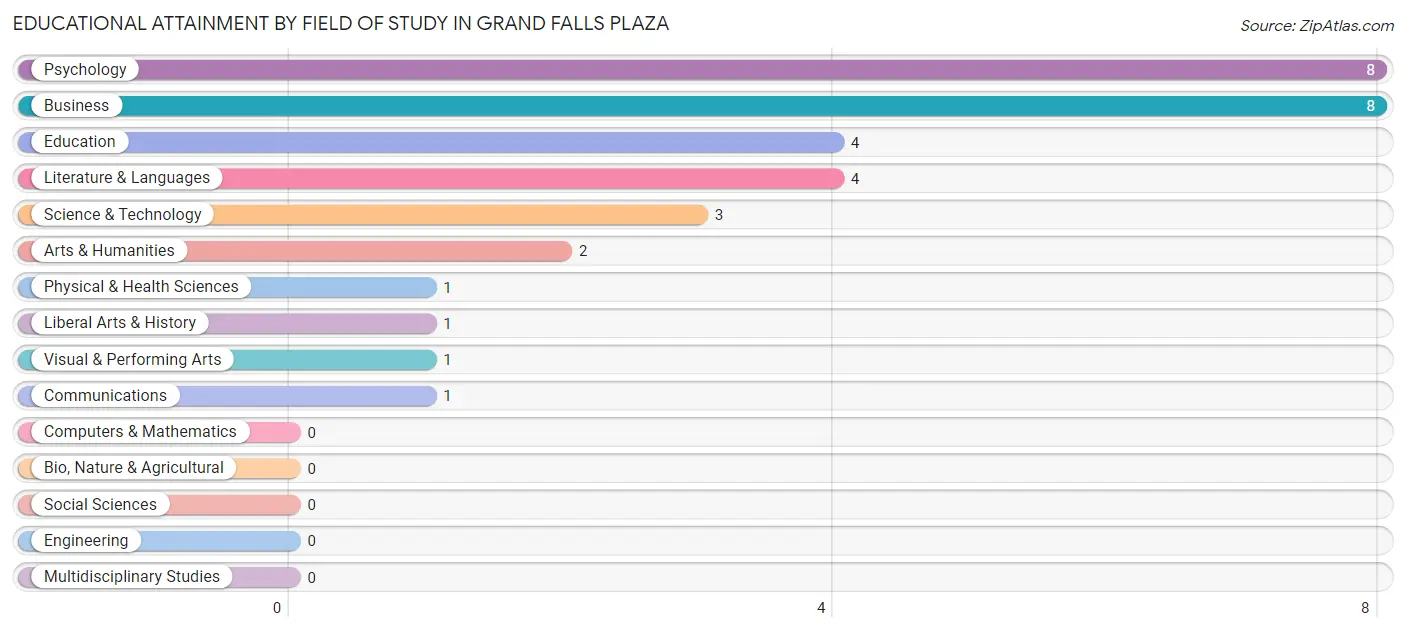
Educational Attainment by Field of Study in Grand Falls Plaza
Psychology (8 | 24.2%), business (8 | 24.2%), education (4 | 12.1%), literature & languages (4 | 12.1%), and science & technology (3 | 9.1%) are the most common fields of study among 33 individuals in Grand Falls Plaza who have obtained a bachelor's degree or higher.
| Field of Study | # Graduates | % Graduates |
| Computers & Mathematics | 0 | 0.0% |
| Bio, Nature & Agricultural | 0 | 0.0% |
| Physical & Health Sciences | 1 | 3.0% |
| Psychology | 8 | 24.2% |
| Social Sciences | 0 | 0.0% |
| Engineering | 0 | 0.0% |
| Multidisciplinary Studies | 0 | 0.0% |
| Science & Technology | 3 | 9.1% |
| Business | 8 | 24.2% |
| Education | 4 | 12.1% |
| Literature & Languages | 4 | 12.1% |
| Liberal Arts & History | 1 | 3.0% |
| Visual & Performing Arts | 1 | 3.0% |
| Communications | 1 | 3.0% |
| Arts & Humanities | 2 | 6.1% |
| Total | 33 | 100.0% |
Transportation & Commute in Grand Falls Plaza
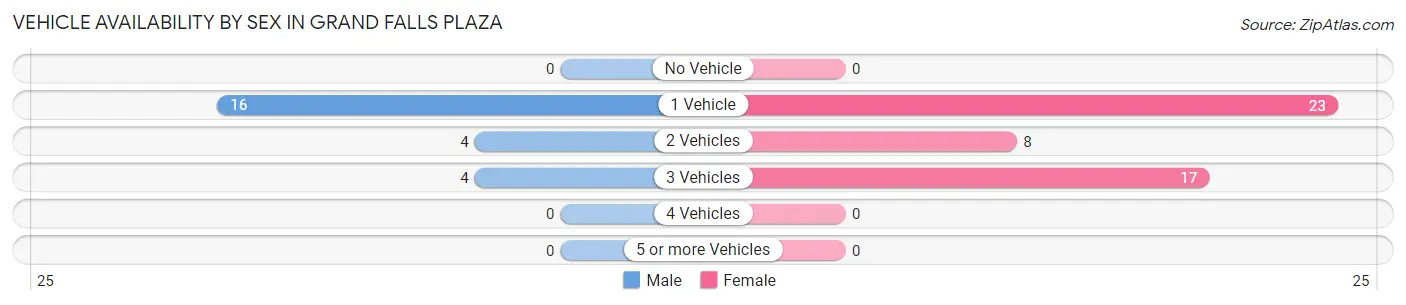
Vehicle Availability by Sex in Grand Falls Plaza
The most prevalent vehicle ownership categories in Grand Falls Plaza are males with 1 vehicle (16, accounting for 66.7%) and females with 1 vehicle (23, making up 33.3%).
| Vehicles Available | Male | Female |
| No Vehicle | 0 (0.0%) | 0 (0.0%) |
| 1 Vehicle | 16 (66.7%) | 23 (47.9%) |
| 2 Vehicles | 4 (16.7%) | 8 (16.7%) |
| 3 Vehicles | 4 (16.7%) | 17 (35.4%) |
| 4 Vehicles | 0 (0.0%) | 0 (0.0%) |
| 5 or more Vehicles | 0 (0.0%) | 0 (0.0%) |
| Total | 24 (100.0%) | 48 (100.0%) |
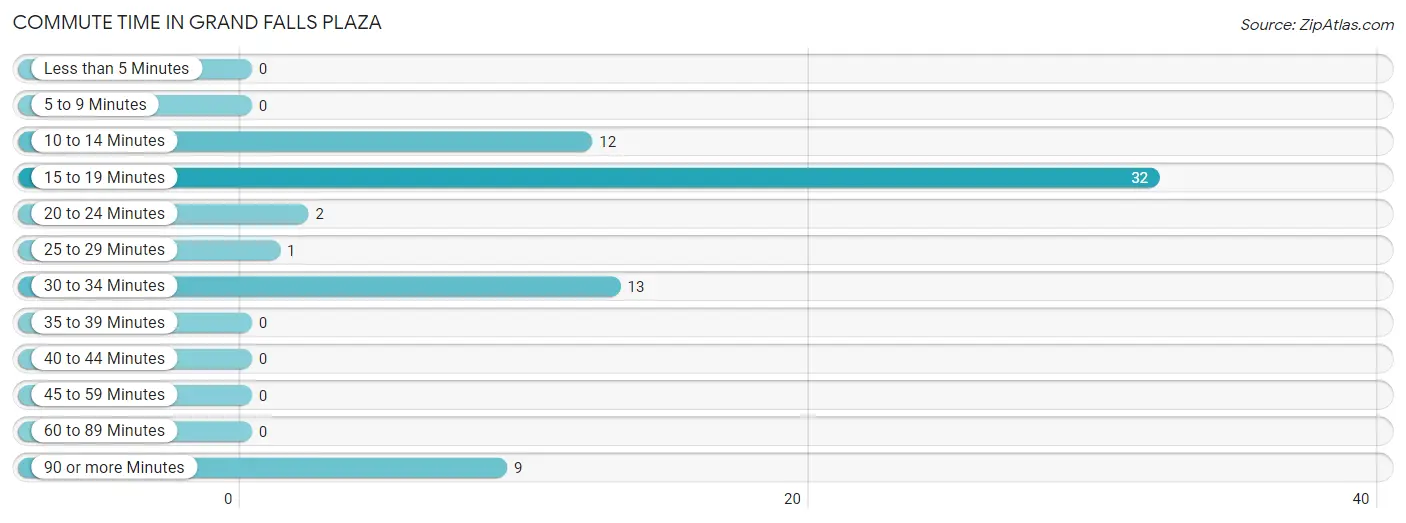
Commute Time in Grand Falls Plaza
The most frequently occuring commute durations in Grand Falls Plaza are 15 to 19 minutes (32 commuters, 46.4%), 30 to 34 minutes (13 commuters, 18.8%), and 10 to 14 minutes (12 commuters, 17.4%).
| Commute Time | # Commuters | % Commuters |
| Less than 5 Minutes | 0 | 0.0% |
| 5 to 9 Minutes | 0 | 0.0% |
| 10 to 14 Minutes | 12 | 17.4% |
| 15 to 19 Minutes | 32 | 46.4% |
| 20 to 24 Minutes | 2 | 2.9% |
| 25 to 29 Minutes | 1 | 1.5% |
| 30 to 34 Minutes | 13 | 18.8% |
| 35 to 39 Minutes | 0 | 0.0% |
| 40 to 44 Minutes | 0 | 0.0% |
| 45 to 59 Minutes | 0 | 0.0% |
| 60 to 89 Minutes | 0 | 0.0% |
| 90 or more Minutes | 9 | 13.0% |
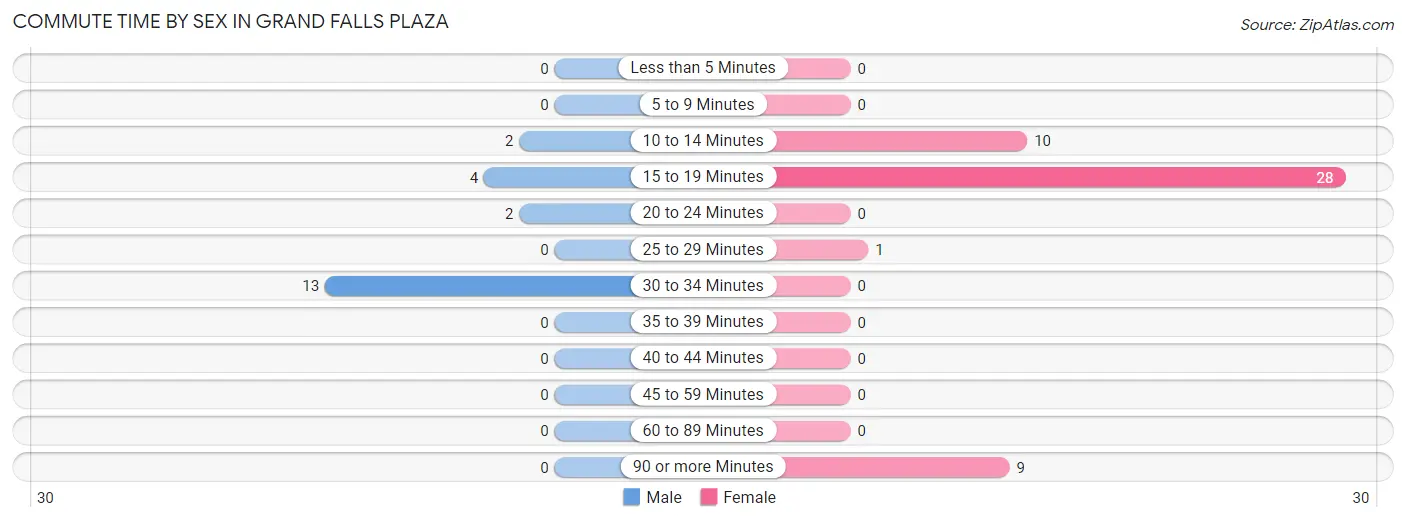
Commute Time by Sex in Grand Falls Plaza
The most common commute times in Grand Falls Plaza are 30 to 34 minutes (13 commuters, 61.9%) for males and 15 to 19 minutes (28 commuters, 58.3%) for females.
| Commute Time | Male | Female |
| Less than 5 Minutes | 0 (0.0%) | 0 (0.0%) |
| 5 to 9 Minutes | 0 (0.0%) | 0 (0.0%) |
| 10 to 14 Minutes | 2 (9.5%) | 10 (20.8%) |
| 15 to 19 Minutes | 4 (19.1%) | 28 (58.3%) |
| 20 to 24 Minutes | 2 (9.5%) | 0 (0.0%) |
| 25 to 29 Minutes | 0 (0.0%) | 1 (2.1%) |
| 30 to 34 Minutes | 13 (61.9%) | 0 (0.0%) |
| 35 to 39 Minutes | 0 (0.0%) | 0 (0.0%) |
| 40 to 44 Minutes | 0 (0.0%) | 0 (0.0%) |
| 45 to 59 Minutes | 0 (0.0%) | 0 (0.0%) |
| 60 to 89 Minutes | 0 (0.0%) | 0 (0.0%) |
| 90 or more Minutes | 0 (0.0%) | 9 (18.8%) |
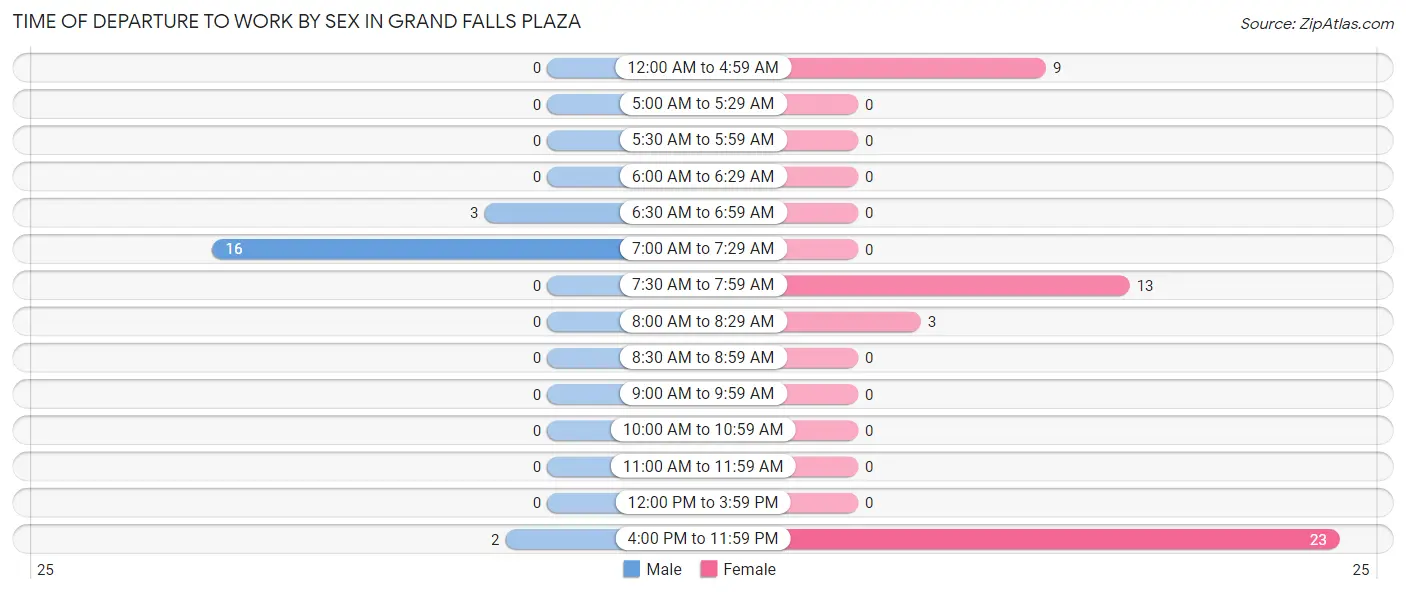
Time of Departure to Work by Sex in Grand Falls Plaza
The most frequent times of departure to work in Grand Falls Plaza are 7:00 AM to 7:29 AM (16, 76.2%) for males and 4:00 PM to 11:59 PM (23, 47.9%) for females.
| Time of Departure | Male | Female |
| 12:00 AM to 4:59 AM | 0 (0.0%) | 9 (18.8%) |
| 5:00 AM to 5:29 AM | 0 (0.0%) | 0 (0.0%) |
| 5:30 AM to 5:59 AM | 0 (0.0%) | 0 (0.0%) |
| 6:00 AM to 6:29 AM | 0 (0.0%) | 0 (0.0%) |
| 6:30 AM to 6:59 AM | 3 (14.3%) | 0 (0.0%) |
| 7:00 AM to 7:29 AM | 16 (76.2%) | 0 (0.0%) |
| 7:30 AM to 7:59 AM | 0 (0.0%) | 13 (27.1%) |
| 8:00 AM to 8:29 AM | 0 (0.0%) | 3 (6.2%) |
| 8:30 AM to 8:59 AM | 0 (0.0%) | 0 (0.0%) |
| 9:00 AM to 9:59 AM | 0 (0.0%) | 0 (0.0%) |
| 10:00 AM to 10:59 AM | 0 (0.0%) | 0 (0.0%) |
| 11:00 AM to 11:59 AM | 0 (0.0%) | 0 (0.0%) |
| 12:00 PM to 3:59 PM | 0 (0.0%) | 0 (0.0%) |
| 4:00 PM to 11:59 PM | 2 (9.5%) | 23 (47.9%) |
| Total | 21 (100.0%) | 48 (100.0%) |
Housing Occupancy in Grand Falls Plaza
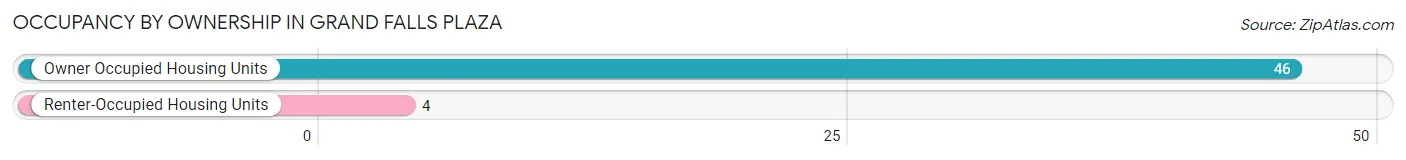
Occupancy by Ownership in Grand Falls Plaza
Of the total 50 dwellings in Grand Falls Plaza, owner-occupied units account for 46 (92.0%), while renter-occupied units make up 4 (8.0%).
| Occupancy | # Housing Units | % Housing Units |
| Owner Occupied Housing Units | 46 | 92.0% |
| Renter-Occupied Housing Units | 4 | 8.0% |
| Total Occupied Housing Units | 50 | 100.0% |
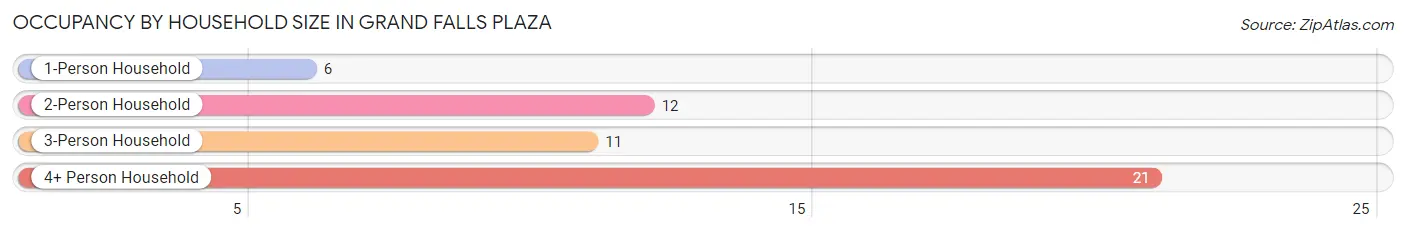
Occupancy by Household Size in Grand Falls Plaza
| Household Size | # Housing Units | % Housing Units |
| 1-Person Household | 6 | 12.0% |
| 2-Person Household | 12 | 24.0% |
| 3-Person Household | 11 | 22.0% |
| 4+ Person Household | 21 | 42.0% |
| Total Housing Units | 50 | 100.0% |
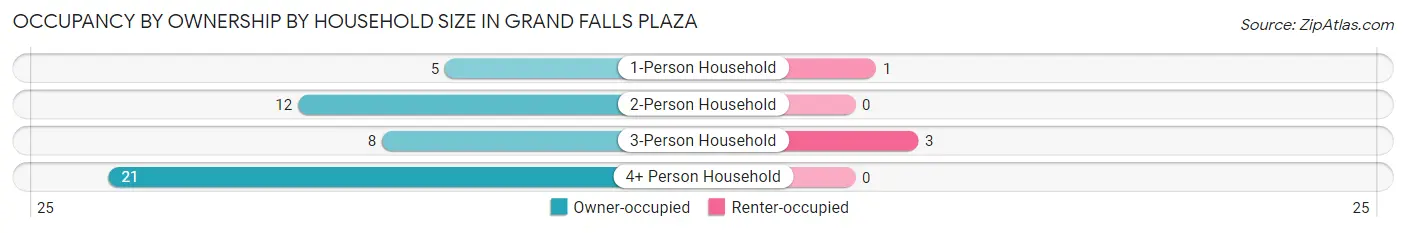
Occupancy by Ownership by Household Size in Grand Falls Plaza
| Household Size | Owner-occupied | Renter-occupied |
| 1-Person Household | 5 (83.3%) | 1 (16.7%) |
| 2-Person Household | 12 (100.0%) | 0 (0.0%) |
| 3-Person Household | 8 (72.7%) | 3 (27.3%) |
| 4+ Person Household | 21 (100.0%) | 0 (0.0%) |
| Total Housing Units | 46 (92.0%) | 4 (8.0%) |
Occupancy by Educational Attainment in Grand Falls Plaza
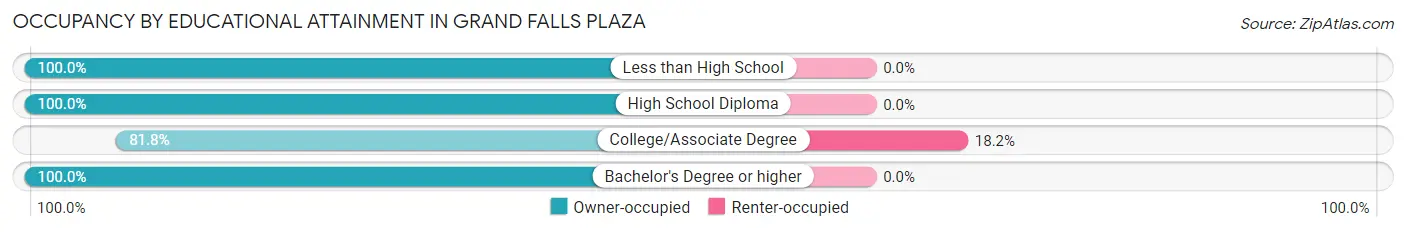
| Household Size | Owner-occupied | Renter-occupied |
| Less than High School | 1 (100.0%) | 0 (0.0%) |
| High School Diploma | 14 (100.0%) | 0 (0.0%) |
| College/Associate Degree | 18 (81.8%) | 4 (18.2%) |
| Bachelor's Degree or higher | 13 (100.0%) | 0 (0.0%) |
Occupancy by Age of Householder in Grand Falls Plaza
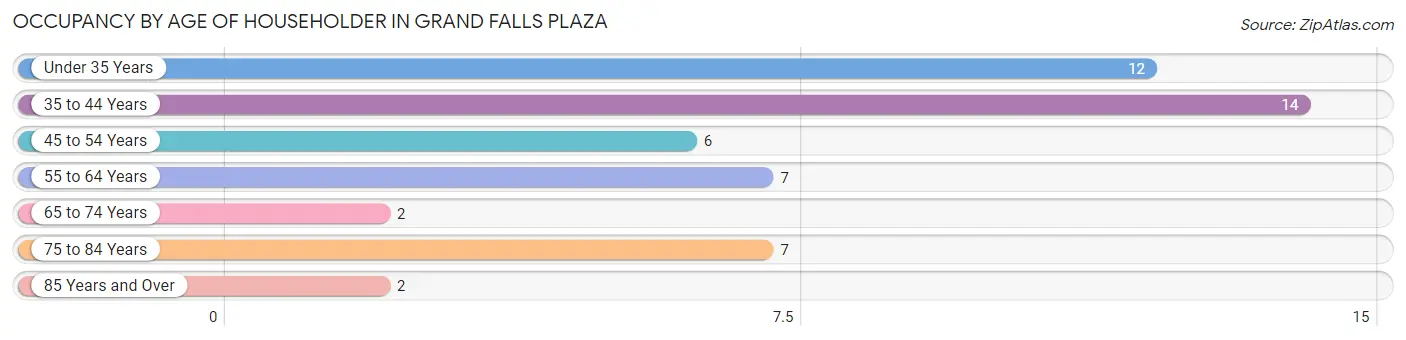
| Age Bracket | # Households | % Households |
| Under 35 Years | 12 | 24.0% |
| 35 to 44 Years | 14 | 28.0% |
| 45 to 54 Years | 6 | 12.0% |
| 55 to 64 Years | 7 | 14.0% |
| 65 to 74 Years | 2 | 4.0% |
| 75 to 84 Years | 7 | 14.0% |
| 85 Years and Over | 2 | 4.0% |
| Total | 50 | 100.0% |
Housing Finances in Grand Falls Plaza
Median Income by Occupancy in Grand Falls Plaza
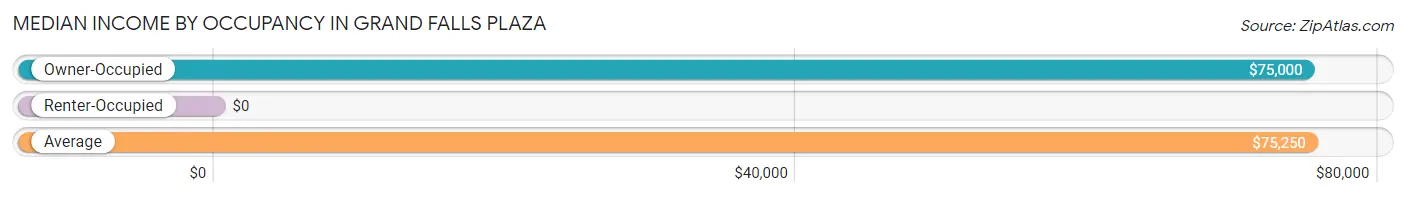
| Occupancy Type | # Households | Median Income |
| Owner-Occupied | 46 (92.0%) | $75,000 |
| Renter-Occupied | 4 (8.0%) | $0 |
| Average | 50 (100.0%) | $75,250 |
Occupancy by Householder Income Bracket in Grand Falls Plaza
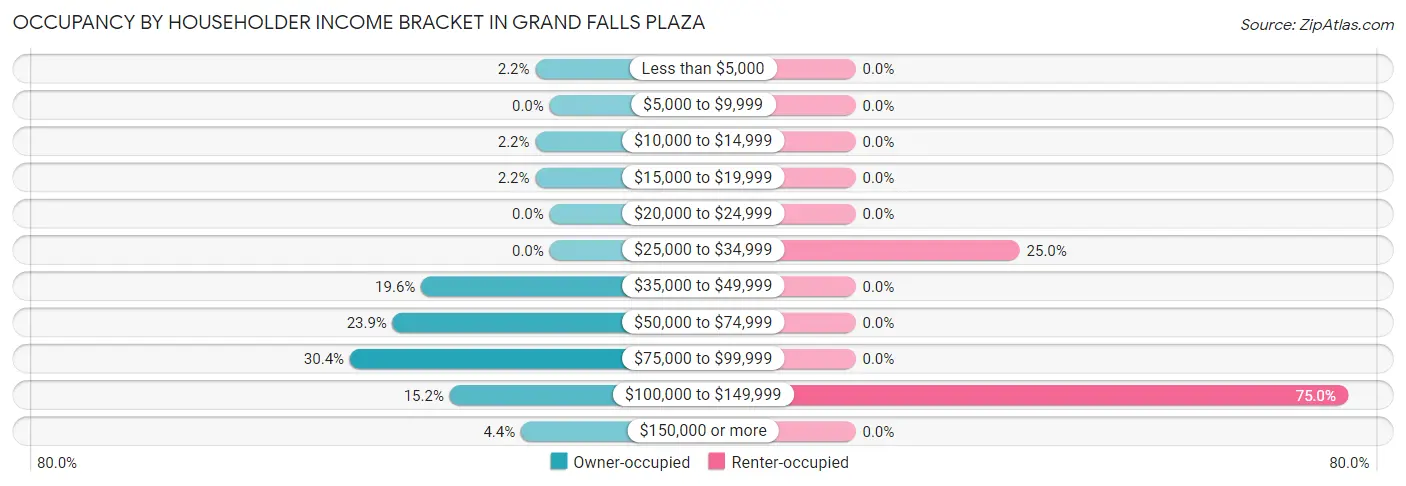
| Income Bracket | Owner-occupied | Renter-occupied |
| Less than $5,000 | 1 (2.2%) | 0 (0.0%) |
| $5,000 to $9,999 | 0 (0.0%) | 0 (0.0%) |
| $10,000 to $14,999 | 1 (2.2%) | 0 (0.0%) |
| $15,000 to $19,999 | 1 (2.2%) | 0 (0.0%) |
| $20,000 to $24,999 | 0 (0.0%) | 0 (0.0%) |
| $25,000 to $34,999 | 0 (0.0%) | 1 (25.0%) |
| $35,000 to $49,999 | 9 (19.6%) | 0 (0.0%) |
| $50,000 to $74,999 | 11 (23.9%) | 0 (0.0%) |
| $75,000 to $99,999 | 14 (30.4%) | 0 (0.0%) |
| $100,000 to $149,999 | 7 (15.2%) | 3 (75.0%) |
| $150,000 or more | 2 (4.3%) | 0 (0.0%) |
| Total | 46 (100.0%) | 4 (100.0%) |
Monthly Housing Cost Tiers in Grand Falls Plaza
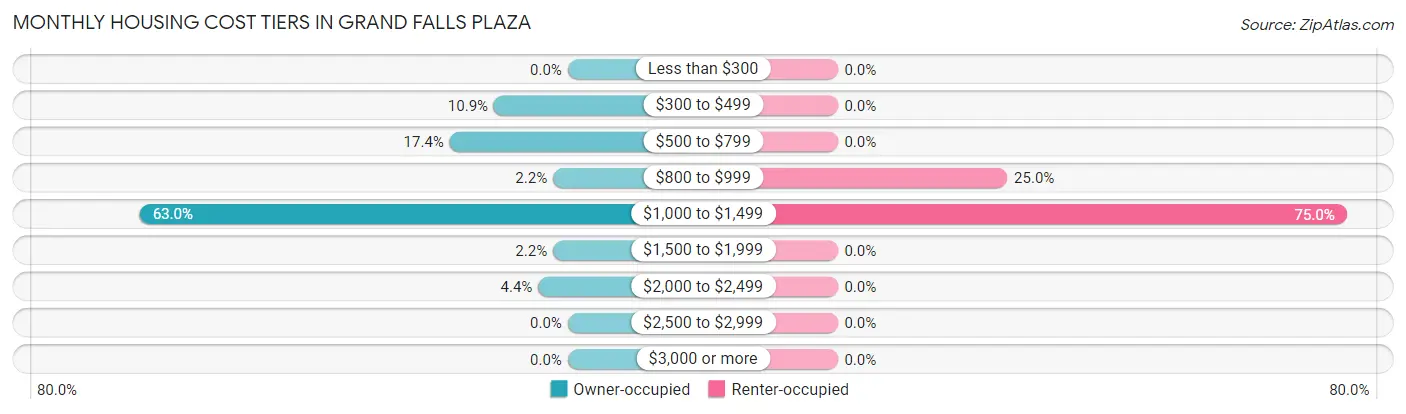
| Monthly Cost | Owner-occupied | Renter-occupied |
| Less than $300 | 0 (0.0%) | 0 (0.0%) |
| $300 to $499 | 5 (10.9%) | 0 (0.0%) |
| $500 to $799 | 8 (17.4%) | 0 (0.0%) |
| $800 to $999 | 1 (2.2%) | 1 (25.0%) |
| $1,000 to $1,499 | 29 (63.0%) | 3 (75.0%) |
| $1,500 to $1,999 | 1 (2.2%) | 0 (0.0%) |
| $2,000 to $2,499 | 2 (4.3%) | 0 (0.0%) |
| $2,500 to $2,999 | 0 (0.0%) | 0 (0.0%) |
| $3,000 or more | 0 (0.0%) | 0 (0.0%) |
| Total | 46 (100.0%) | 4 (100.0%) |
Physical Housing Characteristics in Grand Falls Plaza
Housing Structures in Grand Falls Plaza
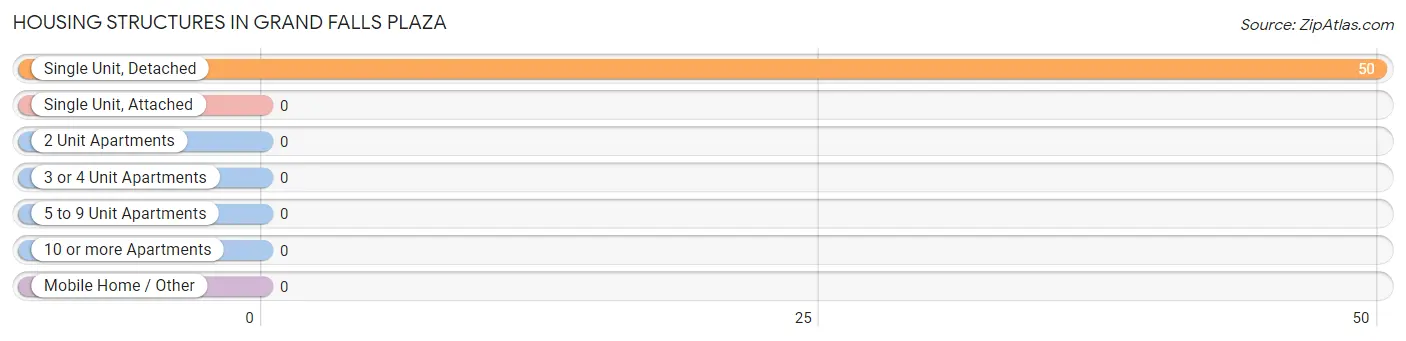
| Structure Type | # Housing Units | % Housing Units |
| Single Unit, Detached | 50 | 100.0% |
| Single Unit, Attached | 0 | 0.0% |
| 2 Unit Apartments | 0 | 0.0% |
| 3 or 4 Unit Apartments | 0 | 0.0% |
| 5 to 9 Unit Apartments | 0 | 0.0% |
| 10 or more Apartments | 0 | 0.0% |
| Mobile Home / Other | 0 | 0.0% |
| Total | 50 | 100.0% |
Housing Structures by Occupancy in Grand Falls Plaza
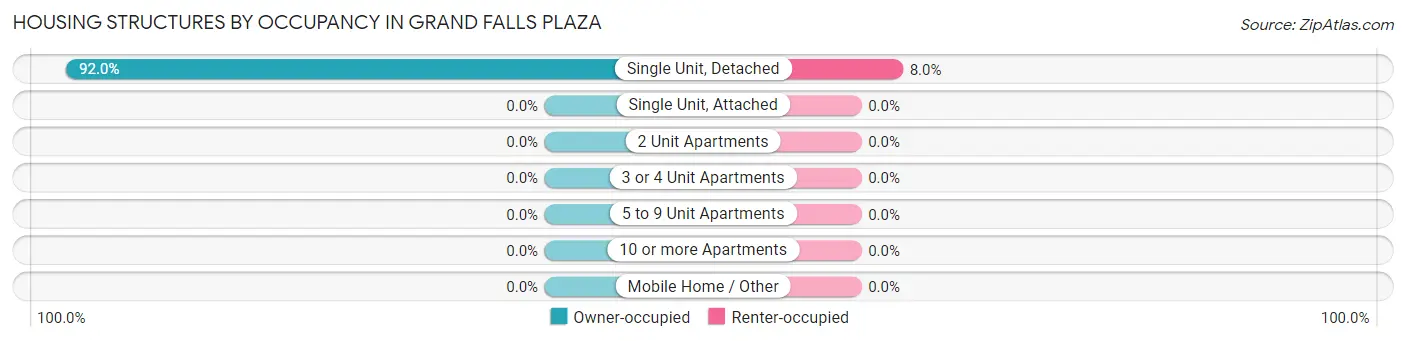
| Structure Type | Owner-occupied | Renter-occupied |
| Single Unit, Detached | 46 (92.0%) | 4 (8.0%) |
| Single Unit, Attached | 0 (0.0%) | 0 (0.0%) |
| 2 Unit Apartments | 0 (0.0%) | 0 (0.0%) |
| 3 or 4 Unit Apartments | 0 (0.0%) | 0 (0.0%) |
| 5 to 9 Unit Apartments | 0 (0.0%) | 0 (0.0%) |
| 10 or more Apartments | 0 (0.0%) | 0 (0.0%) |
| Mobile Home / Other | 0 (0.0%) | 0 (0.0%) |
| Total | 46 (92.0%) | 4 (8.0%) |
Housing Structures by Number of Rooms in Grand Falls Plaza
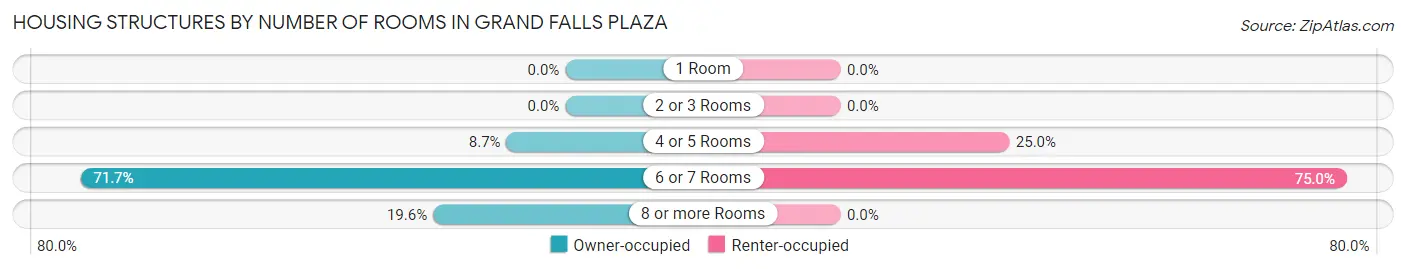
| Number of Rooms | Owner-occupied | Renter-occupied |
| 1 Room | 0 (0.0%) | 0 (0.0%) |
| 2 or 3 Rooms | 0 (0.0%) | 0 (0.0%) |
| 4 or 5 Rooms | 4 (8.7%) | 1 (25.0%) |
| 6 or 7 Rooms | 33 (71.7%) | 3 (75.0%) |
| 8 or more Rooms | 9 (19.6%) | 0 (0.0%) |
| Total | 46 (100.0%) | 4 (100.0%) |
Housing Structure by Heating Type in Grand Falls Plaza
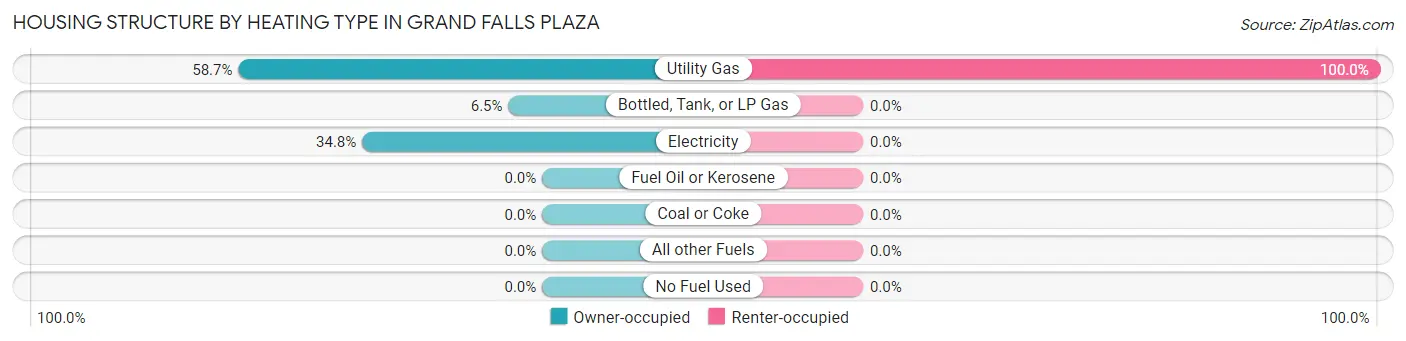
| Heating Type | Owner-occupied | Renter-occupied |
| Utility Gas | 27 (58.7%) | 4 (100.0%) |
| Bottled, Tank, or LP Gas | 3 (6.5%) | 0 (0.0%) |
| Electricity | 16 (34.8%) | 0 (0.0%) |
| Fuel Oil or Kerosene | 0 (0.0%) | 0 (0.0%) |
| Coal or Coke | 0 (0.0%) | 0 (0.0%) |
| All other Fuels | 0 (0.0%) | 0 (0.0%) |
| No Fuel Used | 0 (0.0%) | 0 (0.0%) |
| Total | 46 (100.0%) | 4 (100.0%) |
Household Vehicle Usage in Grand Falls Plaza
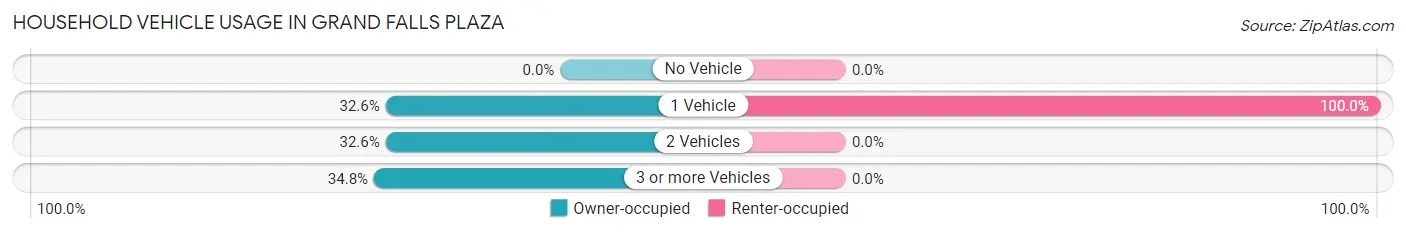
| Vehicles per Household | Owner-occupied | Renter-occupied |
| No Vehicle | 0 (0.0%) | 0 (0.0%) |
| 1 Vehicle | 15 (32.6%) | 4 (100.0%) |
| 2 Vehicles | 15 (32.6%) | 0 (0.0%) |
| 3 or more Vehicles | 16 (34.8%) | 0 (0.0%) |
| Total | 46 (100.0%) | 4 (100.0%) |
Real Estate & Mortgages in Grand Falls Plaza
Real Estate and Mortgage Overview in Grand Falls Plaza
| Characteristic | Without Mortgage | With Mortgage |
| Housing Units | 12 | 34 |
| Median Property Value | $187,500 | $139,600 |
| Median Household Income | $51,250 | $1 |
| Monthly Housing Costs | $520 | $0 |
| Real Estate Taxes | $1,344 | $0 |
Property Value by Mortgage Status in Grand Falls Plaza
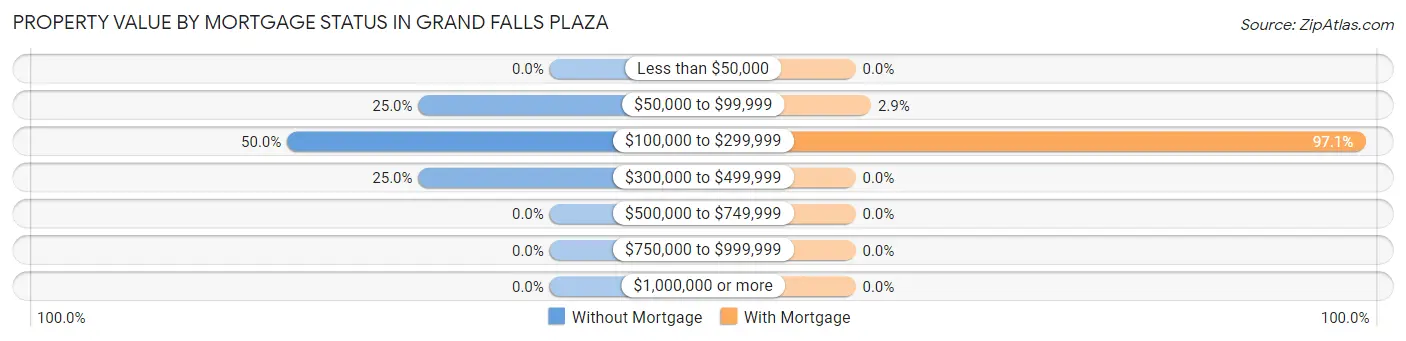
| Property Value | Without Mortgage | With Mortgage |
| Less than $50,000 | 0 (0.0%) | 0 (0.0%) |
| $50,000 to $99,999 | 3 (25.0%) | 1 (2.9%) |
| $100,000 to $299,999 | 6 (50.0%) | 33 (97.1%) |
| $300,000 to $499,999 | 3 (25.0%) | 0 (0.0%) |
| $500,000 to $749,999 | 0 (0.0%) | 0 (0.0%) |
| $750,000 to $999,999 | 0 (0.0%) | 0 (0.0%) |
| $1,000,000 or more | 0 (0.0%) | 0 (0.0%) |
| Total | 12 (100.0%) | 34 (100.0%) |
Household Income by Mortgage Status in Grand Falls Plaza
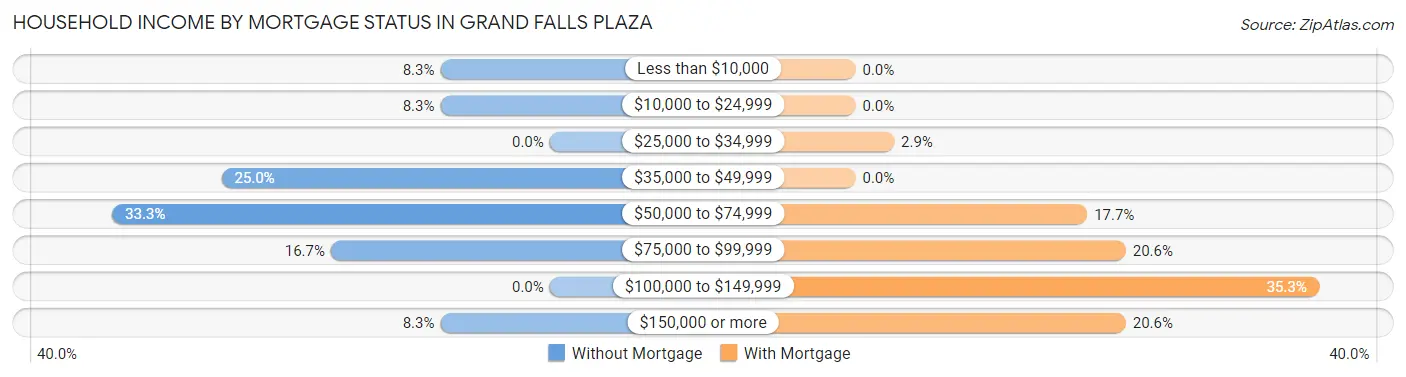
| Household Income | Without Mortgage | With Mortgage |
| Less than $10,000 | 1 (8.3%) | 0 (0.0%) |
| $10,000 to $24,999 | 1 (8.3%) | 0 (0.0%) |
| $25,000 to $34,999 | 0 (0.0%) | 1 (2.9%) |
| $35,000 to $49,999 | 3 (25.0%) | 0 (0.0%) |
| $50,000 to $74,999 | 4 (33.3%) | 6 (17.6%) |
| $75,000 to $99,999 | 2 (16.7%) | 7 (20.6%) |
| $100,000 to $149,999 | 0 (0.0%) | 12 (35.3%) |
| $150,000 or more | 1 (8.3%) | 7 (20.6%) |
| Total | 12 (100.0%) | 34 (100.0%) |
Property Value to Household Income Ratio in Grand Falls Plaza
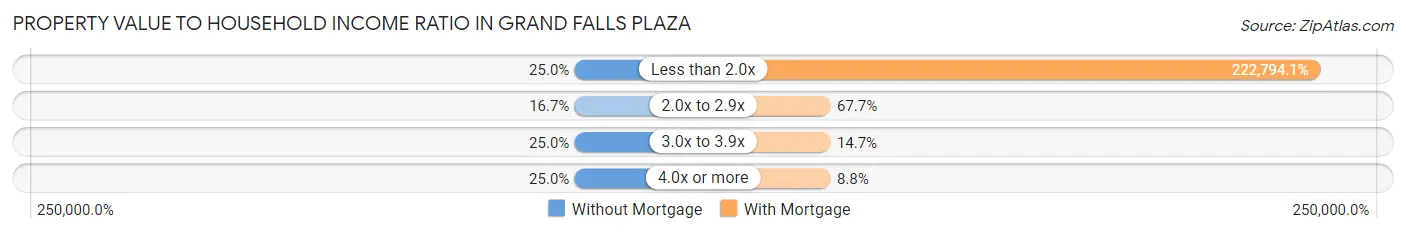
| Value-to-Income Ratio | Without Mortgage | With Mortgage |
| Less than 2.0x | 3 (25.0%) | 75,750 (222,794.1%) |
| 2.0x to 2.9x | 2 (16.7%) | 23 (67.6%) |
| 3.0x to 3.9x | 3 (25.0%) | 5 (14.7%) |
| 4.0x or more | 3 (25.0%) | 3 (8.8%) |
| Total | 12 (100.0%) | 34 (100.0%) |
Real Estate Taxes by Mortgage Status in Grand Falls Plaza
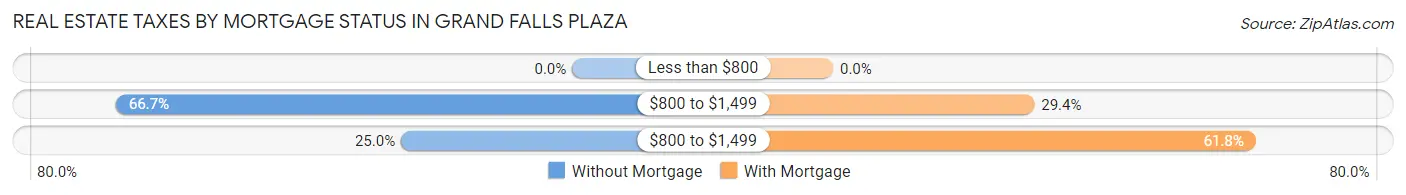
| Property Taxes | Without Mortgage | With Mortgage |
| Less than $800 | 0 (0.0%) | 0 (0.0%) |
| $800 to $1,499 | 8 (66.7%) | 10 (29.4%) |
| $800 to $1,499 | 3 (25.0%) | 21 (61.8%) |
| Total | 12 (100.0%) | 34 (100.0%) |
Health & Disability in Grand Falls Plaza
Health Insurance Coverage by Age in Grand Falls Plaza
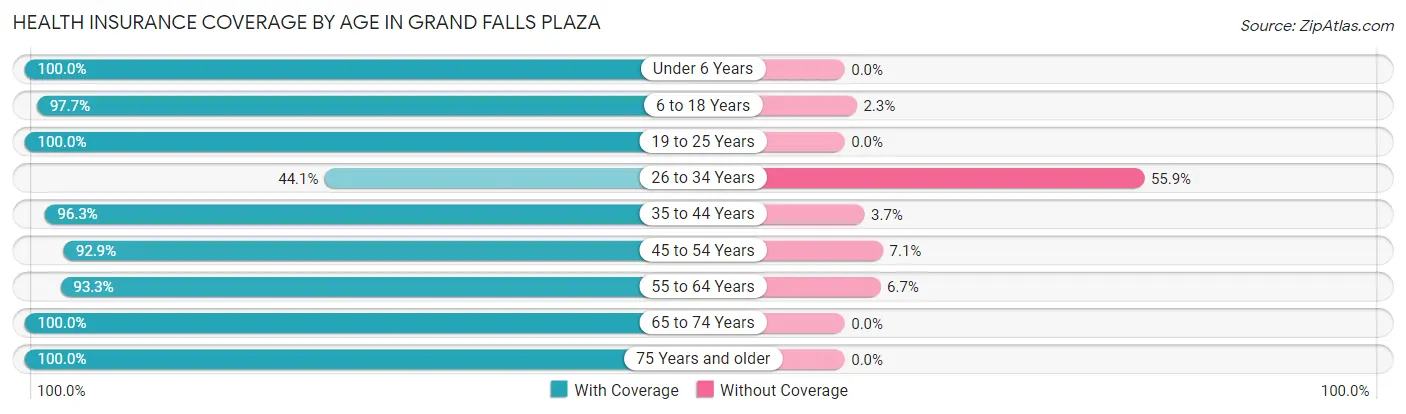
| Age Bracket | With Coverage | Without Coverage |
| Under 6 Years | 2 (100.0%) | 0 (0.0%) |
| 6 to 18 Years | 86 (97.7%) | 2 (2.3%) |
| 19 to 25 Years | 14 (100.0%) | 0 (0.0%) |
| 26 to 34 Years | 15 (44.1%) | 19 (55.9%) |
| 35 to 44 Years | 26 (96.3%) | 1 (3.7%) |
| 45 to 54 Years | 13 (92.9%) | 1 (7.1%) |
| 55 to 64 Years | 14 (93.3%) | 1 (6.7%) |
| 65 to 74 Years | 3 (100.0%) | 0 (0.0%) |
| 75 Years and older | 17 (100.0%) | 0 (0.0%) |
| Total | 190 (88.8%) | 24 (11.2%) |
Health Insurance Coverage by Citizenship Status in Grand Falls Plaza
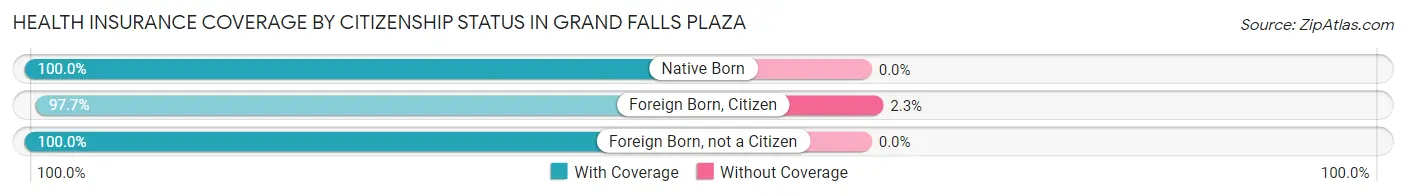
| Citizenship Status | With Coverage | Without Coverage |
| Native Born | 2 (100.0%) | 0 (0.0%) |
| Foreign Born, Citizen | 86 (97.7%) | 2 (2.3%) |
| Foreign Born, not a Citizen | 14 (100.0%) | 0 (0.0%) |
Health Insurance Coverage by Household Income in Grand Falls Plaza
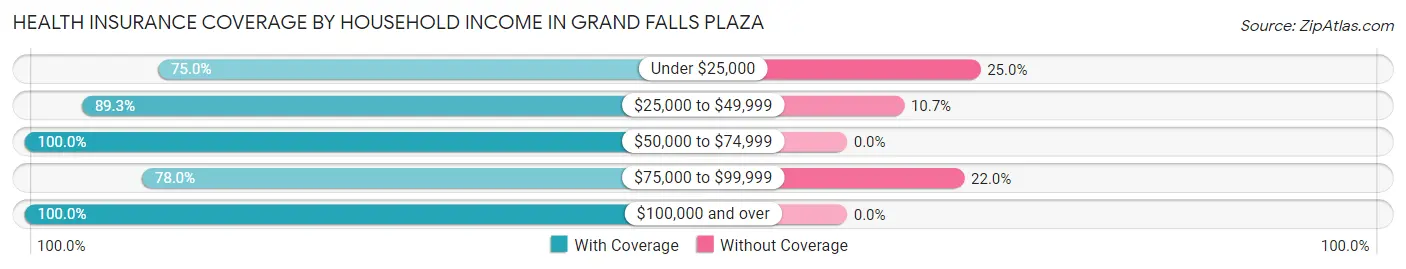
| Household Income | With Coverage | Without Coverage |
| Under $25,000 | 3 (75.0%) | 1 (25.0%) |
| $25,000 to $49,999 | 25 (89.3%) | 3 (10.7%) |
| $50,000 to $74,999 | 48 (100.0%) | 0 (0.0%) |
| $75,000 to $99,999 | 71 (78.0%) | 20 (22.0%) |
| $100,000 and over | 43 (100.0%) | 0 (0.0%) |
Public vs Private Health Insurance Coverage by Age in Grand Falls Plaza
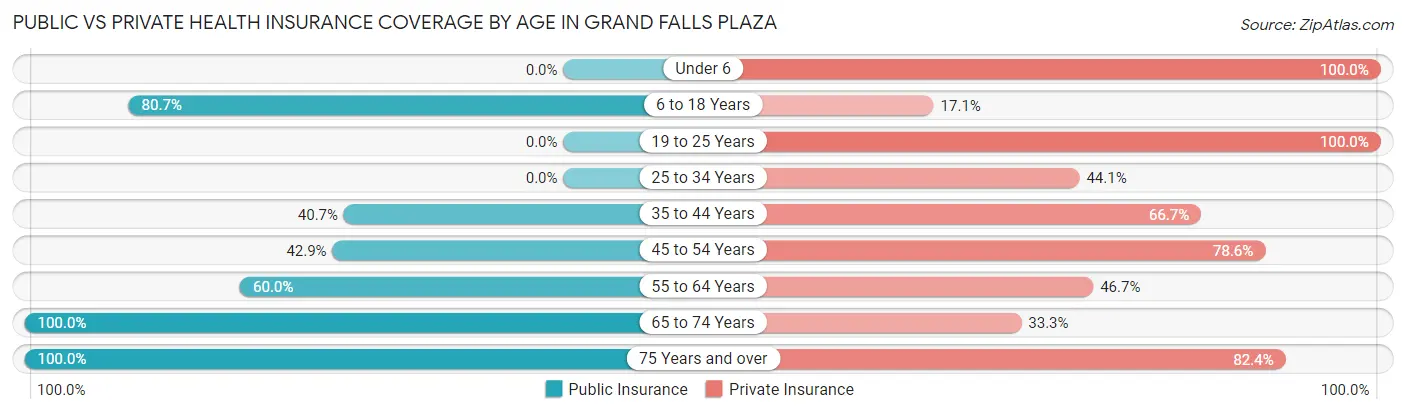
| Age Bracket | Public Insurance | Private Insurance |
| Under 6 | 0 (0.0%) | 2 (100.0%) |
| 6 to 18 Years | 71 (80.7%) | 15 (17.1%) |
| 19 to 25 Years | 0 (0.0%) | 14 (100.0%) |
| 25 to 34 Years | 0 (0.0%) | 15 (44.1%) |
| 35 to 44 Years | 11 (40.7%) | 18 (66.7%) |
| 45 to 54 Years | 6 (42.9%) | 11 (78.6%) |
| 55 to 64 Years | 9 (60.0%) | 7 (46.7%) |
| 65 to 74 Years | 3 (100.0%) | 1 (33.3%) |
| 75 Years and over | 17 (100.0%) | 14 (82.4%) |
| Total | 117 (54.7%) | 97 (45.3%) |
Disability Status by Sex by Age in Grand Falls Plaza
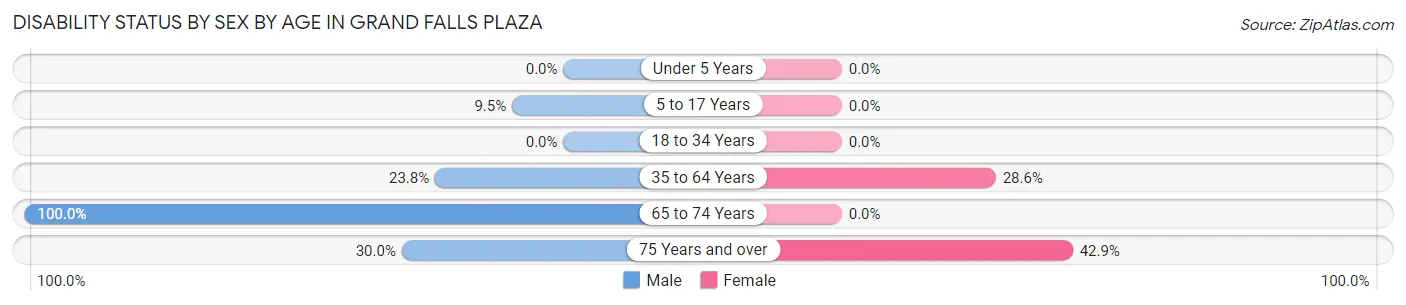
| Age Bracket | Male | Female |
| Under 5 Years | 0 (0.0%) | 0 (0.0%) |
| 5 to 17 Years | 6 (9.5%) | 0 (0.0%) |
| 18 to 34 Years | 0 (0.0%) | 0 (0.0%) |
| 35 to 64 Years | 5 (23.8%) | 10 (28.6%) |
| 65 to 74 Years | 1 (100.0%) | 0 (0.0%) |
| 75 Years and over | 3 (30.0%) | 3 (42.9%) |
Disability Class by Sex by Age in Grand Falls Plaza
Disability Class: Hearing Difficulty
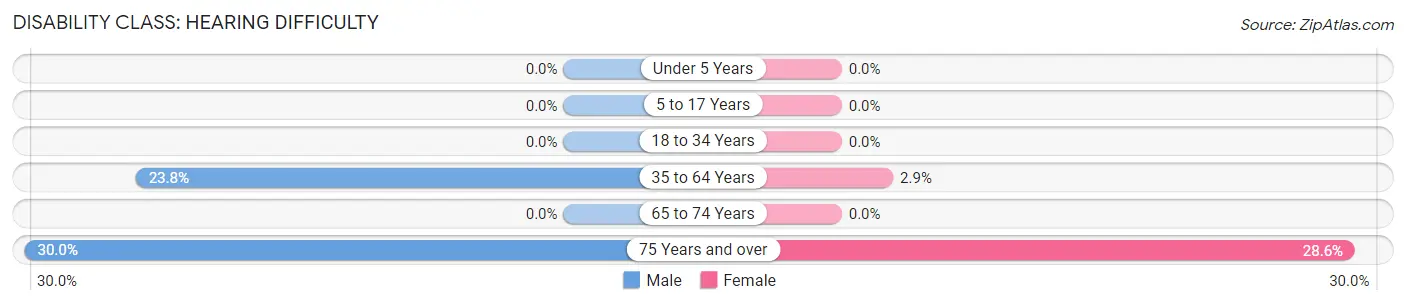
| Age Bracket | Male | Female |
| Under 5 Years | 0 (0.0%) | 0 (0.0%) |
| 5 to 17 Years | 0 (0.0%) | 0 (0.0%) |
| 18 to 34 Years | 0 (0.0%) | 0 (0.0%) |
| 35 to 64 Years | 5 (23.8%) | 1 (2.9%) |
| 65 to 74 Years | 0 (0.0%) | 0 (0.0%) |
| 75 Years and over | 3 (30.0%) | 2 (28.6%) |
Disability Class: Vision Difficulty
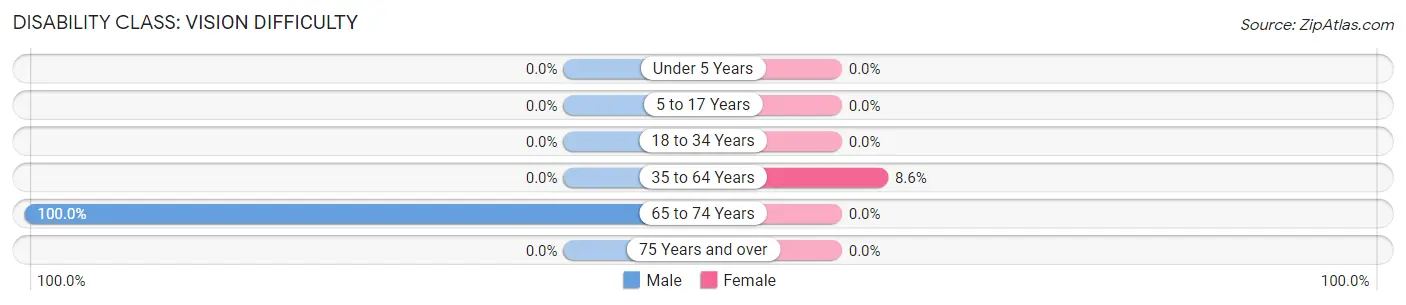
| Age Bracket | Male | Female |
| Under 5 Years | 0 (0.0%) | 0 (0.0%) |
| 5 to 17 Years | 0 (0.0%) | 0 (0.0%) |
| 18 to 34 Years | 0 (0.0%) | 0 (0.0%) |
| 35 to 64 Years | 0 (0.0%) | 3 (8.6%) |
| 65 to 74 Years | 1 (100.0%) | 0 (0.0%) |
| 75 Years and over | 0 (0.0%) | 0 (0.0%) |
Disability Class: Cognitive Difficulty
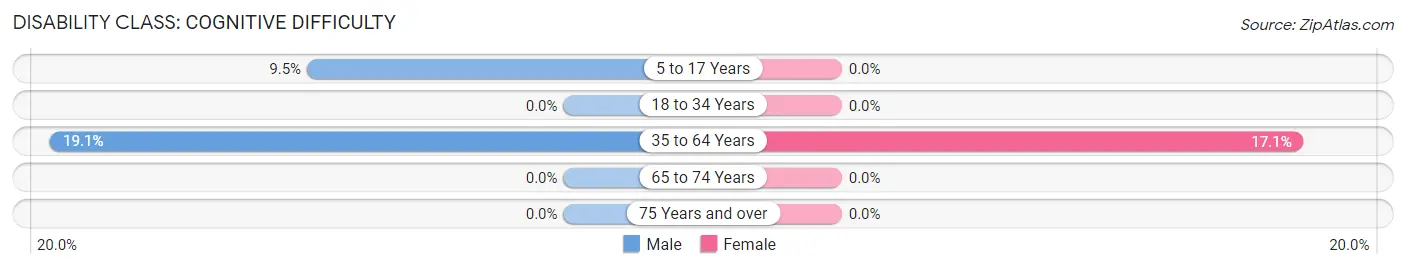
| Age Bracket | Male | Female |
| 5 to 17 Years | 6 (9.5%) | 0 (0.0%) |
| 18 to 34 Years | 0 (0.0%) | 0 (0.0%) |
| 35 to 64 Years | 4 (19.1%) | 6 (17.1%) |
| 65 to 74 Years | 0 (0.0%) | 0 (0.0%) |
| 75 Years and over | 0 (0.0%) | 0 (0.0%) |
Disability Class: Ambulatory Difficulty
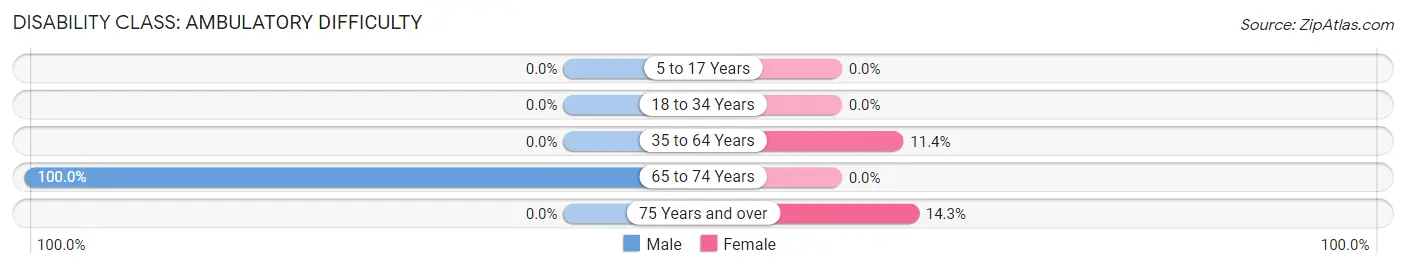
| Age Bracket | Male | Female |
| 5 to 17 Years | 0 (0.0%) | 0 (0.0%) |
| 18 to 34 Years | 0 (0.0%) | 0 (0.0%) |
| 35 to 64 Years | 0 (0.0%) | 4 (11.4%) |
| 65 to 74 Years | 1 (100.0%) | 0 (0.0%) |
| 75 Years and over | 0 (0.0%) | 1 (14.3%) |
Disability Class: Self-Care Difficulty
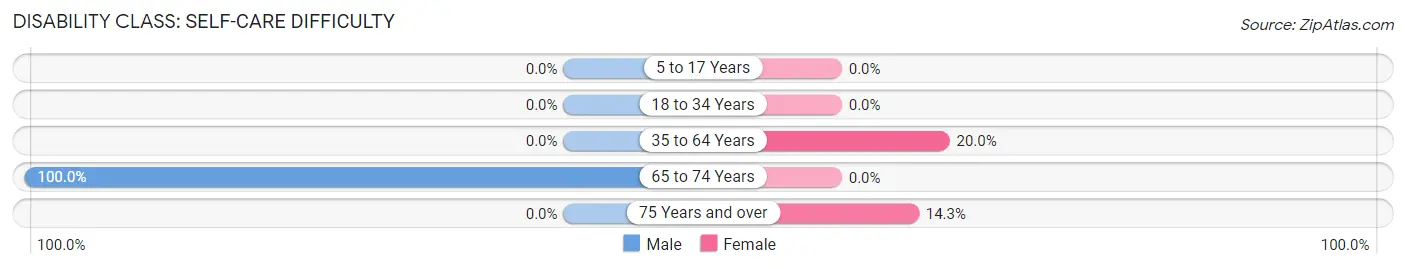
| Age Bracket | Male | Female |
| 5 to 17 Years | 0 (0.0%) | 0 (0.0%) |
| 18 to 34 Years | 0 (0.0%) | 0 (0.0%) |
| 35 to 64 Years | 0 (0.0%) | 7 (20.0%) |
| 65 to 74 Years | 1 (100.0%) | 0 (0.0%) |
| 75 Years and over | 0 (0.0%) | 1 (14.3%) |
Technology Access in Grand Falls Plaza
Computing Device Access in Grand Falls Plaza
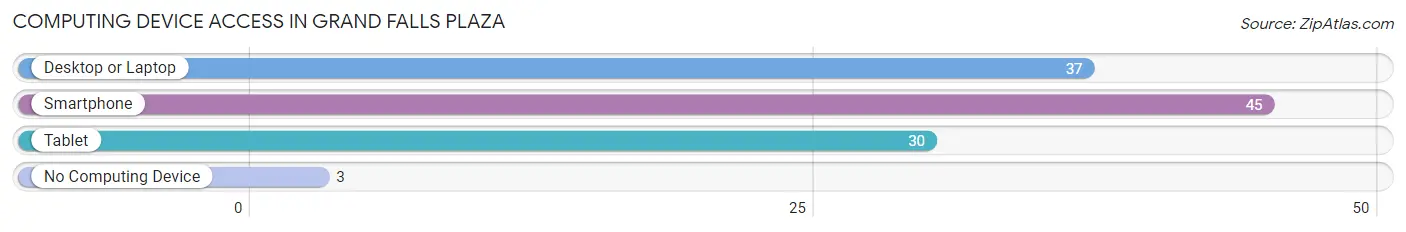
| Device Type | # Households | % Households |
| Desktop or Laptop | 37 | 74.0% |
| Smartphone | 45 | 90.0% |
| Tablet | 30 | 60.0% |
| No Computing Device | 3 | 6.0% |
| Total | 50 | 100.0% |
Internet Access in Grand Falls Plaza
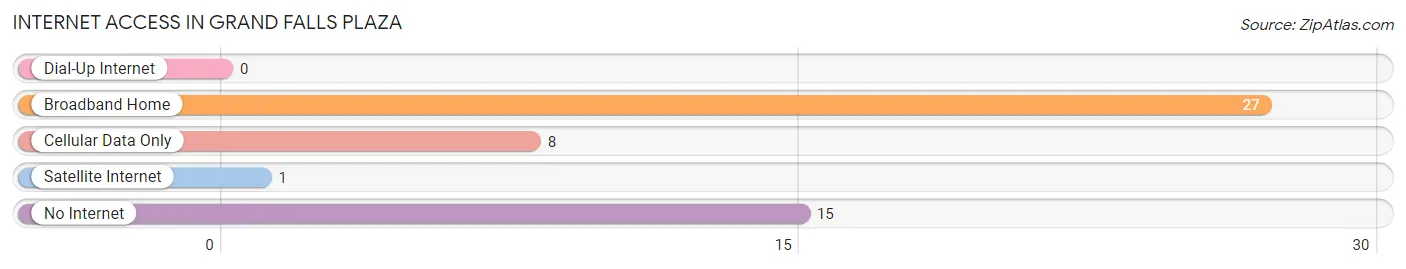
| Internet Type | # Households | % Households |
| Dial-Up Internet | 0 | 0.0% |
| Broadband Home | 27 | 54.0% |
| Cellular Data Only | 8 | 16.0% |
| Satellite Internet | 1 | 2.0% |
| No Internet | 15 | 30.0% |
| Total | 50 | 100.0% |
Grand Falls Plaza Summary
Grand Falls Plaza is a small town located in the state of Missouri, United States. It is situated in the southeastern corner of the state, near the border with Arkansas. The town is located in the Ozark Mountains, and is part of the Ozark Plateau. The town is situated on the banks of the Grand River, and is surrounded by rolling hills and forests.
History
Grand Falls Plaza was founded in 1845 by a group of settlers from the nearby town of Grand Falls. The settlers were looking for a place to settle and build a new town. The town was named after the nearby Grand River, which was known for its spectacular waterfalls. The town quickly grew and became a popular destination for travelers and settlers.
In the late 1800s, the town was a popular stop for steamboats traveling up and down the Grand River. The town was also a popular destination for hunters and fishermen, as the area was known for its abundance of wildlife.
In the early 1900s, the town began to decline as the steamboat industry declined and the population began to move away. The town was nearly abandoned by the 1950s, but in the late 1970s, the town began to experience a resurgence. The town was revitalized by the construction of a new bridge over the Grand River, which allowed for easier access to the town.
Geography
Grand Falls Plaza is located in the southeastern corner of Missouri, near the border with Arkansas. The town is situated in the Ozark Mountains, and is part of the Ozark Plateau. The town is situated on the banks of the Grand River, and is surrounded by rolling hills and forests. The town is located at an elevation of 890 feet above sea level.
The climate in Grand Falls Plaza is humid subtropical, with hot, humid summers and mild winters. The average annual temperature is around 60 degrees Fahrenheit, with an average high of around 80 degrees in the summer and an average low of around 40 degrees in the winter. The town receives an average of around 45 inches of precipitation per year.
Economy
The economy of Grand Falls Plaza is largely based on tourism and agriculture. The town is a popular destination for tourists, who come to enjoy the scenic beauty of the Ozark Mountains and the Grand River. The town is also home to several farms, which produce a variety of crops, including corn, soybeans, wheat, and hay.
The town is also home to several small businesses, including restaurants, shops, and other services. The town is also home to a small manufacturing plant, which produces a variety of products, including furniture and clothing.
Demographics
As of the 2010 census, the population of Grand Falls Plaza was 1,845. The town has a population density of around 1,000 people per square mile. The median age of the population is around 40 years old, and the median household income is around $35,000. The town is predominantly white, with around 95% of the population being white. The town also has a small Hispanic population, with around 5% of the population being Hispanic.
Common Questions
What is Per Capita Income in Grand Falls Plaza?
Per Capita income in Grand Falls Plaza is $20,547.
What is the Median Family Income in Grand Falls Plaza?
Median Family Income in Grand Falls Plaza is $72,679.
What is the Median Household income in Grand Falls Plaza?
Median Household Income in Grand Falls Plaza is $75,250.
What is Income or Wage Gap in Grand Falls Plaza?
Income or Wage Gap in Grand Falls Plaza is 37.9%.
Women in Grand Falls Plaza earn 62.1 cents for every dollar earned by a man.
What is Inequality or Gini Index in Grand Falls Plaza?
Inequality or Gini Index in Grand Falls Plaza is 0.26.
What is the Total Population of Grand Falls Plaza?
Total Population of Grand Falls Plaza is 214.
What is the Total Male Population of Grand Falls Plaza?
Total Male Population of Grand Falls Plaza is 112.
What is the Total Female Population of Grand Falls Plaza?
Total Female Population of Grand Falls Plaza is 102.
What is the Ratio of Males per 100 Females in Grand Falls Plaza?
There are 109.80 Males per 100 Females in Grand Falls Plaza.
What is the Ratio of Females per 100 Males in Grand Falls Plaza?
There are 91.07 Females per 100 Males in Grand Falls Plaza.
What is the Median Population Age in Grand Falls Plaza?
Median Population Age in Grand Falls Plaza is 27.0 Years.
What is the Average Family Size in Grand Falls Plaza
Average Family Size in Grand Falls Plaza is 4.3 People.
What is the Average Household Size in Grand Falls Plaza
Average Household Size in Grand Falls Plaza is 4.3 People.
How Large is the Labor Force in Grand Falls Plaza?
There are 89 People in the Labor Forcein in Grand Falls Plaza.
What is the Percentage of People in the Labor Force in Grand Falls Plaza?
66.9% of People are in the Labor Force in Grand Falls Plaza.
What is the Unemployment Rate in Grand Falls Plaza?
Unemployment Rate in Grand Falls Plaza is 19.1%.