Jane, MO Map & Demographics
Jane Map
Jane Overview
$21,684
PER CAPITA INCOME
$65,750
AVG FAMILY INCOME
$57,143
AVG HOUSEHOLD INCOME
10.2%
WAGE / INCOME GAP [ % ]
89.8¢/ $1
WAGE / INCOME GAP [ $ ]
0.36
INEQUALITY / GINI INDEX
535
TOTAL POPULATION
258
MALE POPULATION
277
FEMALE POPULATION
93.14
MALES / 100 FEMALES
107.36
FEMALES / 100 MALES
29.6
MEDIAN AGE
4.1
AVG FAMILY SIZE
3.4
AVG HOUSEHOLD SIZE
260
LABOR FORCE [ PEOPLE ]
67.4%
PERCENT IN LABOR FORCE
6.2%
UNEMPLOYMENT RATE
Jane Area Codes
Income in Jane
Income Overview in Jane
Per Capita Income in Jane is $21,684, while median incomes of families and households are $65,750 and $57,143 respectively.
| Characteristic | Number | Measure |
| Per Capita Income | 535 | $21,684 |
| Median Family Income | 113 | $65,750 |
| Mean Family Income | 113 | $76,502 |
| Median Household Income | 158 | $57,143 |
| Mean Household Income | 158 | $66,533 |
| Income Deficit | 113 | $0 |
| Wage / Income Gap (%) | 535 | 10.16% |
| Wage / Income Gap ($) | 535 | 89.84¢ per $1 |
| Gini / Inequality Index | 535 | 0.36 |
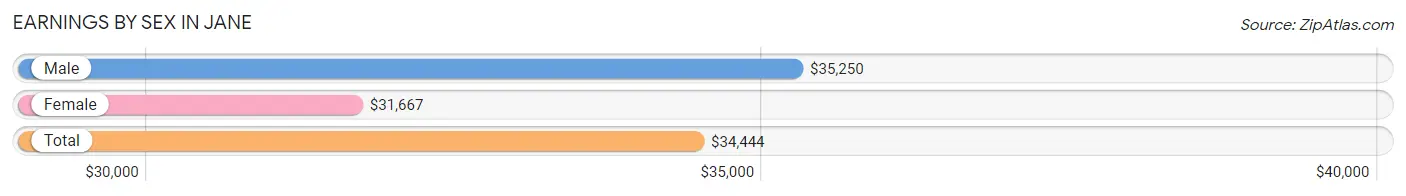
Earnings by Sex in Jane
Average Earnings in Jane are $34,444, $35,250 for men and $31,667 for women, a difference of 10.2%.
| Sex | Number | Average Earnings |
| Male | 142 (53.8%) | $35,250 |
| Female | 122 (46.2%) | $31,667 |
| Total | 264 (100.0%) | $34,444 |
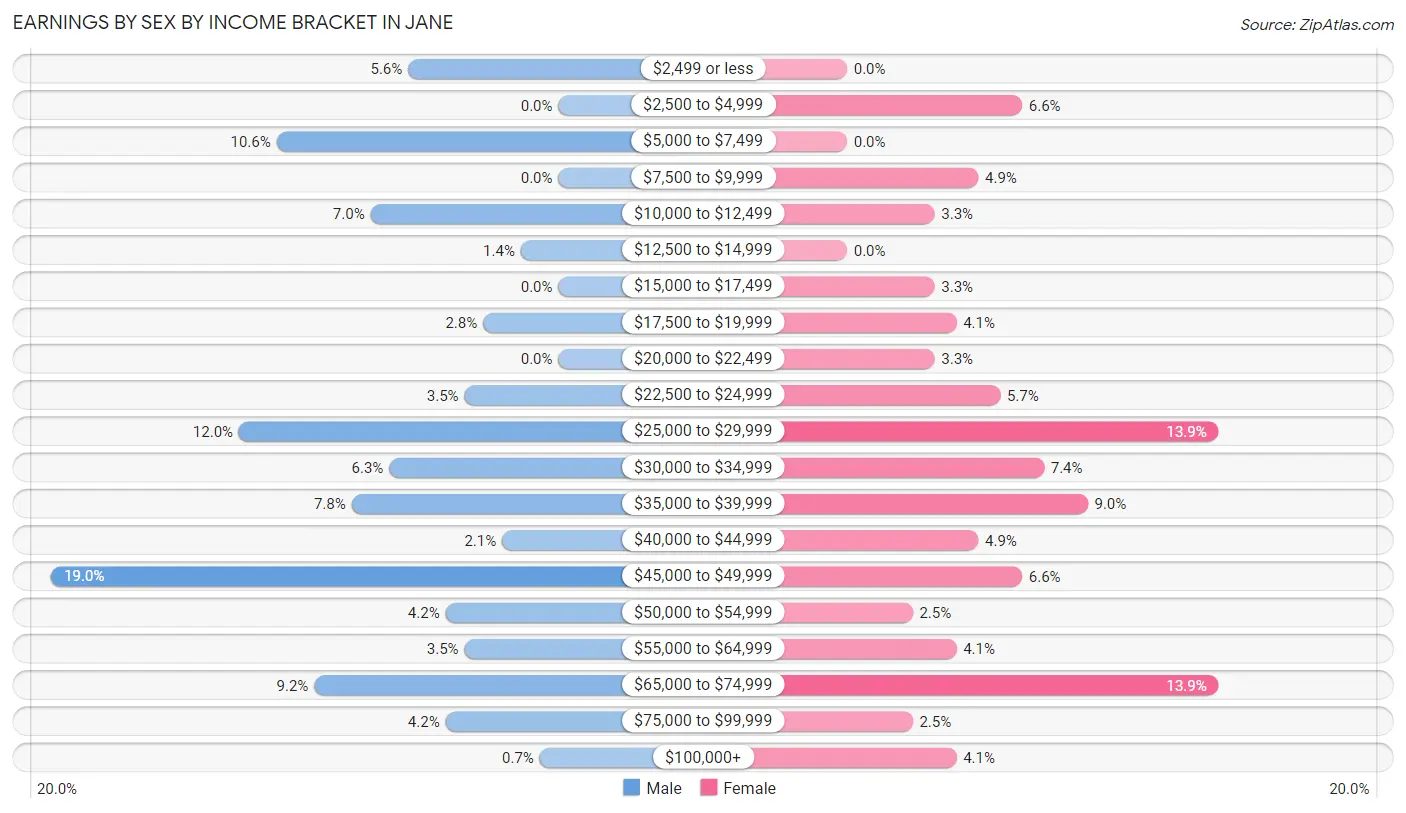
Earnings by Sex by Income Bracket in Jane
The most common earnings brackets in Jane are $45,000 to $49,999 for men (27 | 19.0%) and $25,000 to $29,999 for women (17 | 13.9%).
| Income | Male | Female |
| $2,499 or less | 8 (5.6%) | 0 (0.0%) |
| $2,500 to $4,999 | 0 (0.0%) | 8 (6.6%) |
| $5,000 to $7,499 | 15 (10.6%) | 0 (0.0%) |
| $7,500 to $9,999 | 0 (0.0%) | 6 (4.9%) |
| $10,000 to $12,499 | 10 (7.0%) | 4 (3.3%) |
| $12,500 to $14,999 | 2 (1.4%) | 0 (0.0%) |
| $15,000 to $17,499 | 0 (0.0%) | 4 (3.3%) |
| $17,500 to $19,999 | 4 (2.8%) | 5 (4.1%) |
| $20,000 to $22,499 | 0 (0.0%) | 4 (3.3%) |
| $22,500 to $24,999 | 5 (3.5%) | 7 (5.7%) |
| $25,000 to $29,999 | 17 (12.0%) | 17 (13.9%) |
| $30,000 to $34,999 | 9 (6.3%) | 9 (7.4%) |
| $35,000 to $39,999 | 11 (7.7%) | 11 (9.0%) |
| $40,000 to $44,999 | 3 (2.1%) | 6 (4.9%) |
| $45,000 to $49,999 | 27 (19.0%) | 8 (6.6%) |
| $50,000 to $54,999 | 6 (4.2%) | 3 (2.5%) |
| $55,000 to $64,999 | 5 (3.5%) | 5 (4.1%) |
| $65,000 to $74,999 | 13 (9.1%) | 17 (13.9%) |
| $75,000 to $99,999 | 6 (4.2%) | 3 (2.5%) |
| $100,000+ | 1 (0.7%) | 5 (4.1%) |
| Total | 142 (100.0%) | 122 (100.0%) |
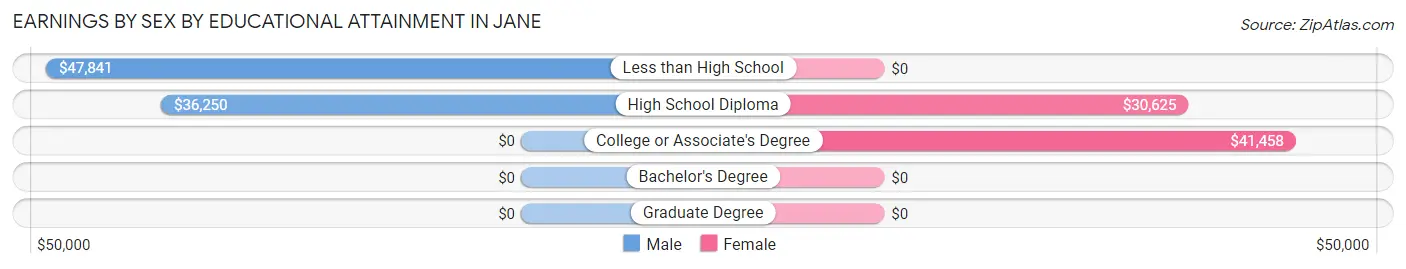
Earnings by Sex by Educational Attainment in Jane
Average earnings in Jane are $43,750 for men and $33,750 for women, a difference of 22.9%. Men with an educational attainment of less than high school enjoy the highest average annual earnings of $47,841, while those with high school diploma education earn the least with $36,250. Women with an educational attainment of college or associate's degree earn the most with the average annual earnings of $41,458, while those with high school diploma education have the smallest earnings of $30,625.
| Educational Attainment | Male Income | Female Income |
| Less than High School | $47,841 | $0 |
| High School Diploma | $36,250 | $30,625 |
| College or Associate's Degree | - | - |
| Bachelor's Degree | - | - |
| Graduate Degree | - | - |
| Total | $43,750 | $33,750 |
Family Income in Jane
Family Income Brackets in Jane
According to the Jane family income data, there are 44 families falling into the $50,000 to $74,999 income range, which is the most common income bracket and makes up 38.9% of all families.
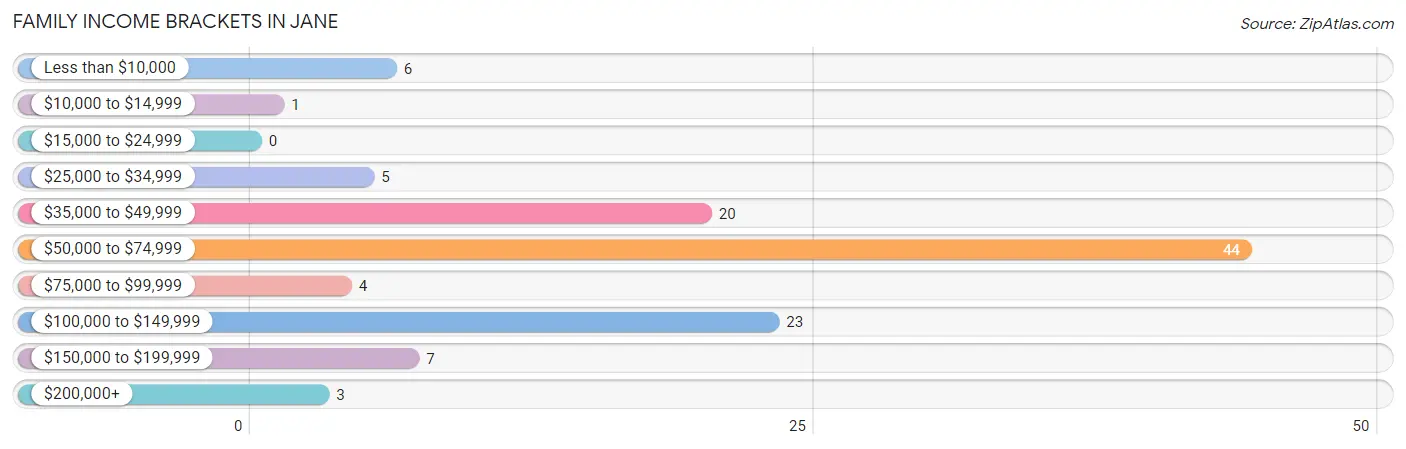
| Income Bracket | # Families | % Families |
| Less than $10,000 | 6 | 5.3% |
| $10,000 to $14,999 | 1 | 0.9% |
| $15,000 to $24,999 | 0 | 0.0% |
| $25,000 to $34,999 | 5 | 4.4% |
| $35,000 to $49,999 | 20 | 17.7% |
| $50,000 to $74,999 | 44 | 38.9% |
| $75,000 to $99,999 | 4 | 3.5% |
| $100,000 to $149,999 | 23 | 20.4% |
| $150,000 to $199,999 | 7 | 6.2% |
| $200,000+ | 3 | 2.7% |
Family Income by Famaliy Size in Jane
7+ person families (8 | 7.1%) account for the highest median family income in Jane with $137,500 per family, while 2-person families (46 | 40.7%) have the highest median income of $27,750 per family member.
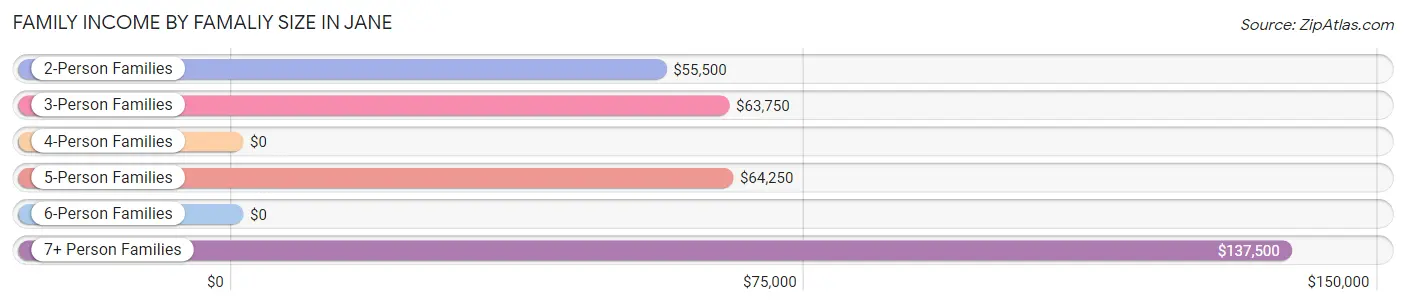
| Income Bracket | # Families | Median Income |
| 2-Person Families | 46 (40.7%) | $55,500 |
| 3-Person Families | 26 (23.0%) | $63,750 |
| 4-Person Families | 12 (10.6%) | $0 |
| 5-Person Families | 7 (6.2%) | $64,250 |
| 6-Person Families | 14 (12.4%) | $0 |
| 7+ Person Families | 8 (7.1%) | $137,500 |
| Total | 113 (100.0%) | $65,750 |
Family Income by Number of Earners in Jane
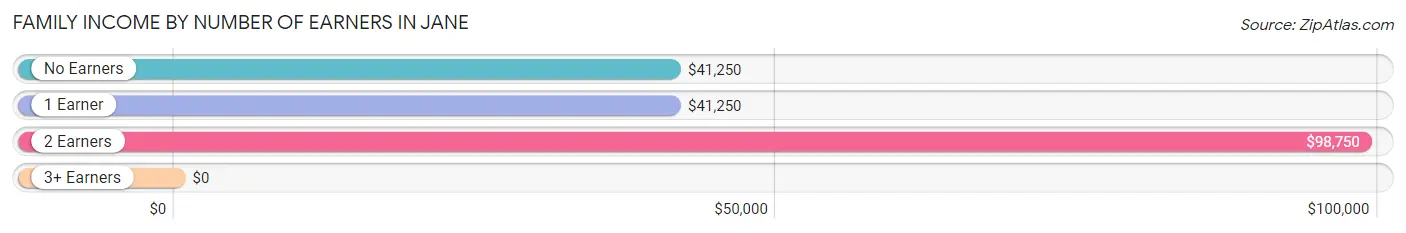
| Number of Earners | # Families | Median Income |
| No Earners | 13 (11.5%) | $41,250 |
| 1 Earner | 34 (30.1%) | $41,250 |
| 2 Earners | 59 (52.2%) | $98,750 |
| 3+ Earners | 7 (6.2%) | $0 |
| Total | 113 (100.0%) | $65,750 |
Household Income in Jane
Household Income Brackets in Jane
With 52 households falling in the category, the $50,000 to $74,999 income range is the most frequent in Jane, accounting for 32.9% of all households. In contrast, only 3 households (1.9%) fall into the $200,000+ income bracket, making it the least populous group.
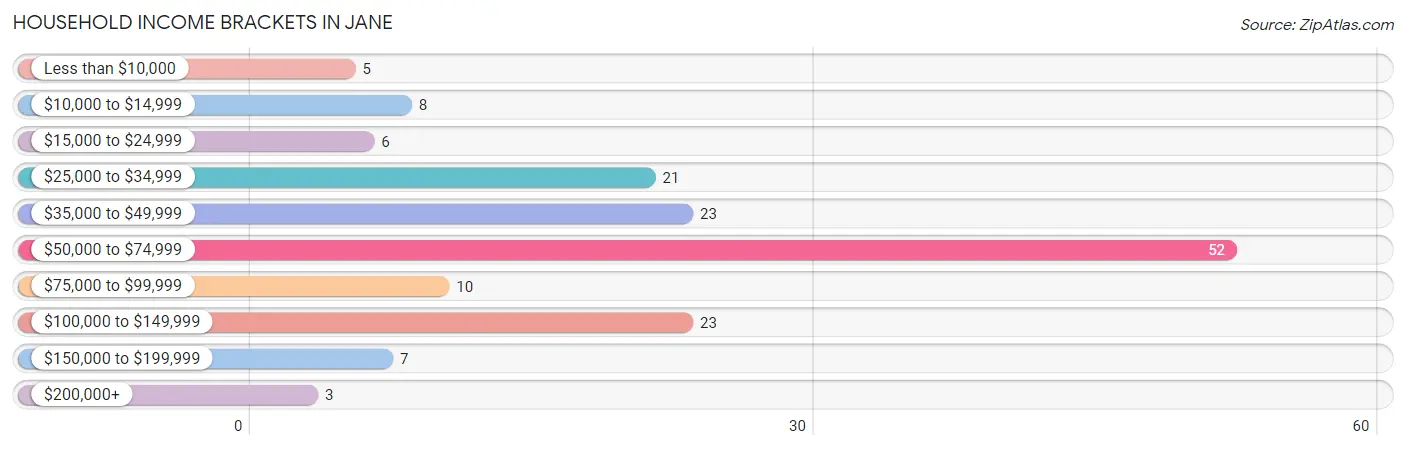
| Income Bracket | # Households | % Households |
| Less than $10,000 | 5 | 3.2% |
| $10,000 to $14,999 | 8 | 5.1% |
| $15,000 to $24,999 | 6 | 3.8% |
| $25,000 to $34,999 | 21 | 13.3% |
| $35,000 to $49,999 | 23 | 14.6% |
| $50,000 to $74,999 | 52 | 32.9% |
| $75,000 to $99,999 | 10 | 6.3% |
| $100,000 to $149,999 | 23 | 14.6% |
| $150,000 to $199,999 | 7 | 4.4% |
| $200,000+ | 3 | 1.9% |
Household Income by Householder Age in Jane
The median household income in Jane is $57,143, with the highest median household income of $68,542 found in the 25 to 44 years age bracket for the primary householder. A total of 78 households (49.4%) fall into this category. Meanwhile, the 15 to 24 years age bracket for the primary householder has the lowest median household income of $0, with 5 households (3.2%) in this group.
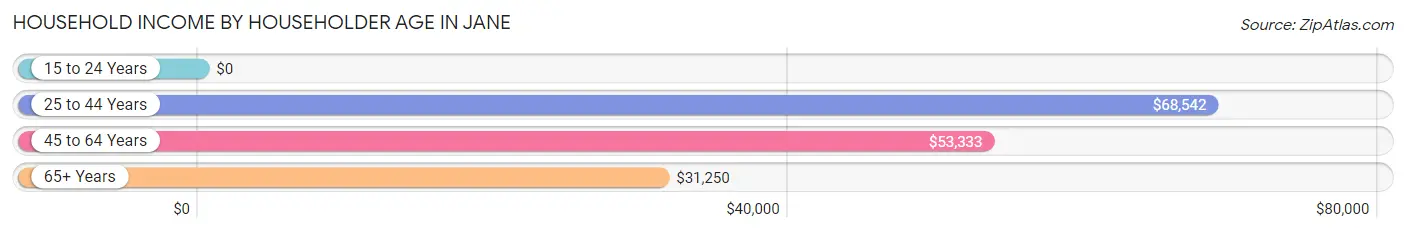
| Income Bracket | # Households | Median Income |
| 15 to 24 Years | 5 (3.2%) | $0 |
| 25 to 44 Years | 78 (49.4%) | $68,542 |
| 45 to 64 Years | 48 (30.4%) | $53,333 |
| 65+ Years | 27 (17.1%) | $31,250 |
| Total | 158 (100.0%) | $57,143 |
Poverty in Jane
Income Below Poverty by Sex and Age in Jane
With 14.0% poverty level for males and 14.8% for females among the residents of Jane, 16 and 17 year old males and 15 year old females are the most vulnerable to poverty, with 8 males (100.0%) and 3 females (100.0%) in their respective age groups living below the poverty level.
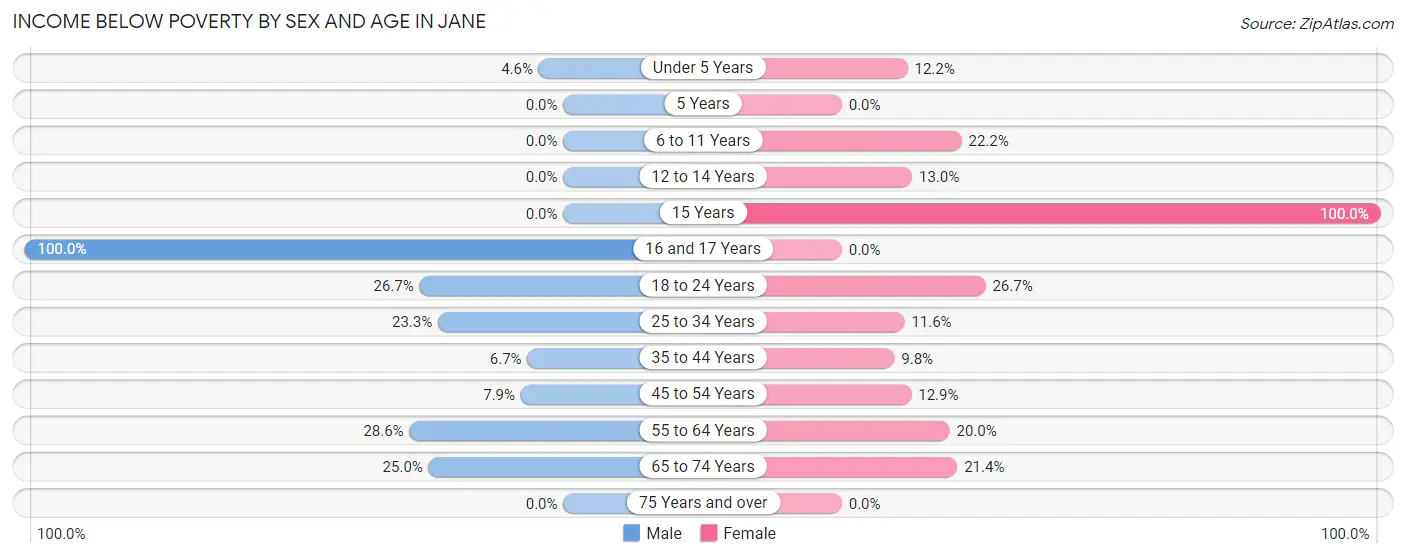
| Age Bracket | Male | Female |
| Under 5 Years | 1 (4.5%) | 5 (12.2%) |
| 5 Years | 0 (0.0%) | 0 (0.0%) |
| 6 to 11 Years | 0 (0.0%) | 2 (22.2%) |
| 12 to 14 Years | 0 (0.0%) | 3 (13.0%) |
| 15 Years | 0 (0.0%) | 3 (100.0%) |
| 16 and 17 Years | 8 (100.0%) | 0 (0.0%) |
| 18 to 24 Years | 4 (26.7%) | 8 (26.7%) |
| 25 to 34 Years | 10 (23.3%) | 5 (11.6%) |
| 35 to 44 Years | 3 (6.7%) | 4 (9.8%) |
| 45 to 54 Years | 3 (7.9%) | 4 (12.9%) |
| 55 to 64 Years | 4 (28.6%) | 4 (20.0%) |
| 65 to 74 Years | 3 (25.0%) | 3 (21.4%) |
| 75 Years and over | 0 (0.0%) | 0 (0.0%) |
| Total | 36 (14.0%) | 41 (14.8%) |
Income Above Poverty by Sex and Age in Jane
According to the poverty statistics in Jane, males aged 5 years and females aged 16 and 17 years are the age groups that are most secure financially, with 100.0% of males and 100.0% of females in these age groups living above the poverty line.
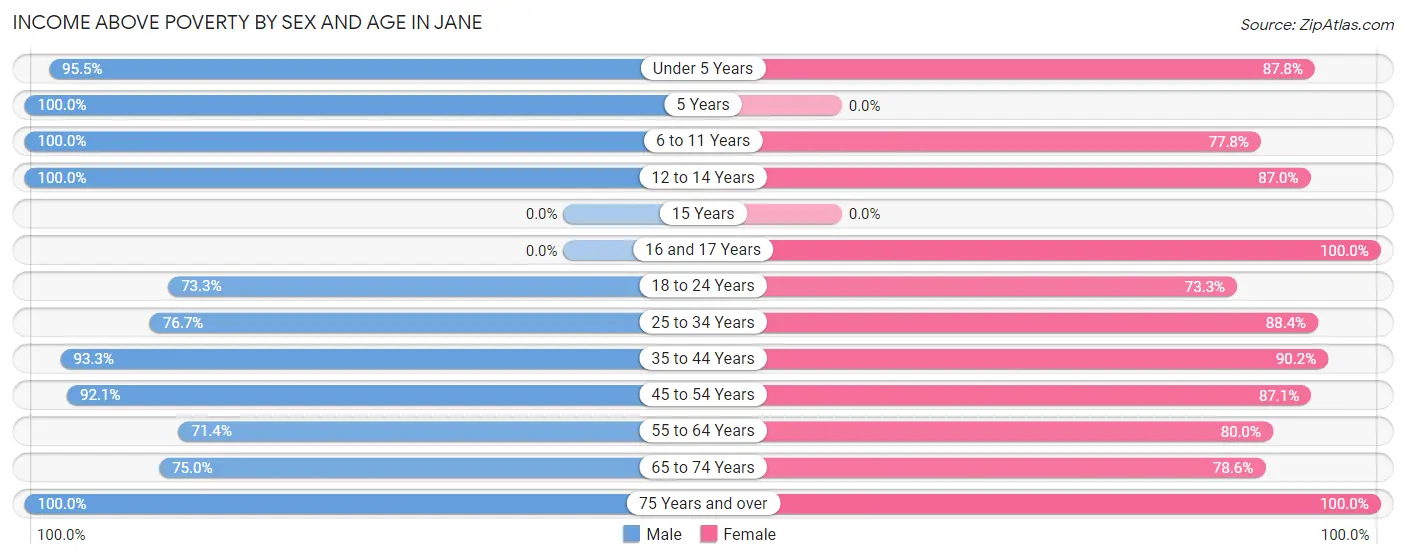
| Age Bracket | Male | Female |
| Under 5 Years | 21 (95.5%) | 36 (87.8%) |
| 5 Years | 4 (100.0%) | 0 (0.0%) |
| 6 to 11 Years | 39 (100.0%) | 7 (77.8%) |
| 12 to 14 Years | 8 (100.0%) | 20 (87.0%) |
| 15 Years | 0 (0.0%) | 0 (0.0%) |
| 16 and 17 Years | 0 (0.0%) | 16 (100.0%) |
| 18 to 24 Years | 11 (73.3%) | 22 (73.3%) |
| 25 to 34 Years | 33 (76.7%) | 38 (88.4%) |
| 35 to 44 Years | 42 (93.3%) | 37 (90.2%) |
| 45 to 54 Years | 35 (92.1%) | 27 (87.1%) |
| 55 to 64 Years | 10 (71.4%) | 16 (80.0%) |
| 65 to 74 Years | 9 (75.0%) | 11 (78.6%) |
| 75 Years and over | 10 (100.0%) | 6 (100.0%) |
| Total | 222 (86.1%) | 236 (85.2%) |
Income Below Poverty Among Married-Couple Families in Jane
The poverty statistics for married-couple families in Jane show that 7.4% or 6 of the total 81 families live below the poverty line. Families with 1 or 2 children have the highest poverty rate of 21.0%, comprising of 4 families. On the other hand, families with 3 or 4 children have the lowest poverty rate of 0.0%, which includes 0 families.
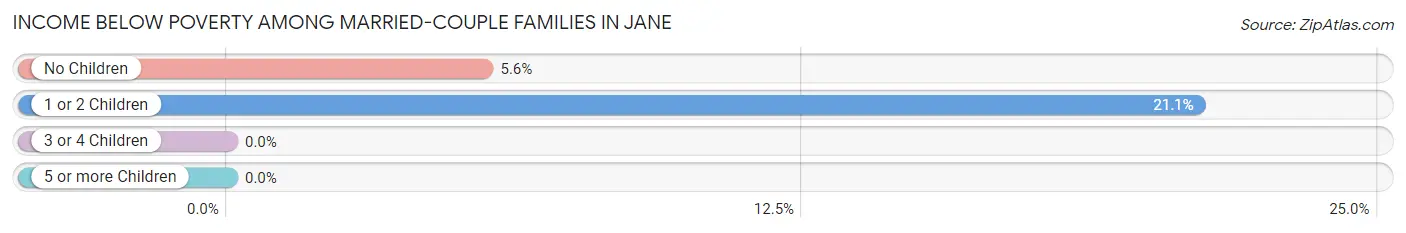
| Children | Above Poverty | Below Poverty |
| No Children | 34 (94.4%) | 2 (5.6%) |
| 1 or 2 Children | 15 (78.9%) | 4 (21.0%) |
| 3 or 4 Children | 26 (100.0%) | 0 (0.0%) |
| 5 or more Children | 0 (0.0%) | 0 (0.0%) |
| Total | 75 (92.6%) | 6 (7.4%) |
Income Below Poverty Among Single-Parent Households in Jane
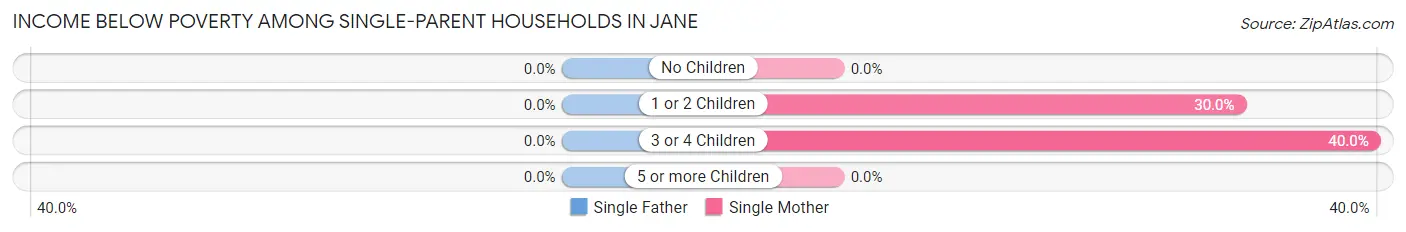
| Children | Single Father | Single Mother |
| No Children | 0 (0.0%) | 0 (0.0%) |
| 1 or 2 Children | 0 (0.0%) | 3 (30.0%) |
| 3 or 4 Children | 0 (0.0%) | 2 (40.0%) |
| 5 or more Children | 0 (0.0%) | 0 (0.0%) |
| Total | 0 (0.0%) | 5 (25.0%) |
Income Below Poverty Among Married-Couple vs Single-Parent Households in Jane
The poverty data for Jane shows that 6 of the married-couple family households (7.4%) and 5 of the single-parent households (15.6%) are living below the poverty level. Within the married-couple family households, those with 1 or 2 children have the highest poverty rate, with 4 households (21.0%) falling below the poverty line. Among the single-parent households, those with 3 or 4 children have the highest poverty rate, with 2 household (40.0%) living below poverty.
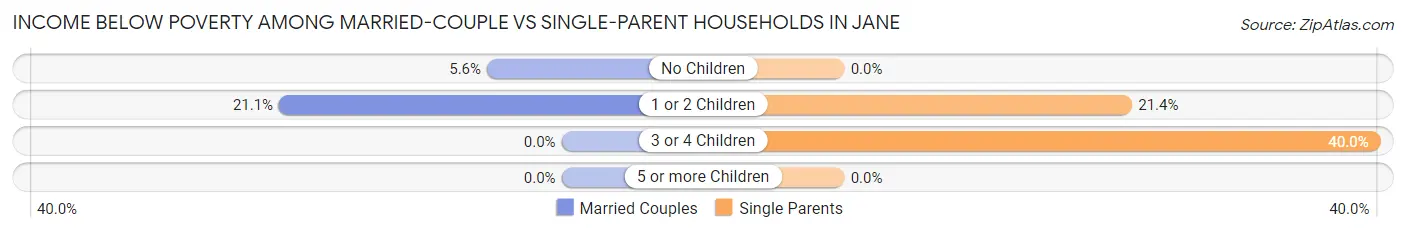
| Children | Married-Couple Families | Single-Parent Households |
| No Children | 2 (5.6%) | 0 (0.0%) |
| 1 or 2 Children | 4 (21.0%) | 3 (21.4%) |
| 3 or 4 Children | 0 (0.0%) | 2 (40.0%) |
| 5 or more Children | 0 (0.0%) | 0 (0.0%) |
| Total | 6 (7.4%) | 5 (15.6%) |
Race in Jane
The most populous races in Jane are White / Caucasian (460 | 86.0%), Two or more Races (44 | 8.2%), and Hispanic or Latino (28 | 5.2%).
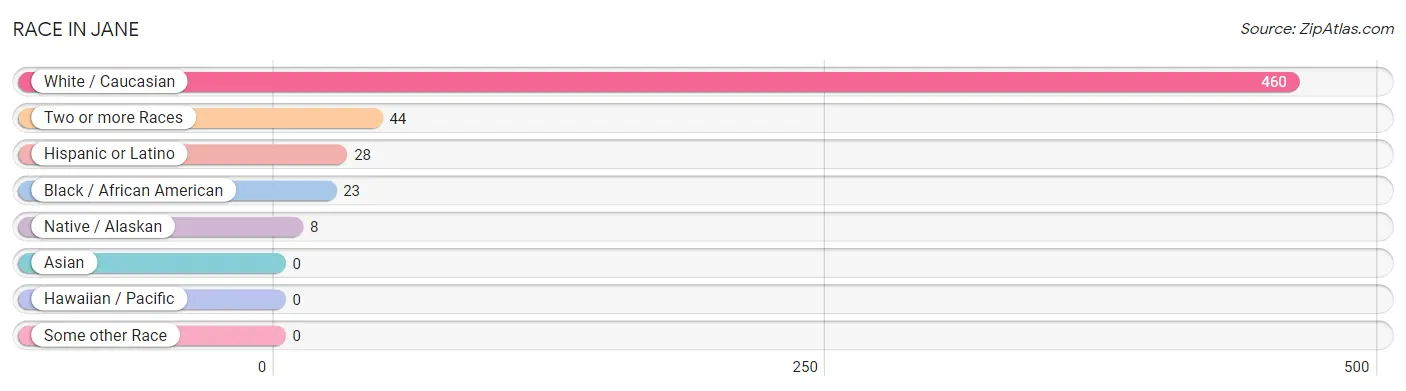
| Race | # Population | % Population |
| Asian | 0 | 0.0% |
| Black / African American | 23 | 4.3% |
| Hawaiian / Pacific | 0 | 0.0% |
| Hispanic or Latino | 28 | 5.2% |
| Native / Alaskan | 8 | 1.5% |
| White / Caucasian | 460 | 86.0% |
| Two or more Races | 44 | 8.2% |
| Some other Race | 0 | 0.0% |
| Total | 535 | 100.0% |
Ancestry in Jane
The most populous ancestries reported in Jane are German (43 | 8.0%), American (41 | 7.7%), Irish (41 | 7.7%), Cherokee (33 | 6.2%), and English (21 | 3.9%), together accounting for 33.5% of all Jane residents.
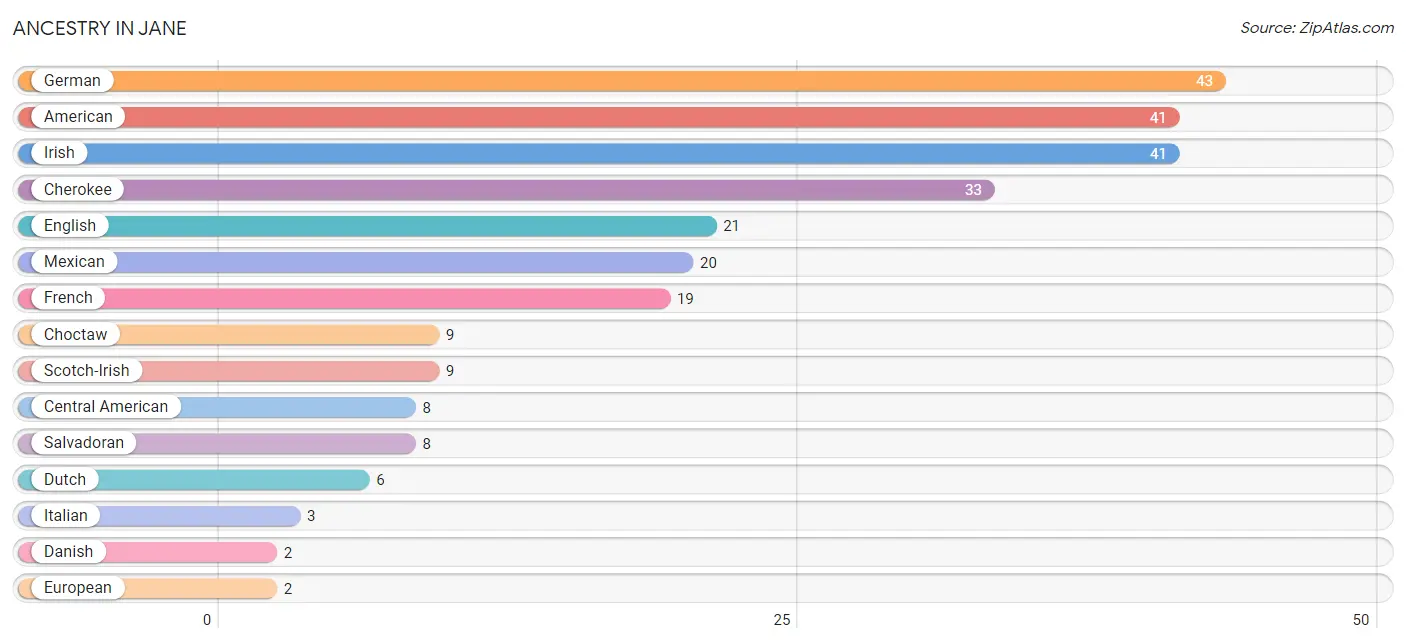
| Ancestry | # Population | % Population |
| American | 41 | 7.7% |
| Apache | 1 | 0.2% |
| Central American | 8 | 1.5% |
| Cherokee | 33 | 6.2% |
| Choctaw | 9 | 1.7% |
| Danish | 2 | 0.4% |
| Dutch | 6 | 1.1% |
| English | 21 | 3.9% |
| European | 2 | 0.4% |
| French | 19 | 3.5% |
| German | 43 | 8.0% |
| Irish | 41 | 7.7% |
| Italian | 3 | 0.6% |
| Kiowa | 1 | 0.2% |
| Mexican | 20 | 3.7% |
| Norwegian | 2 | 0.4% |
| Polish | 2 | 0.4% |
| Salvadoran | 8 | 1.5% |
| Scotch-Irish | 9 | 1.7% | View All 19 Rows |
Immigrants in Jane
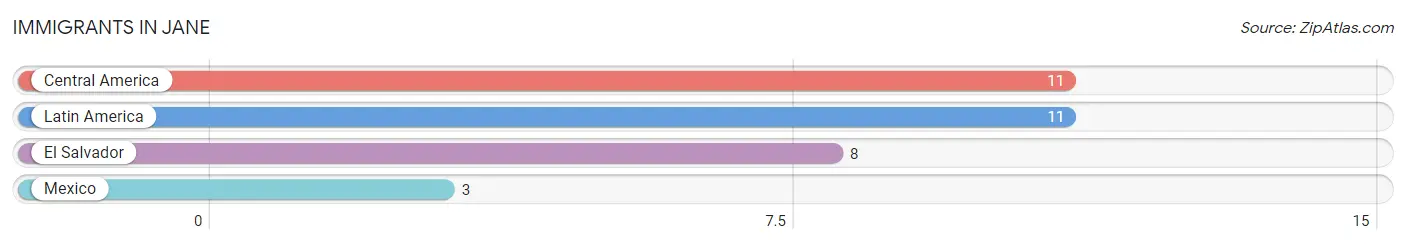
The most numerous immigrant groups reported in Jane came from Central America (11 | 2.1%), Latin America (11 | 2.1%), El Salvador (8 | 1.5%), and Mexico (3 | 0.6%), together accounting for 6.2% of all Jane residents.
| Immigration Origin | # Population | % Population |
| Central America | 11 | 2.1% |
| El Salvador | 8 | 1.5% |
| Latin America | 11 | 2.1% |
| Mexico | 3 | 0.6% | View All 4 Rows |
Sex and Age in Jane
Sex and Age in Jane
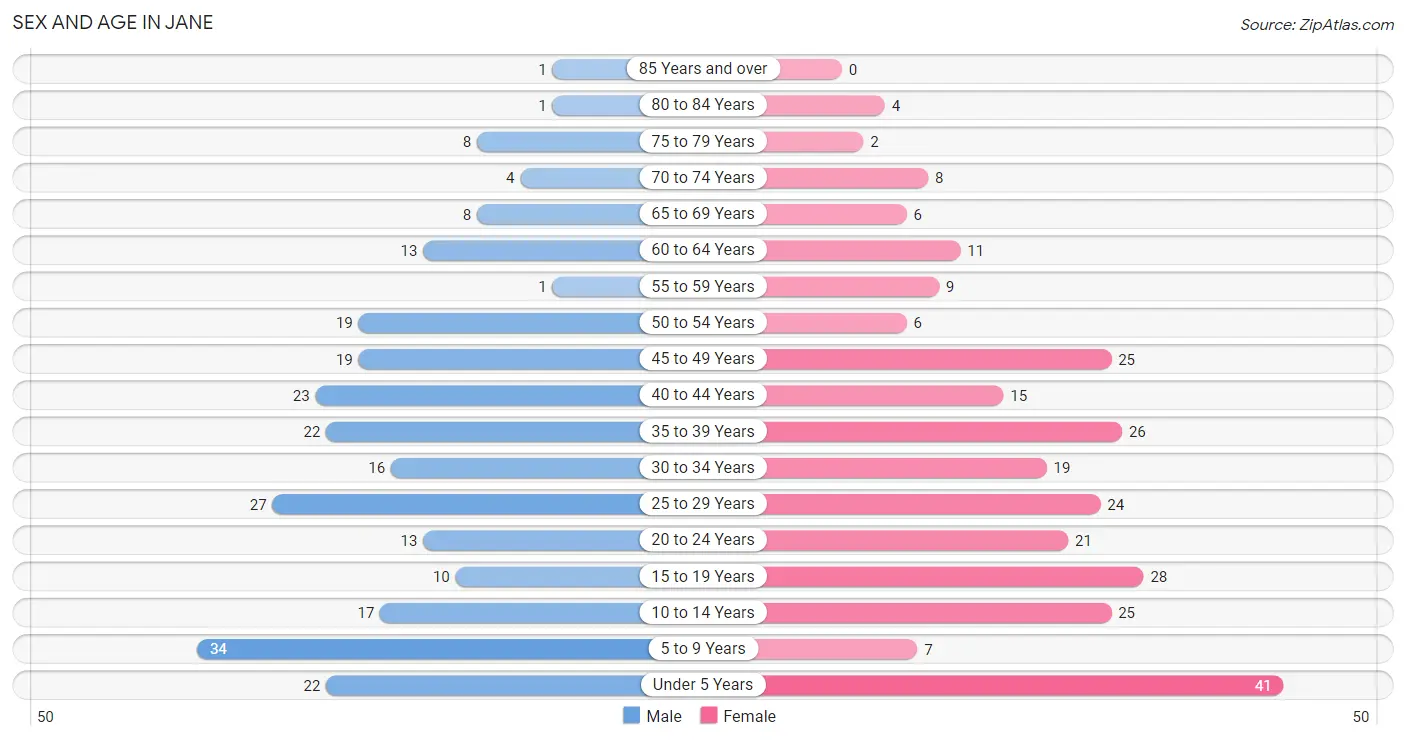
The most populous age groups in Jane are 5 to 9 Years (34 | 13.2%) for men and Under 5 Years (41 | 14.8%) for women.
| Age Bracket | Male | Female |
| Under 5 Years | 22 (8.5%) | 41 (14.8%) |
| 5 to 9 Years | 34 (13.2%) | 7 (2.5%) |
| 10 to 14 Years | 17 (6.6%) | 25 (9.0%) |
| 15 to 19 Years | 10 (3.9%) | 28 (10.1%) |
| 20 to 24 Years | 13 (5.0%) | 21 (7.6%) |
| 25 to 29 Years | 27 (10.5%) | 24 (8.7%) |
| 30 to 34 Years | 16 (6.2%) | 19 (6.9%) |
| 35 to 39 Years | 22 (8.5%) | 26 (9.4%) |
| 40 to 44 Years | 23 (8.9%) | 15 (5.4%) |
| 45 to 49 Years | 19 (7.4%) | 25 (9.0%) |
| 50 to 54 Years | 19 (7.4%) | 6 (2.2%) |
| 55 to 59 Years | 1 (0.4%) | 9 (3.3%) |
| 60 to 64 Years | 13 (5.0%) | 11 (4.0%) |
| 65 to 69 Years | 8 (3.1%) | 6 (2.2%) |
| 70 to 74 Years | 4 (1.5%) | 8 (2.9%) |
| 75 to 79 Years | 8 (3.1%) | 2 (0.7%) |
| 80 to 84 Years | 1 (0.4%) | 4 (1.4%) |
| 85 Years and over | 1 (0.4%) | 0 (0.0%) |
| Total | 258 (100.0%) | 277 (100.0%) |
Families and Households in Jane
Median Family Size in Jane
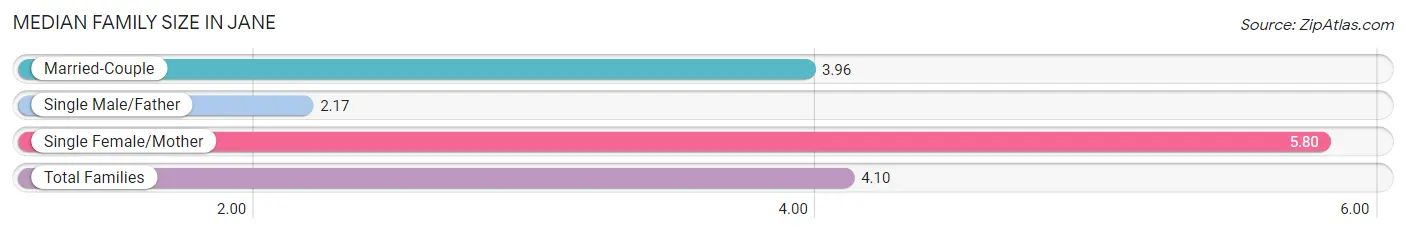
The median family size in Jane is 4.10 persons per family, with single female/mother families (20 | 17.7%) accounting for the largest median family size of 5.8 persons per family. On the other hand, single male/father families (12 | 10.6%) represent the smallest median family size with 2.17 persons per family.
| Family Type | # Families | Family Size |
| Married-Couple | 81 (71.7%) | 3.96 |
| Single Male/Father | 12 (10.6%) | 2.17 |
| Single Female/Mother | 20 (17.7%) | 5.80 |
| Total Families | 113 (100.0%) | 4.10 |
Median Household Size in Jane
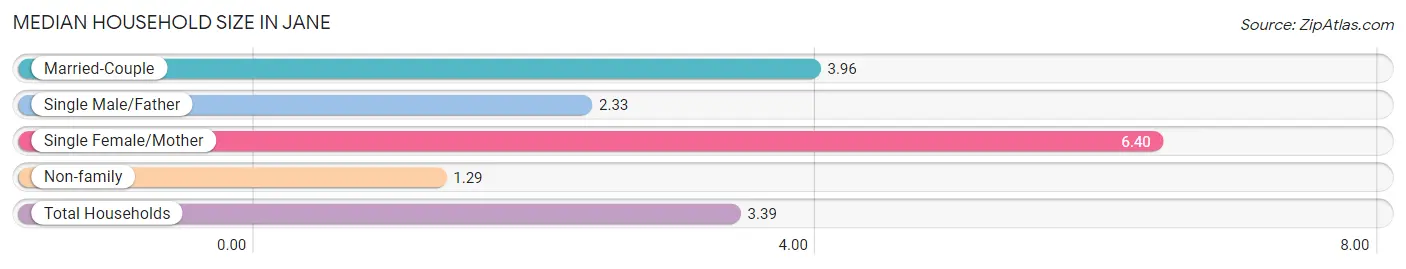
The median household size in Jane is 3.39 persons per household, with single female/mother households (20 | 12.7%) accounting for the largest median household size of 6.4 persons per household. non-family households (45 | 28.5%) represent the smallest median household size with 1.29 persons per household.
| Household Type | # Households | Household Size |
| Married-Couple | 81 (51.3%) | 3.96 |
| Single Male/Father | 12 (7.6%) | 2.33 |
| Single Female/Mother | 20 (12.7%) | 6.40 |
| Non-family | 45 (28.5%) | 1.29 |
| Total Households | 158 (100.0%) | 3.39 |
Household Size by Marriage Status in Jane
Out of a total of 158 households in Jane, 113 (71.5%) are family households, while 45 (28.5%) are nonfamily households. The most numerous type of family households are 2-person households, comprising 39, and the most common type of nonfamily households are 1-person households, comprising 37.
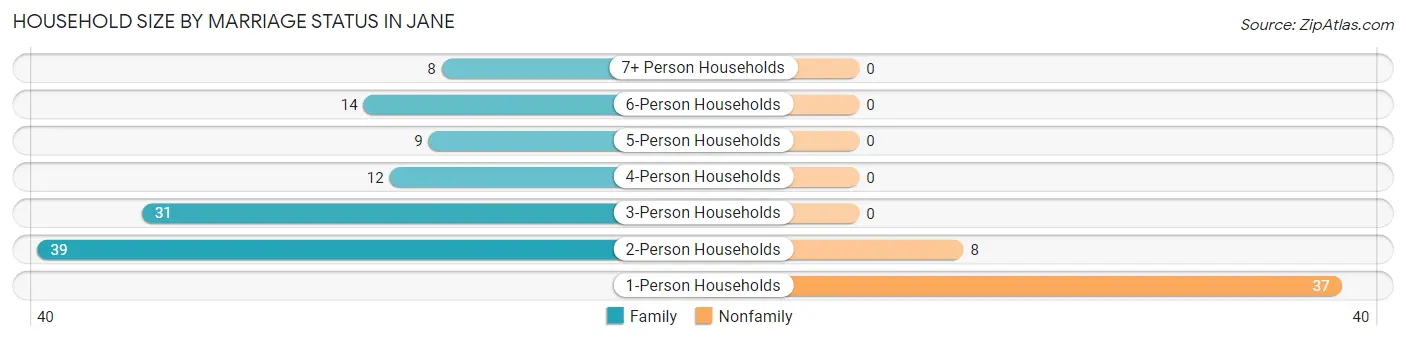
| Household Size | Family Households | Nonfamily Households |
| 1-Person Households | - | 37 (23.4%) |
| 2-Person Households | 39 (24.7%) | 8 (5.1%) |
| 3-Person Households | 31 (19.6%) | 0 (0.0%) |
| 4-Person Households | 12 (7.6%) | 0 (0.0%) |
| 5-Person Households | 9 (5.7%) | 0 (0.0%) |
| 6-Person Households | 14 (8.9%) | 0 (0.0%) |
| 7+ Person Households | 8 (5.1%) | 0 (0.0%) |
| Total | 113 (71.5%) | 45 (28.5%) |
Female Fertility in Jane
Fertility by Age in Jane
| Age Bracket | Women with Births | Births / 1,000 Women |
| 15 to 19 years | 0 (0.0%) | 0.0 |
| 20 to 34 years | 0 (0.0%) | 0.0 |
| 35 to 50 years | 0 (0.0%) | 0.0 |
| Total | 0 (0.0%) | 0.0 |
Fertility by Age by Marriage Status in Jane
| Age Bracket | Married | Unmarried |
| 15 to 19 years | 0 (0.0%) | 0 (0.0%) |
| 20 to 34 years | 0 (0.0%) | 0 (0.0%) |
| 35 to 50 years | 0 (0.0%) | 0 (0.0%) |
| Total | 0 (0.0%) | 0 (0.0%) |
Fertility by Education in Jane
| Educational Attainment | Women with Births | Births / 1,000 Women |
| Less than High School | 0 (0.0%) | 0.0 |
| High School Diploma | 0 (0.0%) | 0.0 |
| College or Associate's Degree | 0 (0.0%) | 0.0 |
| Bachelor's Degree | 0 (0.0%) | 0.0 |
| Graduate Degree | 0 (0.0%) | 0.0 |
| Total | 0 (0.0%) | 0.0 |
Fertility by Education by Marriage Status in Jane
| Educational Attainment | Married | Unmarried |
| Less than High School | 0 (0.0%) | 0 (0.0%) |
| High School Diploma | 0 (0.0%) | 0 (0.0%) |
| College or Associate's Degree | 0 (0.0%) | 0 (0.0%) |
| Bachelor's Degree | 0 (0.0%) | 0 (0.0%) |
| Graduate Degree | 0 (0.0%) | 0 (0.0%) |
| Total | 0 (0.0%) | 0 (0.0%) |
Employment Characteristics in Jane
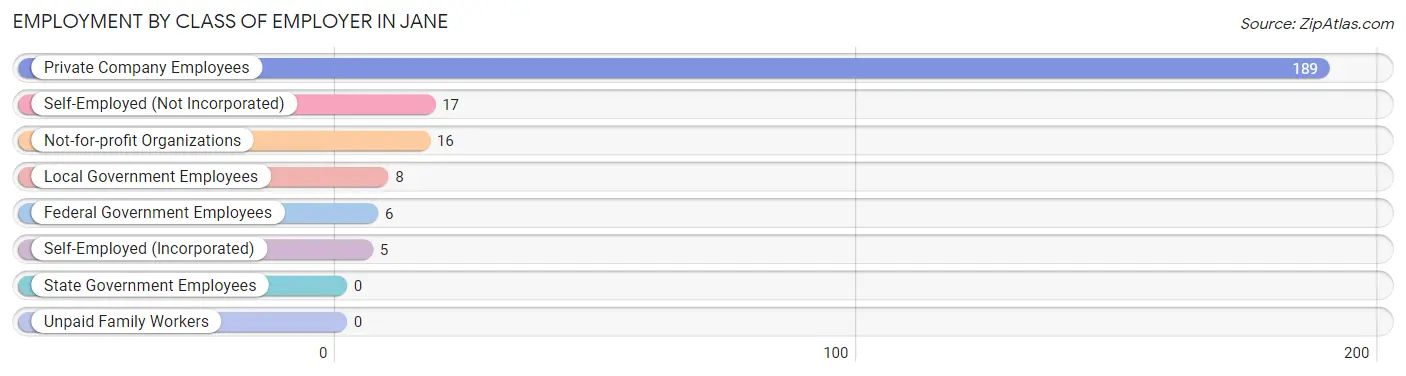
Employment by Class of Employer in Jane
Among the 241 employed individuals in Jane, private company employees (189 | 78.4%), self-employed (not incorporated) (17 | 7.0%), and not-for-profit organizations (16 | 6.6%) make up the most common classes of employment.
| Employer Class | # Employees | % Employees |
| Private Company Employees | 189 | 78.4% |
| Self-Employed (Incorporated) | 5 | 2.1% |
| Self-Employed (Not Incorporated) | 17 | 7.0% |
| Not-for-profit Organizations | 16 | 6.6% |
| Local Government Employees | 8 | 3.3% |
| State Government Employees | 0 | 0.0% |
| Federal Government Employees | 6 | 2.5% |
| Unpaid Family Workers | 0 | 0.0% |
| Total | 241 | 100.0% |
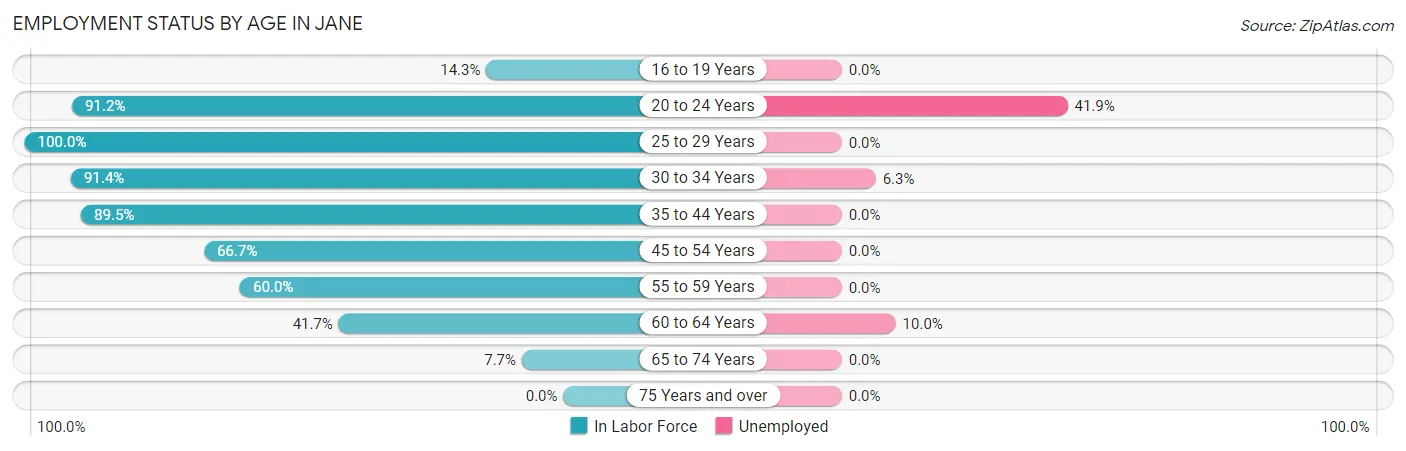
Employment Status by Age in Jane
According to the labor force statistics for Jane, out of the total population over 16 years of age (386), 67.4% or 260 individuals are in the labor force, with 6.2% or 16 of them unemployed. The age group with the highest labor force participation rate is 25 to 29 years, with 100.0% or 51 individuals in the labor force. Within the labor force, the 20 to 24 years age range has the highest percentage of unemployed individuals, with 41.9% or 13 of them being unemployed.
| Age Bracket | In Labor Force | Unemployed |
| 16 to 19 Years | 5 (14.3%) | 0 (0.0%) |
| 20 to 24 Years | 31 (91.2%) | 13 (41.9%) |
| 25 to 29 Years | 51 (100.0%) | 0 (0.0%) |
| 30 to 34 Years | 32 (91.4%) | 2 (6.3%) |
| 35 to 44 Years | 77 (89.5%) | 0 (0.0%) |
| 45 to 54 Years | 46 (66.7%) | 0 (0.0%) |
| 55 to 59 Years | 6 (60.0%) | 0 (0.0%) |
| 60 to 64 Years | 10 (41.7%) | 1 (10.0%) |
| 65 to 74 Years | 2 (7.7%) | 0 (0.0%) |
| 75 Years and over | 0 (0.0%) | 0 (0.0%) |
| Total | 260 (67.4%) | 16 (6.2%) |
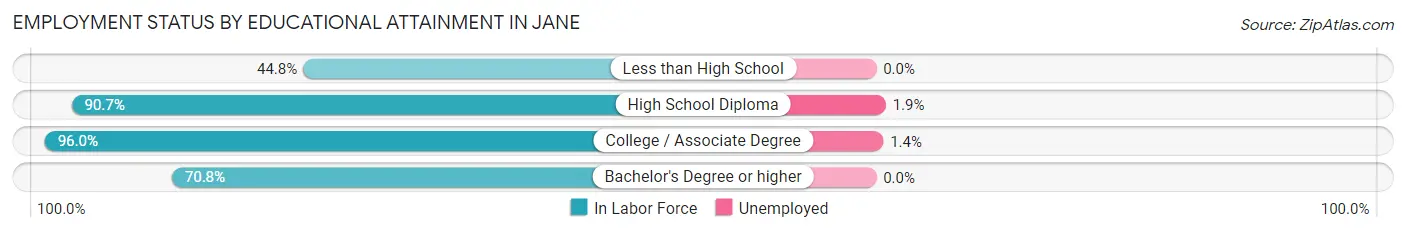
Employment Status by Educational Attainment in Jane
According to labor force statistics for Jane, 80.7% of individuals (222) out of the total population between 25 and 64 years of age (275) are in the labor force, with 1.4% or 3 of them being unemployed. The group with the highest labor force participation rate are those with the educational attainment of college / associate degree, with 96.0% or 72 individuals in the labor force. Within the labor force, individuals with high school diploma education have the highest percentage of unemployment, with 1.9% or 2 of them being unemployed.
| Educational Attainment | In Labor Force | Unemployed |
| Less than High School | 26 (44.8%) | 0 (0.0%) |
| High School Diploma | 107 (90.7%) | 2 (1.9%) |
| College / Associate Degree | 72 (96.0%) | 1 (1.4%) |
| Bachelor's Degree or higher | 17 (70.8%) | 0 (0.0%) |
| Total | 222 (80.7%) | 4 (1.4%) |
Employment Occupations by Sex in Jane
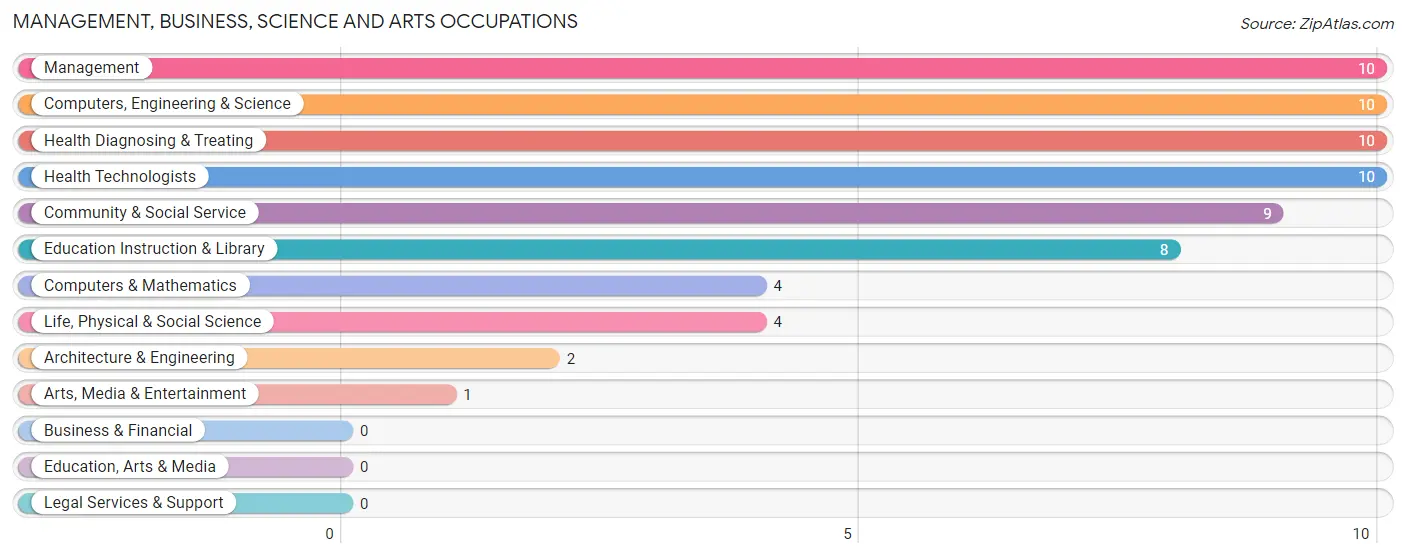
Management, Business, Science and Arts Occupations
The most common Management, Business, Science and Arts occupations in Jane are Management (10 | 4.1%), Computers, Engineering & Science (10 | 4.1%), Health Diagnosing & Treating (10 | 4.1%), Health Technologists (10 | 4.1%), and Community & Social Service (9 | 3.7%).
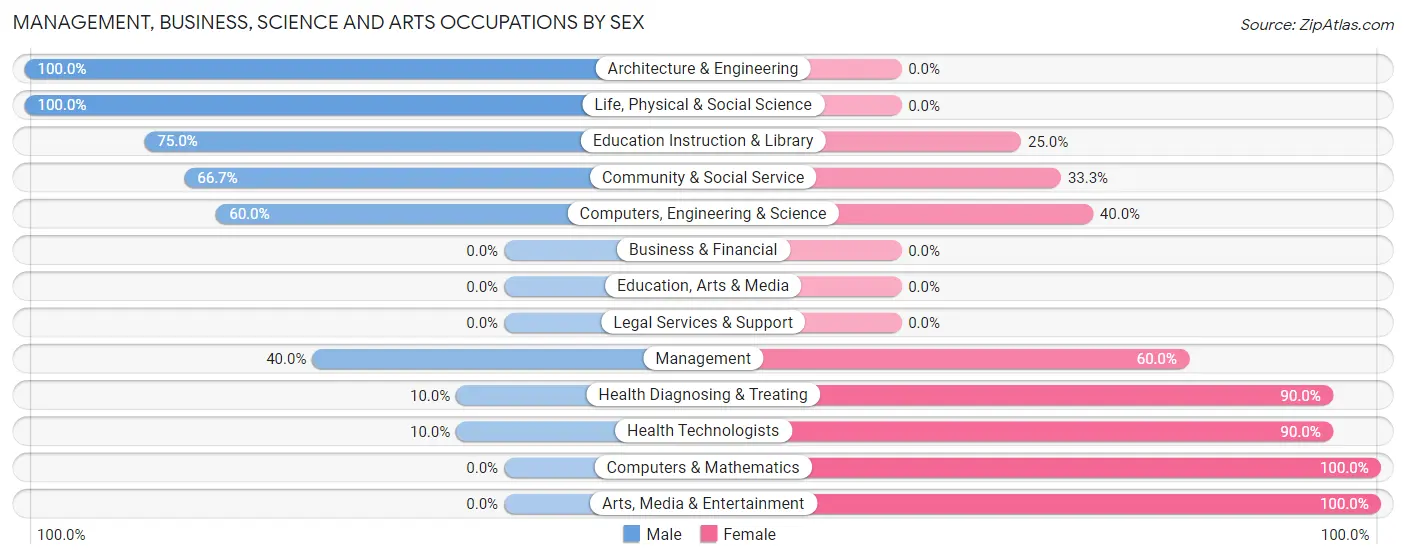
Management, Business, Science and Arts Occupations by Sex
Within the Management, Business, Science and Arts occupations in Jane, the most male-oriented occupations are Architecture & Engineering (100.0%), Life, Physical & Social Science (100.0%), and Education Instruction & Library (75.0%), while the most female-oriented occupations are Computers & Mathematics (100.0%), Arts, Media & Entertainment (100.0%), and Health Diagnosing & Treating (90.0%).
| Occupation | Male | Female |
| Management | 4 (40.0%) | 6 (60.0%) |
| Business & Financial | 0 (0.0%) | 0 (0.0%) |
| Computers, Engineering & Science | 6 (60.0%) | 4 (40.0%) |
| Computers & Mathematics | 0 (0.0%) | 4 (100.0%) |
| Architecture & Engineering | 2 (100.0%) | 0 (0.0%) |
| Life, Physical & Social Science | 4 (100.0%) | 0 (0.0%) |
| Community & Social Service | 6 (66.7%) | 3 (33.3%) |
| Education, Arts & Media | 0 (0.0%) | 0 (0.0%) |
| Legal Services & Support | 0 (0.0%) | 0 (0.0%) |
| Education Instruction & Library | 6 (75.0%) | 2 (25.0%) |
| Arts, Media & Entertainment | 0 (0.0%) | 1 (100.0%) |
| Health Diagnosing & Treating | 1 (10.0%) | 9 (90.0%) |
| Health Technologists | 1 (10.0%) | 9 (90.0%) |
| Total (Category) | 17 (43.6%) | 22 (56.4%) |
| Total (Overall) | 132 (54.5%) | 110 (45.5%) |
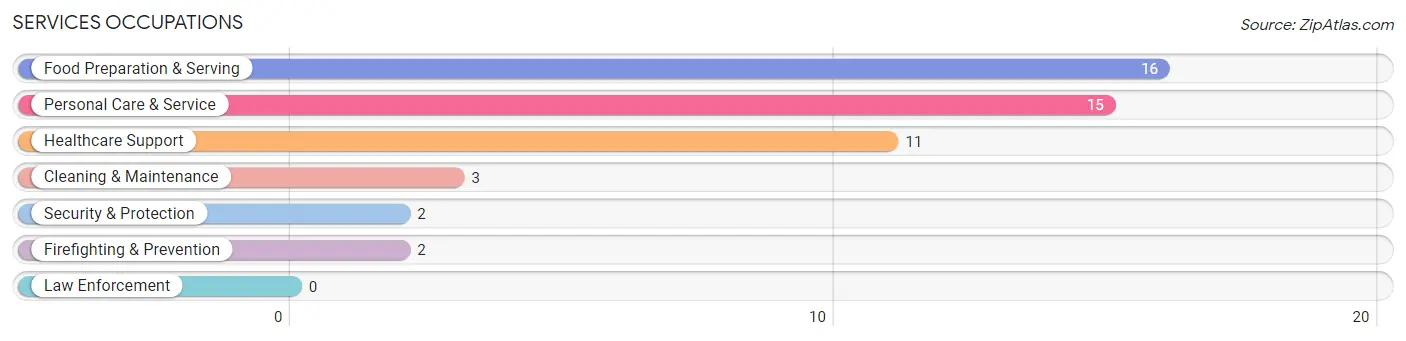
Services Occupations
The most common Services occupations in Jane are Food Preparation & Serving (16 | 6.6%), Personal Care & Service (15 | 6.2%), Healthcare Support (11 | 4.5%), Cleaning & Maintenance (3 | 1.2%), and Security & Protection (2 | 0.8%).
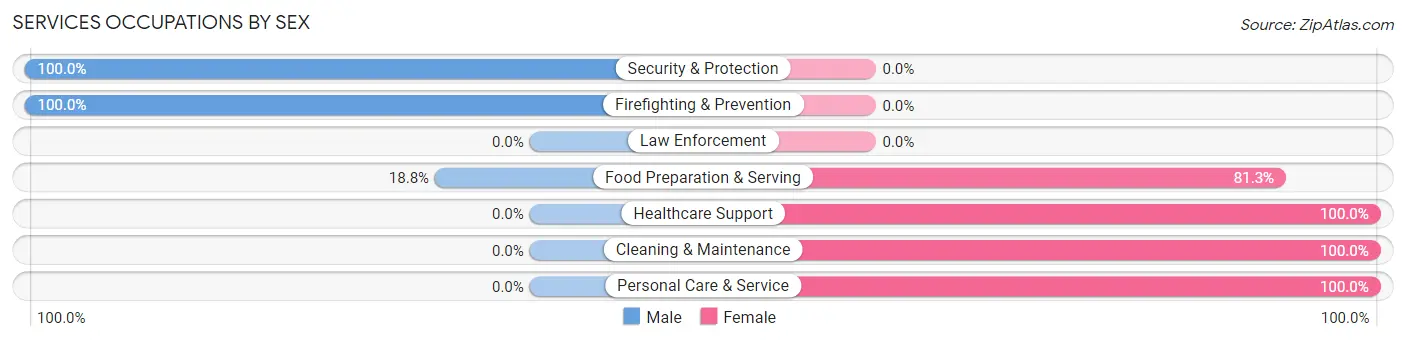
Services Occupations by Sex
Within the Services occupations in Jane, the most male-oriented occupations are Security & Protection (100.0%), Firefighting & Prevention (100.0%), and Food Preparation & Serving (18.8%), while the most female-oriented occupations are Healthcare Support (100.0%), Cleaning & Maintenance (100.0%), and Personal Care & Service (100.0%).
| Occupation | Male | Female |
| Healthcare Support | 0 (0.0%) | 11 (100.0%) |
| Security & Protection | 2 (100.0%) | 0 (0.0%) |
| Firefighting & Prevention | 2 (100.0%) | 0 (0.0%) |
| Law Enforcement | 0 (0.0%) | 0 (0.0%) |
| Food Preparation & Serving | 3 (18.8%) | 13 (81.2%) |
| Cleaning & Maintenance | 0 (0.0%) | 3 (100.0%) |
| Personal Care & Service | 0 (0.0%) | 15 (100.0%) |
| Total (Category) | 5 (10.6%) | 42 (89.4%) |
| Total (Overall) | 132 (54.5%) | 110 (45.5%) |
Sales and Office Occupations
The most common Sales and Office occupations in Jane are Office & Administration (29 | 12.0%), and Sales & Related (23 | 9.5%).
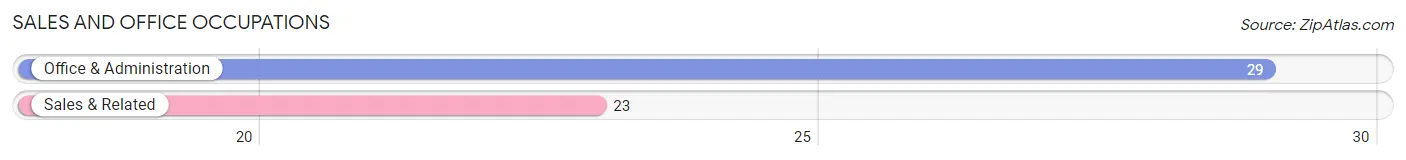
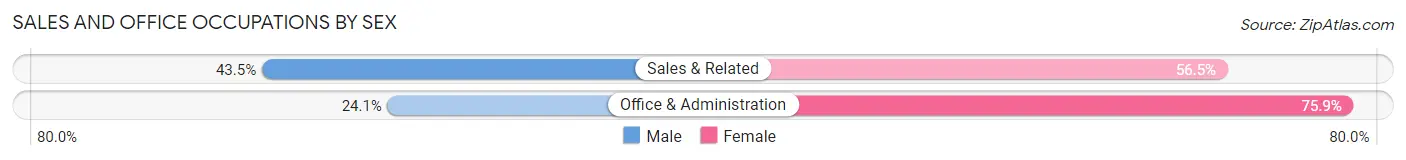
Sales and Office Occupations by Sex
| Occupation | Male | Female |
| Sales & Related | 10 (43.5%) | 13 (56.5%) |
| Office & Administration | 7 (24.1%) | 22 (75.9%) |
| Total (Category) | 17 (32.7%) | 35 (67.3%) |
| Total (Overall) | 132 (54.5%) | 110 (45.5%) |
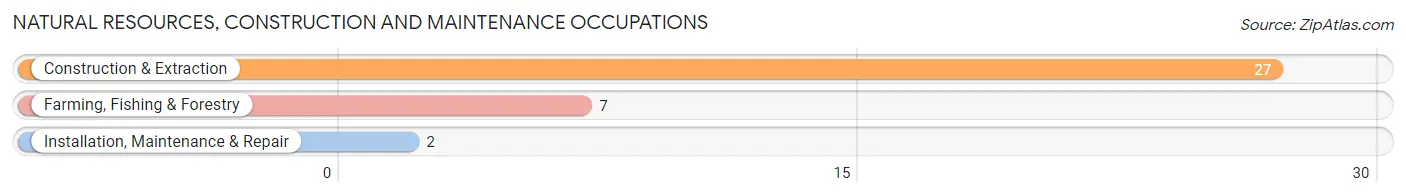
Natural Resources, Construction and Maintenance Occupations
The most common Natural Resources, Construction and Maintenance occupations in Jane are Construction & Extraction (27 | 11.2%), Farming, Fishing & Forestry (7 | 2.9%), and Installation, Maintenance & Repair (2 | 0.8%).
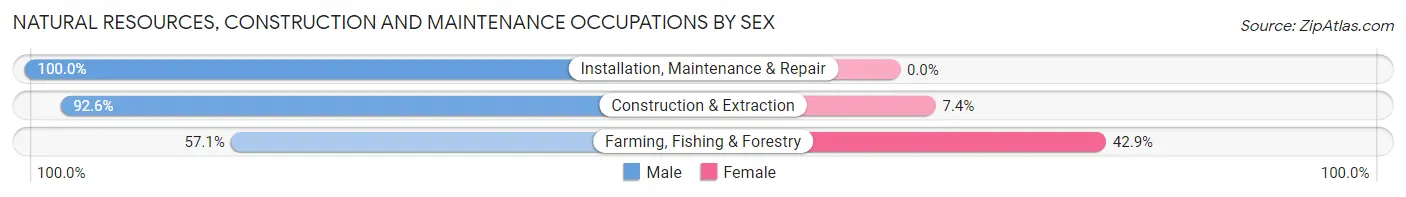
Natural Resources, Construction and Maintenance Occupations by Sex
| Occupation | Male | Female |
| Farming, Fishing & Forestry | 4 (57.1%) | 3 (42.9%) |
| Construction & Extraction | 25 (92.6%) | 2 (7.4%) |
| Installation, Maintenance & Repair | 2 (100.0%) | 0 (0.0%) |
| Total (Category) | 31 (86.1%) | 5 (13.9%) |
| Total (Overall) | 132 (54.5%) | 110 (45.5%) |
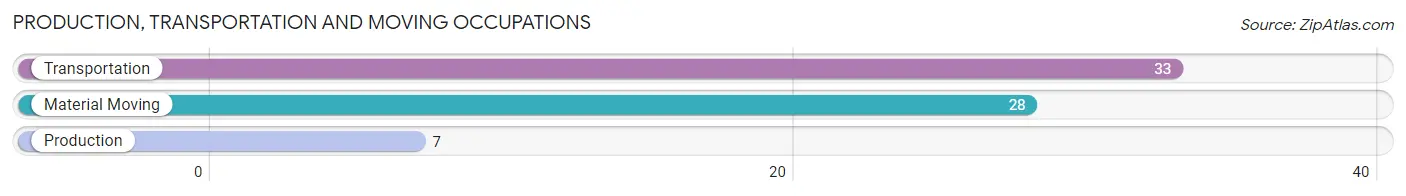
Production, Transportation and Moving Occupations
The most common Production, Transportation and Moving occupations in Jane are Transportation (33 | 13.6%), Material Moving (28 | 11.6%), and Production (7 | 2.9%).
Production, Transportation and Moving Occupations by Sex
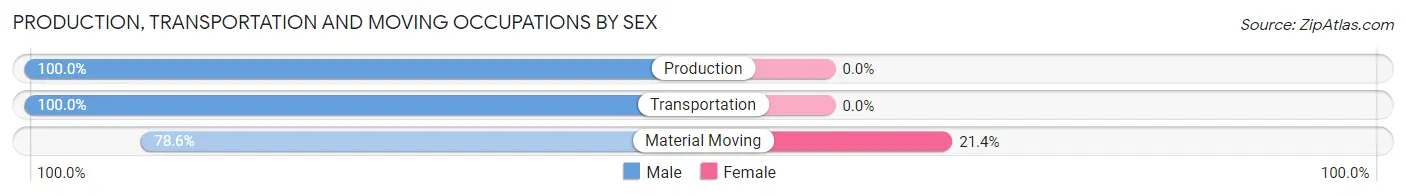
| Occupation | Male | Female |
| Production | 7 (100.0%) | 0 (0.0%) |
| Transportation | 33 (100.0%) | 0 (0.0%) |
| Material Moving | 22 (78.6%) | 6 (21.4%) |
| Total (Category) | 62 (91.2%) | 6 (8.8%) |
| Total (Overall) | 132 (54.5%) | 110 (45.5%) |
Employment Industries by Sex in Jane
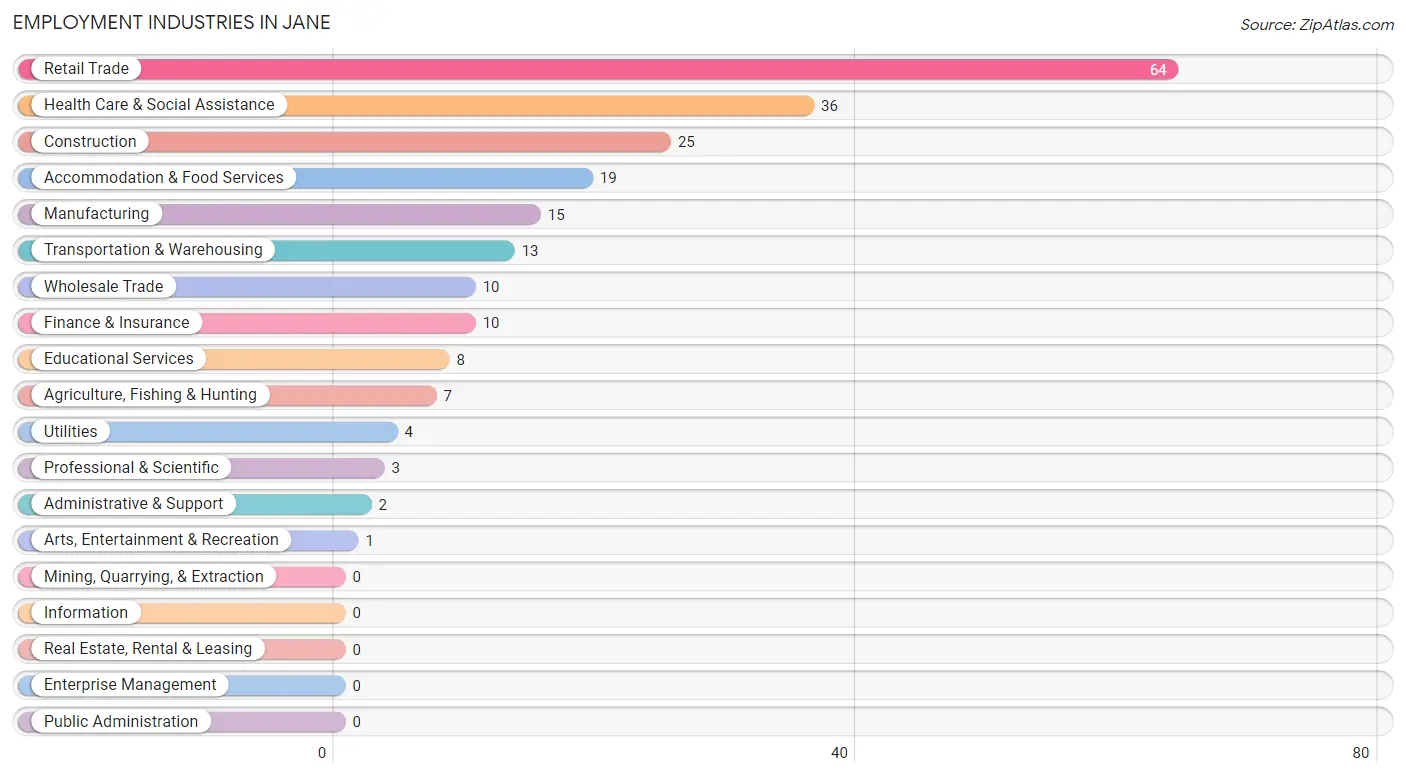
Employment Industries in Jane
The major employment industries in Jane include Retail Trade (64 | 26.5%), Health Care & Social Assistance (36 | 14.9%), Construction (25 | 10.3%), Accommodation & Food Services (19 | 7.9%), and Manufacturing (15 | 6.2%).
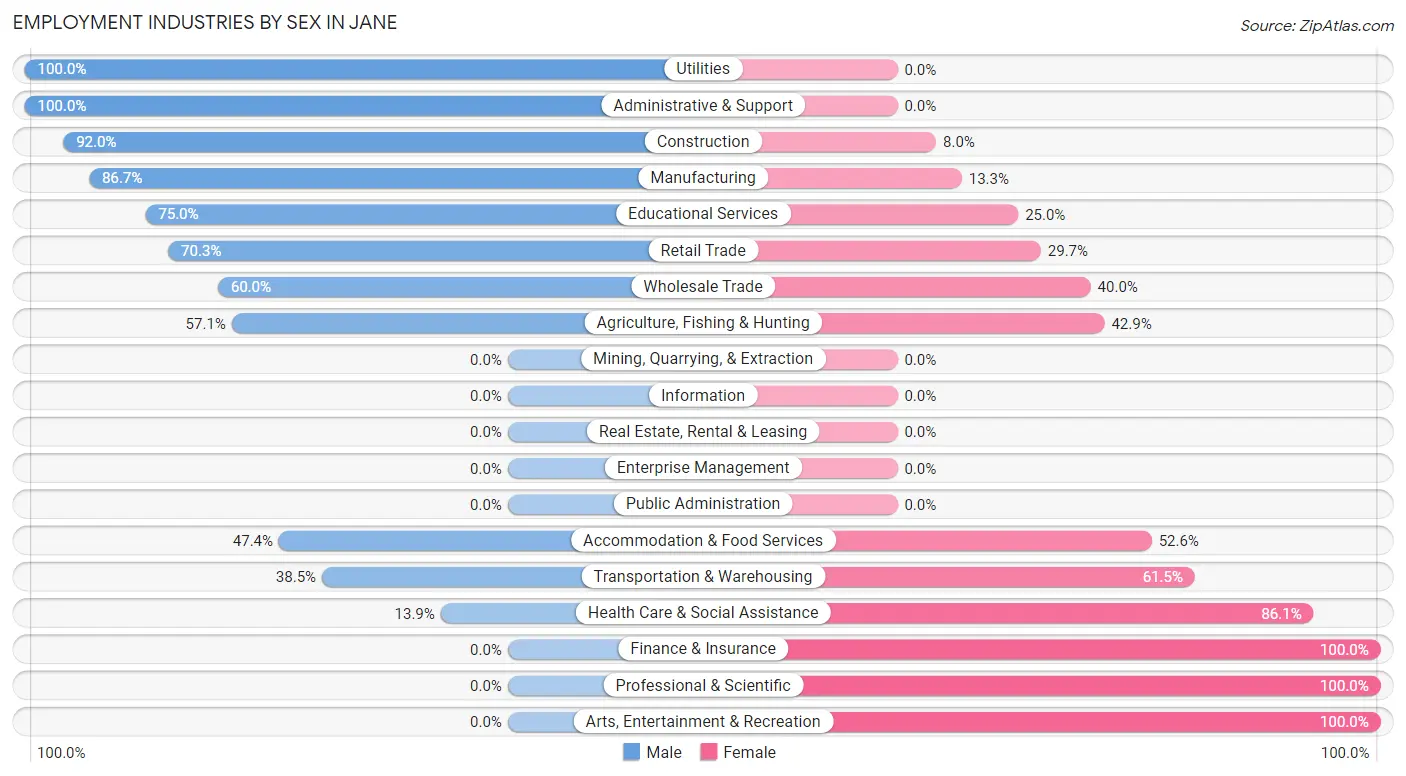
Employment Industries by Sex in Jane
The Jane industries that see more men than women are Utilities (100.0%), Administrative & Support (100.0%), and Construction (92.0%), whereas the industries that tend to have a higher number of women are Finance & Insurance (100.0%), Professional & Scientific (100.0%), and Arts, Entertainment & Recreation (100.0%).
| Industry | Male | Female |
| Agriculture, Fishing & Hunting | 4 (57.1%) | 3 (42.9%) |
| Mining, Quarrying, & Extraction | 0 (0.0%) | 0 (0.0%) |
| Construction | 23 (92.0%) | 2 (8.0%) |
| Manufacturing | 13 (86.7%) | 2 (13.3%) |
| Wholesale Trade | 6 (60.0%) | 4 (40.0%) |
| Retail Trade | 45 (70.3%) | 19 (29.7%) |
| Transportation & Warehousing | 5 (38.5%) | 8 (61.5%) |
| Utilities | 4 (100.0%) | 0 (0.0%) |
| Information | 0 (0.0%) | 0 (0.0%) |
| Finance & Insurance | 0 (0.0%) | 10 (100.0%) |
| Real Estate, Rental & Leasing | 0 (0.0%) | 0 (0.0%) |
| Professional & Scientific | 0 (0.0%) | 3 (100.0%) |
| Enterprise Management | 0 (0.0%) | 0 (0.0%) |
| Administrative & Support | 2 (100.0%) | 0 (0.0%) |
| Educational Services | 6 (75.0%) | 2 (25.0%) |
| Health Care & Social Assistance | 5 (13.9%) | 31 (86.1%) |
| Arts, Entertainment & Recreation | 0 (0.0%) | 1 (100.0%) |
| Accommodation & Food Services | 9 (47.4%) | 10 (52.6%) |
| Public Administration | 0 (0.0%) | 0 (0.0%) |
| Total | 132 (54.5%) | 110 (45.5%) |
Education in Jane
School Enrollment in Jane
The most common levels of schooling among the 129 students in Jane are high school (44 | 34.1%), elementary school (39 | 30.2%), and middle school (30 | 23.3%).
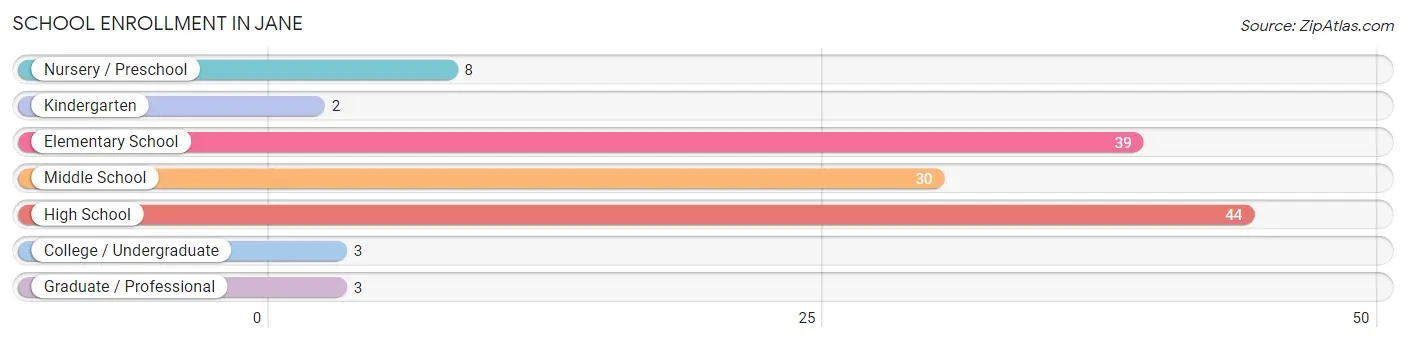
| School Level | # Students | % Students |
| Nursery / Preschool | 8 | 6.2% |
| Kindergarten | 2 | 1.5% |
| Elementary School | 39 | 30.2% |
| Middle School | 30 | 23.3% |
| High School | 44 | 34.1% |
| College / Undergraduate | 3 | 2.3% |
| Graduate / Professional | 3 | 2.3% |
| Total | 129 | 100.0% |
School Enrollment by Age by Funding Source in Jane
Out of a total of 129 students who are enrolled in schools in Jane, 6 (4.7%) attend a private institution, while the remaining 123 (95.3%) are enrolled in public schools. The age group of 35 years and over has the highest likelihood of being enrolled in private schools, with 3 (100.0% in the age bracket) enrolled. Conversely, the age group of 3 to 4 year olds has the lowest likelihood of being enrolled in a private school, with 5 (100.0% in the age bracket) attending a public institution.
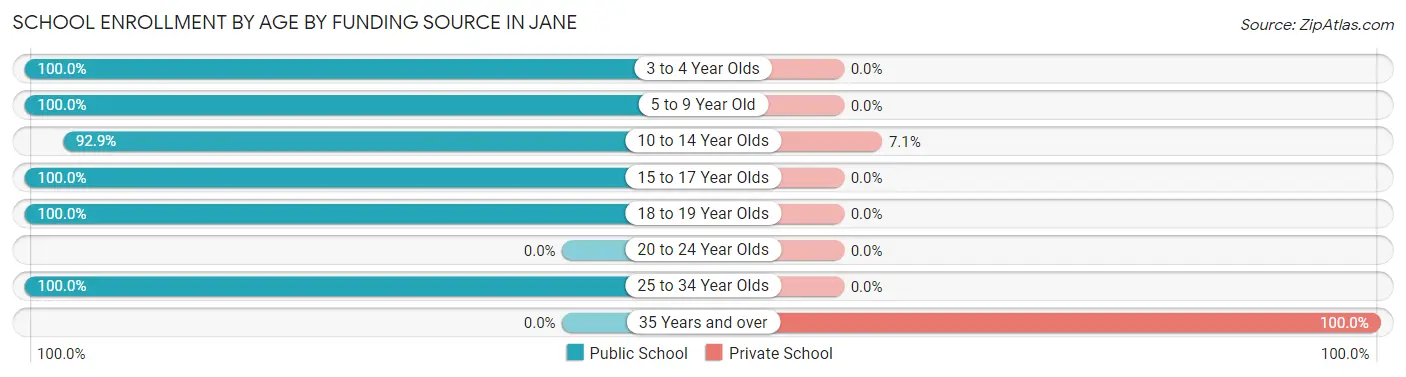
| Age Bracket | Public School | Private School |
| 3 to 4 Year Olds | 5 (100.0%) | 0 (0.0%) |
| 5 to 9 Year Old | 40 (100.0%) | 0 (0.0%) |
| 10 to 14 Year Olds | 39 (92.9%) | 3 (7.1%) |
| 15 to 17 Year Olds | 27 (100.0%) | 0 (0.0%) |
| 18 to 19 Year Olds | 9 (100.0%) | 0 (0.0%) |
| 20 to 24 Year Olds | 0 (0.0%) | 0 (0.0%) |
| 25 to 34 Year Olds | 3 (100.0%) | 0 (0.0%) |
| 35 Years and over | 0 (0.0%) | 3 (100.0%) |
| Total | 123 (95.3%) | 6 (4.7%) |
Educational Attainment by Field of Study in Jane
Business (11 | 36.7%), education (6 | 20.0%), science & technology (4 | 13.3%), computers & mathematics (3 | 10.0%), and social sciences (2 | 6.7%) are the most common fields of study among 30 individuals in Jane who have obtained a bachelor's degree or higher.
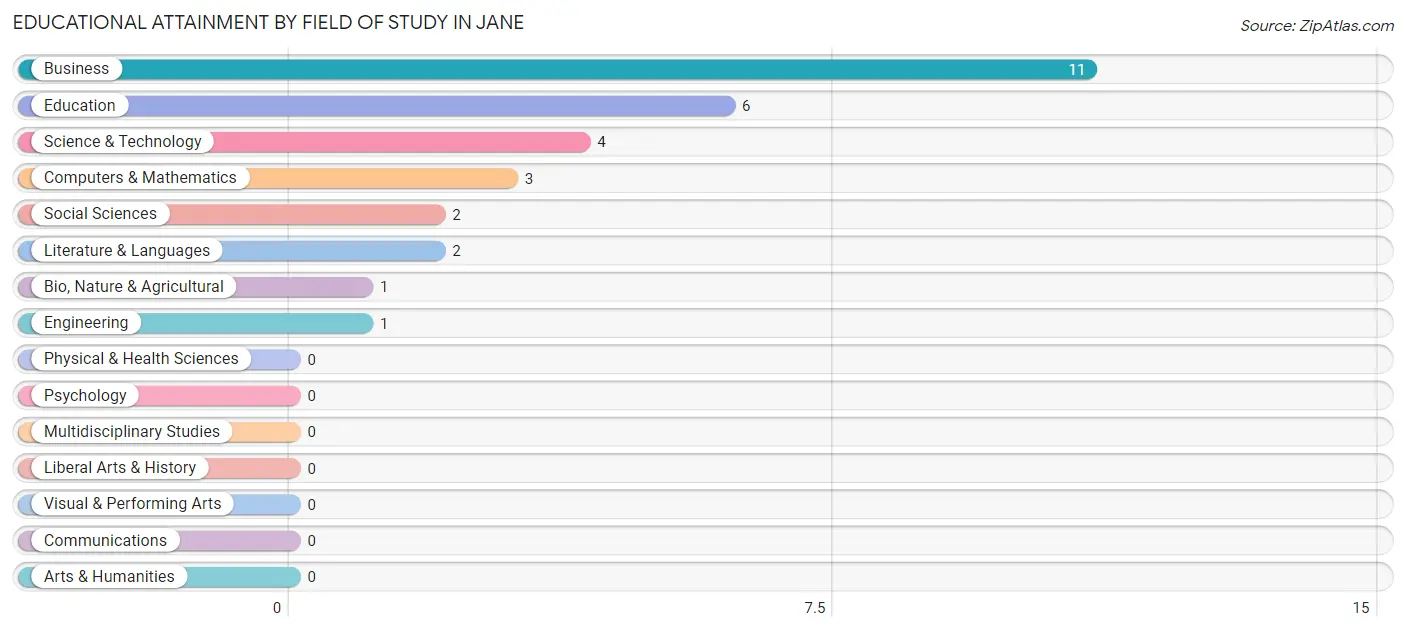
| Field of Study | # Graduates | % Graduates |
| Computers & Mathematics | 3 | 10.0% |
| Bio, Nature & Agricultural | 1 | 3.3% |
| Physical & Health Sciences | 0 | 0.0% |
| Psychology | 0 | 0.0% |
| Social Sciences | 2 | 6.7% |
| Engineering | 1 | 3.3% |
| Multidisciplinary Studies | 0 | 0.0% |
| Science & Technology | 4 | 13.3% |
| Business | 11 | 36.7% |
| Education | 6 | 20.0% |
| Literature & Languages | 2 | 6.7% |
| Liberal Arts & History | 0 | 0.0% |
| Visual & Performing Arts | 0 | 0.0% |
| Communications | 0 | 0.0% |
| Arts & Humanities | 0 | 0.0% |
| Total | 30 | 100.0% |
Transportation & Commute in Jane
Vehicle Availability by Sex in Jane
The most prevalent vehicle ownership categories in Jane are males with 2 vehicles (71, accounting for 53.0%) and females with 2 vehicles (60, making up 66.4%).
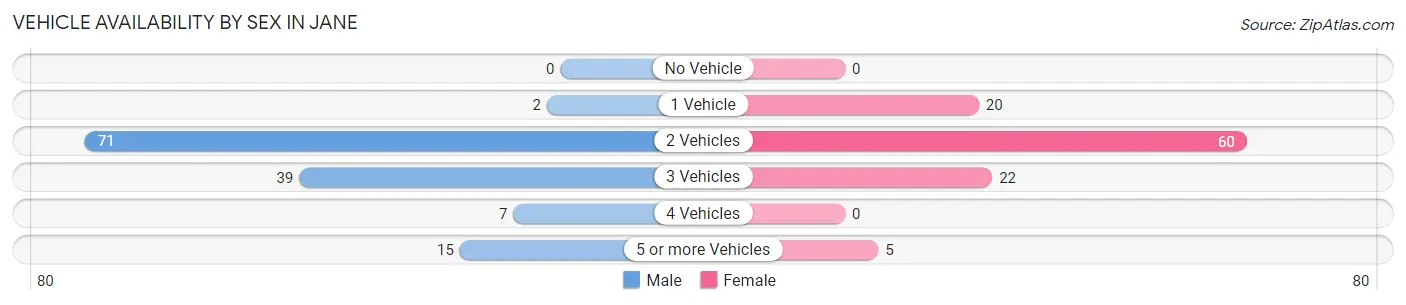
| Vehicles Available | Male | Female |
| No Vehicle | 0 (0.0%) | 0 (0.0%) |
| 1 Vehicle | 2 (1.5%) | 20 (18.7%) |
| 2 Vehicles | 71 (53.0%) | 60 (56.1%) |
| 3 Vehicles | 39 (29.1%) | 22 (20.6%) |
| 4 Vehicles | 7 (5.2%) | 0 (0.0%) |
| 5 or more Vehicles | 15 (11.2%) | 5 (4.7%) |
| Total | 134 (100.0%) | 107 (100.0%) |
Commute Time in Jane
The most frequently occuring commute durations in Jane are 30 to 34 minutes (52 commuters, 23.2%), 10 to 14 minutes (30 commuters, 13.4%), and 5 to 9 minutes (25 commuters, 11.2%).
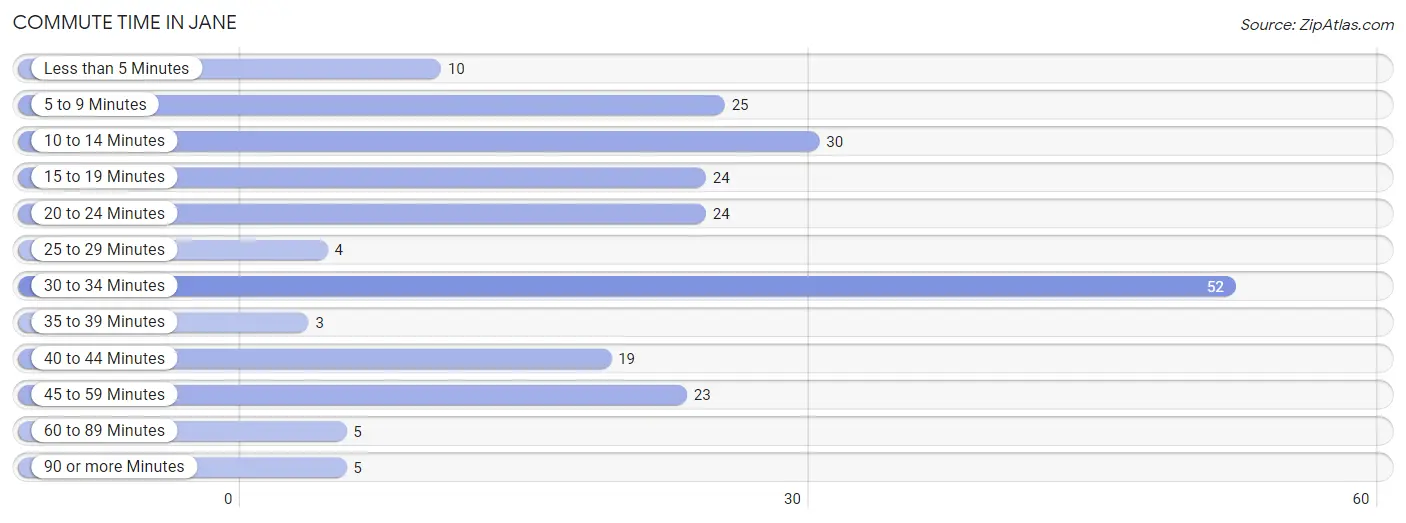
| Commute Time | # Commuters | % Commuters |
| Less than 5 Minutes | 10 | 4.5% |
| 5 to 9 Minutes | 25 | 11.2% |
| 10 to 14 Minutes | 30 | 13.4% |
| 15 to 19 Minutes | 24 | 10.7% |
| 20 to 24 Minutes | 24 | 10.7% |
| 25 to 29 Minutes | 4 | 1.8% |
| 30 to 34 Minutes | 52 | 23.2% |
| 35 to 39 Minutes | 3 | 1.3% |
| 40 to 44 Minutes | 19 | 8.5% |
| 45 to 59 Minutes | 23 | 10.3% |
| 60 to 89 Minutes | 5 | 2.2% |
| 90 or more Minutes | 5 | 2.2% |
Commute Time by Sex in Jane
The most common commute times in Jane are 30 to 34 minutes (35 commuters, 26.1%) for males and 15 to 19 minutes (17 commuters, 18.9%) for females.
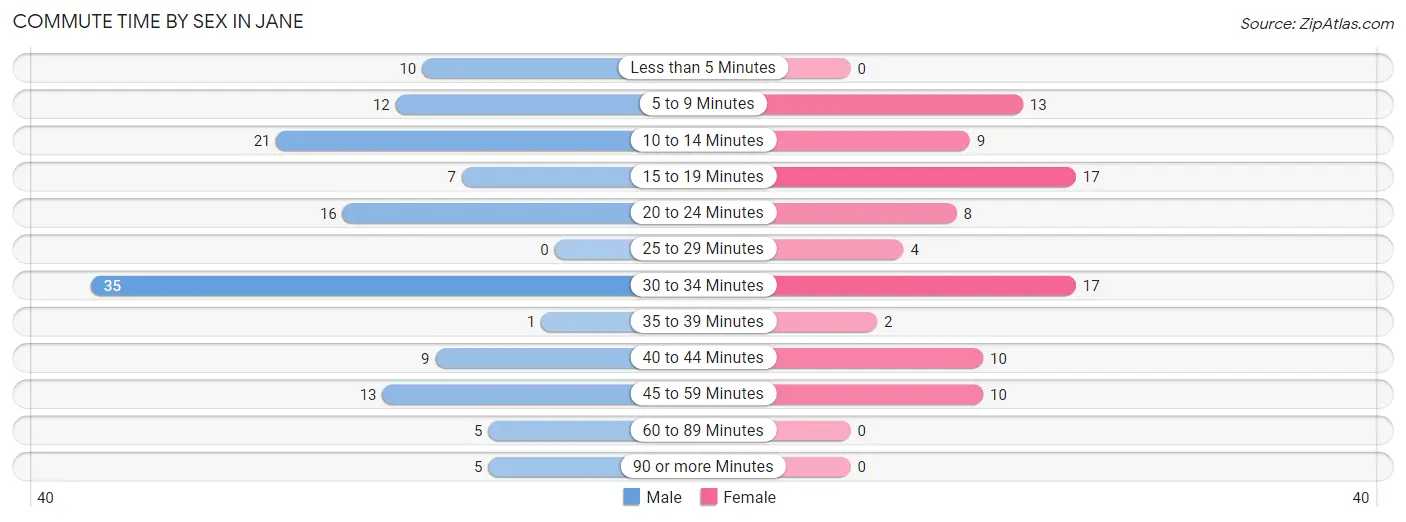
| Commute Time | Male | Female |
| Less than 5 Minutes | 10 (7.5%) | 0 (0.0%) |
| 5 to 9 Minutes | 12 (9.0%) | 13 (14.4%) |
| 10 to 14 Minutes | 21 (15.7%) | 9 (10.0%) |
| 15 to 19 Minutes | 7 (5.2%) | 17 (18.9%) |
| 20 to 24 Minutes | 16 (11.9%) | 8 (8.9%) |
| 25 to 29 Minutes | 0 (0.0%) | 4 (4.4%) |
| 30 to 34 Minutes | 35 (26.1%) | 17 (18.9%) |
| 35 to 39 Minutes | 1 (0.7%) | 2 (2.2%) |
| 40 to 44 Minutes | 9 (6.7%) | 10 (11.1%) |
| 45 to 59 Minutes | 13 (9.7%) | 10 (11.1%) |
| 60 to 89 Minutes | 5 (3.7%) | 0 (0.0%) |
| 90 or more Minutes | 5 (3.7%) | 0 (0.0%) |
Time of Departure to Work by Sex in Jane
The most frequent times of departure to work in Jane are 7:00 AM to 7:29 AM (32, 23.9%) for males and 7:30 AM to 7:59 AM (25, 27.8%) for females.
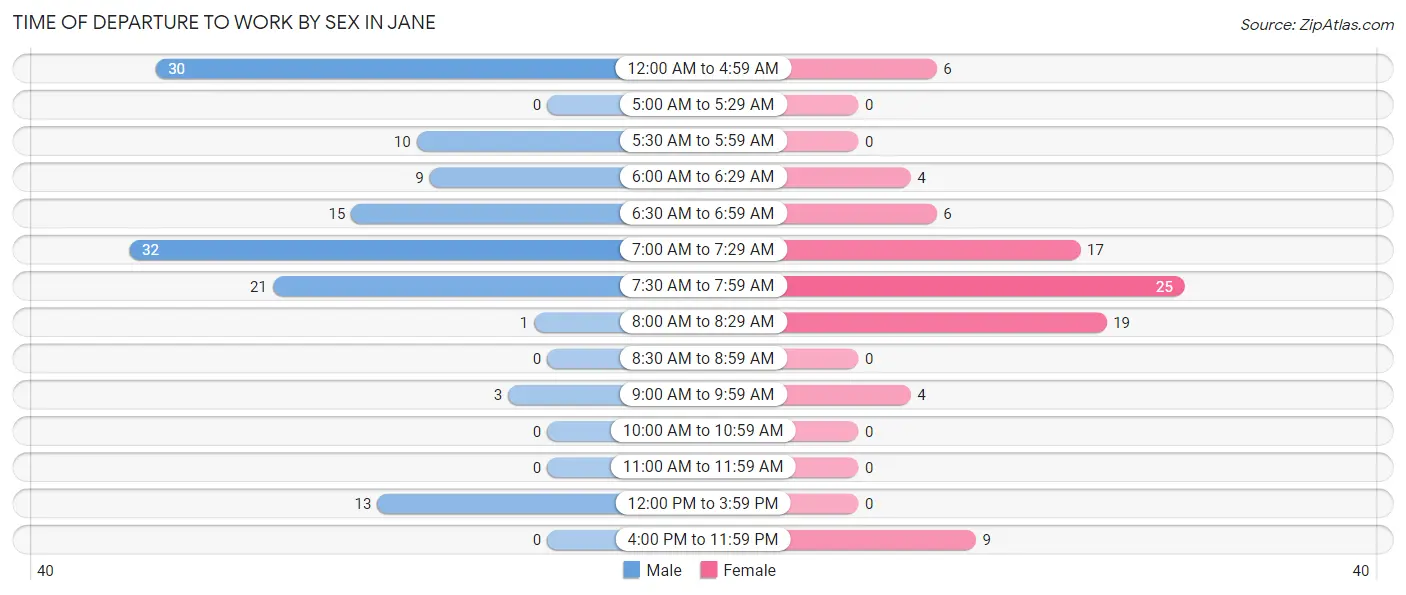
| Time of Departure | Male | Female |
| 12:00 AM to 4:59 AM | 30 (22.4%) | 6 (6.7%) |
| 5:00 AM to 5:29 AM | 0 (0.0%) | 0 (0.0%) |
| 5:30 AM to 5:59 AM | 10 (7.5%) | 0 (0.0%) |
| 6:00 AM to 6:29 AM | 9 (6.7%) | 4 (4.4%) |
| 6:30 AM to 6:59 AM | 15 (11.2%) | 6 (6.7%) |
| 7:00 AM to 7:29 AM | 32 (23.9%) | 17 (18.9%) |
| 7:30 AM to 7:59 AM | 21 (15.7%) | 25 (27.8%) |
| 8:00 AM to 8:29 AM | 1 (0.7%) | 19 (21.1%) |
| 8:30 AM to 8:59 AM | 0 (0.0%) | 0 (0.0%) |
| 9:00 AM to 9:59 AM | 3 (2.2%) | 4 (4.4%) |
| 10:00 AM to 10:59 AM | 0 (0.0%) | 0 (0.0%) |
| 11:00 AM to 11:59 AM | 0 (0.0%) | 0 (0.0%) |
| 12:00 PM to 3:59 PM | 13 (9.7%) | 0 (0.0%) |
| 4:00 PM to 11:59 PM | 0 (0.0%) | 9 (10.0%) |
| Total | 134 (100.0%) | 90 (100.0%) |
Housing Occupancy in Jane
Occupancy by Ownership in Jane
Of the total 158 dwellings in Jane, owner-occupied units account for 101 (63.9%), while renter-occupied units make up 57 (36.1%).
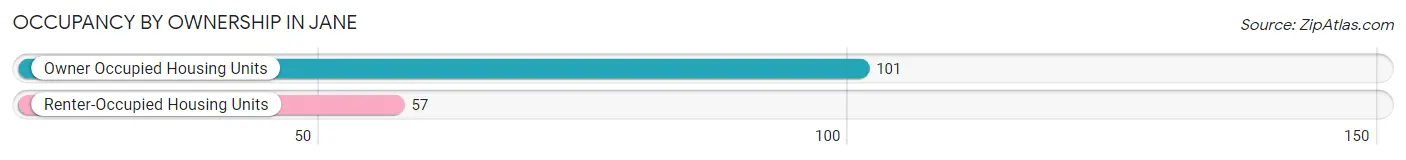
| Occupancy | # Housing Units | % Housing Units |
| Owner Occupied Housing Units | 101 | 63.9% |
| Renter-Occupied Housing Units | 57 | 36.1% |
| Total Occupied Housing Units | 158 | 100.0% |
Occupancy by Household Size in Jane
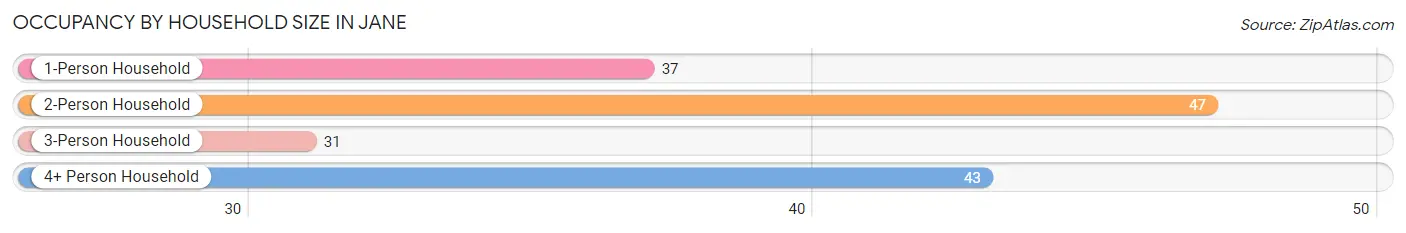
| Household Size | # Housing Units | % Housing Units |
| 1-Person Household | 37 | 23.4% |
| 2-Person Household | 47 | 29.7% |
| 3-Person Household | 31 | 19.6% |
| 4+ Person Household | 43 | 27.2% |
| Total Housing Units | 158 | 100.0% |
Occupancy by Ownership by Household Size in Jane
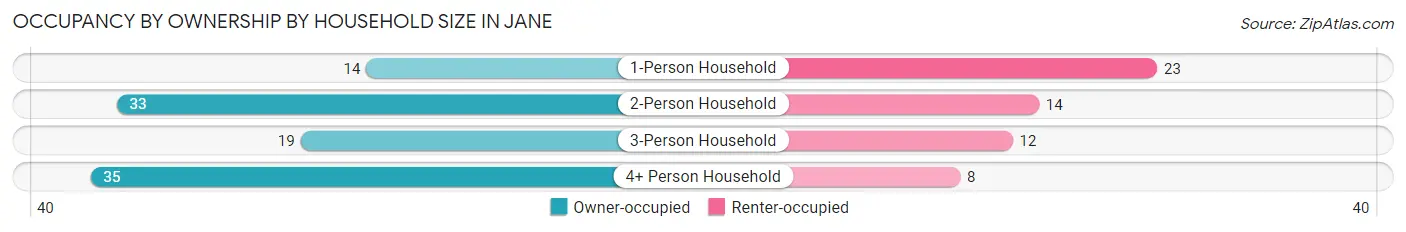
| Household Size | Owner-occupied | Renter-occupied |
| 1-Person Household | 14 (37.8%) | 23 (62.2%) |
| 2-Person Household | 33 (70.2%) | 14 (29.8%) |
| 3-Person Household | 19 (61.3%) | 12 (38.7%) |
| 4+ Person Household | 35 (81.4%) | 8 (18.6%) |
| Total Housing Units | 101 (63.9%) | 57 (36.1%) |
Occupancy by Educational Attainment in Jane
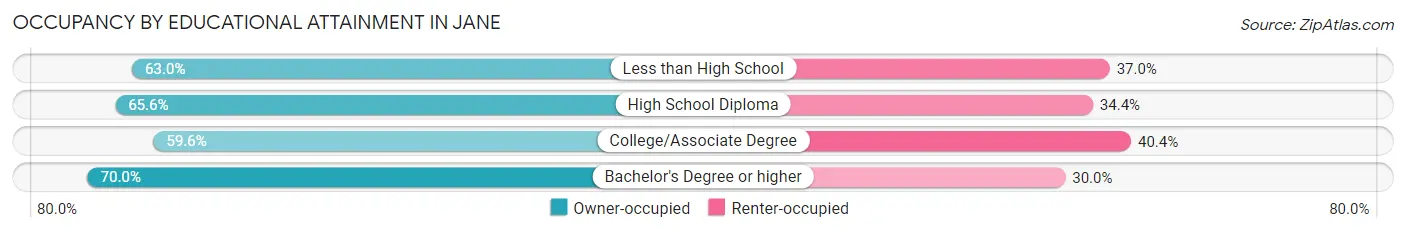
| Household Size | Owner-occupied | Renter-occupied |
| Less than High School | 17 (63.0%) | 10 (37.0%) |
| High School Diploma | 42 (65.6%) | 22 (34.4%) |
| College/Associate Degree | 28 (59.6%) | 19 (40.4%) |
| Bachelor's Degree or higher | 14 (70.0%) | 6 (30.0%) |
Occupancy by Age of Householder in Jane
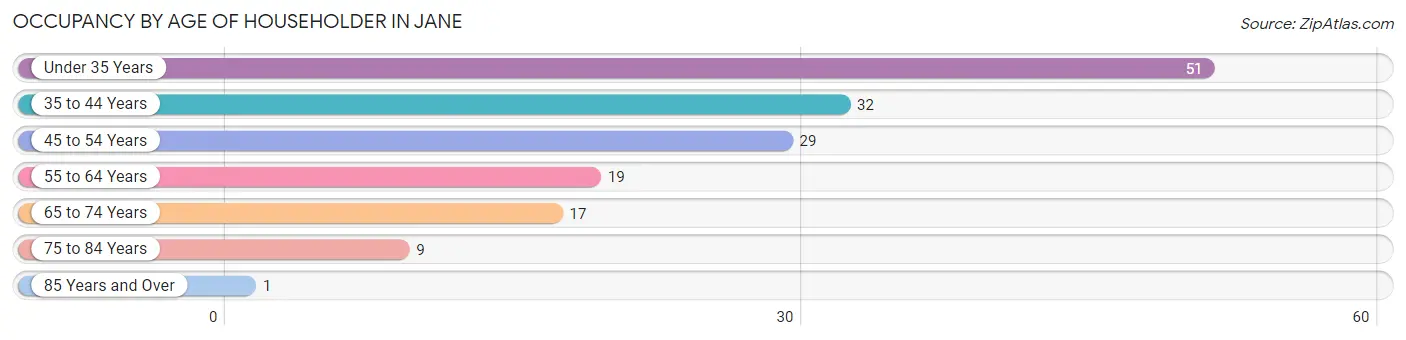
| Age Bracket | # Households | % Households |
| Under 35 Years | 51 | 32.3% |
| 35 to 44 Years | 32 | 20.3% |
| 45 to 54 Years | 29 | 18.3% |
| 55 to 64 Years | 19 | 12.0% |
| 65 to 74 Years | 17 | 10.8% |
| 75 to 84 Years | 9 | 5.7% |
| 85 Years and Over | 1 | 0.6% |
| Total | 158 | 100.0% |
Housing Finances in Jane
Median Income by Occupancy in Jane
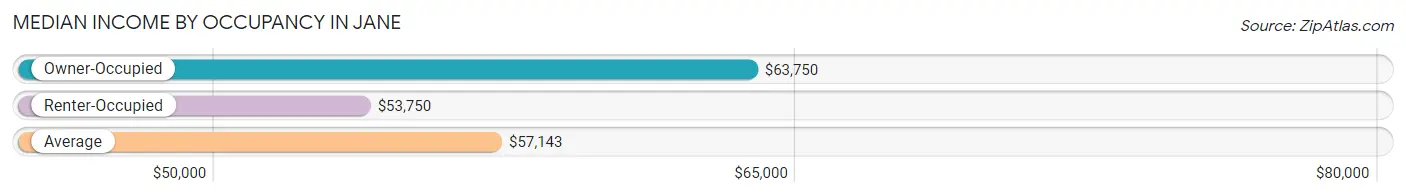
| Occupancy Type | # Households | Median Income |
| Owner-Occupied | 101 (63.9%) | $63,750 |
| Renter-Occupied | 57 (36.1%) | $53,750 |
| Average | 158 (100.0%) | $57,143 |
Occupancy by Householder Income Bracket in Jane
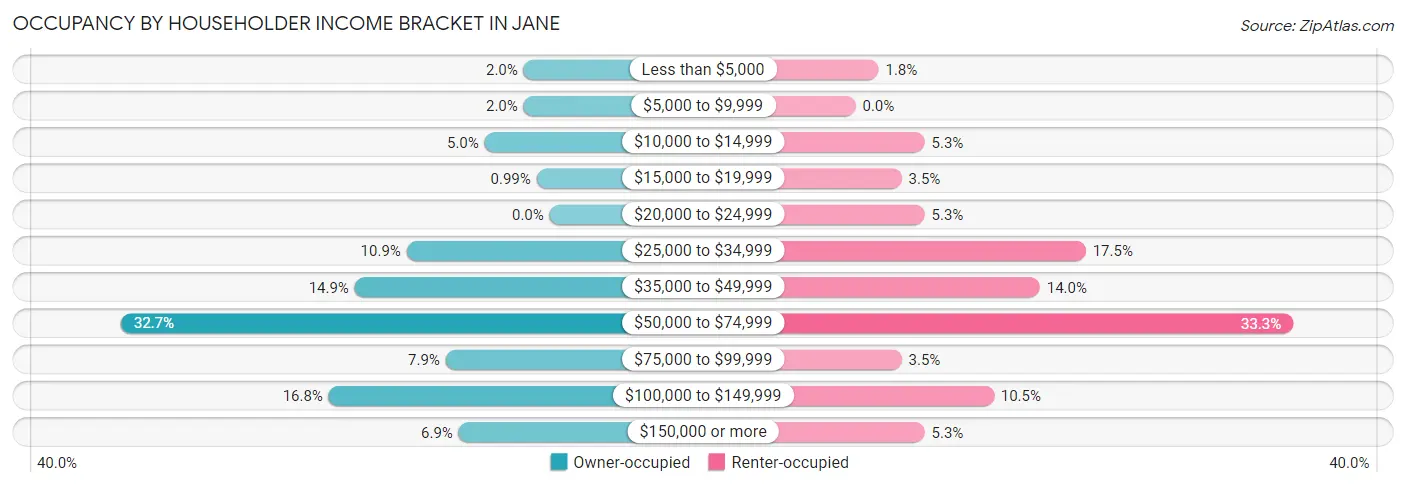
| Income Bracket | Owner-occupied | Renter-occupied |
| Less than $5,000 | 2 (2.0%) | 1 (1.8%) |
| $5,000 to $9,999 | 2 (2.0%) | 0 (0.0%) |
| $10,000 to $14,999 | 5 (5.0%) | 3 (5.3%) |
| $15,000 to $19,999 | 1 (1.0%) | 2 (3.5%) |
| $20,000 to $24,999 | 0 (0.0%) | 3 (5.3%) |
| $25,000 to $34,999 | 11 (10.9%) | 10 (17.5%) |
| $35,000 to $49,999 | 15 (14.8%) | 8 (14.0%) |
| $50,000 to $74,999 | 33 (32.7%) | 19 (33.3%) |
| $75,000 to $99,999 | 8 (7.9%) | 2 (3.5%) |
| $100,000 to $149,999 | 17 (16.8%) | 6 (10.5%) |
| $150,000 or more | 7 (6.9%) | 3 (5.3%) |
| Total | 101 (100.0%) | 57 (100.0%) |
Monthly Housing Cost Tiers in Jane
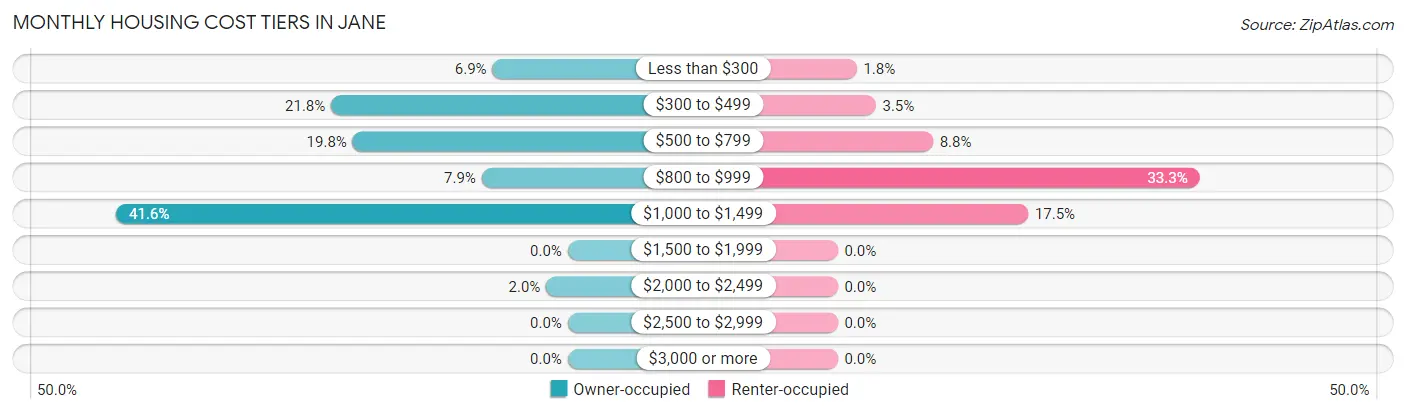
| Monthly Cost | Owner-occupied | Renter-occupied |
| Less than $300 | 7 (6.9%) | 1 (1.8%) |
| $300 to $499 | 22 (21.8%) | 2 (3.5%) |
| $500 to $799 | 20 (19.8%) | 5 (8.8%) |
| $800 to $999 | 8 (7.9%) | 19 (33.3%) |
| $1,000 to $1,499 | 42 (41.6%) | 10 (17.5%) |
| $1,500 to $1,999 | 0 (0.0%) | 0 (0.0%) |
| $2,000 to $2,499 | 2 (2.0%) | 0 (0.0%) |
| $2,500 to $2,999 | 0 (0.0%) | 0 (0.0%) |
| $3,000 or more | 0 (0.0%) | 0 (0.0%) |
| Total | 101 (100.0%) | 57 (100.0%) |
Physical Housing Characteristics in Jane
Housing Structures in Jane
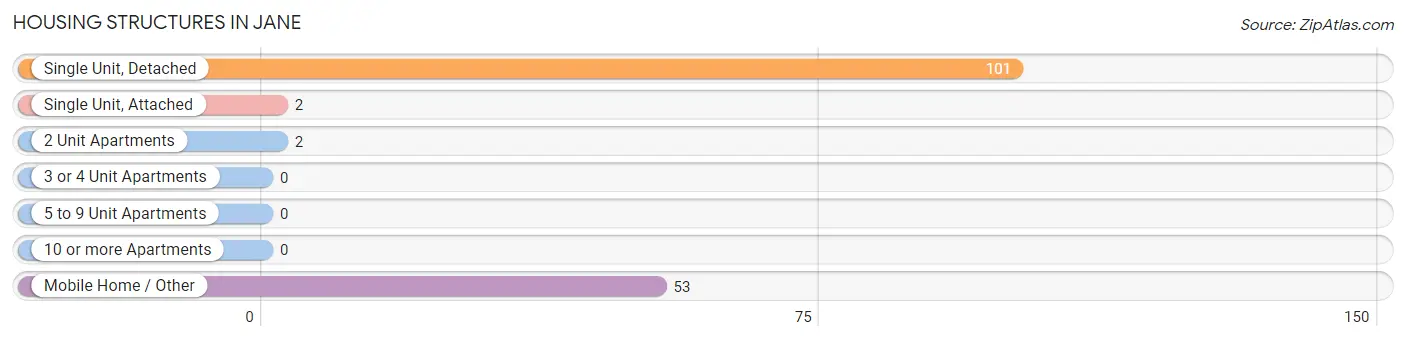
| Structure Type | # Housing Units | % Housing Units |
| Single Unit, Detached | 101 | 63.9% |
| Single Unit, Attached | 2 | 1.3% |
| 2 Unit Apartments | 2 | 1.3% |
| 3 or 4 Unit Apartments | 0 | 0.0% |
| 5 to 9 Unit Apartments | 0 | 0.0% |
| 10 or more Apartments | 0 | 0.0% |
| Mobile Home / Other | 53 | 33.5% |
| Total | 158 | 100.0% |
Housing Structures by Occupancy in Jane
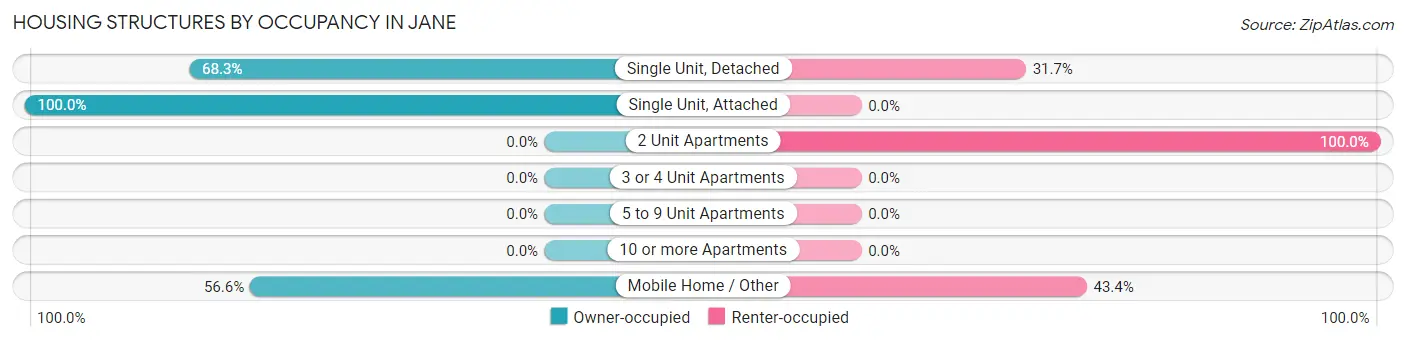
| Structure Type | Owner-occupied | Renter-occupied |
| Single Unit, Detached | 69 (68.3%) | 32 (31.7%) |
| Single Unit, Attached | 2 (100.0%) | 0 (0.0%) |
| 2 Unit Apartments | 0 (0.0%) | 2 (100.0%) |
| 3 or 4 Unit Apartments | 0 (0.0%) | 0 (0.0%) |
| 5 to 9 Unit Apartments | 0 (0.0%) | 0 (0.0%) |
| 10 or more Apartments | 0 (0.0%) | 0 (0.0%) |
| Mobile Home / Other | 30 (56.6%) | 23 (43.4%) |
| Total | 101 (63.9%) | 57 (36.1%) |
Housing Structures by Number of Rooms in Jane
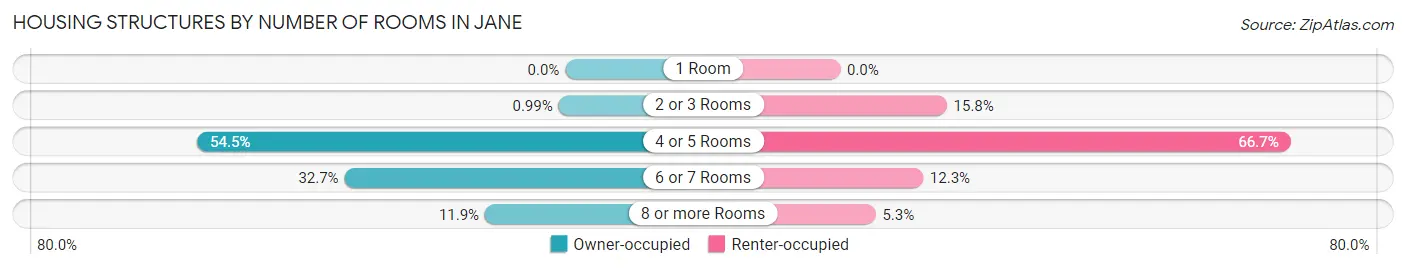
| Number of Rooms | Owner-occupied | Renter-occupied |
| 1 Room | 0 (0.0%) | 0 (0.0%) |
| 2 or 3 Rooms | 1 (1.0%) | 9 (15.8%) |
| 4 or 5 Rooms | 55 (54.5%) | 38 (66.7%) |
| 6 or 7 Rooms | 33 (32.7%) | 7 (12.3%) |
| 8 or more Rooms | 12 (11.9%) | 3 (5.3%) |
| Total | 101 (100.0%) | 57 (100.0%) |
Housing Structure by Heating Type in Jane
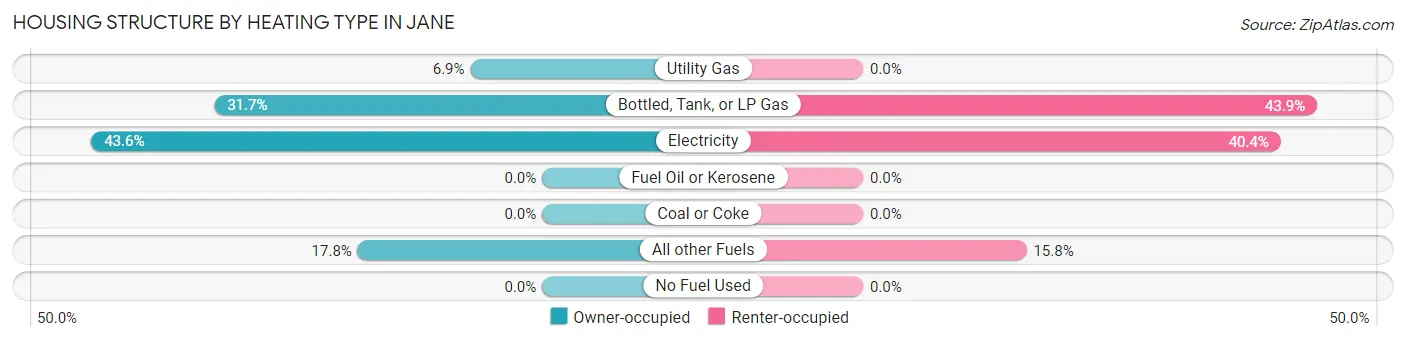
| Heating Type | Owner-occupied | Renter-occupied |
| Utility Gas | 7 (6.9%) | 0 (0.0%) |
| Bottled, Tank, or LP Gas | 32 (31.7%) | 25 (43.9%) |
| Electricity | 44 (43.6%) | 23 (40.4%) |
| Fuel Oil or Kerosene | 0 (0.0%) | 0 (0.0%) |
| Coal or Coke | 0 (0.0%) | 0 (0.0%) |
| All other Fuels | 18 (17.8%) | 9 (15.8%) |
| No Fuel Used | 0 (0.0%) | 0 (0.0%) |
| Total | 101 (100.0%) | 57 (100.0%) |
Household Vehicle Usage in Jane
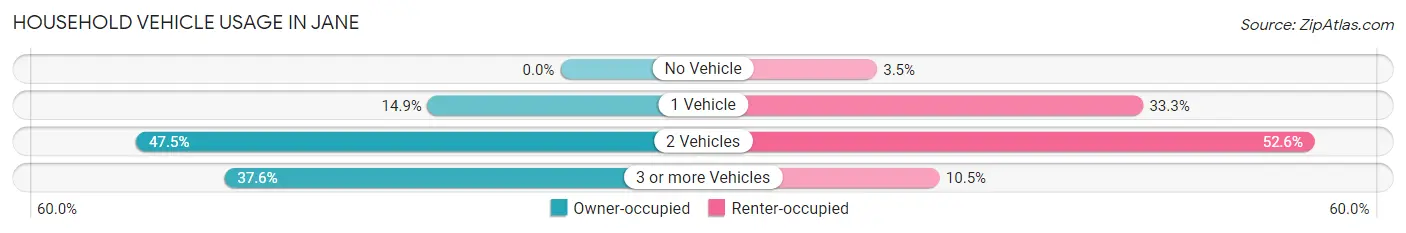
| Vehicles per Household | Owner-occupied | Renter-occupied |
| No Vehicle | 0 (0.0%) | 2 (3.5%) |
| 1 Vehicle | 15 (14.8%) | 19 (33.3%) |
| 2 Vehicles | 48 (47.5%) | 30 (52.6%) |
| 3 or more Vehicles | 38 (37.6%) | 6 (10.5%) |
| Total | 101 (100.0%) | 57 (100.0%) |
Real Estate & Mortgages in Jane
Real Estate and Mortgage Overview in Jane
| Characteristic | Without Mortgage | With Mortgage |
| Housing Units | 47 | 54 |
| Median Property Value | $187,500 | $146,400 |
| Median Household Income | $45,625 | $2 |
| Monthly Housing Costs | $475 | $0 |
| Real Estate Taxes | $1,088 | $7 |
Property Value by Mortgage Status in Jane
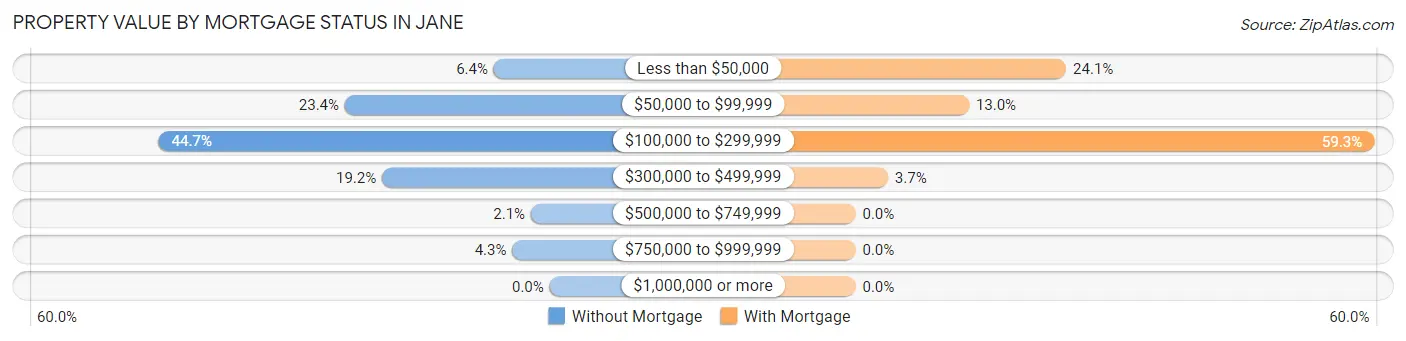
| Property Value | Without Mortgage | With Mortgage |
| Less than $50,000 | 3 (6.4%) | 13 (24.1%) |
| $50,000 to $99,999 | 11 (23.4%) | 7 (13.0%) |
| $100,000 to $299,999 | 21 (44.7%) | 32 (59.3%) |
| $300,000 to $499,999 | 9 (19.2%) | 2 (3.7%) |
| $500,000 to $749,999 | 1 (2.1%) | 0 (0.0%) |
| $750,000 to $999,999 | 2 (4.3%) | 0 (0.0%) |
| $1,000,000 or more | 0 (0.0%) | 0 (0.0%) |
| Total | 47 (100.0%) | 54 (100.0%) |
Household Income by Mortgage Status in Jane
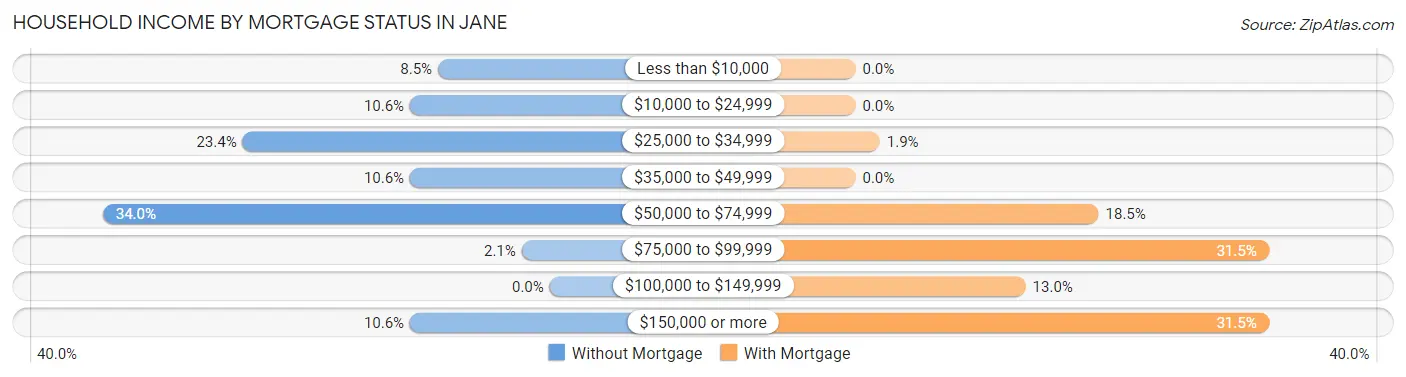
| Household Income | Without Mortgage | With Mortgage |
| Less than $10,000 | 4 (8.5%) | 0 (0.0%) |
| $10,000 to $24,999 | 5 (10.6%) | 0 (0.0%) |
| $25,000 to $34,999 | 11 (23.4%) | 1 (1.8%) |
| $35,000 to $49,999 | 5 (10.6%) | 0 (0.0%) |
| $50,000 to $74,999 | 16 (34.0%) | 10 (18.5%) |
| $75,000 to $99,999 | 1 (2.1%) | 17 (31.5%) |
| $100,000 to $149,999 | 0 (0.0%) | 7 (13.0%) |
| $150,000 or more | 5 (10.6%) | 17 (31.5%) |
| Total | 47 (100.0%) | 54 (100.0%) |
Property Value to Household Income Ratio in Jane
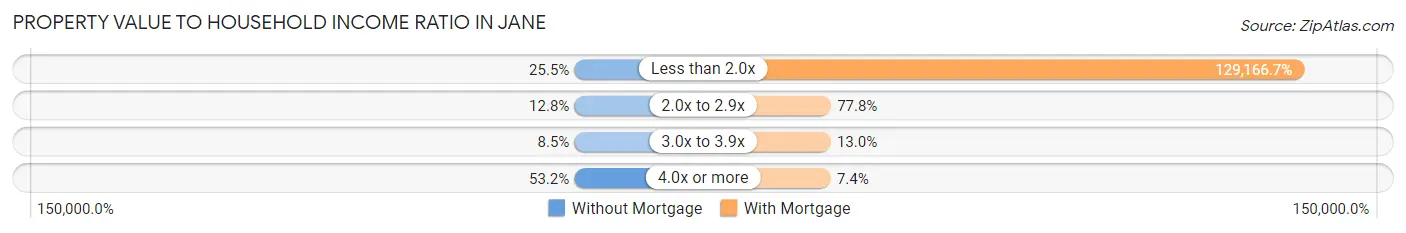
| Value-to-Income Ratio | Without Mortgage | With Mortgage |
| Less than 2.0x | 12 (25.5%) | 69,750 (129,166.7%) |
| 2.0x to 2.9x | 6 (12.8%) | 42 (77.8%) |
| 3.0x to 3.9x | 4 (8.5%) | 7 (13.0%) |
| 4.0x or more | 25 (53.2%) | 4 (7.4%) |
| Total | 47 (100.0%) | 54 (100.0%) |
Real Estate Taxes by Mortgage Status in Jane
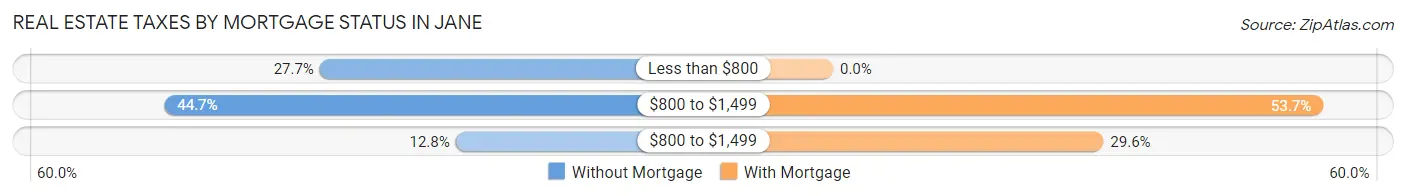
| Property Taxes | Without Mortgage | With Mortgage |
| Less than $800 | 13 (27.7%) | 0 (0.0%) |
| $800 to $1,499 | 21 (44.7%) | 29 (53.7%) |
| $800 to $1,499 | 6 (12.8%) | 16 (29.6%) |
| Total | 47 (100.0%) | 54 (100.0%) |
Health & Disability in Jane
Health Insurance Coverage by Age in Jane
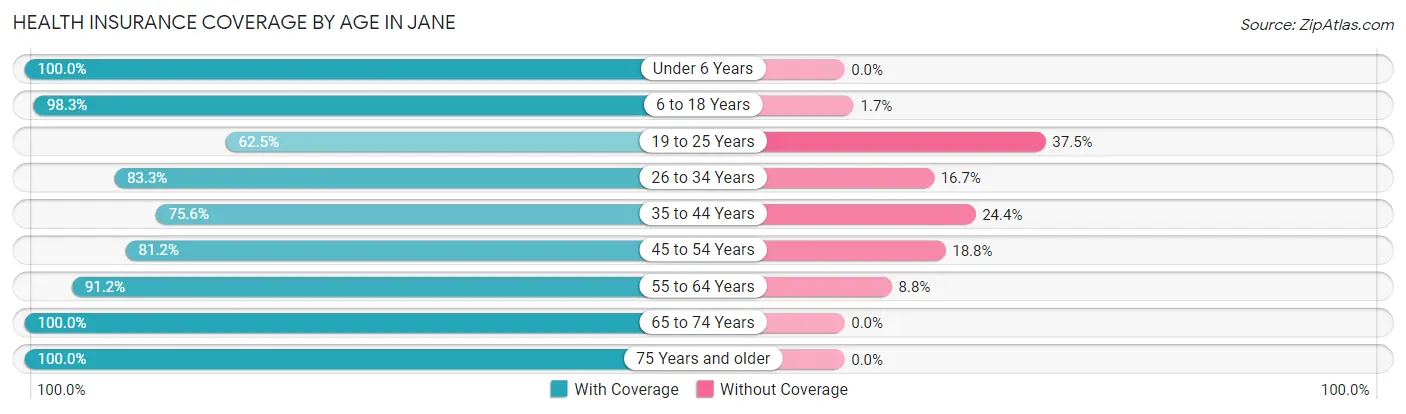
| Age Bracket | With Coverage | Without Coverage |
| Under 6 Years | 67 (100.0%) | 0 (0.0%) |
| 6 to 18 Years | 113 (98.3%) | 2 (1.7%) |
| 19 to 25 Years | 30 (62.5%) | 18 (37.5%) |
| 26 to 34 Years | 60 (83.3%) | 12 (16.7%) |
| 35 to 44 Years | 65 (75.6%) | 21 (24.4%) |
| 45 to 54 Years | 56 (81.2%) | 13 (18.8%) |
| 55 to 64 Years | 31 (91.2%) | 3 (8.8%) |
| 65 to 74 Years | 26 (100.0%) | 0 (0.0%) |
| 75 Years and older | 16 (100.0%) | 0 (0.0%) |
| Total | 464 (87.1%) | 69 (13.0%) |
Health Insurance Coverage by Citizenship Status in Jane
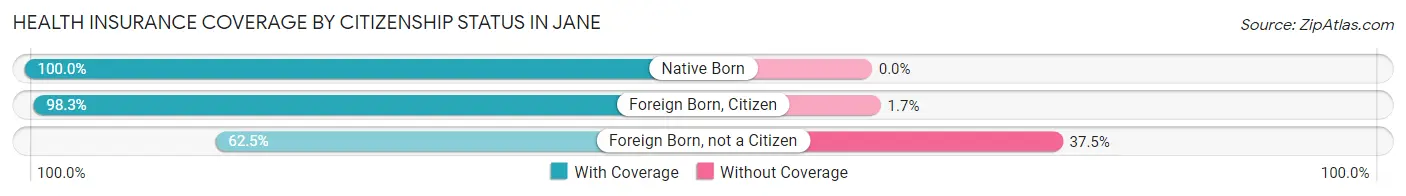
| Citizenship Status | With Coverage | Without Coverage |
| Native Born | 67 (100.0%) | 0 (0.0%) |
| Foreign Born, Citizen | 113 (98.3%) | 2 (1.7%) |
| Foreign Born, not a Citizen | 30 (62.5%) | 18 (37.5%) |
Health Insurance Coverage by Household Income in Jane
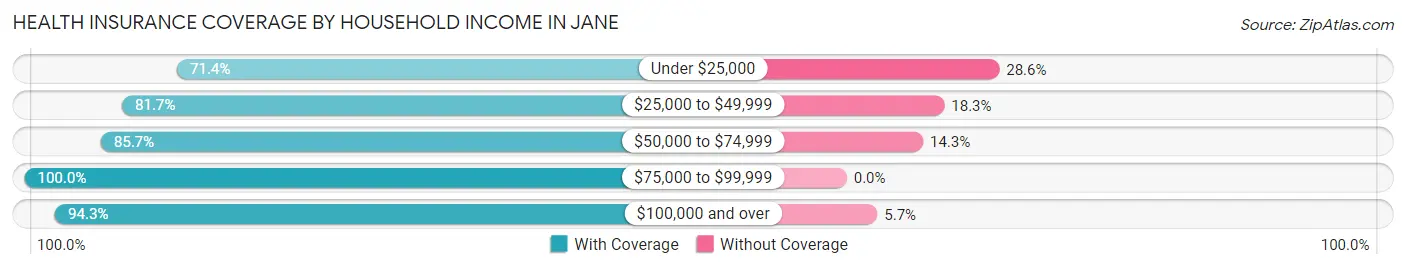
| Household Income | With Coverage | Without Coverage |
| Under $25,000 | 40 (71.4%) | 16 (28.6%) |
| $25,000 to $49,999 | 76 (81.7%) | 17 (18.3%) |
| $50,000 to $74,999 | 162 (85.7%) | 27 (14.3%) |
| $75,000 to $99,999 | 38 (100.0%) | 0 (0.0%) |
| $100,000 and over | 148 (94.3%) | 9 (5.7%) |
Public vs Private Health Insurance Coverage by Age in Jane
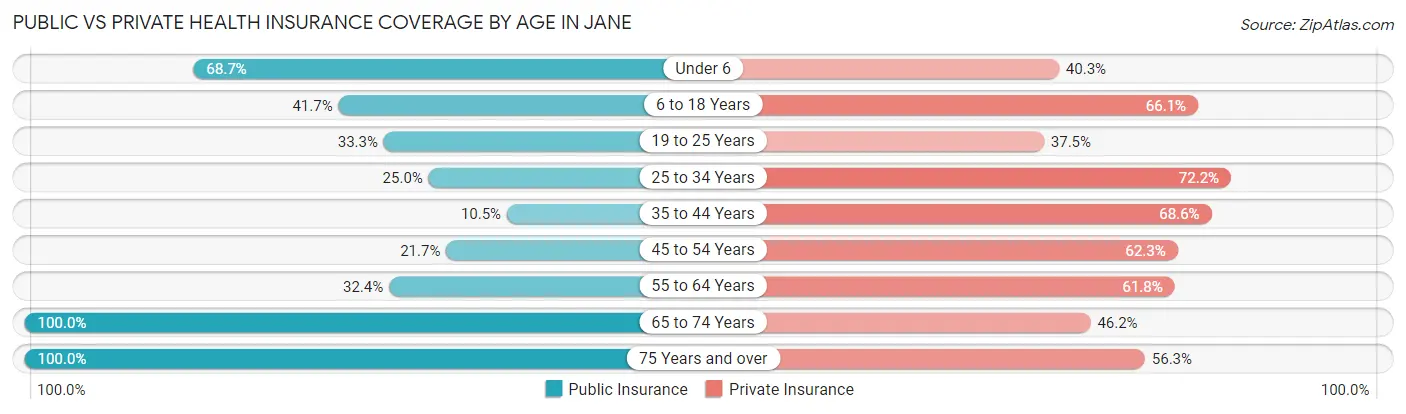
| Age Bracket | Public Insurance | Private Insurance |
| Under 6 | 46 (68.7%) | 27 (40.3%) |
| 6 to 18 Years | 48 (41.7%) | 76 (66.1%) |
| 19 to 25 Years | 16 (33.3%) | 18 (37.5%) |
| 25 to 34 Years | 18 (25.0%) | 52 (72.2%) |
| 35 to 44 Years | 9 (10.5%) | 59 (68.6%) |
| 45 to 54 Years | 15 (21.7%) | 43 (62.3%) |
| 55 to 64 Years | 11 (32.4%) | 21 (61.8%) |
| 65 to 74 Years | 26 (100.0%) | 12 (46.2%) |
| 75 Years and over | 16 (100.0%) | 9 (56.2%) |
| Total | 205 (38.5%) | 317 (59.5%) |
Disability Status by Sex by Age in Jane
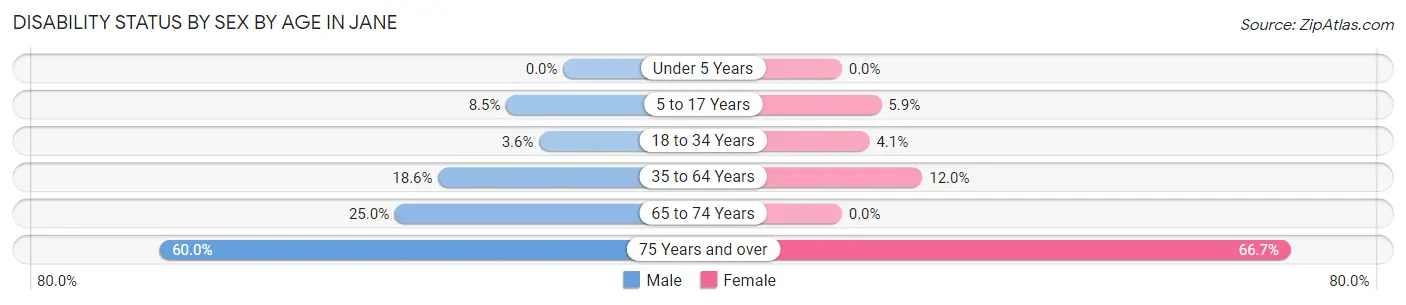
| Age Bracket | Male | Female |
| Under 5 Years | 0 (0.0%) | 0 (0.0%) |
| 5 to 17 Years | 5 (8.5%) | 3 (5.9%) |
| 18 to 34 Years | 2 (3.6%) | 3 (4.1%) |
| 35 to 64 Years | 18 (18.6%) | 11 (12.0%) |
| 65 to 74 Years | 3 (25.0%) | 0 (0.0%) |
| 75 Years and over | 6 (60.0%) | 4 (66.7%) |
Disability Class by Sex by Age in Jane
Disability Class: Hearing Difficulty
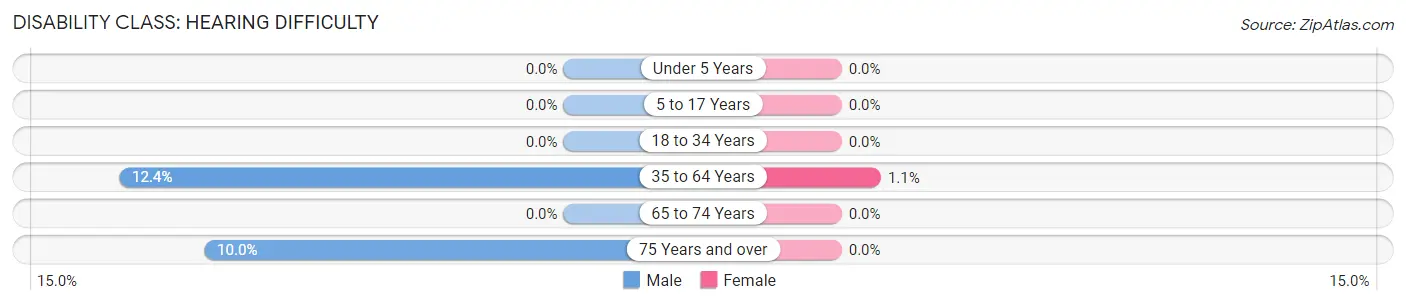
| Age Bracket | Male | Female |
| Under 5 Years | 0 (0.0%) | 0 (0.0%) |
| 5 to 17 Years | 0 (0.0%) | 0 (0.0%) |
| 18 to 34 Years | 0 (0.0%) | 0 (0.0%) |
| 35 to 64 Years | 12 (12.4%) | 1 (1.1%) |
| 65 to 74 Years | 0 (0.0%) | 0 (0.0%) |
| 75 Years and over | 1 (10.0%) | 0 (0.0%) |
Disability Class: Vision Difficulty
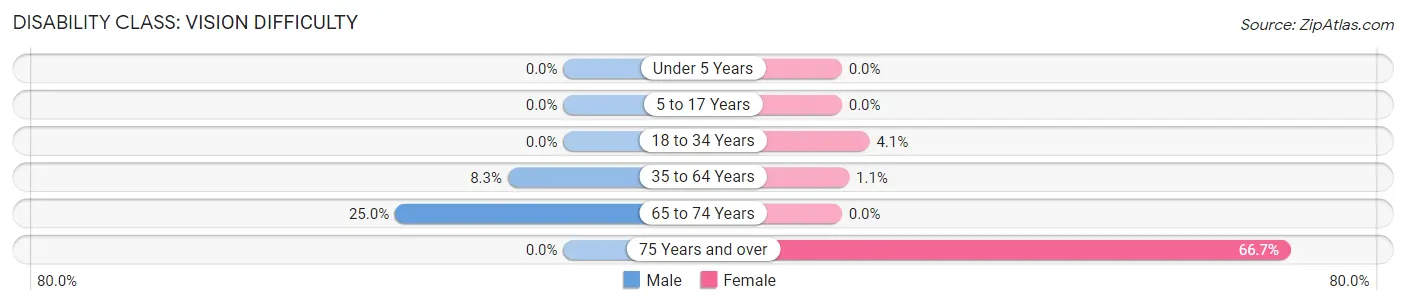
| Age Bracket | Male | Female |
| Under 5 Years | 0 (0.0%) | 0 (0.0%) |
| 5 to 17 Years | 0 (0.0%) | 0 (0.0%) |
| 18 to 34 Years | 0 (0.0%) | 3 (4.1%) |
| 35 to 64 Years | 8 (8.3%) | 1 (1.1%) |
| 65 to 74 Years | 3 (25.0%) | 0 (0.0%) |
| 75 Years and over | 0 (0.0%) | 4 (66.7%) |
Disability Class: Cognitive Difficulty
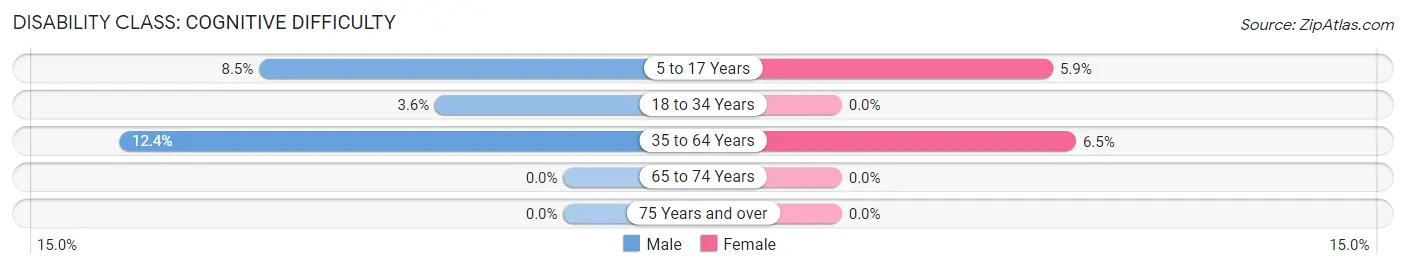
| Age Bracket | Male | Female |
| 5 to 17 Years | 5 (8.5%) | 3 (5.9%) |
| 18 to 34 Years | 2 (3.6%) | 0 (0.0%) |
| 35 to 64 Years | 12 (12.4%) | 6 (6.5%) |
| 65 to 74 Years | 0 (0.0%) | 0 (0.0%) |
| 75 Years and over | 0 (0.0%) | 0 (0.0%) |
Disability Class: Ambulatory Difficulty
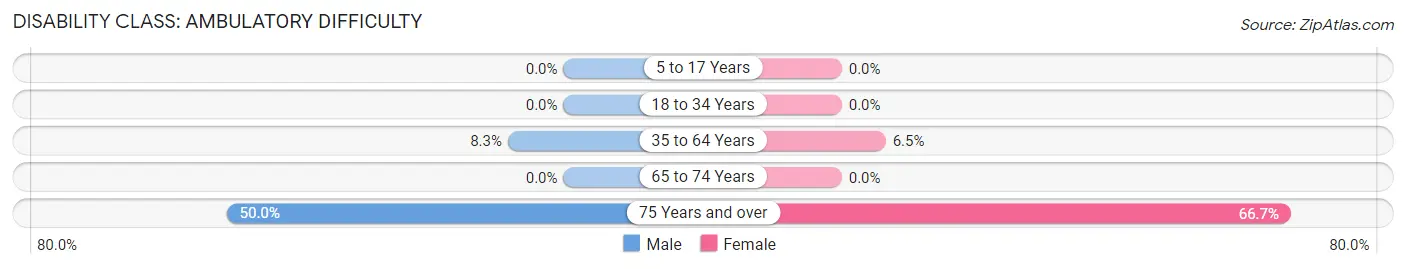
| Age Bracket | Male | Female |
| 5 to 17 Years | 0 (0.0%) | 0 (0.0%) |
| 18 to 34 Years | 0 (0.0%) | 0 (0.0%) |
| 35 to 64 Years | 8 (8.3%) | 6 (6.5%) |
| 65 to 74 Years | 0 (0.0%) | 0 (0.0%) |
| 75 Years and over | 5 (50.0%) | 4 (66.7%) |
Disability Class: Self-Care Difficulty
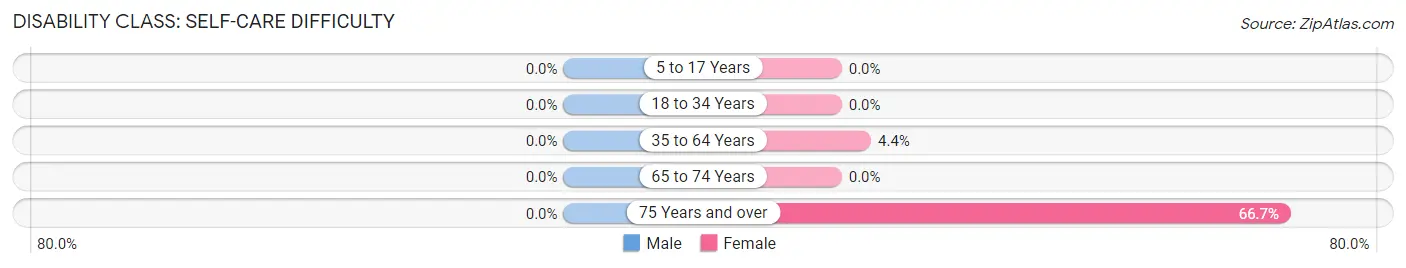
| Age Bracket | Male | Female |
| 5 to 17 Years | 0 (0.0%) | 0 (0.0%) |
| 18 to 34 Years | 0 (0.0%) | 0 (0.0%) |
| 35 to 64 Years | 0 (0.0%) | 4 (4.3%) |
| 65 to 74 Years | 0 (0.0%) | 0 (0.0%) |
| 75 Years and over | 0 (0.0%) | 4 (66.7%) |
Technology Access in Jane
Computing Device Access in Jane
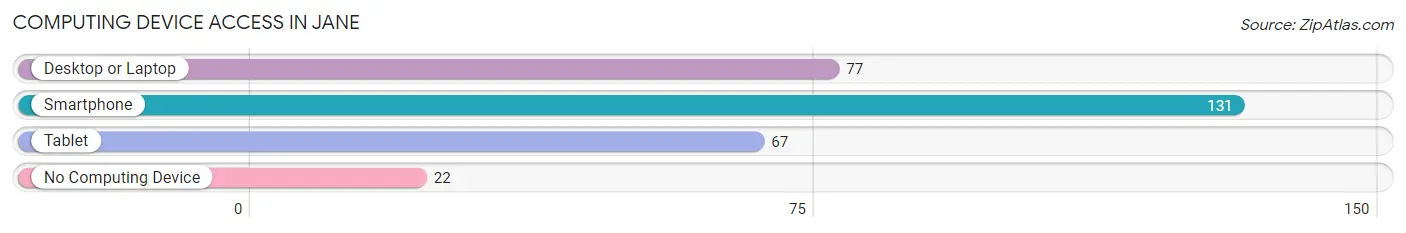
| Device Type | # Households | % Households |
| Desktop or Laptop | 77 | 48.7% |
| Smartphone | 131 | 82.9% |
| Tablet | 67 | 42.4% |
| No Computing Device | 22 | 13.9% |
| Total | 158 | 100.0% |
Internet Access in Jane
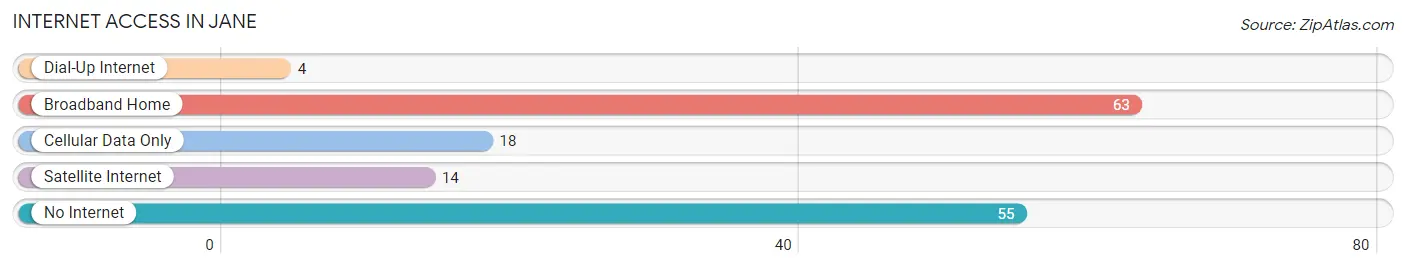
| Internet Type | # Households | % Households |
| Dial-Up Internet | 4 | 2.5% |
| Broadband Home | 63 | 39.9% |
| Cellular Data Only | 18 | 11.4% |
| Satellite Internet | 14 | 8.9% |
| No Internet | 55 | 34.8% |
| Total | 158 | 100.0% |
Jane Summary
History
Jane, Missouri is a small town located in McDonald County, Missouri. The town was founded in 1883 by William and Mary Jane (Henderson) Jane. The town was named after Mary Jane, who was the daughter of a local farmer. The town was originally a farming community, but it soon became a mining town when coal was discovered in the area. The coal mines provided jobs for many of the town’s residents and helped to fuel the local economy.
The town of Jane was incorporated in 1887 and the first mayor was William Jane. The town grew rapidly in the late 19th century and early 20th century, and by the 1920s it had a population of over 1,000 people. The town was home to several businesses, including a bank, a hotel, a general store, and a movie theater.
Geography
Jane is located in the Ozark Mountains of southwest Missouri. The town is situated in a valley between two hills, and the surrounding area is mostly forested. The town is located about 25 miles south of the city of Joplin, Missouri.
The climate in Jane is humid subtropical, with hot summers and mild winters. The average annual temperature is around 60 degrees Fahrenheit, and the average annual precipitation is around 40 inches.
Economy
The economy of Jane is largely based on agriculture and tourism. The town is home to several farms, and the surrounding area is known for its cattle and dairy farms. The town is also home to several tourist attractions, including a historic downtown area, a museum, and a golf course.
The town is also home to several small businesses, including restaurants, shops, and a movie theater. The town is also home to a few manufacturing companies, including a furniture factory and a plastics factory.
Demographics
As of the 2010 census, the population of Jane was 1,845. The racial makeup of the town was 97.3% White, 0.7% African American, 0.3% Native American, 0.2% Asian, 0.1% Pacific Islander, and 1.4% from other races. The median household income was $31,250, and the median family income was $37,500.
The town is home to several churches, including the First Baptist Church, the First United Methodist Church, and the Church of Christ. The town is also home to a public library and a community center.
Conclusion
Jane, Missouri is a small town located in McDonald County, Missouri. The town was founded in 1883 and was originally a farming community. The town later became a mining town when coal was discovered in the area. The town is now largely based on agriculture and tourism, and it is home to several small businesses, churches, and tourist attractions. The population of Jane was 1,845 as of the 2010 census, and the median household income was $31,250.
Common Questions
What is Per Capita Income in Jane?
Per Capita income in Jane is $21,684.
What is the Median Family Income in Jane?
Median Family Income in Jane is $65,750.
What is the Median Household income in Jane?
Median Household Income in Jane is $57,143.
What is Income or Wage Gap in Jane?
Income or Wage Gap in Jane is 10.2%.
Women in Jane earn 89.8 cents for every dollar earned by a man.
What is Inequality or Gini Index in Jane?
Inequality or Gini Index in Jane is 0.36.
What is the Total Population of Jane?
Total Population of Jane is 535.
What is the Total Male Population of Jane?
Total Male Population of Jane is 258.
What is the Total Female Population of Jane?
Total Female Population of Jane is 277.
What is the Ratio of Males per 100 Females in Jane?
There are 93.14 Males per 100 Females in Jane.
What is the Ratio of Females per 100 Males in Jane?
There are 107.36 Females per 100 Males in Jane.
What is the Median Population Age in Jane?
Median Population Age in Jane is 29.6 Years.
What is the Average Family Size in Jane
Average Family Size in Jane is 4.1 People.
What is the Average Household Size in Jane
Average Household Size in Jane is 3.4 People.
How Large is the Labor Force in Jane?
There are 260 People in the Labor Forcein in Jane.
What is the Percentage of People in the Labor Force in Jane?
67.4% of People are in the Labor Force in Jane.
What is the Unemployment Rate in Jane?
Unemployment Rate in Jane is 6.2%.