Miller, MO Map & Demographics
Miller Map
Miller Overview
$21,872
PER CAPITA INCOME
$60,833
AVG FAMILY INCOME
$45,893
AVG HOUSEHOLD INCOME
31.6%
WAGE / INCOME GAP [ % ]
68.4¢/ $1
WAGE / INCOME GAP [ $ ]
0.45
INEQUALITY / GINI INDEX
727
TOTAL POPULATION
358
MALE POPULATION
369
FEMALE POPULATION
97.02
MALES / 100 FEMALES
103.07
FEMALES / 100 MALES
40.2
MEDIAN AGE
2.7
AVG FAMILY SIZE
2.1
AVG HOUSEHOLD SIZE
314
LABOR FORCE [ PEOPLE ]
51.7%
PERCENT IN LABOR FORCE
6.7%
UNEMPLOYMENT RATE
Miller Zip Codes
Miller Area Codes
Income in Miller
Income Overview in Miller
Per Capita Income in Miller is $21,872, while median incomes of families and households are $60,833 and $45,893 respectively.
| Characteristic | Number | Measure |
| Per Capita Income | 727 | $21,872 |
| Median Family Income | 218 | $60,833 |
| Mean Family Income | 218 | $64,338 |
| Median Household Income | 341 | $45,893 |
| Mean Household Income | 341 | $51,781 |
| Income Deficit | 218 | $0 |
| Wage / Income Gap (%) | 727 | 31.56% |
| Wage / Income Gap ($) | 727 | 68.44¢ per $1 |
| Gini / Inequality Index | 727 | 0.45 |
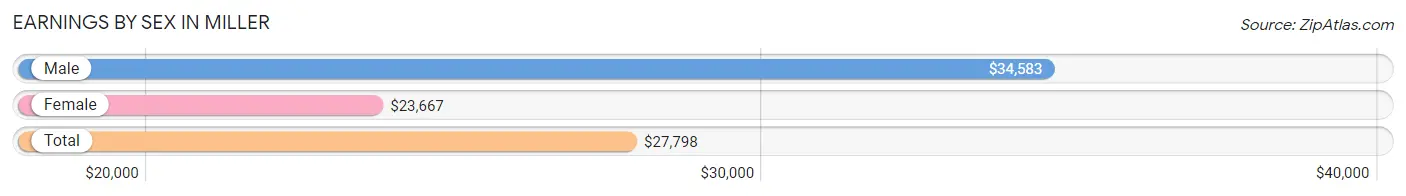
Earnings by Sex in Miller
Average Earnings in Miller are $27,798, $34,583 for men and $23,667 for women, a difference of 31.6%.
| Sex | Number | Average Earnings |
| Male | 155 (46.3%) | $34,583 |
| Female | 180 (53.7%) | $23,667 |
| Total | 335 (100.0%) | $27,798 |
Earnings by Sex by Income Bracket in Miller
The most common earnings brackets in Miller are $45,000 to $49,999 for men (27 | 17.4%) and $50,000 to $54,999 for women (24 | 13.3%).
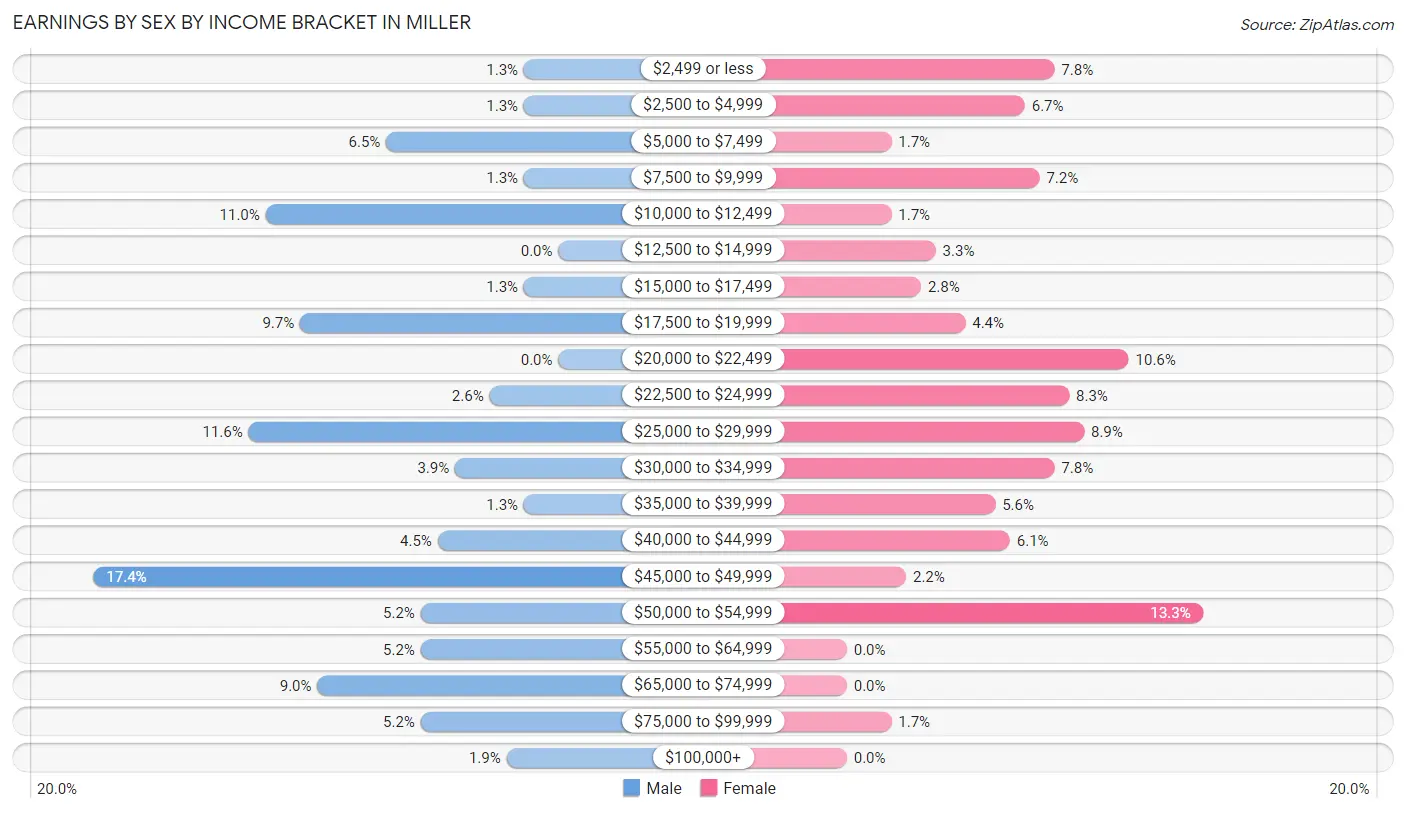
| Income | Male | Female |
| $2,499 or less | 2 (1.3%) | 14 (7.8%) |
| $2,500 to $4,999 | 2 (1.3%) | 12 (6.7%) |
| $5,000 to $7,499 | 10 (6.5%) | 3 (1.7%) |
| $7,500 to $9,999 | 2 (1.3%) | 13 (7.2%) |
| $10,000 to $12,499 | 17 (11.0%) | 3 (1.7%) |
| $12,500 to $14,999 | 0 (0.0%) | 6 (3.3%) |
| $15,000 to $17,499 | 2 (1.3%) | 5 (2.8%) |
| $17,500 to $19,999 | 15 (9.7%) | 8 (4.4%) |
| $20,000 to $22,499 | 0 (0.0%) | 19 (10.6%) |
| $22,500 to $24,999 | 4 (2.6%) | 15 (8.3%) |
| $25,000 to $29,999 | 18 (11.6%) | 16 (8.9%) |
| $30,000 to $34,999 | 6 (3.9%) | 14 (7.8%) |
| $35,000 to $39,999 | 2 (1.3%) | 10 (5.6%) |
| $40,000 to $44,999 | 7 (4.5%) | 11 (6.1%) |
| $45,000 to $49,999 | 27 (17.4%) | 4 (2.2%) |
| $50,000 to $54,999 | 8 (5.2%) | 24 (13.3%) |
| $55,000 to $64,999 | 8 (5.2%) | 0 (0.0%) |
| $65,000 to $74,999 | 14 (9.0%) | 0 (0.0%) |
| $75,000 to $99,999 | 8 (5.2%) | 3 (1.7%) |
| $100,000+ | 3 (1.9%) | 0 (0.0%) |
| Total | 155 (100.0%) | 180 (100.0%) |
Earnings by Sex by Educational Attainment in Miller
Average earnings in Miller are $34,583 for men and $27,813 for women, a difference of 19.6%. Men with an educational attainment of graduate degree enjoy the highest average annual earnings of $61,875, while those with high school diploma education earn the least with $27,083. Women with an educational attainment of college or associate's degree earn the most with the average annual earnings of $32,917, while those with high school diploma education have the smallest earnings of $23,889.
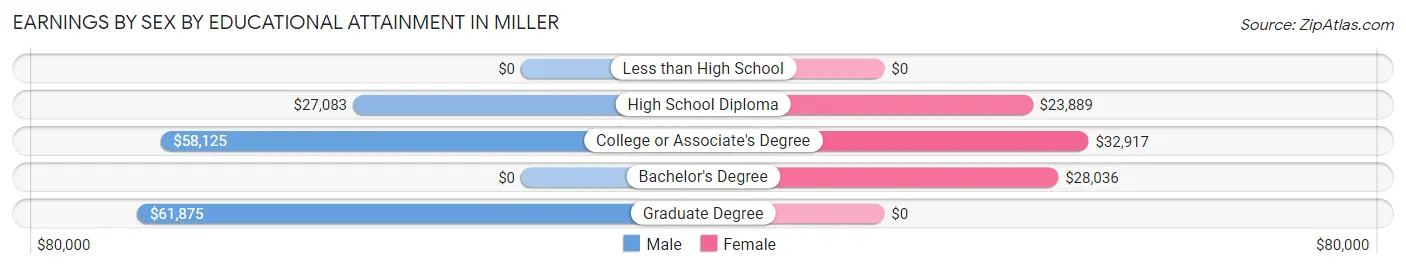
| Educational Attainment | Male Income | Female Income |
| Less than High School | - | - |
| High School Diploma | $27,083 | $23,889 |
| College or Associate's Degree | $58,125 | $32,917 |
| Bachelor's Degree | - | - |
| Graduate Degree | $61,875 | $0 |
| Total | $34,583 | $27,813 |
Family Income in Miller
Family Income Brackets in Miller
According to the Miller family income data, there are 75 families falling into the $50,000 to $74,999 income range, which is the most common income bracket and makes up 34.4% of all families. Conversely, the $10,000 to $14,999 income bracket is the least frequent group with only 2 families (0.9%) belonging to this category.
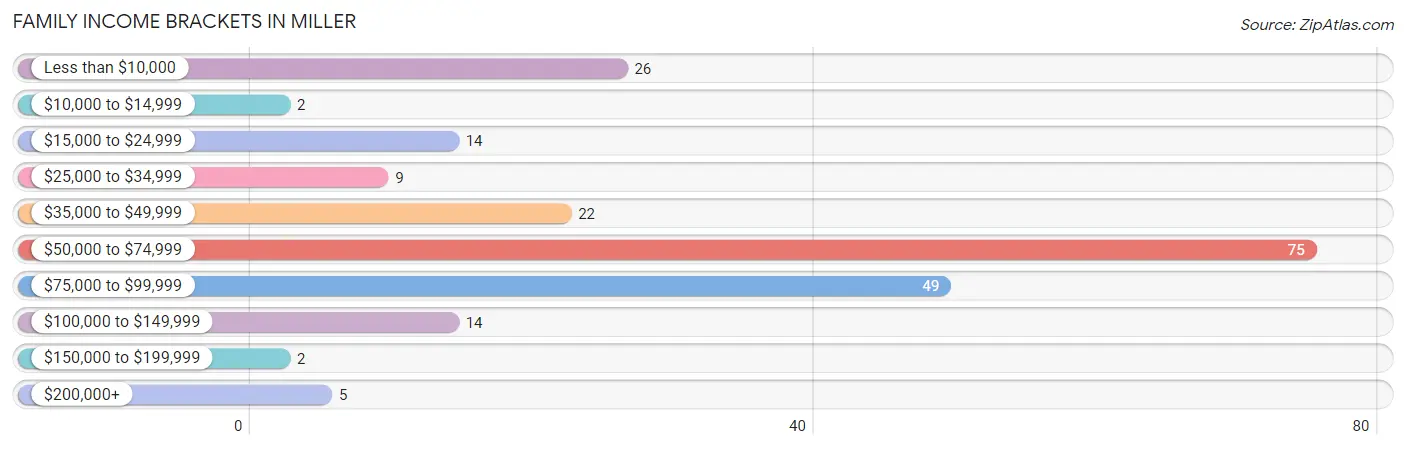
| Income Bracket | # Families | % Families |
| Less than $10,000 | 26 | 11.9% |
| $10,000 to $14,999 | 2 | 0.9% |
| $15,000 to $24,999 | 14 | 6.4% |
| $25,000 to $34,999 | 9 | 4.1% |
| $35,000 to $49,999 | 22 | 10.1% |
| $50,000 to $74,999 | 75 | 34.4% |
| $75,000 to $99,999 | 49 | 22.5% |
| $100,000 to $149,999 | 14 | 6.4% |
| $150,000 to $199,999 | 2 | 0.9% |
| $200,000+ | 5 | 2.3% |
Family Income by Famaliy Size in Miller
3-person families (40 | 18.3%) account for the highest median family income in Miller with $65,278 per family, while 2-person families (106 | 48.6%) have the highest median income of $25,625 per family member.
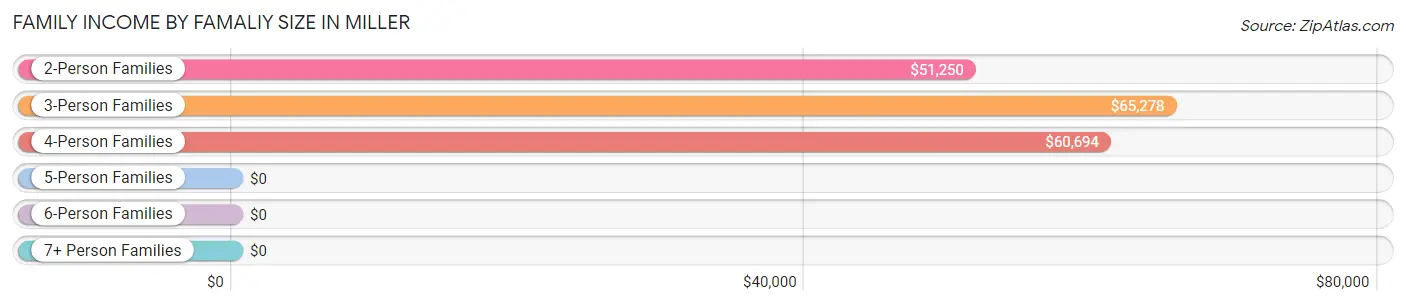
| Income Bracket | # Families | Median Income |
| 2-Person Families | 106 (48.6%) | $51,250 |
| 3-Person Families | 40 (18.3%) | $65,278 |
| 4-Person Families | 55 (25.2%) | $60,694 |
| 5-Person Families | 14 (6.4%) | $0 |
| 6-Person Families | 3 (1.4%) | $0 |
| 7+ Person Families | 0 (0.0%) | $0 |
| Total | 218 (100.0%) | $60,833 |
Family Income by Number of Earners in Miller
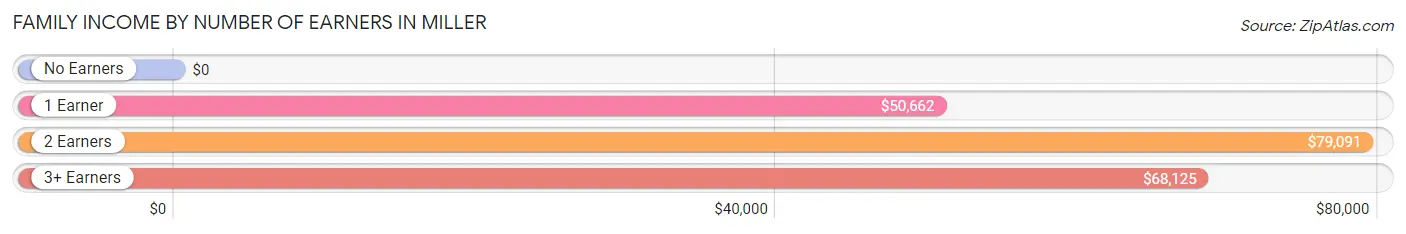
| Number of Earners | # Families | Median Income |
| No Earners | 52 (23.8%) | $0 |
| 1 Earner | 61 (28.0%) | $50,662 |
| 2 Earners | 92 (42.2%) | $79,091 |
| 3+ Earners | 13 (6.0%) | $68,125 |
| Total | 218 (100.0%) | $60,833 |
Household Income in Miller
Household Income Brackets in Miller
With 81 households falling in the category, the $50,000 to $74,999 income range is the most frequent in Miller, accounting for 23.7% of all households. In contrast, only 2 households (0.6%) fall into the $150,000 to $199,999 income bracket, making it the least populous group.
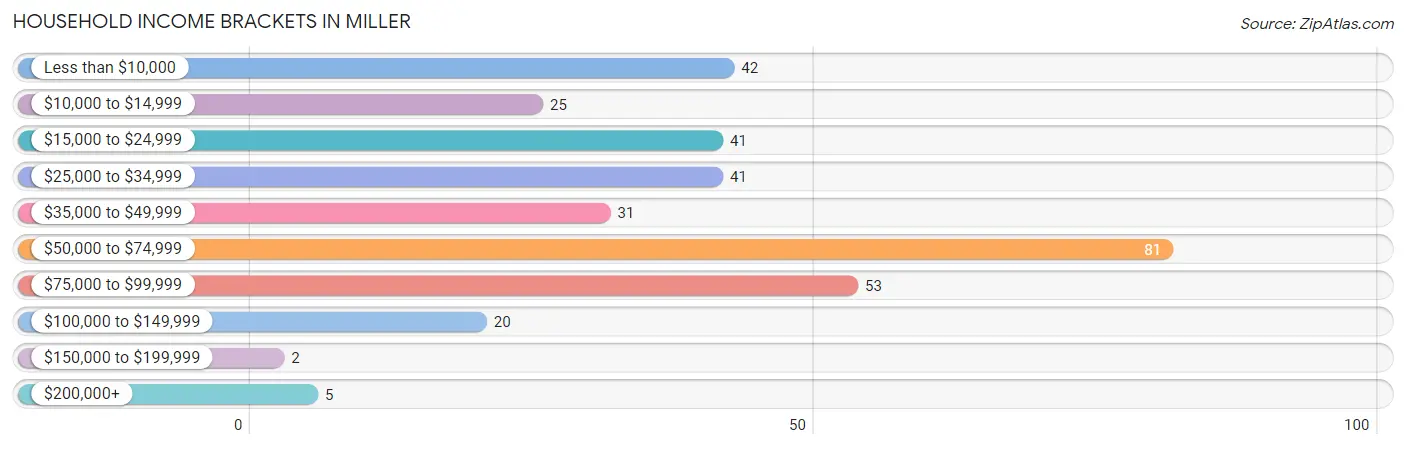
| Income Bracket | # Households | % Households |
| Less than $10,000 | 42 | 12.3% |
| $10,000 to $14,999 | 25 | 7.3% |
| $15,000 to $24,999 | 41 | 12.0% |
| $25,000 to $34,999 | 41 | 12.0% |
| $35,000 to $49,999 | 31 | 9.1% |
| $50,000 to $74,999 | 81 | 23.8% |
| $75,000 to $99,999 | 53 | 15.5% |
| $100,000 to $149,999 | 20 | 5.9% |
| $150,000 to $199,999 | 2 | 0.6% |
| $200,000+ | 5 | 1.5% |
Household Income by Householder Age in Miller
The median household income in Miller is $45,893, with the highest median household income of $51,912 found in the 25 to 44 years age bracket for the primary householder. A total of 112 households (32.8%) fall into this category. Meanwhile, the 15 to 24 years age bracket for the primary householder has the lowest median household income of $0, with 8 households (2.4%) in this group.
| Income Bracket | # Households | Median Income |
| 15 to 24 Years | 8 (2.4%) | $0 |
| 25 to 44 Years | 112 (32.8%) | $51,912 |
| 45 to 64 Years | 121 (35.5%) | $49,375 |
| 65+ Years | 100 (29.3%) | $27,500 |
| Total | 341 (100.0%) | $45,893 |
Poverty in Miller
Income Below Poverty by Sex and Age in Miller
With 20.1% poverty level for males and 23.6% for females among the residents of Miller, under 5 year old males and 55 to 64 year old females are the most vulnerable to poverty, with 5 males (100.0%) and 32 females (58.2%) in their respective age groups living below the poverty level.
| Age Bracket | Male | Female |
| Under 5 Years | 5 (100.0%) | 5 (50.0%) |
| 5 Years | 4 (100.0%) | 0 (0.0%) |
| 6 to 11 Years | 0 (0.0%) | 5 (23.8%) |
| 12 to 14 Years | 2 (14.3%) | 4 (57.1%) |
| 15 Years | 3 (8.3%) | 0 (0.0%) |
| 16 and 17 Years | 8 (44.4%) | 0 (0.0%) |
| 18 to 24 Years | 3 (13.6%) | 4 (9.5%) |
| 25 to 34 Years | 9 (14.3%) | 0 (0.0%) |
| 35 to 44 Years | 9 (19.6%) | 7 (15.6%) |
| 45 to 54 Years | 16 (31.4%) | 11 (16.9%) |
| 55 to 64 Years | 4 (30.8%) | 32 (58.2%) |
| 65 to 74 Years | 2 (5.9%) | 0 (0.0%) |
| 75 Years and over | 7 (21.9%) | 19 (50.0%) |
| Total | 72 (20.1%) | 87 (23.6%) |
Income Above Poverty by Sex and Age in Miller
According to the poverty statistics in Miller, males aged 6 to 11 years and females aged 15 years are the age groups that are most secure financially, with 100.0% of males and 100.0% of females in these age groups living above the poverty line.
| Age Bracket | Male | Female |
| Under 5 Years | 0 (0.0%) | 5 (50.0%) |
| 5 Years | 0 (0.0%) | 0 (0.0%) |
| 6 to 11 Years | 20 (100.0%) | 16 (76.2%) |
| 12 to 14 Years | 12 (85.7%) | 3 (42.9%) |
| 15 Years | 33 (91.7%) | 3 (100.0%) |
| 16 and 17 Years | 10 (55.6%) | 18 (100.0%) |
| 18 to 24 Years | 19 (86.4%) | 38 (90.5%) |
| 25 to 34 Years | 54 (85.7%) | 35 (100.0%) |
| 35 to 44 Years | 37 (80.4%) | 38 (84.4%) |
| 45 to 54 Years | 35 (68.6%) | 54 (83.1%) |
| 55 to 64 Years | 9 (69.2%) | 23 (41.8%) |
| 65 to 74 Years | 32 (94.1%) | 30 (100.0%) |
| 75 Years and over | 25 (78.1%) | 19 (50.0%) |
| Total | 286 (79.9%) | 282 (76.4%) |
Income Below Poverty Among Married-Couple Families in Miller
The poverty statistics for married-couple families in Miller show that 8.0% or 11 of the total 137 families live below the poverty line. Families with 3 or 4 children have the highest poverty rate of 33.3%, comprising of 4 families. On the other hand, families with 1 or 2 children have the lowest poverty rate of 5.4%, which includes 3 families.
| Children | Above Poverty | Below Poverty |
| No Children | 65 (94.2%) | 4 (5.8%) |
| 1 or 2 Children | 53 (94.6%) | 3 (5.4%) |
| 3 or 4 Children | 8 (66.7%) | 4 (33.3%) |
| 5 or more Children | 0 (0.0%) | 0 (0.0%) |
| Total | 126 (92.0%) | 11 (8.0%) |
Income Below Poverty Among Single-Parent Households in Miller
According to the poverty data in Miller, 18.2% or 2 single-father households and 47.1% or 33 single-mother households are living below the poverty line. Among single-father households, those with 1 or 2 children have the highest poverty rate, with 2 households (22.2%) experiencing poverty. Likewise, among single-mother households, those with no children have the highest poverty rate, with 21 households (55.3%) falling below the poverty line.
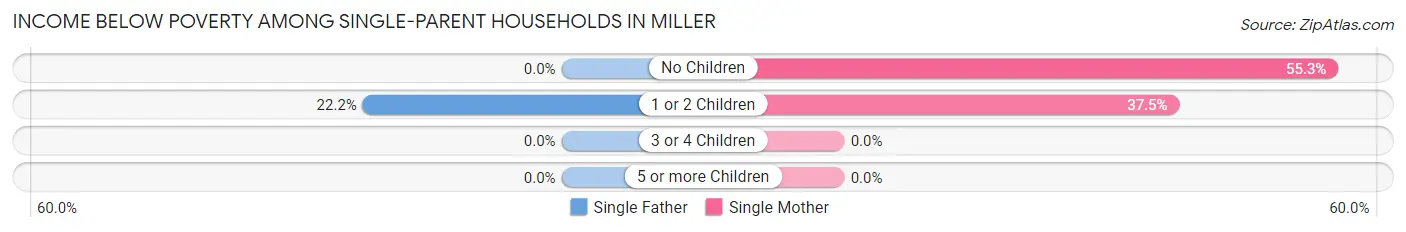
| Children | Single Father | Single Mother |
| No Children | 0 (0.0%) | 21 (55.3%) |
| 1 or 2 Children | 2 (22.2%) | 12 (37.5%) |
| 3 or 4 Children | 0 (0.0%) | 0 (0.0%) |
| 5 or more Children | 0 (0.0%) | 0 (0.0%) |
| Total | 2 (18.2%) | 33 (47.1%) |
Income Below Poverty Among Married-Couple vs Single-Parent Households in Miller
The poverty data for Miller shows that 11 of the married-couple family households (8.0%) and 35 of the single-parent households (43.2%) are living below the poverty level. Within the married-couple family households, those with 3 or 4 children have the highest poverty rate, with 4 households (33.3%) falling below the poverty line. Among the single-parent households, those with no children have the highest poverty rate, with 21 household (52.5%) living below poverty.
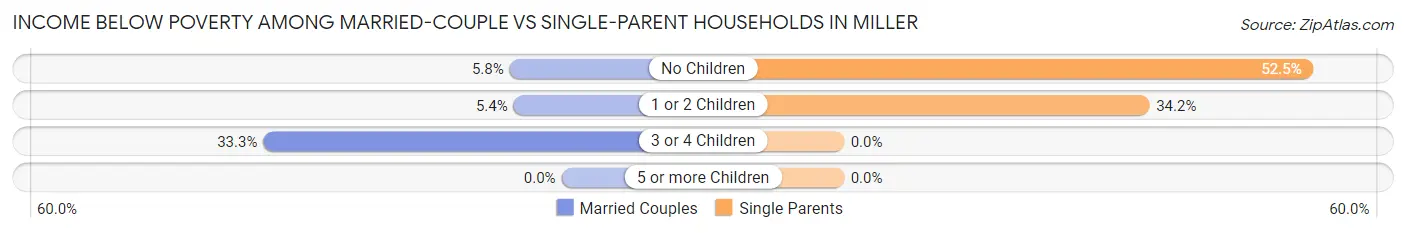
| Children | Married-Couple Families | Single-Parent Households |
| No Children | 4 (5.8%) | 21 (52.5%) |
| 1 or 2 Children | 3 (5.4%) | 14 (34.2%) |
| 3 or 4 Children | 4 (33.3%) | 0 (0.0%) |
| 5 or more Children | 0 (0.0%) | 0 (0.0%) |
| Total | 11 (8.0%) | 35 (43.2%) |
Race in Miller
The most populous races in Miller are White / Caucasian (673 | 92.6%), Two or more Races (21 | 2.9%), and Native / Alaskan (18 | 2.5%).
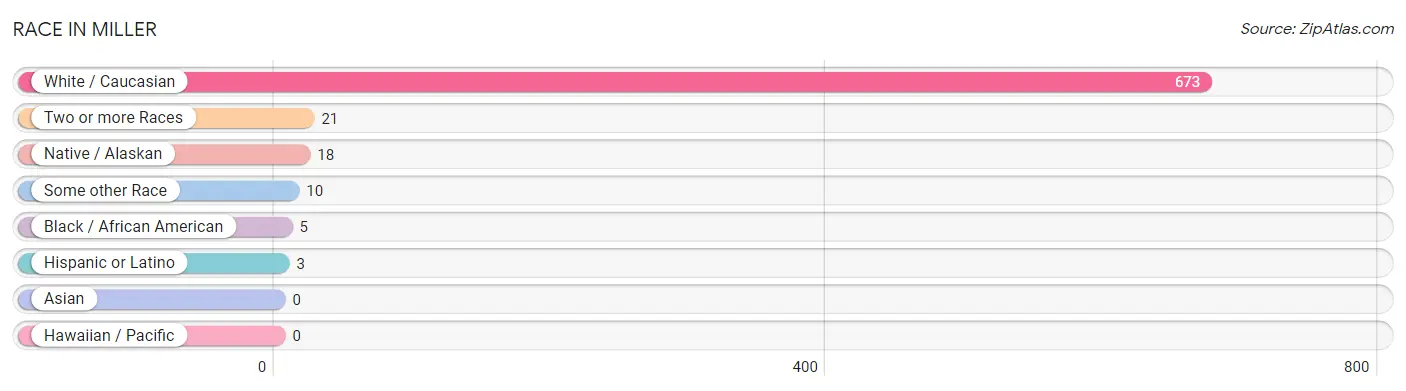
| Race | # Population | % Population |
| Asian | 0 | 0.0% |
| Black / African American | 5 | 0.7% |
| Hawaiian / Pacific | 0 | 0.0% |
| Hispanic or Latino | 3 | 0.4% |
| Native / Alaskan | 18 | 2.5% |
| White / Caucasian | 673 | 92.6% |
| Two or more Races | 21 | 2.9% |
| Some other Race | 10 | 1.4% |
| Total | 727 | 100.0% |
Ancestry in Miller
The most populous ancestries reported in Miller are American (141 | 19.4%), German (130 | 17.9%), English (124 | 17.1%), Irish (48 | 6.6%), and Dutch (32 | 4.4%), together accounting for 65.3% of all Miller residents.
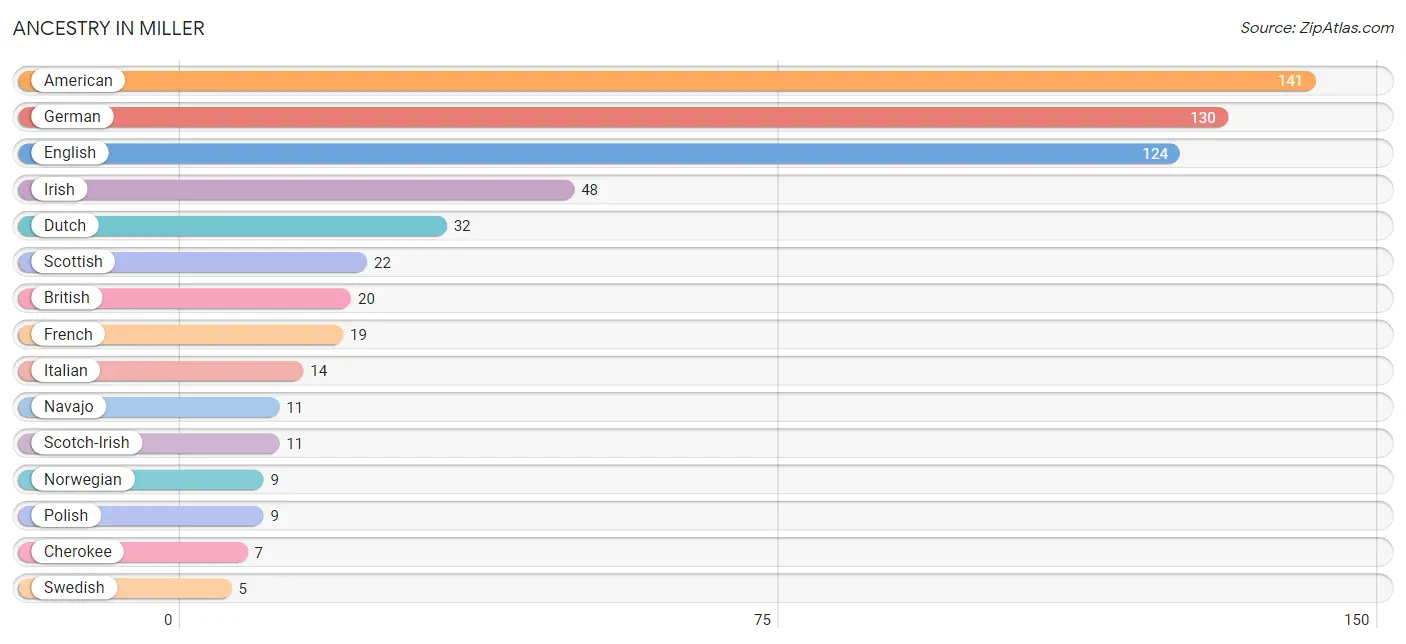
| Ancestry | # Population | % Population |
| American | 141 | 19.4% |
| British | 20 | 2.8% |
| Cherokee | 7 | 1.0% |
| Chickasaw | 1 | 0.1% |
| Delaware | 2 | 0.3% |
| Dutch | 32 | 4.4% |
| English | 124 | 17.1% |
| European | 4 | 0.5% |
| French | 19 | 2.6% |
| German | 130 | 17.9% |
| Irish | 48 | 6.6% |
| Italian | 14 | 1.9% |
| Menominee | 4 | 0.5% |
| Mexican | 3 | 0.4% |
| Navajo | 11 | 1.5% |
| Norwegian | 9 | 1.2% |
| Polish | 9 | 1.2% |
| Scotch-Irish | 11 | 1.5% |
| Scottish | 22 | 3.0% |
| Swedish | 5 | 0.7% |
| Trinidadian and Tobagonian | 1 | 0.1% |
| Welsh | 3 | 0.4% | View All 22 Rows |
Immigrants in Miller
The most numerous immigrant groups reported in Miller came from Latin America (6 | 0.8%), Caribbean (3 | 0.4%), Central America (3 | 0.4%), Mexico (3 | 0.4%), and Trinidad and Tobago (3 | 0.4%), together accounting for 2.5% of all Miller residents.
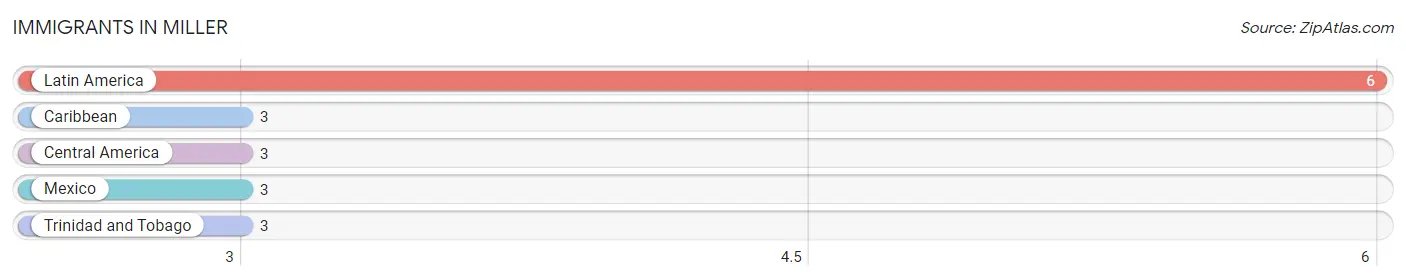
| Immigration Origin | # Population | % Population |
| Caribbean | 3 | 0.4% |
| Central America | 3 | 0.4% |
| Latin America | 6 | 0.8% |
| Mexico | 3 | 0.4% |
| Trinidad and Tobago | 3 | 0.4% | View All 5 Rows |
Sex and Age in Miller
Sex and Age in Miller
The most populous age groups in Miller are 15 to 19 Years (58 | 16.2%) for men and 15 to 19 Years (46 | 12.5%) for women.
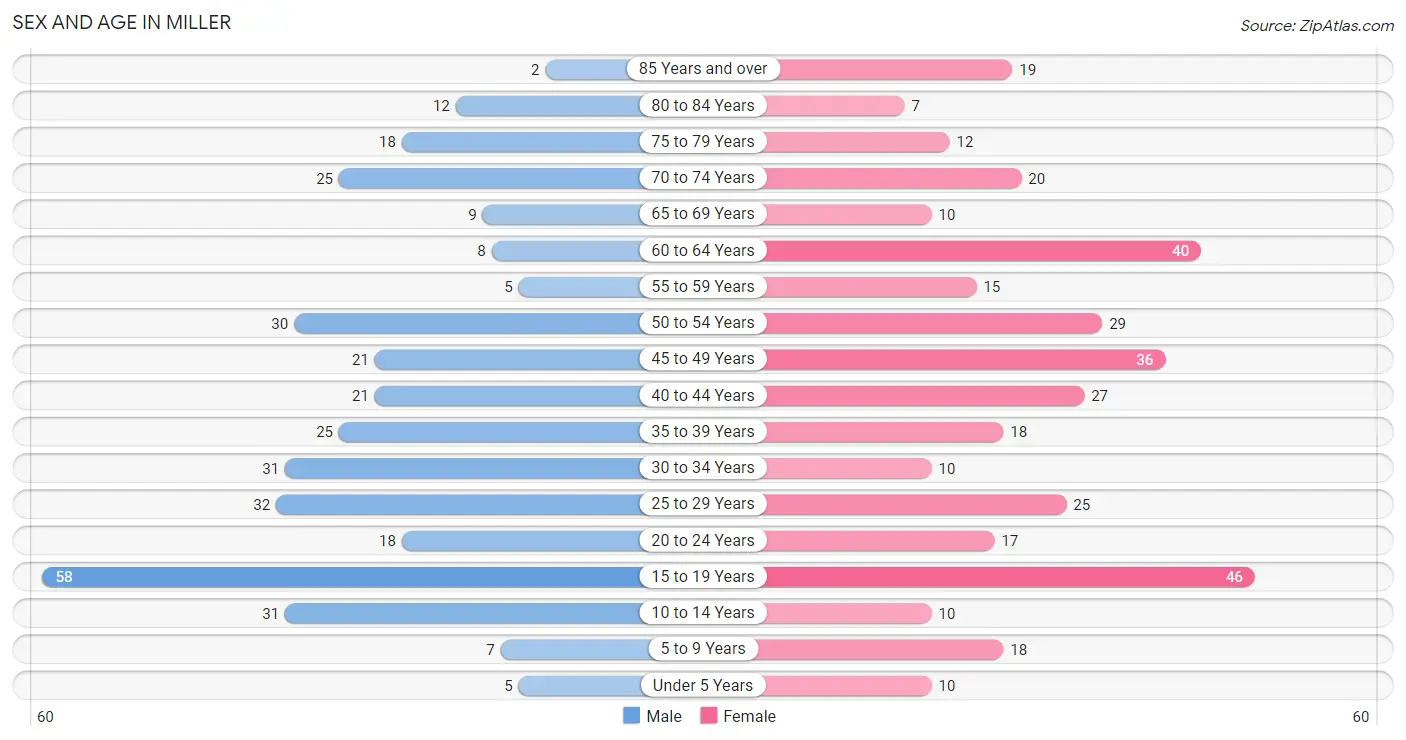
| Age Bracket | Male | Female |
| Under 5 Years | 5 (1.4%) | 10 (2.7%) |
| 5 to 9 Years | 7 (2.0%) | 18 (4.9%) |
| 10 to 14 Years | 31 (8.7%) | 10 (2.7%) |
| 15 to 19 Years | 58 (16.2%) | 46 (12.5%) |
| 20 to 24 Years | 18 (5.0%) | 17 (4.6%) |
| 25 to 29 Years | 32 (8.9%) | 25 (6.8%) |
| 30 to 34 Years | 31 (8.7%) | 10 (2.7%) |
| 35 to 39 Years | 25 (7.0%) | 18 (4.9%) |
| 40 to 44 Years | 21 (5.9%) | 27 (7.3%) |
| 45 to 49 Years | 21 (5.9%) | 36 (9.8%) |
| 50 to 54 Years | 30 (8.4%) | 29 (7.9%) |
| 55 to 59 Years | 5 (1.4%) | 15 (4.1%) |
| 60 to 64 Years | 8 (2.2%) | 40 (10.8%) |
| 65 to 69 Years | 9 (2.5%) | 10 (2.7%) |
| 70 to 74 Years | 25 (7.0%) | 20 (5.4%) |
| 75 to 79 Years | 18 (5.0%) | 12 (3.3%) |
| 80 to 84 Years | 12 (3.4%) | 7 (1.9%) |
| 85 Years and over | 2 (0.6%) | 19 (5.1%) |
| Total | 358 (100.0%) | 369 (100.0%) |
Families and Households in Miller
Median Family Size in Miller
The median family size in Miller is 2.69 persons per family, with married-couple families (137 | 62.8%) accounting for the largest median family size of 2.82 persons per family. On the other hand, single female/mother families (70 | 32.1%) represent the smallest median family size with 2.46 persons per family.
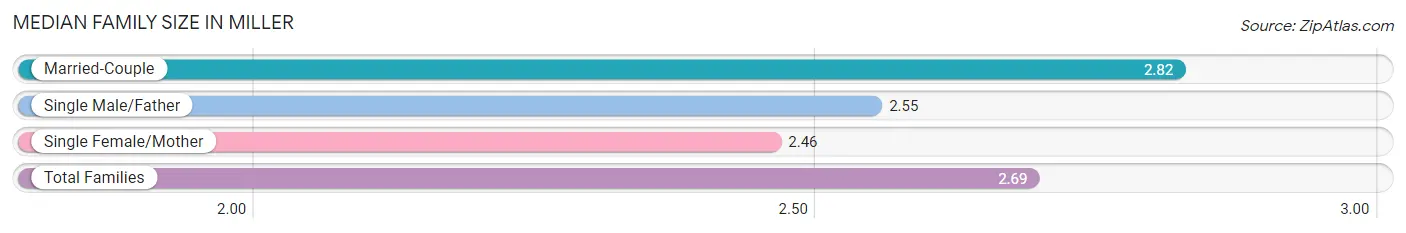
| Family Type | # Families | Family Size |
| Married-Couple | 137 (62.8%) | 2.82 |
| Single Male/Father | 11 (5.1%) | 2.55 |
| Single Female/Mother | 70 (32.1%) | 2.46 |
| Total Families | 218 (100.0%) | 2.69 |
Median Household Size in Miller
The median household size in Miller is 2.13 persons per household, with married-couple households (137 | 40.2%) accounting for the largest median household size of 2.82 persons per household. non-family households (123 | 36.1%) represent the smallest median household size with 1.06 persons per household.
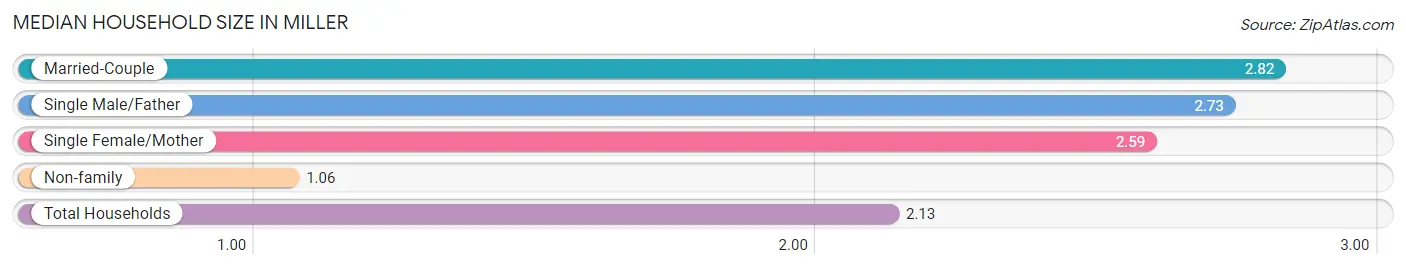
| Household Type | # Households | Household Size |
| Married-Couple | 137 (40.2%) | 2.82 |
| Single Male/Father | 11 (3.2%) | 2.73 |
| Single Female/Mother | 70 (20.5%) | 2.59 |
| Non-family | 123 (36.1%) | 1.06 |
| Total Households | 341 (100.0%) | 2.13 |
Household Size by Marriage Status in Miller
Out of a total of 341 households in Miller, 218 (63.9%) are family households, while 123 (36.1%) are nonfamily households. The most numerous type of family households are 2-person households, comprising 96, and the most common type of nonfamily households are 1-person households, comprising 116.
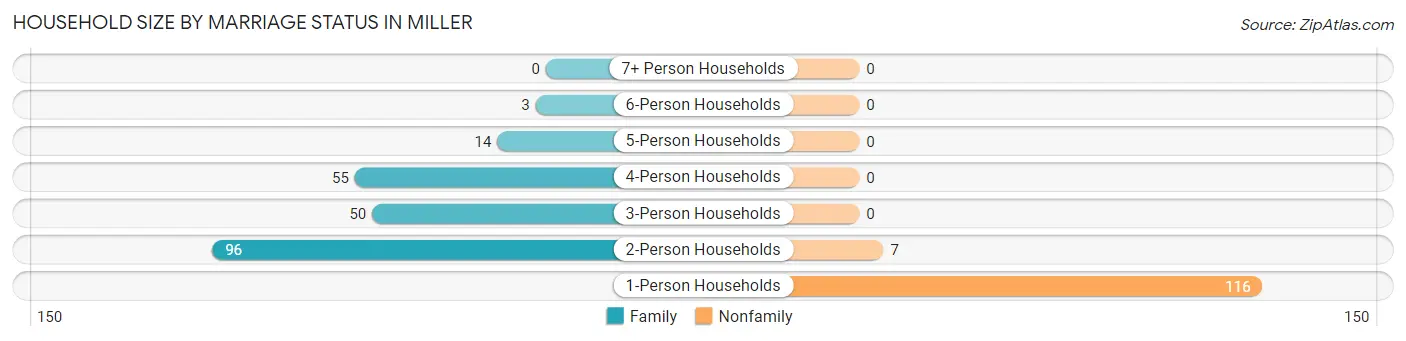
| Household Size | Family Households | Nonfamily Households |
| 1-Person Households | - | 116 (34.0%) |
| 2-Person Households | 96 (28.1%) | 7 (2.1%) |
| 3-Person Households | 50 (14.7%) | 0 (0.0%) |
| 4-Person Households | 55 (16.1%) | 0 (0.0%) |
| 5-Person Households | 14 (4.1%) | 0 (0.0%) |
| 6-Person Households | 3 (0.9%) | 0 (0.0%) |
| 7+ Person Households | 0 (0.0%) | 0 (0.0%) |
| Total | 218 (63.9%) | 123 (36.1%) |
Female Fertility in Miller
Fertility by Age in Miller
Average fertility rate in Miller is 20.0 births per 1,000 women. Women in the age bracket of 20 to 34 years have the highest fertility rate with 77.0 births per 1,000 women. Women in the age bracket of 20 to 34 years acount for 100.0% of all women with births.
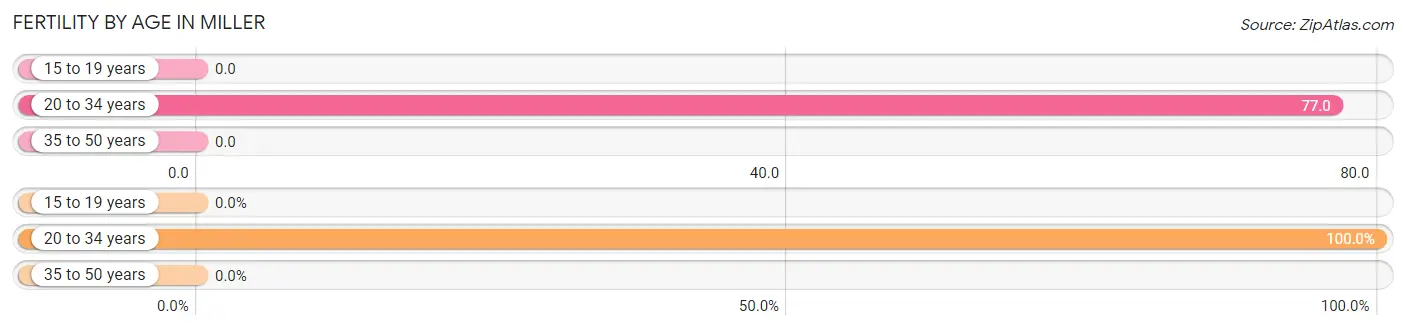
| Age Bracket | Women with Births | Births / 1,000 Women |
| 15 to 19 years | 0 (0.0%) | 0.0 |
| 20 to 34 years | 4 (100.0%) | 77.0 |
| 35 to 50 years | 0 (0.0%) | 0.0 |
| Total | 4 (100.0%) | 20.0 |
Fertility by Age by Marriage Status in Miller
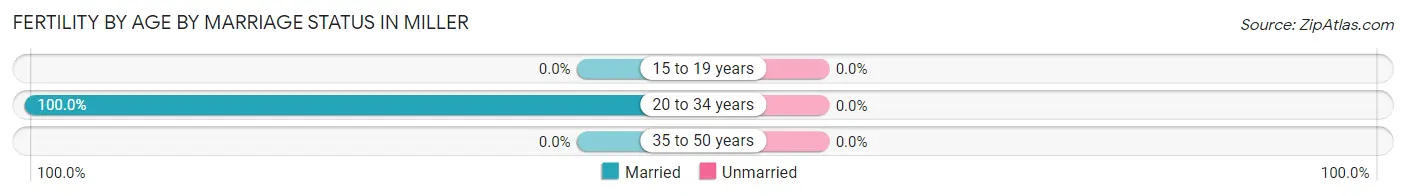
| Age Bracket | Married | Unmarried |
| 15 to 19 years | 0 (0.0%) | 0 (0.0%) |
| 20 to 34 years | 4 (100.0%) | 0 (0.0%) |
| 35 to 50 years | 0 (0.0%) | 0 (0.0%) |
| Total | 4 (100.0%) | 0 (0.0%) |
Fertility by Education in Miller
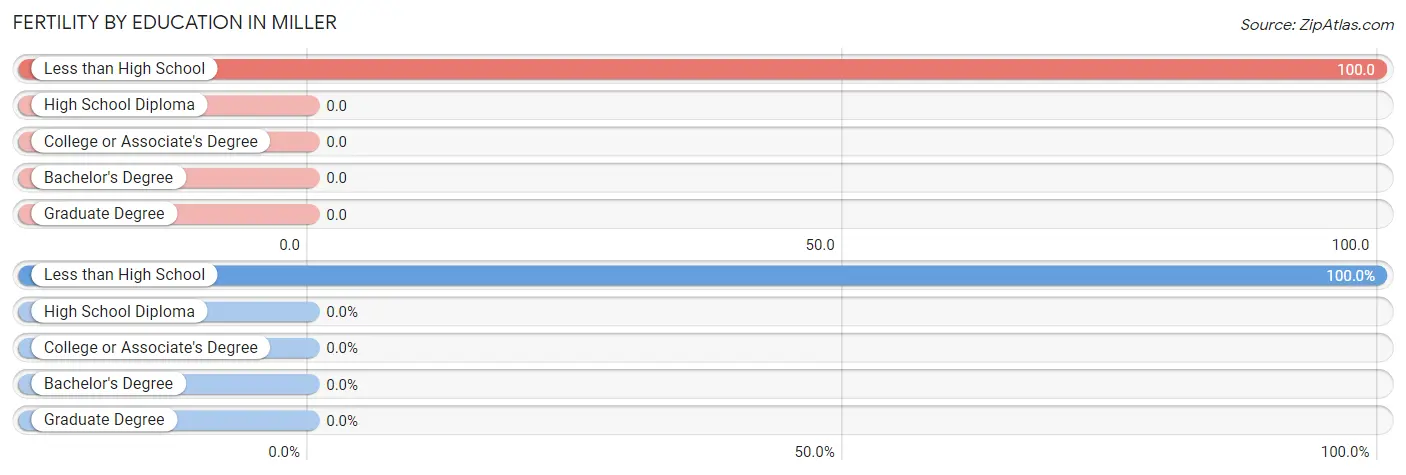
| Educational Attainment | Women with Births | Births / 1,000 Women |
| Less than High School | 4 (100.0%) | 100.0 |
| High School Diploma | 0 (0.0%) | 0.0 |
| College or Associate's Degree | 0 (0.0%) | 0.0 |
| Bachelor's Degree | 0 (0.0%) | 0.0 |
| Graduate Degree | 0 (0.0%) | 0.0 |
| Total | 4 (100.0%) | 20.0 |
Fertility by Education by Marriage Status in Miller
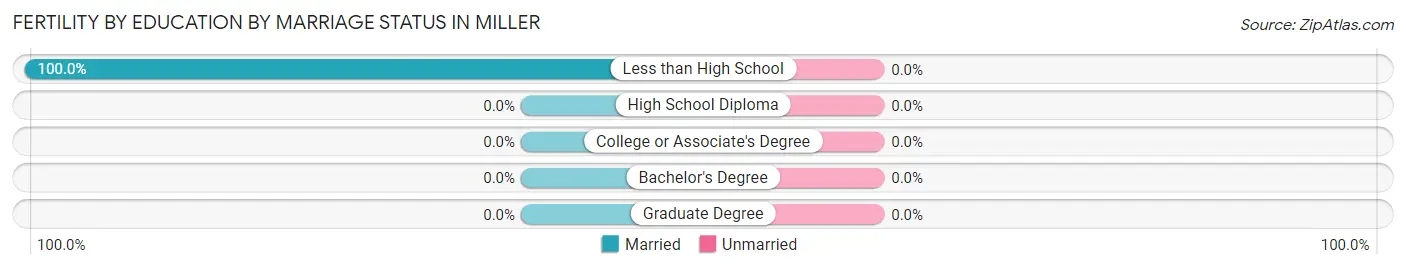
| Educational Attainment | Married | Unmarried |
| Less than High School | 4 (100.0%) | 0 (0.0%) |
| High School Diploma | 0 (0.0%) | 0 (0.0%) |
| College or Associate's Degree | 0 (0.0%) | 0 (0.0%) |
| Bachelor's Degree | 0 (0.0%) | 0 (0.0%) |
| Graduate Degree | 0 (0.0%) | 0 (0.0%) |
| Total | 4 (100.0%) | 0 (0.0%) |
Employment Characteristics in Miller
Employment by Class of Employer in Miller
Among the 293 employed individuals in Miller, private company employees (209 | 71.3%), not-for-profit organizations (30 | 10.2%), and self-employed (not incorporated) (23 | 7.9%) make up the most common classes of employment.
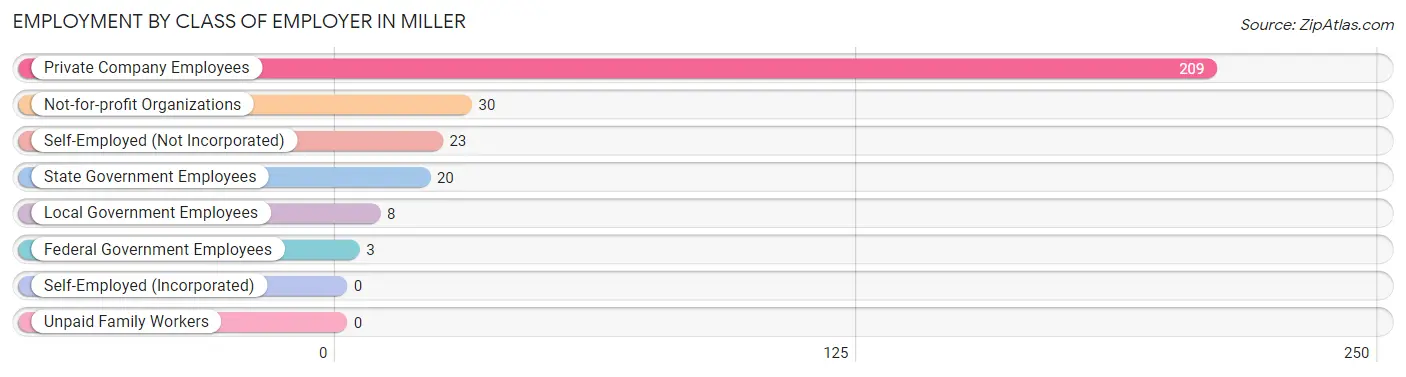
| Employer Class | # Employees | % Employees |
| Private Company Employees | 209 | 71.3% |
| Self-Employed (Incorporated) | 0 | 0.0% |
| Self-Employed (Not Incorporated) | 23 | 7.9% |
| Not-for-profit Organizations | 30 | 10.2% |
| Local Government Employees | 8 | 2.7% |
| State Government Employees | 20 | 6.8% |
| Federal Government Employees | 3 | 1.0% |
| Unpaid Family Workers | 0 | 0.0% |
| Total | 293 | 100.0% |
Employment Status by Age in Miller
According to the labor force statistics for Miller, out of the total population over 16 years of age (607), 51.7% or 314 individuals are in the labor force, with 6.7% or 21 of them unemployed. The age group with the highest labor force participation rate is 30 to 34 years, with 87.8% or 36 individuals in the labor force. Within the labor force, the 16 to 19 years age range has the highest percentage of unemployed individuals, with 59.3% or 16 of them being unemployed.
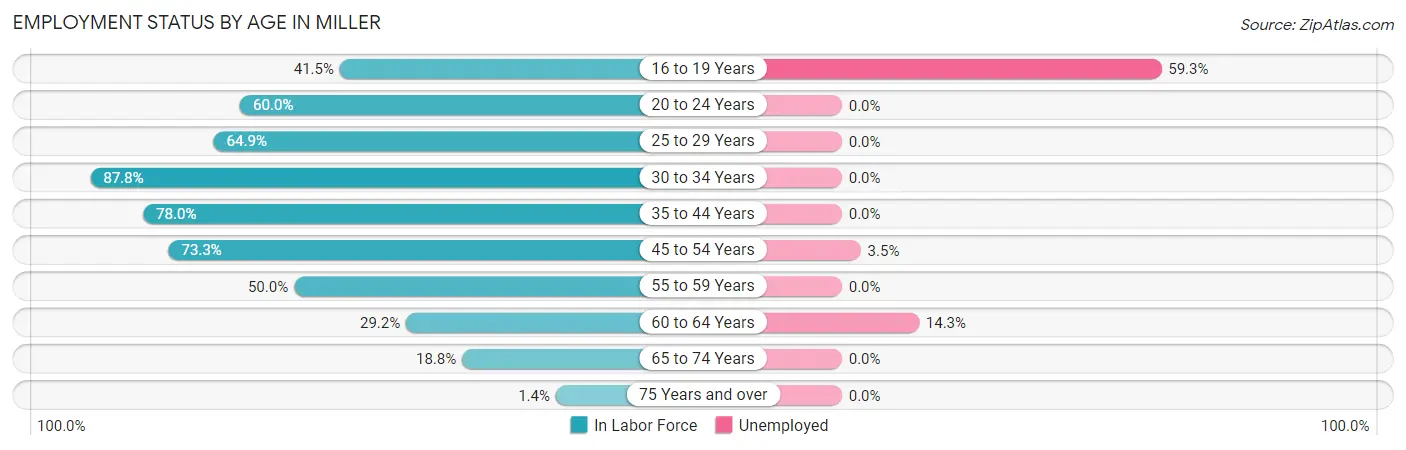
| Age Bracket | In Labor Force | Unemployed |
| 16 to 19 Years | 27 (41.5%) | 16 (59.3%) |
| 20 to 24 Years | 21 (60.0%) | 0 (0.0%) |
| 25 to 29 Years | 37 (64.9%) | 0 (0.0%) |
| 30 to 34 Years | 36 (87.8%) | 0 (0.0%) |
| 35 to 44 Years | 71 (78.0%) | 0 (0.0%) |
| 45 to 54 Years | 85 (73.3%) | 3 (3.5%) |
| 55 to 59 Years | 10 (50.0%) | 0 (0.0%) |
| 60 to 64 Years | 14 (29.2%) | 2 (14.3%) |
| 65 to 74 Years | 12 (18.8%) | 0 (0.0%) |
| 75 Years and over | 1 (1.4%) | 0 (0.0%) |
| Total | 314 (51.7%) | 21 (6.7%) |
Employment Status by Educational Attainment in Miller
According to labor force statistics for Miller, 67.8% of individuals (253) out of the total population between 25 and 64 years of age (373) are in the labor force, with 2.0% or 5 of them being unemployed. The group with the highest labor force participation rate are those with the educational attainment of bachelor's degree or higher, with 91.2% or 52 individuals in the labor force. Within the labor force, individuals with bachelor's degree or higher education have the highest percentage of unemployment, with 3.8% or 2 of them being unemployed.
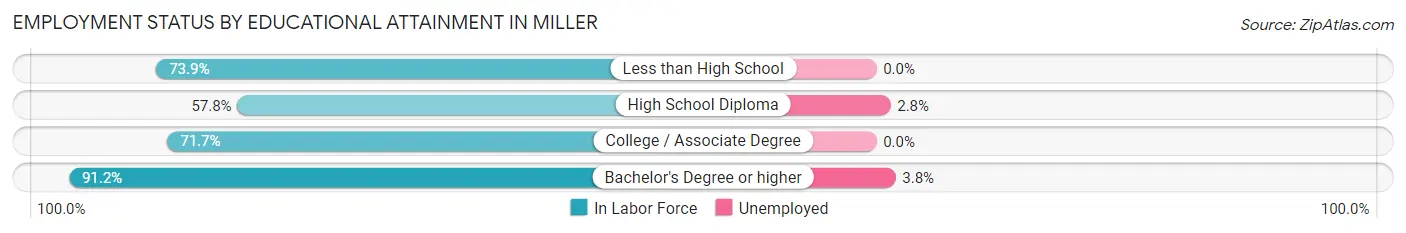
| Educational Attainment | In Labor Force | Unemployed |
| Less than High School | 17 (73.9%) | 0 (0.0%) |
| High School Diploma | 108 (57.8%) | 5 (2.8%) |
| College / Associate Degree | 76 (71.7%) | 0 (0.0%) |
| Bachelor's Degree or higher | 52 (91.2%) | 2 (3.8%) |
| Total | 253 (67.8%) | 7 (2.0%) |
Employment Occupations by Sex in Miller
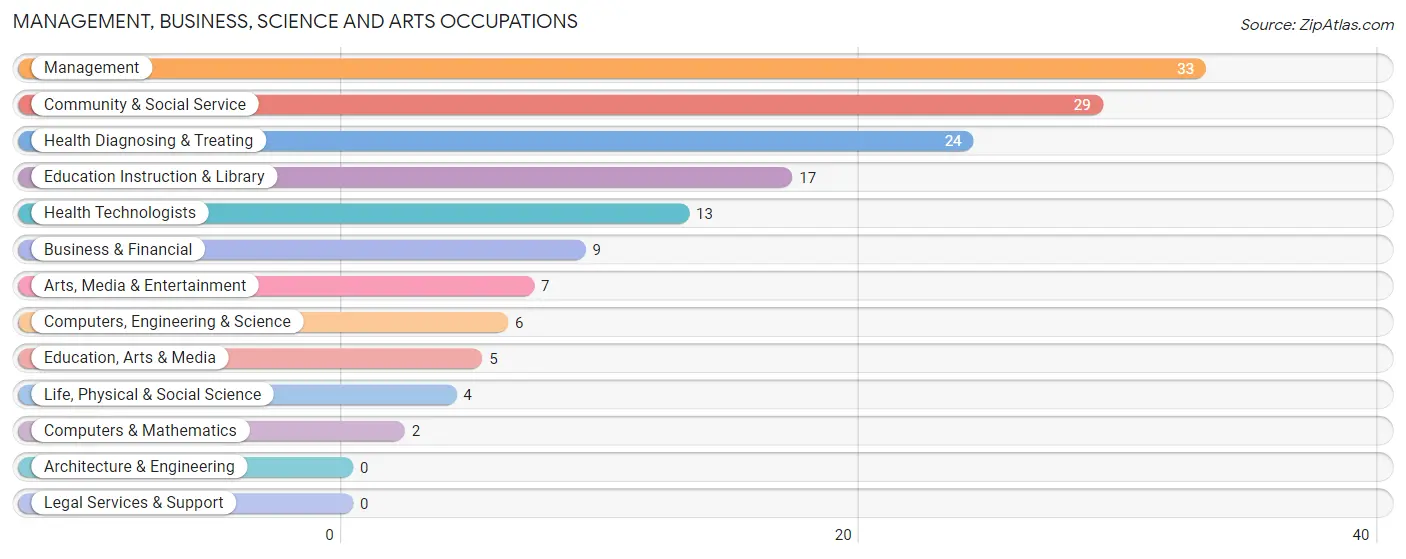
Management, Business, Science and Arts Occupations
The most common Management, Business, Science and Arts occupations in Miller are Management (33 | 11.3%), Community & Social Service (29 | 9.9%), Health Diagnosing & Treating (24 | 8.2%), Education Instruction & Library (17 | 5.8%), and Health Technologists (13 | 4.4%).
Management, Business, Science and Arts Occupations by Sex
Within the Management, Business, Science and Arts occupations in Miller, the most male-oriented occupations are Business & Financial (100.0%), Computers, Engineering & Science (100.0%), and Computers & Mathematics (100.0%), while the most female-oriented occupations are Education Instruction & Library (100.0%), Health Technologists (84.6%), and Community & Social Service (69.0%).
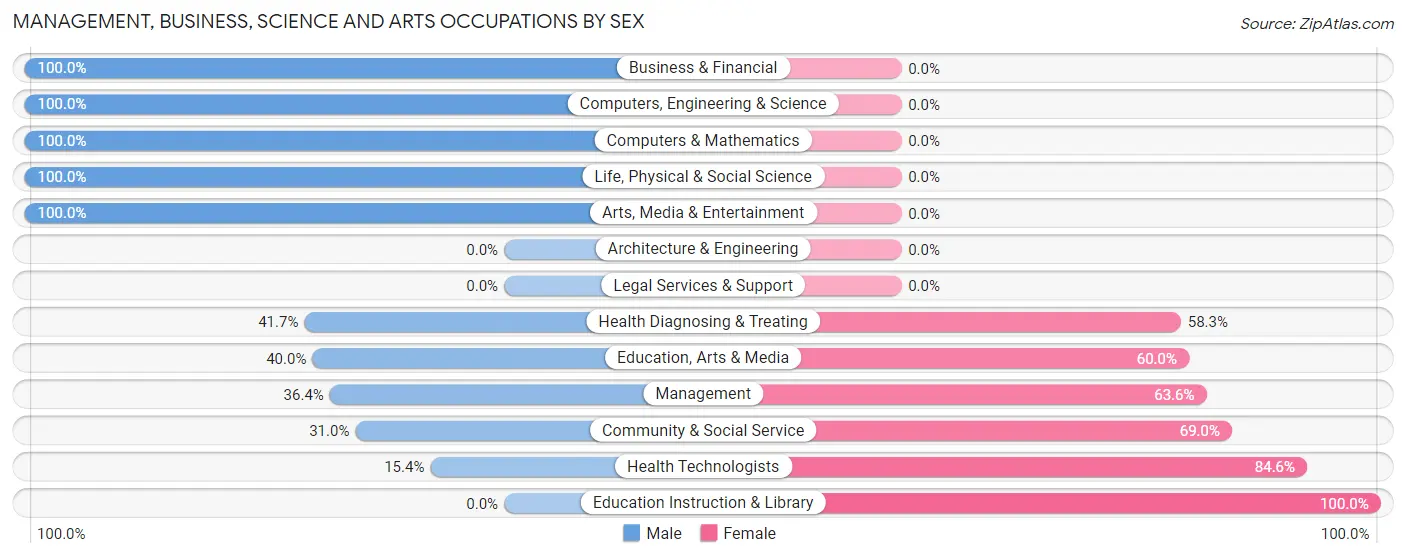
| Occupation | Male | Female |
| Management | 12 (36.4%) | 21 (63.6%) |
| Business & Financial | 9 (100.0%) | 0 (0.0%) |
| Computers, Engineering & Science | 6 (100.0%) | 0 (0.0%) |
| Computers & Mathematics | 2 (100.0%) | 0 (0.0%) |
| Architecture & Engineering | 0 (0.0%) | 0 (0.0%) |
| Life, Physical & Social Science | 4 (100.0%) | 0 (0.0%) |
| Community & Social Service | 9 (31.0%) | 20 (69.0%) |
| Education, Arts & Media | 2 (40.0%) | 3 (60.0%) |
| Legal Services & Support | 0 (0.0%) | 0 (0.0%) |
| Education Instruction & Library | 0 (0.0%) | 17 (100.0%) |
| Arts, Media & Entertainment | 7 (100.0%) | 0 (0.0%) |
| Health Diagnosing & Treating | 10 (41.7%) | 14 (58.3%) |
| Health Technologists | 2 (15.4%) | 11 (84.6%) |
| Total (Category) | 46 (45.5%) | 55 (54.5%) |
| Total (Overall) | 140 (47.8%) | 153 (52.2%) |
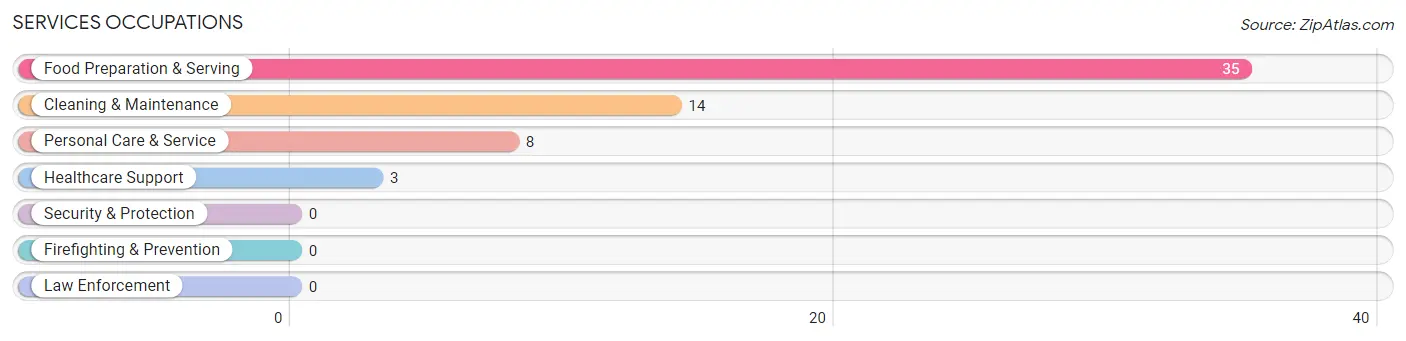
Services Occupations
The most common Services occupations in Miller are Food Preparation & Serving (35 | 11.9%), Cleaning & Maintenance (14 | 4.8%), Personal Care & Service (8 | 2.7%), and Healthcare Support (3 | 1.0%).
Services Occupations by Sex
Within the Services occupations in Miller, the most male-oriented occupations are Cleaning & Maintenance (100.0%), and Food Preparation & Serving (22.9%), while the most female-oriented occupations are Healthcare Support (100.0%), Personal Care & Service (100.0%), and Food Preparation & Serving (77.1%).
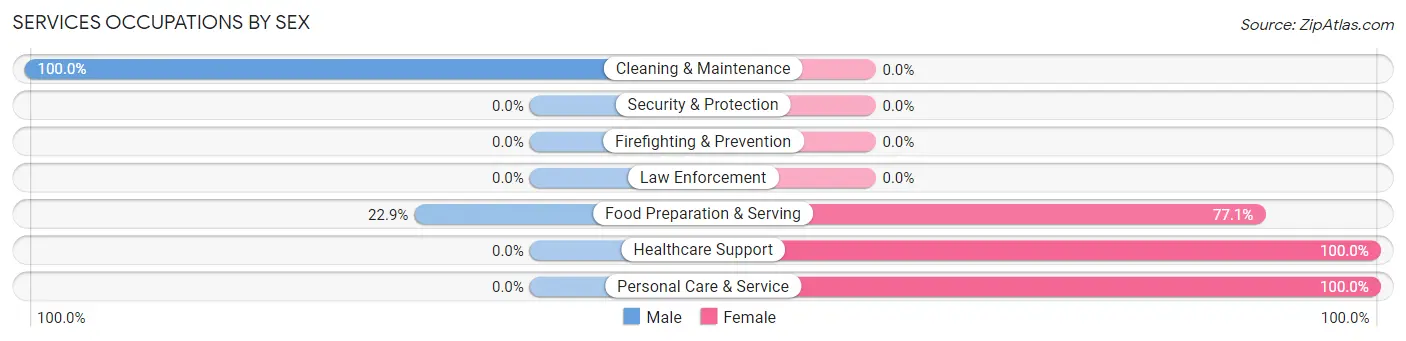
| Occupation | Male | Female |
| Healthcare Support | 0 (0.0%) | 3 (100.0%) |
| Security & Protection | 0 (0.0%) | 0 (0.0%) |
| Firefighting & Prevention | 0 (0.0%) | 0 (0.0%) |
| Law Enforcement | 0 (0.0%) | 0 (0.0%) |
| Food Preparation & Serving | 8 (22.9%) | 27 (77.1%) |
| Cleaning & Maintenance | 14 (100.0%) | 0 (0.0%) |
| Personal Care & Service | 0 (0.0%) | 8 (100.0%) |
| Total (Category) | 22 (36.7%) | 38 (63.3%) |
| Total (Overall) | 140 (47.8%) | 153 (52.2%) |
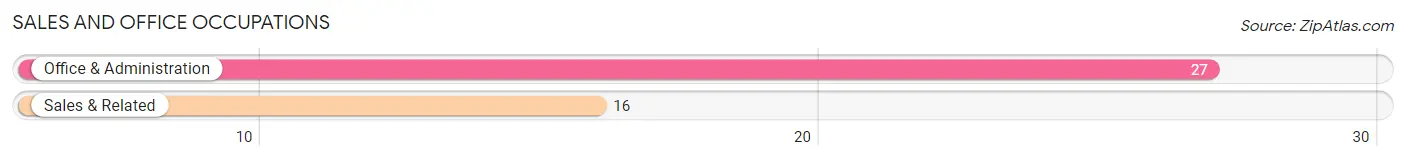
Sales and Office Occupations
The most common Sales and Office occupations in Miller are Office & Administration (27 | 9.2%), and Sales & Related (16 | 5.5%).
Sales and Office Occupations by Sex
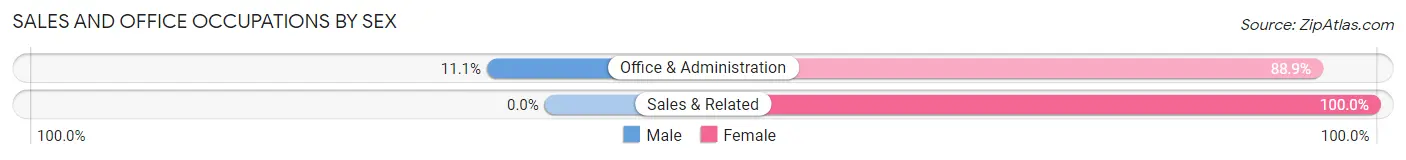
| Occupation | Male | Female |
| Sales & Related | 0 (0.0%) | 16 (100.0%) |
| Office & Administration | 3 (11.1%) | 24 (88.9%) |
| Total (Category) | 3 (7.0%) | 40 (93.0%) |
| Total (Overall) | 140 (47.8%) | 153 (52.2%) |
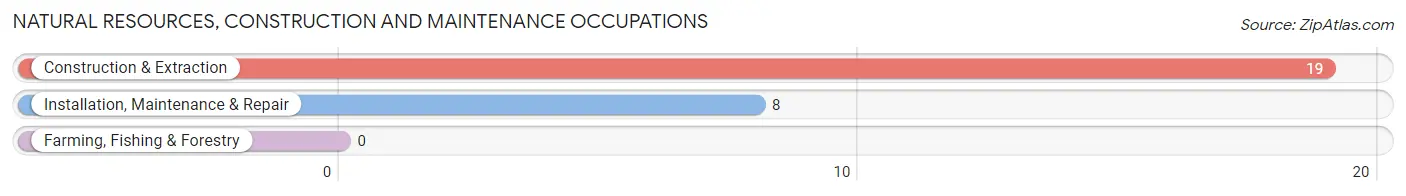
Natural Resources, Construction and Maintenance Occupations
The most common Natural Resources, Construction and Maintenance occupations in Miller are Construction & Extraction (19 | 6.5%), and Installation, Maintenance & Repair (8 | 2.7%).
Natural Resources, Construction and Maintenance Occupations by Sex
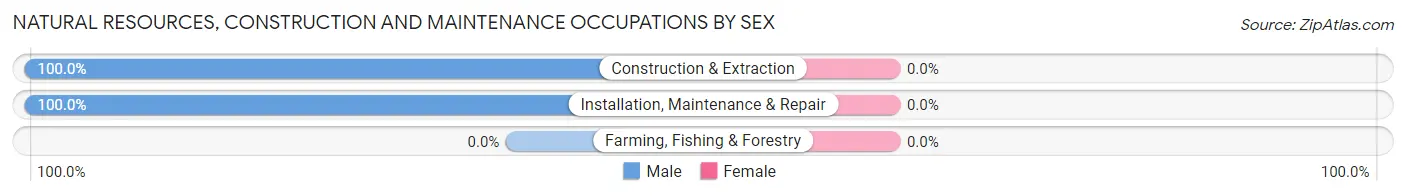
| Occupation | Male | Female |
| Farming, Fishing & Forestry | 0 (0.0%) | 0 (0.0%) |
| Construction & Extraction | 19 (100.0%) | 0 (0.0%) |
| Installation, Maintenance & Repair | 8 (100.0%) | 0 (0.0%) |
| Total (Category) | 27 (100.0%) | 0 (0.0%) |
| Total (Overall) | 140 (47.8%) | 153 (52.2%) |
Production, Transportation and Moving Occupations
The most common Production, Transportation and Moving occupations in Miller are Transportation (27 | 9.2%), Production (22 | 7.5%), and Material Moving (13 | 4.4%).
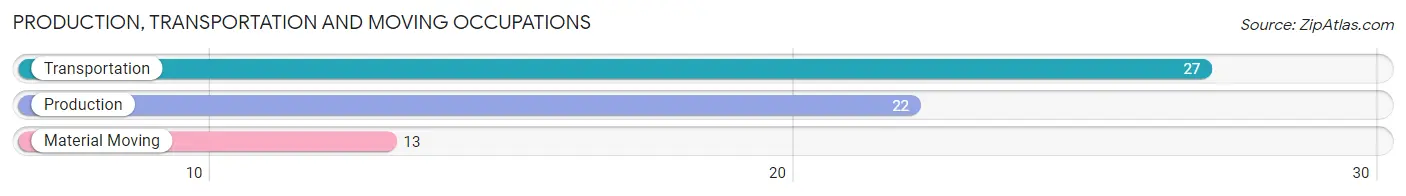
Production, Transportation and Moving Occupations by Sex
| Occupation | Male | Female |
| Production | 11 (50.0%) | 11 (50.0%) |
| Transportation | 25 (92.6%) | 2 (7.4%) |
| Material Moving | 6 (46.2%) | 7 (53.8%) |
| Total (Category) | 42 (67.7%) | 20 (32.3%) |
| Total (Overall) | 140 (47.8%) | 153 (52.2%) |
Employment Industries by Sex in Miller
Employment Industries in Miller
The major employment industries in Miller include Health Care & Social Assistance (50 | 17.1%), Manufacturing (35 | 11.9%), Retail Trade (34 | 11.6%), Accommodation & Food Services (34 | 11.6%), and Educational Services (31 | 10.6%).
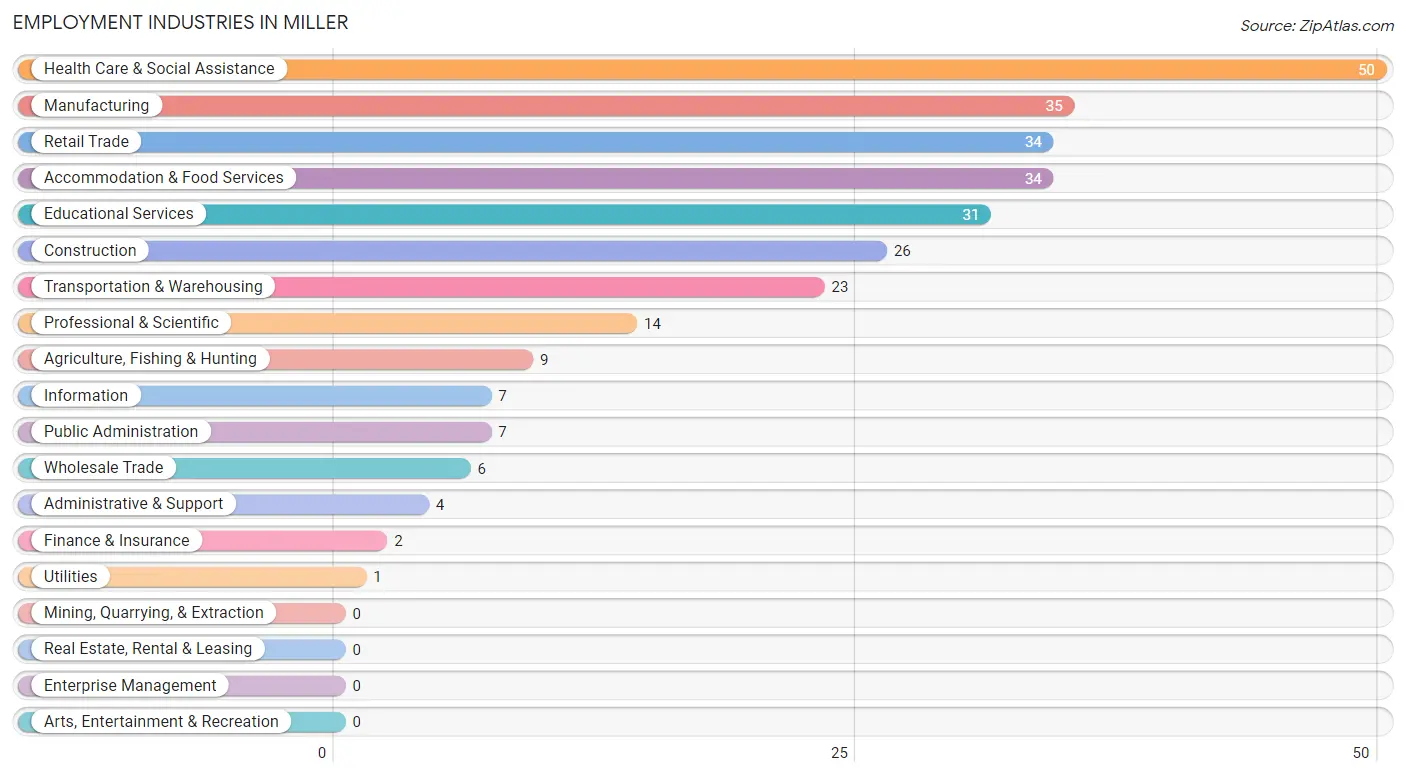
Employment Industries by Sex in Miller
The Miller industries that see more men than women are Construction (100.0%), Wholesale Trade (100.0%), and Utilities (100.0%), whereas the industries that tend to have a higher number of women are Health Care & Social Assistance (90.0%), Retail Trade (76.5%), and Educational Services (74.2%).
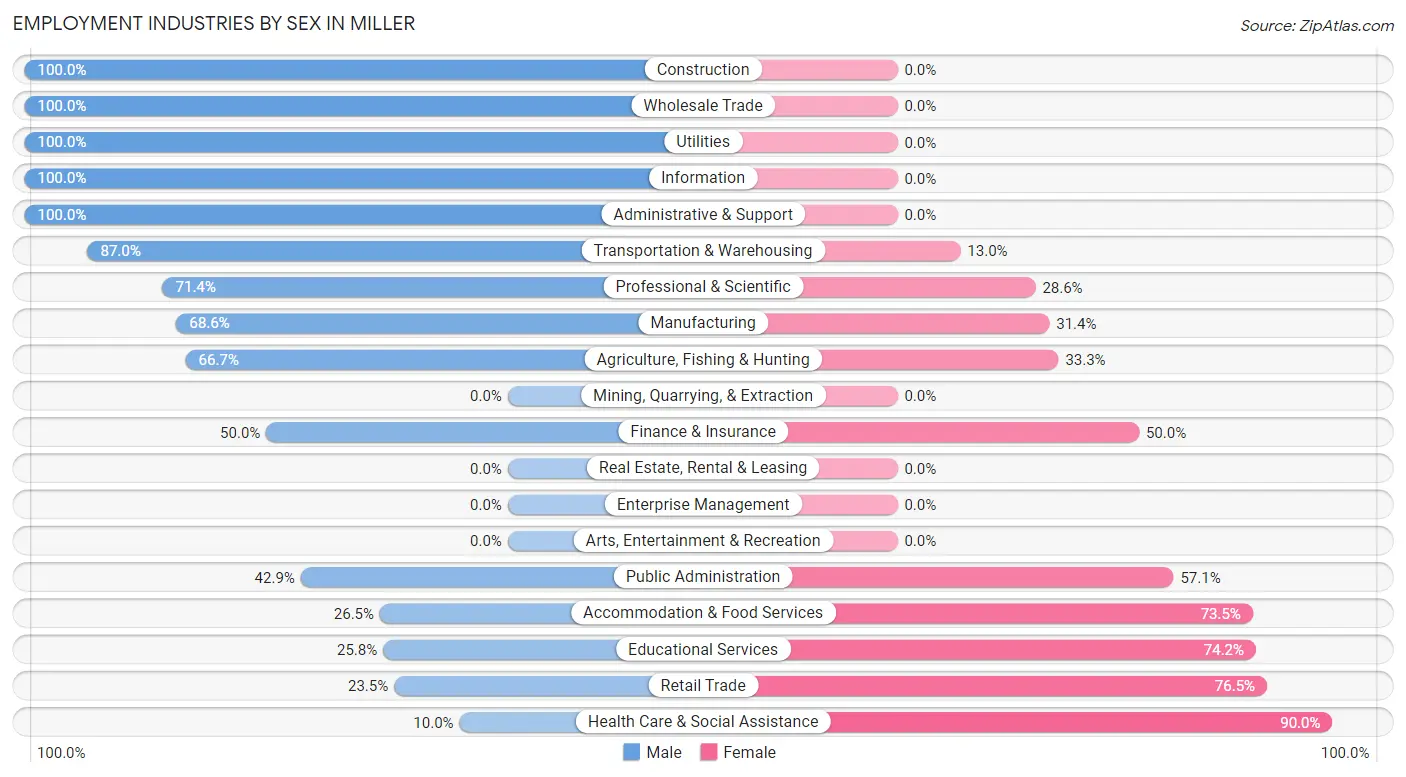
| Industry | Male | Female |
| Agriculture, Fishing & Hunting | 6 (66.7%) | 3 (33.3%) |
| Mining, Quarrying, & Extraction | 0 (0.0%) | 0 (0.0%) |
| Construction | 26 (100.0%) | 0 (0.0%) |
| Manufacturing | 24 (68.6%) | 11 (31.4%) |
| Wholesale Trade | 6 (100.0%) | 0 (0.0%) |
| Retail Trade | 8 (23.5%) | 26 (76.5%) |
| Transportation & Warehousing | 20 (87.0%) | 3 (13.0%) |
| Utilities | 1 (100.0%) | 0 (0.0%) |
| Information | 7 (100.0%) | 0 (0.0%) |
| Finance & Insurance | 1 (50.0%) | 1 (50.0%) |
| Real Estate, Rental & Leasing | 0 (0.0%) | 0 (0.0%) |
| Professional & Scientific | 10 (71.4%) | 4 (28.6%) |
| Enterprise Management | 0 (0.0%) | 0 (0.0%) |
| Administrative & Support | 4 (100.0%) | 0 (0.0%) |
| Educational Services | 8 (25.8%) | 23 (74.2%) |
| Health Care & Social Assistance | 5 (10.0%) | 45 (90.0%) |
| Arts, Entertainment & Recreation | 0 (0.0%) | 0 (0.0%) |
| Accommodation & Food Services | 9 (26.5%) | 25 (73.5%) |
| Public Administration | 3 (42.9%) | 4 (57.1%) |
| Total | 140 (47.8%) | 153 (52.2%) |
Education in Miller
School Enrollment in Miller
The most common levels of schooling among the 200 students in Miller are high school (82 | 41.0%), college / undergraduate (47 | 23.5%), and middle school (36 | 18.0%).
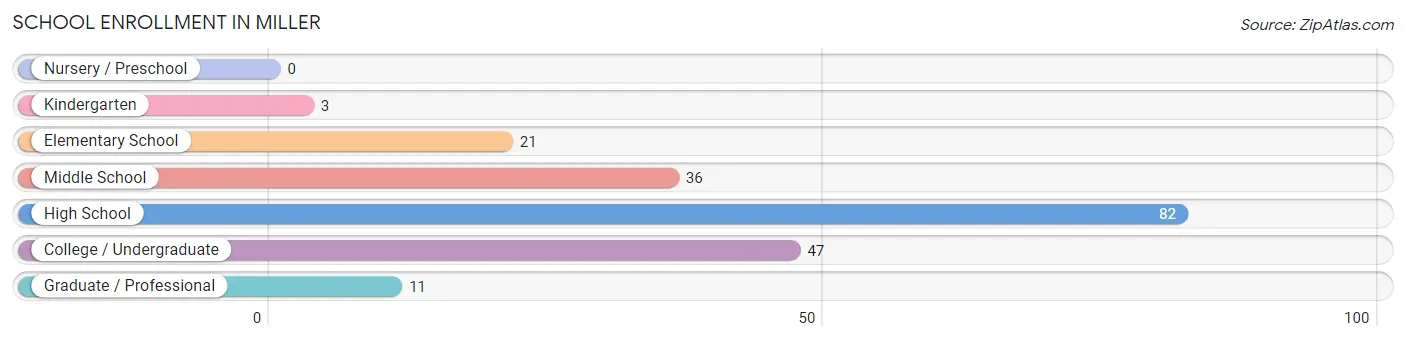
| School Level | # Students | % Students |
| Nursery / Preschool | 0 | 0.0% |
| Kindergarten | 3 | 1.5% |
| Elementary School | 21 | 10.5% |
| Middle School | 36 | 18.0% |
| High School | 82 | 41.0% |
| College / Undergraduate | 47 | 23.5% |
| Graduate / Professional | 11 | 5.5% |
| Total | 200 | 100.0% |
School Enrollment by Age by Funding Source in Miller
Out of a total of 200 students who are enrolled in schools in Miller, 31 (15.5%) attend a private institution, while the remaining 169 (84.5%) are enrolled in public schools. The age group of 20 to 24 year olds has the highest likelihood of being enrolled in private schools, with 10 (58.8% in the age bracket) enrolled. Conversely, the age group of 25 to 34 year olds has the lowest likelihood of being enrolled in a private school, with 8 (100.0% in the age bracket) attending a public institution.
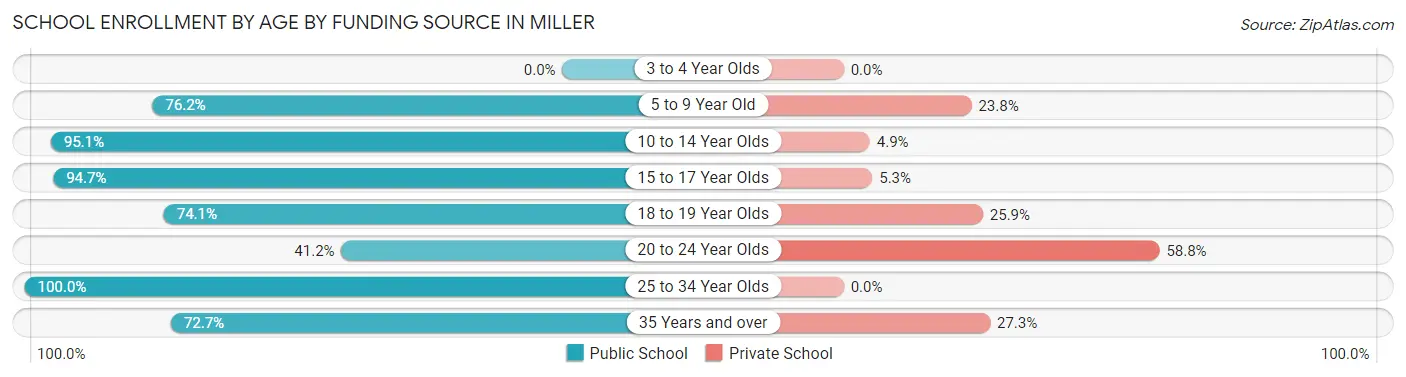
| Age Bracket | Public School | Private School |
| 3 to 4 Year Olds | 0 (0.0%) | 0 (0.0%) |
| 5 to 9 Year Old | 16 (76.2%) | 5 (23.8%) |
| 10 to 14 Year Olds | 39 (95.1%) | 2 (4.9%) |
| 15 to 17 Year Olds | 71 (94.7%) | 4 (5.3%) |
| 18 to 19 Year Olds | 20 (74.1%) | 7 (25.9%) |
| 20 to 24 Year Olds | 7 (41.2%) | 10 (58.8%) |
| 25 to 34 Year Olds | 8 (100.0%) | 0 (0.0%) |
| 35 Years and over | 8 (72.7%) | 3 (27.3%) |
| Total | 169 (84.5%) | 31 (15.5%) |
Educational Attainment by Field of Study in Miller
Education (26 | 32.1%), business (17 | 21.0%), bio, nature & agricultural (9 | 11.1%), science & technology (7 | 8.6%), and engineering (6 | 7.4%) are the most common fields of study among 81 individuals in Miller who have obtained a bachelor's degree or higher.
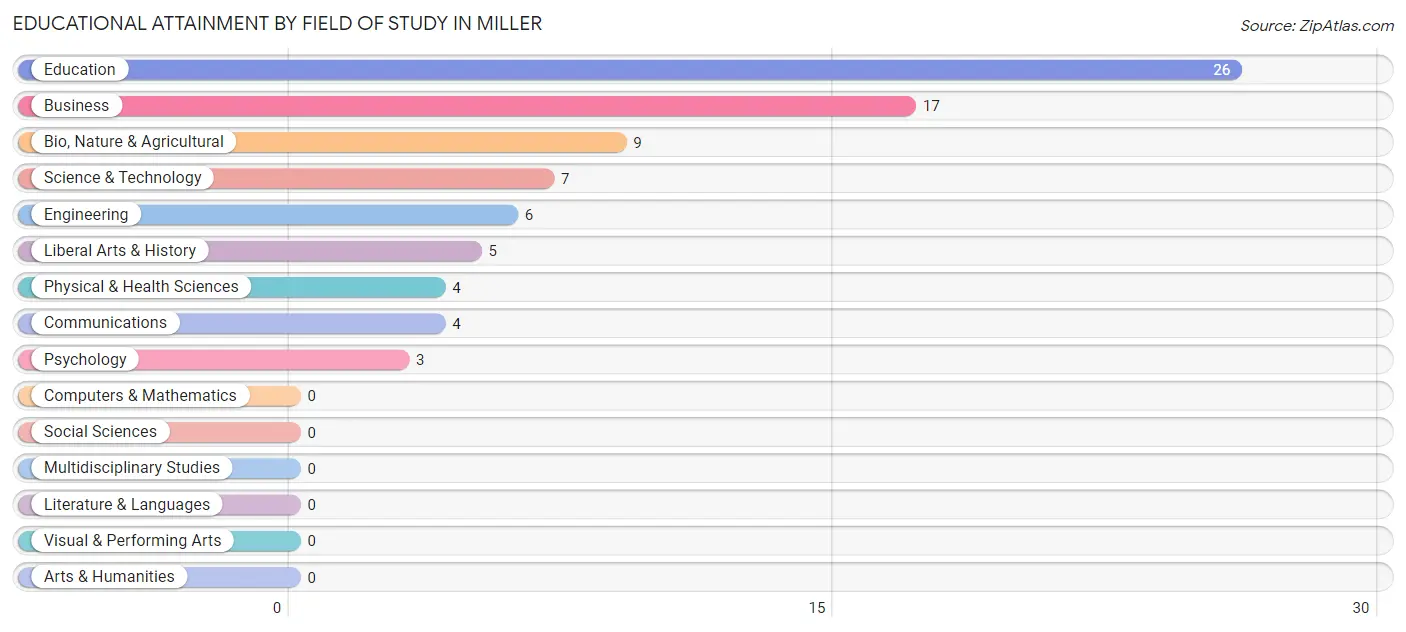
| Field of Study | # Graduates | % Graduates |
| Computers & Mathematics | 0 | 0.0% |
| Bio, Nature & Agricultural | 9 | 11.1% |
| Physical & Health Sciences | 4 | 4.9% |
| Psychology | 3 | 3.7% |
| Social Sciences | 0 | 0.0% |
| Engineering | 6 | 7.4% |
| Multidisciplinary Studies | 0 | 0.0% |
| Science & Technology | 7 | 8.6% |
| Business | 17 | 21.0% |
| Education | 26 | 32.1% |
| Literature & Languages | 0 | 0.0% |
| Liberal Arts & History | 5 | 6.2% |
| Visual & Performing Arts | 0 | 0.0% |
| Communications | 4 | 4.9% |
| Arts & Humanities | 0 | 0.0% |
| Total | 81 | 100.0% |
Transportation & Commute in Miller
Vehicle Availability by Sex in Miller
The most prevalent vehicle ownership categories in Miller are males with 2 vehicles (55, accounting for 39.3%) and females with 2 vehicles (53, making up 35.9%).
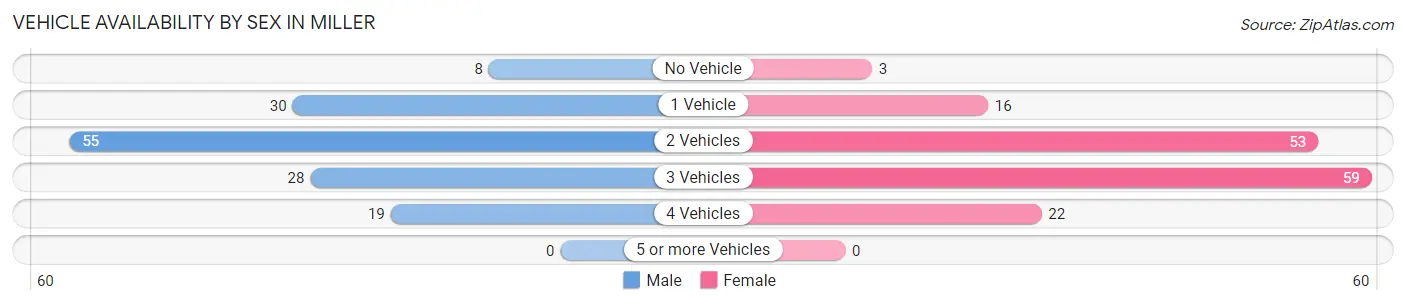
| Vehicles Available | Male | Female |
| No Vehicle | 8 (5.7%) | 3 (2.0%) |
| 1 Vehicle | 30 (21.4%) | 16 (10.5%) |
| 2 Vehicles | 55 (39.3%) | 53 (34.6%) |
| 3 Vehicles | 28 (20.0%) | 59 (38.6%) |
| 4 Vehicles | 19 (13.6%) | 22 (14.4%) |
| 5 or more Vehicles | 0 (0.0%) | 0 (0.0%) |
| Total | 140 (100.0%) | 153 (100.0%) |
Commute Time in Miller
The most frequently occuring commute durations in Miller are 30 to 34 minutes (57 commuters, 21.0%), 35 to 39 minutes (27 commuters, 10.0%), and 20 to 24 minutes (26 commuters, 9.6%).
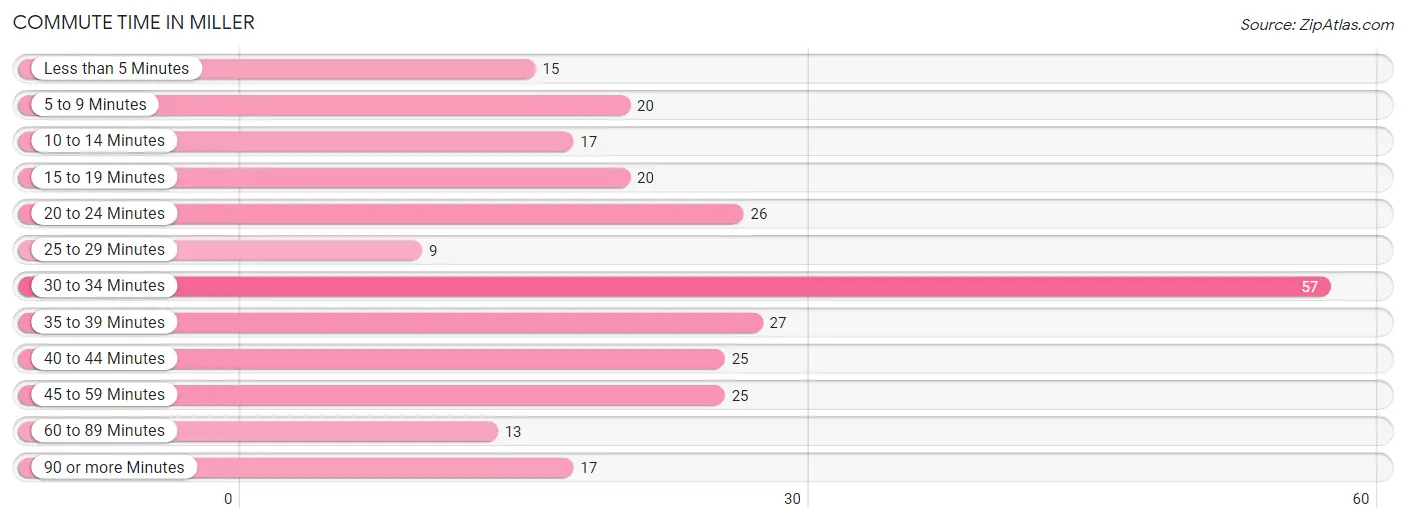
| Commute Time | # Commuters | % Commuters |
| Less than 5 Minutes | 15 | 5.5% |
| 5 to 9 Minutes | 20 | 7.4% |
| 10 to 14 Minutes | 17 | 6.3% |
| 15 to 19 Minutes | 20 | 7.4% |
| 20 to 24 Minutes | 26 | 9.6% |
| 25 to 29 Minutes | 9 | 3.3% |
| 30 to 34 Minutes | 57 | 21.0% |
| 35 to 39 Minutes | 27 | 10.0% |
| 40 to 44 Minutes | 25 | 9.2% |
| 45 to 59 Minutes | 25 | 9.2% |
| 60 to 89 Minutes | 13 | 4.8% |
| 90 or more Minutes | 17 | 6.3% |
Commute Time by Sex in Miller
The most common commute times in Miller are 30 to 34 minutes (32 commuters, 23.9%) for males and 30 to 34 minutes (25 commuters, 18.2%) for females.
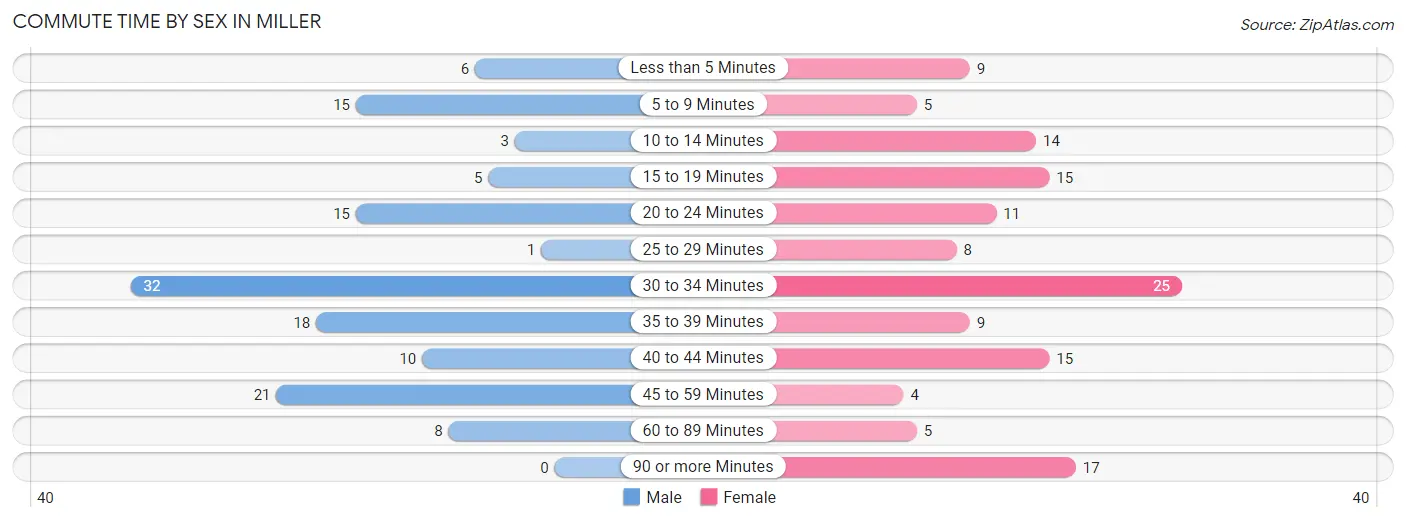
| Commute Time | Male | Female |
| Less than 5 Minutes | 6 (4.5%) | 9 (6.6%) |
| 5 to 9 Minutes | 15 (11.2%) | 5 (3.6%) |
| 10 to 14 Minutes | 3 (2.2%) | 14 (10.2%) |
| 15 to 19 Minutes | 5 (3.7%) | 15 (11.0%) |
| 20 to 24 Minutes | 15 (11.2%) | 11 (8.0%) |
| 25 to 29 Minutes | 1 (0.7%) | 8 (5.8%) |
| 30 to 34 Minutes | 32 (23.9%) | 25 (18.2%) |
| 35 to 39 Minutes | 18 (13.4%) | 9 (6.6%) |
| 40 to 44 Minutes | 10 (7.5%) | 15 (11.0%) |
| 45 to 59 Minutes | 21 (15.7%) | 4 (2.9%) |
| 60 to 89 Minutes | 8 (6.0%) | 5 (3.6%) |
| 90 or more Minutes | 0 (0.0%) | 17 (12.4%) |
Time of Departure to Work by Sex in Miller
The most frequent times of departure to work in Miller are 6:30 AM to 6:59 AM (23, 17.2%) for males and 6:30 AM to 6:59 AM (34, 24.8%) for females.
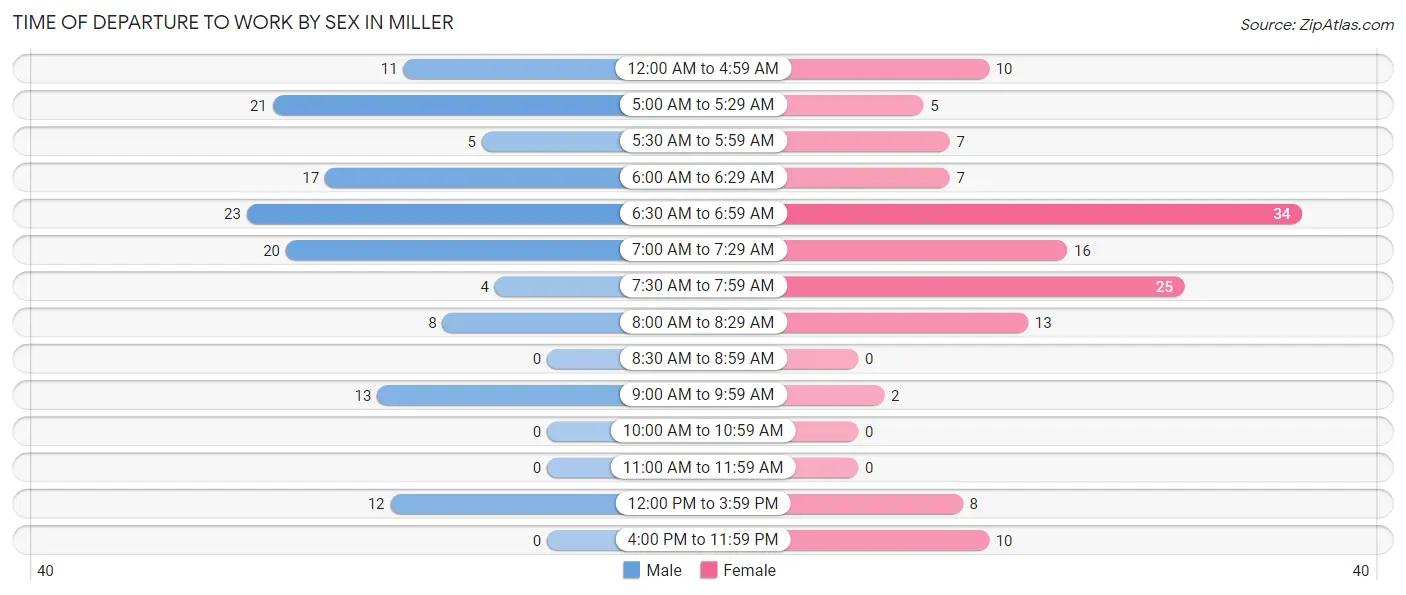
| Time of Departure | Male | Female |
| 12:00 AM to 4:59 AM | 11 (8.2%) | 10 (7.3%) |
| 5:00 AM to 5:29 AM | 21 (15.7%) | 5 (3.6%) |
| 5:30 AM to 5:59 AM | 5 (3.7%) | 7 (5.1%) |
| 6:00 AM to 6:29 AM | 17 (12.7%) | 7 (5.1%) |
| 6:30 AM to 6:59 AM | 23 (17.2%) | 34 (24.8%) |
| 7:00 AM to 7:29 AM | 20 (14.9%) | 16 (11.7%) |
| 7:30 AM to 7:59 AM | 4 (3.0%) | 25 (18.2%) |
| 8:00 AM to 8:29 AM | 8 (6.0%) | 13 (9.5%) |
| 8:30 AM to 8:59 AM | 0 (0.0%) | 0 (0.0%) |
| 9:00 AM to 9:59 AM | 13 (9.7%) | 2 (1.5%) |
| 10:00 AM to 10:59 AM | 0 (0.0%) | 0 (0.0%) |
| 11:00 AM to 11:59 AM | 0 (0.0%) | 0 (0.0%) |
| 12:00 PM to 3:59 PM | 12 (9.0%) | 8 (5.8%) |
| 4:00 PM to 11:59 PM | 0 (0.0%) | 10 (7.3%) |
| Total | 134 (100.0%) | 137 (100.0%) |
Housing Occupancy in Miller
Occupancy by Ownership in Miller
Of the total 341 dwellings in Miller, owner-occupied units account for 227 (66.6%), while renter-occupied units make up 114 (33.4%).
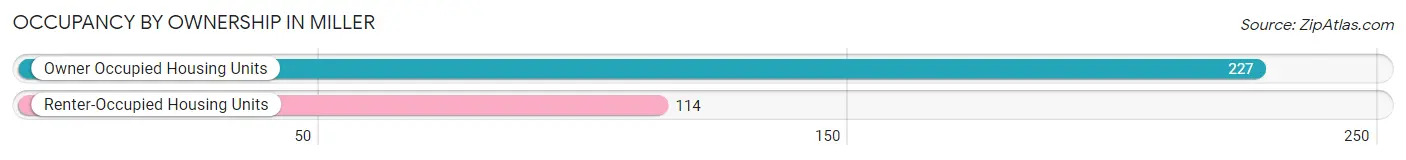
| Occupancy | # Housing Units | % Housing Units |
| Owner Occupied Housing Units | 227 | 66.6% |
| Renter-Occupied Housing Units | 114 | 33.4% |
| Total Occupied Housing Units | 341 | 100.0% |
Occupancy by Household Size in Miller

| Household Size | # Housing Units | % Housing Units |
| 1-Person Household | 116 | 34.0% |
| 2-Person Household | 103 | 30.2% |
| 3-Person Household | 50 | 14.7% |
| 4+ Person Household | 72 | 21.1% |
| Total Housing Units | 341 | 100.0% |
Occupancy by Ownership by Household Size in Miller
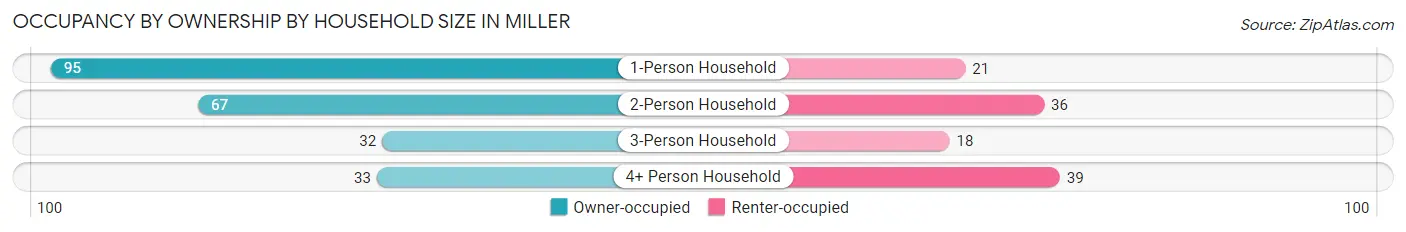
| Household Size | Owner-occupied | Renter-occupied |
| 1-Person Household | 95 (81.9%) | 21 (18.1%) |
| 2-Person Household | 67 (65.0%) | 36 (34.9%) |
| 3-Person Household | 32 (64.0%) | 18 (36.0%) |
| 4+ Person Household | 33 (45.8%) | 39 (54.2%) |
| Total Housing Units | 227 (66.6%) | 114 (33.4%) |
Occupancy by Educational Attainment in Miller
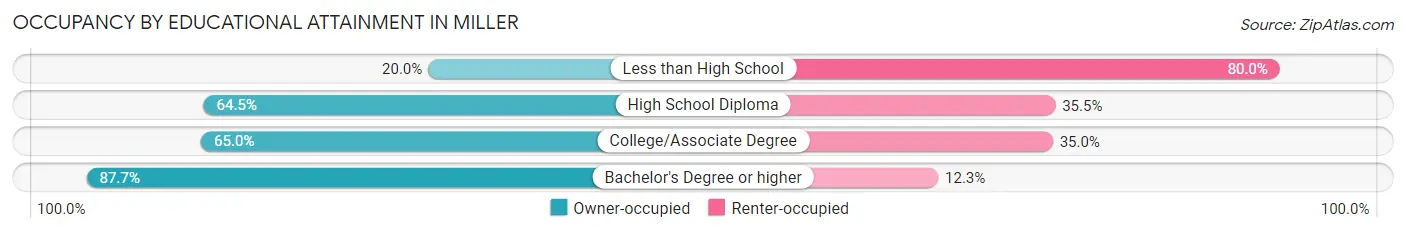
| Household Size | Owner-occupied | Renter-occupied |
| Less than High School | 3 (20.0%) | 12 (80.0%) |
| High School Diploma | 109 (64.5%) | 60 (35.5%) |
| College/Associate Degree | 65 (65.0%) | 35 (35.0%) |
| Bachelor's Degree or higher | 50 (87.7%) | 7 (12.3%) |
Occupancy by Age of Householder in Miller
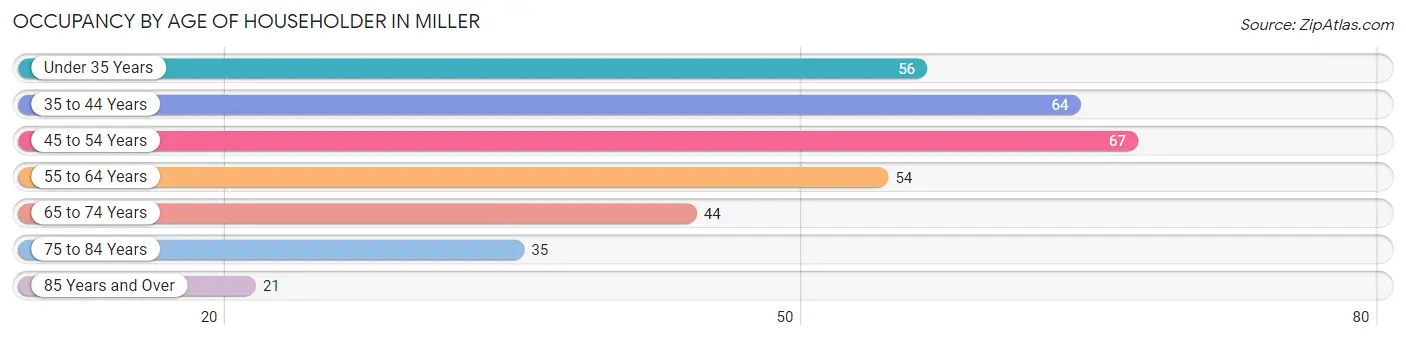
| Age Bracket | # Households | % Households |
| Under 35 Years | 56 | 16.4% |
| 35 to 44 Years | 64 | 18.8% |
| 45 to 54 Years | 67 | 19.7% |
| 55 to 64 Years | 54 | 15.8% |
| 65 to 74 Years | 44 | 12.9% |
| 75 to 84 Years | 35 | 10.3% |
| 85 Years and Over | 21 | 6.2% |
| Total | 341 | 100.0% |
Housing Finances in Miller
Median Income by Occupancy in Miller
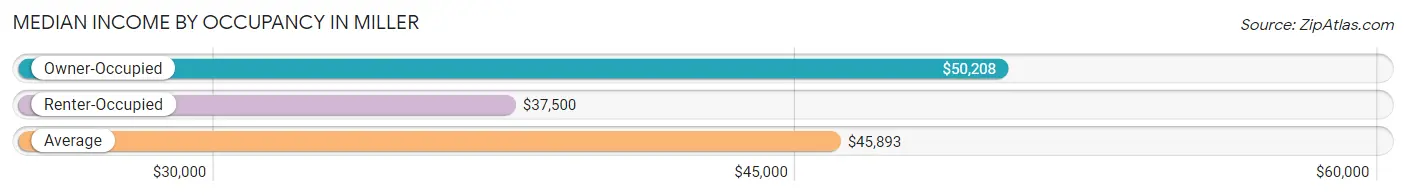
| Occupancy Type | # Households | Median Income |
| Owner-Occupied | 227 (66.6%) | $50,208 |
| Renter-Occupied | 114 (33.4%) | $37,500 |
| Average | 341 (100.0%) | $45,893 |
Occupancy by Householder Income Bracket in Miller
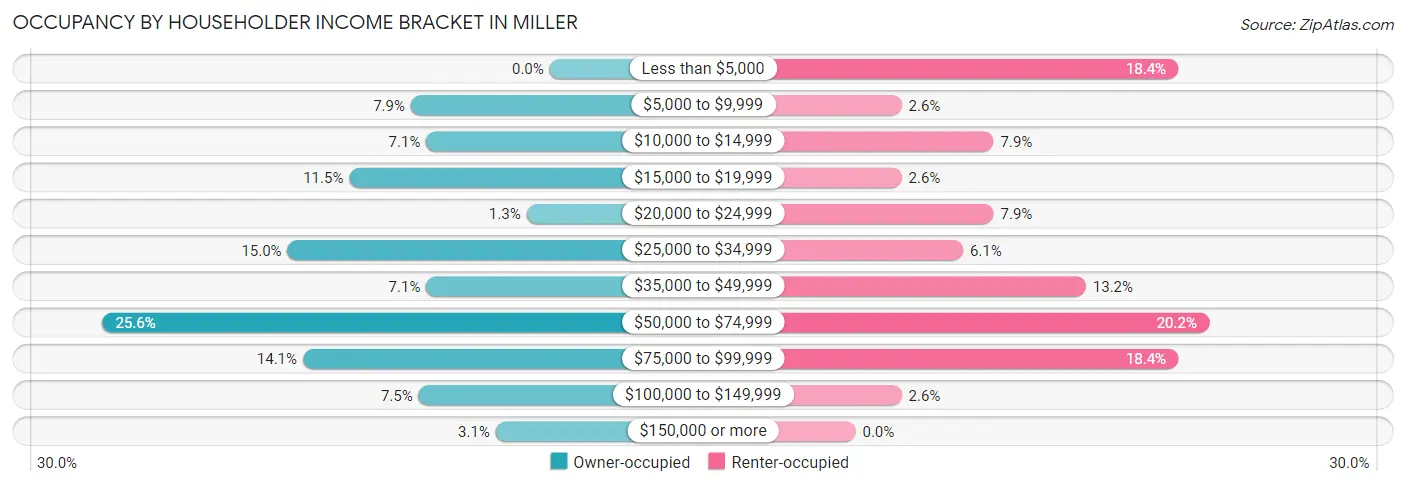
| Income Bracket | Owner-occupied | Renter-occupied |
| Less than $5,000 | 0 (0.0%) | 21 (18.4%) |
| $5,000 to $9,999 | 18 (7.9%) | 3 (2.6%) |
| $10,000 to $14,999 | 16 (7.0%) | 9 (7.9%) |
| $15,000 to $19,999 | 26 (11.5%) | 3 (2.6%) |
| $20,000 to $24,999 | 3 (1.3%) | 9 (7.9%) |
| $25,000 to $34,999 | 34 (15.0%) | 7 (6.1%) |
| $35,000 to $49,999 | 16 (7.0%) | 15 (13.2%) |
| $50,000 to $74,999 | 58 (25.6%) | 23 (20.2%) |
| $75,000 to $99,999 | 32 (14.1%) | 21 (18.4%) |
| $100,000 to $149,999 | 17 (7.5%) | 3 (2.6%) |
| $150,000 or more | 7 (3.1%) | 0 (0.0%) |
| Total | 227 (100.0%) | 114 (100.0%) |
Monthly Housing Cost Tiers in Miller
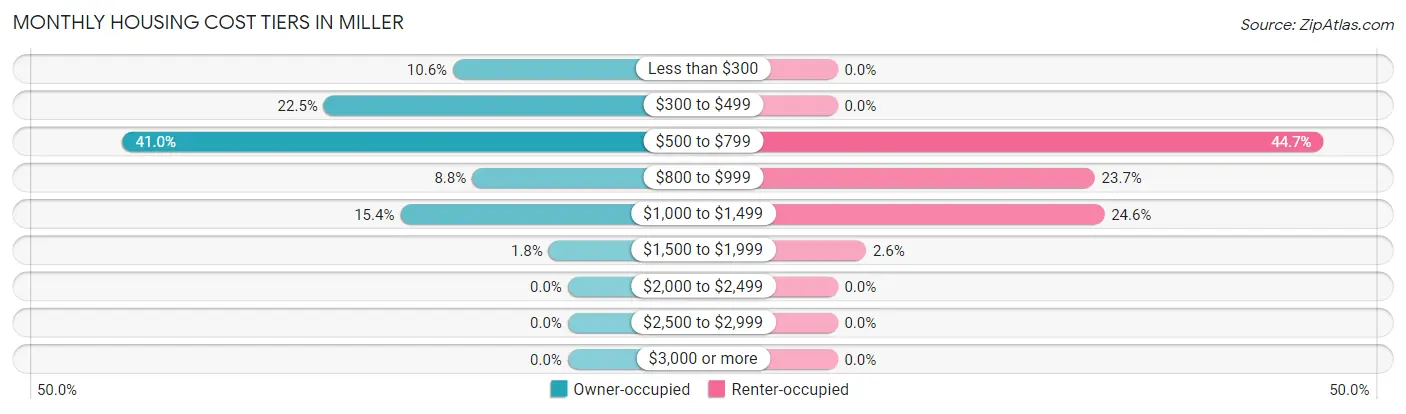
| Monthly Cost | Owner-occupied | Renter-occupied |
| Less than $300 | 24 (10.6%) | 0 (0.0%) |
| $300 to $499 | 51 (22.5%) | 0 (0.0%) |
| $500 to $799 | 93 (41.0%) | 51 (44.7%) |
| $800 to $999 | 20 (8.8%) | 27 (23.7%) |
| $1,000 to $1,499 | 35 (15.4%) | 28 (24.6%) |
| $1,500 to $1,999 | 4 (1.8%) | 3 (2.6%) |
| $2,000 to $2,499 | 0 (0.0%) | 0 (0.0%) |
| $2,500 to $2,999 | 0 (0.0%) | 0 (0.0%) |
| $3,000 or more | 0 (0.0%) | 0 (0.0%) |
| Total | 227 (100.0%) | 114 (100.0%) |
Physical Housing Characteristics in Miller
Housing Structures in Miller
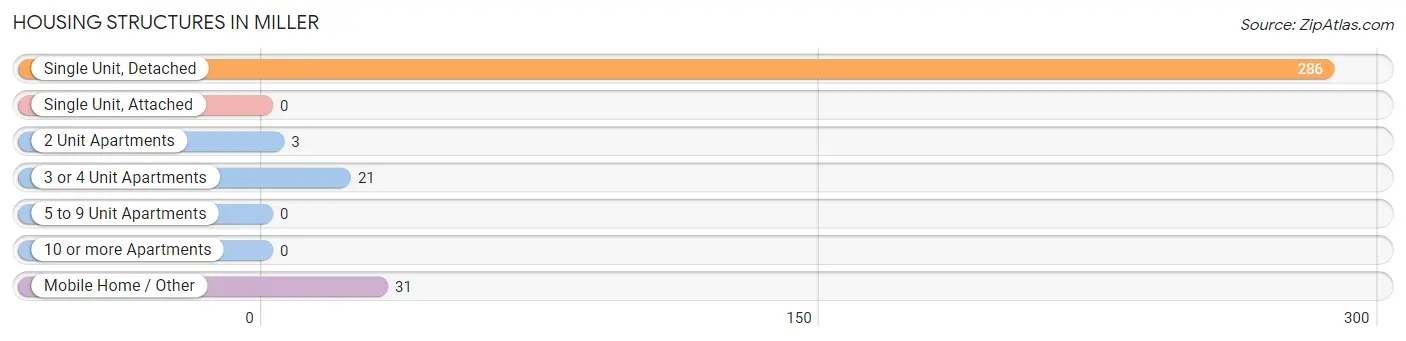
| Structure Type | # Housing Units | % Housing Units |
| Single Unit, Detached | 286 | 83.9% |
| Single Unit, Attached | 0 | 0.0% |
| 2 Unit Apartments | 3 | 0.9% |
| 3 or 4 Unit Apartments | 21 | 6.2% |
| 5 to 9 Unit Apartments | 0 | 0.0% |
| 10 or more Apartments | 0 | 0.0% |
| Mobile Home / Other | 31 | 9.1% |
| Total | 341 | 100.0% |
Housing Structures by Occupancy in Miller
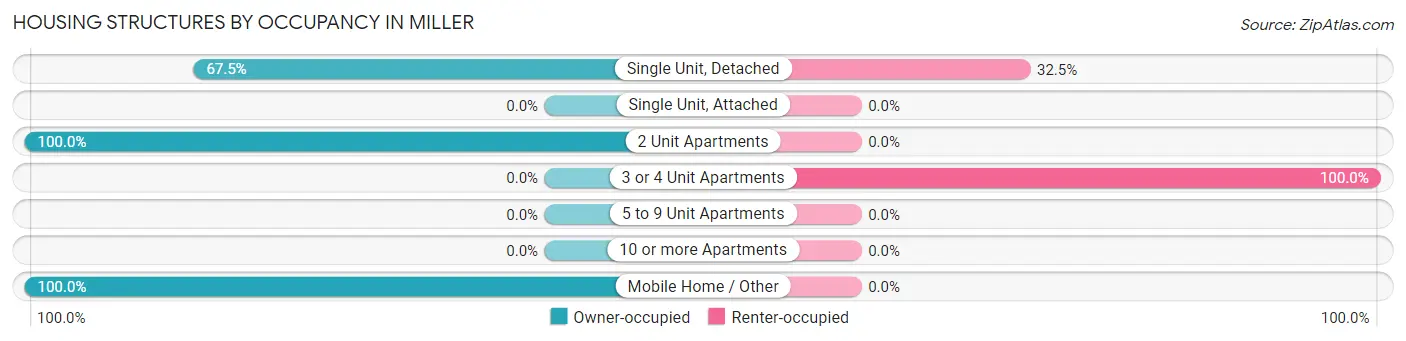
| Structure Type | Owner-occupied | Renter-occupied |
| Single Unit, Detached | 193 (67.5%) | 93 (32.5%) |
| Single Unit, Attached | 0 (0.0%) | 0 (0.0%) |
| 2 Unit Apartments | 3 (100.0%) | 0 (0.0%) |
| 3 or 4 Unit Apartments | 0 (0.0%) | 21 (100.0%) |
| 5 to 9 Unit Apartments | 0 (0.0%) | 0 (0.0%) |
| 10 or more Apartments | 0 (0.0%) | 0 (0.0%) |
| Mobile Home / Other | 31 (100.0%) | 0 (0.0%) |
| Total | 227 (66.6%) | 114 (33.4%) |
Housing Structures by Number of Rooms in Miller
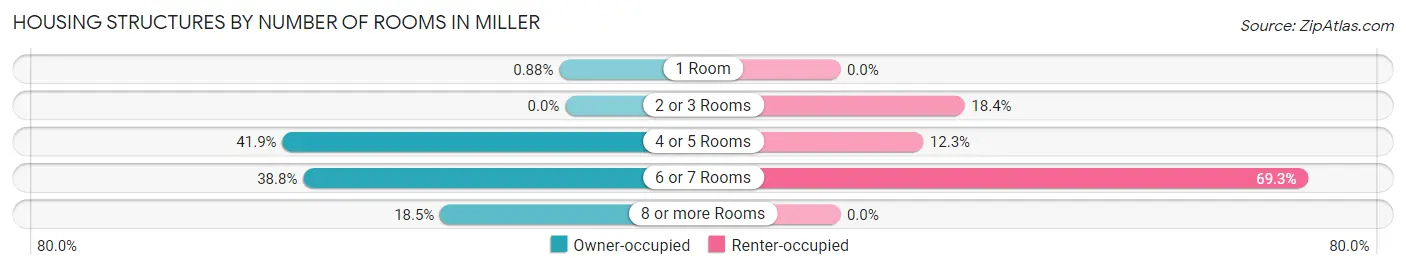
| Number of Rooms | Owner-occupied | Renter-occupied |
| 1 Room | 2 (0.9%) | 0 (0.0%) |
| 2 or 3 Rooms | 0 (0.0%) | 21 (18.4%) |
| 4 or 5 Rooms | 95 (41.8%) | 14 (12.3%) |
| 6 or 7 Rooms | 88 (38.8%) | 79 (69.3%) |
| 8 or more Rooms | 42 (18.5%) | 0 (0.0%) |
| Total | 227 (100.0%) | 114 (100.0%) |
Housing Structure by Heating Type in Miller
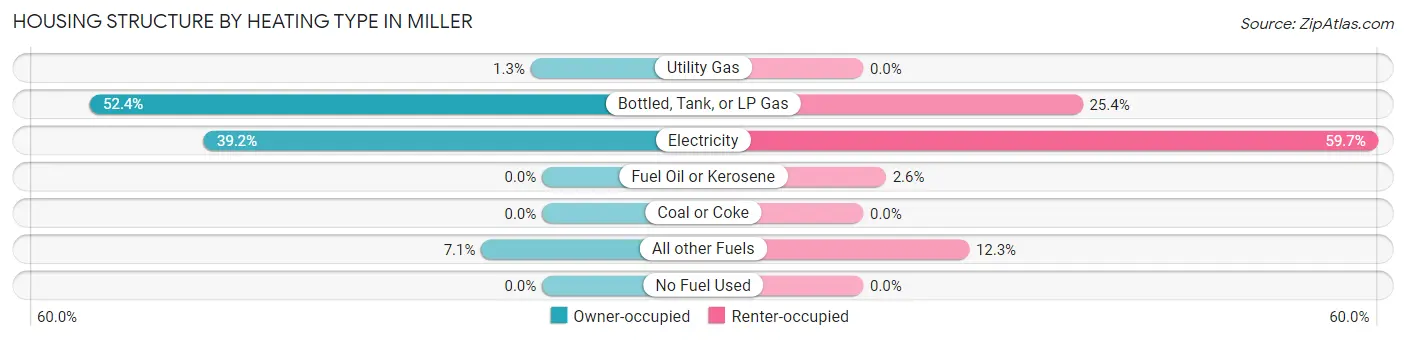
| Heating Type | Owner-occupied | Renter-occupied |
| Utility Gas | 3 (1.3%) | 0 (0.0%) |
| Bottled, Tank, or LP Gas | 119 (52.4%) | 29 (25.4%) |
| Electricity | 89 (39.2%) | 68 (59.7%) |
| Fuel Oil or Kerosene | 0 (0.0%) | 3 (2.6%) |
| Coal or Coke | 0 (0.0%) | 0 (0.0%) |
| All other Fuels | 16 (7.0%) | 14 (12.3%) |
| No Fuel Used | 0 (0.0%) | 0 (0.0%) |
| Total | 227 (100.0%) | 114 (100.0%) |
Household Vehicle Usage in Miller
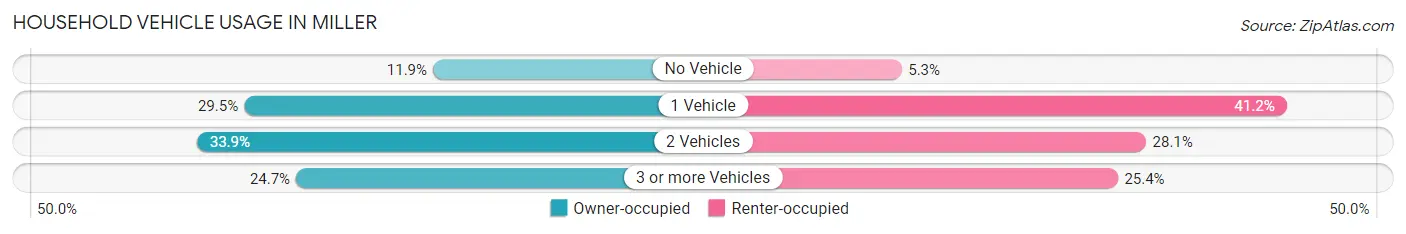
| Vehicles per Household | Owner-occupied | Renter-occupied |
| No Vehicle | 27 (11.9%) | 6 (5.3%) |
| 1 Vehicle | 67 (29.5%) | 47 (41.2%) |
| 2 Vehicles | 77 (33.9%) | 32 (28.1%) |
| 3 or more Vehicles | 56 (24.7%) | 29 (25.4%) |
| Total | 227 (100.0%) | 114 (100.0%) |
Real Estate & Mortgages in Miller
Real Estate and Mortgage Overview in Miller
| Characteristic | Without Mortgage | With Mortgage |
| Housing Units | 139 | 88 |
| Median Property Value | $87,500 | $91,700 |
| Median Household Income | $40,417 | $7 |
| Monthly Housing Costs | $504 | $0 |
| Real Estate Taxes | $629 | $10 |
Property Value by Mortgage Status in Miller
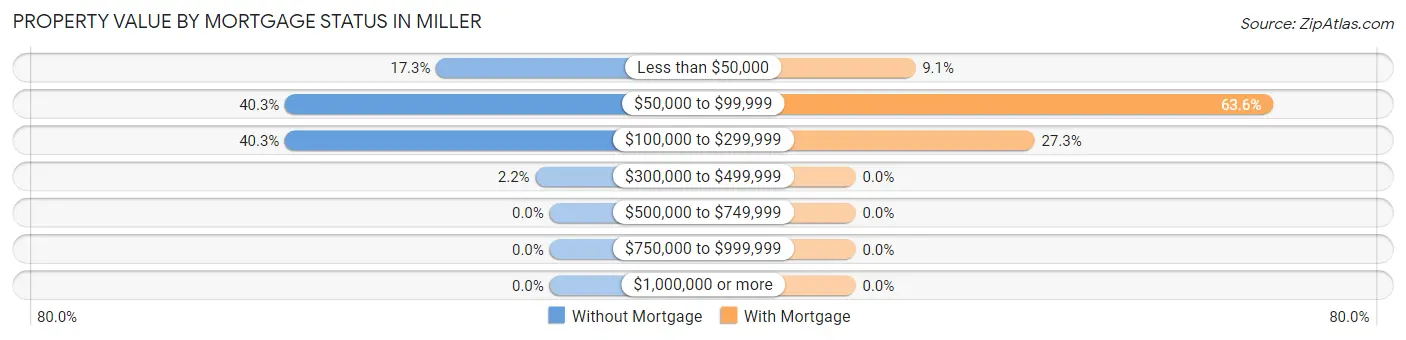
| Property Value | Without Mortgage | With Mortgage |
| Less than $50,000 | 24 (17.3%) | 8 (9.1%) |
| $50,000 to $99,999 | 56 (40.3%) | 56 (63.6%) |
| $100,000 to $299,999 | 56 (40.3%) | 24 (27.3%) |
| $300,000 to $499,999 | 3 (2.2%) | 0 (0.0%) |
| $500,000 to $749,999 | 0 (0.0%) | 0 (0.0%) |
| $750,000 to $999,999 | 0 (0.0%) | 0 (0.0%) |
| $1,000,000 or more | 0 (0.0%) | 0 (0.0%) |
| Total | 139 (100.0%) | 88 (100.0%) |
Household Income by Mortgage Status in Miller
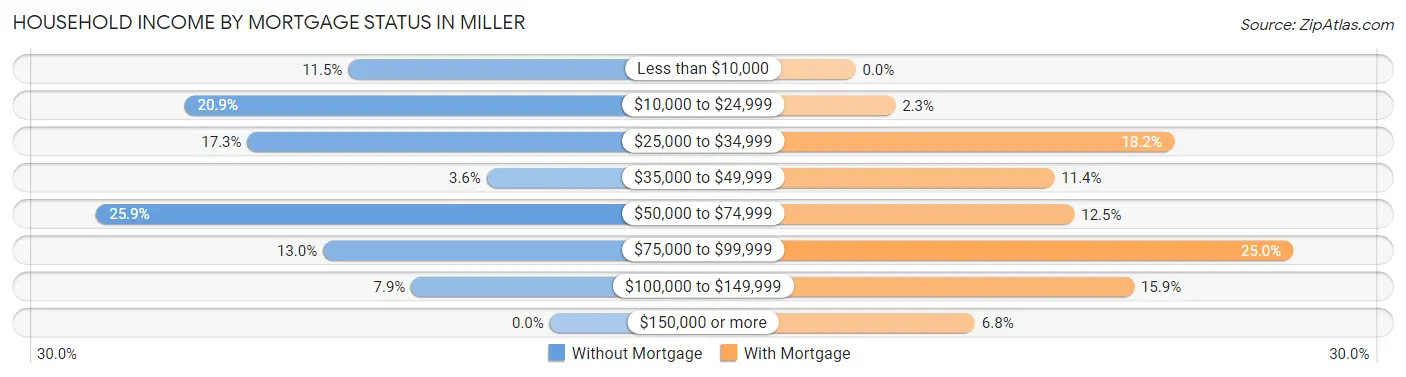
| Household Income | Without Mortgage | With Mortgage |
| Less than $10,000 | 16 (11.5%) | 0 (0.0%) |
| $10,000 to $24,999 | 29 (20.9%) | 2 (2.3%) |
| $25,000 to $34,999 | 24 (17.3%) | 16 (18.2%) |
| $35,000 to $49,999 | 5 (3.6%) | 10 (11.4%) |
| $50,000 to $74,999 | 36 (25.9%) | 11 (12.5%) |
| $75,000 to $99,999 | 18 (13.0%) | 22 (25.0%) |
| $100,000 to $149,999 | 11 (7.9%) | 14 (15.9%) |
| $150,000 or more | 0 (0.0%) | 6 (6.8%) |
| Total | 139 (100.0%) | 88 (100.0%) |
Property Value to Household Income Ratio in Miller
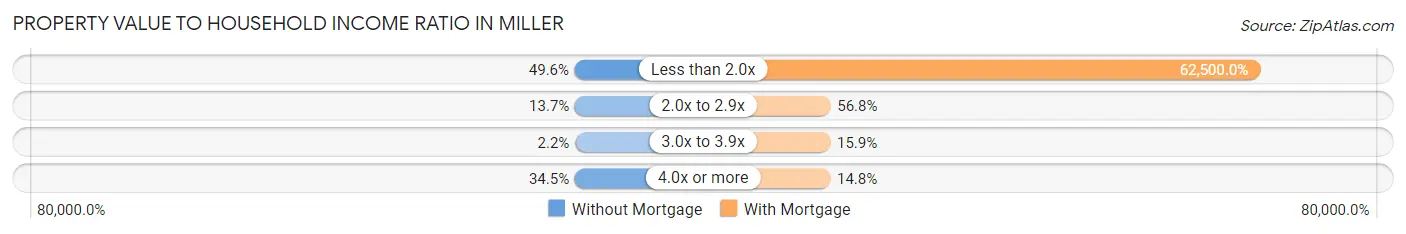
| Value-to-Income Ratio | Without Mortgage | With Mortgage |
| Less than 2.0x | 69 (49.6%) | 55,000 (62,500.0%) |
| 2.0x to 2.9x | 19 (13.7%) | 50 (56.8%) |
| 3.0x to 3.9x | 3 (2.2%) | 14 (15.9%) |
| 4.0x or more | 48 (34.5%) | 13 (14.8%) |
| Total | 139 (100.0%) | 88 (100.0%) |
Real Estate Taxes by Mortgage Status in Miller
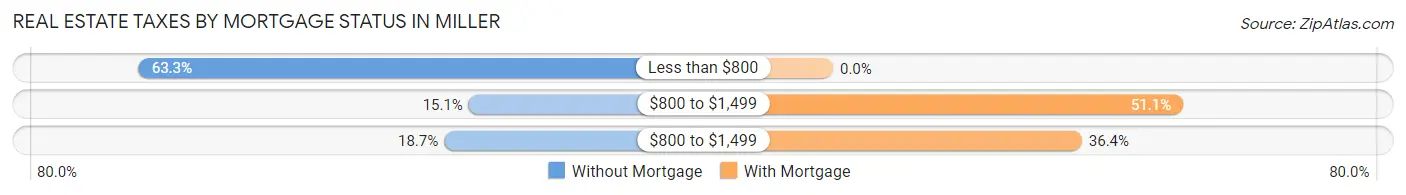
| Property Taxes | Without Mortgage | With Mortgage |
| Less than $800 | 88 (63.3%) | 0 (0.0%) |
| $800 to $1,499 | 21 (15.1%) | 45 (51.1%) |
| $800 to $1,499 | 26 (18.7%) | 32 (36.4%) |
| Total | 139 (100.0%) | 88 (100.0%) |
Health & Disability in Miller
Health Insurance Coverage by Age in Miller
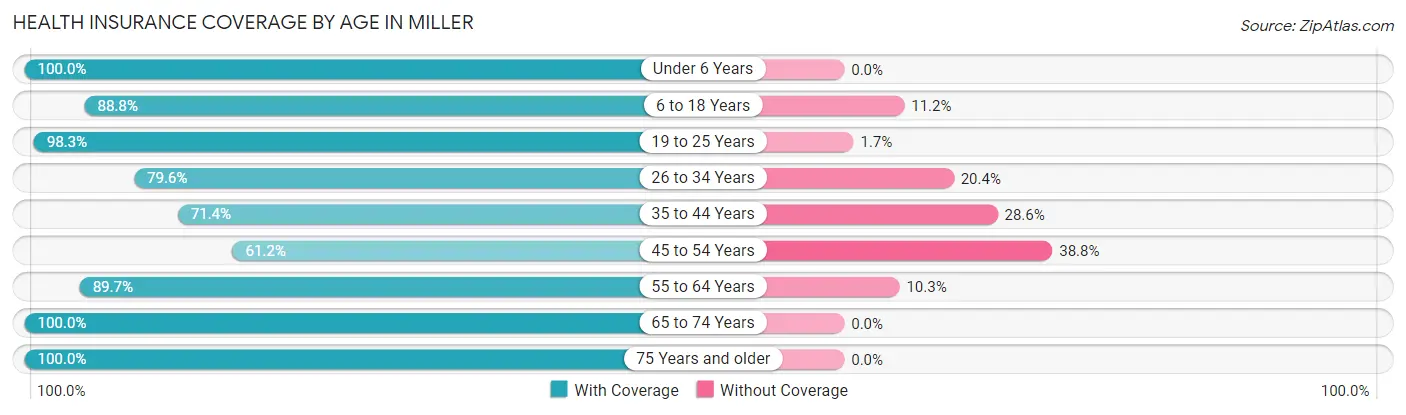
| Age Bracket | With Coverage | Without Coverage |
| Under 6 Years | 19 (100.0%) | 0 (0.0%) |
| 6 to 18 Years | 127 (88.8%) | 16 (11.2%) |
| 19 to 25 Years | 57 (98.3%) | 1 (1.7%) |
| 26 to 34 Years | 78 (79.6%) | 20 (20.4%) |
| 35 to 44 Years | 65 (71.4%) | 26 (28.6%) |
| 45 to 54 Years | 71 (61.2%) | 45 (38.8%) |
| 55 to 64 Years | 61 (89.7%) | 7 (10.3%) |
| 65 to 74 Years | 64 (100.0%) | 0 (0.0%) |
| 75 Years and older | 70 (100.0%) | 0 (0.0%) |
| Total | 612 (84.2%) | 115 (15.8%) |
Health Insurance Coverage by Citizenship Status in Miller
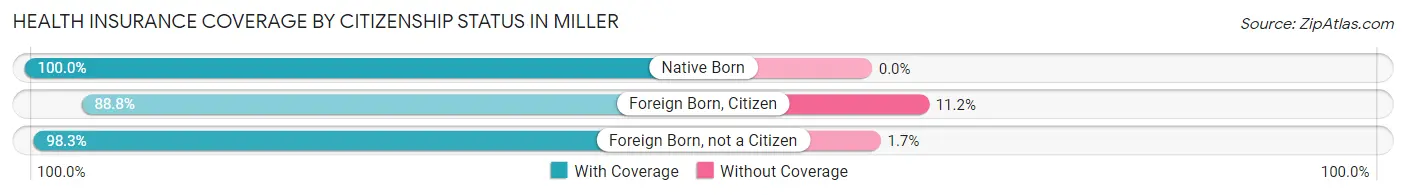
| Citizenship Status | With Coverage | Without Coverage |
| Native Born | 19 (100.0%) | 0 (0.0%) |
| Foreign Born, Citizen | 127 (88.8%) | 16 (11.2%) |
| Foreign Born, not a Citizen | 57 (98.3%) | 1 (1.7%) |
Health Insurance Coverage by Household Income in Miller
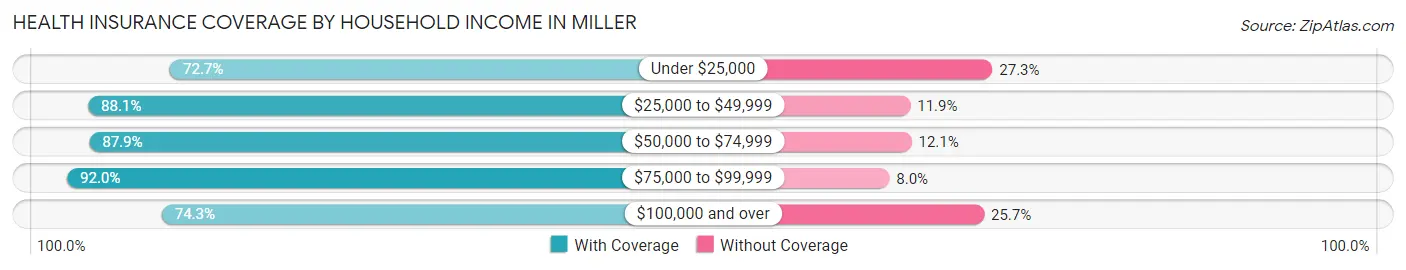
| Household Income | With Coverage | Without Coverage |
| Under $25,000 | 112 (72.7%) | 42 (27.3%) |
| $25,000 to $49,999 | 111 (88.1%) | 15 (11.9%) |
| $50,000 to $74,999 | 210 (87.9%) | 29 (12.1%) |
| $75,000 to $99,999 | 127 (92.0%) | 11 (8.0%) |
| $100,000 and over | 52 (74.3%) | 18 (25.7%) |
Public vs Private Health Insurance Coverage by Age in Miller
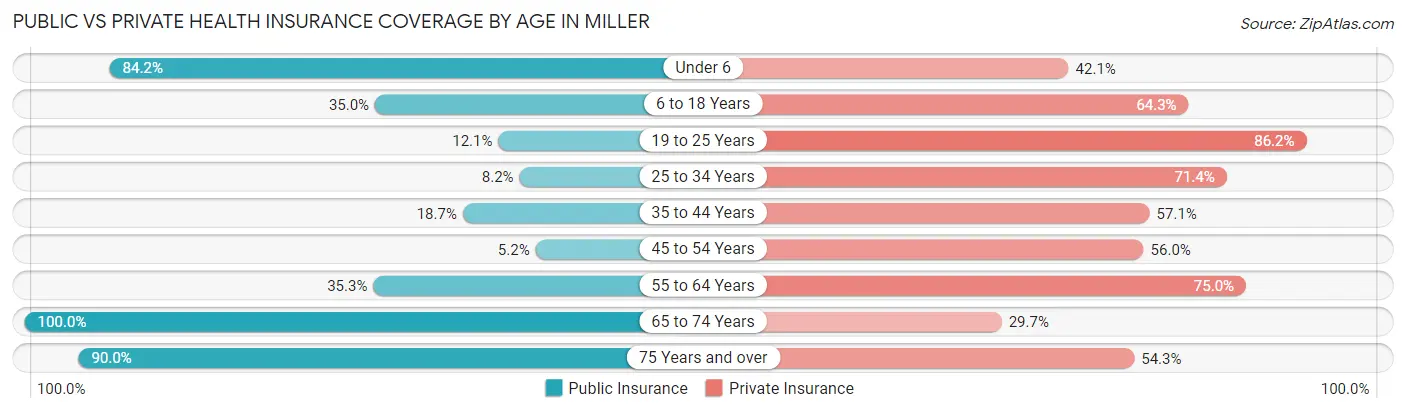
| Age Bracket | Public Insurance | Private Insurance |
| Under 6 | 16 (84.2%) | 8 (42.1%) |
| 6 to 18 Years | 50 (35.0%) | 92 (64.3%) |
| 19 to 25 Years | 7 (12.1%) | 50 (86.2%) |
| 25 to 34 Years | 8 (8.2%) | 70 (71.4%) |
| 35 to 44 Years | 17 (18.7%) | 52 (57.1%) |
| 45 to 54 Years | 6 (5.2%) | 65 (56.0%) |
| 55 to 64 Years | 24 (35.3%) | 51 (75.0%) |
| 65 to 74 Years | 64 (100.0%) | 19 (29.7%) |
| 75 Years and over | 63 (90.0%) | 38 (54.3%) |
| Total | 255 (35.1%) | 445 (61.2%) |
Disability Status by Sex by Age in Miller
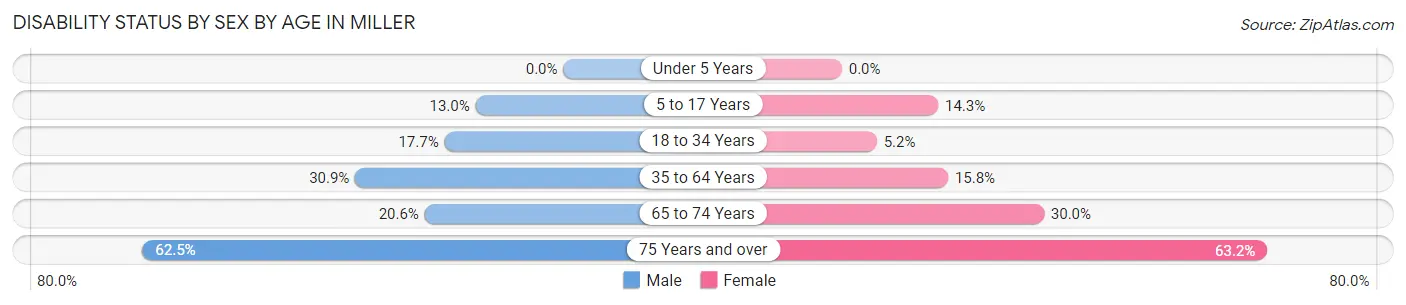
| Age Bracket | Male | Female |
| Under 5 Years | 0 (0.0%) | 0 (0.0%) |
| 5 to 17 Years | 12 (13.0%) | 7 (14.3%) |
| 18 to 34 Years | 15 (17.6%) | 4 (5.2%) |
| 35 to 64 Years | 34 (30.9%) | 26 (15.8%) |
| 65 to 74 Years | 7 (20.6%) | 9 (30.0%) |
| 75 Years and over | 20 (62.5%) | 24 (63.2%) |
Disability Class by Sex by Age in Miller
Disability Class: Hearing Difficulty
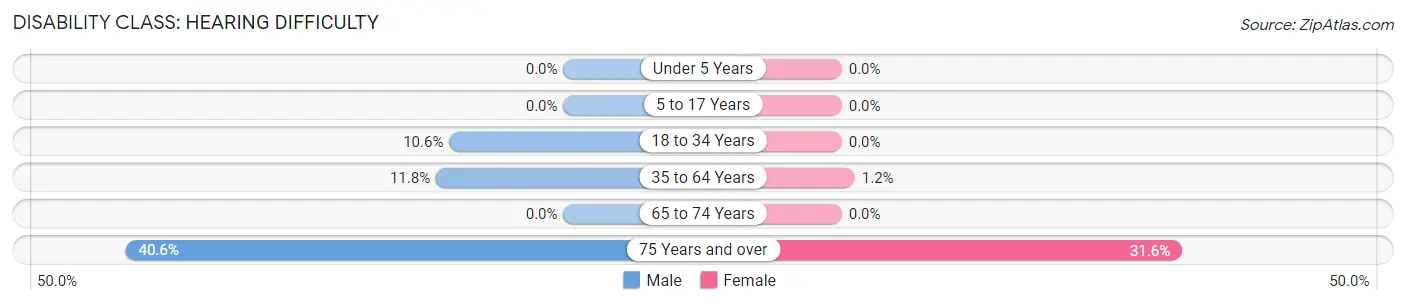
| Age Bracket | Male | Female |
| Under 5 Years | 0 (0.0%) | 0 (0.0%) |
| 5 to 17 Years | 0 (0.0%) | 0 (0.0%) |
| 18 to 34 Years | 9 (10.6%) | 0 (0.0%) |
| 35 to 64 Years | 13 (11.8%) | 2 (1.2%) |
| 65 to 74 Years | 0 (0.0%) | 0 (0.0%) |
| 75 Years and over | 13 (40.6%) | 12 (31.6%) |
Disability Class: Vision Difficulty
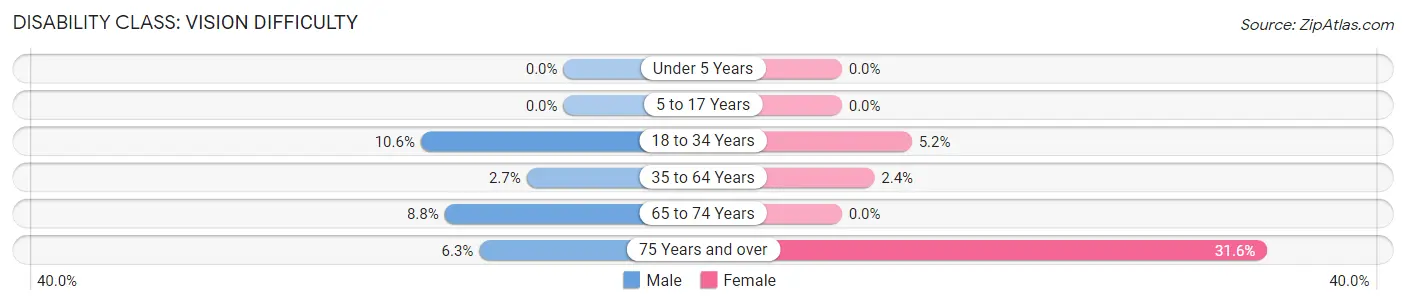
| Age Bracket | Male | Female |
| Under 5 Years | 0 (0.0%) | 0 (0.0%) |
| 5 to 17 Years | 0 (0.0%) | 0 (0.0%) |
| 18 to 34 Years | 9 (10.6%) | 4 (5.2%) |
| 35 to 64 Years | 3 (2.7%) | 4 (2.4%) |
| 65 to 74 Years | 3 (8.8%) | 0 (0.0%) |
| 75 Years and over | 2 (6.2%) | 12 (31.6%) |
Disability Class: Cognitive Difficulty
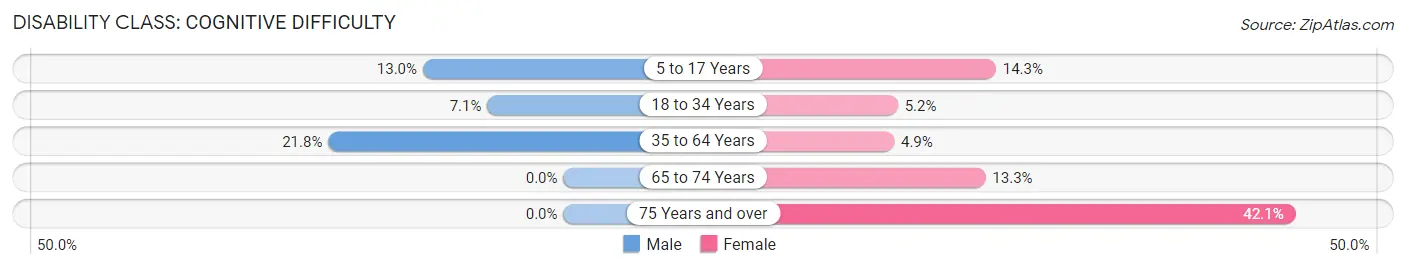
| Age Bracket | Male | Female |
| 5 to 17 Years | 12 (13.0%) | 7 (14.3%) |
| 18 to 34 Years | 6 (7.1%) | 4 (5.2%) |
| 35 to 64 Years | 24 (21.8%) | 8 (4.9%) |
| 65 to 74 Years | 0 (0.0%) | 4 (13.3%) |
| 75 Years and over | 0 (0.0%) | 16 (42.1%) |
Disability Class: Ambulatory Difficulty
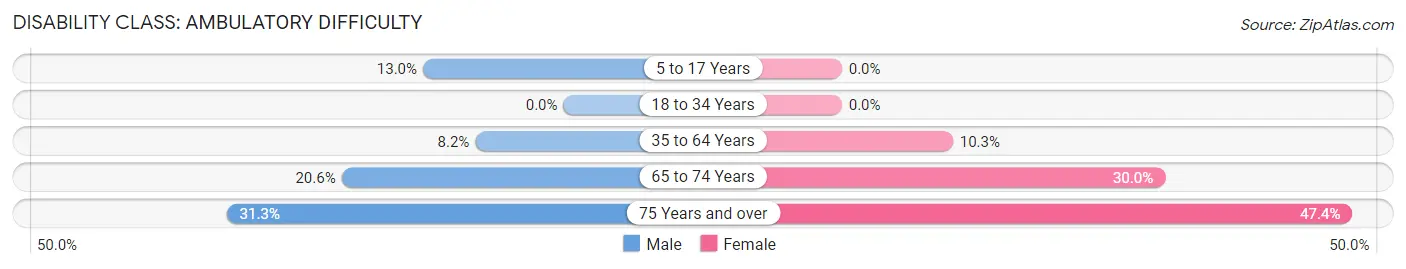
| Age Bracket | Male | Female |
| 5 to 17 Years | 12 (13.0%) | 0 (0.0%) |
| 18 to 34 Years | 0 (0.0%) | 0 (0.0%) |
| 35 to 64 Years | 9 (8.2%) | 17 (10.3%) |
| 65 to 74 Years | 7 (20.6%) | 9 (30.0%) |
| 75 Years and over | 10 (31.2%) | 18 (47.4%) |
Disability Class: Self-Care Difficulty
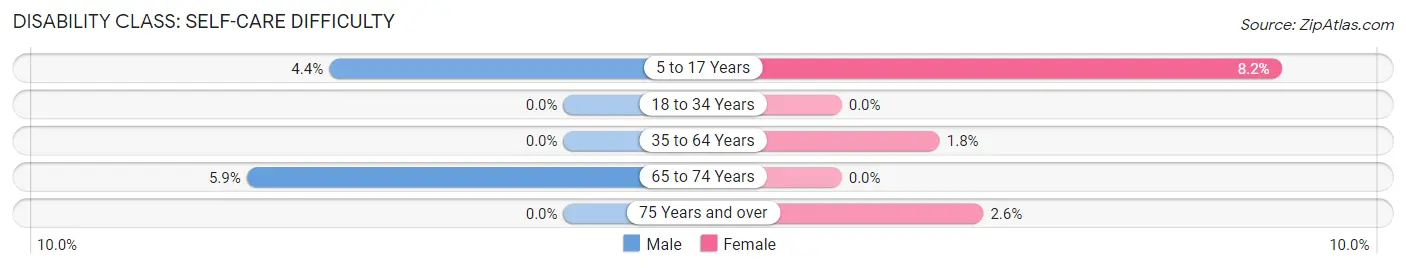
| Age Bracket | Male | Female |
| 5 to 17 Years | 4 (4.3%) | 4 (8.2%) |
| 18 to 34 Years | 0 (0.0%) | 0 (0.0%) |
| 35 to 64 Years | 0 (0.0%) | 3 (1.8%) |
| 65 to 74 Years | 2 (5.9%) | 0 (0.0%) |
| 75 Years and over | 0 (0.0%) | 1 (2.6%) |
Technology Access in Miller
Computing Device Access in Miller
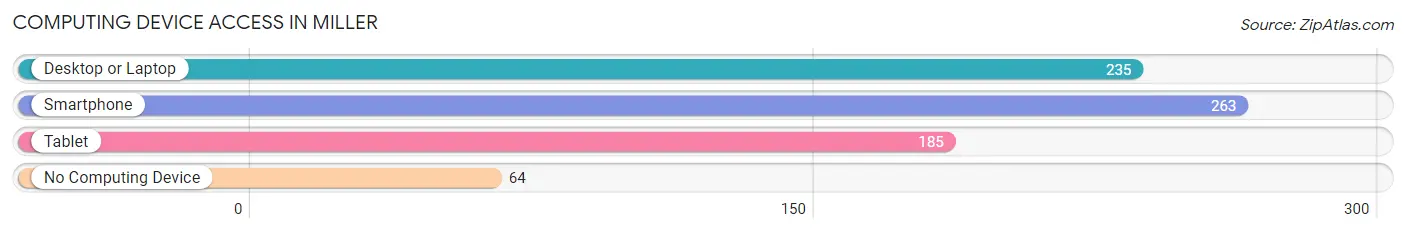
| Device Type | # Households | % Households |
| Desktop or Laptop | 235 | 68.9% |
| Smartphone | 263 | 77.1% |
| Tablet | 185 | 54.2% |
| No Computing Device | 64 | 18.8% |
| Total | 341 | 100.0% |
Internet Access in Miller
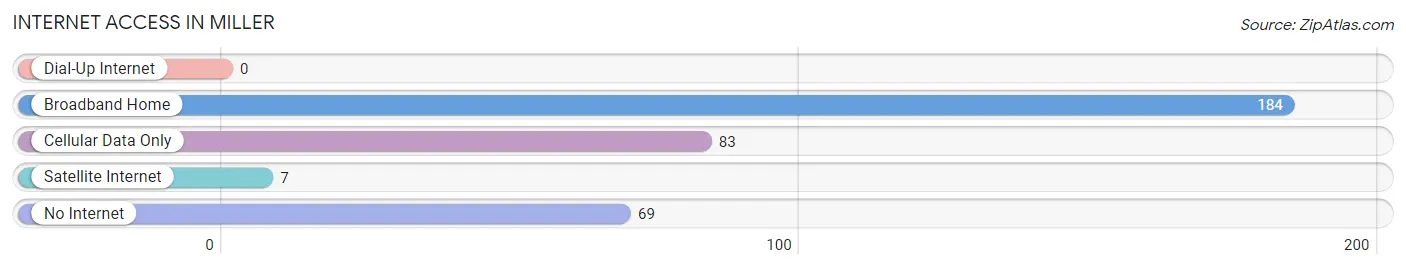
| Internet Type | # Households | % Households |
| Dial-Up Internet | 0 | 0.0% |
| Broadband Home | 184 | 54.0% |
| Cellular Data Only | 83 | 24.3% |
| Satellite Internet | 7 | 2.1% |
| No Internet | 69 | 20.2% |
| Total | 341 | 100.0% |
Miller Summary
Miller, Missouri is a small town located in the southeastern corner of the state, in the Ozark Mountains. It is part of the Ozark Plateau, which is known for its rolling hills and lush forests. The town is situated on the banks of the Big Piney River, and is surrounded by the Mark Twain National Forest. Miller is a rural community with a population of just over 1,000 people, and is the county seat of Texas County.
History
Miller was founded in 1883 by a group of settlers from the nearby town of Houston. The town was named after a local landowner, William Miller, who donated the land for the town. The first post office was established in 1884, and the town was incorporated in 1887.
In the early 1900s, Miller was a thriving agricultural community, with a variety of crops being grown in the area. The town was also home to several sawmills and gristmills, which provided lumber and grain for the local economy.
In the 1950s, Miller began to experience a decline in population as many of the local businesses closed. The town was revitalized in the 1970s, when the Mark Twain National Forest was established nearby. This brought new visitors to the area, and the town began to experience a resurgence in population and economic activity.
Geography
Miller is located in the Ozark Mountains, in the southeastern corner of Missouri. The town is situated on the banks of the Big Piney River, and is surrounded by the Mark Twain National Forest. The town is located at an elevation of 890 feet, and has a total area of 1.2 square miles.
The climate in Miller is humid subtropical, with hot, humid summers and mild winters. The average annual temperature is around 60 degrees Fahrenheit, and the average annual precipitation is around 40 inches.
Economy
The economy of Miller is largely based on tourism and agriculture. The town is home to several tourist attractions, including the Mark Twain National Forest, the Big Piney River, and the Ozark National Scenic Riverways. The town also has several small businesses, including restaurants, shops, and lodging.
Agriculture is also an important part of the local economy. The area is known for its cattle, poultry, and dairy farms, as well as its fruit and vegetable farms. The town also has several sawmills and gristmills, which provide lumber and grain for the local economy.
Demographics
As of the 2010 census, Miller had a population of 1,072 people. The racial makeup of the town was 97.2% White, 0.7% African American, 0.2% Native American, 0.2% Asian, 0.1% Pacific Islander, 0.7% from other races, and 0.9% from two or more races. Hispanic or Latino of any race were 1.7% of the population.
The median household income in Miller was $30,938, and the median family income was $37,500. The per capita income was $17,845. About 17.2% of the population was below the poverty line.
Common Questions
What is Per Capita Income in Miller?
Per Capita income in Miller is $21,872.
What is the Median Family Income in Miller?
Median Family Income in Miller is $60,833.
What is the Median Household income in Miller?
Median Household Income in Miller is $45,893.
What is Income or Wage Gap in Miller?
Income or Wage Gap in Miller is 31.6%.
Women in Miller earn 68.4 cents for every dollar earned by a man.
What is Inequality or Gini Index in Miller?
Inequality or Gini Index in Miller is 0.45.
What is the Total Population of Miller?
Total Population of Miller is 727.
What is the Total Male Population of Miller?
Total Male Population of Miller is 358.
What is the Total Female Population of Miller?
Total Female Population of Miller is 369.
What is the Ratio of Males per 100 Females in Miller?
There are 97.02 Males per 100 Females in Miller.
What is the Ratio of Females per 100 Males in Miller?
There are 103.07 Females per 100 Males in Miller.
What is the Median Population Age in Miller?
Median Population Age in Miller is 40.2 Years.
What is the Average Family Size in Miller
Average Family Size in Miller is 2.7 People.
What is the Average Household Size in Miller
Average Household Size in Miller is 2.1 People.
How Large is the Labor Force in Miller?
There are 314 People in the Labor Forcein in Miller.
What is the Percentage of People in the Labor Force in Miller?
51.7% of People are in the Labor Force in Miller.
What is the Unemployment Rate in Miller?
Unemployment Rate in Miller is 6.7%.