Leota, MN Map & Demographics
Leota Map
Leota Overview
$28,040
PER CAPITA INCOME
$63,750
AVG FAMILY INCOME
$54,861
AVG HOUSEHOLD INCOME
54.7%
WAGE / INCOME GAP [ % ]
45.3¢/ $1
WAGE / INCOME GAP [ $ ]
0.29
INEQUALITY / GINI INDEX
146
TOTAL POPULATION
73
MALE POPULATION
73
FEMALE POPULATION
100.00
MALES / 100 FEMALES
100.00
FEMALES / 100 MALES
45.5
MEDIAN AGE
3.0
AVG FAMILY SIZE
2.6
AVG HOUSEHOLD SIZE
54
LABOR FORCE [ PEOPLE ]
51.9%
PERCENT IN LABOR FORCE
Leota Zip Codes
Leota Area Codes
Income in Leota
Income Overview in Leota
Per Capita Income in Leota is $28,040, while median incomes of families and households are $63,750 and $54,861 respectively.
| Characteristic | Number | Measure |
| Per Capita Income | 146 | $28,040 |
| Median Family Income | 46 | $63,750 |
| Mean Family Income | 46 | $77,900 |
| Median Household Income | 55 | $54,861 |
| Mean Household Income | 55 | $73,960 |
| Income Deficit | 46 | $0 |
| Wage / Income Gap (%) | 146 | 54.65% |
| Wage / Income Gap ($) | 146 | 45.35¢ per $1 |
| Gini / Inequality Index | 146 | 0.29 |
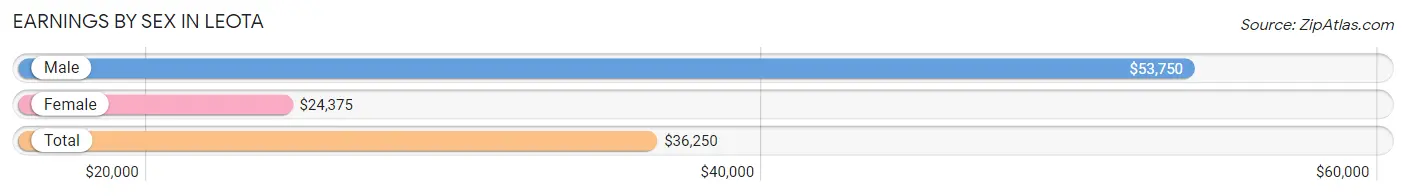
Earnings by Sex in Leota
Average Earnings in Leota are $36,250, $53,750 for men and $24,375 for women, a difference of 54.6%.
| Sex | Number | Average Earnings |
| Male | 31 (51.7%) | $53,750 |
| Female | 29 (48.3%) | $24,375 |
| Total | 60 (100.0%) | $36,250 |
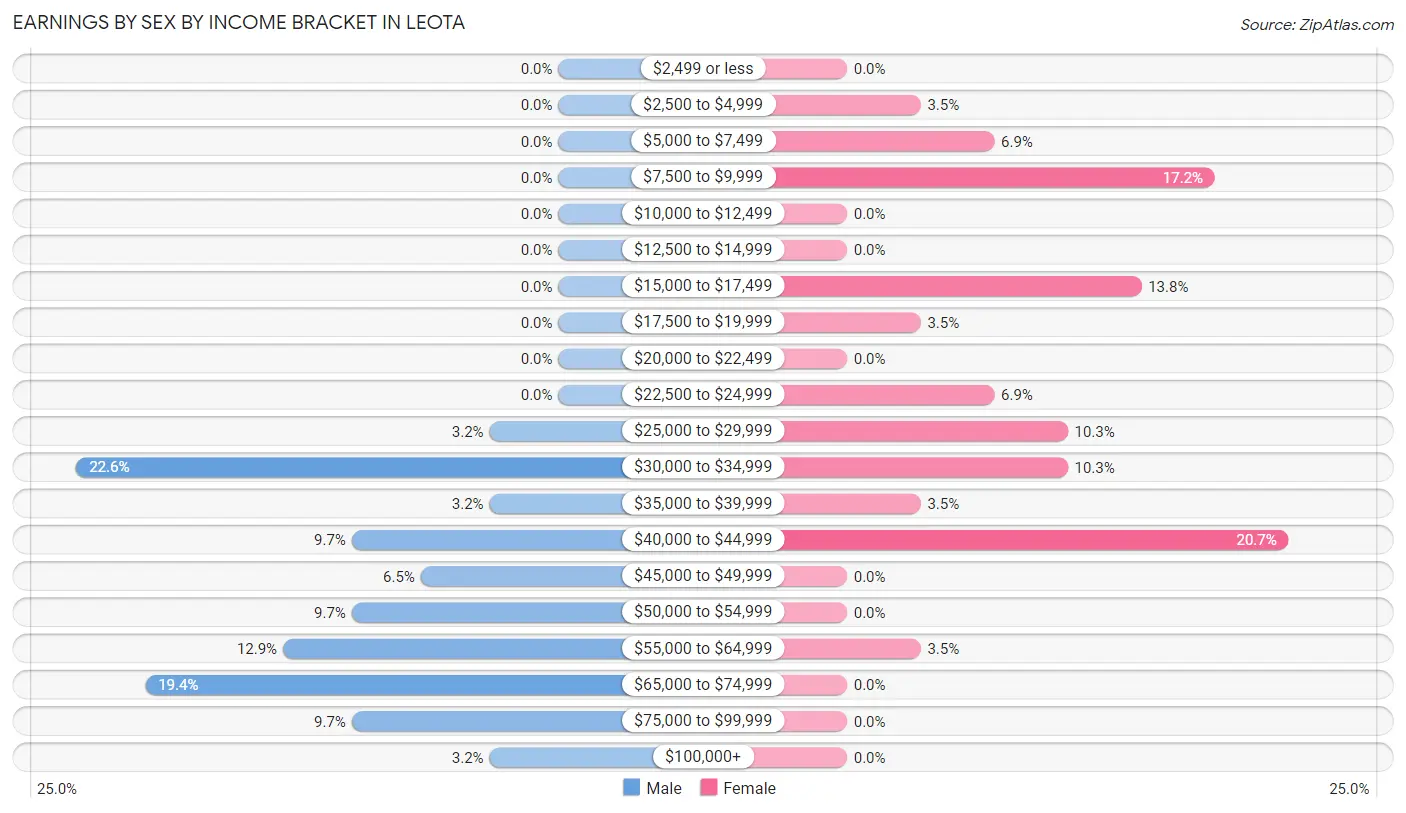
Earnings by Sex by Income Bracket in Leota
The most common earnings brackets in Leota are $30,000 to $34,999 for men (7 | 22.6%) and $40,000 to $44,999 for women (6 | 20.7%).
| Income | Male | Female |
| $2,499 or less | 0 (0.0%) | 0 (0.0%) |
| $2,500 to $4,999 | 0 (0.0%) | 1 (3.5%) |
| $5,000 to $7,499 | 0 (0.0%) | 2 (6.9%) |
| $7,500 to $9,999 | 0 (0.0%) | 5 (17.2%) |
| $10,000 to $12,499 | 0 (0.0%) | 0 (0.0%) |
| $12,500 to $14,999 | 0 (0.0%) | 0 (0.0%) |
| $15,000 to $17,499 | 0 (0.0%) | 4 (13.8%) |
| $17,500 to $19,999 | 0 (0.0%) | 1 (3.5%) |
| $20,000 to $22,499 | 0 (0.0%) | 0 (0.0%) |
| $22,500 to $24,999 | 0 (0.0%) | 2 (6.9%) |
| $25,000 to $29,999 | 1 (3.2%) | 3 (10.3%) |
| $30,000 to $34,999 | 7 (22.6%) | 3 (10.3%) |
| $35,000 to $39,999 | 1 (3.2%) | 1 (3.5%) |
| $40,000 to $44,999 | 3 (9.7%) | 6 (20.7%) |
| $45,000 to $49,999 | 2 (6.5%) | 0 (0.0%) |
| $50,000 to $54,999 | 3 (9.7%) | 0 (0.0%) |
| $55,000 to $64,999 | 4 (12.9%) | 1 (3.5%) |
| $65,000 to $74,999 | 6 (19.4%) | 0 (0.0%) |
| $75,000 to $99,999 | 3 (9.7%) | 0 (0.0%) |
| $100,000+ | 1 (3.2%) | 0 (0.0%) |
| Total | 31 (100.0%) | 29 (100.0%) |
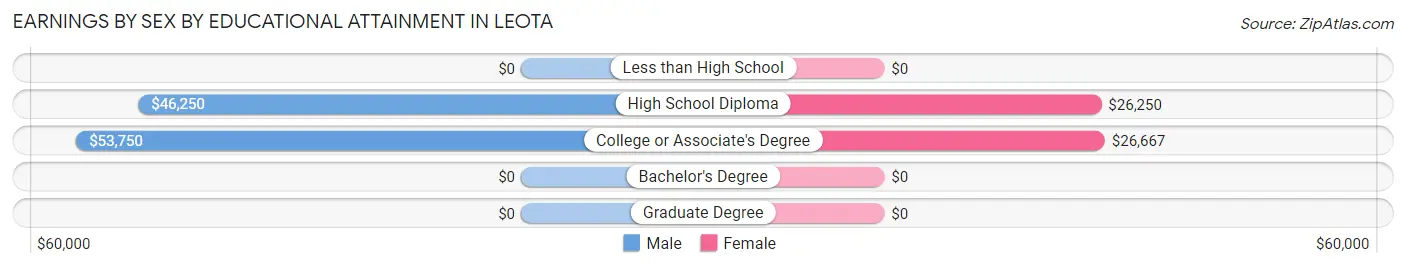
Earnings by Sex by Educational Attainment in Leota
Average earnings in Leota are $53,750 for men and $25,417 for women, a difference of 52.7%. Men with an educational attainment of college or associate's degree enjoy the highest average annual earnings of $53,750, while those with high school diploma education earn the least with $46,250. Women with an educational attainment of college or associate's degree earn the most with the average annual earnings of $26,667, while those with high school diploma education have the smallest earnings of $26,250.
| Educational Attainment | Male Income | Female Income |
| Less than High School | - | - |
| High School Diploma | $46,250 | $26,250 |
| College or Associate's Degree | $53,750 | $26,667 |
| Bachelor's Degree | - | - |
| Graduate Degree | - | - |
| Total | $53,750 | $25,417 |
Family Income in Leota
Family Income Brackets in Leota
According to the Leota family income data, there are 17 families falling into the $50,000 to $74,999 income range, which is the most common income bracket and makes up 37.0% of all families.
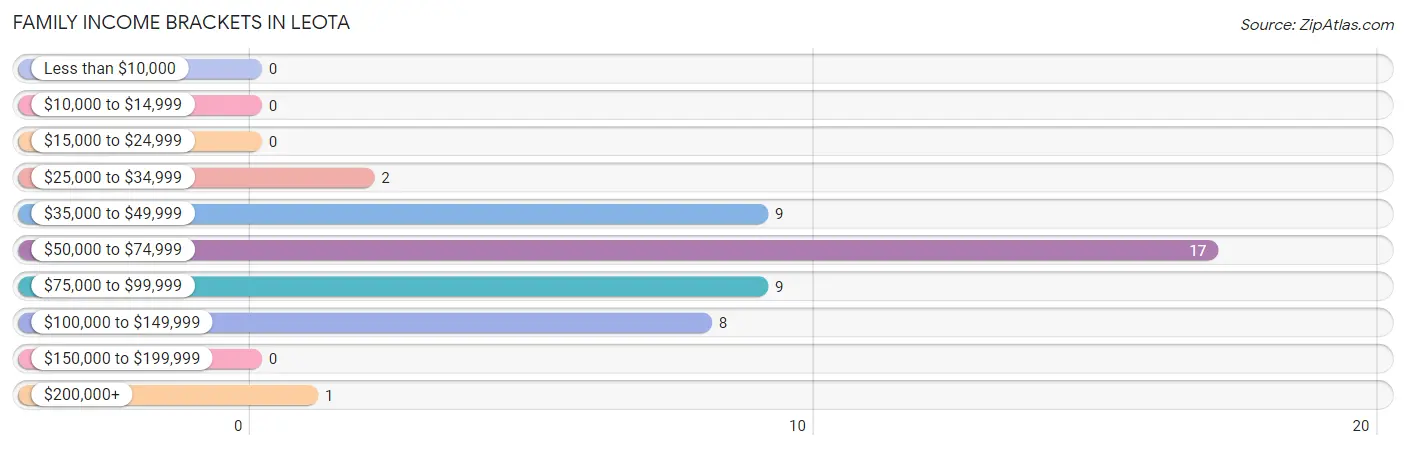
| Income Bracket | # Families | % Families |
| Less than $10,000 | 0 | 0.0% |
| $10,000 to $14,999 | 0 | 0.0% |
| $15,000 to $24,999 | 0 | 0.0% |
| $25,000 to $34,999 | 2 | 4.3% |
| $35,000 to $49,999 | 9 | 19.6% |
| $50,000 to $74,999 | 17 | 37.0% |
| $75,000 to $99,999 | 9 | 19.6% |
| $100,000 to $149,999 | 8 | 17.4% |
| $150,000 to $199,999 | 0 | 0.0% |
| $200,000+ | 1 | 2.2% |
Family Income by Famaliy Size in Leota
2-person families (36 | 78.3%) account for the highest median family income in Leota with $53,750 per family, while 2-person families (36 | 78.3%) have the highest median income of $26,875 per family member.
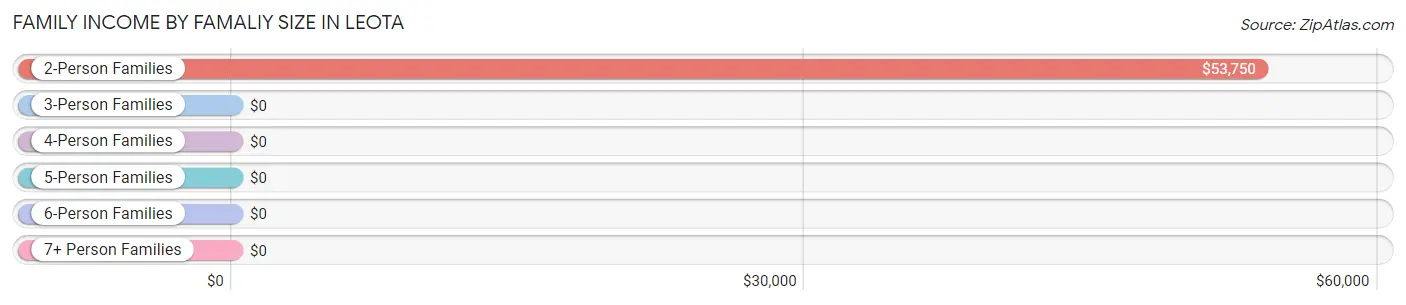
| Income Bracket | # Families | Median Income |
| 2-Person Families | 36 (78.3%) | $53,750 |
| 3-Person Families | 6 (13.0%) | $0 |
| 4-Person Families | 0 (0.0%) | $0 |
| 5-Person Families | 3 (6.5%) | $0 |
| 6-Person Families | 0 (0.0%) | $0 |
| 7+ Person Families | 1 (2.2%) | $0 |
| Total | 46 (100.0%) | $63,750 |
Family Income by Number of Earners in Leota
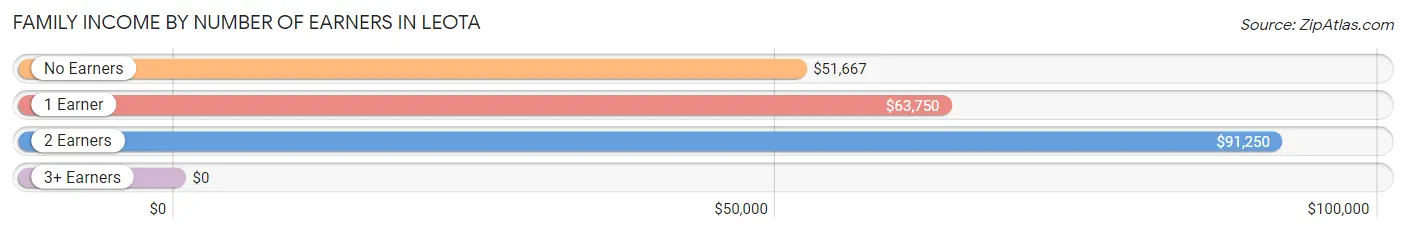
| Number of Earners | # Families | Median Income |
| No Earners | 14 (30.4%) | $51,667 |
| 1 Earner | 8 (17.4%) | $63,750 |
| 2 Earners | 24 (52.2%) | $91,250 |
| 3+ Earners | 0 (0.0%) | $0 |
| Total | 46 (100.0%) | $63,750 |
Household Income in Leota
Household Income Brackets in Leota
With 21 households falling in the category, the $50,000 to $74,999 income range is the most frequent in Leota, accounting for 38.2% of all households.
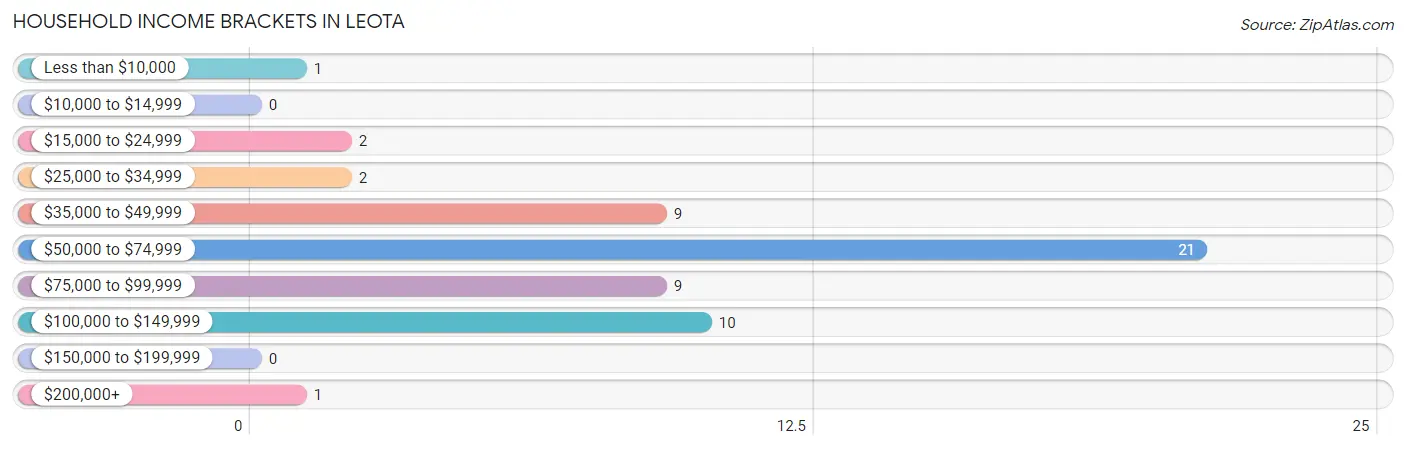
| Income Bracket | # Households | % Households |
| Less than $10,000 | 1 | 1.8% |
| $10,000 to $14,999 | 0 | 0.0% |
| $15,000 to $24,999 | 2 | 3.6% |
| $25,000 to $34,999 | 2 | 3.6% |
| $35,000 to $49,999 | 9 | 16.4% |
| $50,000 to $74,999 | 21 | 38.2% |
| $75,000 to $99,999 | 9 | 16.4% |
| $100,000 to $149,999 | 10 | 18.2% |
| $150,000 to $199,999 | 0 | 0.0% |
| $200,000+ | 1 | 1.8% |
Household Income by Householder Age in Leota
The median household income in Leota is $54,861, with the highest median household income of $72,917 found in the 25 to 44 years age bracket for the primary householder. A total of 17 households (30.9%) fall into this category. Meanwhile, the 15 to 24 years age bracket for the primary householder has the lowest median household income of $0, with 2 households (3.6%) in this group.
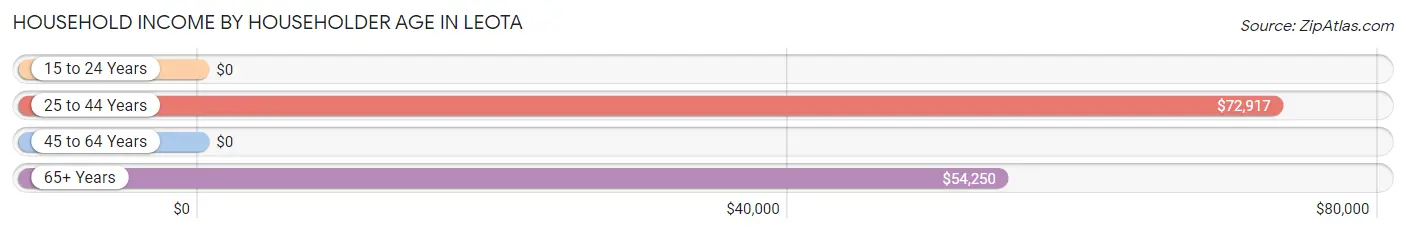
| Income Bracket | # Households | Median Income |
| 15 to 24 Years | 2 (3.6%) | $0 |
| 25 to 44 Years | 17 (30.9%) | $72,917 |
| 45 to 64 Years | 9 (16.4%) | $0 |
| 65+ Years | 27 (49.1%) | $54,250 |
| Total | 55 (100.0%) | $54,861 |
Poverty in Leota
Income Below Poverty by Sex and Age in Leota
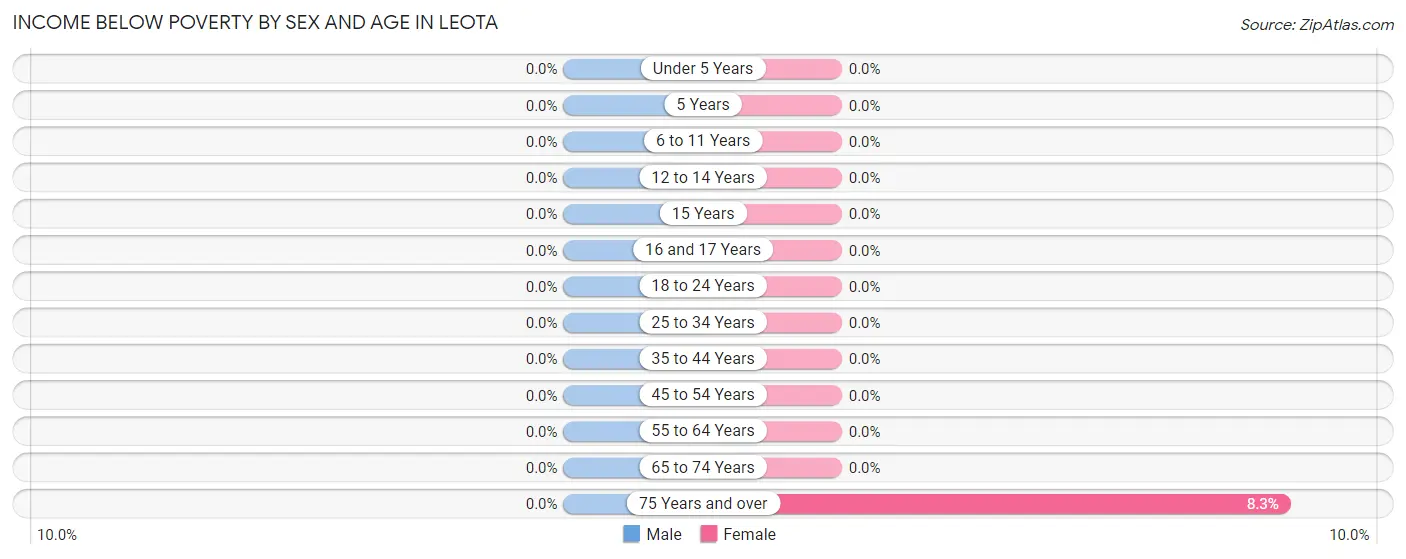
| Age Bracket | Male | Female |
| Under 5 Years | 0 (0.0%) | 0 (0.0%) |
| 5 Years | 0 (0.0%) | 0 (0.0%) |
| 6 to 11 Years | 0 (0.0%) | 0 (0.0%) |
| 12 to 14 Years | 0 (0.0%) | 0 (0.0%) |
| 15 Years | 0 (0.0%) | 0 (0.0%) |
| 16 and 17 Years | 0 (0.0%) | 0 (0.0%) |
| 18 to 24 Years | 0 (0.0%) | 0 (0.0%) |
| 25 to 34 Years | 0 (0.0%) | 0 (0.0%) |
| 35 to 44 Years | 0 (0.0%) | 0 (0.0%) |
| 45 to 54 Years | 0 (0.0%) | 0 (0.0%) |
| 55 to 64 Years | 0 (0.0%) | 0 (0.0%) |
| 65 to 74 Years | 0 (0.0%) | 0 (0.0%) |
| 75 Years and over | 0 (0.0%) | 1 (8.3%) |
| Total | 0 (0.0%) | 1 (1.4%) |
Income Above Poverty by Sex and Age in Leota
According to the poverty statistics in Leota, males aged under 5 years and females aged under 5 years are the age groups that are most secure financially, with 100.0% of males and 100.0% of females in these age groups living above the poverty line.
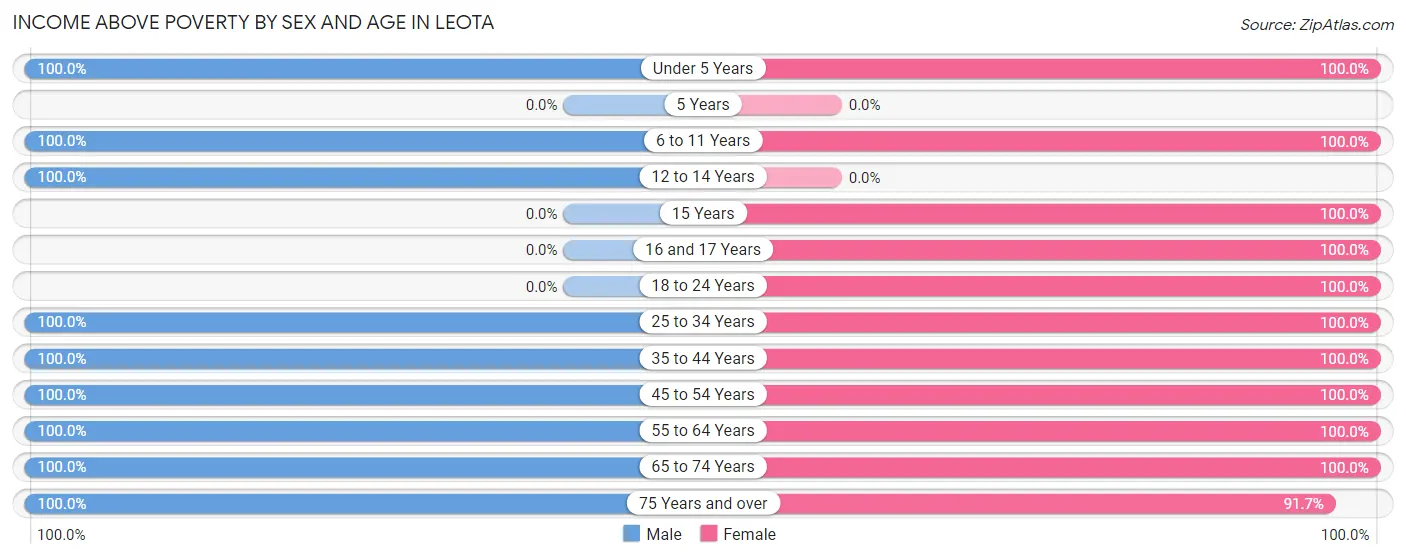
| Age Bracket | Male | Female |
| Under 5 Years | 2 (100.0%) | 2 (100.0%) |
| 5 Years | 0 (0.0%) | 0 (0.0%) |
| 6 to 11 Years | 19 (100.0%) | 16 (100.0%) |
| 12 to 14 Years | 2 (100.0%) | 0 (0.0%) |
| 15 Years | 0 (0.0%) | 1 (100.0%) |
| 16 and 17 Years | 0 (0.0%) | 1 (100.0%) |
| 18 to 24 Years | 0 (0.0%) | 2 (100.0%) |
| 25 to 34 Years | 11 (100.0%) | 8 (100.0%) |
| 35 to 44 Years | 1 (100.0%) | 6 (100.0%) |
| 45 to 54 Years | 5 (100.0%) | 5 (100.0%) |
| 55 to 64 Years | 7 (100.0%) | 6 (100.0%) |
| 65 to 74 Years | 15 (100.0%) | 14 (100.0%) |
| 75 Years and over | 11 (100.0%) | 11 (91.7%) |
| Total | 73 (100.0%) | 72 (98.6%) |
Income Below Poverty Among Married-Couple Families in Leota
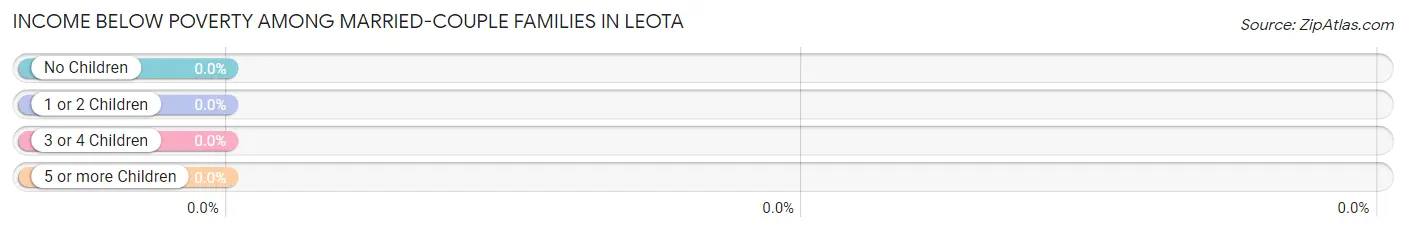
| Children | Above Poverty | Below Poverty |
| No Children | 34 (100.0%) | 0 (0.0%) |
| 1 or 2 Children | 6 (100.0%) | 0 (0.0%) |
| 3 or 4 Children | 3 (100.0%) | 0 (0.0%) |
| 5 or more Children | 1 (100.0%) | 0 (0.0%) |
| Total | 44 (100.0%) | 0 (0.0%) |
Income Below Poverty Among Single-Parent Households in Leota
| Children | Single Father | Single Mother |
| No Children | 0 (0.0%) | 0 (0.0%) |
| 1 or 2 Children | 0 (0.0%) | 0 (0.0%) |
| 3 or 4 Children | 0 (0.0%) | 0 (0.0%) |
| 5 or more Children | 0 (0.0%) | 0 (0.0%) |
| Total | 0 (0.0%) | 0 (0.0%) |
Income Below Poverty Among Married-Couple vs Single-Parent Households in Leota
| Children | Married-Couple Families | Single-Parent Households |
| No Children | 0 (0.0%) | 0 (0.0%) |
| 1 or 2 Children | 0 (0.0%) | 0 (0.0%) |
| 3 or 4 Children | 0 (0.0%) | 0 (0.0%) |
| 5 or more Children | 0 (0.0%) | 0 (0.0%) |
| Total | 0 (0.0%) | 0 (0.0%) |
Race in Leota
The most populous races in Leota are White / Caucasian (134 | 91.8%), Hispanic or Latino (10 | 6.9%), and Some other Race (10 | 6.9%).
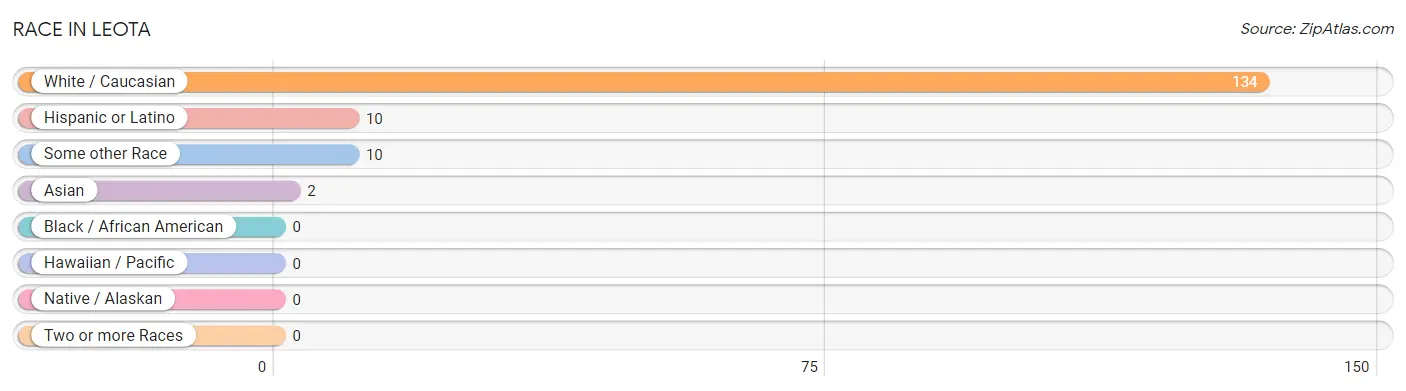
| Race | # Population | % Population |
| Asian | 2 | 1.4% |
| Black / African American | 0 | 0.0% |
| Hawaiian / Pacific | 0 | 0.0% |
| Hispanic or Latino | 10 | 6.9% |
| Native / Alaskan | 0 | 0.0% |
| White / Caucasian | 134 | 91.8% |
| Two or more Races | 0 | 0.0% |
| Some other Race | 10 | 6.9% |
| Total | 146 | 100.0% |
Ancestry in Leota
The most populous ancestries reported in Leota are Dutch (49 | 33.6%), Hungarian (25 | 17.1%), German (21 | 14.4%), Puerto Rican (10 | 6.9%), and Italian (8 | 5.5%), together accounting for 77.4% of all Leota residents.
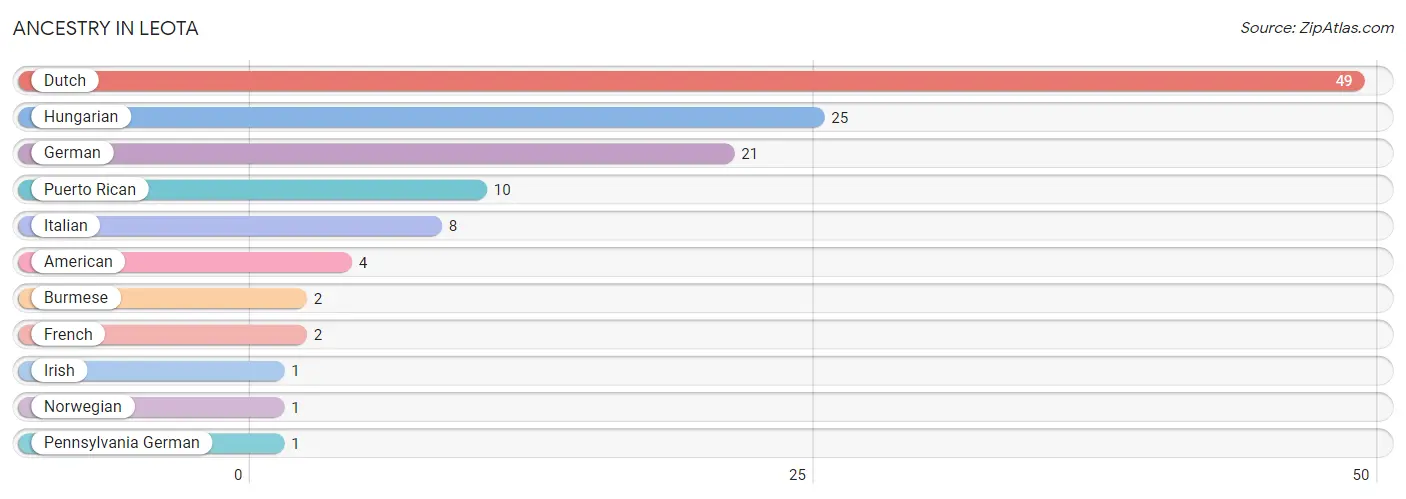
| Ancestry | # Population | % Population |
| American | 4 | 2.7% |
| Burmese | 2 | 1.4% |
| Dutch | 49 | 33.6% |
| French | 2 | 1.4% |
| German | 21 | 14.4% |
| Hungarian | 25 | 17.1% |
| Irish | 1 | 0.7% |
| Italian | 8 | 5.5% |
| Norwegian | 1 | 0.7% |
| Pennsylvania German | 1 | 0.7% |
| Puerto Rican | 10 | 6.9% | View All 11 Rows |
Immigrants in Leota
The most numerous immigrant groups reported in Leota came from Asia (2 | 1.4%), Eastern Asia (2 | 1.4%), and Korea (2 | 1.4%), together accounting for 4.1% of all Leota residents.
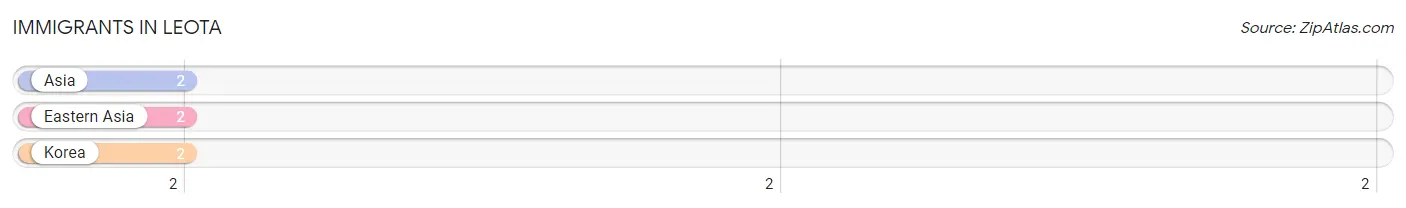
| Immigration Origin | # Population | % Population |
| Asia | 2 | 1.4% |
| Eastern Asia | 2 | 1.4% |
| Korea | 2 | 1.4% | View All 3 Rows |
Sex and Age in Leota
Sex and Age in Leota
The most populous age groups in Leota are 5 to 9 Years (11 | 15.1%) for men and 5 to 9 Years (14 | 19.2%) for women.
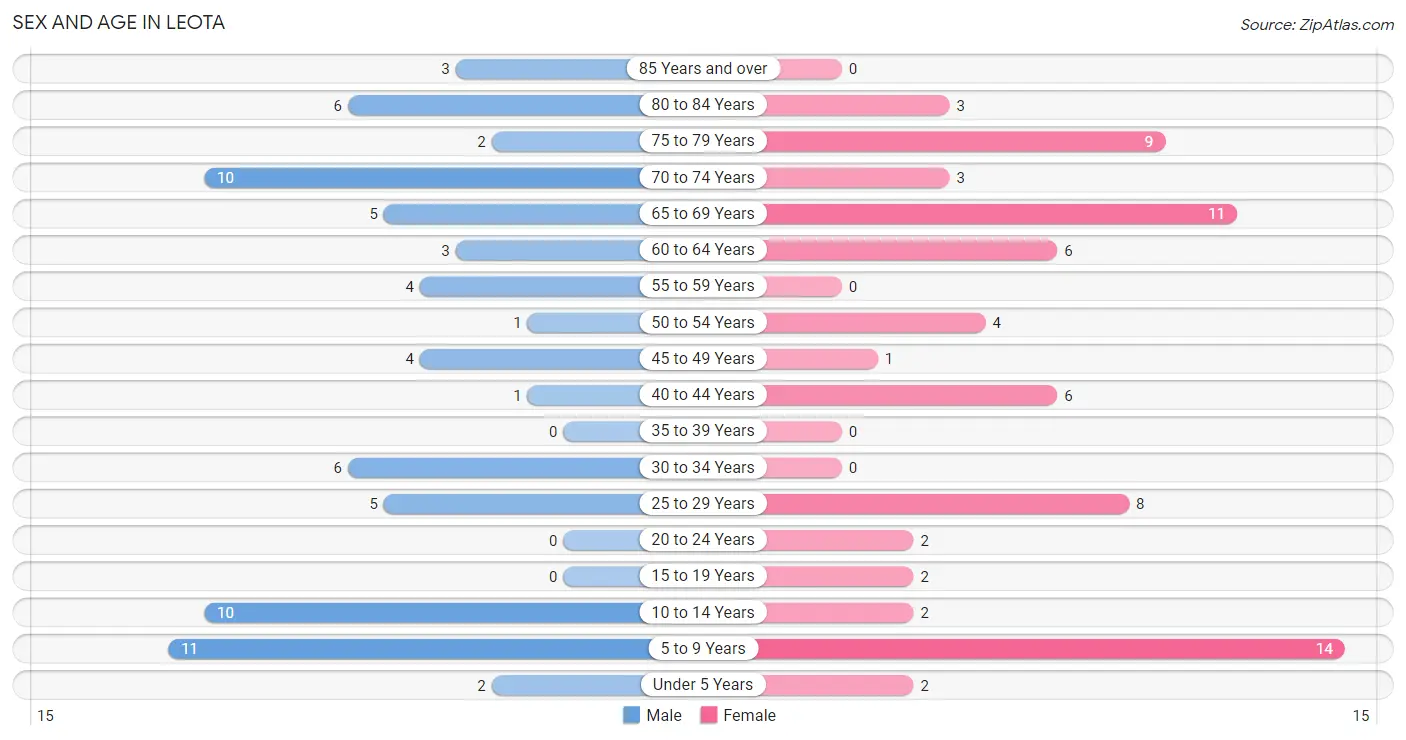
| Age Bracket | Male | Female |
| Under 5 Years | 2 (2.7%) | 2 (2.7%) |
| 5 to 9 Years | 11 (15.1%) | 14 (19.2%) |
| 10 to 14 Years | 10 (13.7%) | 2 (2.7%) |
| 15 to 19 Years | 0 (0.0%) | 2 (2.7%) |
| 20 to 24 Years | 0 (0.0%) | 2 (2.7%) |
| 25 to 29 Years | 5 (6.9%) | 8 (11.0%) |
| 30 to 34 Years | 6 (8.2%) | 0 (0.0%) |
| 35 to 39 Years | 0 (0.0%) | 0 (0.0%) |
| 40 to 44 Years | 1 (1.4%) | 6 (8.2%) |
| 45 to 49 Years | 4 (5.5%) | 1 (1.4%) |
| 50 to 54 Years | 1 (1.4%) | 4 (5.5%) |
| 55 to 59 Years | 4 (5.5%) | 0 (0.0%) |
| 60 to 64 Years | 3 (4.1%) | 6 (8.2%) |
| 65 to 69 Years | 5 (6.9%) | 11 (15.1%) |
| 70 to 74 Years | 10 (13.7%) | 3 (4.1%) |
| 75 to 79 Years | 2 (2.7%) | 9 (12.3%) |
| 80 to 84 Years | 6 (8.2%) | 3 (4.1%) |
| 85 Years and over | 3 (4.1%) | 0 (0.0%) |
| Total | 73 (100.0%) | 73 (100.0%) |
Families and Households in Leota
Median Family Size in Leota

| Family Type | # Families | Family Size |
| Married-Couple | 44 (95.7%) | 3.02 |
| Single Male/Father | 0 (0.0%) | - |
| Single Female/Mother | 2 (4.3%) | 2.00 |
| Total Families | 46 (100.0%) | 2.98 |
Median Household Size in Leota
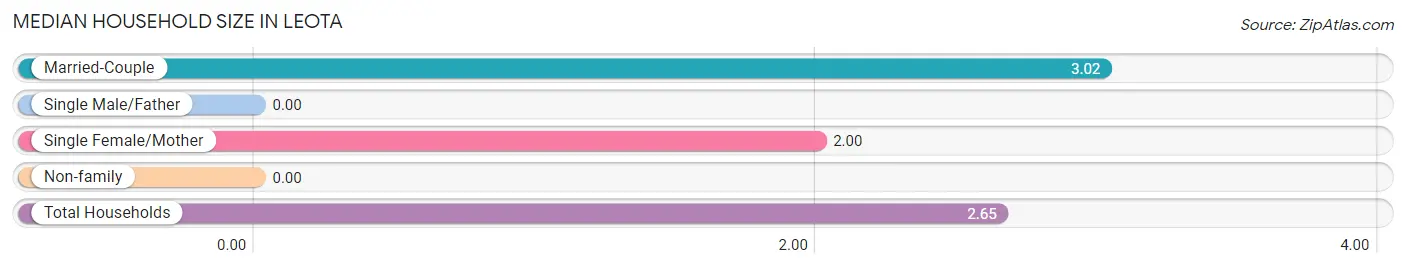
| Household Type | # Households | Household Size |
| Married-Couple | 44 (80.0%) | 3.02 |
| Single Male/Father | 0 (0.0%) | - |
| Single Female/Mother | 2 (3.6%) | 2.00 |
| Non-family | 9 (16.4%) | - |
| Total Households | 55 (100.0%) | 2.65 |
Household Size by Marriage Status in Leota
Out of a total of 55 households in Leota, 46 (83.6%) are family households, while 9 (16.4%) are nonfamily households. The most numerous type of family households are 2-person households, comprising 36, and the most common type of nonfamily households are 1-person households, comprising 9.
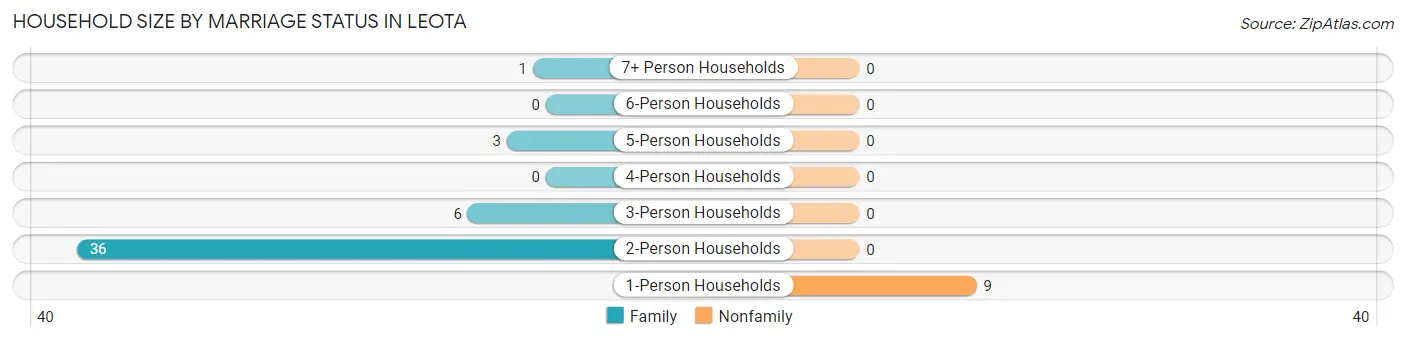
| Household Size | Family Households | Nonfamily Households |
| 1-Person Households | - | 9 (16.4%) |
| 2-Person Households | 36 (65.4%) | 0 (0.0%) |
| 3-Person Households | 6 (10.9%) | 0 (0.0%) |
| 4-Person Households | 0 (0.0%) | 0 (0.0%) |
| 5-Person Households | 3 (5.4%) | 0 (0.0%) |
| 6-Person Households | 0 (0.0%) | 0 (0.0%) |
| 7+ Person Households | 1 (1.8%) | 0 (0.0%) |
| Total | 46 (83.6%) | 9 (16.4%) |
Female Fertility in Leota
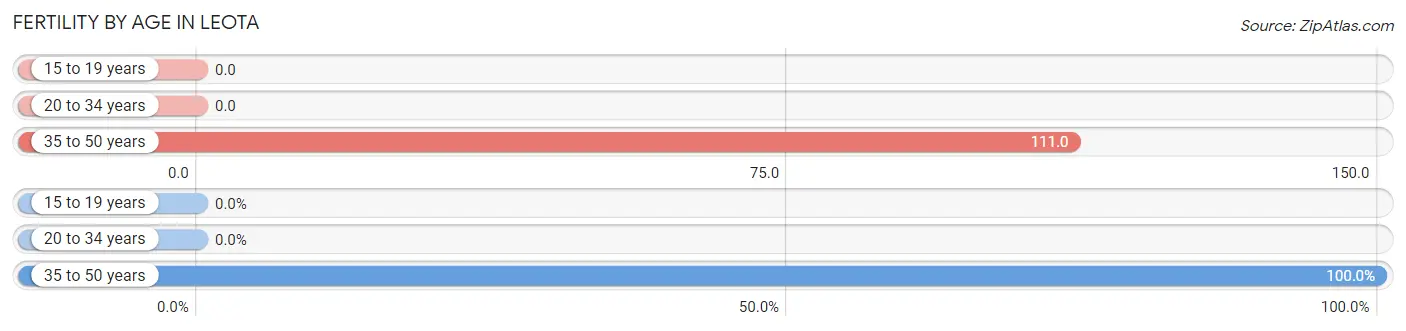
Fertility by Age in Leota
Average fertility rate in Leota is 48.0 births per 1,000 women. Women in the age bracket of 35 to 50 years have the highest fertility rate with 111.0 births per 1,000 women. Women in the age bracket of 35 to 50 years acount for 100.0% of all women with births.
| Age Bracket | Women with Births | Births / 1,000 Women |
| 15 to 19 years | 0 (0.0%) | 0.0 |
| 20 to 34 years | 0 (0.0%) | 0.0 |
| 35 to 50 years | 1 (100.0%) | 111.0 |
| Total | 1 (100.0%) | 48.0 |
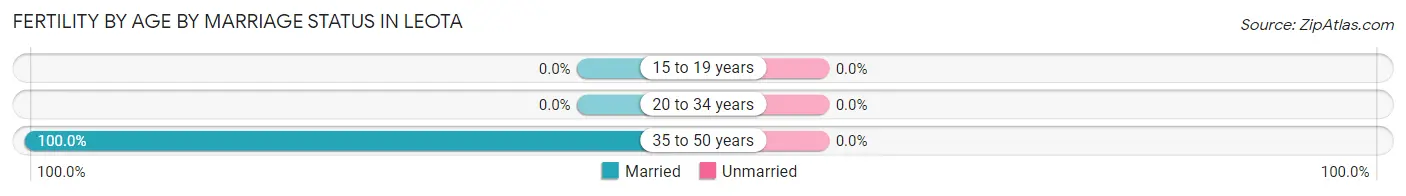
Fertility by Age by Marriage Status in Leota
| Age Bracket | Married | Unmarried |
| 15 to 19 years | 0 (0.0%) | 0 (0.0%) |
| 20 to 34 years | 0 (0.0%) | 0 (0.0%) |
| 35 to 50 years | 1 (100.0%) | 0 (0.0%) |
| Total | 1 (100.0%) | 0 (0.0%) |
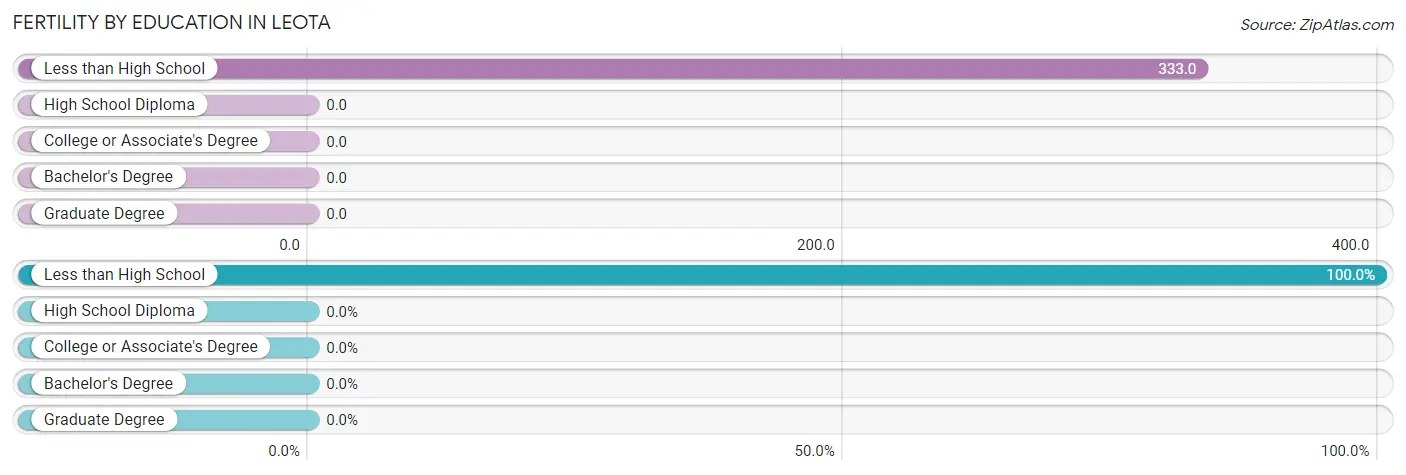
Fertility by Education in Leota
| Educational Attainment | Women with Births | Births / 1,000 Women |
| Less than High School | 1 (100.0%) | 333.0 |
| High School Diploma | 0 (0.0%) | 0.0 |
| College or Associate's Degree | 0 (0.0%) | 0.0 |
| Bachelor's Degree | 0 (0.0%) | 0.0 |
| Graduate Degree | 0 (0.0%) | 0.0 |
| Total | 1 (100.0%) | 48.0 |
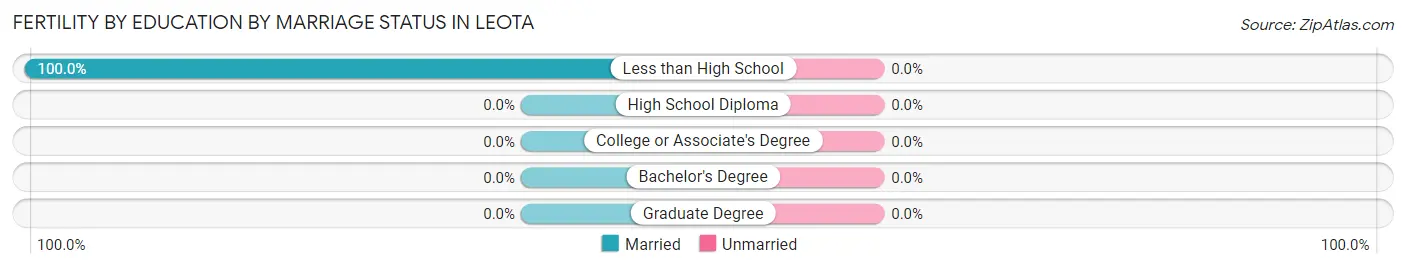
Fertility by Education by Marriage Status in Leota
| Educational Attainment | Married | Unmarried |
| Less than High School | 1 (100.0%) | 0 (0.0%) |
| High School Diploma | 0 (0.0%) | 0 (0.0%) |
| College or Associate's Degree | 0 (0.0%) | 0 (0.0%) |
| Bachelor's Degree | 0 (0.0%) | 0 (0.0%) |
| Graduate Degree | 0 (0.0%) | 0 (0.0%) |
| Total | 1 (100.0%) | 0 (0.0%) |
Employment Characteristics in Leota
Employment by Class of Employer in Leota
Among the 53 employed individuals in Leota, private company employees (34 | 64.1%), not-for-profit organizations (8 | 15.1%), and self-employed (not incorporated) (7 | 13.2%) make up the most common classes of employment.
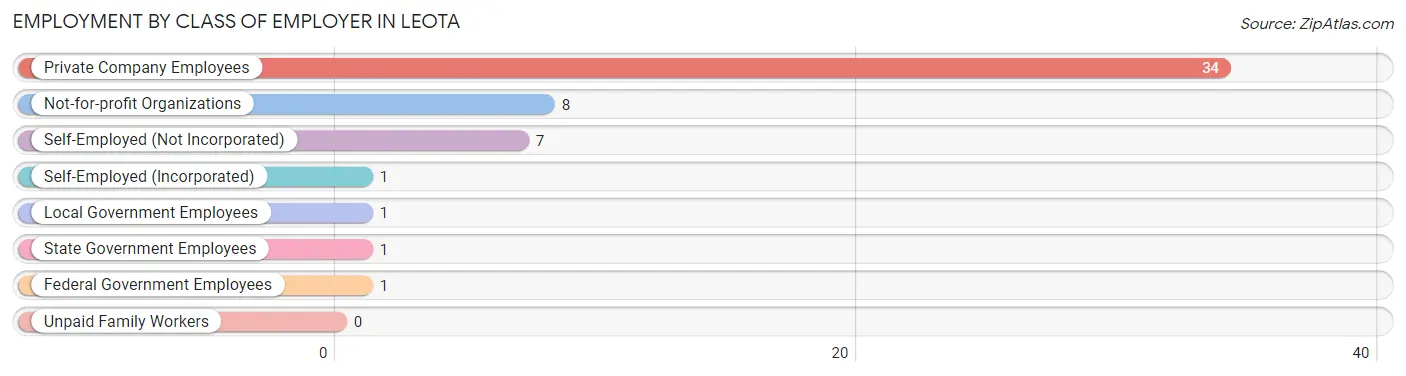
| Employer Class | # Employees | % Employees |
| Private Company Employees | 34 | 64.1% |
| Self-Employed (Incorporated) | 1 | 1.9% |
| Self-Employed (Not Incorporated) | 7 | 13.2% |
| Not-for-profit Organizations | 8 | 15.1% |
| Local Government Employees | 1 | 1.9% |
| State Government Employees | 1 | 1.9% |
| Federal Government Employees | 1 | 1.9% |
| Unpaid Family Workers | 0 | 0.0% |
| Total | 53 | 100.0% |
Employment Status by Age in Leota
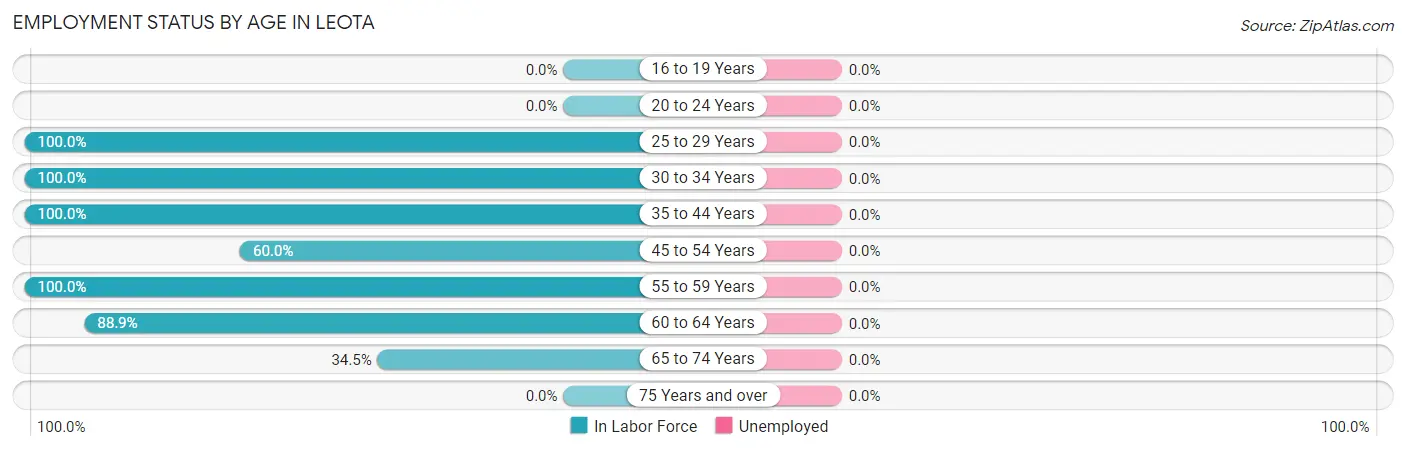
| Age Bracket | In Labor Force | Unemployed |
| 16 to 19 Years | 0 (0.0%) | 0 (0.0%) |
| 20 to 24 Years | 0 (0.0%) | 0 (0.0%) |
| 25 to 29 Years | 13 (100.0%) | 0 (0.0%) |
| 30 to 34 Years | 6 (100.0%) | 0 (0.0%) |
| 35 to 44 Years | 7 (100.0%) | 0 (0.0%) |
| 45 to 54 Years | 6 (60.0%) | 0 (0.0%) |
| 55 to 59 Years | 4 (100.0%) | 0 (0.0%) |
| 60 to 64 Years | 8 (88.9%) | 0 (0.0%) |
| 65 to 74 Years | 10 (34.5%) | 0 (0.0%) |
| 75 Years and over | 0 (0.0%) | 0 (0.0%) |
| Total | 54 (51.9%) | 0 (0.0%) |
Employment Status by Educational Attainment in Leota
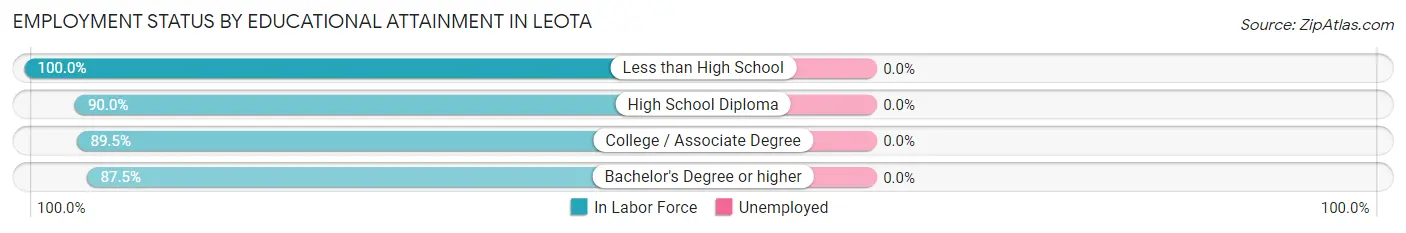
| Educational Attainment | In Labor Force | Unemployed |
| Less than High School | 2 (100.0%) | 0 (0.0%) |
| High School Diploma | 18 (90.0%) | 0 (0.0%) |
| College / Associate Degree | 17 (89.5%) | 0 (0.0%) |
| Bachelor's Degree or higher | 7 (87.5%) | 0 (0.0%) |
| Total | 44 (89.8%) | 0 (0.0%) |
Employment Occupations by Sex in Leota
Management, Business, Science and Arts Occupations
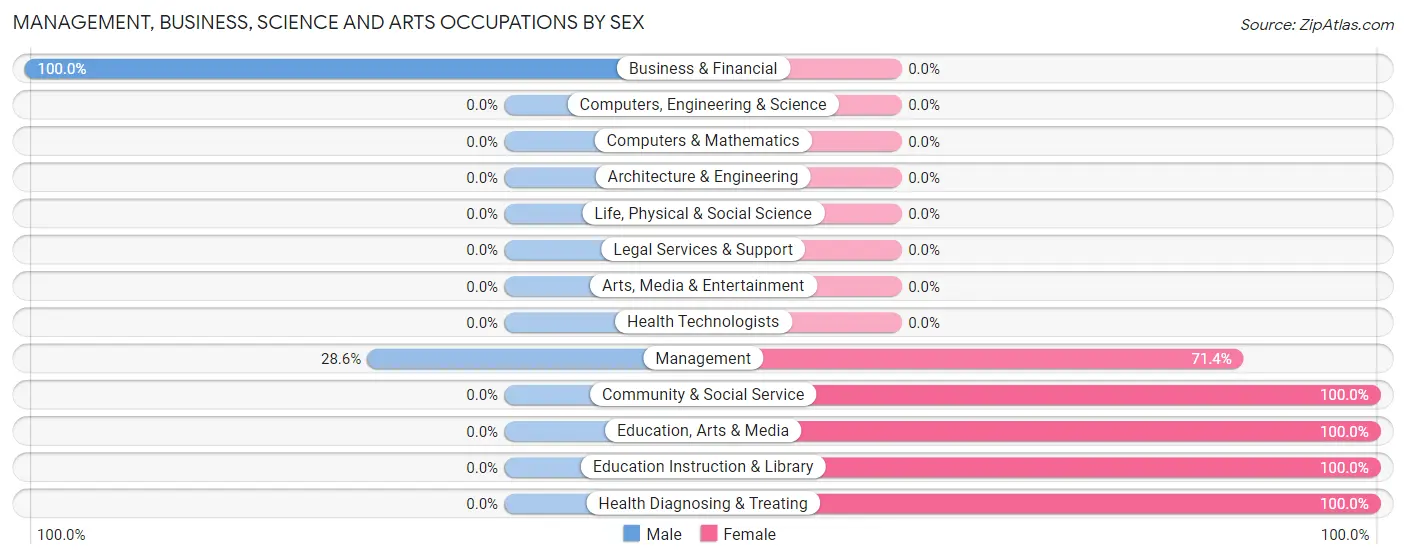
The most common Management, Business, Science and Arts occupations in Leota are Management (7 | 13.0%), Business & Financial (2 | 3.7%), Community & Social Service (2 | 3.7%), Health Diagnosing & Treating (2 | 3.7%), and Education, Arts & Media (1 | 1.8%).
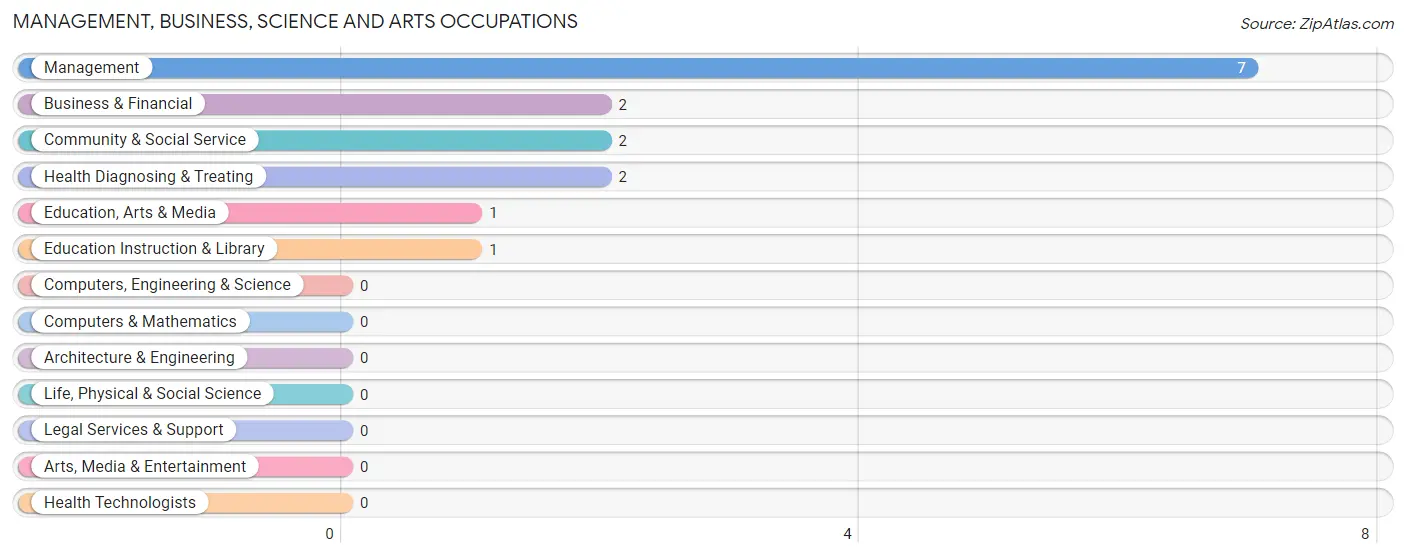
Management, Business, Science and Arts Occupations by Sex
Within the Management, Business, Science and Arts occupations in Leota, the most male-oriented occupations are Business & Financial (100.0%), and Management (28.6%), while the most female-oriented occupations are Community & Social Service (100.0%), Education, Arts & Media (100.0%), and Education Instruction & Library (100.0%).
| Occupation | Male | Female |
| Management | 2 (28.6%) | 5 (71.4%) |
| Business & Financial | 2 (100.0%) | 0 (0.0%) |
| Computers, Engineering & Science | 0 (0.0%) | 0 (0.0%) |
| Computers & Mathematics | 0 (0.0%) | 0 (0.0%) |
| Architecture & Engineering | 0 (0.0%) | 0 (0.0%) |
| Life, Physical & Social Science | 0 (0.0%) | 0 (0.0%) |
| Community & Social Service | 0 (0.0%) | 2 (100.0%) |
| Education, Arts & Media | 0 (0.0%) | 1 (100.0%) |
| Legal Services & Support | 0 (0.0%) | 0 (0.0%) |
| Education Instruction & Library | 0 (0.0%) | 1 (100.0%) |
| Arts, Media & Entertainment | 0 (0.0%) | 0 (0.0%) |
| Health Diagnosing & Treating | 0 (0.0%) | 2 (100.0%) |
| Health Technologists | 0 (0.0%) | 0 (0.0%) |
| Total (Category) | 4 (30.8%) | 9 (69.2%) |
| Total (Overall) | 30 (55.6%) | 24 (44.4%) |
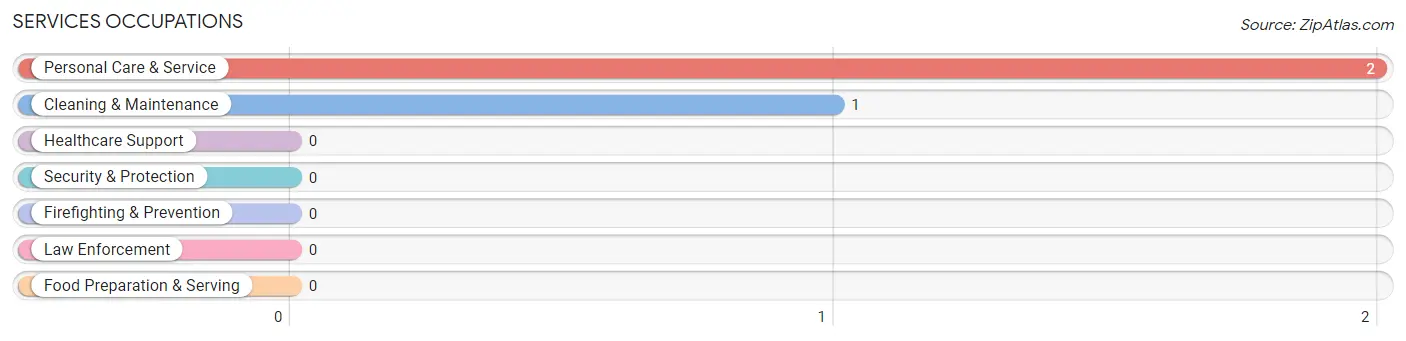
Services Occupations
The most common Services occupations in Leota are Personal Care & Service (2 | 3.7%), and Cleaning & Maintenance (1 | 1.8%).
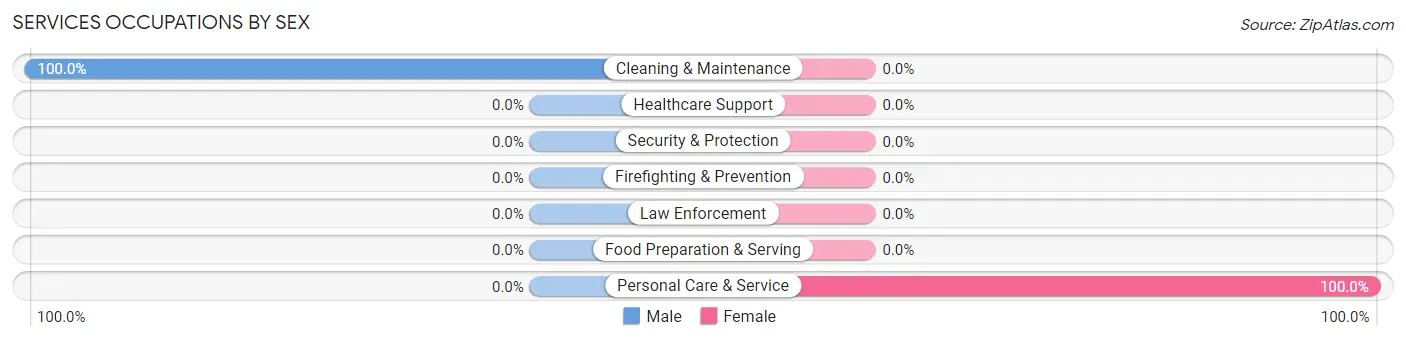
Services Occupations by Sex
| Occupation | Male | Female |
| Healthcare Support | 0 (0.0%) | 0 (0.0%) |
| Security & Protection | 0 (0.0%) | 0 (0.0%) |
| Firefighting & Prevention | 0 (0.0%) | 0 (0.0%) |
| Law Enforcement | 0 (0.0%) | 0 (0.0%) |
| Food Preparation & Serving | 0 (0.0%) | 0 (0.0%) |
| Cleaning & Maintenance | 1 (100.0%) | 0 (0.0%) |
| Personal Care & Service | 0 (0.0%) | 2 (100.0%) |
| Total (Category) | 1 (33.3%) | 2 (66.7%) |
| Total (Overall) | 30 (55.6%) | 24 (44.4%) |
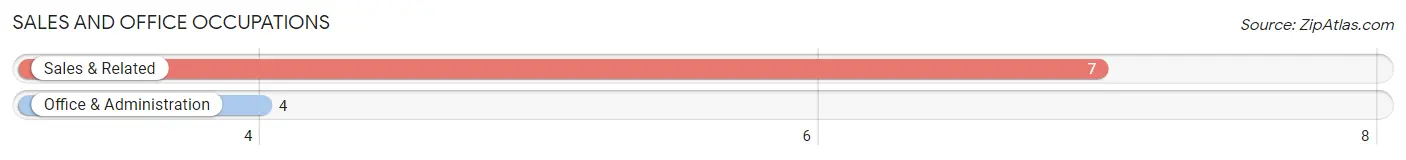
Sales and Office Occupations
The most common Sales and Office occupations in Leota are Sales & Related (7 | 13.0%), and Office & Administration (4 | 7.4%).
Sales and Office Occupations by Sex
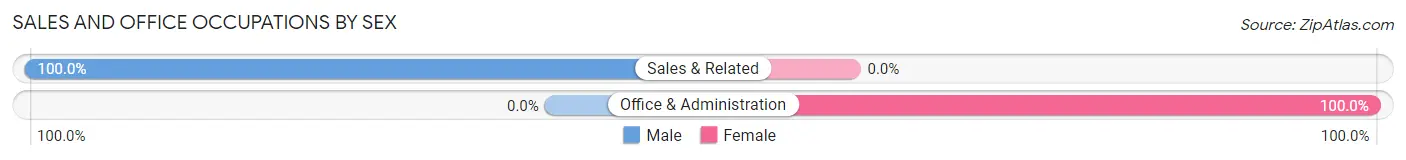
| Occupation | Male | Female |
| Sales & Related | 7 (100.0%) | 0 (0.0%) |
| Office & Administration | 0 (0.0%) | 4 (100.0%) |
| Total (Category) | 7 (63.6%) | 4 (36.4%) |
| Total (Overall) | 30 (55.6%) | 24 (44.4%) |
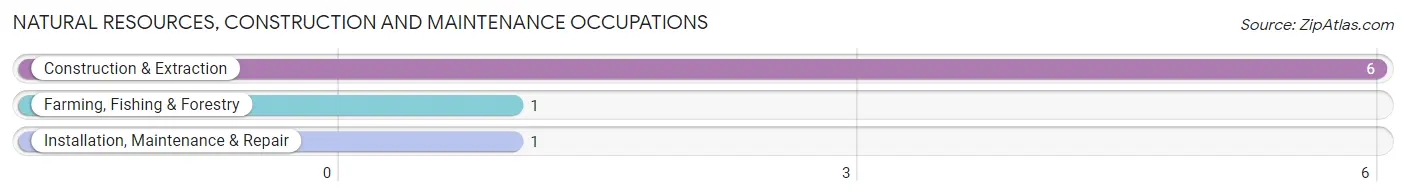
Natural Resources, Construction and Maintenance Occupations
The most common Natural Resources, Construction and Maintenance occupations in Leota are Construction & Extraction (6 | 11.1%), Farming, Fishing & Forestry (1 | 1.8%), and Installation, Maintenance & Repair (1 | 1.8%).
Natural Resources, Construction and Maintenance Occupations by Sex
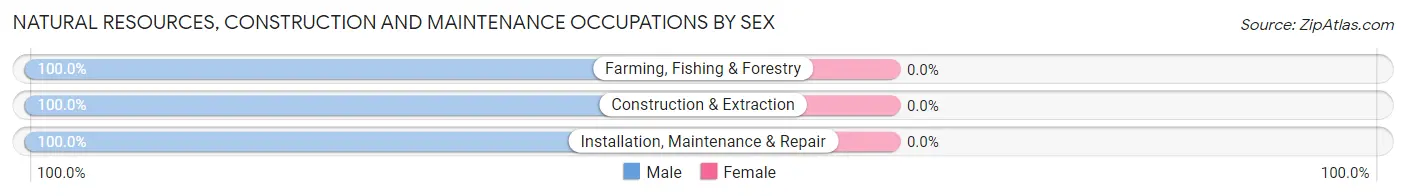
| Occupation | Male | Female |
| Farming, Fishing & Forestry | 1 (100.0%) | 0 (0.0%) |
| Construction & Extraction | 6 (100.0%) | 0 (0.0%) |
| Installation, Maintenance & Repair | 1 (100.0%) | 0 (0.0%) |
| Total (Category) | 8 (100.0%) | 0 (0.0%) |
| Total (Overall) | 30 (55.6%) | 24 (44.4%) |
Production, Transportation and Moving Occupations
The most common Production, Transportation and Moving occupations in Leota are Production (13 | 24.1%), and Transportation (6 | 11.1%).
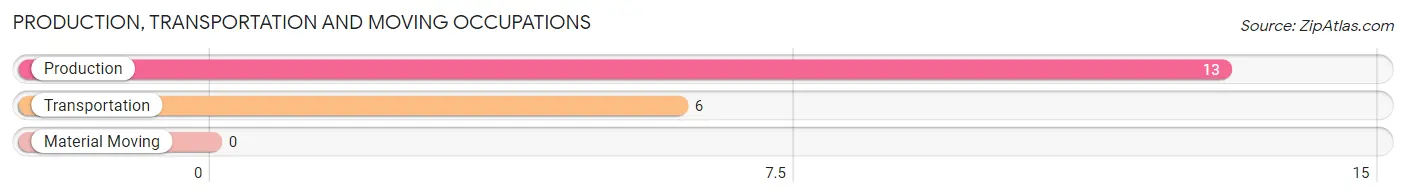
Production, Transportation and Moving Occupations by Sex
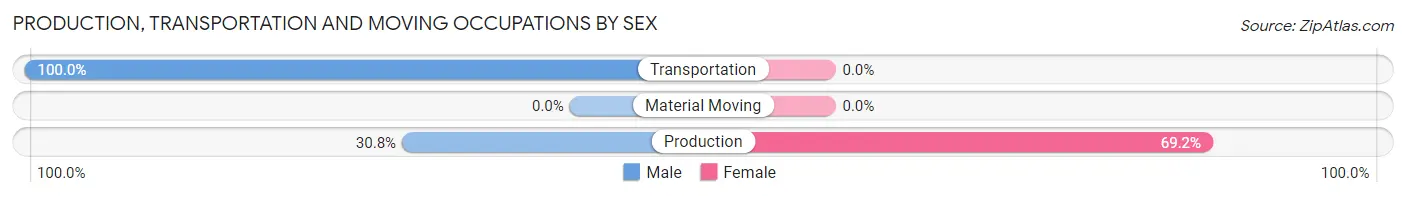
| Occupation | Male | Female |
| Production | 4 (30.8%) | 9 (69.2%) |
| Transportation | 6 (100.0%) | 0 (0.0%) |
| Material Moving | 0 (0.0%) | 0 (0.0%) |
| Total (Category) | 10 (52.6%) | 9 (47.4%) |
| Total (Overall) | 30 (55.6%) | 24 (44.4%) |
Employment Industries by Sex in Leota
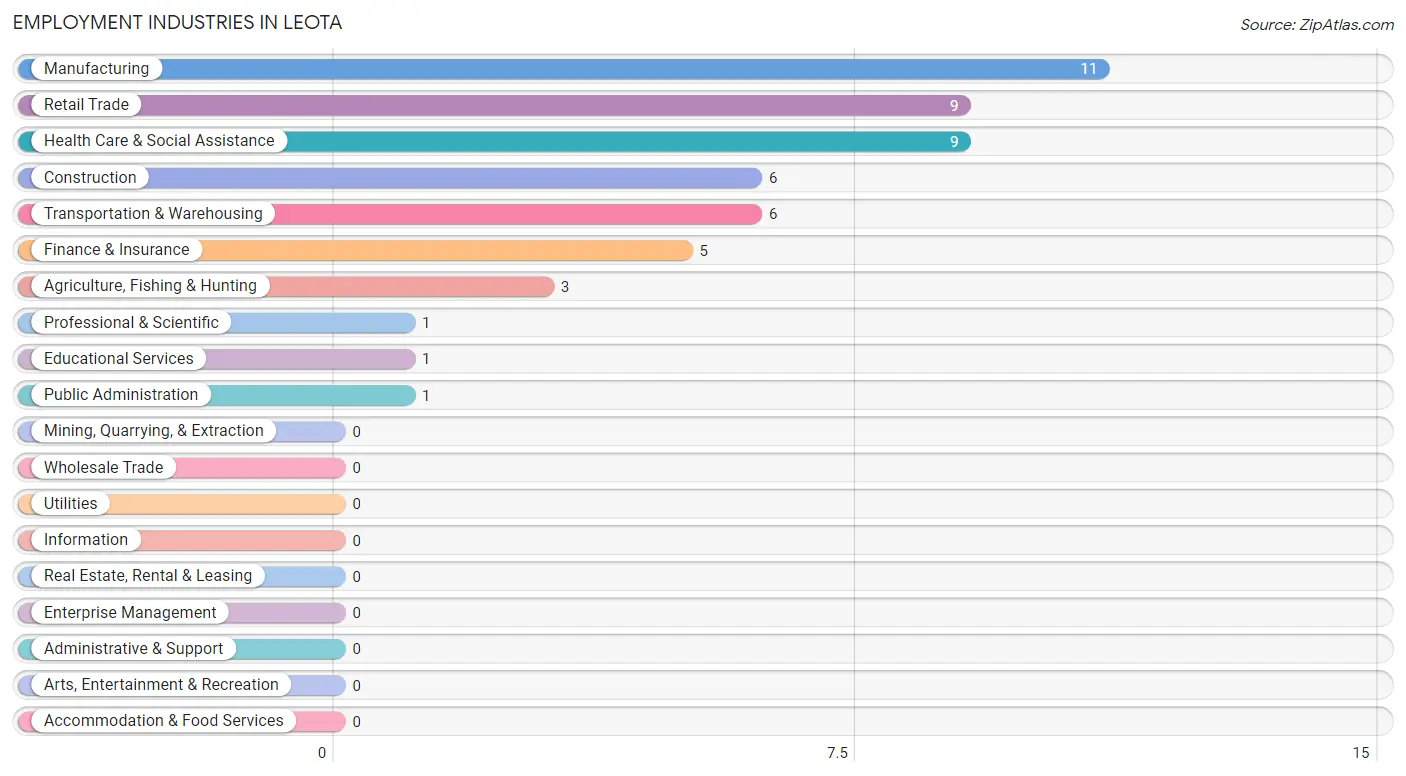
Employment Industries in Leota
The major employment industries in Leota include Manufacturing (11 | 20.4%), Retail Trade (9 | 16.7%), Health Care & Social Assistance (9 | 16.7%), Construction (6 | 11.1%), and Transportation & Warehousing (6 | 11.1%).
Employment Industries by Sex in Leota
The Leota industries that see more men than women are Agriculture, Fishing & Hunting (100.0%), Construction (100.0%), and Retail Trade (100.0%), whereas the industries that tend to have a higher number of women are Professional & Scientific (100.0%), Educational Services (100.0%), and Health Care & Social Assistance (100.0%).
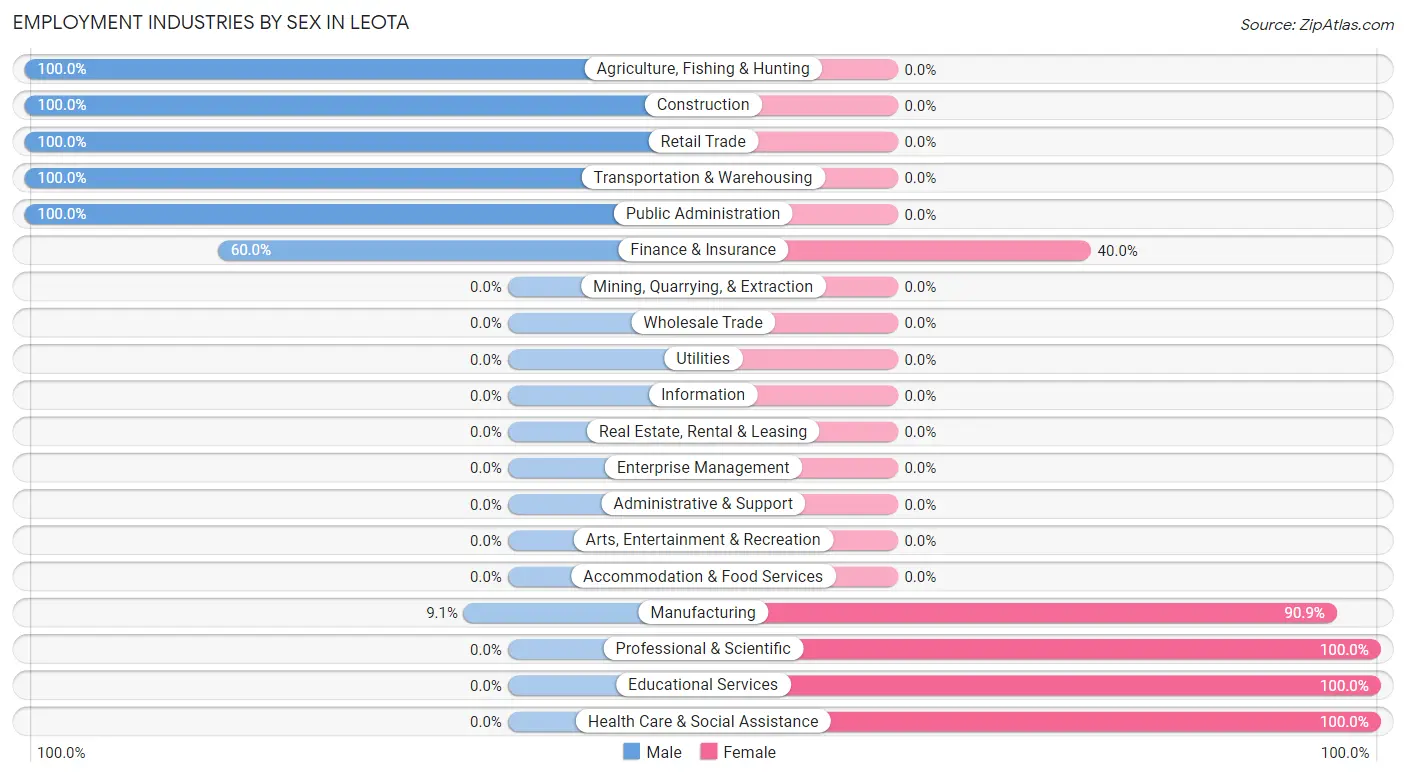
| Industry | Male | Female |
| Agriculture, Fishing & Hunting | 3 (100.0%) | 0 (0.0%) |
| Mining, Quarrying, & Extraction | 0 (0.0%) | 0 (0.0%) |
| Construction | 6 (100.0%) | 0 (0.0%) |
| Manufacturing | 1 (9.1%) | 10 (90.9%) |
| Wholesale Trade | 0 (0.0%) | 0 (0.0%) |
| Retail Trade | 9 (100.0%) | 0 (0.0%) |
| Transportation & Warehousing | 6 (100.0%) | 0 (0.0%) |
| Utilities | 0 (0.0%) | 0 (0.0%) |
| Information | 0 (0.0%) | 0 (0.0%) |
| Finance & Insurance | 3 (60.0%) | 2 (40.0%) |
| Real Estate, Rental & Leasing | 0 (0.0%) | 0 (0.0%) |
| Professional & Scientific | 0 (0.0%) | 1 (100.0%) |
| Enterprise Management | 0 (0.0%) | 0 (0.0%) |
| Administrative & Support | 0 (0.0%) | 0 (0.0%) |
| Educational Services | 0 (0.0%) | 1 (100.0%) |
| Health Care & Social Assistance | 0 (0.0%) | 9 (100.0%) |
| Arts, Entertainment & Recreation | 0 (0.0%) | 0 (0.0%) |
| Accommodation & Food Services | 0 (0.0%) | 0 (0.0%) |
| Public Administration | 1 (100.0%) | 0 (0.0%) |
| Total | 30 (55.6%) | 24 (44.4%) |
Education in Leota
School Enrollment in Leota
The most common levels of schooling among the 51 students in Leota are elementary school (33 | 64.7%), graduate / professional (10 | 19.6%), and high school (4 | 7.8%).
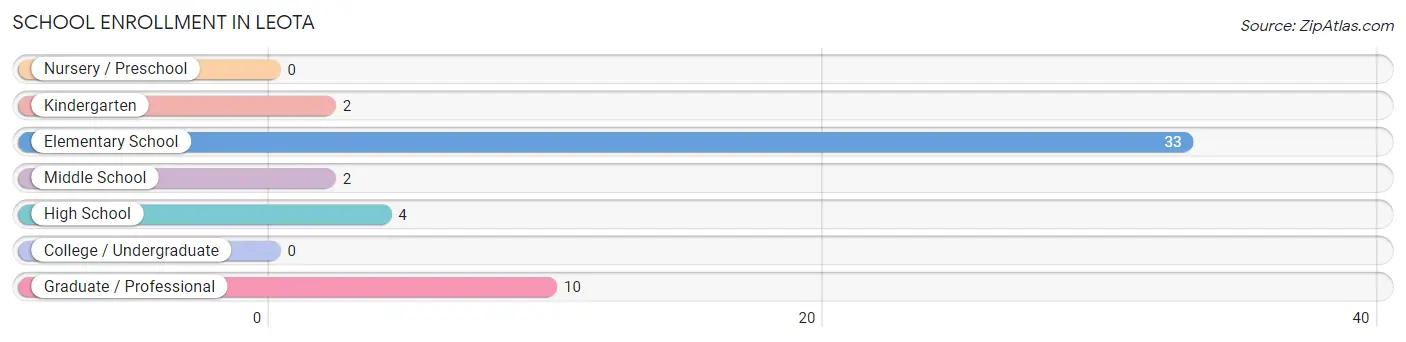
| School Level | # Students | % Students |
| Nursery / Preschool | 0 | 0.0% |
| Kindergarten | 2 | 3.9% |
| Elementary School | 33 | 64.7% |
| Middle School | 2 | 3.9% |
| High School | 4 | 7.8% |
| College / Undergraduate | 0 | 0.0% |
| Graduate / Professional | 10 | 19.6% |
| Total | 51 | 100.0% |
School Enrollment by Age by Funding Source in Leota
Out of a total of 51 students who are enrolled in schools in Leota, 9 (17.6%) attend a private institution, while the remaining 42 (82.4%) are enrolled in public schools. The age group of 25 to 34 year olds has the highest likelihood of being enrolled in private schools, with 5 (100.0% in the age bracket) enrolled. Conversely, the age group of 10 to 14 year olds has the lowest likelihood of being enrolled in a private school, with 12 (100.0% in the age bracket) attending a public institution.
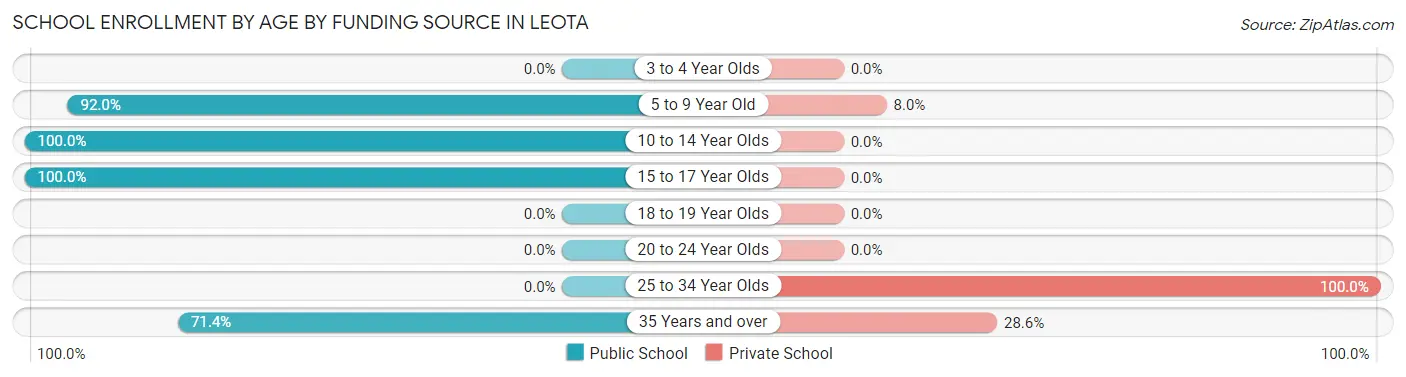
| Age Bracket | Public School | Private School |
| 3 to 4 Year Olds | 0 (0.0%) | 0 (0.0%) |
| 5 to 9 Year Old | 23 (92.0%) | 2 (8.0%) |
| 10 to 14 Year Olds | 12 (100.0%) | 0 (0.0%) |
| 15 to 17 Year Olds | 2 (100.0%) | 0 (0.0%) |
| 18 to 19 Year Olds | 0 (0.0%) | 0 (0.0%) |
| 20 to 24 Year Olds | 0 (0.0%) | 0 (0.0%) |
| 25 to 34 Year Olds | 0 (0.0%) | 5 (100.0%) |
| 35 Years and over | 5 (71.4%) | 2 (28.6%) |
| Total | 42 (82.4%) | 9 (17.6%) |
Educational Attainment by Field of Study in Leota
Social sciences (5 | 33.3%), arts & humanities (5 | 33.3%), education (2 | 13.3%), engineering (1 | 6.7%), and science & technology (1 | 6.7%) are the most common fields of study among 15 individuals in Leota who have obtained a bachelor's degree or higher.
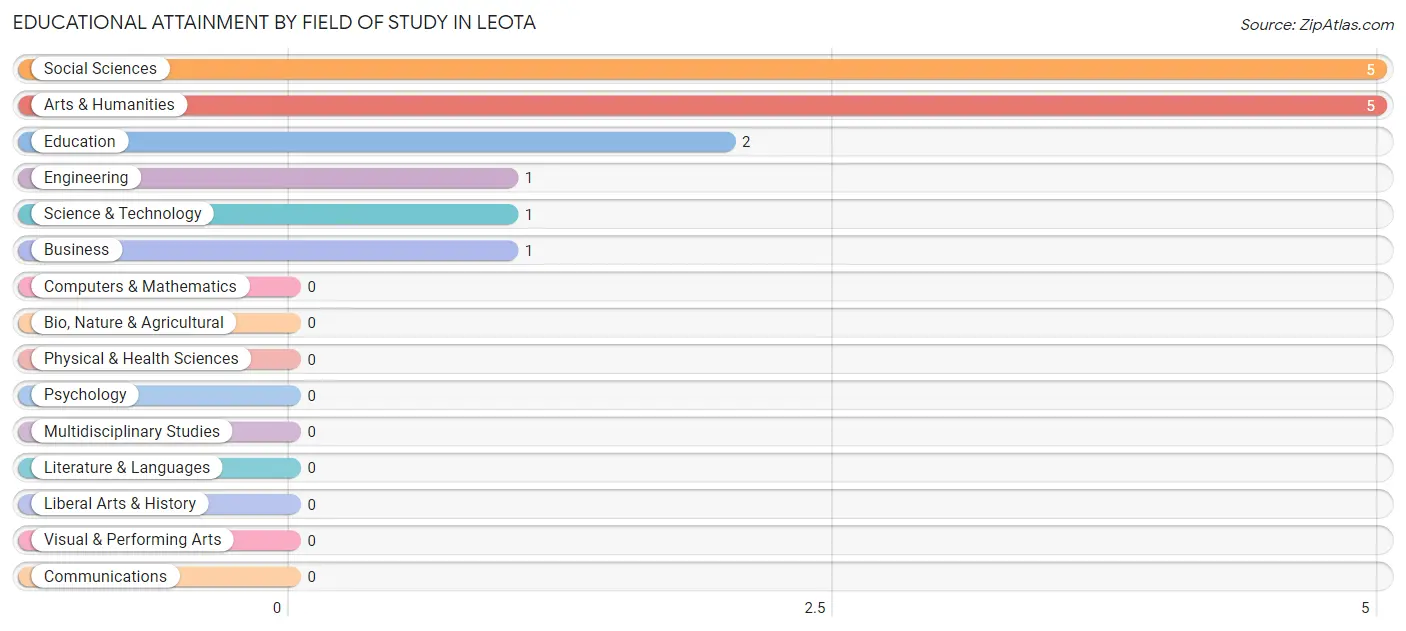
| Field of Study | # Graduates | % Graduates |
| Computers & Mathematics | 0 | 0.0% |
| Bio, Nature & Agricultural | 0 | 0.0% |
| Physical & Health Sciences | 0 | 0.0% |
| Psychology | 0 | 0.0% |
| Social Sciences | 5 | 33.3% |
| Engineering | 1 | 6.7% |
| Multidisciplinary Studies | 0 | 0.0% |
| Science & Technology | 1 | 6.7% |
| Business | 1 | 6.7% |
| Education | 2 | 13.3% |
| Literature & Languages | 0 | 0.0% |
| Liberal Arts & History | 0 | 0.0% |
| Visual & Performing Arts | 0 | 0.0% |
| Communications | 0 | 0.0% |
| Arts & Humanities | 5 | 33.3% |
| Total | 15 | 100.0% |
Transportation & Commute in Leota
Vehicle Availability by Sex in Leota
The most prevalent vehicle ownership categories in Leota are males with 2 vehicles (18, accounting for 62.1%) and females with 2 vehicles (12, making up 75.0%).
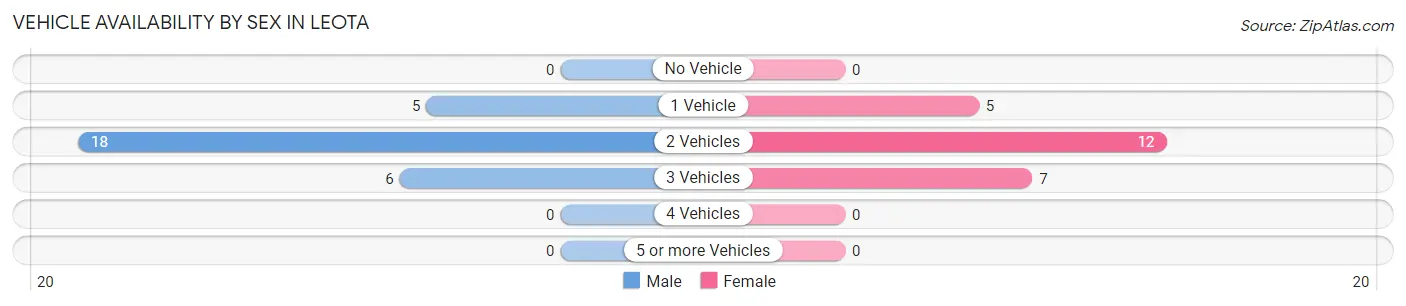
| Vehicles Available | Male | Female |
| No Vehicle | 0 (0.0%) | 0 (0.0%) |
| 1 Vehicle | 5 (17.2%) | 5 (20.8%) |
| 2 Vehicles | 18 (62.1%) | 12 (50.0%) |
| 3 Vehicles | 6 (20.7%) | 7 (29.2%) |
| 4 Vehicles | 0 (0.0%) | 0 (0.0%) |
| 5 or more Vehicles | 0 (0.0%) | 0 (0.0%) |
| Total | 29 (100.0%) | 24 (100.0%) |
Commute Time in Leota
The most frequently occuring commute durations in Leota are 10 to 14 minutes (16 commuters, 32.0%), 15 to 19 minutes (15 commuters, 30.0%), and 5 to 9 minutes (7 commuters, 14.0%).
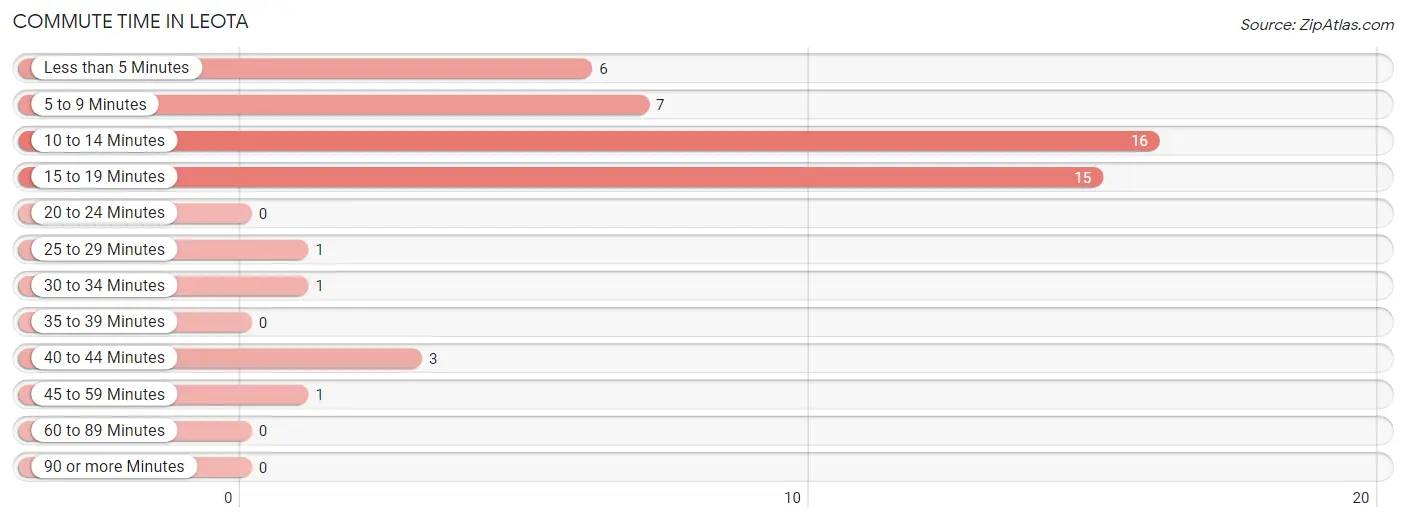
| Commute Time | # Commuters | % Commuters |
| Less than 5 Minutes | 6 | 12.0% |
| 5 to 9 Minutes | 7 | 14.0% |
| 10 to 14 Minutes | 16 | 32.0% |
| 15 to 19 Minutes | 15 | 30.0% |
| 20 to 24 Minutes | 0 | 0.0% |
| 25 to 29 Minutes | 1 | 2.0% |
| 30 to 34 Minutes | 1 | 2.0% |
| 35 to 39 Minutes | 0 | 0.0% |
| 40 to 44 Minutes | 3 | 6.0% |
| 45 to 59 Minutes | 1 | 2.0% |
| 60 to 89 Minutes | 0 | 0.0% |
| 90 or more Minutes | 0 | 0.0% |
Commute Time by Sex in Leota
The most common commute times in Leota are 10 to 14 minutes (7 commuters, 26.9%) for males and 10 to 14 minutes (9 commuters, 37.5%) for females.
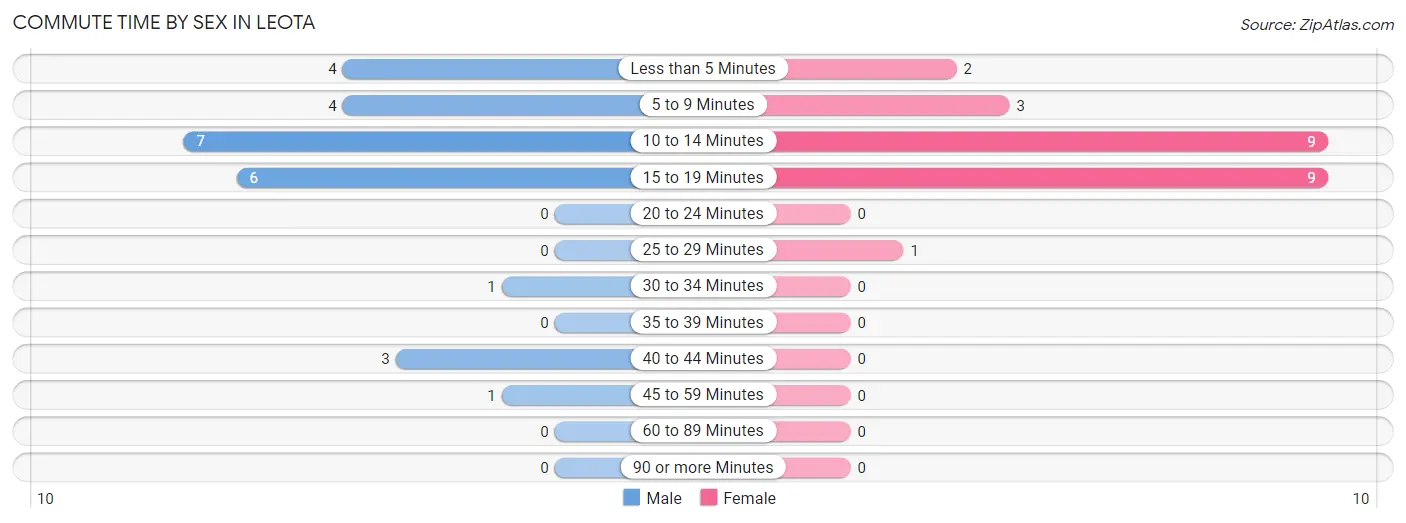
| Commute Time | Male | Female |
| Less than 5 Minutes | 4 (15.4%) | 2 (8.3%) |
| 5 to 9 Minutes | 4 (15.4%) | 3 (12.5%) |
| 10 to 14 Minutes | 7 (26.9%) | 9 (37.5%) |
| 15 to 19 Minutes | 6 (23.1%) | 9 (37.5%) |
| 20 to 24 Minutes | 0 (0.0%) | 0 (0.0%) |
| 25 to 29 Minutes | 0 (0.0%) | 1 (4.2%) |
| 30 to 34 Minutes | 1 (3.8%) | 0 (0.0%) |
| 35 to 39 Minutes | 0 (0.0%) | 0 (0.0%) |
| 40 to 44 Minutes | 3 (11.5%) | 0 (0.0%) |
| 45 to 59 Minutes | 1 (3.8%) | 0 (0.0%) |
| 60 to 89 Minutes | 0 (0.0%) | 0 (0.0%) |
| 90 or more Minutes | 0 (0.0%) | 0 (0.0%) |
Time of Departure to Work by Sex in Leota
The most frequent times of departure to work in Leota are 12:00 AM to 4:59 AM (10, 38.5%) for males and 7:00 AM to 7:29 AM (15, 62.5%) for females.
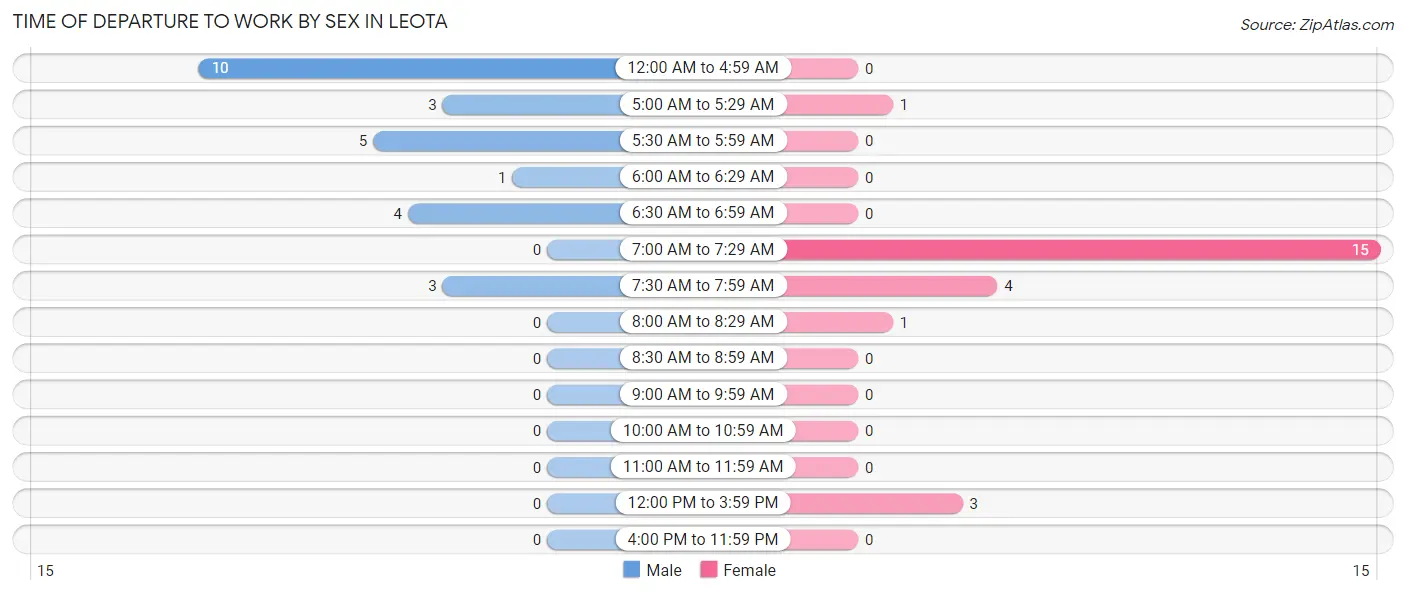
| Time of Departure | Male | Female |
| 12:00 AM to 4:59 AM | 10 (38.5%) | 0 (0.0%) |
| 5:00 AM to 5:29 AM | 3 (11.5%) | 1 (4.2%) |
| 5:30 AM to 5:59 AM | 5 (19.2%) | 0 (0.0%) |
| 6:00 AM to 6:29 AM | 1 (3.8%) | 0 (0.0%) |
| 6:30 AM to 6:59 AM | 4 (15.4%) | 0 (0.0%) |
| 7:00 AM to 7:29 AM | 0 (0.0%) | 15 (62.5%) |
| 7:30 AM to 7:59 AM | 3 (11.5%) | 4 (16.7%) |
| 8:00 AM to 8:29 AM | 0 (0.0%) | 1 (4.2%) |
| 8:30 AM to 8:59 AM | 0 (0.0%) | 0 (0.0%) |
| 9:00 AM to 9:59 AM | 0 (0.0%) | 0 (0.0%) |
| 10:00 AM to 10:59 AM | 0 (0.0%) | 0 (0.0%) |
| 11:00 AM to 11:59 AM | 0 (0.0%) | 0 (0.0%) |
| 12:00 PM to 3:59 PM | 0 (0.0%) | 3 (12.5%) |
| 4:00 PM to 11:59 PM | 0 (0.0%) | 0 (0.0%) |
| Total | 26 (100.0%) | 24 (100.0%) |
Housing Occupancy in Leota
Occupancy by Ownership in Leota
Of the total 55 dwellings in Leota, owner-occupied units account for 52 (94.6%), while renter-occupied units make up 3 (5.4%).
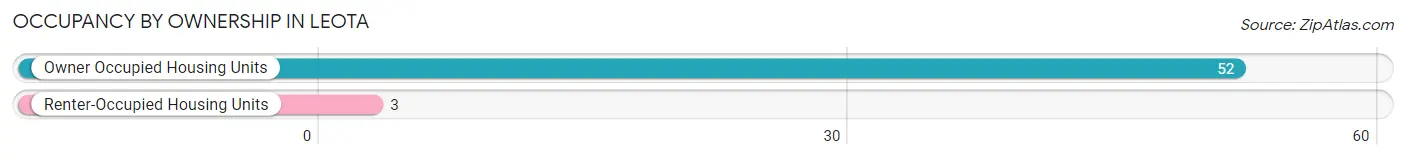
| Occupancy | # Housing Units | % Housing Units |
| Owner Occupied Housing Units | 52 | 94.6% |
| Renter-Occupied Housing Units | 3 | 5.4% |
| Total Occupied Housing Units | 55 | 100.0% |
Occupancy by Household Size in Leota
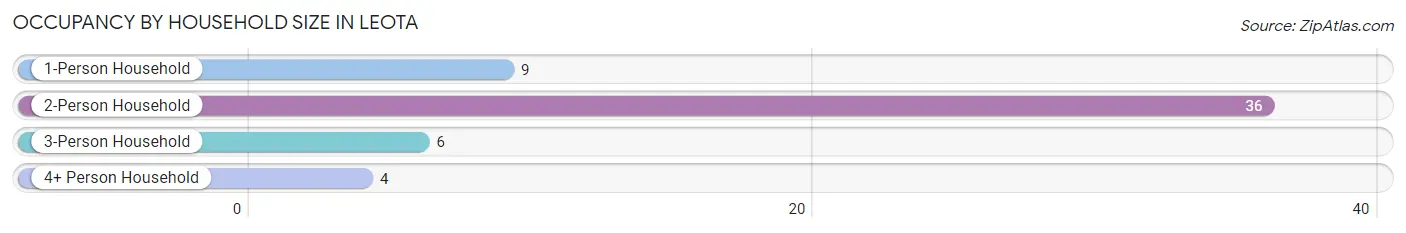
| Household Size | # Housing Units | % Housing Units |
| 1-Person Household | 9 | 16.4% |
| 2-Person Household | 36 | 65.4% |
| 3-Person Household | 6 | 10.9% |
| 4+ Person Household | 4 | 7.3% |
| Total Housing Units | 55 | 100.0% |
Occupancy by Ownership by Household Size in Leota
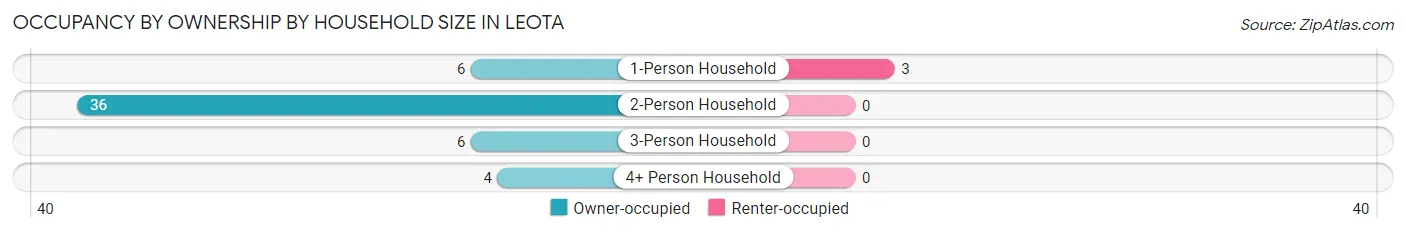
| Household Size | Owner-occupied | Renter-occupied |
| 1-Person Household | 6 (66.7%) | 3 (33.3%) |
| 2-Person Household | 36 (100.0%) | 0 (0.0%) |
| 3-Person Household | 6 (100.0%) | 0 (0.0%) |
| 4+ Person Household | 4 (100.0%) | 0 (0.0%) |
| Total Housing Units | 52 (94.6%) | 3 (5.4%) |
Occupancy by Educational Attainment in Leota
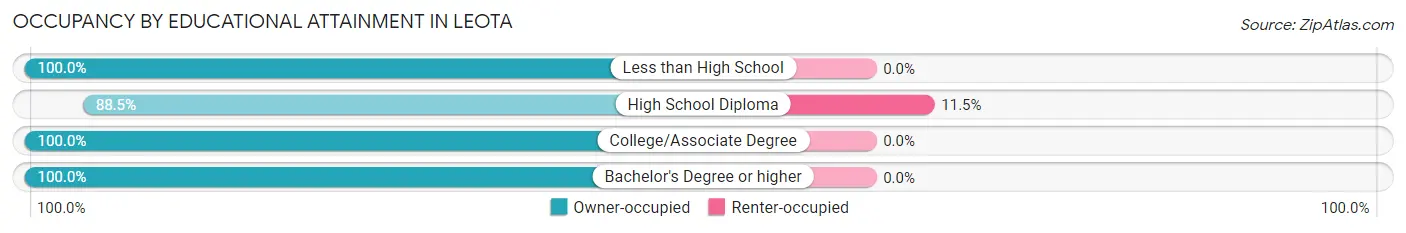
| Household Size | Owner-occupied | Renter-occupied |
| Less than High School | 2 (100.0%) | 0 (0.0%) |
| High School Diploma | 23 (88.5%) | 3 (11.5%) |
| College/Associate Degree | 24 (100.0%) | 0 (0.0%) |
| Bachelor's Degree or higher | 3 (100.0%) | 0 (0.0%) |
Occupancy by Age of Householder in Leota
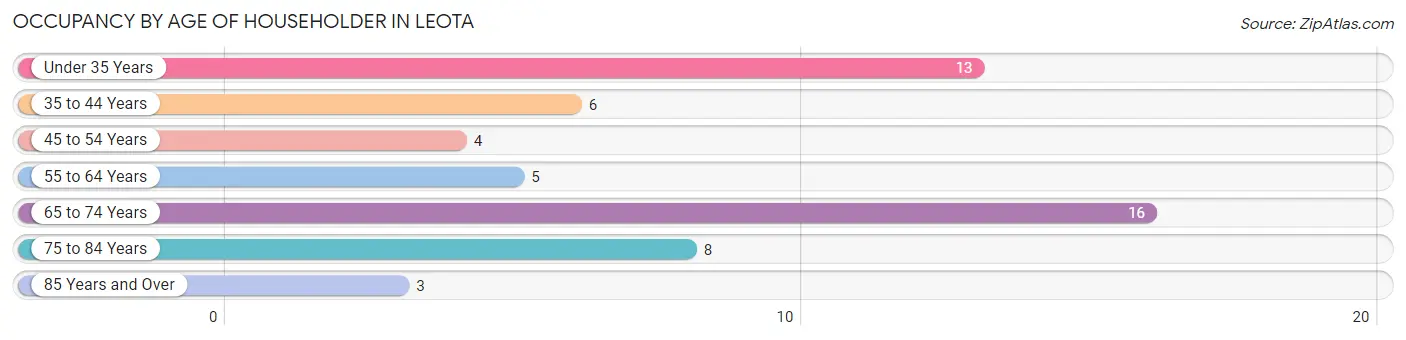
| Age Bracket | # Households | % Households |
| Under 35 Years | 13 | 23.6% |
| 35 to 44 Years | 6 | 10.9% |
| 45 to 54 Years | 4 | 7.3% |
| 55 to 64 Years | 5 | 9.1% |
| 65 to 74 Years | 16 | 29.1% |
| 75 to 84 Years | 8 | 14.5% |
| 85 Years and Over | 3 | 5.4% |
| Total | 55 | 100.0% |
Housing Finances in Leota
Median Income by Occupancy in Leota
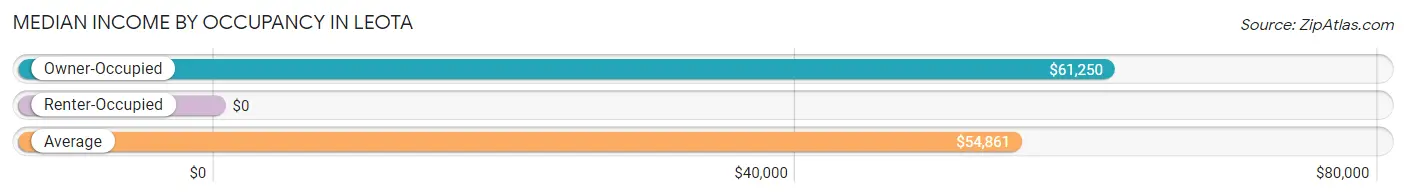
| Occupancy Type | # Households | Median Income |
| Owner-Occupied | 52 (94.6%) | $61,250 |
| Renter-Occupied | 3 (5.4%) | $0 |
| Average | 55 (100.0%) | $54,861 |
Occupancy by Householder Income Bracket in Leota
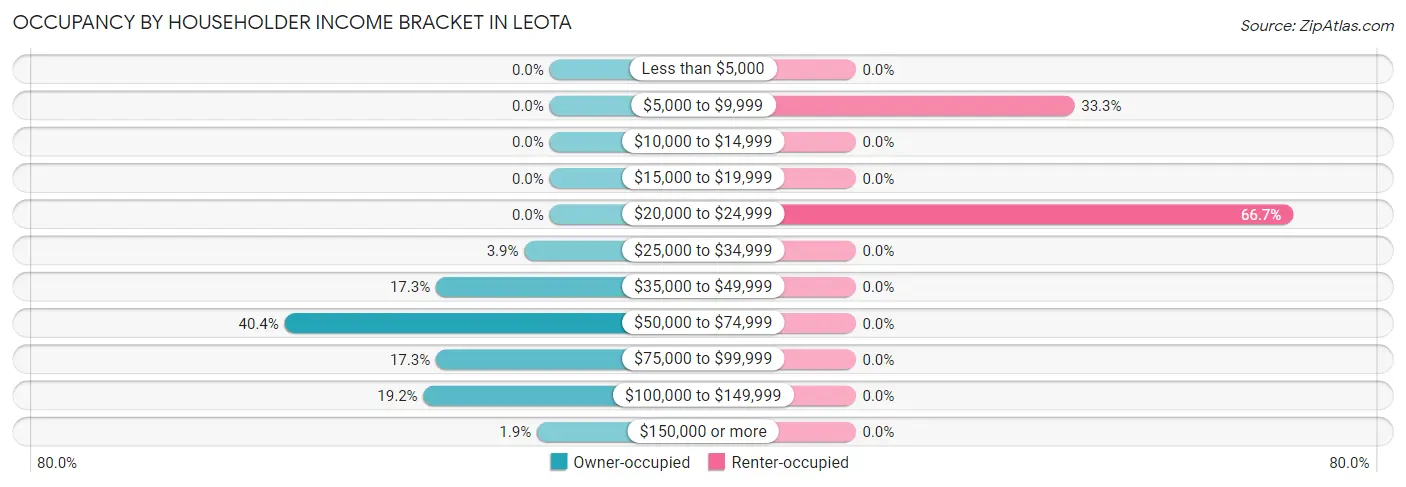
| Income Bracket | Owner-occupied | Renter-occupied |
| Less than $5,000 | 0 (0.0%) | 0 (0.0%) |
| $5,000 to $9,999 | 0 (0.0%) | 1 (33.3%) |
| $10,000 to $14,999 | 0 (0.0%) | 0 (0.0%) |
| $15,000 to $19,999 | 0 (0.0%) | 0 (0.0%) |
| $20,000 to $24,999 | 0 (0.0%) | 2 (66.7%) |
| $25,000 to $34,999 | 2 (3.8%) | 0 (0.0%) |
| $35,000 to $49,999 | 9 (17.3%) | 0 (0.0%) |
| $50,000 to $74,999 | 21 (40.4%) | 0 (0.0%) |
| $75,000 to $99,999 | 9 (17.3%) | 0 (0.0%) |
| $100,000 to $149,999 | 10 (19.2%) | 0 (0.0%) |
| $150,000 or more | 1 (1.9%) | 0 (0.0%) |
| Total | 52 (100.0%) | 3 (100.0%) |
Monthly Housing Cost Tiers in Leota
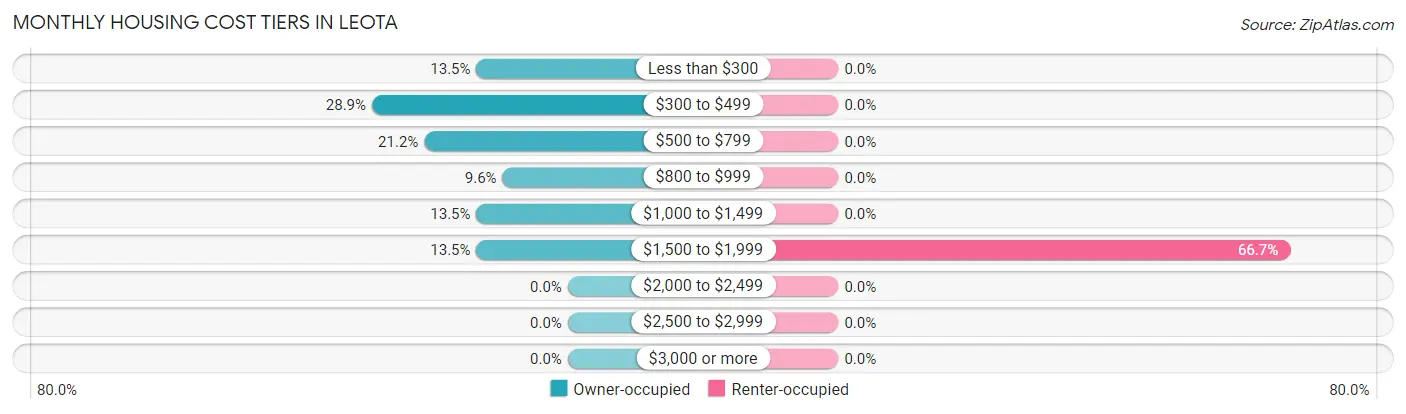
| Monthly Cost | Owner-occupied | Renter-occupied |
| Less than $300 | 7 (13.5%) | 0 (0.0%) |
| $300 to $499 | 15 (28.8%) | 0 (0.0%) |
| $500 to $799 | 11 (21.1%) | 0 (0.0%) |
| $800 to $999 | 5 (9.6%) | 0 (0.0%) |
| $1,000 to $1,499 | 7 (13.5%) | 0 (0.0%) |
| $1,500 to $1,999 | 7 (13.5%) | 2 (66.7%) |
| $2,000 to $2,499 | 0 (0.0%) | 0 (0.0%) |
| $2,500 to $2,999 | 0 (0.0%) | 0 (0.0%) |
| $3,000 or more | 0 (0.0%) | 0 (0.0%) |
| Total | 52 (100.0%) | 3 (100.0%) |
Physical Housing Characteristics in Leota
Housing Structures in Leota
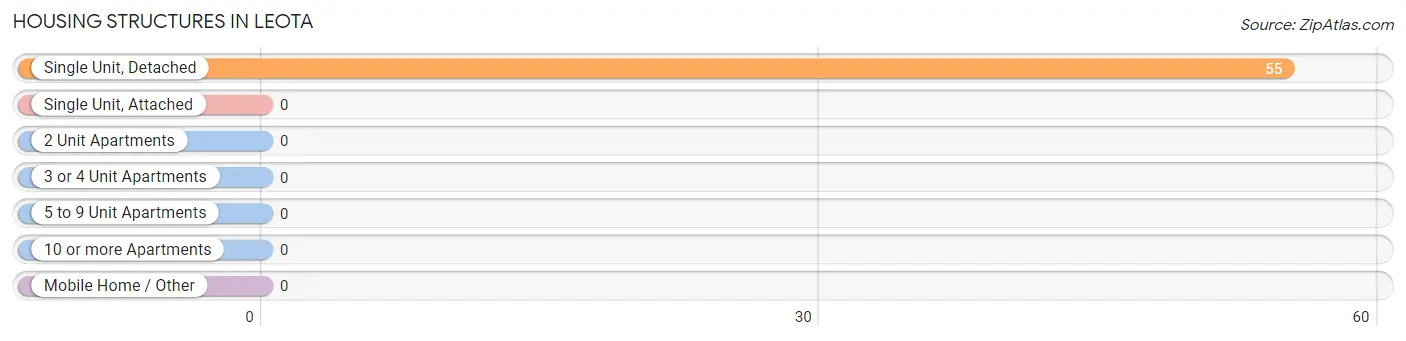
| Structure Type | # Housing Units | % Housing Units |
| Single Unit, Detached | 55 | 100.0% |
| Single Unit, Attached | 0 | 0.0% |
| 2 Unit Apartments | 0 | 0.0% |
| 3 or 4 Unit Apartments | 0 | 0.0% |
| 5 to 9 Unit Apartments | 0 | 0.0% |
| 10 or more Apartments | 0 | 0.0% |
| Mobile Home / Other | 0 | 0.0% |
| Total | 55 | 100.0% |
Housing Structures by Occupancy in Leota
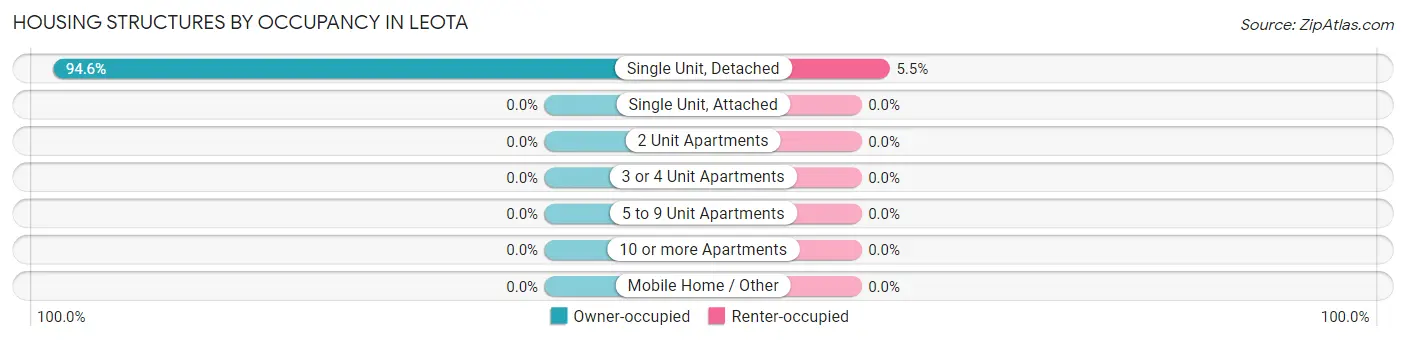
| Structure Type | Owner-occupied | Renter-occupied |
| Single Unit, Detached | 52 (94.6%) | 3 (5.4%) |
| Single Unit, Attached | 0 (0.0%) | 0 (0.0%) |
| 2 Unit Apartments | 0 (0.0%) | 0 (0.0%) |
| 3 or 4 Unit Apartments | 0 (0.0%) | 0 (0.0%) |
| 5 to 9 Unit Apartments | 0 (0.0%) | 0 (0.0%) |
| 10 or more Apartments | 0 (0.0%) | 0 (0.0%) |
| Mobile Home / Other | 0 (0.0%) | 0 (0.0%) |
| Total | 52 (94.6%) | 3 (5.4%) |
Housing Structures by Number of Rooms in Leota
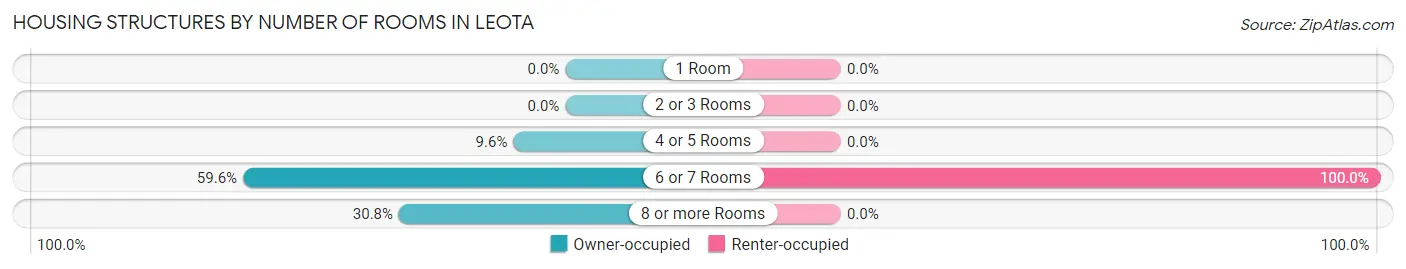
| Number of Rooms | Owner-occupied | Renter-occupied |
| 1 Room | 0 (0.0%) | 0 (0.0%) |
| 2 or 3 Rooms | 0 (0.0%) | 0 (0.0%) |
| 4 or 5 Rooms | 5 (9.6%) | 0 (0.0%) |
| 6 or 7 Rooms | 31 (59.6%) | 3 (100.0%) |
| 8 or more Rooms | 16 (30.8%) | 0 (0.0%) |
| Total | 52 (100.0%) | 3 (100.0%) |
Housing Structure by Heating Type in Leota
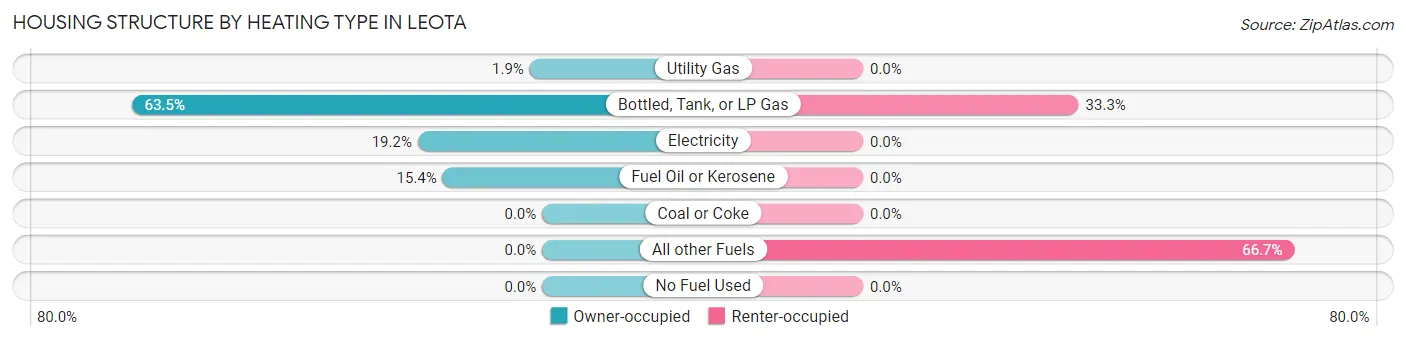
| Heating Type | Owner-occupied | Renter-occupied |
| Utility Gas | 1 (1.9%) | 0 (0.0%) |
| Bottled, Tank, or LP Gas | 33 (63.5%) | 1 (33.3%) |
| Electricity | 10 (19.2%) | 0 (0.0%) |
| Fuel Oil or Kerosene | 8 (15.4%) | 0 (0.0%) |
| Coal or Coke | 0 (0.0%) | 0 (0.0%) |
| All other Fuels | 0 (0.0%) | 2 (66.7%) |
| No Fuel Used | 0 (0.0%) | 0 (0.0%) |
| Total | 52 (100.0%) | 3 (100.0%) |
Household Vehicle Usage in Leota
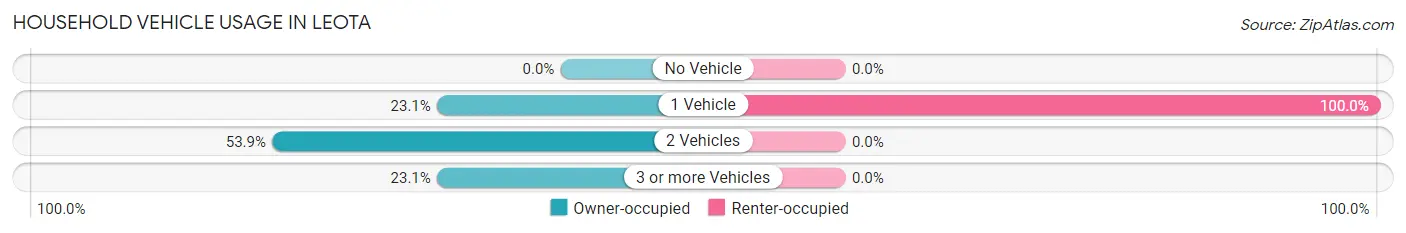
| Vehicles per Household | Owner-occupied | Renter-occupied |
| No Vehicle | 0 (0.0%) | 0 (0.0%) |
| 1 Vehicle | 12 (23.1%) | 3 (100.0%) |
| 2 Vehicles | 28 (53.8%) | 0 (0.0%) |
| 3 or more Vehicles | 12 (23.1%) | 0 (0.0%) |
| Total | 52 (100.0%) | 3 (100.0%) |
Real Estate & Mortgages in Leota
Real Estate and Mortgage Overview in Leota
| Characteristic | Without Mortgage | With Mortgage |
| Housing Units | 37 | 15 |
| Median Property Value | $85,000 | $0 |
| Median Household Income | $54,250 | $0 |
| Monthly Housing Costs | $465 | $0 |
| Real Estate Taxes | $830 | $0 |
Property Value by Mortgage Status in Leota
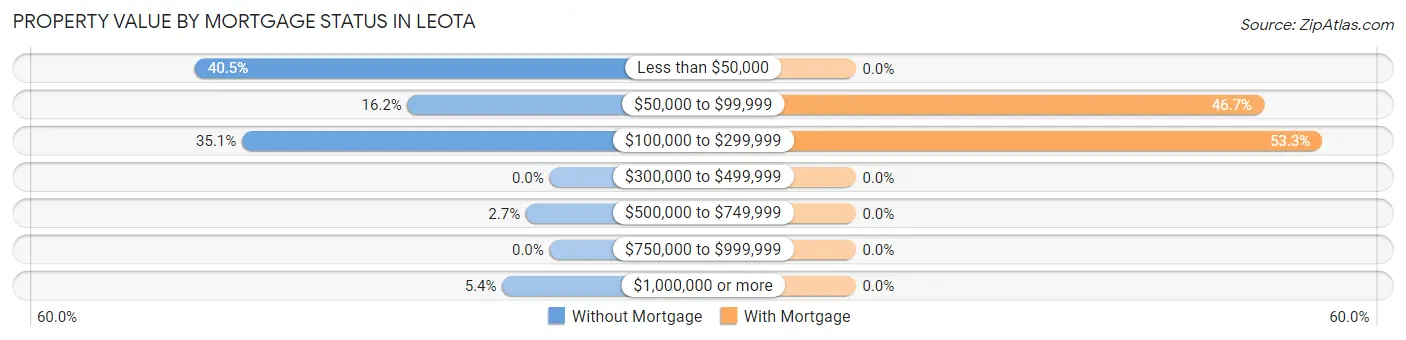
| Property Value | Without Mortgage | With Mortgage |
| Less than $50,000 | 15 (40.5%) | 0 (0.0%) |
| $50,000 to $99,999 | 6 (16.2%) | 7 (46.7%) |
| $100,000 to $299,999 | 13 (35.1%) | 8 (53.3%) |
| $300,000 to $499,999 | 0 (0.0%) | 0 (0.0%) |
| $500,000 to $749,999 | 1 (2.7%) | 0 (0.0%) |
| $750,000 to $999,999 | 0 (0.0%) | 0 (0.0%) |
| $1,000,000 or more | 2 (5.4%) | 0 (0.0%) |
| Total | 37 (100.0%) | 15 (100.0%) |
Household Income by Mortgage Status in Leota
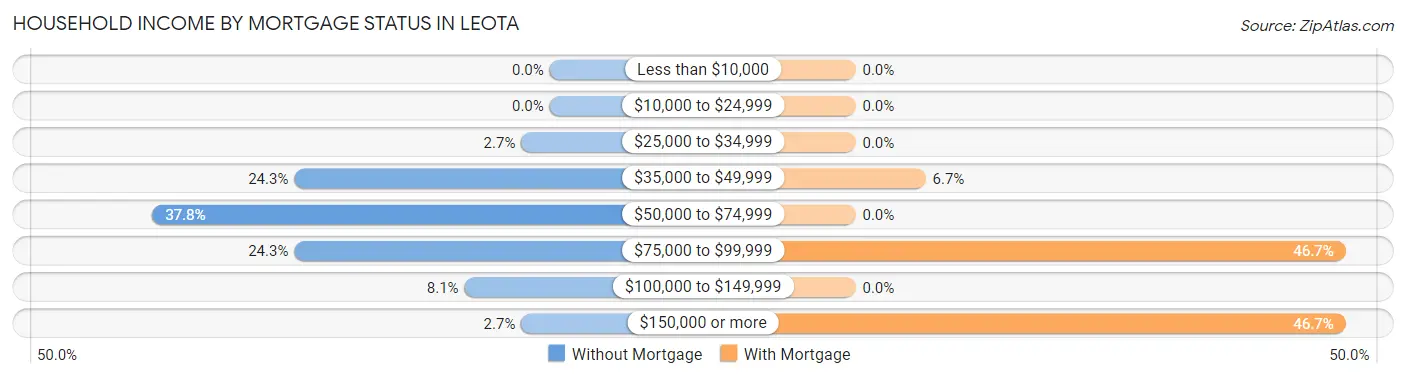
| Household Income | Without Mortgage | With Mortgage |
| Less than $10,000 | 0 (0.0%) | 0 (0.0%) |
| $10,000 to $24,999 | 0 (0.0%) | 0 (0.0%) |
| $25,000 to $34,999 | 1 (2.7%) | 0 (0.0%) |
| $35,000 to $49,999 | 9 (24.3%) | 1 (6.7%) |
| $50,000 to $74,999 | 14 (37.8%) | 0 (0.0%) |
| $75,000 to $99,999 | 9 (24.3%) | 7 (46.7%) |
| $100,000 to $149,999 | 3 (8.1%) | 0 (0.0%) |
| $150,000 or more | 1 (2.7%) | 7 (46.7%) |
| Total | 37 (100.0%) | 15 (100.0%) |
Property Value to Household Income Ratio in Leota
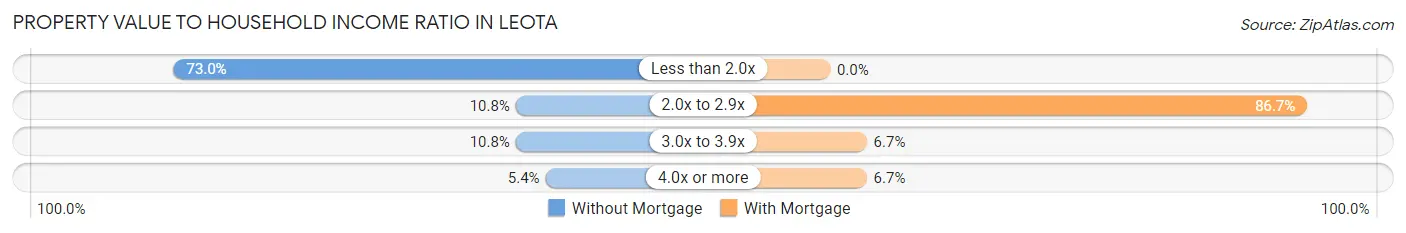
| Value-to-Income Ratio | Without Mortgage | With Mortgage |
| Less than 2.0x | 27 (73.0%) | 0 (0.0%) |
| 2.0x to 2.9x | 4 (10.8%) | 13 (86.7%) |
| 3.0x to 3.9x | 4 (10.8%) | 1 (6.7%) |
| 4.0x or more | 2 (5.4%) | 1 (6.7%) |
| Total | 37 (100.0%) | 15 (100.0%) |
Real Estate Taxes by Mortgage Status in Leota
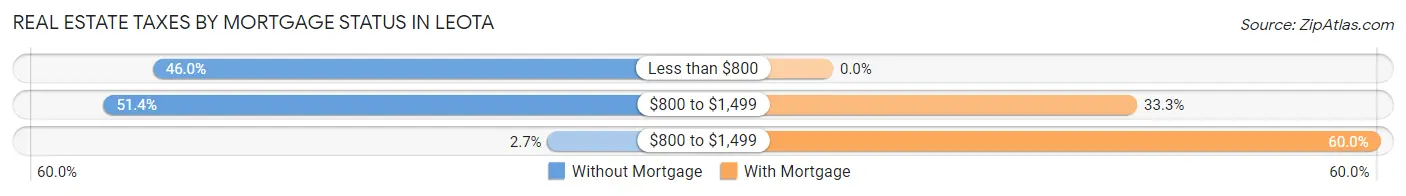
| Property Taxes | Without Mortgage | With Mortgage |
| Less than $800 | 17 (46.0%) | 0 (0.0%) |
| $800 to $1,499 | 19 (51.3%) | 5 (33.3%) |
| $800 to $1,499 | 1 (2.7%) | 9 (60.0%) |
| Total | 37 (100.0%) | 15 (100.0%) |
Health & Disability in Leota
Health Insurance Coverage by Age in Leota
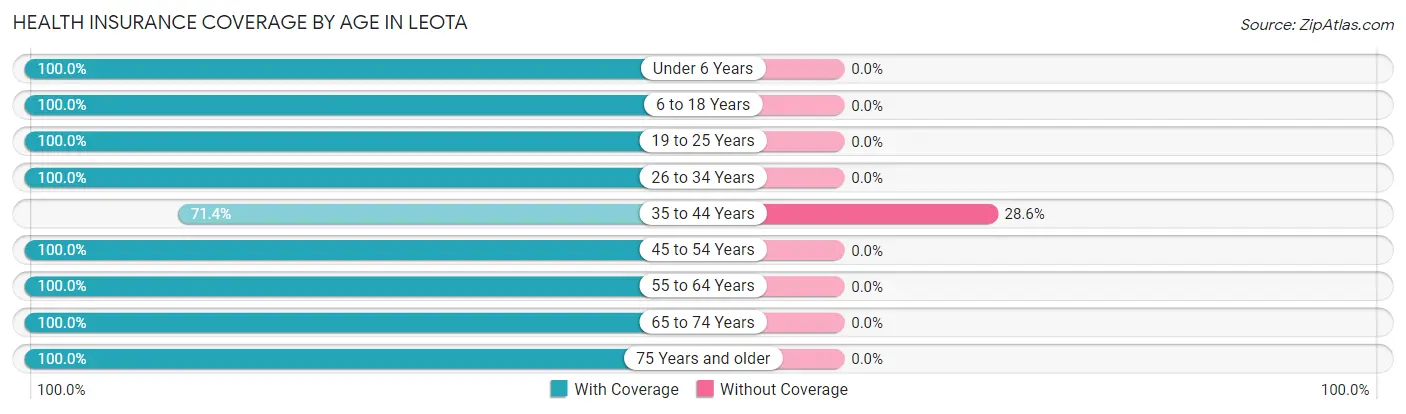
| Age Bracket | With Coverage | Without Coverage |
| Under 6 Years | 4 (100.0%) | 0 (0.0%) |
| 6 to 18 Years | 39 (100.0%) | 0 (0.0%) |
| 19 to 25 Years | 2 (100.0%) | 0 (0.0%) |
| 26 to 34 Years | 19 (100.0%) | 0 (0.0%) |
| 35 to 44 Years | 5 (71.4%) | 2 (28.6%) |
| 45 to 54 Years | 10 (100.0%) | 0 (0.0%) |
| 55 to 64 Years | 13 (100.0%) | 0 (0.0%) |
| 65 to 74 Years | 29 (100.0%) | 0 (0.0%) |
| 75 Years and older | 23 (100.0%) | 0 (0.0%) |
| Total | 144 (98.6%) | 2 (1.4%) |
Health Insurance Coverage by Citizenship Status in Leota
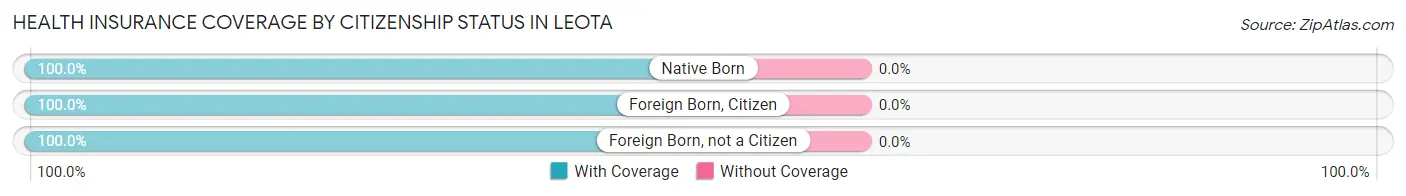
| Citizenship Status | With Coverage | Without Coverage |
| Native Born | 4 (100.0%) | 0 (0.0%) |
| Foreign Born, Citizen | 39 (100.0%) | 0 (0.0%) |
| Foreign Born, not a Citizen | 2 (100.0%) | 0 (0.0%) |
Health Insurance Coverage by Household Income in Leota
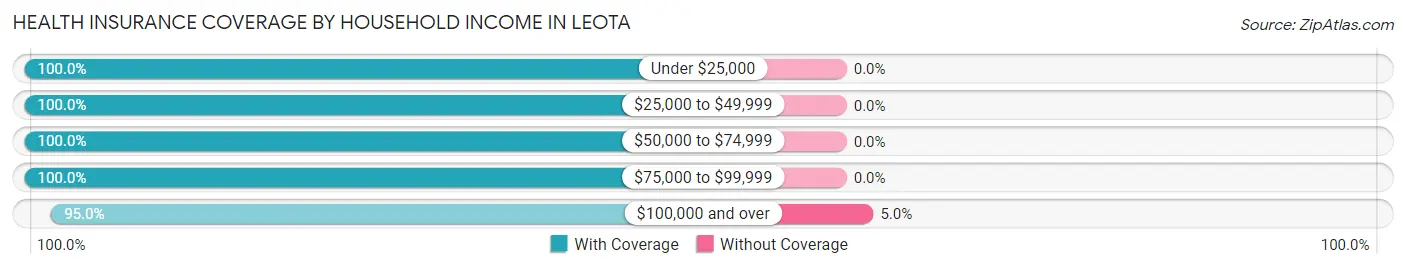
| Household Income | With Coverage | Without Coverage |
| Under $25,000 | 3 (100.0%) | 0 (0.0%) |
| $25,000 to $49,999 | 25 (100.0%) | 0 (0.0%) |
| $50,000 to $74,999 | 60 (100.0%) | 0 (0.0%) |
| $75,000 to $99,999 | 18 (100.0%) | 0 (0.0%) |
| $100,000 and over | 38 (95.0%) | 2 (5.0%) |
Public vs Private Health Insurance Coverage by Age in Leota
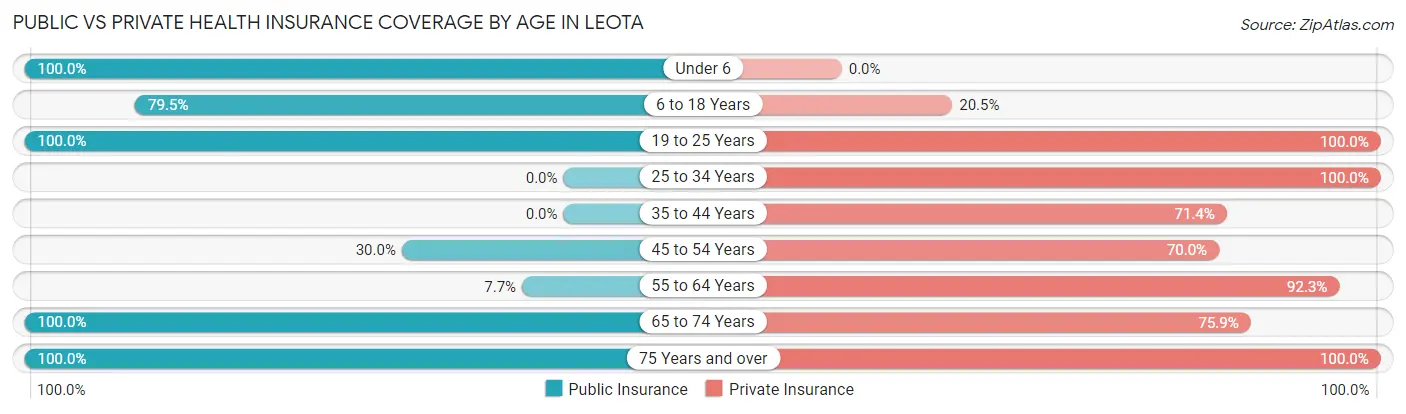
| Age Bracket | Public Insurance | Private Insurance |
| Under 6 | 4 (100.0%) | 0 (0.0%) |
| 6 to 18 Years | 31 (79.5%) | 8 (20.5%) |
| 19 to 25 Years | 2 (100.0%) | 2 (100.0%) |
| 25 to 34 Years | 0 (0.0%) | 19 (100.0%) |
| 35 to 44 Years | 0 (0.0%) | 5 (71.4%) |
| 45 to 54 Years | 3 (30.0%) | 7 (70.0%) |
| 55 to 64 Years | 1 (7.7%) | 12 (92.3%) |
| 65 to 74 Years | 29 (100.0%) | 22 (75.9%) |
| 75 Years and over | 23 (100.0%) | 23 (100.0%) |
| Total | 93 (63.7%) | 98 (67.1%) |
Disability Status by Sex by Age in Leota
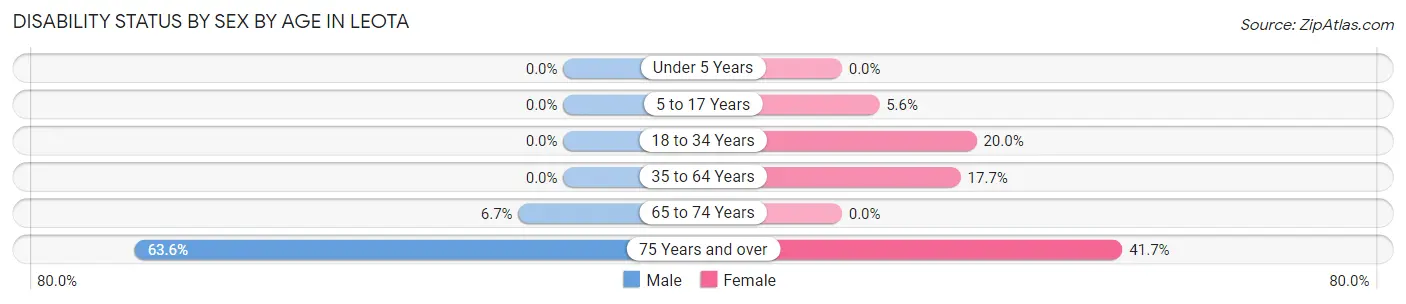
| Age Bracket | Male | Female |
| Under 5 Years | 0 (0.0%) | 0 (0.0%) |
| 5 to 17 Years | 0 (0.0%) | 1 (5.6%) |
| 18 to 34 Years | 0 (0.0%) | 2 (20.0%) |
| 35 to 64 Years | 0 (0.0%) | 3 (17.6%) |
| 65 to 74 Years | 1 (6.7%) | 0 (0.0%) |
| 75 Years and over | 7 (63.6%) | 5 (41.7%) |
Disability Class by Sex by Age in Leota
Disability Class: Hearing Difficulty
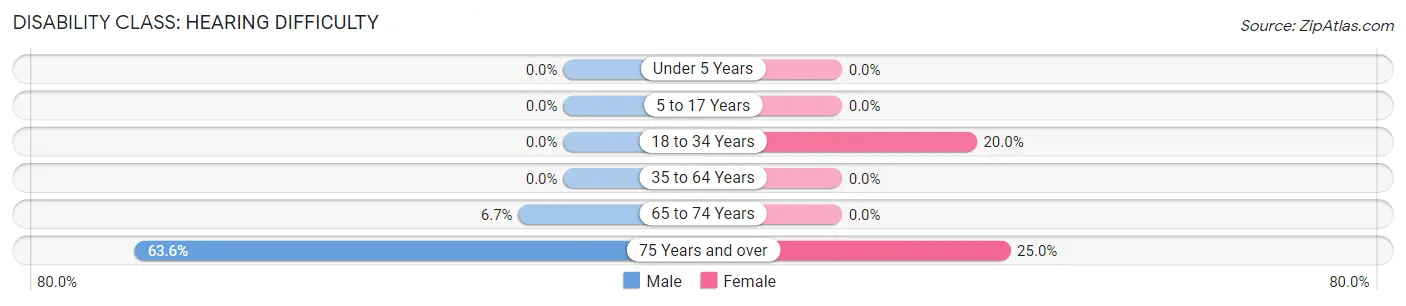
| Age Bracket | Male | Female |
| Under 5 Years | 0 (0.0%) | 0 (0.0%) |
| 5 to 17 Years | 0 (0.0%) | 0 (0.0%) |
| 18 to 34 Years | 0 (0.0%) | 2 (20.0%) |
| 35 to 64 Years | 0 (0.0%) | 0 (0.0%) |
| 65 to 74 Years | 1 (6.7%) | 0 (0.0%) |
| 75 Years and over | 7 (63.6%) | 3 (25.0%) |
Disability Class: Vision Difficulty
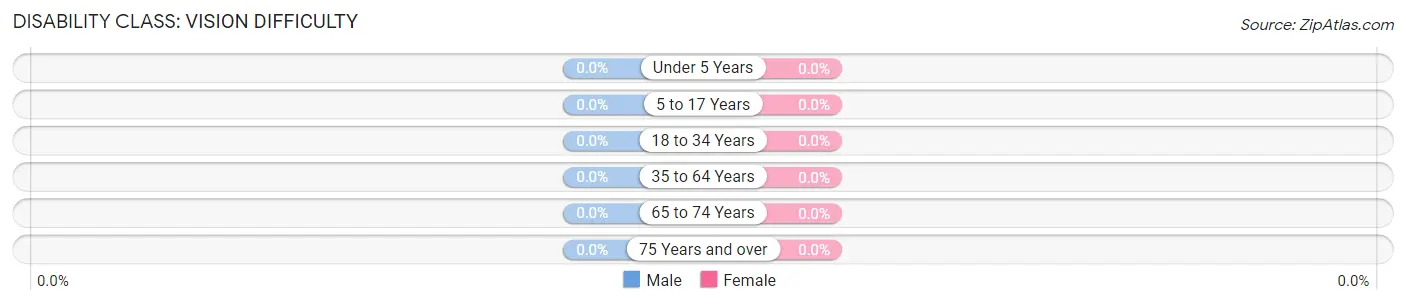
| Age Bracket | Male | Female |
| Under 5 Years | 0 (0.0%) | 0 (0.0%) |
| 5 to 17 Years | 0 (0.0%) | 0 (0.0%) |
| 18 to 34 Years | 0 (0.0%) | 0 (0.0%) |
| 35 to 64 Years | 0 (0.0%) | 0 (0.0%) |
| 65 to 74 Years | 0 (0.0%) | 0 (0.0%) |
| 75 Years and over | 0 (0.0%) | 0 (0.0%) |
Disability Class: Cognitive Difficulty
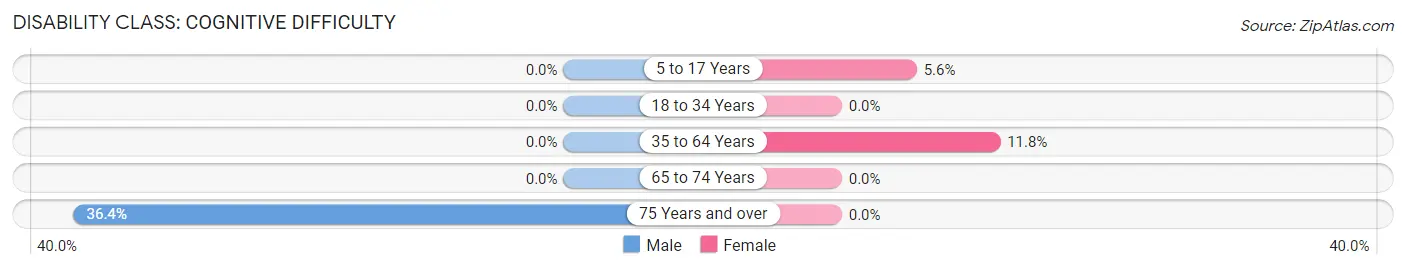
| Age Bracket | Male | Female |
| 5 to 17 Years | 0 (0.0%) | 1 (5.6%) |
| 18 to 34 Years | 0 (0.0%) | 0 (0.0%) |
| 35 to 64 Years | 0 (0.0%) | 2 (11.8%) |
| 65 to 74 Years | 0 (0.0%) | 0 (0.0%) |
| 75 Years and over | 4 (36.4%) | 0 (0.0%) |
Disability Class: Ambulatory Difficulty
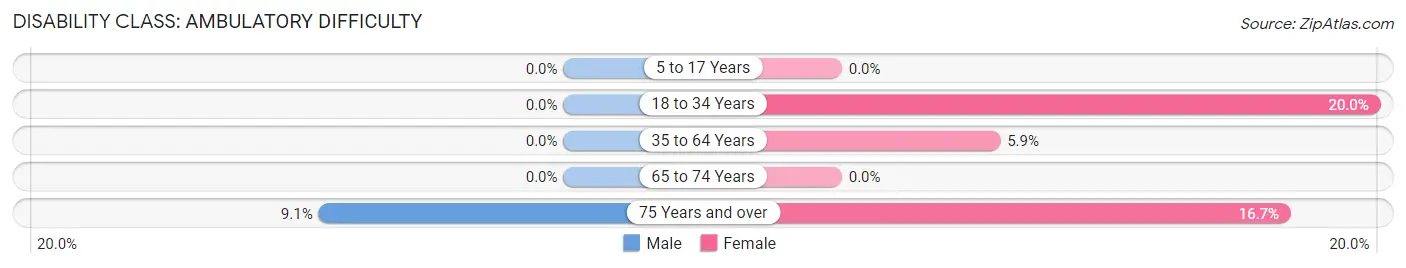
| Age Bracket | Male | Female |
| 5 to 17 Years | 0 (0.0%) | 0 (0.0%) |
| 18 to 34 Years | 0 (0.0%) | 2 (20.0%) |
| 35 to 64 Years | 0 (0.0%) | 1 (5.9%) |
| 65 to 74 Years | 0 (0.0%) | 0 (0.0%) |
| 75 Years and over | 1 (9.1%) | 2 (16.7%) |
Disability Class: Self-Care Difficulty
| Age Bracket | Male | Female |
| 5 to 17 Years | 0 (0.0%) | 0 (0.0%) |
| 18 to 34 Years | 0 (0.0%) | 0 (0.0%) |
| 35 to 64 Years | 0 (0.0%) | 0 (0.0%) |
| 65 to 74 Years | 0 (0.0%) | 0 (0.0%) |
| 75 Years and over | 0 (0.0%) | 0 (0.0%) |
Technology Access in Leota
Computing Device Access in Leota
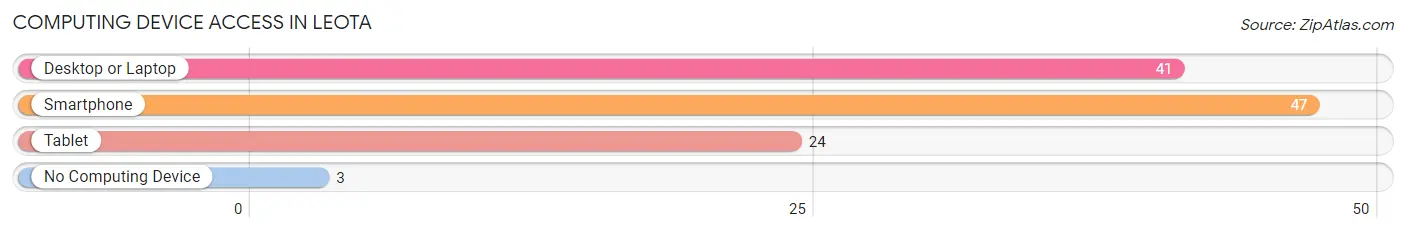
| Device Type | # Households | % Households |
| Desktop or Laptop | 41 | 74.6% |
| Smartphone | 47 | 85.5% |
| Tablet | 24 | 43.6% |
| No Computing Device | 3 | 5.4% |
| Total | 55 | 100.0% |
Internet Access in Leota
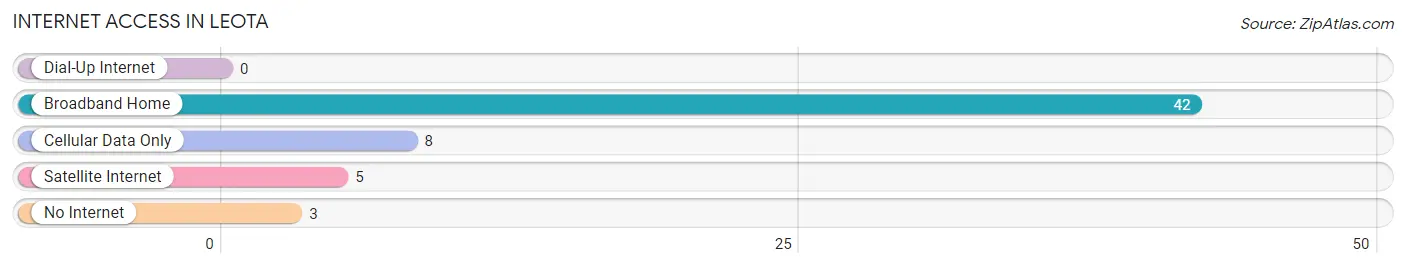
| Internet Type | # Households | % Households |
| Dial-Up Internet | 0 | 0.0% |
| Broadband Home | 42 | 76.4% |
| Cellular Data Only | 8 | 14.5% |
| Satellite Internet | 5 | 9.1% |
| No Internet | 3 | 5.4% |
| Total | 55 | 100.0% |
Leota Summary
Leota, Minnesota is a small city located in Nobles County in the southwestern corner of the state. It is situated on the banks of the Des Moines River, and is part of the larger Worthington-Leota metropolitan area. The city has a population of just over 1,000 people, and is known for its rural charm and friendly atmosphere.
History
Leota was founded in 1871 by a group of settlers from the nearby town of Worthington. The settlers were looking for a place to settle that was close to the Des Moines River, and Leota was the perfect spot. The town was named after the daughter of one of the settlers, and the first post office was established in 1872.
The town grew slowly but steadily over the years, and by the early 1900s it had become a thriving agricultural community. The town was home to several grain elevators, a creamery, and a number of other businesses. In the 1920s, the town was connected to the rest of the state by the newly constructed Highway 60.
Geography
Leota is located in the southwestern corner of Minnesota, in Nobles County. It is situated on the banks of the Des Moines River, and is part of the larger Worthington-Leota metropolitan area. The city is located about 25 miles from the Iowa border, and is about an hour and a half drive from the Twin Cities.
The city has a total area of 0.7 square miles, all of which is land. The terrain is mostly flat, with some rolling hills in the area. The climate is typical of the Midwest, with cold winters and hot summers.
Economy
Leota’s economy is largely based on agriculture. The town is home to several grain elevators, and the surrounding area is home to many farms. The town is also home to a number of small businesses, including a grocery store, a hardware store, and a few restaurants.
The town is also home to a number of manufacturing companies, including a plastics factory and a metal fabrication plant. The town is also home to a number of small service businesses, such as auto repair shops and a few medical offices.
Demographics
As of the 2010 census, the population of Leota was 1,072. The racial makeup of the town was 97.2% White, 0.7% African American, 0.2% Native American, 0.2% Asian, 0.1% Pacific Islander, 0.7% from other races, and 0.9% from two or more races. Hispanic or Latino of any race were 1.3% of the population.
The median household income in Leota was $41,250, and the median family income was $48,750. The per capita income for the town was $19,945. About 8.2% of families and 10.2% of the population were below the poverty line, including 13.2% of those under age 18 and 8.3% of those age 65 or over.
Leota is a small town with a rich history and a friendly atmosphere. The town is home to a number of small businesses, and the surrounding area is home to many farms. The town is also home to a number of manufacturing companies, and the local economy is largely based on agriculture. The town has a population of just over 1,000 people, and is known for its rural charm and friendly atmosphere.
Common Questions
What is Per Capita Income in Leota?
Per Capita income in Leota is $28,040.
What is the Median Family Income in Leota?
Median Family Income in Leota is $63,750.
What is the Median Household income in Leota?
Median Household Income in Leota is $54,861.
What is Income or Wage Gap in Leota?
Income or Wage Gap in Leota is 54.7%.
Women in Leota earn 45.3 cents for every dollar earned by a man.
What is Inequality or Gini Index in Leota?
Inequality or Gini Index in Leota is 0.29.
What is the Total Population of Leota?
Total Population of Leota is 146.
What is the Total Male Population of Leota?
Total Male Population of Leota is 73.
What is the Total Female Population of Leota?
Total Female Population of Leota is 73.
What is the Ratio of Males per 100 Females in Leota?
There are 100.00 Males per 100 Females in Leota.
What is the Ratio of Females per 100 Males in Leota?
There are 100.00 Females per 100 Males in Leota.
What is the Median Population Age in Leota?
Median Population Age in Leota is 45.5 Years.
What is the Average Family Size in Leota
Average Family Size in Leota is 3.0 People.
What is the Average Household Size in Leota
Average Household Size in Leota is 2.6 People.
How Large is the Labor Force in Leota?
There are 54 People in the Labor Forcein in Leota.
What is the Percentage of People in the Labor Force in Leota?
51.9% of People are in the Labor Force in Leota.