Zip Codes with the Highest Percentage of Population Employed in Health Diagnosing & Treating in Jonesboro, GA
RELATED REPORTS & OPTIONS
Health Diagnosing & Treating
Jonesboro
Compare Zip Codes
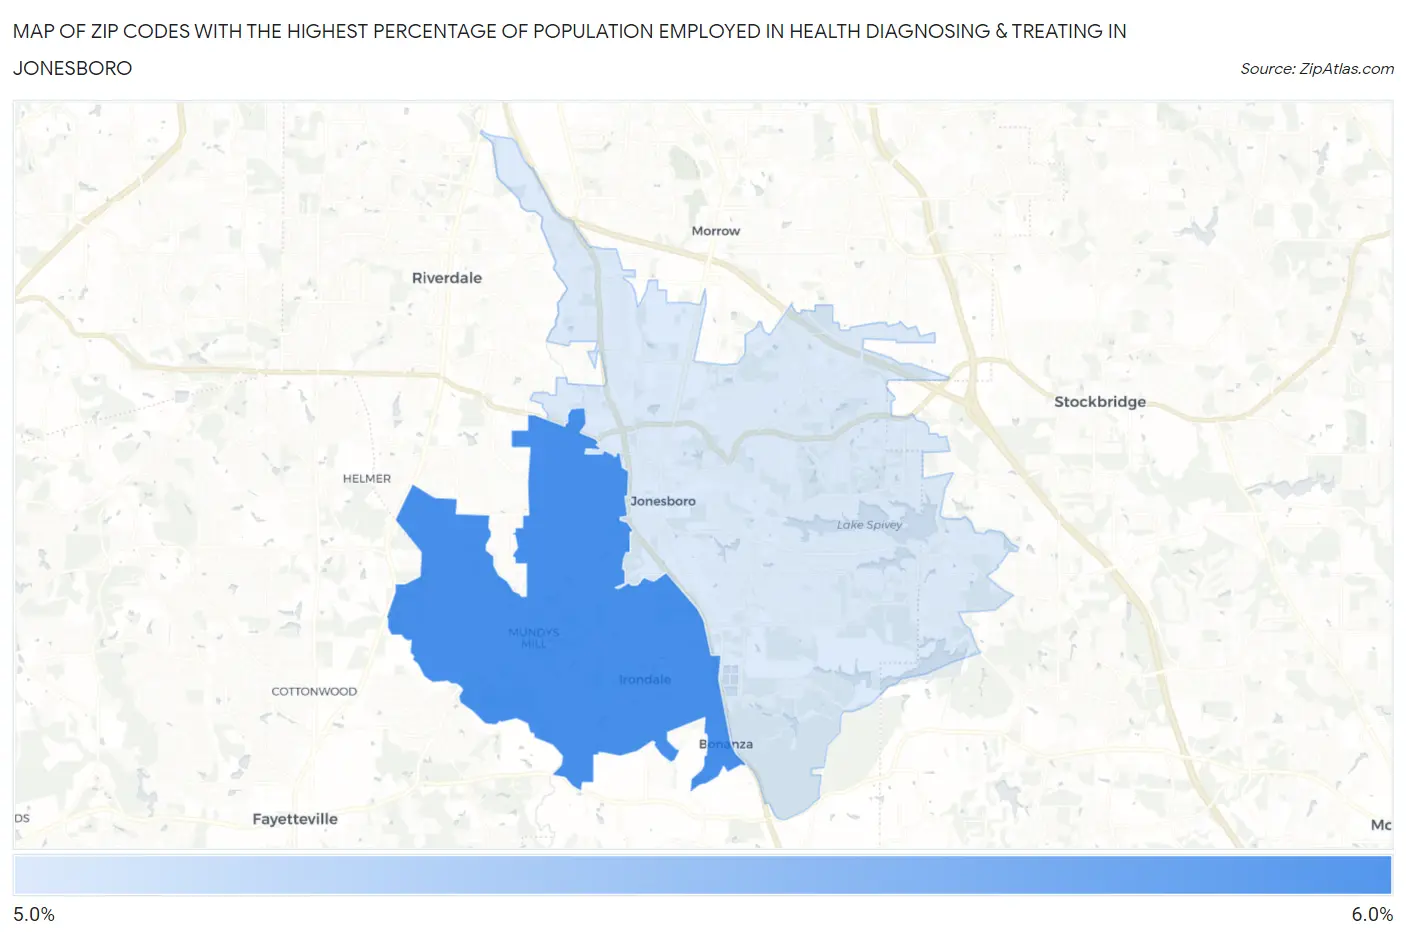
Map of Zip Codes with the Highest Percentage of Population Employed in Health Diagnosing & Treating in Jonesboro
5.2%
5.4%
Zip Codes with the Highest Percentage of Population Employed in Health Diagnosing & Treating in Jonesboro, GA
| Zip Code | % Employed | vs State | vs National | |
| 1. | 30238 | 5.4% | 5.7%(-0.258)#334 | 6.2%(-0.797)#15,977 |
| 2. | 30236 | 5.2% | 5.7%(-0.505)#354 | 6.2%(-1.04)#16,927 |
1
Common Questions
What are the Top Zip Codes with the Highest Percentage of Population Employed in Health Diagnosing & Treating in Jonesboro, GA?
Top Zip Codes with the Highest Percentage of Population Employed in Health Diagnosing & Treating in Jonesboro, GA are:
What zip code has the Highest Percentage of Population Employed in Health Diagnosing & Treating in Jonesboro, GA?
30238 has the Highest Percentage of Population Employed in Health Diagnosing & Treating in Jonesboro, GA with 5.4%.
What is the Percentage of Population Employed in Health Diagnosing & Treating in Georgia?
Percentage of Population Employed in Health Diagnosing & Treating in Georgia is 5.7%.
What is the Percentage of Population Employed in Health Diagnosing & Treating in the United States?
Percentage of Population Employed in Health Diagnosing & Treating in the United States is 6.2%.