Zip Codes with the Highest Percentage of Population Employed in Health Diagnosing & Treating in Buford, GA
RELATED REPORTS & OPTIONS
Health Diagnosing & Treating
Buford
Compare Zip Codes
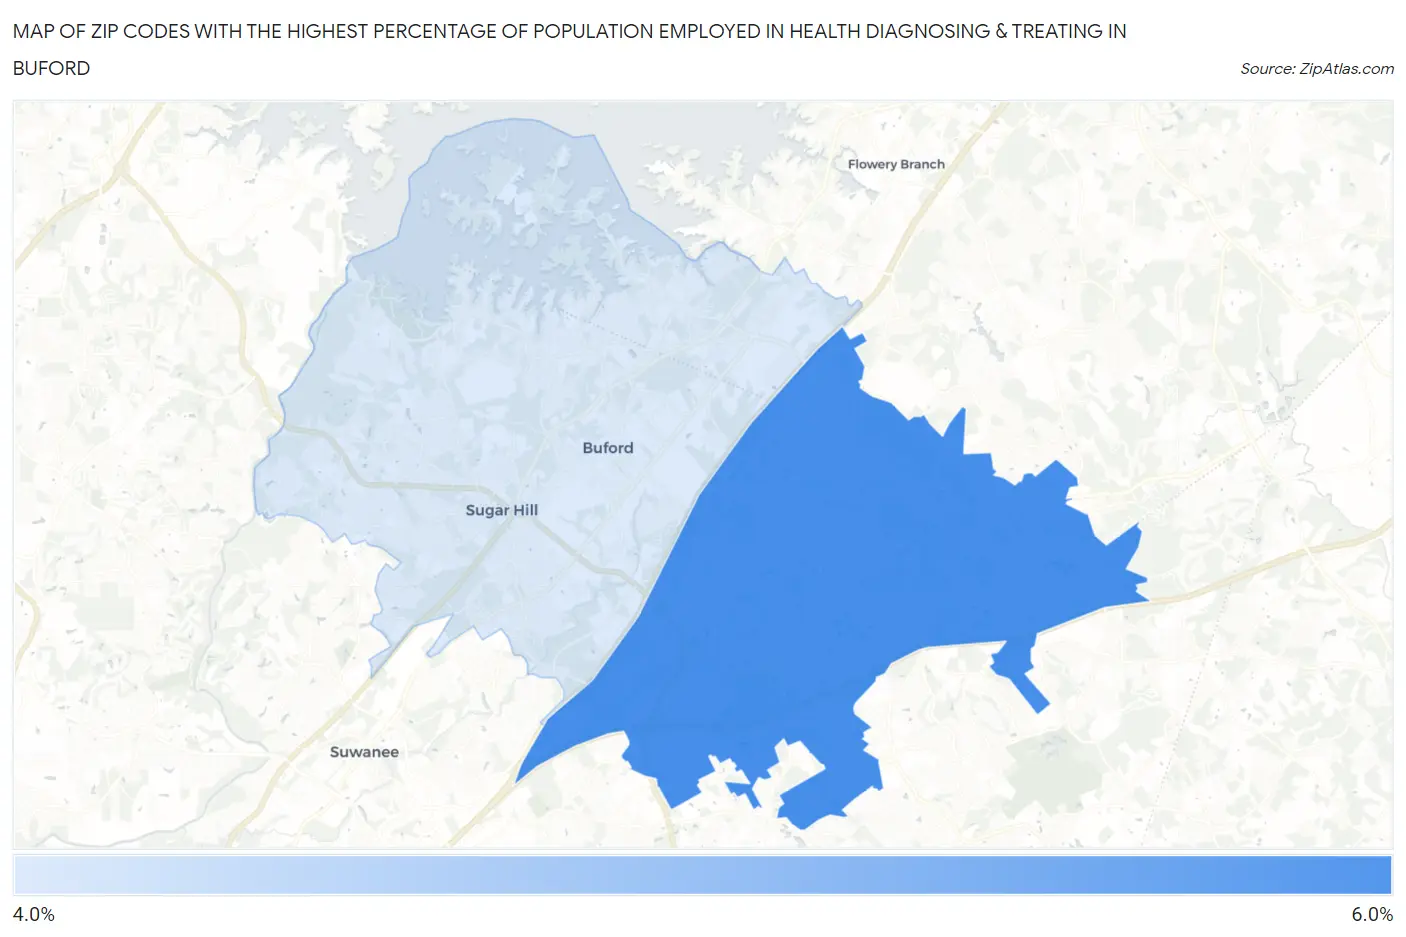
Map of Zip Codes with the Highest Percentage of Population Employed in Health Diagnosing & Treating in Buford
4.6%
5.9%
Zip Codes with the Highest Percentage of Population Employed in Health Diagnosing & Treating in Buford, GA
| Zip Code | % Employed | vs State | vs National | |
| 1. | 30519 | 5.9% | 5.7%(+0.212)#285 | 6.2%(-0.327)#14,158 |
| 2. | 30518 | 4.6% | 5.7%(-1.11)#417 | 6.2%(-1.65)#19,287 |
1
Common Questions
What are the Top Zip Codes with the Highest Percentage of Population Employed in Health Diagnosing & Treating in Buford, GA?
Top Zip Codes with the Highest Percentage of Population Employed in Health Diagnosing & Treating in Buford, GA are:
What zip code has the Highest Percentage of Population Employed in Health Diagnosing & Treating in Buford, GA?
30519 has the Highest Percentage of Population Employed in Health Diagnosing & Treating in Buford, GA with 5.9%.
What is the Percentage of Population Employed in Health Diagnosing & Treating in Buford, GA?
Percentage of Population Employed in Health Diagnosing & Treating in Buford is 3.7%.
What is the Percentage of Population Employed in Health Diagnosing & Treating in Georgia?
Percentage of Population Employed in Health Diagnosing & Treating in Georgia is 5.7%.
What is the Percentage of Population Employed in Health Diagnosing & Treating in the United States?
Percentage of Population Employed in Health Diagnosing & Treating in the United States is 6.2%.