Ellenton, GA Map & Demographics
Ellenton Map
Ellenton Overview
$19,991
PER CAPITA INCOME
$52,019
AVG HOUSEHOLD INCOME
0.37
INEQUALITY / GINI INDEX
296
TOTAL POPULATION
138
MALE POPULATION
158
FEMALE POPULATION
87.34
MALES / 100 FEMALES
114.49
FEMALES / 100 MALES
27.8
MEDIAN AGE
3.6
AVG FAMILY SIZE
3.2
AVG HOUSEHOLD SIZE
131
LABOR FORCE [ PEOPLE ]
68.2%
PERCENT IN LABOR FORCE
4.6%
UNEMPLOYMENT RATE
Ellenton Zip Codes
Ellenton Area Codes
Income in Ellenton
Income Overview in Ellenton
| Characteristic | Number | Measure |
| Per Capita Income | 296 | $19,991 |
| Median Family Income | 80 | $0 |
| Mean Family Income | 80 | $75,471 |
| Median Household Income | 91 | $52,019 |
| Mean Household Income | 91 | $67,886 |
| Income Deficit | 80 | $0 |
| Wage / Income Gap (%) | 296 | 0.00% |
| Wage / Income Gap ($) | 296 | 100.00¢ per $1 |
| Gini / Inequality Index | 296 | 0.37 |
Earnings by Sex in Ellenton
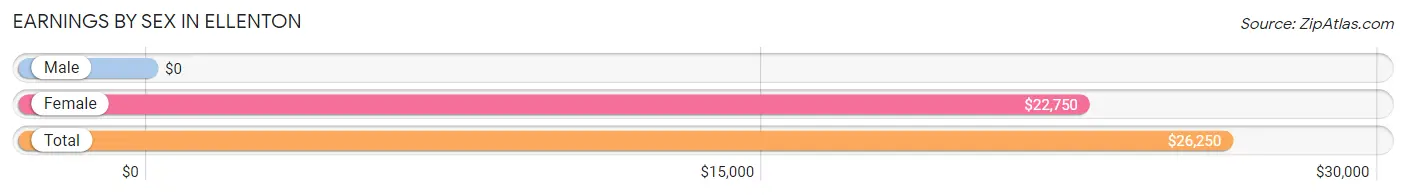
| Sex | Number | Average Earnings |
| Male | 59 (44.4%) | $0 |
| Female | 74 (55.6%) | $22,750 |
| Total | 133 (100.0%) | $26,250 |
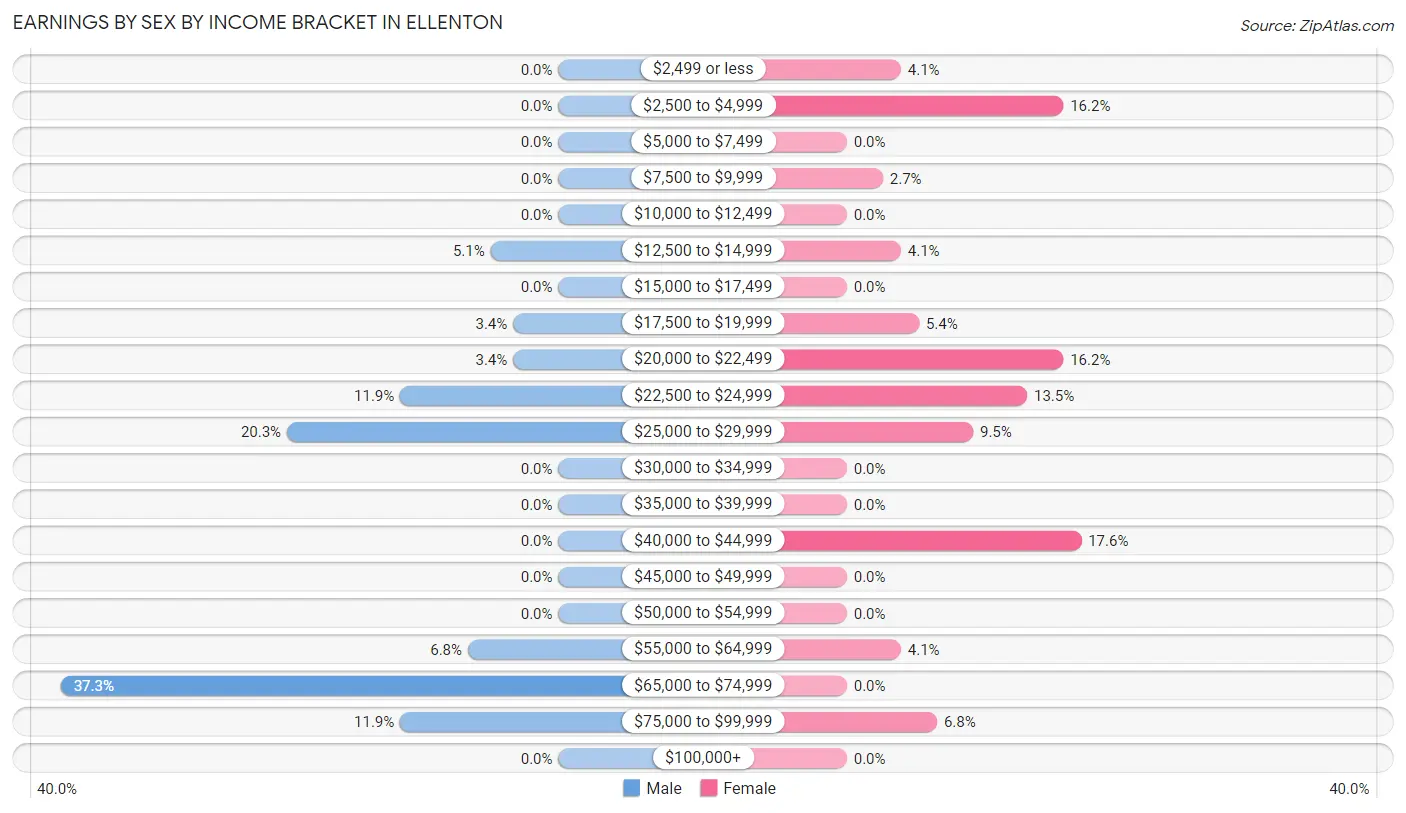
Earnings by Sex by Income Bracket in Ellenton
The most common earnings brackets in Ellenton are $65,000 to $74,999 for men (22 | 37.3%) and $40,000 to $44,999 for women (13 | 17.6%).
| Income | Male | Female |
| $2,499 or less | 0 (0.0%) | 3 (4.1%) |
| $2,500 to $4,999 | 0 (0.0%) | 12 (16.2%) |
| $5,000 to $7,499 | 0 (0.0%) | 0 (0.0%) |
| $7,500 to $9,999 | 0 (0.0%) | 2 (2.7%) |
| $10,000 to $12,499 | 0 (0.0%) | 0 (0.0%) |
| $12,500 to $14,999 | 3 (5.1%) | 3 (4.1%) |
| $15,000 to $17,499 | 0 (0.0%) | 0 (0.0%) |
| $17,500 to $19,999 | 2 (3.4%) | 4 (5.4%) |
| $20,000 to $22,499 | 2 (3.4%) | 12 (16.2%) |
| $22,500 to $24,999 | 7 (11.9%) | 10 (13.5%) |
| $25,000 to $29,999 | 12 (20.3%) | 7 (9.5%) |
| $30,000 to $34,999 | 0 (0.0%) | 0 (0.0%) |
| $35,000 to $39,999 | 0 (0.0%) | 0 (0.0%) |
| $40,000 to $44,999 | 0 (0.0%) | 13 (17.6%) |
| $45,000 to $49,999 | 0 (0.0%) | 0 (0.0%) |
| $50,000 to $54,999 | 0 (0.0%) | 0 (0.0%) |
| $55,000 to $64,999 | 4 (6.8%) | 3 (4.1%) |
| $65,000 to $74,999 | 22 (37.3%) | 0 (0.0%) |
| $75,000 to $99,999 | 7 (11.9%) | 5 (6.8%) |
| $100,000+ | 0 (0.0%) | 0 (0.0%) |
| Total | 59 (100.0%) | 74 (100.0%) |
Earnings by Sex by Educational Attainment in Ellenton
Average earnings in Ellenton are $72,784 for men and $24,625 for women, a difference of 66.2%. Men with an educational attainment of less than high school enjoy the highest average annual earnings of $73,239, while those with less than high school education earn the least with $73,239. Women with an educational attainment of high school diploma earn the most with the average annual earnings of $23,750, while those with high school diploma education have the smallest earnings of $23,750.
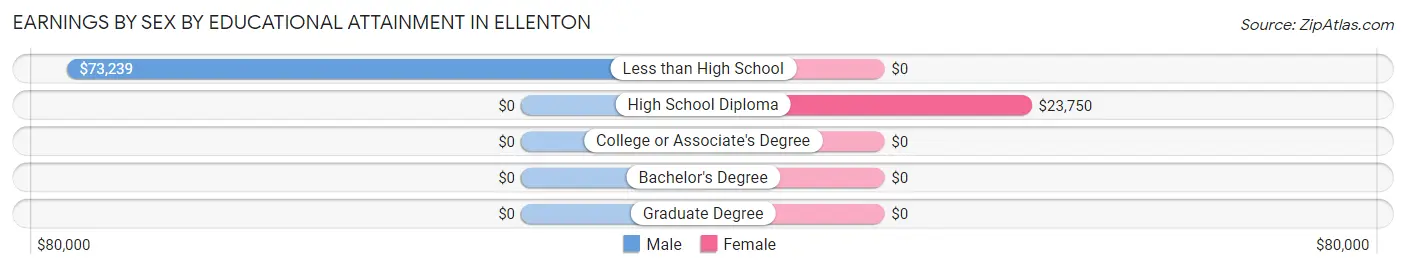
| Educational Attainment | Male Income | Female Income |
| Less than High School | $73,239 | $0 |
| High School Diploma | - | - |
| College or Associate's Degree | - | - |
| Bachelor's Degree | - | - |
| Graduate Degree | - | - |
| Total | $72,784 | $24,625 |
Family Income in Ellenton
Family Income Brackets in Ellenton
According to the Ellenton family income data, there are 29 families falling into the $100,000 to $149,999 income range, which is the most common income bracket and makes up 36.2% of all families.
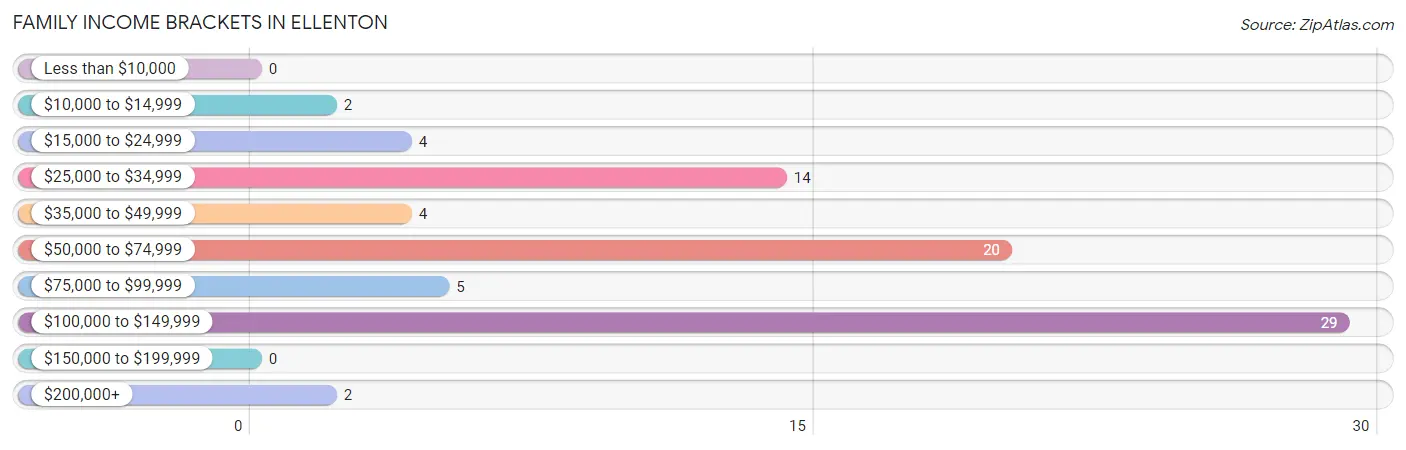
| Income Bracket | # Families | % Families |
| Less than $10,000 | 0 | 0.0% |
| $10,000 to $14,999 | 2 | 2.5% |
| $15,000 to $24,999 | 4 | 5.0% |
| $25,000 to $34,999 | 14 | 17.5% |
| $35,000 to $49,999 | 4 | 5.0% |
| $50,000 to $74,999 | 20 | 25.0% |
| $75,000 to $99,999 | 5 | 6.3% |
| $100,000 to $149,999 | 29 | 36.3% |
| $150,000 to $199,999 | 0 | 0.0% |
| $200,000+ | 2 | 2.5% |
Family Income by Famaliy Size in Ellenton
4-person families (45 | 56.2%) account for the highest median family income in Ellenton with $115,417 per family, while 2-person families (13 | 16.3%) have the highest median income of $28,906 per family member.
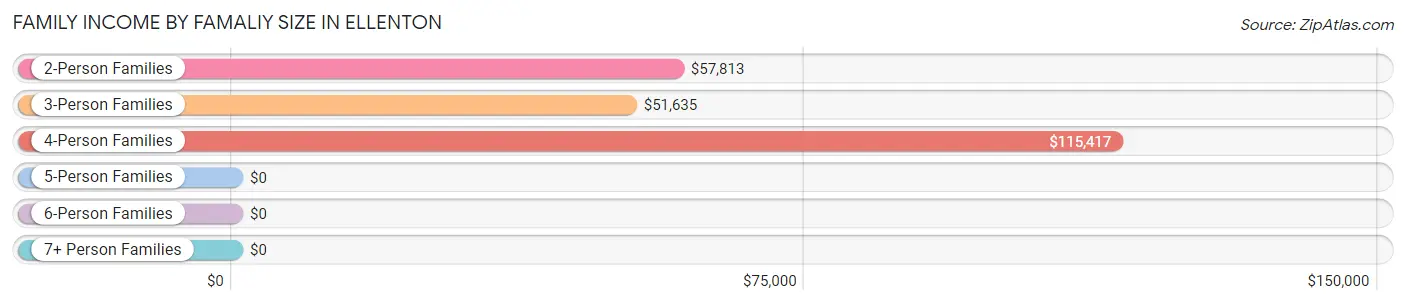
| Income Bracket | # Families | Median Income |
| 2-Person Families | 13 (16.3%) | $57,813 |
| 3-Person Families | 17 (21.2%) | $51,635 |
| 4-Person Families | 45 (56.2%) | $115,417 |
| 5-Person Families | 5 (6.2%) | $0 |
| 6-Person Families | 0 (0.0%) | $0 |
| 7+ Person Families | 0 (0.0%) | $0 |
| Total | 80 (100.0%) | $0 |
Family Income by Number of Earners in Ellenton
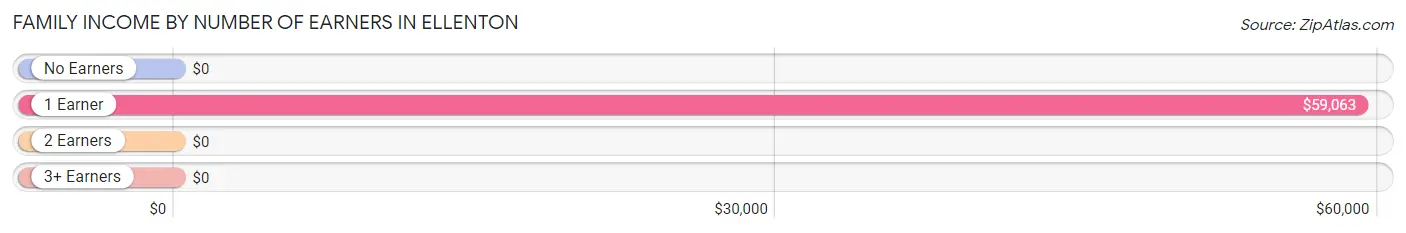
| Number of Earners | # Families | Median Income |
| No Earners | 6 (7.5%) | $0 |
| 1 Earner | 15 (18.8%) | $59,063 |
| 2 Earners | 59 (73.8%) | $0 |
| 3+ Earners | 0 (0.0%) | $0 |
| Total | 80 (100.0%) | $0 |
Household Income in Ellenton
Household Income Brackets in Ellenton
With 29 households falling in the category, the $100,000 to $149,999 income range is the most frequent in Ellenton, accounting for 31.9% of all households.
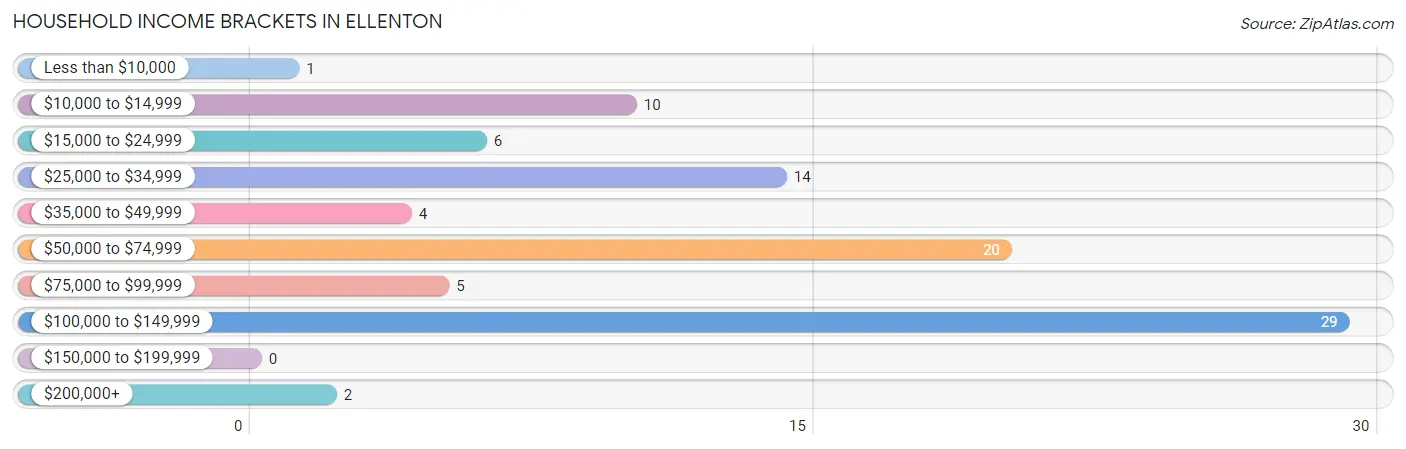
| Income Bracket | # Households | % Households |
| Less than $10,000 | 1 | 1.1% |
| $10,000 to $14,999 | 10 | 11.0% |
| $15,000 to $24,999 | 6 | 6.6% |
| $25,000 to $34,999 | 14 | 15.4% |
| $35,000 to $49,999 | 4 | 4.4% |
| $50,000 to $74,999 | 20 | 22.0% |
| $75,000 to $99,999 | 5 | 5.5% |
| $100,000 to $149,999 | 29 | 31.9% |
| $150,000 to $199,999 | 0 | 0.0% |
| $200,000+ | 2 | 2.2% |
Household Income by Householder Age in Ellenton
The median household income in Ellenton is $52,019, with the highest median household income of $51,042 found in the 45 to 64 years age bracket for the primary householder. A total of 27 households (29.7%) fall into this category.
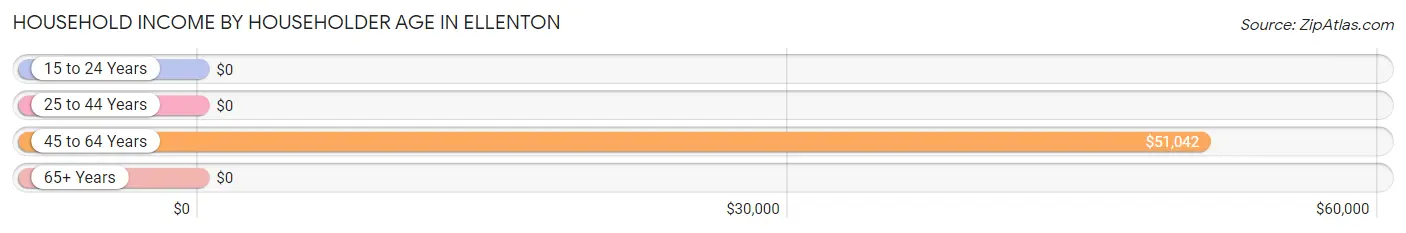
| Income Bracket | # Households | Median Income |
| 15 to 24 Years | 0 (0.0%) | $0 |
| 25 to 44 Years | 52 (57.1%) | $0 |
| 45 to 64 Years | 27 (29.7%) | $51,042 |
| 65+ Years | 12 (13.2%) | $0 |
| Total | 91 (100.0%) | $52,019 |
Poverty in Ellenton
Income Below Poverty by Sex and Age in Ellenton
With 22.5% poverty level for males and 32.9% for females among the residents of Ellenton, 12 to 14 year old males and 16 and 17 year old females are the most vulnerable to poverty, with 12 males (100.0%) and 15 females (100.0%) in their respective age groups living below the poverty level.
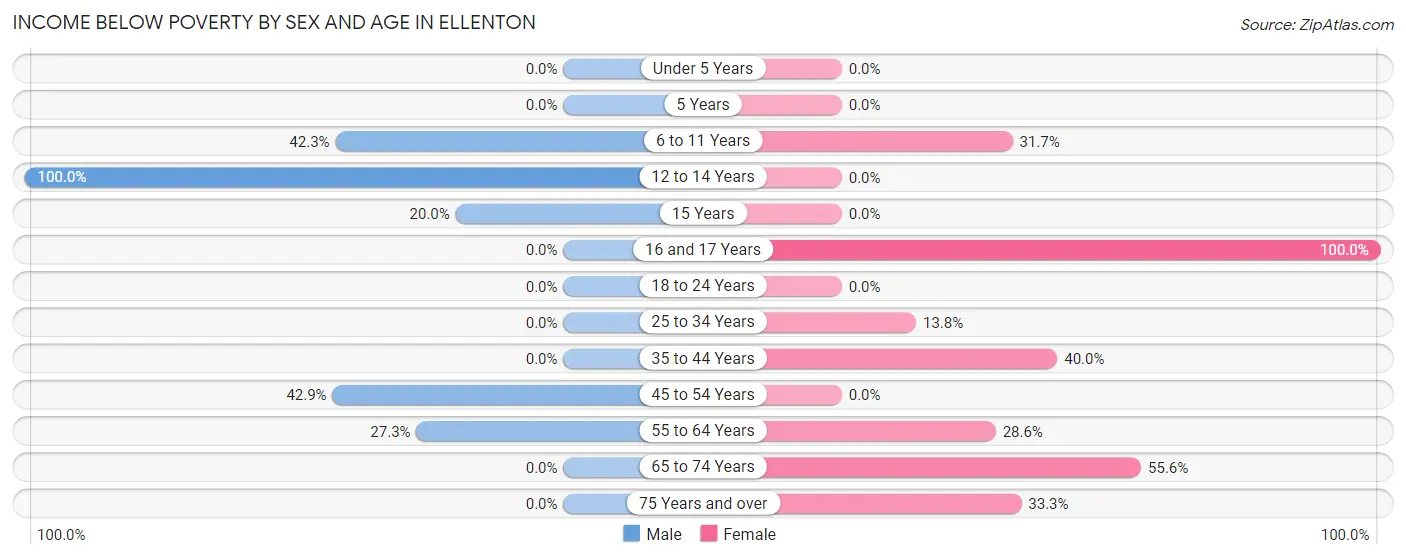
| Age Bracket | Male | Female |
| Under 5 Years | 0 (0.0%) | 0 (0.0%) |
| 5 Years | 0 (0.0%) | 0 (0.0%) |
| 6 to 11 Years | 11 (42.3%) | 13 (31.7%) |
| 12 to 14 Years | 12 (100.0%) | 0 (0.0%) |
| 15 Years | 2 (20.0%) | 0 (0.0%) |
| 16 and 17 Years | 0 (0.0%) | 15 (100.0%) |
| 18 to 24 Years | 0 (0.0%) | 0 (0.0%) |
| 25 to 34 Years | 0 (0.0%) | 4 (13.8%) |
| 35 to 44 Years | 0 (0.0%) | 12 (40.0%) |
| 45 to 54 Years | 3 (42.9%) | 0 (0.0%) |
| 55 to 64 Years | 3 (27.3%) | 2 (28.6%) |
| 65 to 74 Years | 0 (0.0%) | 5 (55.6%) |
| 75 Years and over | 0 (0.0%) | 1 (33.3%) |
| Total | 31 (22.5%) | 52 (32.9%) |
Income Above Poverty by Sex and Age in Ellenton
According to the poverty statistics in Ellenton, males aged under 5 years and females aged 5 years are the age groups that are most secure financially, with 100.0% of males and 100.0% of females in these age groups living above the poverty line.
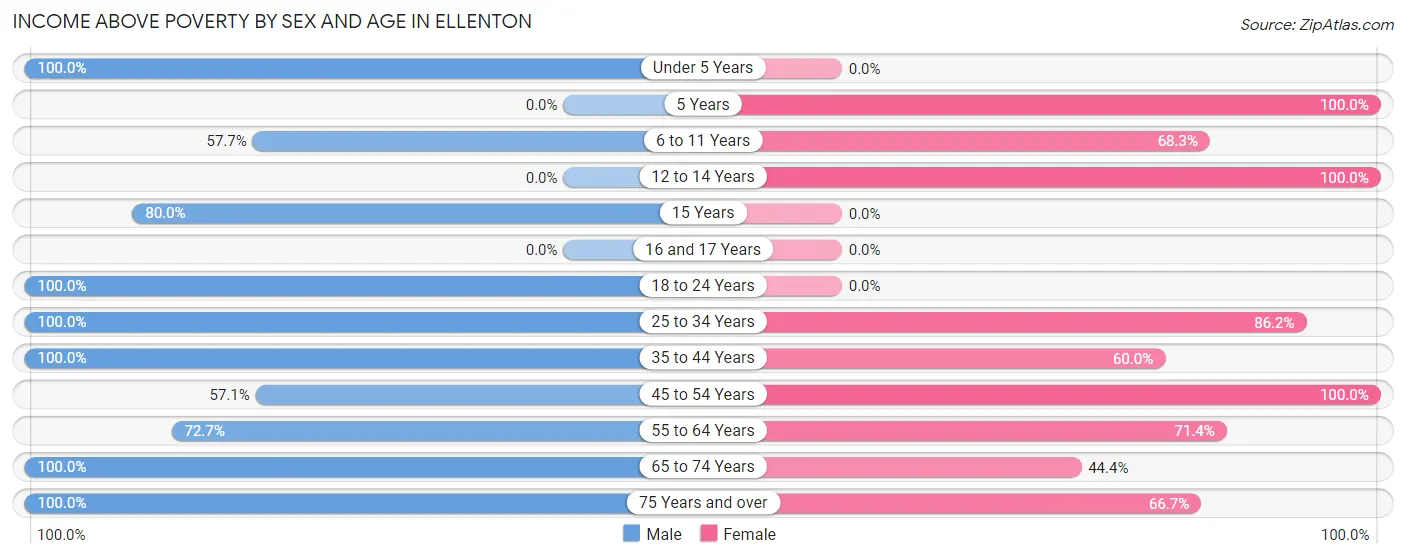
| Age Bracket | Male | Female |
| Under 5 Years | 6 (100.0%) | 0 (0.0%) |
| 5 Years | 0 (0.0%) | 4 (100.0%) |
| 6 to 11 Years | 15 (57.7%) | 28 (68.3%) |
| 12 to 14 Years | 0 (0.0%) | 5 (100.0%) |
| 15 Years | 8 (80.0%) | 0 (0.0%) |
| 16 and 17 Years | 0 (0.0%) | 0 (0.0%) |
| 18 to 24 Years | 9 (100.0%) | 0 (0.0%) |
| 25 to 34 Years | 23 (100.0%) | 25 (86.2%) |
| 35 to 44 Years | 28 (100.0%) | 18 (60.0%) |
| 45 to 54 Years | 4 (57.1%) | 15 (100.0%) |
| 55 to 64 Years | 8 (72.7%) | 5 (71.4%) |
| 65 to 74 Years | 4 (100.0%) | 4 (44.4%) |
| 75 Years and over | 2 (100.0%) | 2 (66.7%) |
| Total | 107 (77.5%) | 106 (67.1%) |
Income Below Poverty Among Married-Couple Families in Ellenton
The poverty statistics for married-couple families in Ellenton show that 4.6% or 2 of the total 43 families live below the poverty line. Families with no children have the highest poverty rate of 12.5%, comprising of 2 families. On the other hand, families with 1 or 2 children have the lowest poverty rate of 0.0%, which includes 0 families.
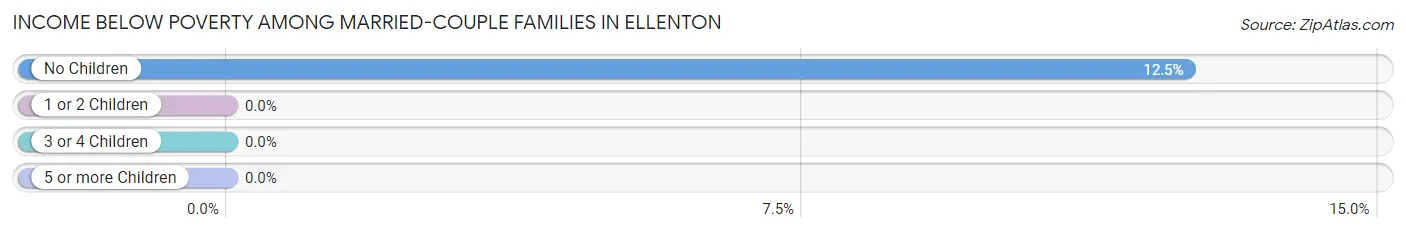
| Children | Above Poverty | Below Poverty |
| No Children | 14 (87.5%) | 2 (12.5%) |
| 1 or 2 Children | 27 (100.0%) | 0 (0.0%) |
| 3 or 4 Children | 0 (0.0%) | 0 (0.0%) |
| 5 or more Children | 0 (0.0%) | 0 (0.0%) |
| Total | 41 (95.4%) | 2 (4.6%) |
Income Below Poverty Among Single-Parent Households in Ellenton
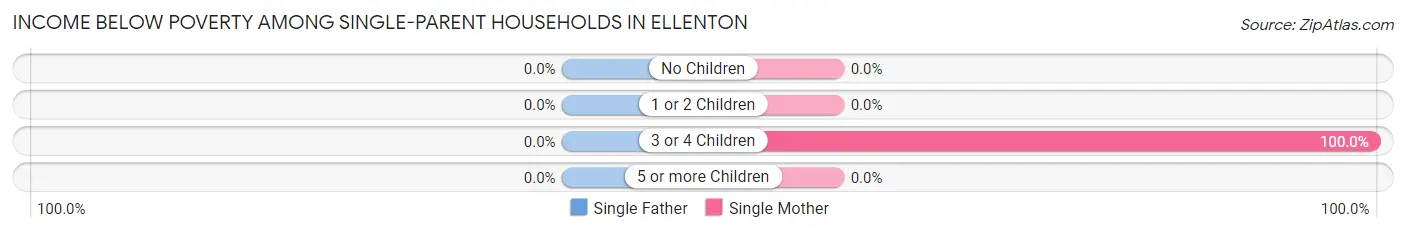
| Children | Single Father | Single Mother |
| No Children | 0 (0.0%) | 0 (0.0%) |
| 1 or 2 Children | 0 (0.0%) | 0 (0.0%) |
| 3 or 4 Children | 0 (0.0%) | 16 (100.0%) |
| 5 or more Children | 0 (0.0%) | 0 (0.0%) |
| Total | 0 (0.0%) | 16 (61.5%) |
Income Below Poverty Among Married-Couple vs Single-Parent Households in Ellenton
The poverty data for Ellenton shows that 2 of the married-couple family households (4.6%) and 16 of the single-parent households (43.2%) are living below the poverty level. Within the married-couple family households, those with no children have the highest poverty rate, with 2 households (12.5%) falling below the poverty line. Among the single-parent households, those with 3 or 4 children have the highest poverty rate, with 16 household (100.0%) living below poverty.
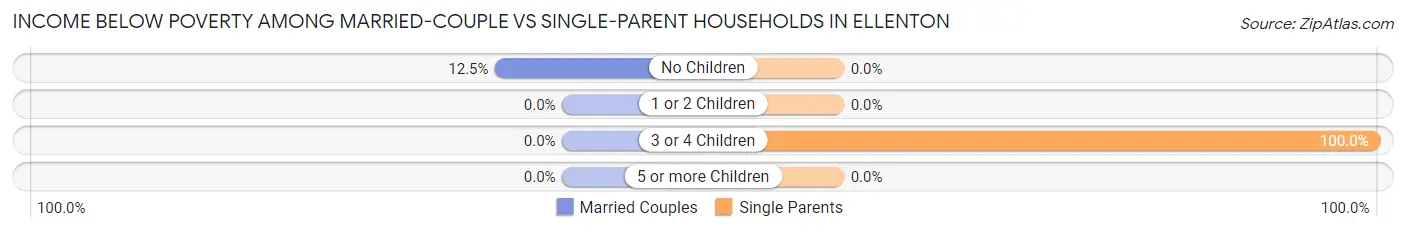
| Children | Married-Couple Families | Single-Parent Households |
| No Children | 2 (12.5%) | 0 (0.0%) |
| 1 or 2 Children | 0 (0.0%) | 0 (0.0%) |
| 3 or 4 Children | 0 (0.0%) | 16 (100.0%) |
| 5 or more Children | 0 (0.0%) | 0 (0.0%) |
| Total | 2 (4.6%) | 16 (43.2%) |
Race in Ellenton
The most populous races in Ellenton are White / Caucasian (190 | 64.2%), Black / African American (48 | 16.2%), and Asian (32 | 10.8%).
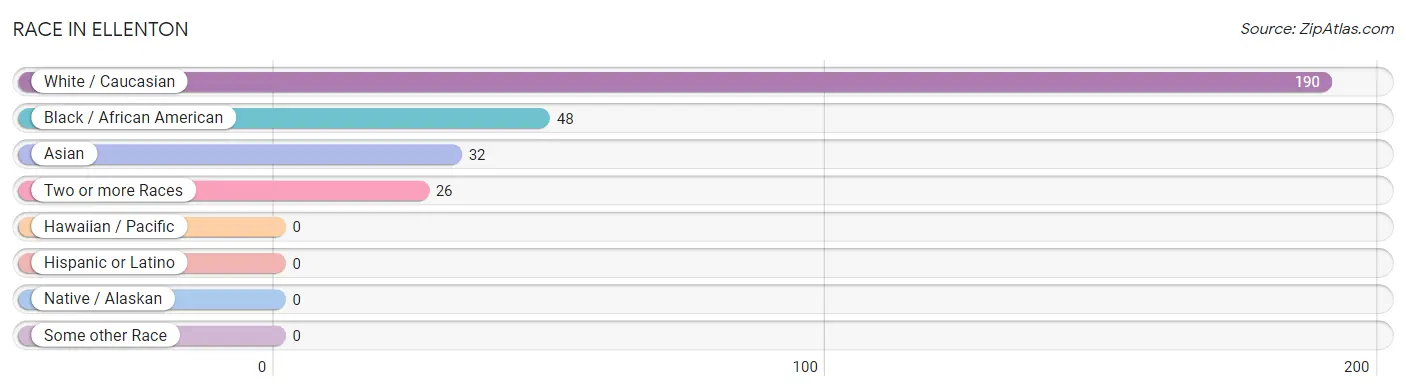
| Race | # Population | % Population |
| Asian | 32 | 10.8% |
| Black / African American | 48 | 16.2% |
| Hawaiian / Pacific | 0 | 0.0% |
| Hispanic or Latino | 0 | 0.0% |
| Native / Alaskan | 0 | 0.0% |
| White / Caucasian | 190 | 64.2% |
| Two or more Races | 26 | 8.8% |
| Some other Race | 0 | 0.0% |
| Total | 296 | 100.0% |
Ancestry in Ellenton
The most populous ancestries reported in Ellenton are American (85 | 28.7%), English (54 | 18.2%), Thai (32 | 10.8%), Irish (31 | 10.5%), and Dutch (5 | 1.7%), together accounting for 69.9% of all Ellenton residents.
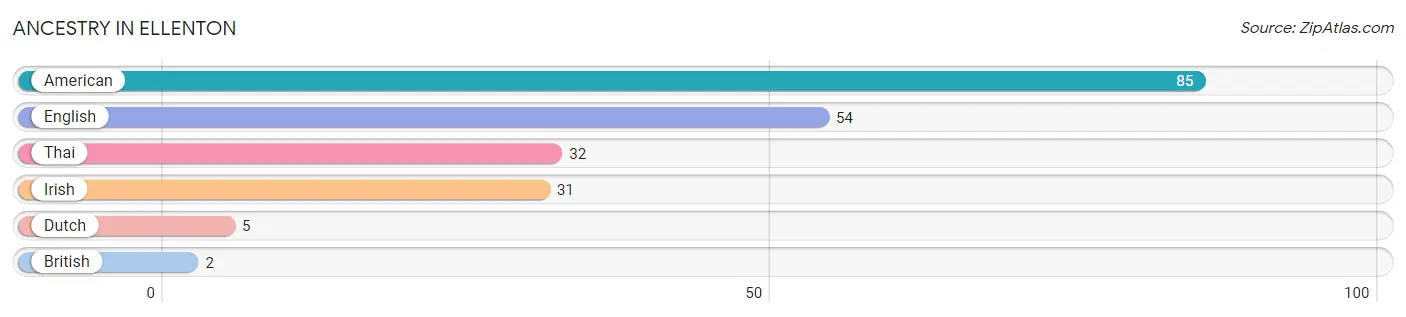
| Ancestry | # Population | % Population |
| American | 85 | 28.7% |
| British | 2 | 0.7% |
| Dutch | 5 | 1.7% |
| English | 54 | 18.2% |
| Irish | 31 | 10.5% |
| Thai | 32 | 10.8% | View All 6 Rows |
Immigrants in Ellenton
The most numerous immigrant groups reported in Ellenton came from Asia (32 | 10.8%), India (32 | 10.8%), and South Central Asia (32 | 10.8%), together accounting for 32.4% of all Ellenton residents.
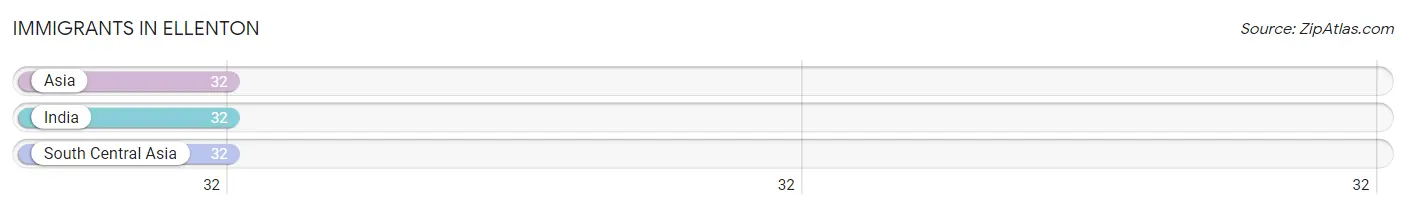
| Immigration Origin | # Population | % Population |
| Asia | 32 | 10.8% |
| India | 32 | 10.8% |
| South Central Asia | 32 | 10.8% | View All 3 Rows |
Sex and Age in Ellenton
Sex and Age in Ellenton
The most populous age groups in Ellenton are 35 to 39 Years (28 | 20.3%) for men and 5 to 9 Years (36 | 22.8%) for women.
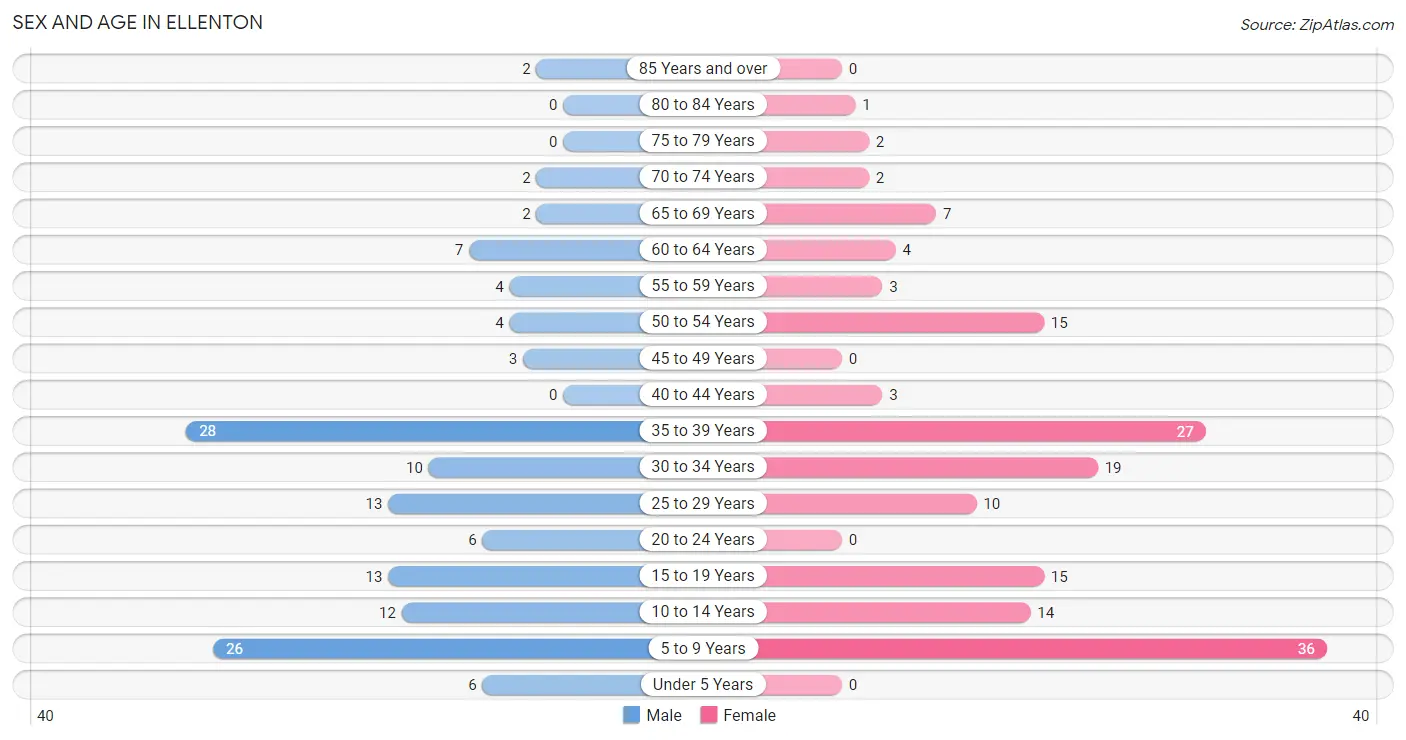
| Age Bracket | Male | Female |
| Under 5 Years | 6 (4.3%) | 0 (0.0%) |
| 5 to 9 Years | 26 (18.8%) | 36 (22.8%) |
| 10 to 14 Years | 12 (8.7%) | 14 (8.9%) |
| 15 to 19 Years | 13 (9.4%) | 15 (9.5%) |
| 20 to 24 Years | 6 (4.3%) | 0 (0.0%) |
| 25 to 29 Years | 13 (9.4%) | 10 (6.3%) |
| 30 to 34 Years | 10 (7.2%) | 19 (12.0%) |
| 35 to 39 Years | 28 (20.3%) | 27 (17.1%) |
| 40 to 44 Years | 0 (0.0%) | 3 (1.9%) |
| 45 to 49 Years | 3 (2.2%) | 0 (0.0%) |
| 50 to 54 Years | 4 (2.9%) | 15 (9.5%) |
| 55 to 59 Years | 4 (2.9%) | 3 (1.9%) |
| 60 to 64 Years | 7 (5.1%) | 4 (2.5%) |
| 65 to 69 Years | 2 (1.5%) | 7 (4.4%) |
| 70 to 74 Years | 2 (1.5%) | 2 (1.3%) |
| 75 to 79 Years | 0 (0.0%) | 2 (1.3%) |
| 80 to 84 Years | 0 (0.0%) | 1 (0.6%) |
| 85 Years and over | 2 (1.5%) | 0 (0.0%) |
| Total | 138 (100.0%) | 158 (100.0%) |
Families and Households in Ellenton
Median Family Size in Ellenton
The median family size in Ellenton is 3.56 persons per family, with single female/mother families (26 | 32.5%) accounting for the largest median family size of 4.08 persons per family. On the other hand, single male/father families (11 | 13.8%) represent the smallest median family size with 3.27 persons per family.
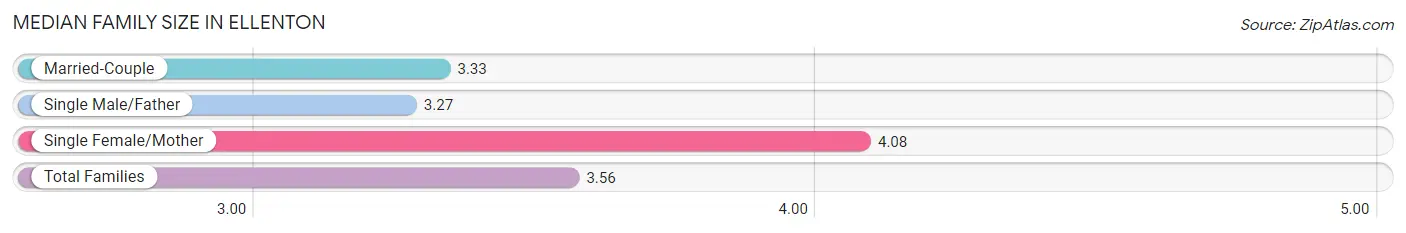
| Family Type | # Families | Family Size |
| Married-Couple | 43 (53.7%) | 3.33 |
| Single Male/Father | 11 (13.8%) | 3.27 |
| Single Female/Mother | 26 (32.5%) | 4.08 |
| Total Families | 80 (100.0%) | 3.56 |
Median Household Size in Ellenton
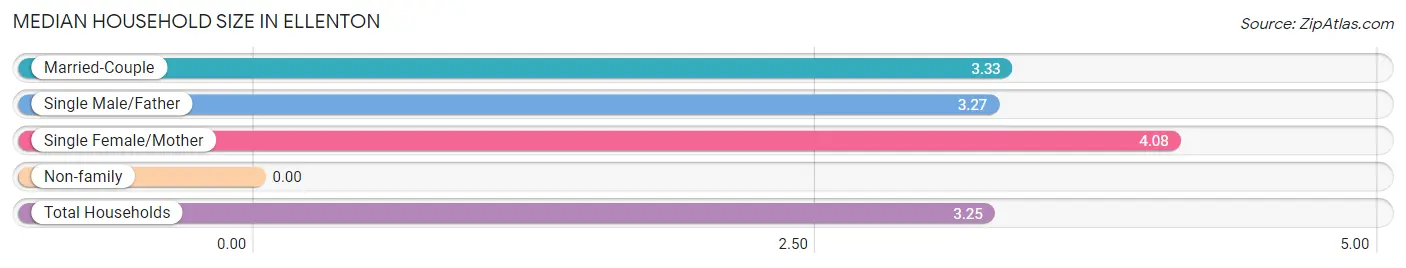
| Household Type | # Households | Household Size |
| Married-Couple | 43 (47.2%) | 3.33 |
| Single Male/Father | 11 (12.1%) | 3.27 |
| Single Female/Mother | 26 (28.6%) | 4.08 |
| Non-family | 11 (12.1%) | - |
| Total Households | 91 (100.0%) | 3.25 |
Household Size by Marriage Status in Ellenton
Out of a total of 91 households in Ellenton, 80 (87.9%) are family households, while 11 (12.1%) are nonfamily households. The most numerous type of family households are 4-person households, comprising 45, and the most common type of nonfamily households are 1-person households, comprising 11.
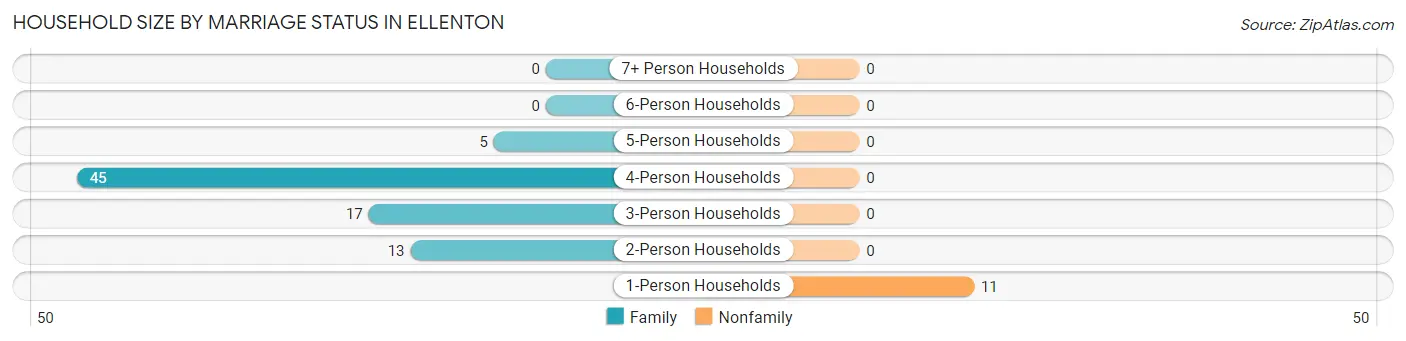
| Household Size | Family Households | Nonfamily Households |
| 1-Person Households | - | 11 (12.1%) |
| 2-Person Households | 13 (14.3%) | 0 (0.0%) |
| 3-Person Households | 17 (18.7%) | 0 (0.0%) |
| 4-Person Households | 45 (49.4%) | 0 (0.0%) |
| 5-Person Households | 5 (5.5%) | 0 (0.0%) |
| 6-Person Households | 0 (0.0%) | 0 (0.0%) |
| 7+ Person Households | 0 (0.0%) | 0 (0.0%) |
| Total | 80 (87.9%) | 11 (12.1%) |
Female Fertility in Ellenton
Fertility by Age in Ellenton
| Age Bracket | Women with Births | Births / 1,000 Women |
| 15 to 19 years | 0 (0.0%) | 0.0 |
| 20 to 34 years | 0 (0.0%) | 0.0 |
| 35 to 50 years | 0 (0.0%) | 0.0 |
| Total | 0 (0.0%) | 0.0 |
Fertility by Age by Marriage Status in Ellenton
| Age Bracket | Married | Unmarried |
| 15 to 19 years | 0 (0.0%) | 0 (0.0%) |
| 20 to 34 years | 0 (0.0%) | 0 (0.0%) |
| 35 to 50 years | 0 (0.0%) | 0 (0.0%) |
| Total | 0 (0.0%) | 0 (0.0%) |
Fertility by Education in Ellenton
| Educational Attainment | Women with Births | Births / 1,000 Women |
| Less than High School | 0 (0.0%) | 0.0 |
| High School Diploma | 0 (0.0%) | 0.0 |
| College or Associate's Degree | 0 (0.0%) | 0.0 |
| Bachelor's Degree | 0 (0.0%) | 0.0 |
| Graduate Degree | 0 (0.0%) | 0.0 |
| Total | 0 (0.0%) | 0.0 |
Fertility by Education by Marriage Status in Ellenton
| Educational Attainment | Married | Unmarried |
| Less than High School | 0 (0.0%) | 0 (0.0%) |
| High School Diploma | 0 (0.0%) | 0 (0.0%) |
| College or Associate's Degree | 0 (0.0%) | 0 (0.0%) |
| Bachelor's Degree | 0 (0.0%) | 0 (0.0%) |
| Graduate Degree | 0 (0.0%) | 0 (0.0%) |
| Total | 0 (0.0%) | 0 (0.0%) |
Employment Characteristics in Ellenton
Employment by Class of Employer in Ellenton
Among the 125 employed individuals in Ellenton, private company employees (106 | 84.8%), local government employees (13 | 10.4%), and self-employed (not incorporated) (2 | 1.6%) make up the most common classes of employment.
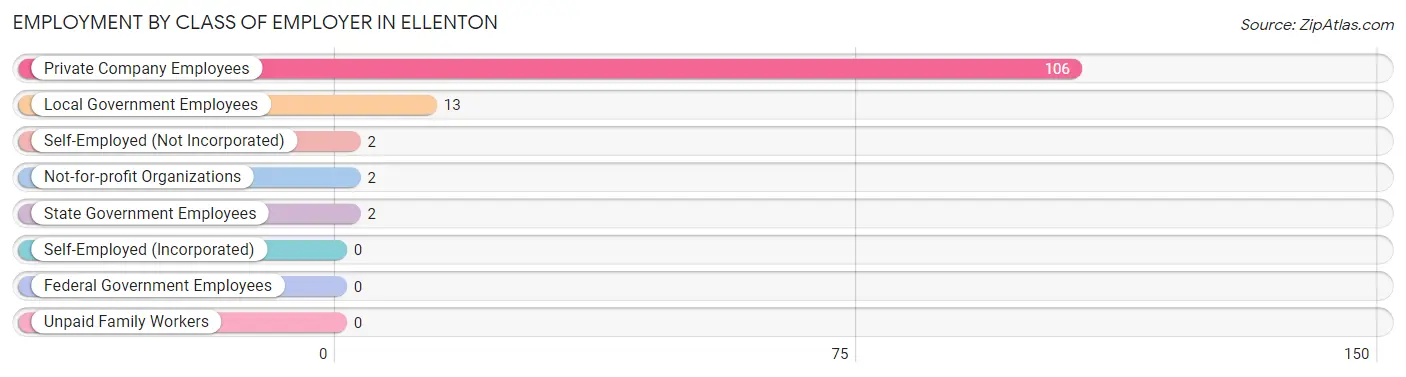
| Employer Class | # Employees | % Employees |
| Private Company Employees | 106 | 84.8% |
| Self-Employed (Incorporated) | 0 | 0.0% |
| Self-Employed (Not Incorporated) | 2 | 1.6% |
| Not-for-profit Organizations | 2 | 1.6% |
| Local Government Employees | 13 | 10.4% |
| State Government Employees | 2 | 1.6% |
| Federal Government Employees | 0 | 0.0% |
| Unpaid Family Workers | 0 | 0.0% |
| Total | 125 | 100.0% |
Employment Status by Age in Ellenton
According to the labor force statistics for Ellenton, out of the total population over 16 years of age (192), 68.2% or 131 individuals are in the labor force, with 4.6% or 6 of them unemployed. The age group with the highest labor force participation rate is 20 to 24 years, with 100.0% or 6 individuals in the labor force. Within the labor force, the 25 to 29 years age range has the highest percentage of unemployed individuals, with 13.0% or 3 of them being unemployed.
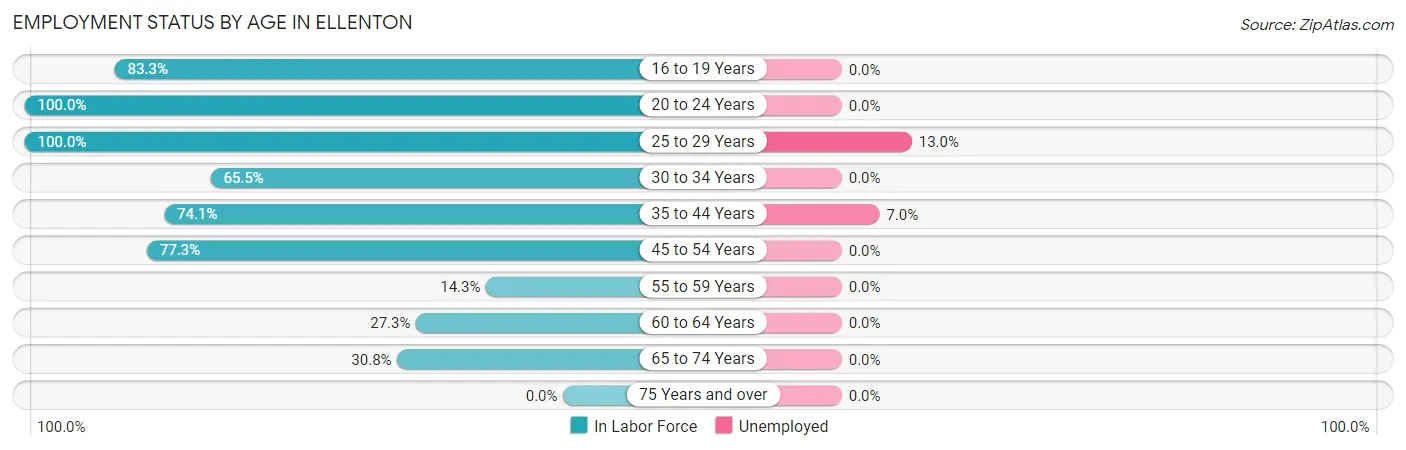
| Age Bracket | In Labor Force | Unemployed |
| 16 to 19 Years | 15 (83.3%) | 0 (0.0%) |
| 20 to 24 Years | 6 (100.0%) | 0 (0.0%) |
| 25 to 29 Years | 23 (100.0%) | 3 (13.0%) |
| 30 to 34 Years | 19 (65.5%) | 0 (0.0%) |
| 35 to 44 Years | 43 (74.1%) | 3 (7.0%) |
| 45 to 54 Years | 17 (77.3%) | 0 (0.0%) |
| 55 to 59 Years | 1 (14.3%) | 0 (0.0%) |
| 60 to 64 Years | 3 (27.3%) | 0 (0.0%) |
| 65 to 74 Years | 4 (30.8%) | 0 (0.0%) |
| 75 Years and over | 0 (0.0%) | 0 (0.0%) |
| Total | 131 (68.2%) | 6 (4.6%) |
Employment Status by Educational Attainment in Ellenton
According to labor force statistics for Ellenton, 70.7% of individuals (106) out of the total population between 25 and 64 years of age (150) are in the labor force, with 5.7% or 6 of them being unemployed. The group with the highest labor force participation rate are those with the educational attainment of high school diploma, with 89.1% or 49 individuals in the labor force. Within the labor force, individuals with less than high school education have the highest percentage of unemployment, with 8.8% or 3 of them being unemployed.
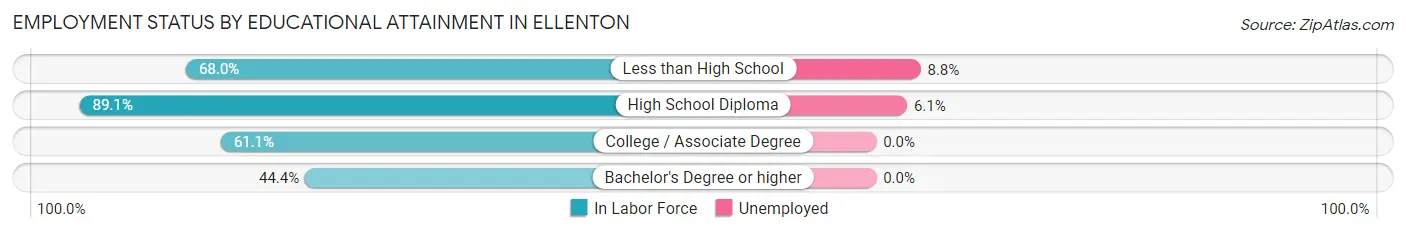
| Educational Attainment | In Labor Force | Unemployed |
| Less than High School | 34 (68.0%) | 4 (8.8%) |
| High School Diploma | 49 (89.1%) | 3 (6.1%) |
| College / Associate Degree | 11 (61.1%) | 0 (0.0%) |
| Bachelor's Degree or higher | 12 (44.4%) | 0 (0.0%) |
| Total | 106 (70.7%) | 9 (5.7%) |
Employment Occupations by Sex in Ellenton
Management, Business, Science and Arts Occupations
The most common Management, Business, Science and Arts occupations in Ellenton are Health Diagnosing & Treating (14 | 11.2%), Community & Social Service (4 | 3.2%), Education Instruction & Library (4 | 3.2%), and Management (2 | 1.6%).
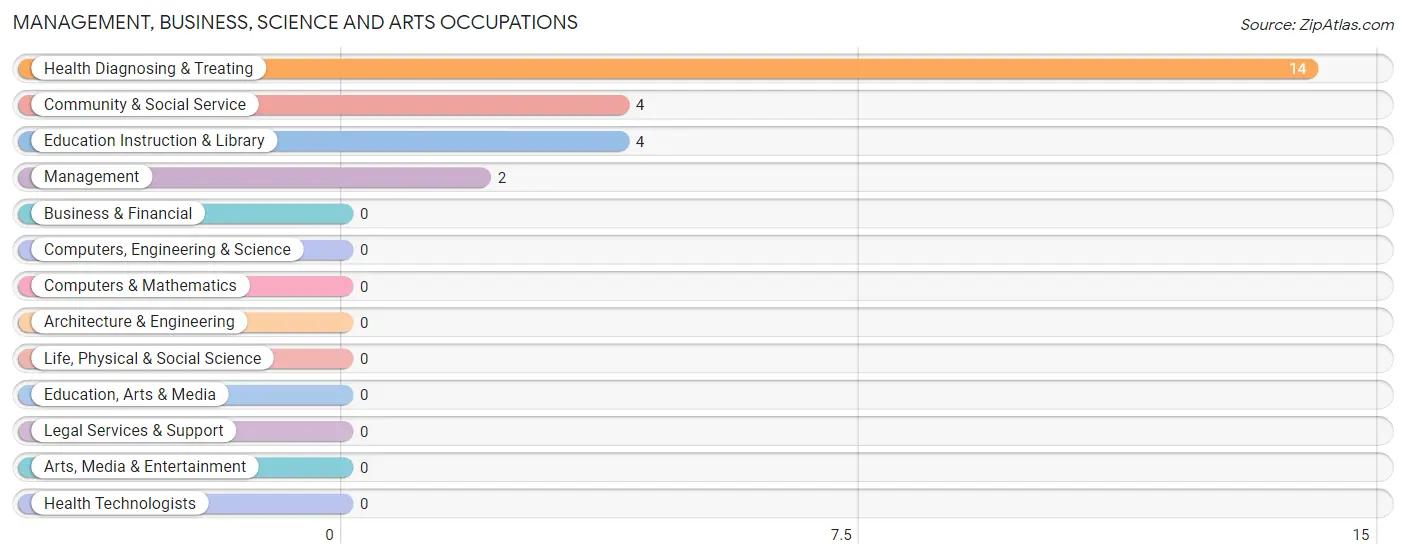
Management, Business, Science and Arts Occupations by Sex
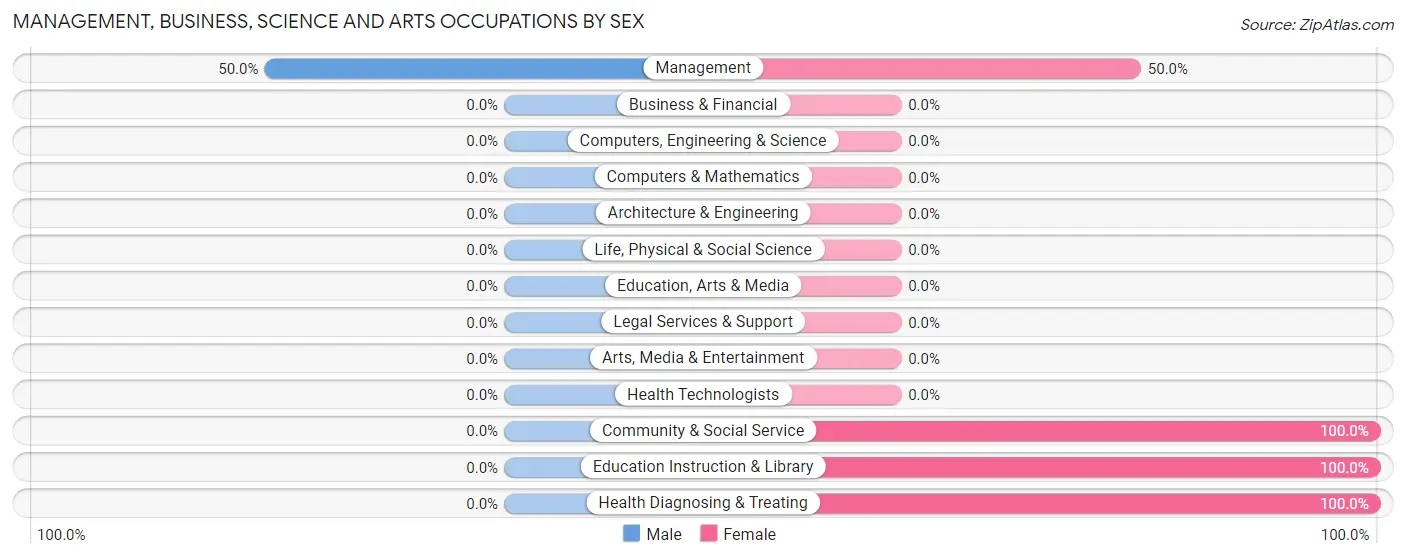
| Occupation | Male | Female |
| Management | 1 (50.0%) | 1 (50.0%) |
| Business & Financial | 0 (0.0%) | 0 (0.0%) |
| Computers, Engineering & Science | 0 (0.0%) | 0 (0.0%) |
| Computers & Mathematics | 0 (0.0%) | 0 (0.0%) |
| Architecture & Engineering | 0 (0.0%) | 0 (0.0%) |
| Life, Physical & Social Science | 0 (0.0%) | 0 (0.0%) |
| Community & Social Service | 0 (0.0%) | 4 (100.0%) |
| Education, Arts & Media | 0 (0.0%) | 0 (0.0%) |
| Legal Services & Support | 0 (0.0%) | 0 (0.0%) |
| Education Instruction & Library | 0 (0.0%) | 4 (100.0%) |
| Arts, Media & Entertainment | 0 (0.0%) | 0 (0.0%) |
| Health Diagnosing & Treating | 0 (0.0%) | 14 (100.0%) |
| Health Technologists | 0 (0.0%) | 0 (0.0%) |
| Total (Category) | 1 (5.0%) | 19 (95.0%) |
| Total (Overall) | 59 (47.2%) | 66 (52.8%) |
Services Occupations
The most common Services occupations in Ellenton are Food Preparation & Serving (12 | 9.6%), Healthcare Support (7 | 5.6%), Security & Protection (2 | 1.6%), Firefighting & Prevention (2 | 1.6%), and Cleaning & Maintenance (2 | 1.6%).
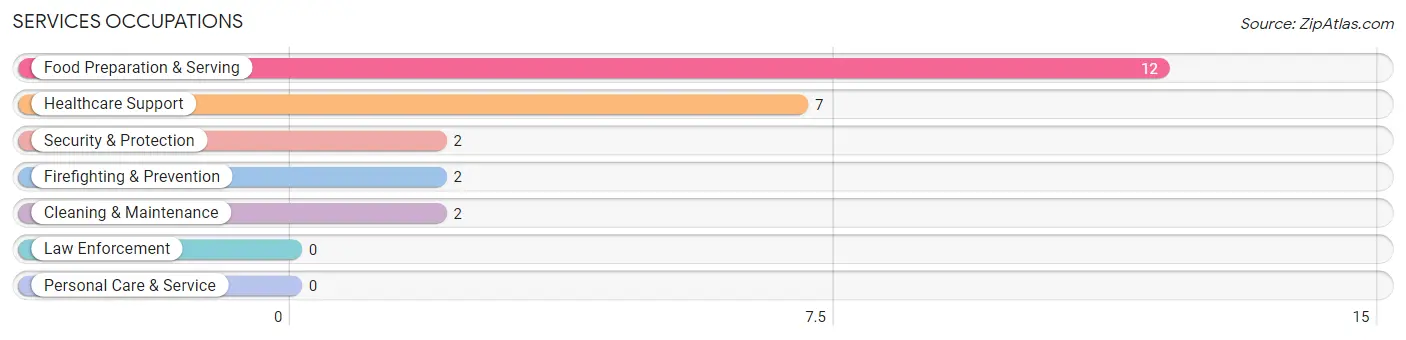
Services Occupations by Sex
Within the Services occupations in Ellenton, the most male-oriented occupations are Security & Protection (100.0%), and Firefighting & Prevention (100.0%), while the most female-oriented occupations are Healthcare Support (100.0%), Food Preparation & Serving (100.0%), and Cleaning & Maintenance (100.0%).
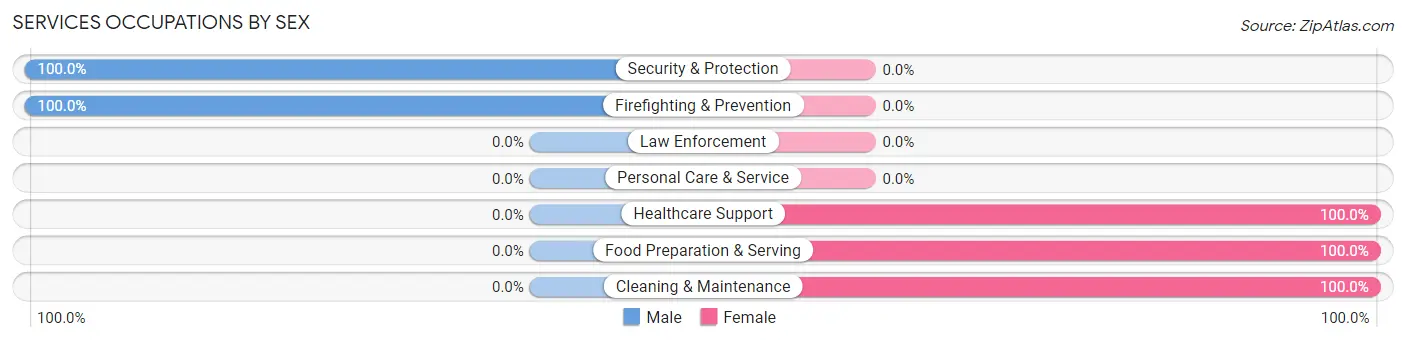
| Occupation | Male | Female |
| Healthcare Support | 0 (0.0%) | 7 (100.0%) |
| Security & Protection | 2 (100.0%) | 0 (0.0%) |
| Firefighting & Prevention | 2 (100.0%) | 0 (0.0%) |
| Law Enforcement | 0 (0.0%) | 0 (0.0%) |
| Food Preparation & Serving | 0 (0.0%) | 12 (100.0%) |
| Cleaning & Maintenance | 0 (0.0%) | 2 (100.0%) |
| Personal Care & Service | 0 (0.0%) | 0 (0.0%) |
| Total (Category) | 2 (8.7%) | 21 (91.3%) |
| Total (Overall) | 59 (47.2%) | 66 (52.8%) |
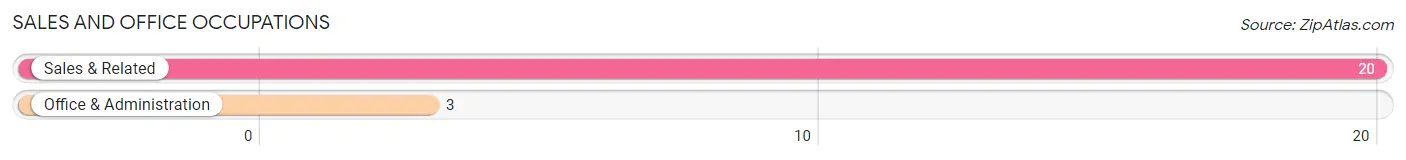
Sales and Office Occupations
The most common Sales and Office occupations in Ellenton are Sales & Related (20 | 16.0%), and Office & Administration (3 | 2.4%).
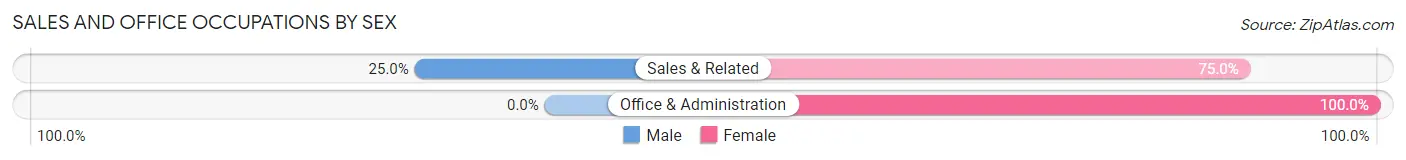
Sales and Office Occupations by Sex
| Occupation | Male | Female |
| Sales & Related | 5 (25.0%) | 15 (75.0%) |
| Office & Administration | 0 (0.0%) | 3 (100.0%) |
| Total (Category) | 5 (21.7%) | 18 (78.3%) |
| Total (Overall) | 59 (47.2%) | 66 (52.8%) |
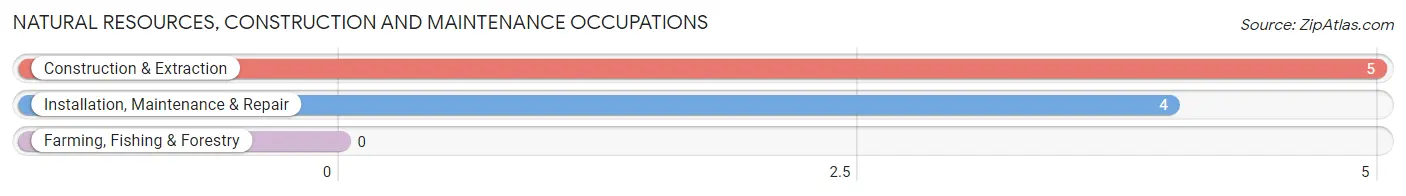
Natural Resources, Construction and Maintenance Occupations
The most common Natural Resources, Construction and Maintenance occupations in Ellenton are Construction & Extraction (5 | 4.0%), and Installation, Maintenance & Repair (4 | 3.2%).
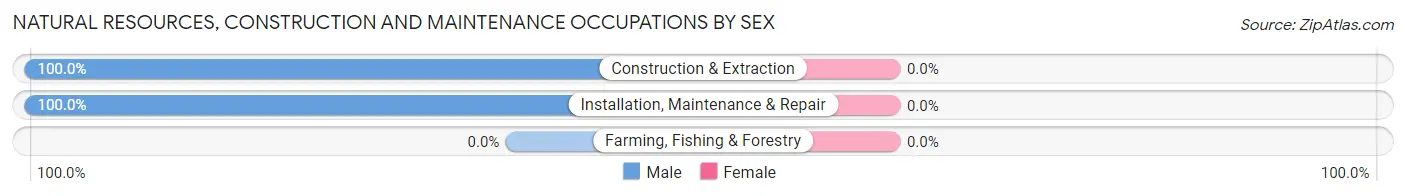
Natural Resources, Construction and Maintenance Occupations by Sex
| Occupation | Male | Female |
| Farming, Fishing & Forestry | 0 (0.0%) | 0 (0.0%) |
| Construction & Extraction | 5 (100.0%) | 0 (0.0%) |
| Installation, Maintenance & Repair | 4 (100.0%) | 0 (0.0%) |
| Total (Category) | 9 (100.0%) | 0 (0.0%) |
| Total (Overall) | 59 (47.2%) | 66 (52.8%) |
Production, Transportation and Moving Occupations
The most common Production, Transportation and Moving occupations in Ellenton are Transportation (29 | 23.2%), and Production (21 | 16.8%).
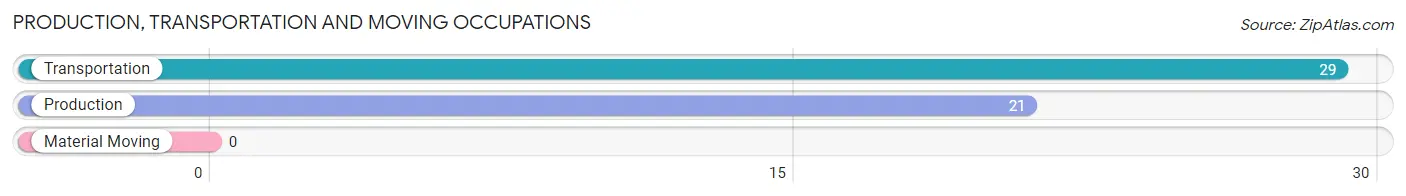
Production, Transportation and Moving Occupations by Sex
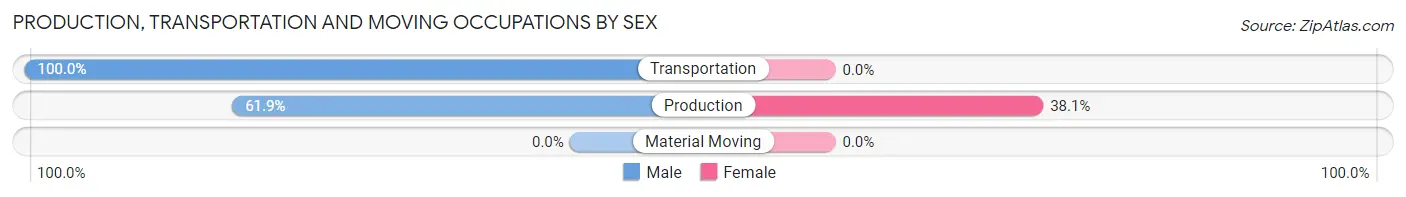
| Occupation | Male | Female |
| Production | 13 (61.9%) | 8 (38.1%) |
| Transportation | 29 (100.0%) | 0 (0.0%) |
| Material Moving | 0 (0.0%) | 0 (0.0%) |
| Total (Category) | 42 (84.0%) | 8 (16.0%) |
| Total (Overall) | 59 (47.2%) | 66 (52.8%) |
Employment Industries by Sex in Ellenton
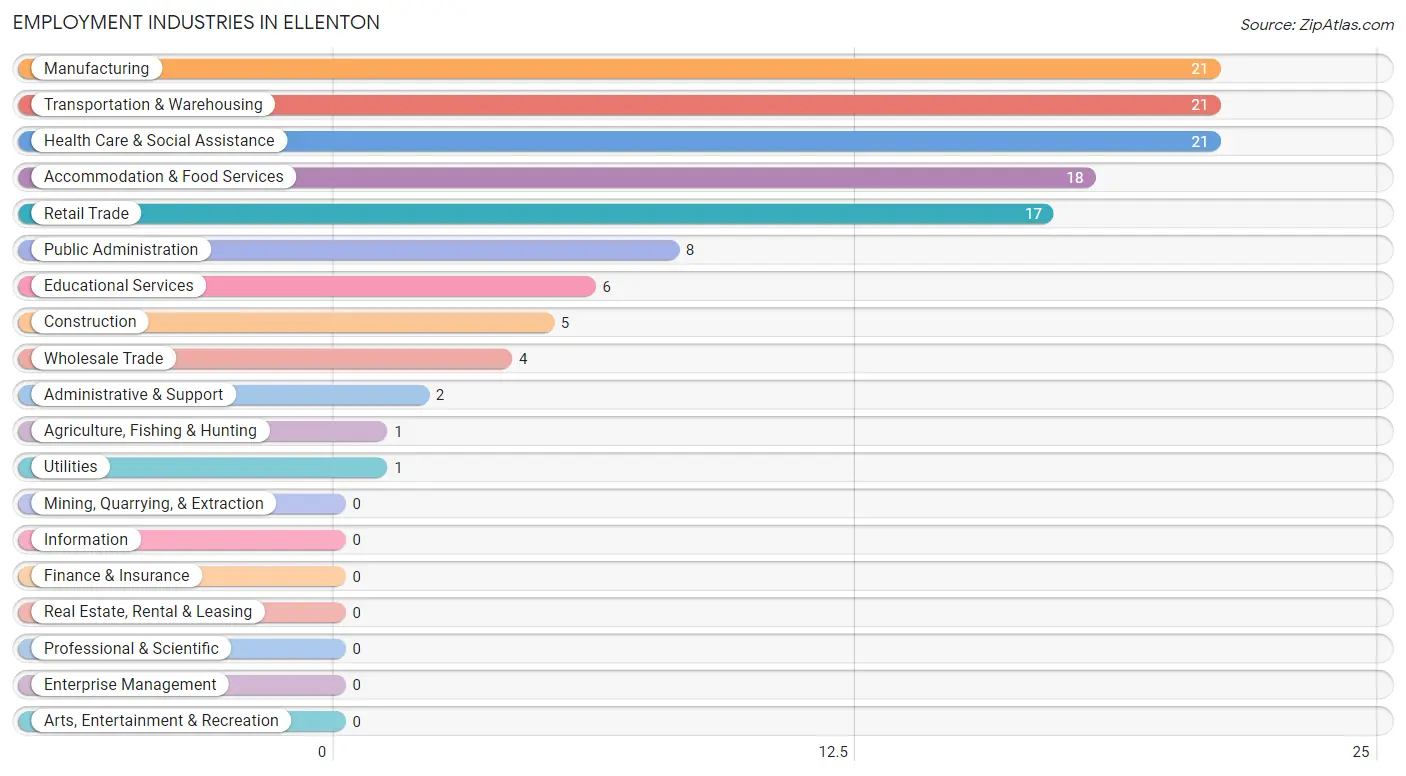
Employment Industries in Ellenton
The major employment industries in Ellenton include Manufacturing (21 | 16.8%), Transportation & Warehousing (21 | 16.8%), Health Care & Social Assistance (21 | 16.8%), Accommodation & Food Services (18 | 14.4%), and Retail Trade (17 | 13.6%).
Employment Industries by Sex in Ellenton
The Ellenton industries that see more men than women are Agriculture, Fishing & Hunting (100.0%), Construction (100.0%), and Wholesale Trade (100.0%), whereas the industries that tend to have a higher number of women are Administrative & Support (100.0%), Health Care & Social Assistance (100.0%), and Accommodation & Food Services (100.0%).
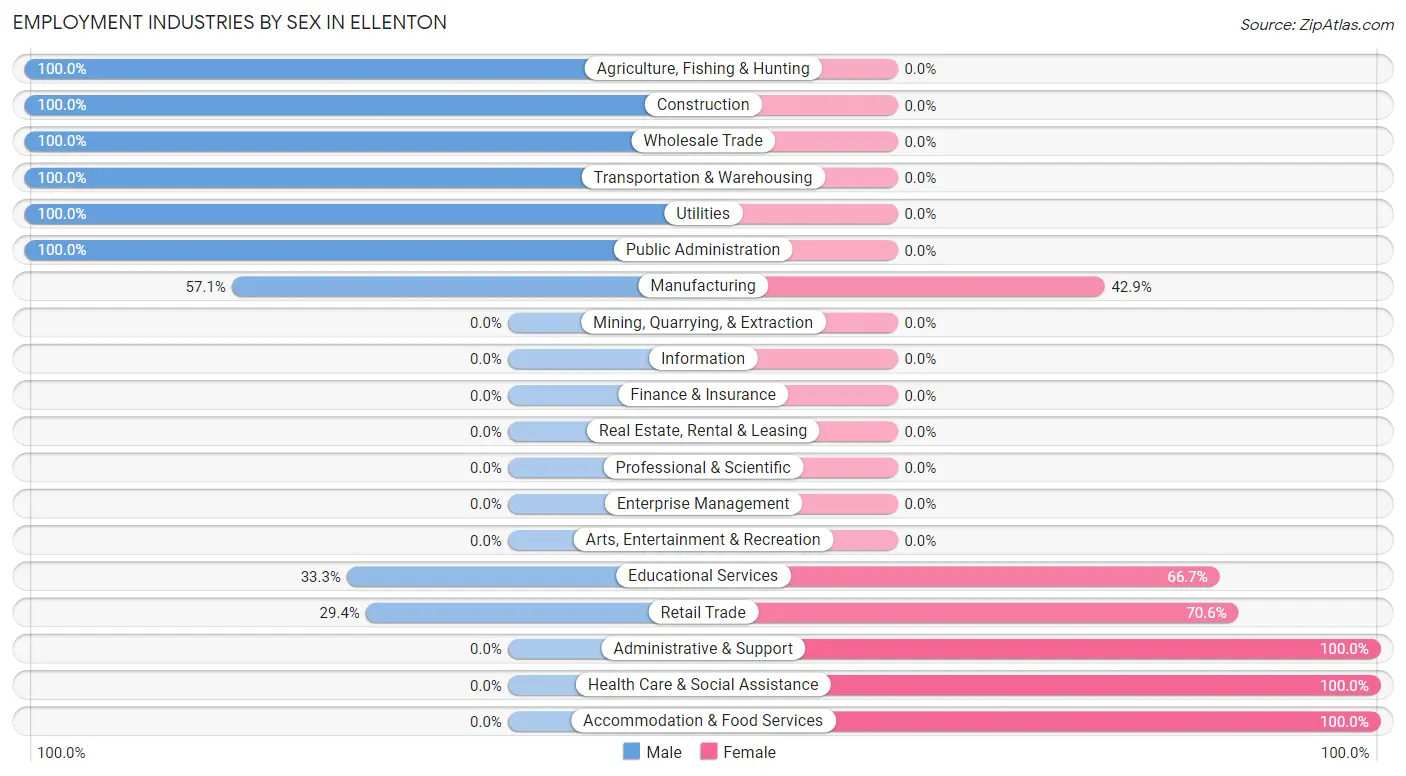
| Industry | Male | Female |
| Agriculture, Fishing & Hunting | 1 (100.0%) | 0 (0.0%) |
| Mining, Quarrying, & Extraction | 0 (0.0%) | 0 (0.0%) |
| Construction | 5 (100.0%) | 0 (0.0%) |
| Manufacturing | 12 (57.1%) | 9 (42.9%) |
| Wholesale Trade | 4 (100.0%) | 0 (0.0%) |
| Retail Trade | 5 (29.4%) | 12 (70.6%) |
| Transportation & Warehousing | 21 (100.0%) | 0 (0.0%) |
| Utilities | 1 (100.0%) | 0 (0.0%) |
| Information | 0 (0.0%) | 0 (0.0%) |
| Finance & Insurance | 0 (0.0%) | 0 (0.0%) |
| Real Estate, Rental & Leasing | 0 (0.0%) | 0 (0.0%) |
| Professional & Scientific | 0 (0.0%) | 0 (0.0%) |
| Enterprise Management | 0 (0.0%) | 0 (0.0%) |
| Administrative & Support | 0 (0.0%) | 2 (100.0%) |
| Educational Services | 2 (33.3%) | 4 (66.7%) |
| Health Care & Social Assistance | 0 (0.0%) | 21 (100.0%) |
| Arts, Entertainment & Recreation | 0 (0.0%) | 0 (0.0%) |
| Accommodation & Food Services | 0 (0.0%) | 18 (100.0%) |
| Public Administration | 8 (100.0%) | 0 (0.0%) |
| Total | 59 (47.2%) | 66 (52.8%) |
Education in Ellenton
School Enrollment in Ellenton
The most common levels of schooling among the 117 students in Ellenton are elementary school (65 | 55.6%), high school (25 | 21.4%), and middle school (19 | 16.2%).
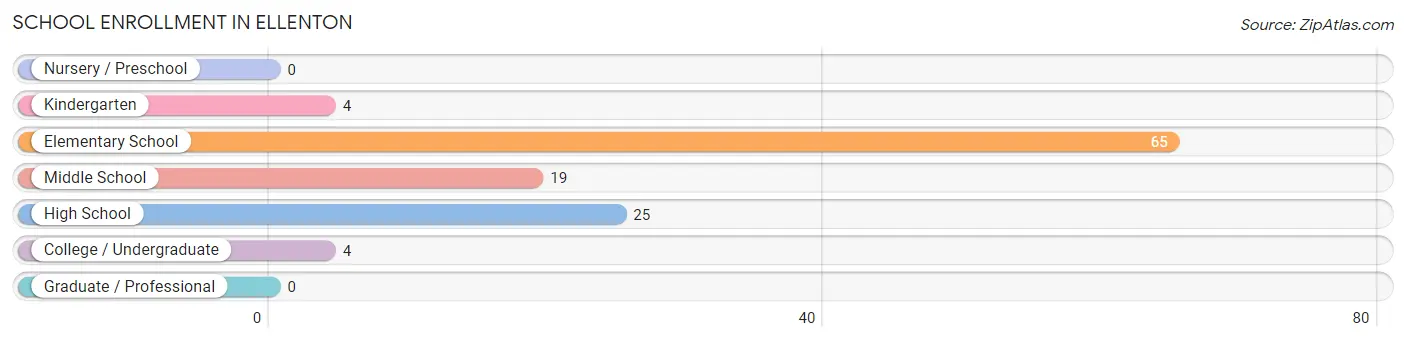
| School Level | # Students | % Students |
| Nursery / Preschool | 0 | 0.0% |
| Kindergarten | 4 | 3.4% |
| Elementary School | 65 | 55.6% |
| Middle School | 19 | 16.2% |
| High School | 25 | 21.4% |
| College / Undergraduate | 4 | 3.4% |
| Graduate / Professional | 0 | 0.0% |
| Total | 117 | 100.0% |
School Enrollment by Age by Funding Source in Ellenton
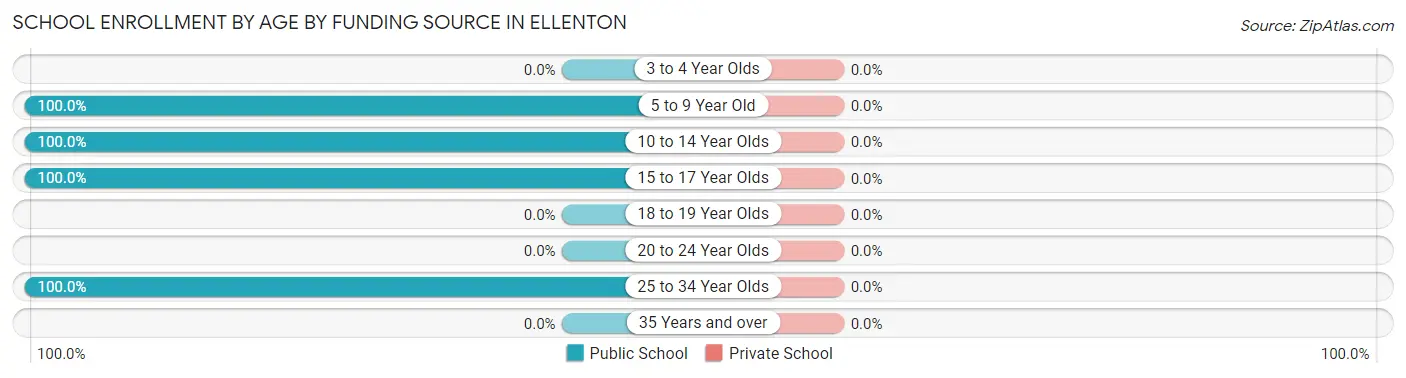
| Age Bracket | Public School | Private School |
| 3 to 4 Year Olds | 0 (0.0%) | 0 (0.0%) |
| 5 to 9 Year Old | 62 (100.0%) | 0 (0.0%) |
| 10 to 14 Year Olds | 26 (100.0%) | 0 (0.0%) |
| 15 to 17 Year Olds | 25 (100.0%) | 0 (0.0%) |
| 18 to 19 Year Olds | 0 (0.0%) | 0 (0.0%) |
| 20 to 24 Year Olds | 0 (0.0%) | 0 (0.0%) |
| 25 to 34 Year Olds | 4 (100.0%) | 0 (0.0%) |
| 35 Years and over | 0 (0.0%) | 0 (0.0%) |
| Total | 117 (100.0%) | 0 (0.0%) |
Educational Attainment by Field of Study in Ellenton
Business (13 | 44.8%), arts & humanities (7 | 24.1%), education (6 | 20.7%), and social sciences (3 | 10.3%) are the most common fields of study among 29 individuals in Ellenton who have obtained a bachelor's degree or higher.
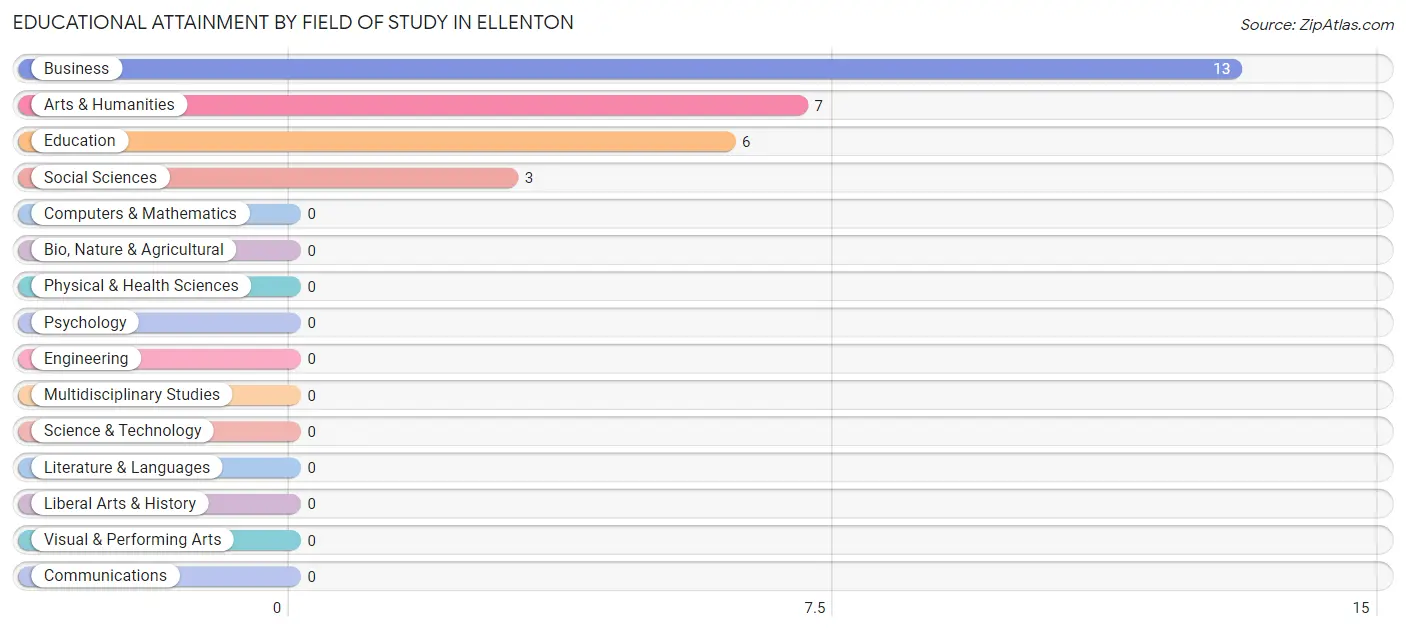
| Field of Study | # Graduates | % Graduates |
| Computers & Mathematics | 0 | 0.0% |
| Bio, Nature & Agricultural | 0 | 0.0% |
| Physical & Health Sciences | 0 | 0.0% |
| Psychology | 0 | 0.0% |
| Social Sciences | 3 | 10.3% |
| Engineering | 0 | 0.0% |
| Multidisciplinary Studies | 0 | 0.0% |
| Science & Technology | 0 | 0.0% |
| Business | 13 | 44.8% |
| Education | 6 | 20.7% |
| Literature & Languages | 0 | 0.0% |
| Liberal Arts & History | 0 | 0.0% |
| Visual & Performing Arts | 0 | 0.0% |
| Communications | 0 | 0.0% |
| Arts & Humanities | 7 | 24.1% |
| Total | 29 | 100.0% |
Transportation & Commute in Ellenton
Vehicle Availability by Sex in Ellenton
The most prevalent vehicle ownership categories in Ellenton are males with 3 vehicles (34, accounting for 57.6%) and females with 3 vehicles (27, making up 51.5%).
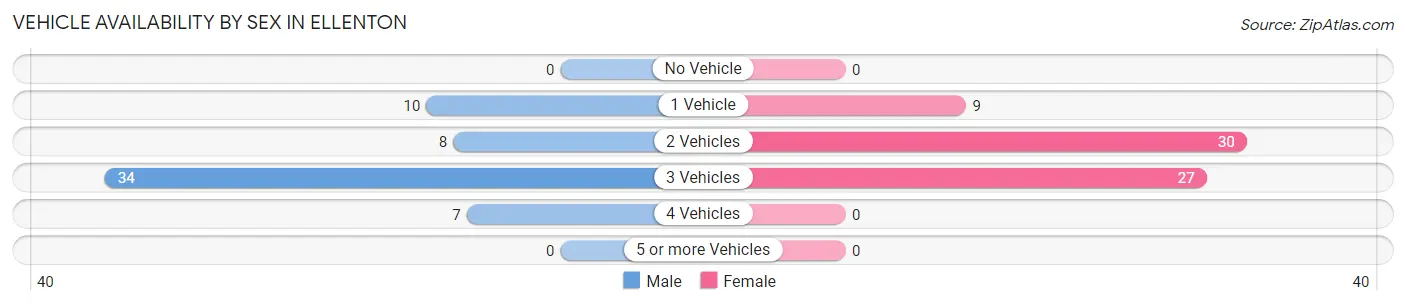
| Vehicles Available | Male | Female |
| No Vehicle | 0 (0.0%) | 0 (0.0%) |
| 1 Vehicle | 10 (17.0%) | 9 (13.6%) |
| 2 Vehicles | 8 (13.6%) | 30 (45.5%) |
| 3 Vehicles | 34 (57.6%) | 27 (40.9%) |
| 4 Vehicles | 7 (11.9%) | 0 (0.0%) |
| 5 or more Vehicles | 0 (0.0%) | 0 (0.0%) |
| Total | 59 (100.0%) | 66 (100.0%) |
Commute Time in Ellenton
The most frequently occuring commute durations in Ellenton are 30 to 34 minutes (35 commuters, 28.0%), 20 to 24 minutes (34 commuters, 27.2%), and 10 to 14 minutes (20 commuters, 16.0%).
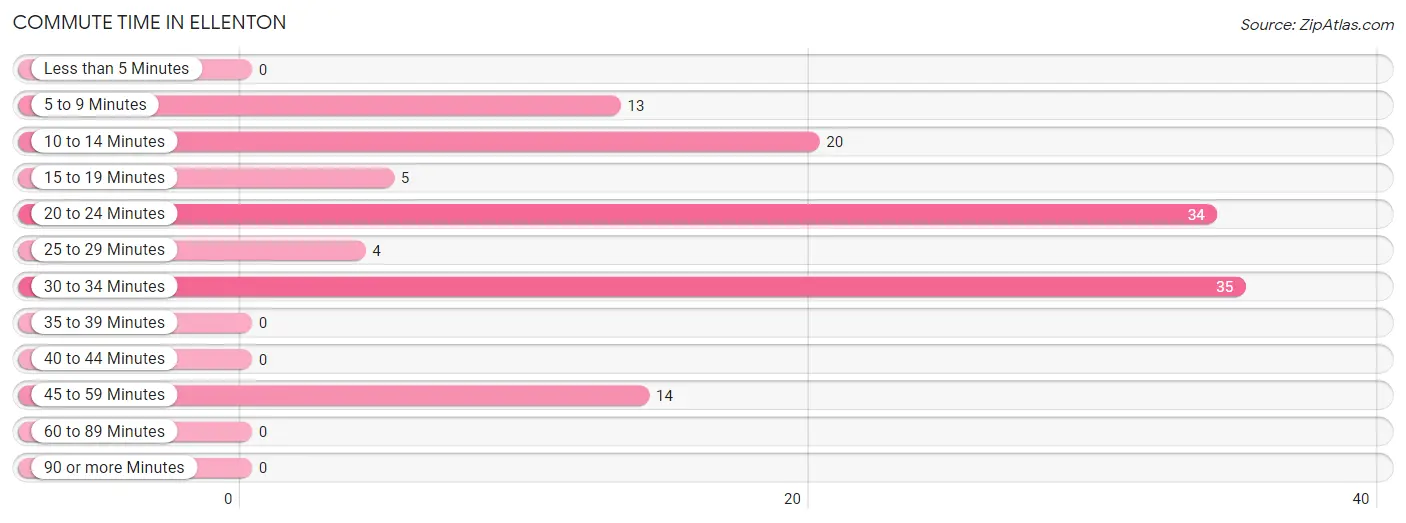
| Commute Time | # Commuters | % Commuters |
| Less than 5 Minutes | 0 | 0.0% |
| 5 to 9 Minutes | 13 | 10.4% |
| 10 to 14 Minutes | 20 | 16.0% |
| 15 to 19 Minutes | 5 | 4.0% |
| 20 to 24 Minutes | 34 | 27.2% |
| 25 to 29 Minutes | 4 | 3.2% |
| 30 to 34 Minutes | 35 | 28.0% |
| 35 to 39 Minutes | 0 | 0.0% |
| 40 to 44 Minutes | 0 | 0.0% |
| 45 to 59 Minutes | 14 | 11.2% |
| 60 to 89 Minutes | 0 | 0.0% |
| 90 or more Minutes | 0 | 0.0% |
Commute Time by Sex in Ellenton
The most common commute times in Ellenton are 30 to 34 minutes (21 commuters, 35.6%) for males and 20 to 24 minutes (22 commuters, 33.3%) for females.
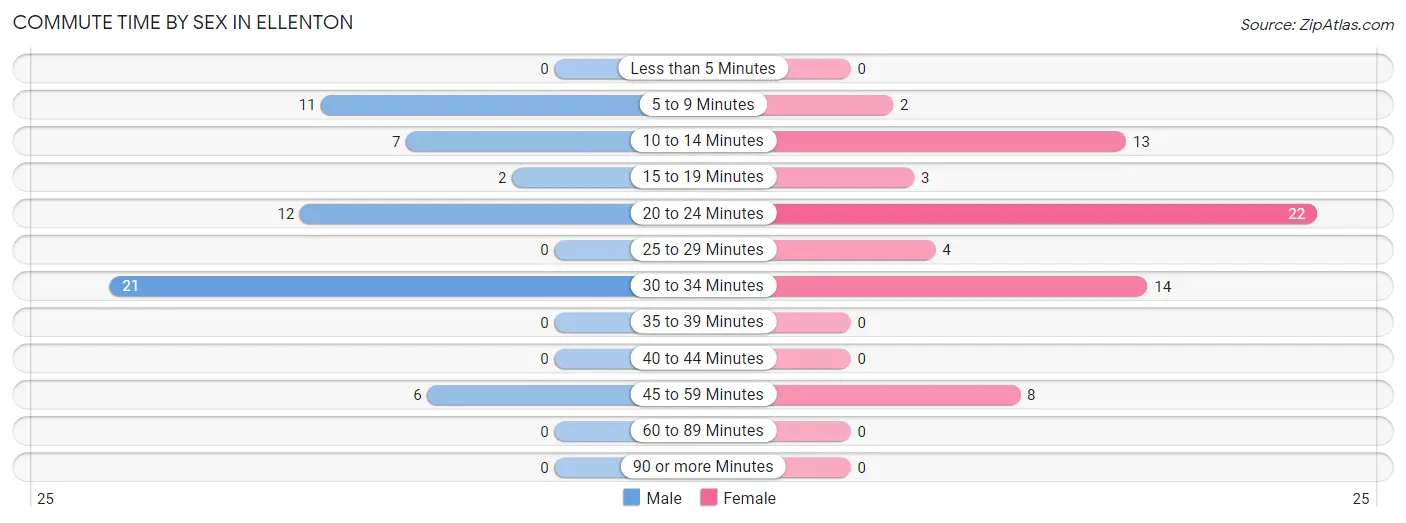
| Commute Time | Male | Female |
| Less than 5 Minutes | 0 (0.0%) | 0 (0.0%) |
| 5 to 9 Minutes | 11 (18.6%) | 2 (3.0%) |
| 10 to 14 Minutes | 7 (11.9%) | 13 (19.7%) |
| 15 to 19 Minutes | 2 (3.4%) | 3 (4.5%) |
| 20 to 24 Minutes | 12 (20.3%) | 22 (33.3%) |
| 25 to 29 Minutes | 0 (0.0%) | 4 (6.1%) |
| 30 to 34 Minutes | 21 (35.6%) | 14 (21.2%) |
| 35 to 39 Minutes | 0 (0.0%) | 0 (0.0%) |
| 40 to 44 Minutes | 0 (0.0%) | 0 (0.0%) |
| 45 to 59 Minutes | 6 (10.2%) | 8 (12.1%) |
| 60 to 89 Minutes | 0 (0.0%) | 0 (0.0%) |
| 90 or more Minutes | 0 (0.0%) | 0 (0.0%) |
Time of Departure to Work by Sex in Ellenton
The most frequent times of departure to work in Ellenton are 12:00 AM to 4:59 AM (22, 37.3%) for males and 7:00 AM to 7:29 AM (15, 22.7%) for females.
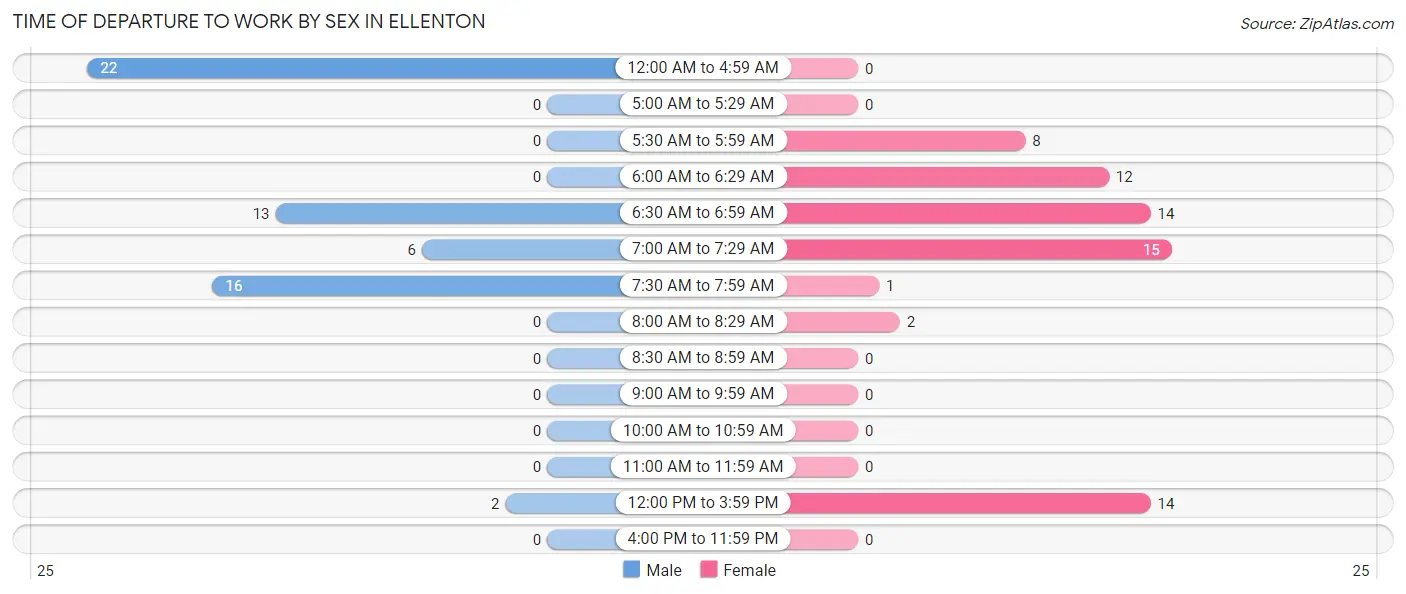
| Time of Departure | Male | Female |
| 12:00 AM to 4:59 AM | 22 (37.3%) | 0 (0.0%) |
| 5:00 AM to 5:29 AM | 0 (0.0%) | 0 (0.0%) |
| 5:30 AM to 5:59 AM | 0 (0.0%) | 8 (12.1%) |
| 6:00 AM to 6:29 AM | 0 (0.0%) | 12 (18.2%) |
| 6:30 AM to 6:59 AM | 13 (22.0%) | 14 (21.2%) |
| 7:00 AM to 7:29 AM | 6 (10.2%) | 15 (22.7%) |
| 7:30 AM to 7:59 AM | 16 (27.1%) | 1 (1.5%) |
| 8:00 AM to 8:29 AM | 0 (0.0%) | 2 (3.0%) |
| 8:30 AM to 8:59 AM | 0 (0.0%) | 0 (0.0%) |
| 9:00 AM to 9:59 AM | 0 (0.0%) | 0 (0.0%) |
| 10:00 AM to 10:59 AM | 0 (0.0%) | 0 (0.0%) |
| 11:00 AM to 11:59 AM | 0 (0.0%) | 0 (0.0%) |
| 12:00 PM to 3:59 PM | 2 (3.4%) | 14 (21.2%) |
| 4:00 PM to 11:59 PM | 0 (0.0%) | 0 (0.0%) |
| Total | 59 (100.0%) | 66 (100.0%) |
Housing Occupancy in Ellenton
Occupancy by Ownership in Ellenton
Of the total 91 dwellings in Ellenton, owner-occupied units account for 60 (65.9%), while renter-occupied units make up 31 (34.1%).
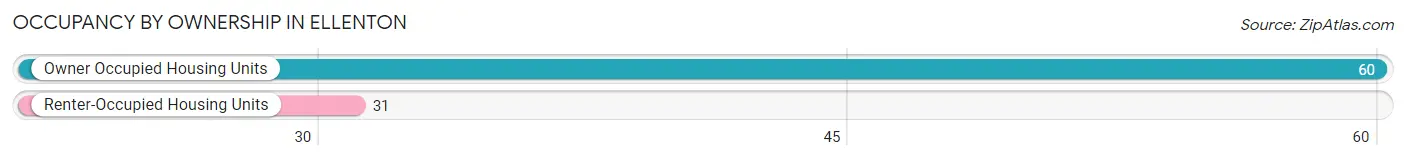
| Occupancy | # Housing Units | % Housing Units |
| Owner Occupied Housing Units | 60 | 65.9% |
| Renter-Occupied Housing Units | 31 | 34.1% |
| Total Occupied Housing Units | 91 | 100.0% |
Occupancy by Household Size in Ellenton
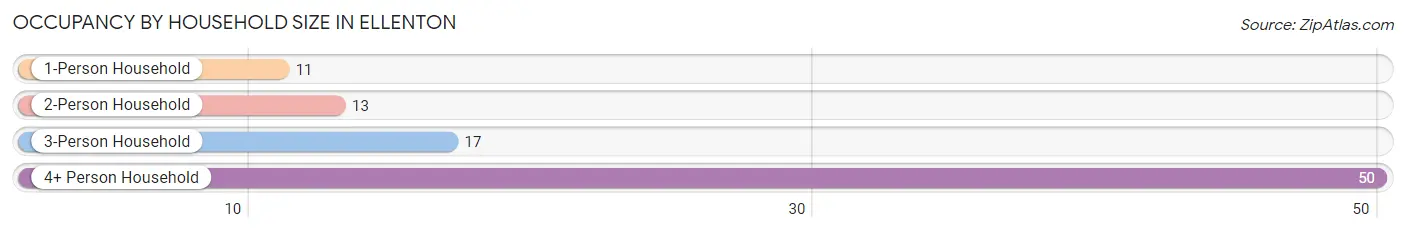
| Household Size | # Housing Units | % Housing Units |
| 1-Person Household | 11 | 12.1% |
| 2-Person Household | 13 | 14.3% |
| 3-Person Household | 17 | 18.7% |
| 4+ Person Household | 50 | 54.9% |
| Total Housing Units | 91 | 100.0% |
Occupancy by Ownership by Household Size in Ellenton
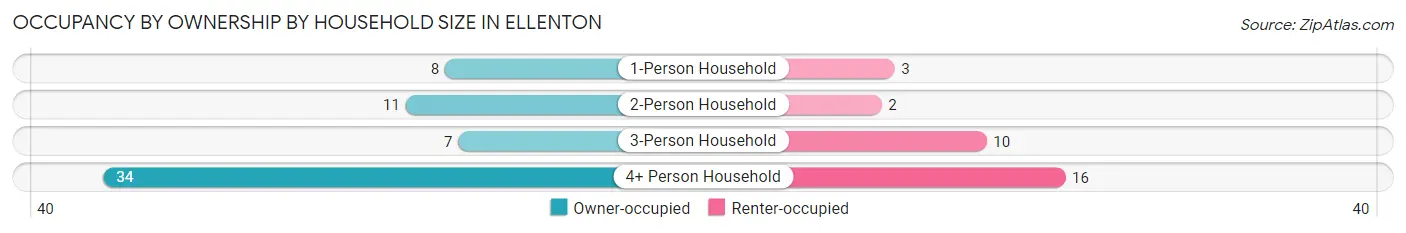
| Household Size | Owner-occupied | Renter-occupied |
| 1-Person Household | 8 (72.7%) | 3 (27.3%) |
| 2-Person Household | 11 (84.6%) | 2 (15.4%) |
| 3-Person Household | 7 (41.2%) | 10 (58.8%) |
| 4+ Person Household | 34 (68.0%) | 16 (32.0%) |
| Total Housing Units | 60 (65.9%) | 31 (34.1%) |
Occupancy by Educational Attainment in Ellenton
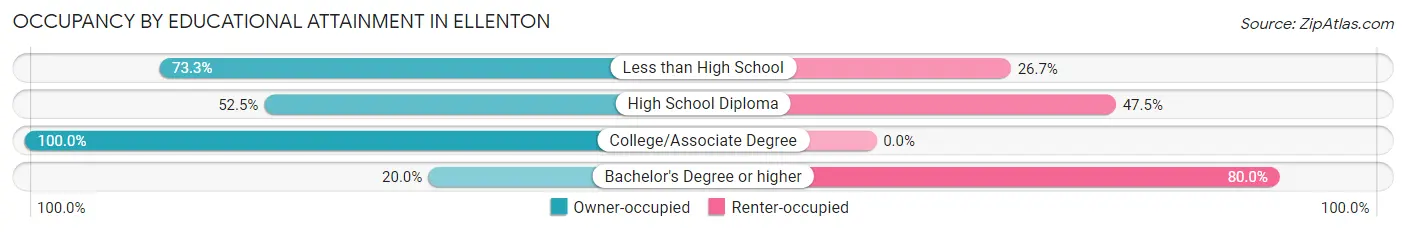
| Household Size | Owner-occupied | Renter-occupied |
| Less than High School | 22 (73.3%) | 8 (26.7%) |
| High School Diploma | 21 (52.5%) | 19 (47.5%) |
| College/Associate Degree | 16 (100.0%) | 0 (0.0%) |
| Bachelor's Degree or higher | 1 (20.0%) | 4 (80.0%) |
Occupancy by Age of Householder in Ellenton
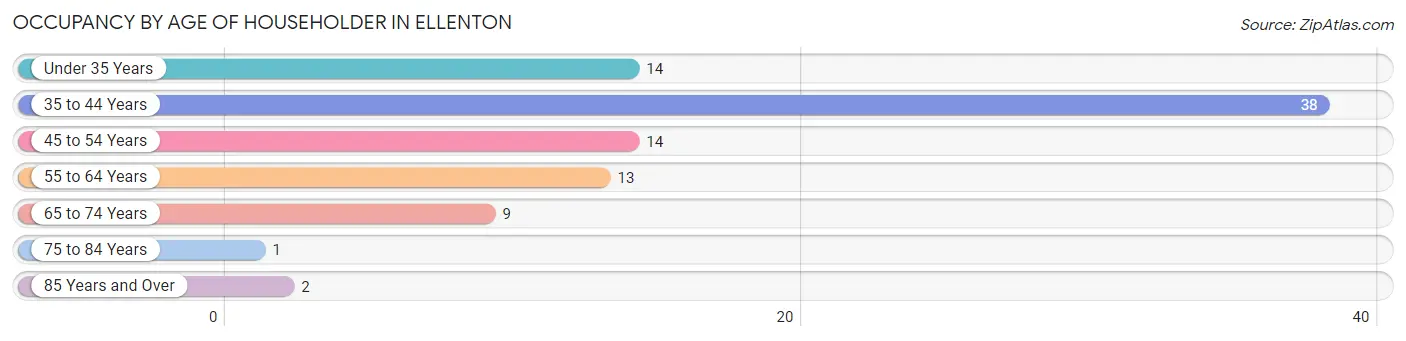
| Age Bracket | # Households | % Households |
| Under 35 Years | 14 | 15.4% |
| 35 to 44 Years | 38 | 41.8% |
| 45 to 54 Years | 14 | 15.4% |
| 55 to 64 Years | 13 | 14.3% |
| 65 to 74 Years | 9 | 9.9% |
| 75 to 84 Years | 1 | 1.1% |
| 85 Years and Over | 2 | 2.2% |
| Total | 91 | 100.0% |
Housing Finances in Ellenton
Median Income by Occupancy in Ellenton
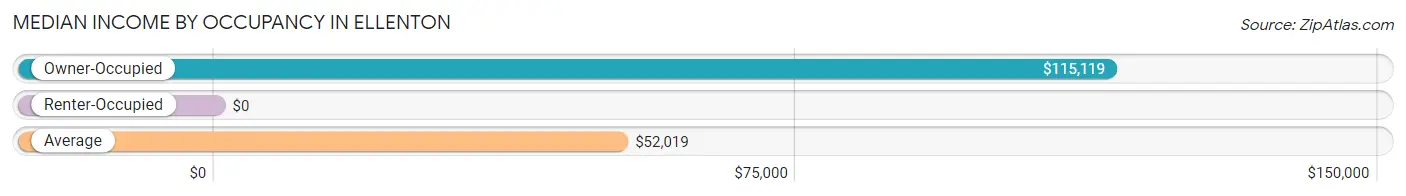
| Occupancy Type | # Households | Median Income |
| Owner-Occupied | 60 (65.9%) | $115,119 |
| Renter-Occupied | 31 (34.1%) | $0 |
| Average | 91 (100.0%) | $52,019 |
Occupancy by Householder Income Bracket in Ellenton
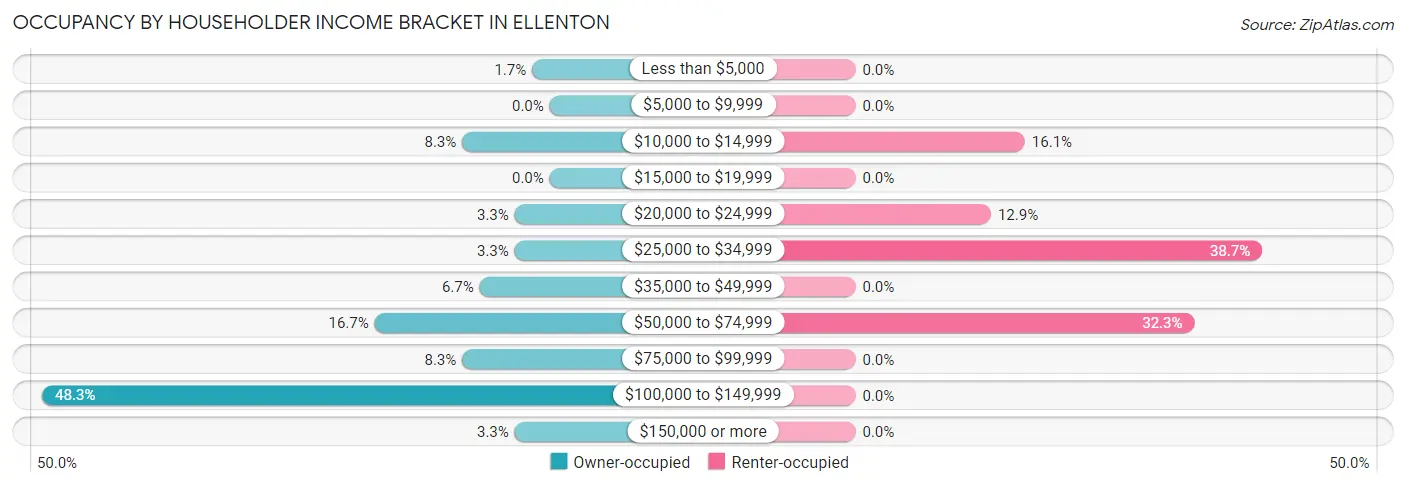
| Income Bracket | Owner-occupied | Renter-occupied |
| Less than $5,000 | 1 (1.7%) | 0 (0.0%) |
| $5,000 to $9,999 | 0 (0.0%) | 0 (0.0%) |
| $10,000 to $14,999 | 5 (8.3%) | 5 (16.1%) |
| $15,000 to $19,999 | 0 (0.0%) | 0 (0.0%) |
| $20,000 to $24,999 | 2 (3.3%) | 4 (12.9%) |
| $25,000 to $34,999 | 2 (3.3%) | 12 (38.7%) |
| $35,000 to $49,999 | 4 (6.7%) | 0 (0.0%) |
| $50,000 to $74,999 | 10 (16.7%) | 10 (32.3%) |
| $75,000 to $99,999 | 5 (8.3%) | 0 (0.0%) |
| $100,000 to $149,999 | 29 (48.3%) | 0 (0.0%) |
| $150,000 or more | 2 (3.3%) | 0 (0.0%) |
| Total | 60 (100.0%) | 31 (100.0%) |
Monthly Housing Cost Tiers in Ellenton
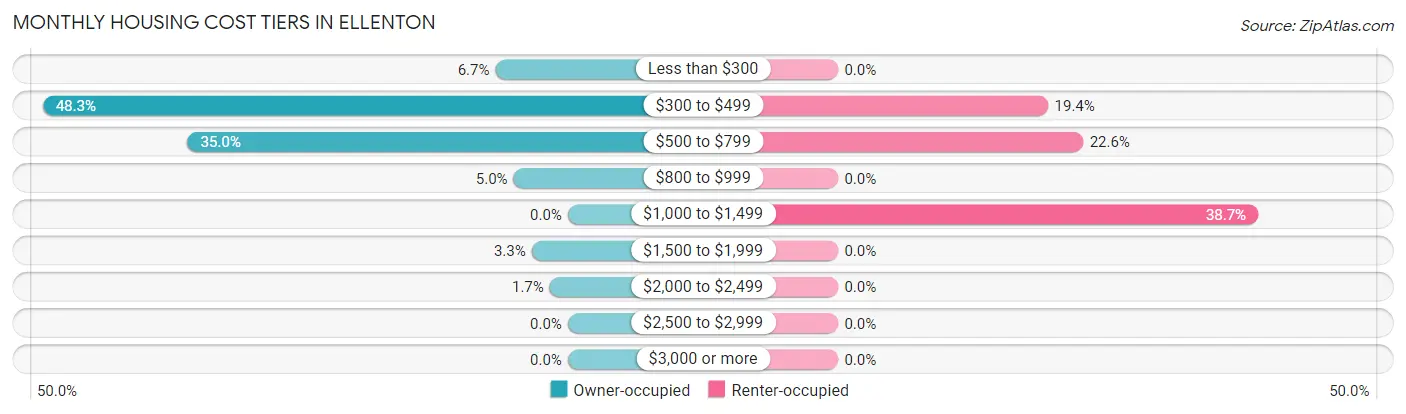
| Monthly Cost | Owner-occupied | Renter-occupied |
| Less than $300 | 4 (6.7%) | 0 (0.0%) |
| $300 to $499 | 29 (48.3%) | 6 (19.4%) |
| $500 to $799 | 21 (35.0%) | 7 (22.6%) |
| $800 to $999 | 3 (5.0%) | 0 (0.0%) |
| $1,000 to $1,499 | 0 (0.0%) | 12 (38.7%) |
| $1,500 to $1,999 | 2 (3.3%) | 0 (0.0%) |
| $2,000 to $2,499 | 1 (1.7%) | 0 (0.0%) |
| $2,500 to $2,999 | 0 (0.0%) | 0 (0.0%) |
| $3,000 or more | 0 (0.0%) | 0 (0.0%) |
| Total | 60 (100.0%) | 31 (100.0%) |
Physical Housing Characteristics in Ellenton
Housing Structures in Ellenton
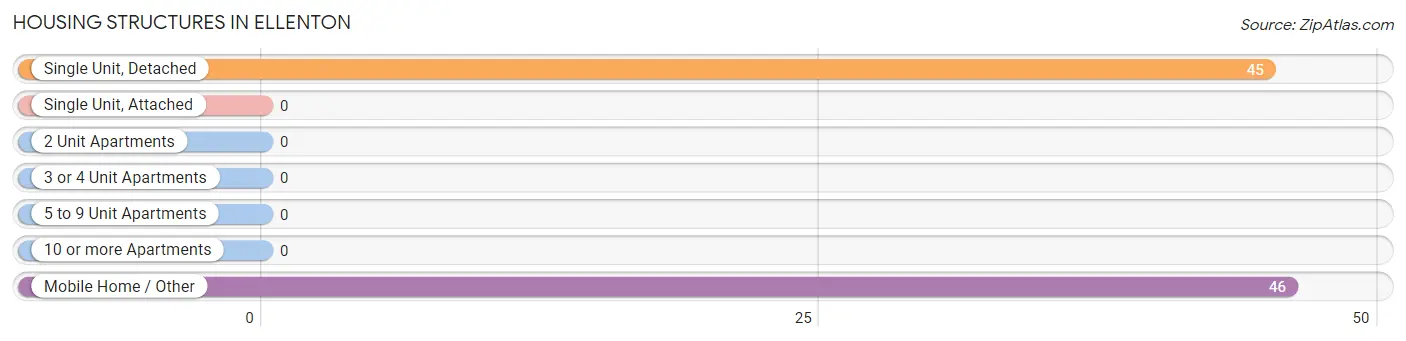
| Structure Type | # Housing Units | % Housing Units |
| Single Unit, Detached | 45 | 49.4% |
| Single Unit, Attached | 0 | 0.0% |
| 2 Unit Apartments | 0 | 0.0% |
| 3 or 4 Unit Apartments | 0 | 0.0% |
| 5 to 9 Unit Apartments | 0 | 0.0% |
| 10 or more Apartments | 0 | 0.0% |
| Mobile Home / Other | 46 | 50.5% |
| Total | 91 | 100.0% |
Housing Structures by Occupancy in Ellenton
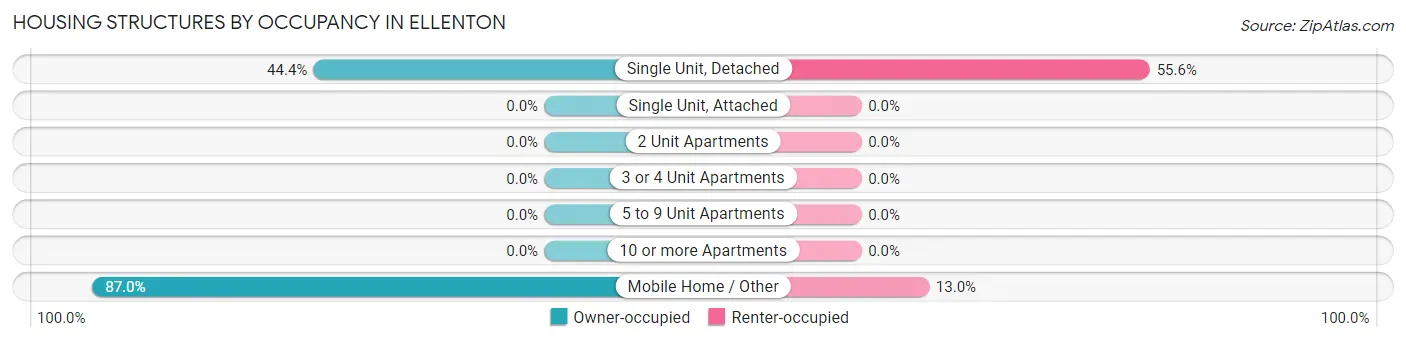
| Structure Type | Owner-occupied | Renter-occupied |
| Single Unit, Detached | 20 (44.4%) | 25 (55.6%) |
| Single Unit, Attached | 0 (0.0%) | 0 (0.0%) |
| 2 Unit Apartments | 0 (0.0%) | 0 (0.0%) |
| 3 or 4 Unit Apartments | 0 (0.0%) | 0 (0.0%) |
| 5 to 9 Unit Apartments | 0 (0.0%) | 0 (0.0%) |
| 10 or more Apartments | 0 (0.0%) | 0 (0.0%) |
| Mobile Home / Other | 40 (87.0%) | 6 (13.0%) |
| Total | 60 (65.9%) | 31 (34.1%) |
Housing Structures by Number of Rooms in Ellenton
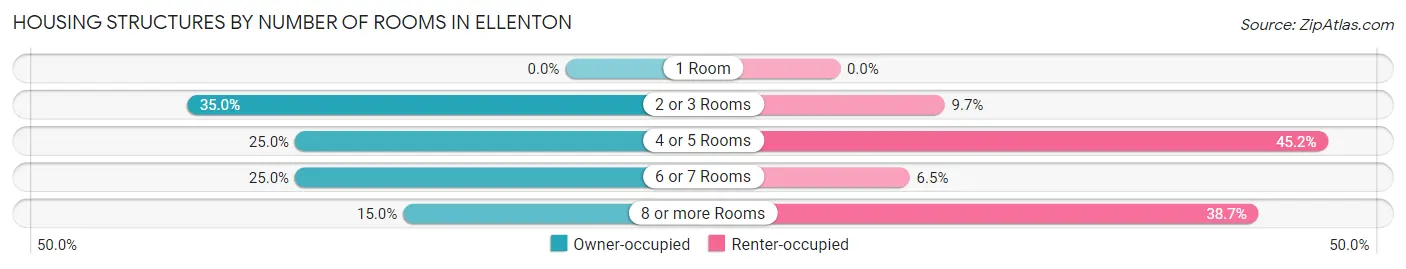
| Number of Rooms | Owner-occupied | Renter-occupied |
| 1 Room | 0 (0.0%) | 0 (0.0%) |
| 2 or 3 Rooms | 21 (35.0%) | 3 (9.7%) |
| 4 or 5 Rooms | 15 (25.0%) | 14 (45.2%) |
| 6 or 7 Rooms | 15 (25.0%) | 2 (6.5%) |
| 8 or more Rooms | 9 (15.0%) | 12 (38.7%) |
| Total | 60 (100.0%) | 31 (100.0%) |
Housing Structure by Heating Type in Ellenton
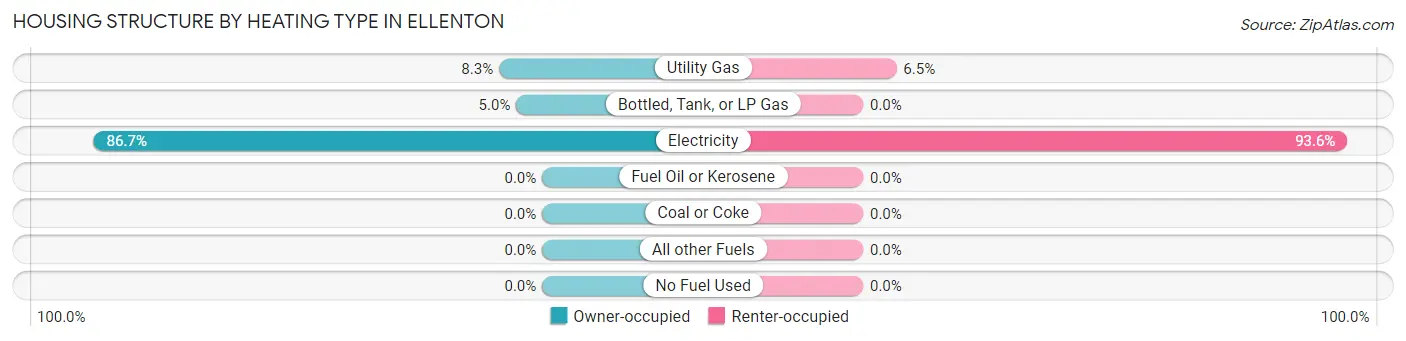
| Heating Type | Owner-occupied | Renter-occupied |
| Utility Gas | 5 (8.3%) | 2 (6.5%) |
| Bottled, Tank, or LP Gas | 3 (5.0%) | 0 (0.0%) |
| Electricity | 52 (86.7%) | 29 (93.5%) |
| Fuel Oil or Kerosene | 0 (0.0%) | 0 (0.0%) |
| Coal or Coke | 0 (0.0%) | 0 (0.0%) |
| All other Fuels | 0 (0.0%) | 0 (0.0%) |
| No Fuel Used | 0 (0.0%) | 0 (0.0%) |
| Total | 60 (100.0%) | 31 (100.0%) |
Household Vehicle Usage in Ellenton
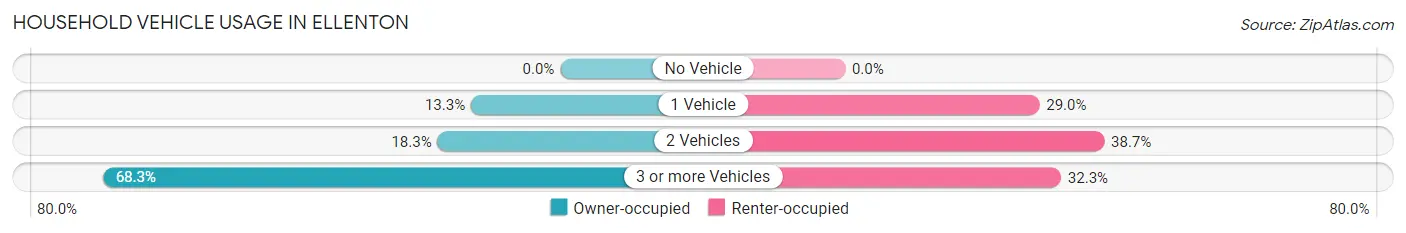
| Vehicles per Household | Owner-occupied | Renter-occupied |
| No Vehicle | 0 (0.0%) | 0 (0.0%) |
| 1 Vehicle | 8 (13.3%) | 9 (29.0%) |
| 2 Vehicles | 11 (18.3%) | 12 (38.7%) |
| 3 or more Vehicles | 41 (68.3%) | 10 (32.3%) |
| Total | 60 (100.0%) | 31 (100.0%) |
Real Estate & Mortgages in Ellenton
Real Estate and Mortgage Overview in Ellenton
| Characteristic | Without Mortgage | With Mortgage |
| Housing Units | 30 | 30 |
| Median Property Value | - | - |
| Median Household Income | $58,750 | $0 |
| Monthly Housing Costs | $419 | $0 |
| Real Estate Taxes | - | - |
Property Value by Mortgage Status in Ellenton
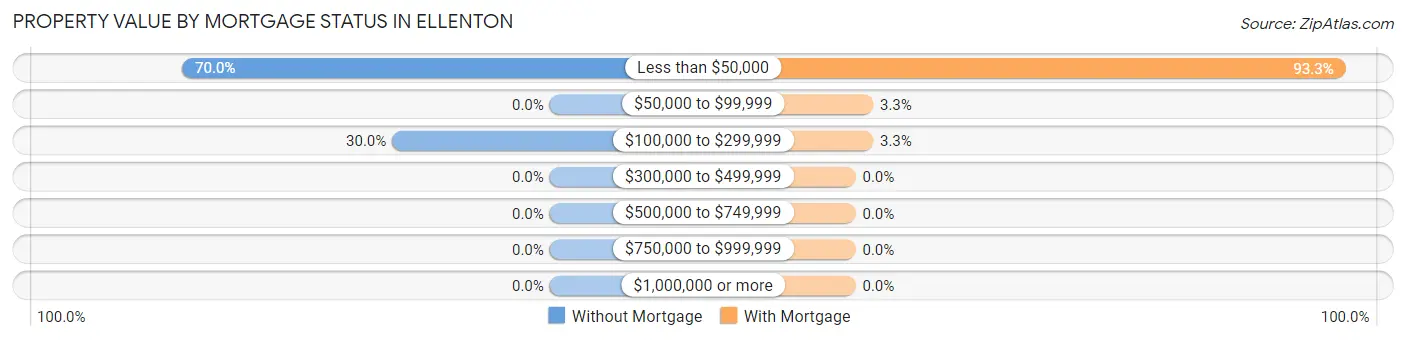
| Property Value | Without Mortgage | With Mortgage |
| Less than $50,000 | 21 (70.0%) | 28 (93.3%) |
| $50,000 to $99,999 | 0 (0.0%) | 1 (3.3%) |
| $100,000 to $299,999 | 9 (30.0%) | 1 (3.3%) |
| $300,000 to $499,999 | 0 (0.0%) | 0 (0.0%) |
| $500,000 to $749,999 | 0 (0.0%) | 0 (0.0%) |
| $750,000 to $999,999 | 0 (0.0%) | 0 (0.0%) |
| $1,000,000 or more | 0 (0.0%) | 0 (0.0%) |
| Total | 30 (100.0%) | 30 (100.0%) |
Household Income by Mortgage Status in Ellenton
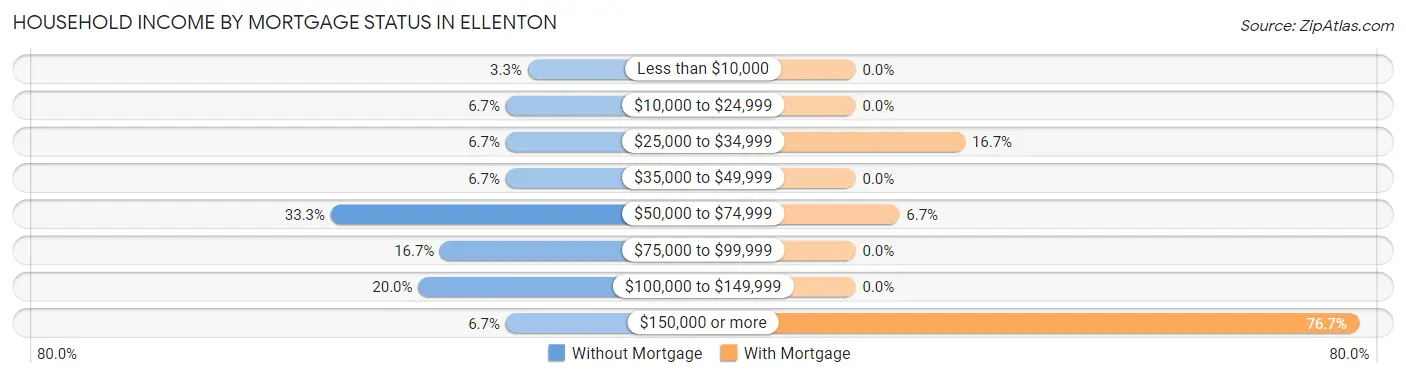
| Household Income | Without Mortgage | With Mortgage |
| Less than $10,000 | 1 (3.3%) | 0 (0.0%) |
| $10,000 to $24,999 | 2 (6.7%) | 0 (0.0%) |
| $25,000 to $34,999 | 2 (6.7%) | 5 (16.7%) |
| $35,000 to $49,999 | 2 (6.7%) | 0 (0.0%) |
| $50,000 to $74,999 | 10 (33.3%) | 2 (6.7%) |
| $75,000 to $99,999 | 5 (16.7%) | 0 (0.0%) |
| $100,000 to $149,999 | 6 (20.0%) | 0 (0.0%) |
| $150,000 or more | 2 (6.7%) | 23 (76.7%) |
| Total | 30 (100.0%) | 30 (100.0%) |
Property Value to Household Income Ratio in Ellenton
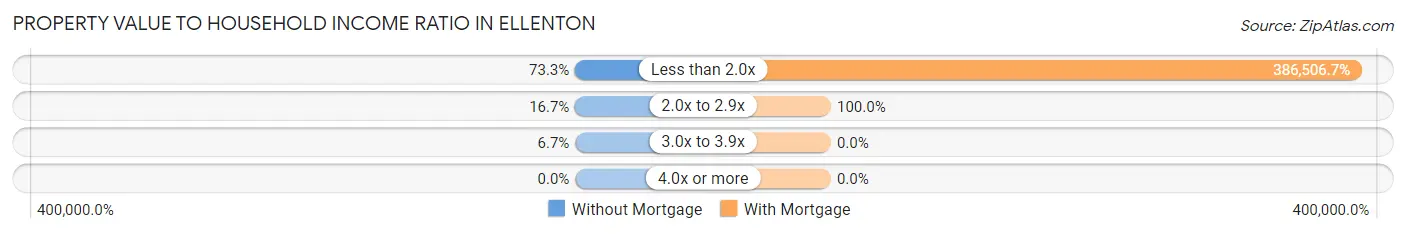
| Value-to-Income Ratio | Without Mortgage | With Mortgage |
| Less than 2.0x | 22 (73.3%) | 115,952 (386,506.7%) |
| 2.0x to 2.9x | 5 (16.7%) | 30 (100.0%) |
| 3.0x to 3.9x | 2 (6.7%) | 0 (0.0%) |
| 4.0x or more | 0 (0.0%) | 0 (0.0%) |
| Total | 30 (100.0%) | 30 (100.0%) |
Real Estate Taxes by Mortgage Status in Ellenton
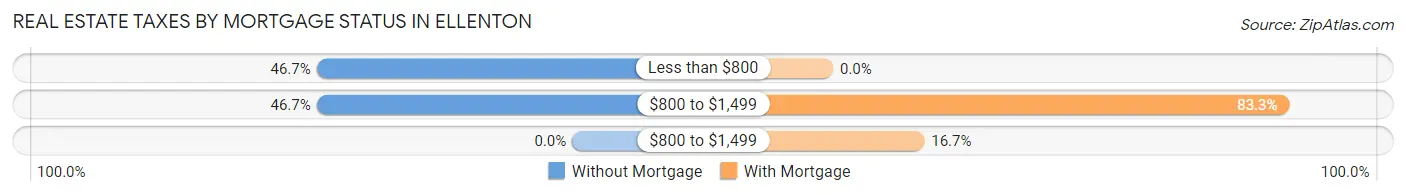
| Property Taxes | Without Mortgage | With Mortgage |
| Less than $800 | 14 (46.7%) | 0 (0.0%) |
| $800 to $1,499 | 14 (46.7%) | 25 (83.3%) |
| $800 to $1,499 | 0 (0.0%) | 5 (16.7%) |
| Total | 30 (100.0%) | 30 (100.0%) |
Health & Disability in Ellenton
Health Insurance Coverage by Age in Ellenton
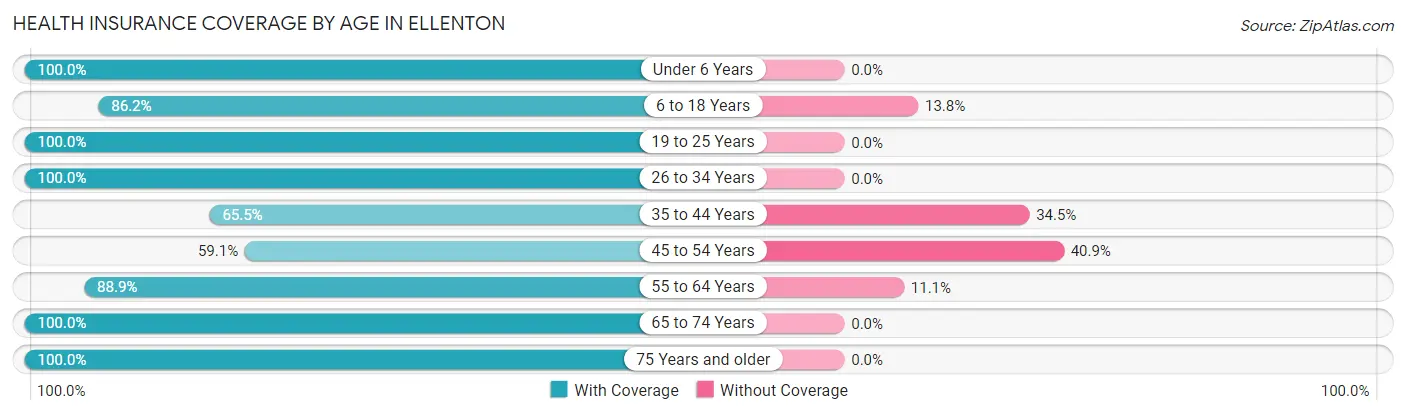
| Age Bracket | With Coverage | Without Coverage |
| Under 6 Years | 10 (100.0%) | 0 (0.0%) |
| 6 to 18 Years | 94 (86.2%) | 15 (13.8%) |
| 19 to 25 Years | 12 (100.0%) | 0 (0.0%) |
| 26 to 34 Years | 49 (100.0%) | 0 (0.0%) |
| 35 to 44 Years | 38 (65.5%) | 20 (34.5%) |
| 45 to 54 Years | 13 (59.1%) | 9 (40.9%) |
| 55 to 64 Years | 16 (88.9%) | 2 (11.1%) |
| 65 to 74 Years | 13 (100.0%) | 0 (0.0%) |
| 75 Years and older | 5 (100.0%) | 0 (0.0%) |
| Total | 250 (84.5%) | 46 (15.5%) |
Health Insurance Coverage by Citizenship Status in Ellenton
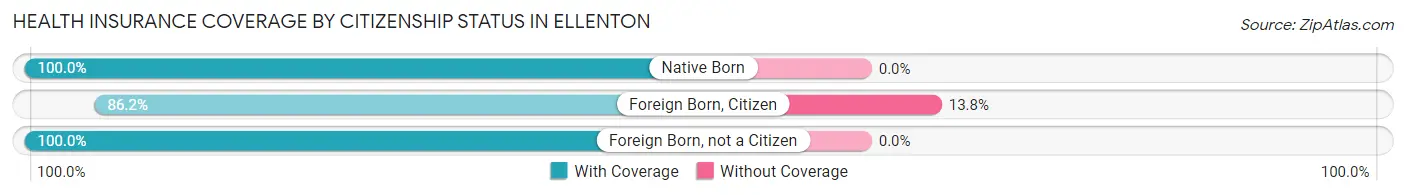
| Citizenship Status | With Coverage | Without Coverage |
| Native Born | 10 (100.0%) | 0 (0.0%) |
| Foreign Born, Citizen | 94 (86.2%) | 15 (13.8%) |
| Foreign Born, not a Citizen | 12 (100.0%) | 0 (0.0%) |
Health Insurance Coverage by Household Income in Ellenton
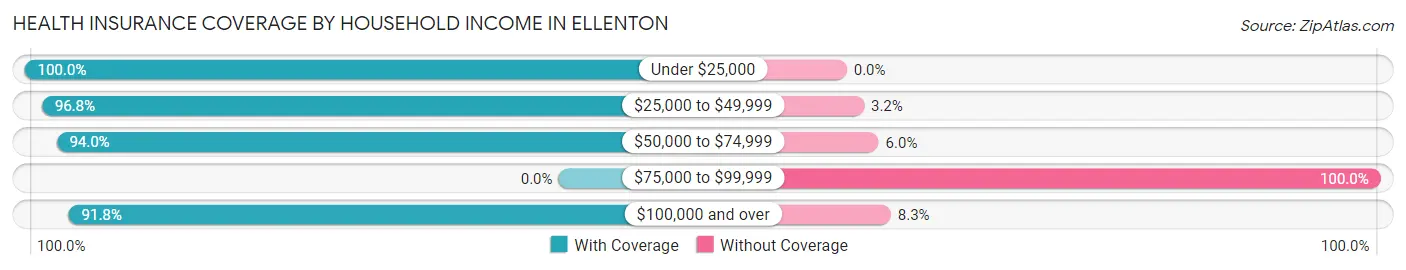
| Household Income | With Coverage | Without Coverage |
| Under $25,000 | 38 (100.0%) | 0 (0.0%) |
| $25,000 to $49,999 | 60 (96.8%) | 2 (3.2%) |
| $50,000 to $74,999 | 63 (94.0%) | 4 (6.0%) |
| $75,000 to $99,999 | 0 (0.0%) | 32 (100.0%) |
| $100,000 and over | 89 (91.7%) | 8 (8.3%) |
Public vs Private Health Insurance Coverage by Age in Ellenton
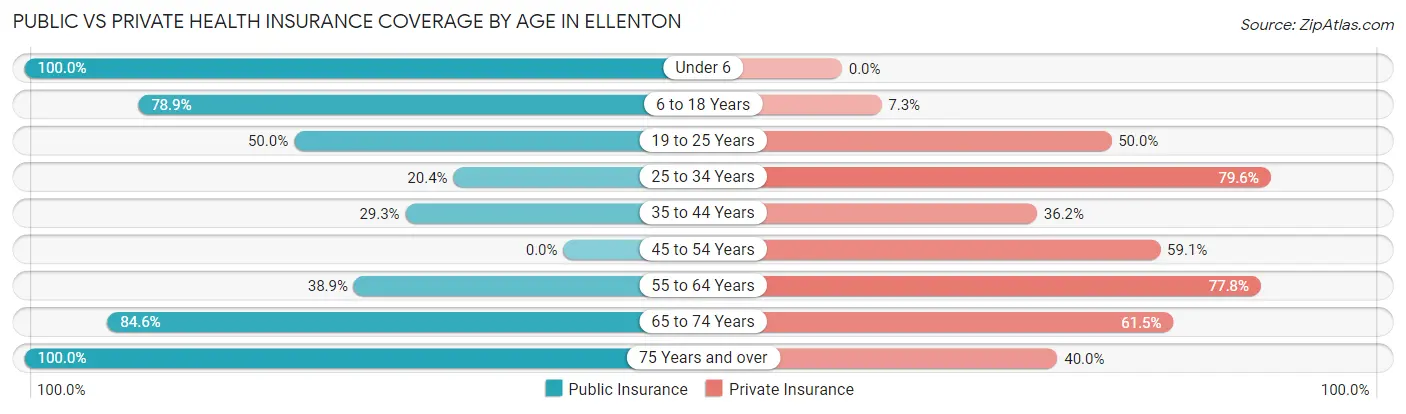
| Age Bracket | Public Insurance | Private Insurance |
| Under 6 | 10 (100.0%) | 0 (0.0%) |
| 6 to 18 Years | 86 (78.9%) | 8 (7.3%) |
| 19 to 25 Years | 6 (50.0%) | 6 (50.0%) |
| 25 to 34 Years | 10 (20.4%) | 39 (79.6%) |
| 35 to 44 Years | 17 (29.3%) | 21 (36.2%) |
| 45 to 54 Years | 0 (0.0%) | 13 (59.1%) |
| 55 to 64 Years | 7 (38.9%) | 14 (77.8%) |
| 65 to 74 Years | 11 (84.6%) | 8 (61.5%) |
| 75 Years and over | 5 (100.0%) | 2 (40.0%) |
| Total | 152 (51.3%) | 111 (37.5%) |
Disability Status by Sex by Age in Ellenton
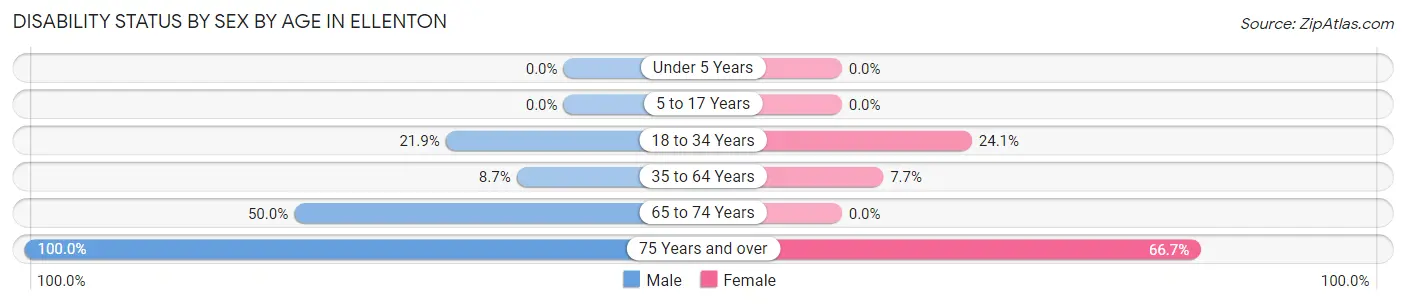
| Age Bracket | Male | Female |
| Under 5 Years | 0 (0.0%) | 0 (0.0%) |
| 5 to 17 Years | 0 (0.0%) | 0 (0.0%) |
| 18 to 34 Years | 7 (21.9%) | 7 (24.1%) |
| 35 to 64 Years | 4 (8.7%) | 4 (7.7%) |
| 65 to 74 Years | 2 (50.0%) | 0 (0.0%) |
| 75 Years and over | 2 (100.0%) | 2 (66.7%) |
Disability Class by Sex by Age in Ellenton
Disability Class: Hearing Difficulty
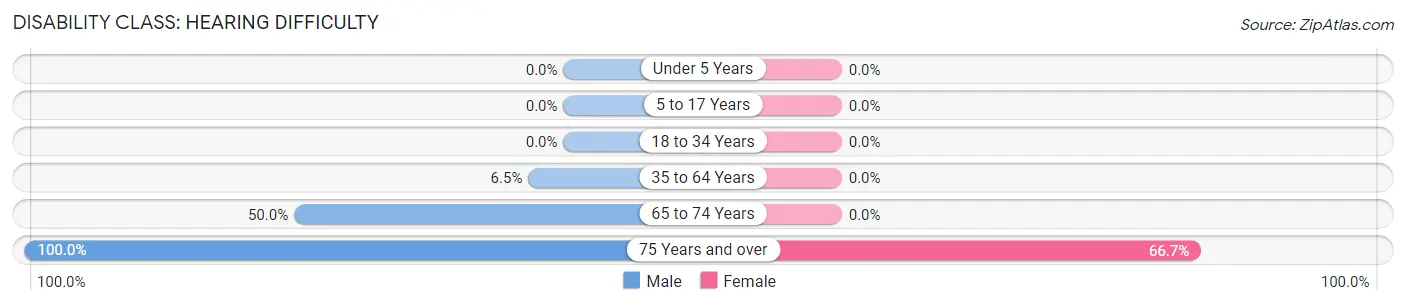
| Age Bracket | Male | Female |
| Under 5 Years | 0 (0.0%) | 0 (0.0%) |
| 5 to 17 Years | 0 (0.0%) | 0 (0.0%) |
| 18 to 34 Years | 0 (0.0%) | 0 (0.0%) |
| 35 to 64 Years | 3 (6.5%) | 0 (0.0%) |
| 65 to 74 Years | 2 (50.0%) | 0 (0.0%) |
| 75 Years and over | 2 (100.0%) | 2 (66.7%) |
Disability Class: Vision Difficulty
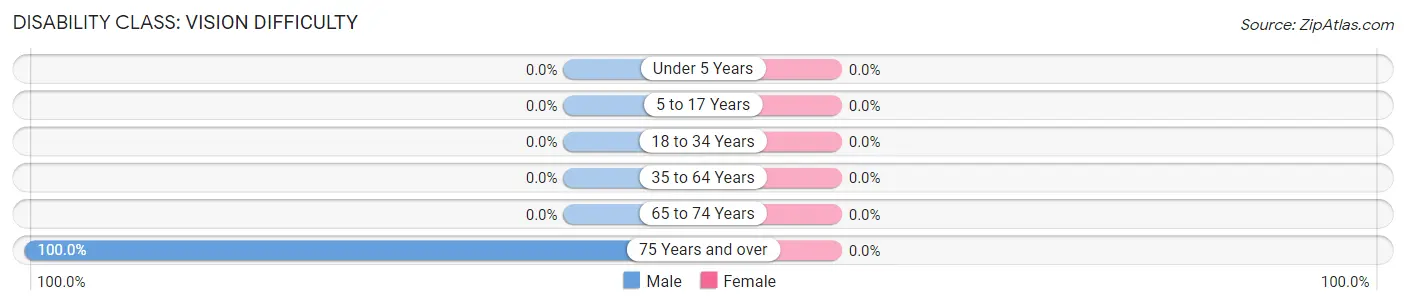
| Age Bracket | Male | Female |
| Under 5 Years | 0 (0.0%) | 0 (0.0%) |
| 5 to 17 Years | 0 (0.0%) | 0 (0.0%) |
| 18 to 34 Years | 0 (0.0%) | 0 (0.0%) |
| 35 to 64 Years | 0 (0.0%) | 0 (0.0%) |
| 65 to 74 Years | 0 (0.0%) | 0 (0.0%) |
| 75 Years and over | 2 (100.0%) | 0 (0.0%) |
Disability Class: Cognitive Difficulty
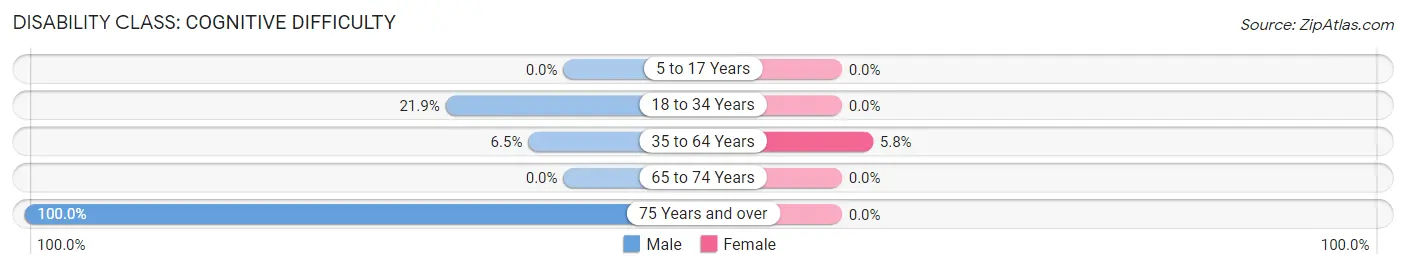
| Age Bracket | Male | Female |
| 5 to 17 Years | 0 (0.0%) | 0 (0.0%) |
| 18 to 34 Years | 7 (21.9%) | 0 (0.0%) |
| 35 to 64 Years | 3 (6.5%) | 3 (5.8%) |
| 65 to 74 Years | 0 (0.0%) | 0 (0.0%) |
| 75 Years and over | 2 (100.0%) | 0 (0.0%) |
Disability Class: Ambulatory Difficulty
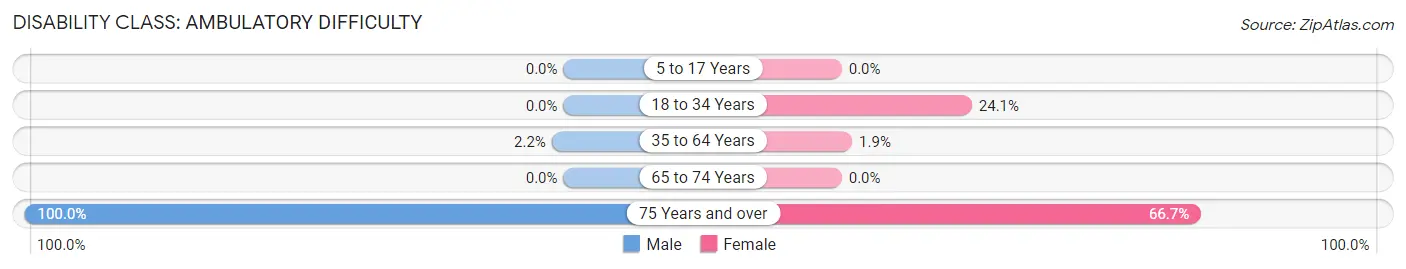
| Age Bracket | Male | Female |
| 5 to 17 Years | 0 (0.0%) | 0 (0.0%) |
| 18 to 34 Years | 0 (0.0%) | 7 (24.1%) |
| 35 to 64 Years | 1 (2.2%) | 1 (1.9%) |
| 65 to 74 Years | 0 (0.0%) | 0 (0.0%) |
| 75 Years and over | 2 (100.0%) | 2 (66.7%) |
Disability Class: Self-Care Difficulty
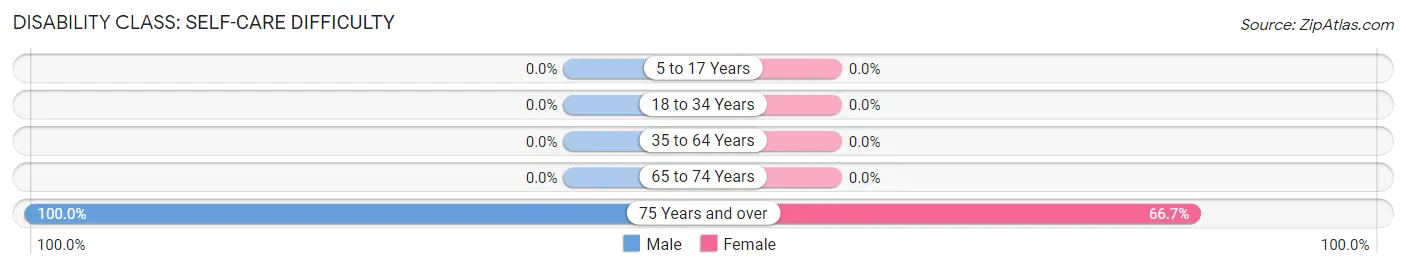
| Age Bracket | Male | Female |
| 5 to 17 Years | 0 (0.0%) | 0 (0.0%) |
| 18 to 34 Years | 0 (0.0%) | 0 (0.0%) |
| 35 to 64 Years | 0 (0.0%) | 0 (0.0%) |
| 65 to 74 Years | 0 (0.0%) | 0 (0.0%) |
| 75 Years and over | 2 (100.0%) | 2 (66.7%) |
Technology Access in Ellenton
Computing Device Access in Ellenton
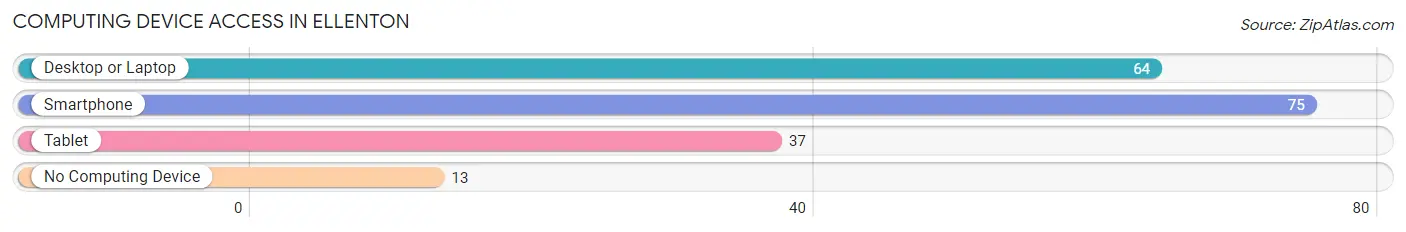
| Device Type | # Households | % Households |
| Desktop or Laptop | 64 | 70.3% |
| Smartphone | 75 | 82.4% |
| Tablet | 37 | 40.7% |
| No Computing Device | 13 | 14.3% |
| Total | 91 | 100.0% |
Internet Access in Ellenton
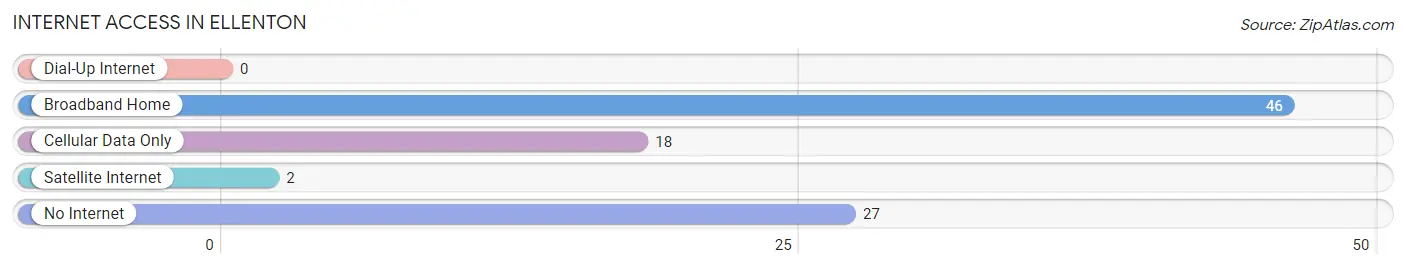
| Internet Type | # Households | % Households |
| Dial-Up Internet | 0 | 0.0% |
| Broadband Home | 46 | 50.5% |
| Cellular Data Only | 18 | 19.8% |
| Satellite Internet | 2 | 2.2% |
| No Internet | 27 | 29.7% |
| Total | 91 | 100.0% |
Ellenton Summary
Ellenton, Georgia is a small town located in the northwest corner of the state, near the Alabama border. It is part of the Chattahoochee-Oconee National Forest and is home to a population of just over 1,000 people. The town was founded in 1872 and has a rich history of farming, logging, and other rural activities.
Geography
Ellenton is located in the northwest corner of Georgia, near the Alabama border. It is part of the Chattahoochee-Oconee National Forest and is surrounded by the Chattahoochee River, the Oconee River, and the Etowah River. The town is situated on a plateau, with an elevation of about 1,000 feet above sea level. The climate is mild, with temperatures ranging from the mid-50s in the winter to the mid-80s in the summer.
Economy
The economy of Ellenton is largely based on agriculture and forestry. The town is home to several farms, which produce a variety of crops, including corn, soybeans, cotton, and peanuts. The town also has a thriving timber industry, with several sawmills and woodworking shops. In addition, Ellenton is home to several small businesses, including a grocery store, a hardware store, and a few restaurants.
Demographics
As of the 2010 census, Ellenton had a population of 1,072 people. The racial makeup of the town was 94.3% White, 2.7% African American, 0.3% Native American, 0.2% Asian, 0.1% Pacific Islander, and 2.4% from other races. The median household income was $30,938, and the median family income was $37,813. The per capita income was $17,845.
Conclusion
Ellenton, Georgia is a small town with a rich history and a vibrant economy. It is home to a diverse population and is surrounded by the beauty of the Chattahoochee-Oconee National Forest. The town is a great place to live and work, and its residents enjoy a high quality of life.
Common Questions
What is Per Capita Income in Ellenton?
Per Capita income in Ellenton is $19,991.
What is the Median Household income in Ellenton?
Median Household Income in Ellenton is $52,019.
What is Inequality or Gini Index in Ellenton?
Inequality or Gini Index in Ellenton is 0.37.
What is the Total Population of Ellenton?
Total Population of Ellenton is 296.
What is the Total Male Population of Ellenton?
Total Male Population of Ellenton is 138.
What is the Total Female Population of Ellenton?
Total Female Population of Ellenton is 158.
What is the Ratio of Males per 100 Females in Ellenton?
There are 87.34 Males per 100 Females in Ellenton.
What is the Ratio of Females per 100 Males in Ellenton?
There are 114.49 Females per 100 Males in Ellenton.
What is the Median Population Age in Ellenton?
Median Population Age in Ellenton is 27.8 Years.
What is the Average Family Size in Ellenton
Average Family Size in Ellenton is 3.6 People.
What is the Average Household Size in Ellenton
Average Household Size in Ellenton is 3.2 People.
How Large is the Labor Force in Ellenton?
There are 131 People in the Labor Forcein in Ellenton.
What is the Percentage of People in the Labor Force in Ellenton?
68.2% of People are in the Labor Force in Ellenton.
What is the Unemployment Rate in Ellenton?
Unemployment Rate in Ellenton is 4.6%.