Lumpkin, GA Map & Demographics
Lumpkin Map
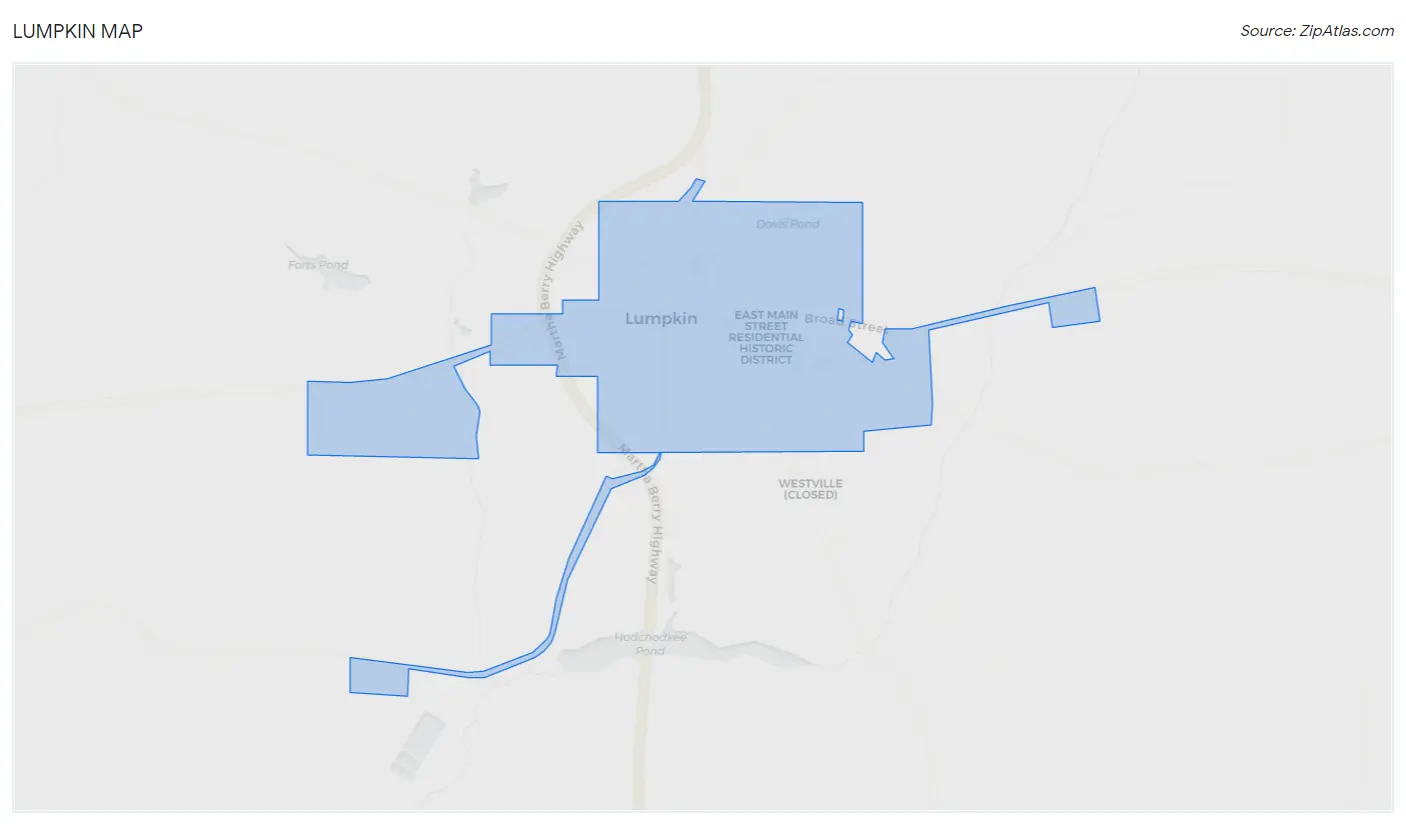
Lumpkin Overview
$23,710
PER CAPITA INCOME
$44,659
AVG FAMILY INCOME
$31,250
AVG HOUSEHOLD INCOME
$4,897
FAMILY INCOME DEFICIT
0.42
INEQUALITY / GINI INDEX
776
TOTAL POPULATION
416
MALE POPULATION
360
FEMALE POPULATION
115.56
MALES / 100 FEMALES
86.54
FEMALES / 100 MALES
34.5
MEDIAN AGE
3.3
AVG FAMILY SIZE
1.9
AVG HOUSEHOLD SIZE
360
LABOR FORCE [ PEOPLE ]
53.7%
PERCENT IN LABOR FORCE
Lumpkin Zip Codes
Lumpkin Area Codes
Income in Lumpkin
Income Overview in Lumpkin
Per Capita Income in Lumpkin is $23,710, while median incomes of families and households are $44,659 and $31,250 respectively.
| Characteristic | Number | Measure |
| Per Capita Income | 776 | $23,710 |
| Median Family Income | 154 | $44,659 |
| Mean Family Income | 154 | $55,101 |
| Median Household Income | 420 | $31,250 |
| Mean Household Income | 420 | $40,961 |
| Income Deficit | 154 | $4,897 |
| Wage / Income Gap (%) | 776 | 0.00% |
| Wage / Income Gap ($) | 776 | 100.00¢ per $1 |
| Gini / Inequality Index | 776 | 0.42 |
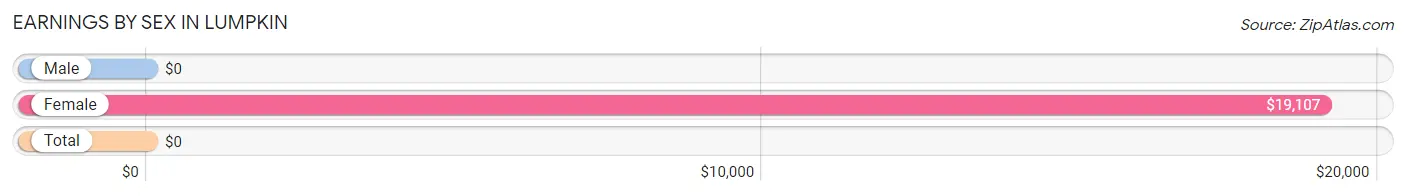
Earnings by Sex in Lumpkin
| Sex | Number | Average Earnings |
| Male | 250 (57.3%) | $0 |
| Female | 186 (42.7%) | $19,107 |
| Total | 436 (100.0%) | $0 |
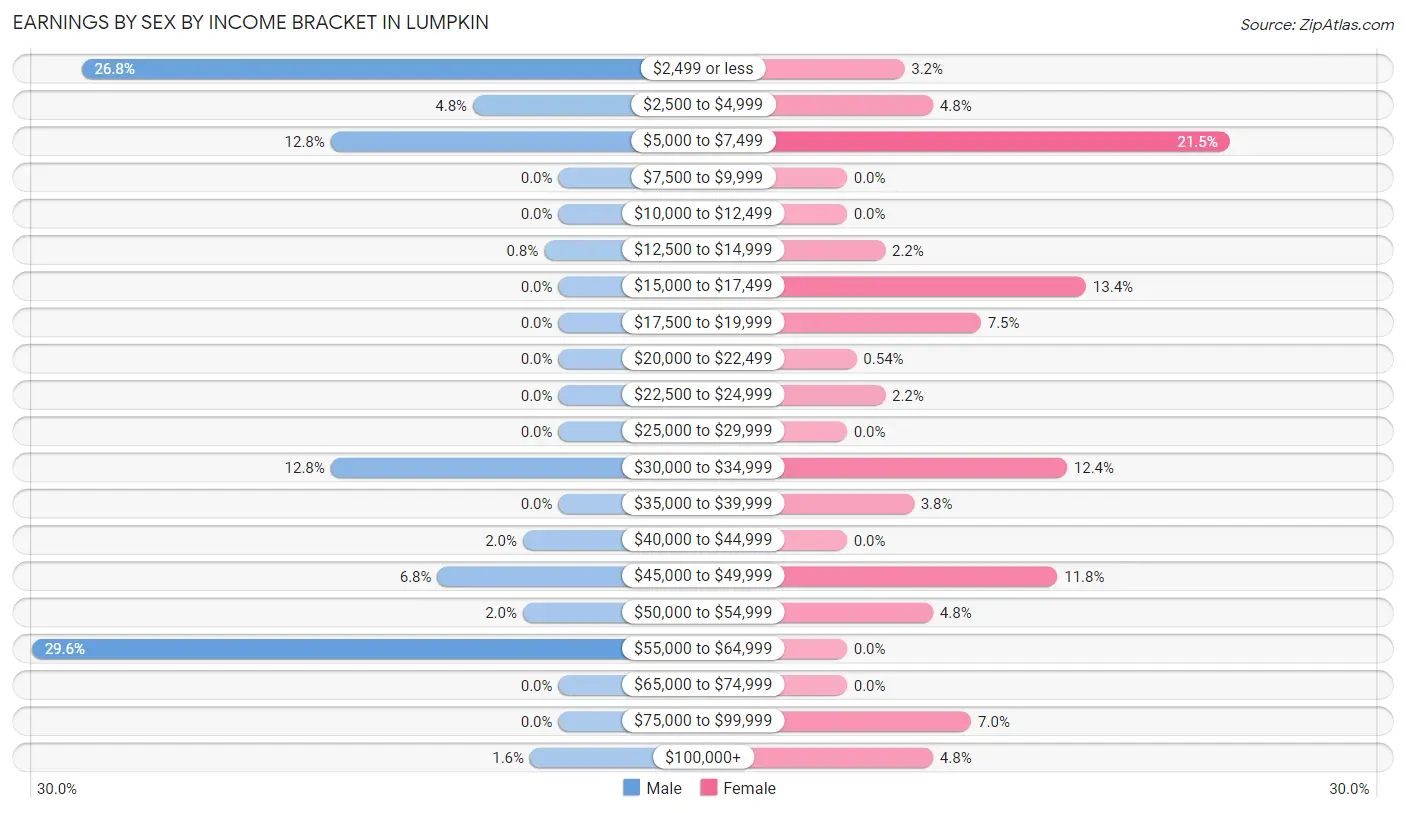
Earnings by Sex by Income Bracket in Lumpkin
The most common earnings brackets in Lumpkin are $55,000 to $64,999 for men (74 | 29.6%) and $5,000 to $7,499 for women (40 | 21.5%).
| Income | Male | Female |
| $2,499 or less | 67 (26.8%) | 6 (3.2%) |
| $2,500 to $4,999 | 12 (4.8%) | 9 (4.8%) |
| $5,000 to $7,499 | 32 (12.8%) | 40 (21.5%) |
| $7,500 to $9,999 | 0 (0.0%) | 0 (0.0%) |
| $10,000 to $12,499 | 0 (0.0%) | 0 (0.0%) |
| $12,500 to $14,999 | 2 (0.8%) | 4 (2.1%) |
| $15,000 to $17,499 | 0 (0.0%) | 25 (13.4%) |
| $17,500 to $19,999 | 0 (0.0%) | 14 (7.5%) |
| $20,000 to $22,499 | 0 (0.0%) | 1 (0.5%) |
| $22,500 to $24,999 | 0 (0.0%) | 4 (2.1%) |
| $25,000 to $29,999 | 0 (0.0%) | 0 (0.0%) |
| $30,000 to $34,999 | 32 (12.8%) | 23 (12.4%) |
| $35,000 to $39,999 | 0 (0.0%) | 7 (3.8%) |
| $40,000 to $44,999 | 5 (2.0%) | 0 (0.0%) |
| $45,000 to $49,999 | 17 (6.8%) | 22 (11.8%) |
| $50,000 to $54,999 | 5 (2.0%) | 9 (4.8%) |
| $55,000 to $64,999 | 74 (29.6%) | 0 (0.0%) |
| $65,000 to $74,999 | 0 (0.0%) | 0 (0.0%) |
| $75,000 to $99,999 | 0 (0.0%) | 13 (7.0%) |
| $100,000+ | 4 (1.6%) | 9 (4.8%) |
| Total | 250 (100.0%) | 186 (100.0%) |
Earnings by Sex by Educational Attainment in Lumpkin
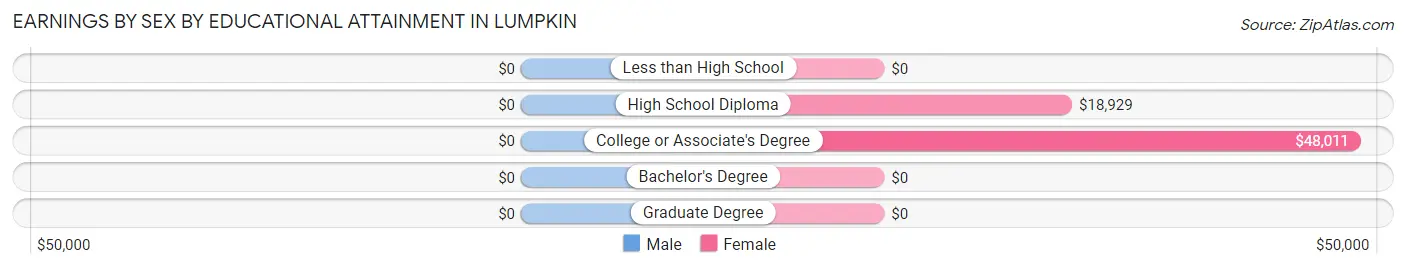
| Educational Attainment | Male Income | Female Income |
| Less than High School | - | - |
| High School Diploma | - | - |
| College or Associate's Degree | - | - |
| Bachelor's Degree | - | - |
| Graduate Degree | - | - |
| Total | - | - |
Family Income in Lumpkin
Family Income Brackets in Lumpkin
According to the Lumpkin family income data, there are 47 families falling into the $35,000 to $49,999 income range, which is the most common income bracket and makes up 30.5% of all families.
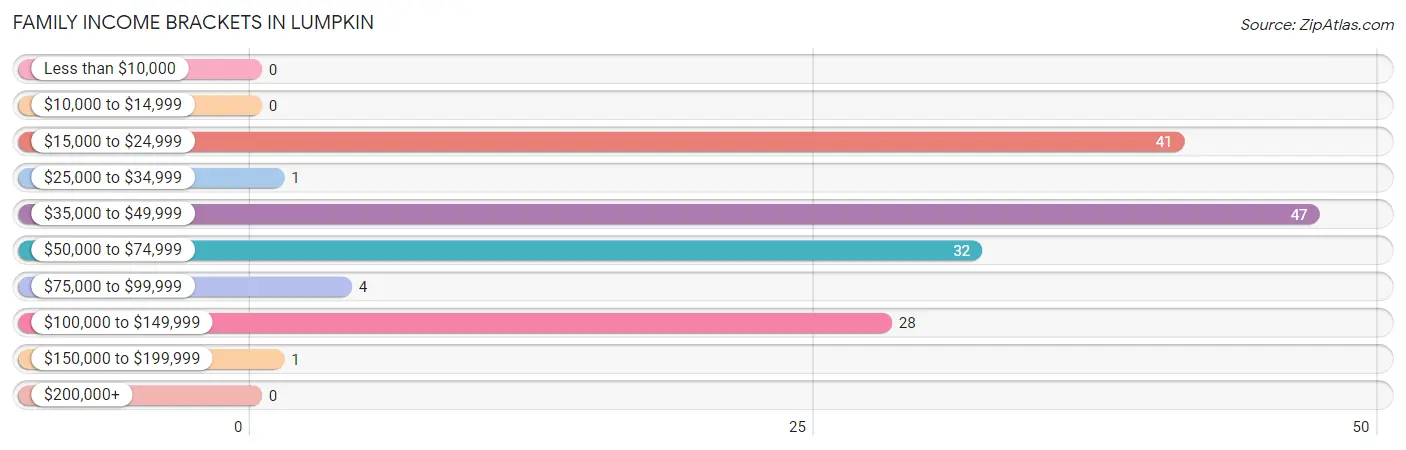
| Income Bracket | # Families | % Families |
| Less than $10,000 | 0 | 0.0% |
| $10,000 to $14,999 | 0 | 0.0% |
| $15,000 to $24,999 | 41 | 26.6% |
| $25,000 to $34,999 | 1 | 0.6% |
| $35,000 to $49,999 | 47 | 30.5% |
| $50,000 to $74,999 | 32 | 20.8% |
| $75,000 to $99,999 | 4 | 2.6% |
| $100,000 to $149,999 | 28 | 18.2% |
| $150,000 to $199,999 | 1 | 0.6% |
| $200,000+ | 0 | 0.0% |
Family Income by Famaliy Size in Lumpkin
2-person families (44 | 28.6%) account for the highest median family income in Lumpkin with $117,083 per family, while 2-person families (44 | 28.6%) have the highest median income of $58,542 per family member.
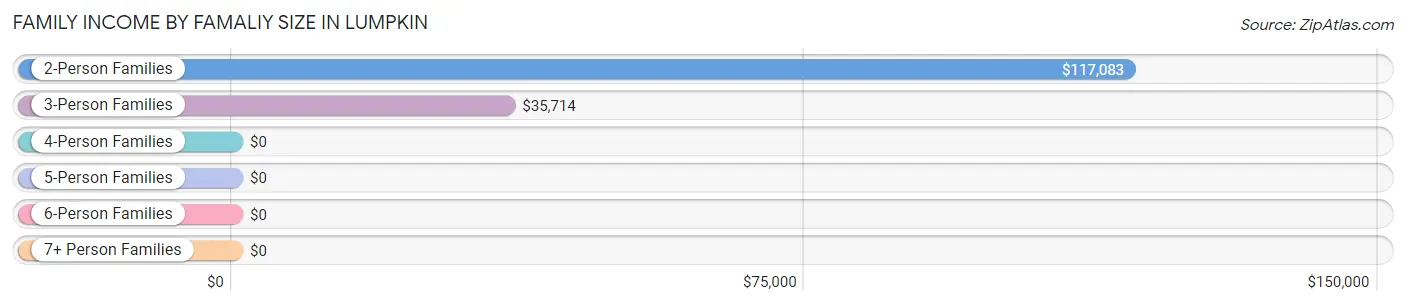
| Income Bracket | # Families | Median Income |
| 2-Person Families | 44 (28.6%) | $117,083 |
| 3-Person Families | 90 (58.4%) | $35,714 |
| 4-Person Families | 18 (11.7%) | $0 |
| 5-Person Families | 1 (0.6%) | $0 |
| 6-Person Families | 1 (0.6%) | $0 |
| 7+ Person Families | 0 (0.0%) | $0 |
| Total | 154 (100.0%) | $44,659 |
Family Income by Number of Earners in Lumpkin
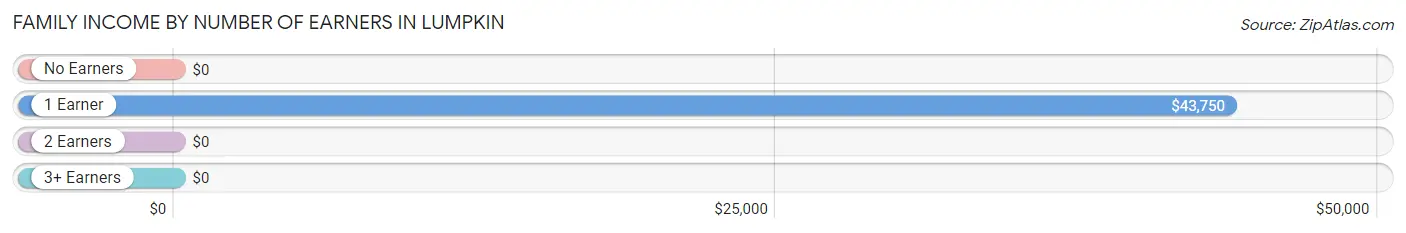
| Number of Earners | # Families | Median Income |
| No Earners | 28 (18.2%) | $0 |
| 1 Earner | 74 (48.0%) | $43,750 |
| 2 Earners | 51 (33.1%) | $0 |
| 3+ Earners | 1 (0.6%) | $0 |
| Total | 154 (100.0%) | $44,659 |
Household Income in Lumpkin
Household Income Brackets in Lumpkin
With 102 households falling in the category, the $10,000 to $14,999 income range is the most frequent in Lumpkin, accounting for 24.3% of all households.
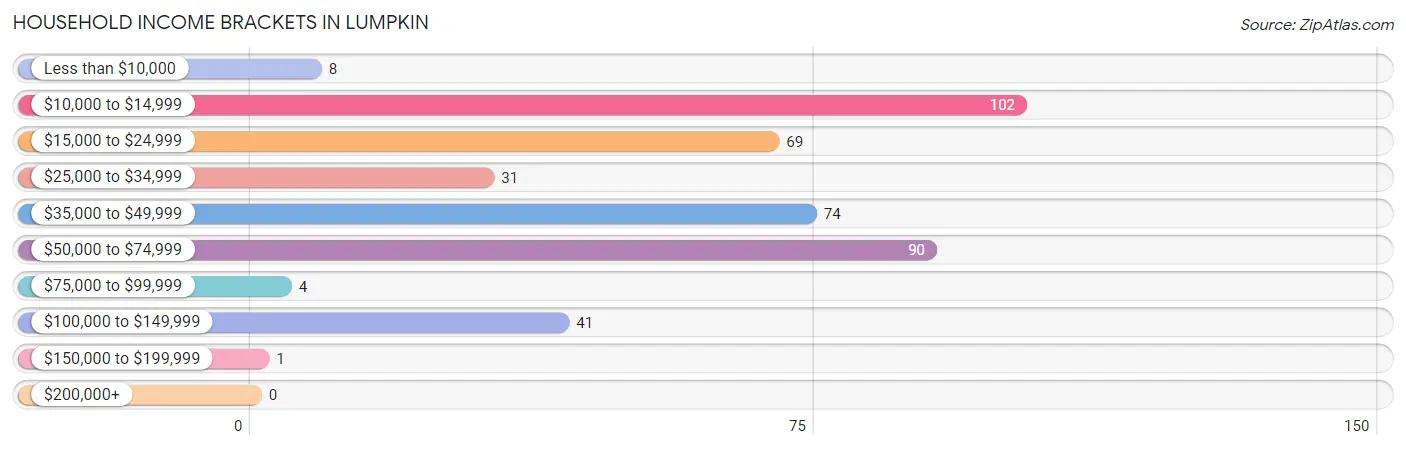
| Income Bracket | # Households | % Households |
| Less than $10,000 | 8 | 1.9% |
| $10,000 to $14,999 | 102 | 24.3% |
| $15,000 to $24,999 | 69 | 16.4% |
| $25,000 to $34,999 | 31 | 7.4% |
| $35,000 to $49,999 | 74 | 17.6% |
| $50,000 to $74,999 | 90 | 21.4% |
| $75,000 to $99,999 | 4 | 1.0% |
| $100,000 to $149,999 | 41 | 9.8% |
| $150,000 to $199,999 | 1 | 0.2% |
| $200,000+ | 0 | 0.0% |
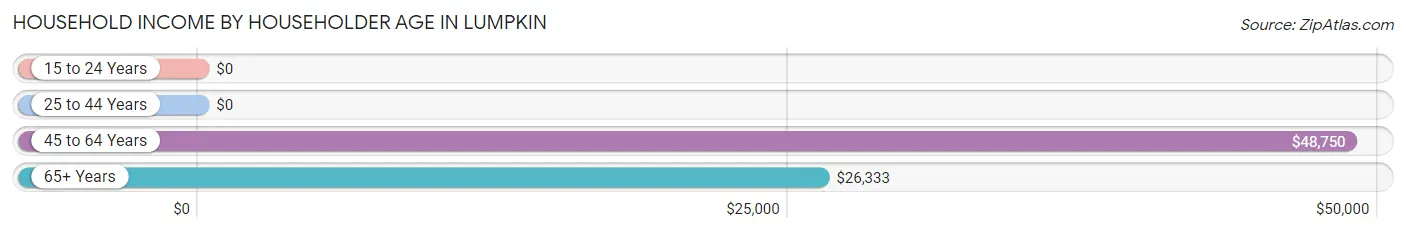
Household Income by Householder Age in Lumpkin
The median household income in Lumpkin is $31,250, with the highest median household income of $48,750 found in the 45 to 64 years age bracket for the primary householder. A total of 94 households (22.4%) fall into this category.
| Income Bracket | # Households | Median Income |
| 15 to 24 Years | 0 (0.0%) | $0 |
| 25 to 44 Years | 202 (48.1%) | $0 |
| 45 to 64 Years | 94 (22.4%) | $48,750 |
| 65+ Years | 124 (29.5%) | $26,333 |
| Total | 420 (100.0%) | $31,250 |
Poverty in Lumpkin
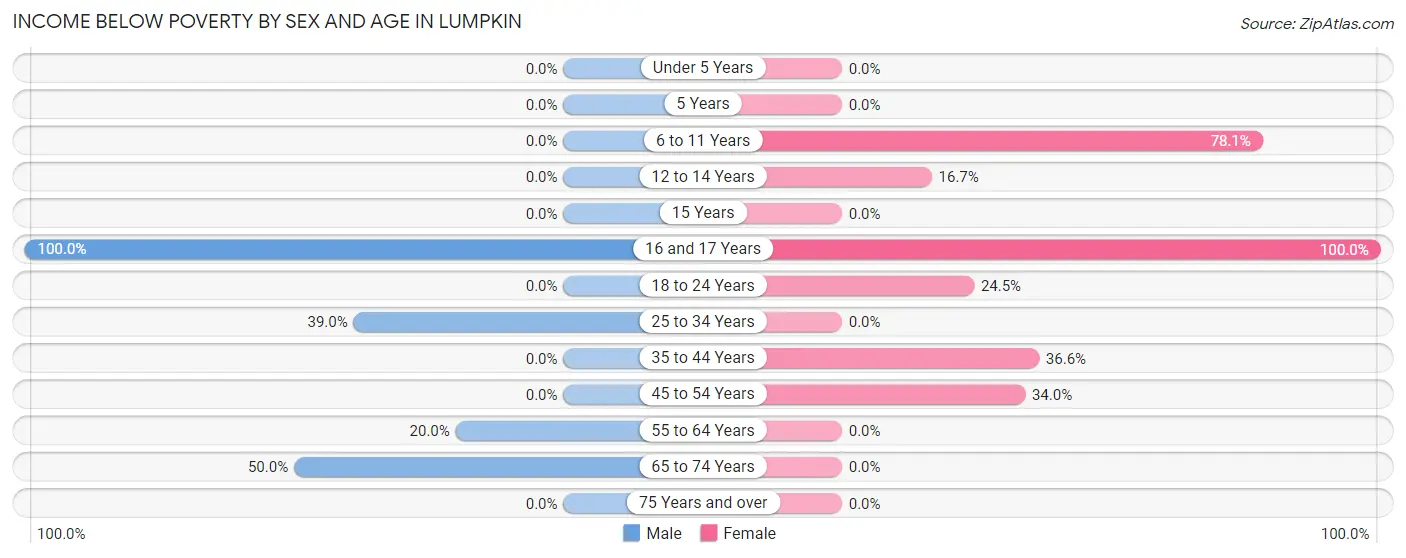
Income Below Poverty by Sex and Age in Lumpkin
With 26.2% poverty level for males and 23.6% for females among the residents of Lumpkin, 16 and 17 year old males and 16 and 17 year old females are the most vulnerable to poverty, with 1 males (100.0%) and 13 females (100.0%) in their respective age groups living below the poverty level.
| Age Bracket | Male | Female |
| Under 5 Years | 0 (0.0%) | 0 (0.0%) |
| 5 Years | 0 (0.0%) | 0 (0.0%) |
| 6 to 11 Years | 0 (0.0%) | 25 (78.1%) |
| 12 to 14 Years | 0 (0.0%) | 2 (16.7%) |
| 15 Years | 0 (0.0%) | 0 (0.0%) |
| 16 and 17 Years | 1 (100.0%) | 13 (100.0%) |
| 18 to 24 Years | 0 (0.0%) | 13 (24.5%) |
| 25 to 34 Years | 67 (39.0%) | 0 (0.0%) |
| 35 to 44 Years | 0 (0.0%) | 15 (36.6%) |
| 45 to 54 Years | 0 (0.0%) | 17 (34.0%) |
| 55 to 64 Years | 9 (20.0%) | 0 (0.0%) |
| 65 to 74 Years | 32 (50.0%) | 0 (0.0%) |
| 75 Years and over | 0 (0.0%) | 0 (0.0%) |
| Total | 109 (26.2%) | 85 (23.6%) |
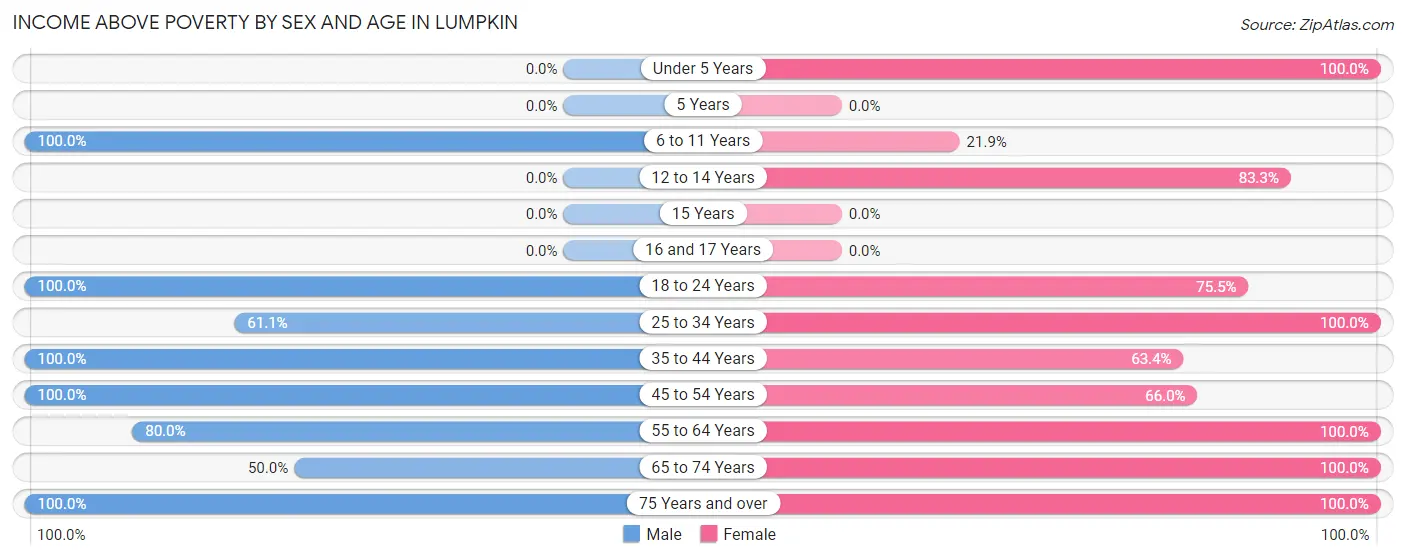
Income Above Poverty by Sex and Age in Lumpkin
According to the poverty statistics in Lumpkin, males aged 6 to 11 years and females aged under 5 years are the age groups that are most secure financially, with 100.0% of males and 100.0% of females in these age groups living above the poverty line.
| Age Bracket | Male | Female |
| Under 5 Years | 0 (0.0%) | 15 (100.0%) |
| 5 Years | 0 (0.0%) | 0 (0.0%) |
| 6 to 11 Years | 46 (100.0%) | 7 (21.9%) |
| 12 to 14 Years | 0 (0.0%) | 10 (83.3%) |
| 15 Years | 0 (0.0%) | 0 (0.0%) |
| 16 and 17 Years | 0 (0.0%) | 0 (0.0%) |
| 18 to 24 Years | 10 (100.0%) | 40 (75.5%) |
| 25 to 34 Years | 105 (61.1%) | 60 (100.0%) |
| 35 to 44 Years | 21 (100.0%) | 26 (63.4%) |
| 45 to 54 Years | 22 (100.0%) | 33 (66.0%) |
| 55 to 64 Years | 36 (80.0%) | 33 (100.0%) |
| 65 to 74 Years | 32 (50.0%) | 43 (100.0%) |
| 75 Years and over | 35 (100.0%) | 8 (100.0%) |
| Total | 307 (73.8%) | 275 (76.4%) |
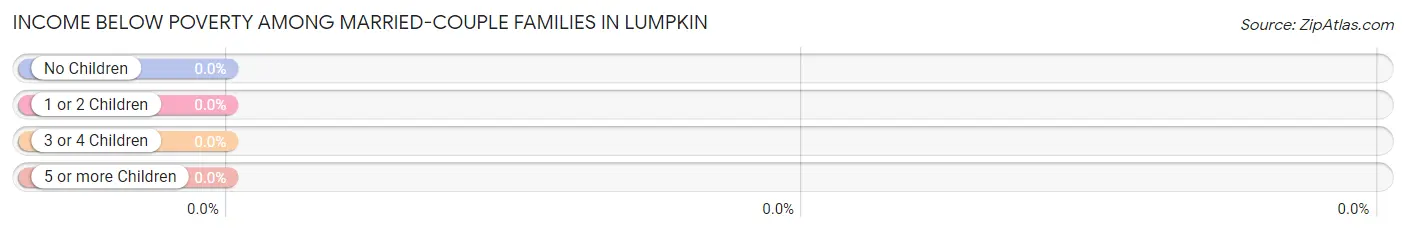
Income Below Poverty Among Married-Couple Families in Lumpkin
| Children | Above Poverty | Below Poverty |
| No Children | 76 (100.0%) | 0 (0.0%) |
| 1 or 2 Children | 9 (100.0%) | 0 (0.0%) |
| 3 or 4 Children | 0 (0.0%) | 0 (0.0%) |
| 5 or more Children | 0 (0.0%) | 0 (0.0%) |
| Total | 85 (100.0%) | 0 (0.0%) |
Income Below Poverty Among Single-Parent Households in Lumpkin
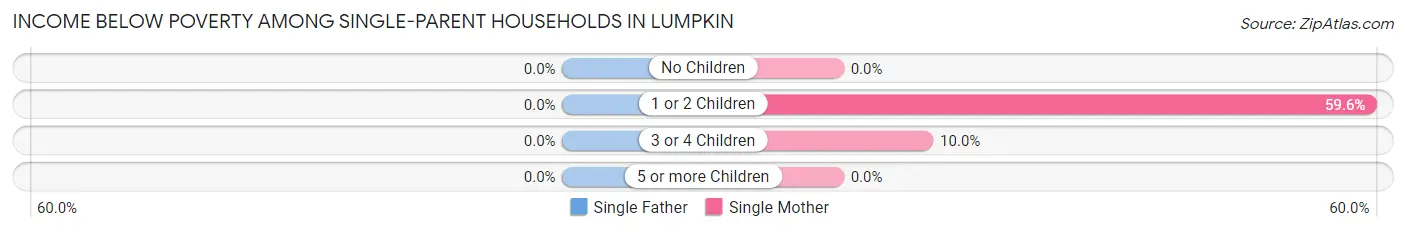
| Children | Single Father | Single Mother |
| No Children | 0 (0.0%) | 0 (0.0%) |
| 1 or 2 Children | 0 (0.0%) | 31 (59.6%) |
| 3 or 4 Children | 0 (0.0%) | 1 (10.0%) |
| 5 or more Children | 0 (0.0%) | 0 (0.0%) |
| Total | 0 (0.0%) | 32 (47.8%) |
Income Below Poverty Among Married-Couple vs Single-Parent Households in Lumpkin
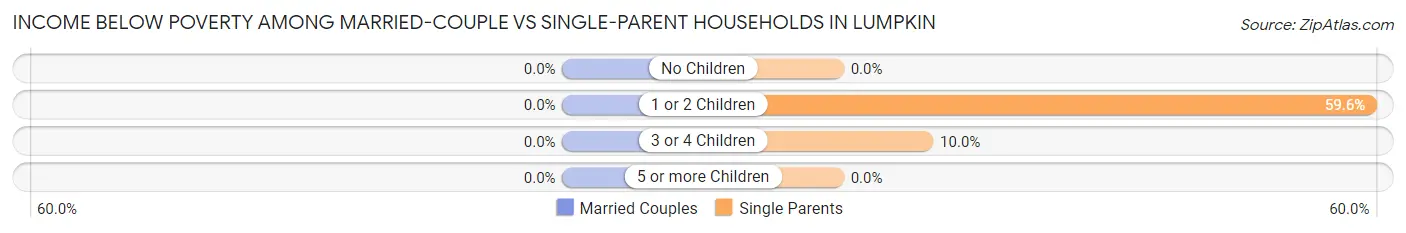
| Children | Married-Couple Families | Single-Parent Households |
| No Children | 0 (0.0%) | 0 (0.0%) |
| 1 or 2 Children | 0 (0.0%) | 31 (59.6%) |
| 3 or 4 Children | 0 (0.0%) | 1 (10.0%) |
| 5 or more Children | 0 (0.0%) | 0 (0.0%) |
| Total | 0 (0.0%) | 32 (46.4%) |
Race in Lumpkin
The most populous races in Lumpkin are Black / African American (577 | 74.4%), White / Caucasian (195 | 25.1%), and Hispanic or Latino (26 | 3.4%).
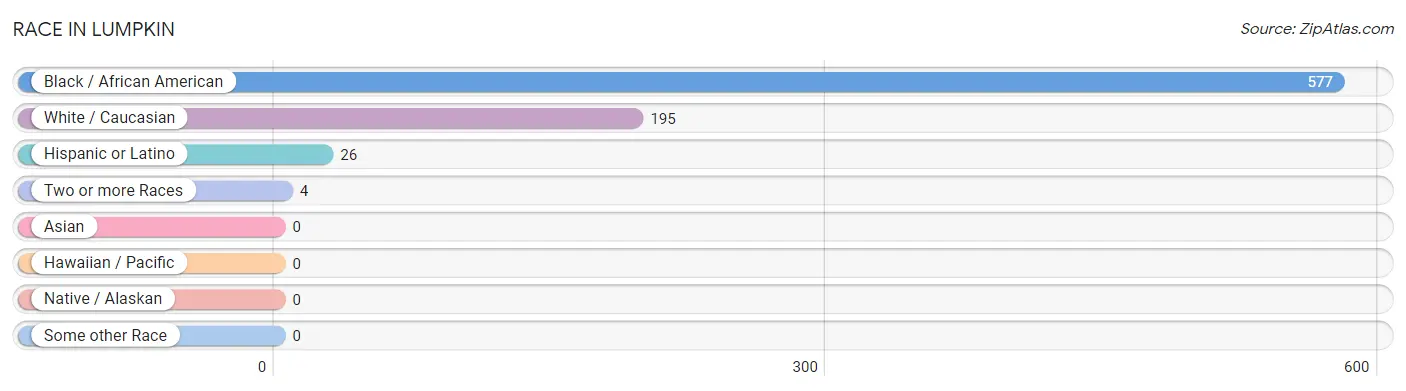
| Race | # Population | % Population |
| Asian | 0 | 0.0% |
| Black / African American | 577 | 74.4% |
| Hawaiian / Pacific | 0 | 0.0% |
| Hispanic or Latino | 26 | 3.4% |
| Native / Alaskan | 0 | 0.0% |
| White / Caucasian | 195 | 25.1% |
| Two or more Races | 4 | 0.5% |
| Some other Race | 0 | 0.0% |
| Total | 776 | 100.0% |
Ancestry in Lumpkin
The most populous ancestries reported in Lumpkin are English (95 | 12.2%), American (50 | 6.4%), Irish (37 | 4.8%), German (21 | 2.7%), and French (3 | 0.4%), together accounting for 26.6% of all Lumpkin residents.
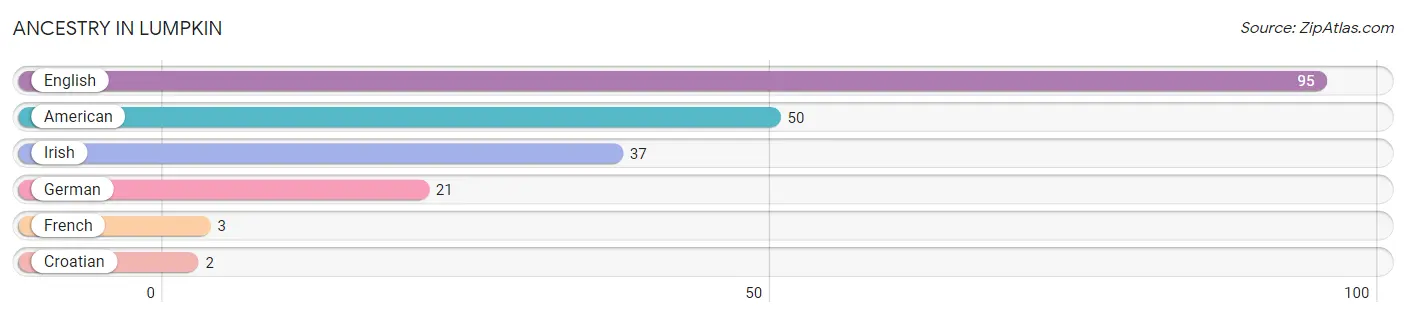
| Ancestry | # Population | % Population |
| American | 50 | 6.4% |
| Croatian | 2 | 0.3% |
| English | 95 | 12.2% |
| French | 3 | 0.4% |
| German | 21 | 2.7% |
| Irish | 37 | 4.8% | View All 6 Rows |
Immigrants in Lumpkin

| Immigration Origin | # Population | % Population | View All 0 Rows |
Sex and Age in Lumpkin
Sex and Age in Lumpkin
The most populous age groups in Lumpkin are 30 to 34 Years (105 | 25.2%) for men and 20 to 24 Years (40 | 11.1%) for women.
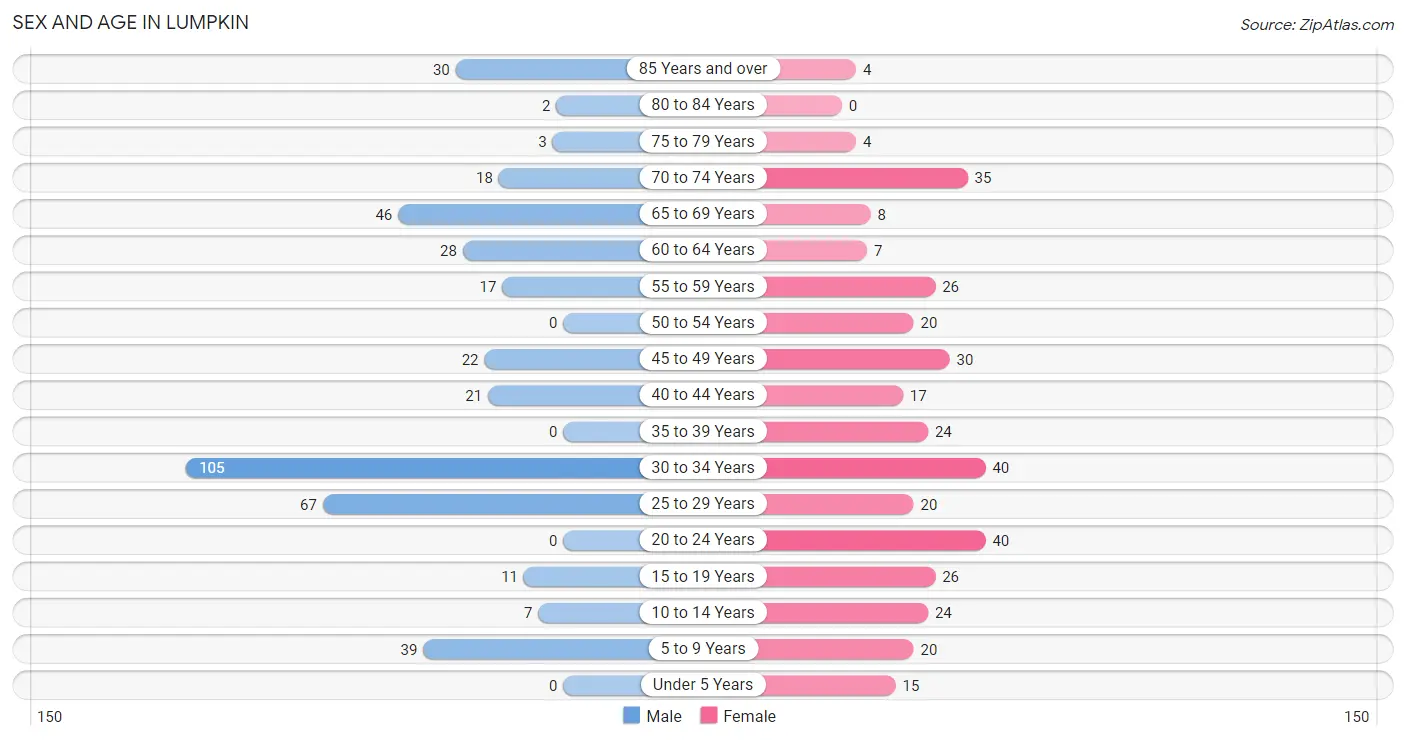
| Age Bracket | Male | Female |
| Under 5 Years | 0 (0.0%) | 15 (4.2%) |
| 5 to 9 Years | 39 (9.4%) | 20 (5.6%) |
| 10 to 14 Years | 7 (1.7%) | 24 (6.7%) |
| 15 to 19 Years | 11 (2.6%) | 26 (7.2%) |
| 20 to 24 Years | 0 (0.0%) | 40 (11.1%) |
| 25 to 29 Years | 67 (16.1%) | 20 (5.6%) |
| 30 to 34 Years | 105 (25.2%) | 40 (11.1%) |
| 35 to 39 Years | 0 (0.0%) | 24 (6.7%) |
| 40 to 44 Years | 21 (5.1%) | 17 (4.7%) |
| 45 to 49 Years | 22 (5.3%) | 30 (8.3%) |
| 50 to 54 Years | 0 (0.0%) | 20 (5.6%) |
| 55 to 59 Years | 17 (4.1%) | 26 (7.2%) |
| 60 to 64 Years | 28 (6.7%) | 7 (1.9%) |
| 65 to 69 Years | 46 (11.1%) | 8 (2.2%) |
| 70 to 74 Years | 18 (4.3%) | 35 (9.7%) |
| 75 to 79 Years | 3 (0.7%) | 4 (1.1%) |
| 80 to 84 Years | 2 (0.5%) | 0 (0.0%) |
| 85 Years and over | 30 (7.2%) | 4 (1.1%) |
| Total | 416 (100.0%) | 360 (100.0%) |
Families and Households in Lumpkin
Median Family Size in Lumpkin
The median family size in Lumpkin is 3.31 persons per family, with single female/mother families (67 | 43.5%) accounting for the largest median family size of 4.12 persons per family. On the other hand, single male/father families (2 | 1.3%) represent the smallest median family size with 2.00 persons per family.
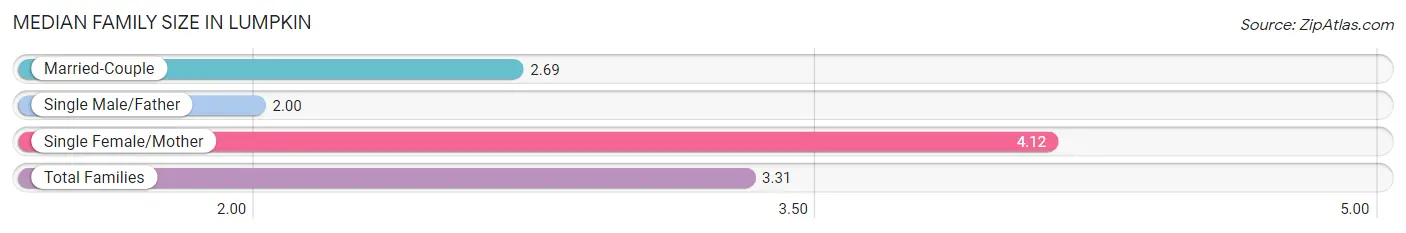
| Family Type | # Families | Family Size |
| Married-Couple | 85 (55.2%) | 2.69 |
| Single Male/Father | 2 (1.3%) | 2.00 |
| Single Female/Mother | 67 (43.5%) | 4.12 |
| Total Families | 154 (100.0%) | 3.31 |
Median Household Size in Lumpkin
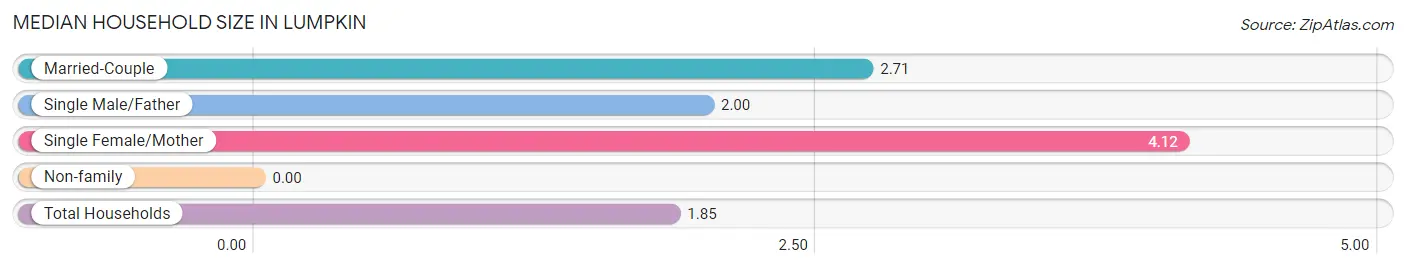
| Household Type | # Households | Household Size |
| Married-Couple | 85 (20.2%) | 2.71 |
| Single Male/Father | 2 (0.5%) | 2.00 |
| Single Female/Mother | 67 (16.0%) | 4.12 |
| Non-family | 266 (63.3%) | - |
| Total Households | 420 (100.0%) | 1.85 |
Household Size by Marriage Status in Lumpkin
Out of a total of 420 households in Lumpkin, 154 (36.7%) are family households, while 266 (63.3%) are nonfamily households. The most numerous type of family households are 3-person households, comprising 89, and the most common type of nonfamily households are 1-person households, comprising 266.
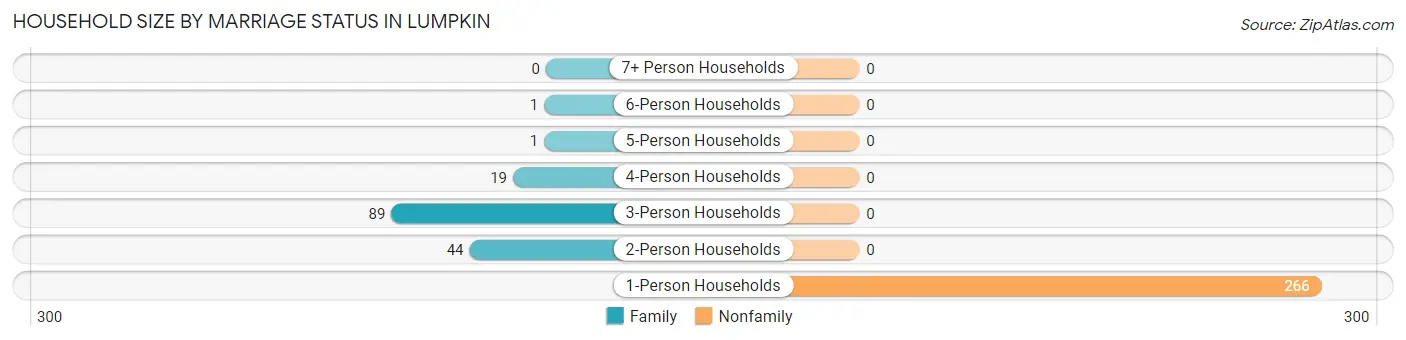
| Household Size | Family Households | Nonfamily Households |
| 1-Person Households | - | 266 (63.3%) |
| 2-Person Households | 44 (10.5%) | 0 (0.0%) |
| 3-Person Households | 89 (21.2%) | 0 (0.0%) |
| 4-Person Households | 19 (4.5%) | 0 (0.0%) |
| 5-Person Households | 1 (0.2%) | 0 (0.0%) |
| 6-Person Households | 1 (0.2%) | 0 (0.0%) |
| 7+ Person Households | 0 (0.0%) | 0 (0.0%) |
| Total | 154 (36.7%) | 266 (63.3%) |
Female Fertility in Lumpkin
Fertility by Age in Lumpkin
Average fertility rate in Lumpkin is 46.0 births per 1,000 women. Women in the age bracket of 20 to 34 years have the highest fertility rate with 90.0 births per 1,000 women. Women in the age bracket of 20 to 34 years acount for 100.0% of all women with births.
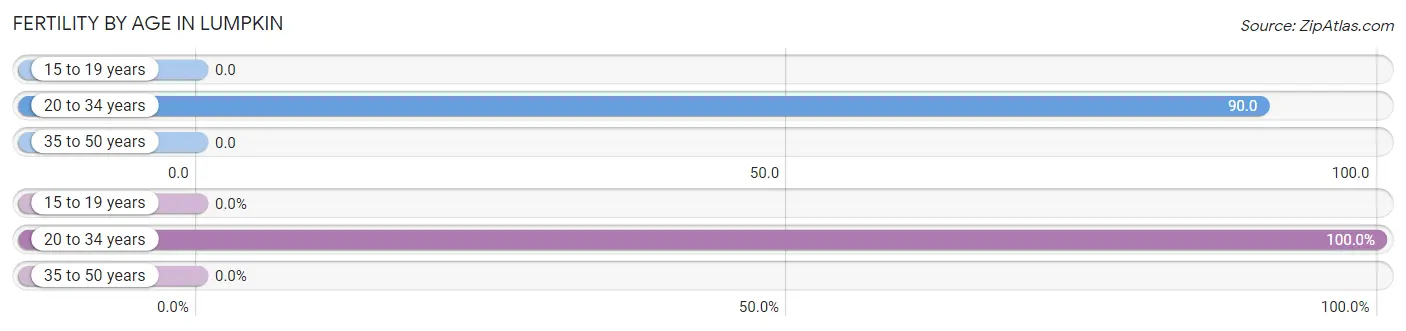
| Age Bracket | Women with Births | Births / 1,000 Women |
| 15 to 19 years | 0 (0.0%) | 0.0 |
| 20 to 34 years | 9 (100.0%) | 90.0 |
| 35 to 50 years | 0 (0.0%) | 0.0 |
| Total | 9 (100.0%) | 46.0 |
Fertility by Age by Marriage Status in Lumpkin
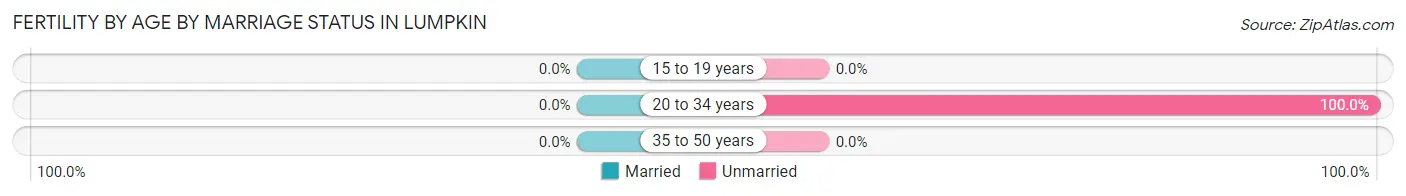
| Age Bracket | Married | Unmarried |
| 15 to 19 years | 0 (0.0%) | 0 (0.0%) |
| 20 to 34 years | 0 (0.0%) | 9 (100.0%) |
| 35 to 50 years | 0 (0.0%) | 0 (0.0%) |
| Total | 0 (0.0%) | 9 (100.0%) |
Fertility by Education in Lumpkin
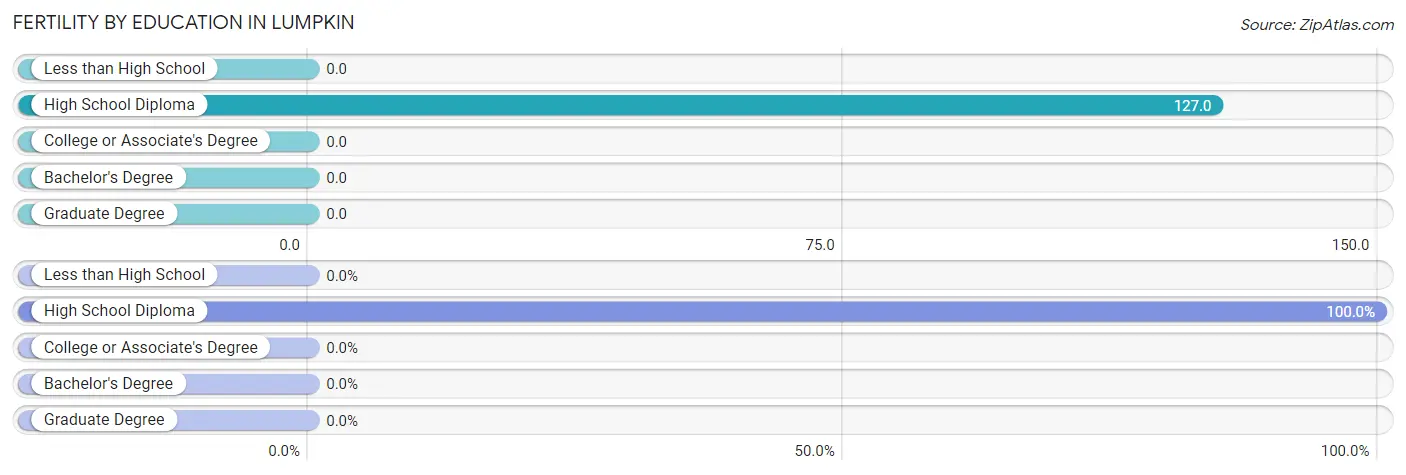
| Educational Attainment | Women with Births | Births / 1,000 Women |
| Less than High School | 0 (0.0%) | 0.0 |
| High School Diploma | 9 (100.0%) | 127.0 |
| College or Associate's Degree | 0 (0.0%) | 0.0 |
| Bachelor's Degree | 0 (0.0%) | 0.0 |
| Graduate Degree | 0 (0.0%) | 0.0 |
| Total | 9 (100.0%) | 46.0 |
Fertility by Education by Marriage Status in Lumpkin
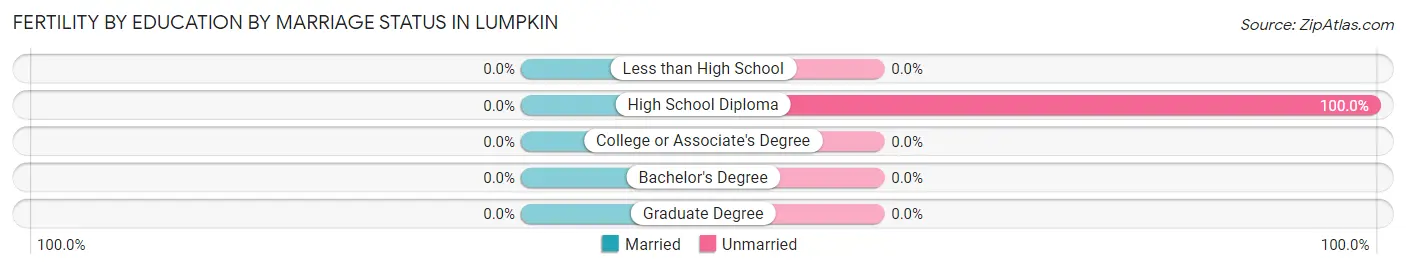
| Educational Attainment | Married | Unmarried |
| Less than High School | 0 (0.0%) | 0 (0.0%) |
| High School Diploma | 0 (0.0%) | 9 (100.0%) |
| College or Associate's Degree | 0 (0.0%) | 0 (0.0%) |
| Bachelor's Degree | 0 (0.0%) | 0 (0.0%) |
| Graduate Degree | 0 (0.0%) | 0 (0.0%) |
| Total | 0 (0.0%) | 9 (100.0%) |
Employment Characteristics in Lumpkin
Employment by Class of Employer in Lumpkin
Among the 350 employed individuals in Lumpkin, private company employees (306 | 87.4%), local government employees (30 | 8.6%), and self-employed (not incorporated) (13 | 3.7%) make up the most common classes of employment.
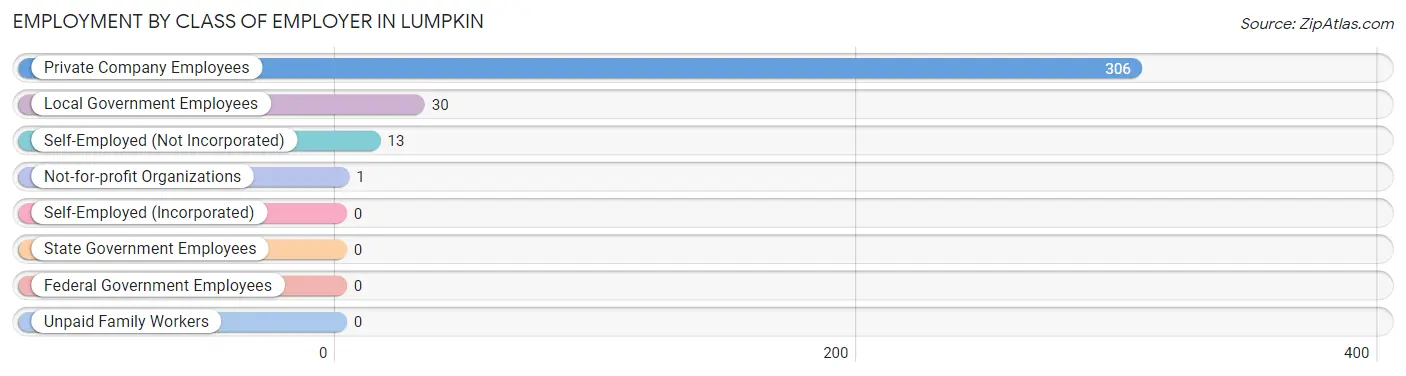
| Employer Class | # Employees | % Employees |
| Private Company Employees | 306 | 87.4% |
| Self-Employed (Incorporated) | 0 | 0.0% |
| Self-Employed (Not Incorporated) | 13 | 3.7% |
| Not-for-profit Organizations | 1 | 0.3% |
| Local Government Employees | 30 | 8.6% |
| State Government Employees | 0 | 0.0% |
| Federal Government Employees | 0 | 0.0% |
| Unpaid Family Workers | 0 | 0.0% |
| Total | 350 | 100.0% |
Employment Status by Age in Lumpkin
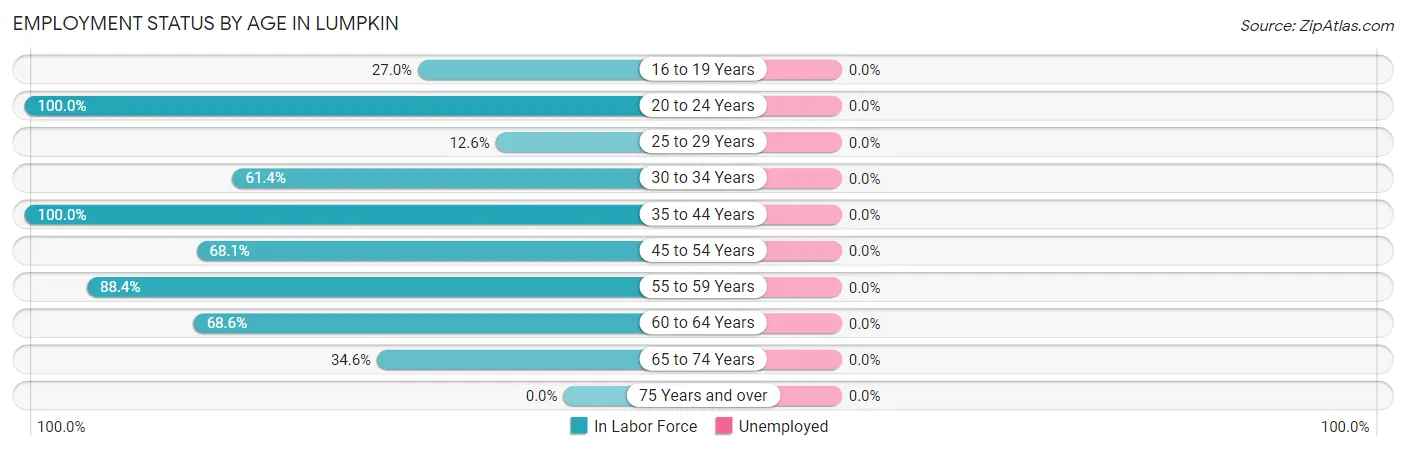
| Age Bracket | In Labor Force | Unemployed |
| 16 to 19 Years | 10 (27.0%) | 0 (0.0%) |
| 20 to 24 Years | 40 (100.0%) | 0 (0.0%) |
| 25 to 29 Years | 11 (12.6%) | 0 (0.0%) |
| 30 to 34 Years | 89 (61.4%) | 0 (0.0%) |
| 35 to 44 Years | 62 (100.0%) | 0 (0.0%) |
| 45 to 54 Years | 49 (68.1%) | 0 (0.0%) |
| 55 to 59 Years | 38 (88.4%) | 0 (0.0%) |
| 60 to 64 Years | 24 (68.6%) | 0 (0.0%) |
| 65 to 74 Years | 37 (34.6%) | 0 (0.0%) |
| 75 Years and over | 0 (0.0%) | 0 (0.0%) |
| Total | 360 (53.7%) | 0 (0.0%) |
Employment Status by Educational Attainment in Lumpkin
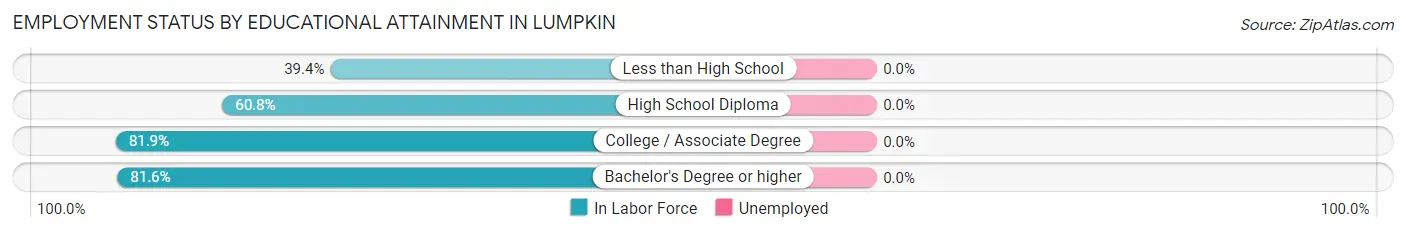
| Educational Attainment | In Labor Force | Unemployed |
| Less than High School | 37 (39.4%) | 0 (0.0%) |
| High School Diploma | 146 (60.8%) | 0 (0.0%) |
| College / Associate Degree | 59 (81.9%) | 0 (0.0%) |
| Bachelor's Degree or higher | 31 (81.6%) | 0 (0.0%) |
| Total | 273 (61.5%) | 0 (0.0%) |
Employment Occupations by Sex in Lumpkin
Management, Business, Science and Arts Occupations
The most common Management, Business, Science and Arts occupations in Lumpkin are Health Diagnosing & Treating (40 | 11.1%), Community & Social Service (17 | 4.7%), Education, Arts & Media (11 | 3.1%), and Education Instruction & Library (6 | 1.7%).
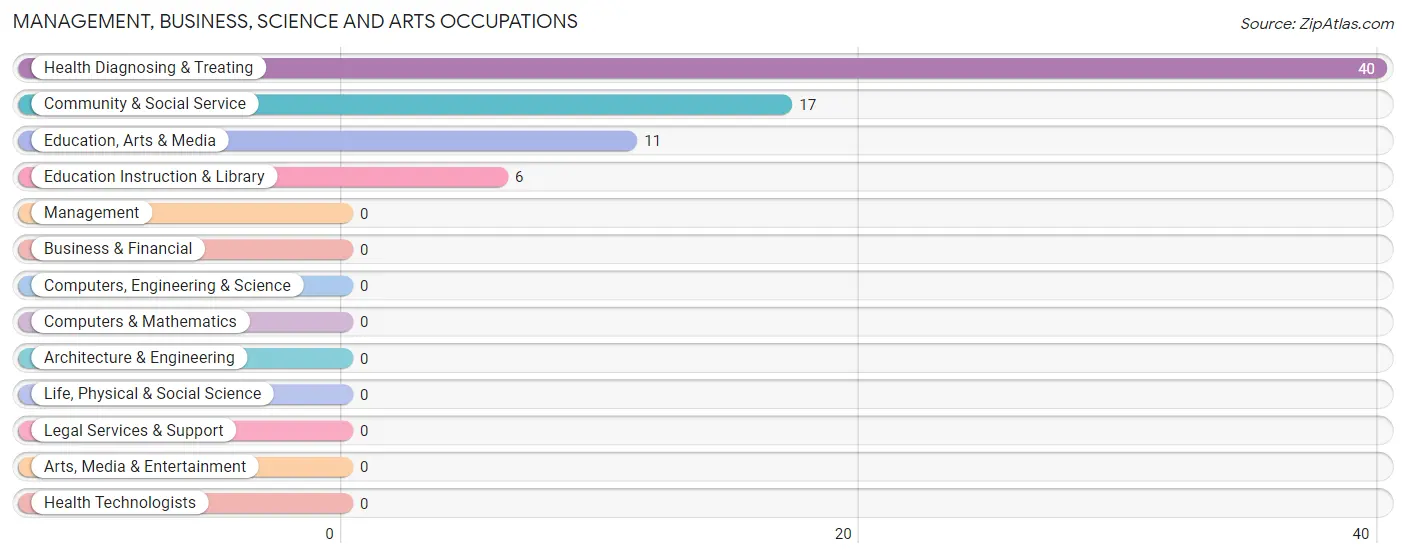
Management, Business, Science and Arts Occupations by Sex
Within the Management, Business, Science and Arts occupations in Lumpkin, the most male-oriented occupations are Education Instruction & Library (83.3%), and Community & Social Service (29.4%), while the most female-oriented occupations are Education, Arts & Media (100.0%), Health Diagnosing & Treating (100.0%), and Community & Social Service (70.6%).
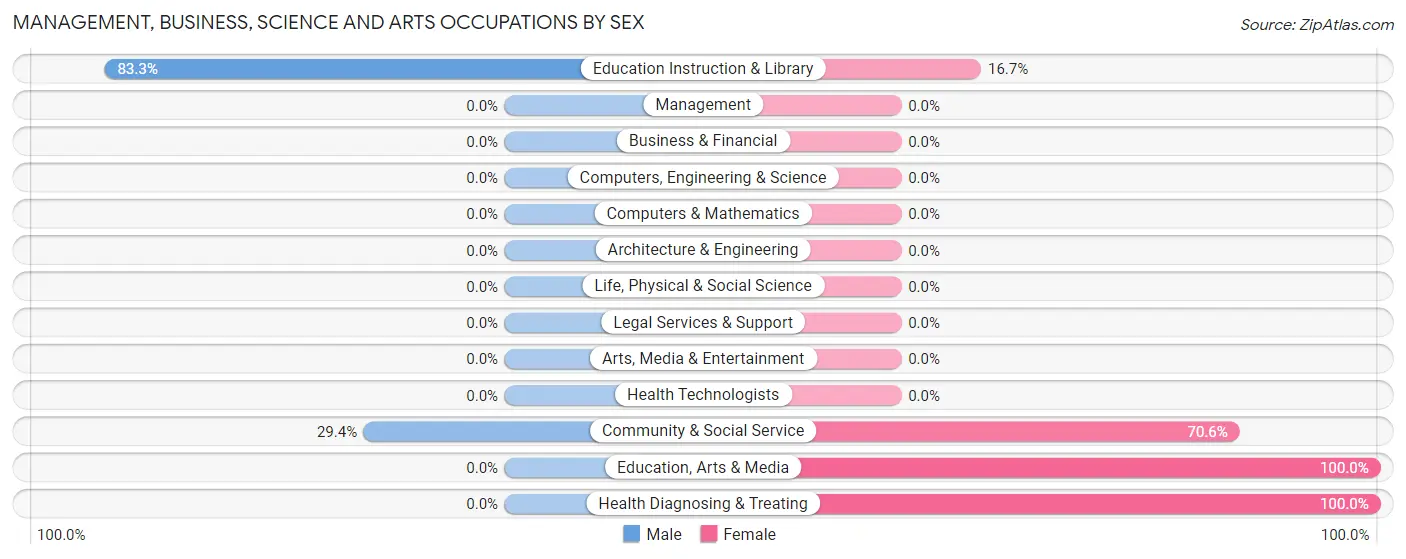
| Occupation | Male | Female |
| Management | 0 (0.0%) | 0 (0.0%) |
| Business & Financial | 0 (0.0%) | 0 (0.0%) |
| Computers, Engineering & Science | 0 (0.0%) | 0 (0.0%) |
| Computers & Mathematics | 0 (0.0%) | 0 (0.0%) |
| Architecture & Engineering | 0 (0.0%) | 0 (0.0%) |
| Life, Physical & Social Science | 0 (0.0%) | 0 (0.0%) |
| Community & Social Service | 5 (29.4%) | 12 (70.6%) |
| Education, Arts & Media | 0 (0.0%) | 11 (100.0%) |
| Legal Services & Support | 0 (0.0%) | 0 (0.0%) |
| Education Instruction & Library | 5 (83.3%) | 1 (16.7%) |
| Arts, Media & Entertainment | 0 (0.0%) | 0 (0.0%) |
| Health Diagnosing & Treating | 0 (0.0%) | 40 (100.0%) |
| Health Technologists | 0 (0.0%) | 0 (0.0%) |
| Total (Category) | 5 (8.8%) | 52 (91.2%) |
| Total (Overall) | 185 (51.4%) | 175 (48.6%) |
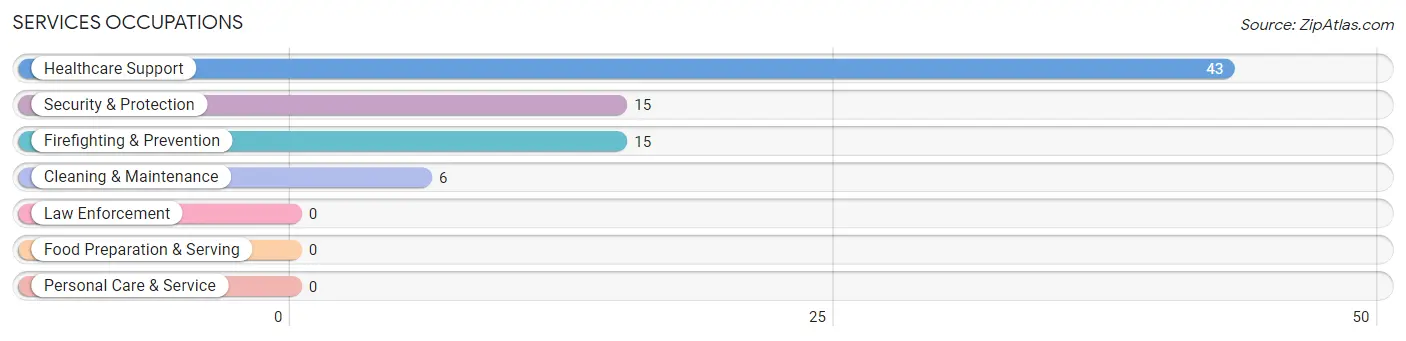
Services Occupations
The most common Services occupations in Lumpkin are Healthcare Support (43 | 11.9%), Security & Protection (15 | 4.2%), Firefighting & Prevention (15 | 4.2%), and Cleaning & Maintenance (6 | 1.7%).
Services Occupations by Sex
Within the Services occupations in Lumpkin, the most male-oriented occupations are Security & Protection (66.7%), and Firefighting & Prevention (66.7%), while the most female-oriented occupations are Healthcare Support (100.0%), Cleaning & Maintenance (100.0%), and Security & Protection (33.3%).
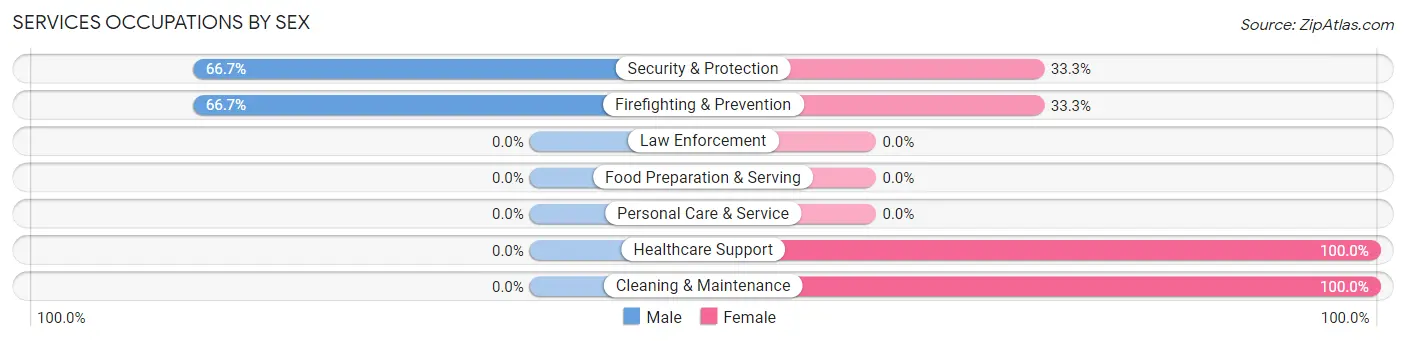
| Occupation | Male | Female |
| Healthcare Support | 0 (0.0%) | 43 (100.0%) |
| Security & Protection | 10 (66.7%) | 5 (33.3%) |
| Firefighting & Prevention | 10 (66.7%) | 5 (33.3%) |
| Law Enforcement | 0 (0.0%) | 0 (0.0%) |
| Food Preparation & Serving | 0 (0.0%) | 0 (0.0%) |
| Cleaning & Maintenance | 0 (0.0%) | 6 (100.0%) |
| Personal Care & Service | 0 (0.0%) | 0 (0.0%) |
| Total (Category) | 10 (15.6%) | 54 (84.4%) |
| Total (Overall) | 185 (51.4%) | 175 (48.6%) |
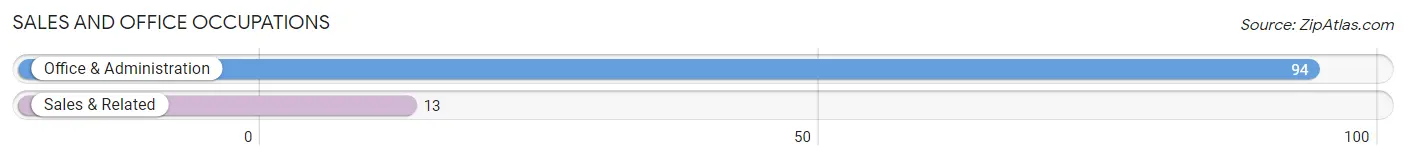
Sales and Office Occupations
The most common Sales and Office occupations in Lumpkin are Office & Administration (94 | 26.1%), and Sales & Related (13 | 3.6%).
Sales and Office Occupations by Sex
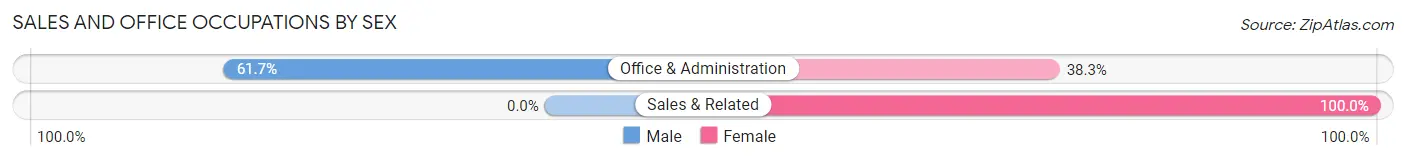
| Occupation | Male | Female |
| Sales & Related | 0 (0.0%) | 13 (100.0%) |
| Office & Administration | 58 (61.7%) | 36 (38.3%) |
| Total (Category) | 58 (54.2%) | 49 (45.8%) |
| Total (Overall) | 185 (51.4%) | 175 (48.6%) |
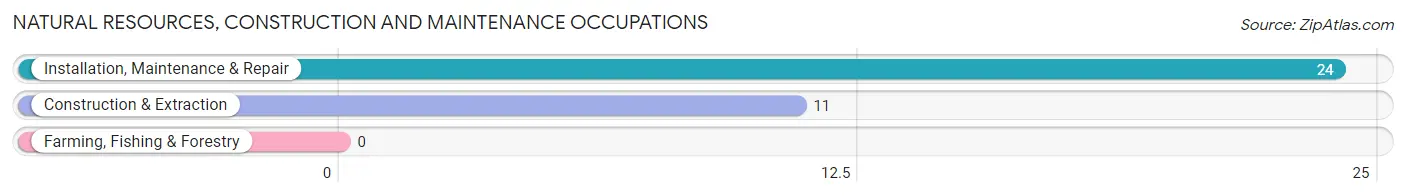
Natural Resources, Construction and Maintenance Occupations
The most common Natural Resources, Construction and Maintenance occupations in Lumpkin are Installation, Maintenance & Repair (24 | 6.7%), and Construction & Extraction (11 | 3.1%).
Natural Resources, Construction and Maintenance Occupations by Sex
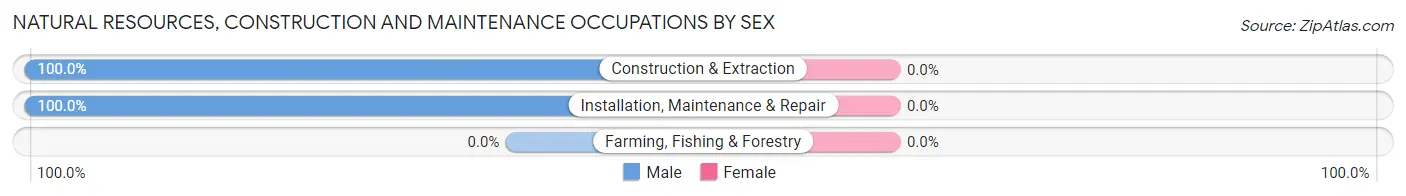
| Occupation | Male | Female |
| Farming, Fishing & Forestry | 0 (0.0%) | 0 (0.0%) |
| Construction & Extraction | 11 (100.0%) | 0 (0.0%) |
| Installation, Maintenance & Repair | 24 (100.0%) | 0 (0.0%) |
| Total (Category) | 35 (100.0%) | 0 (0.0%) |
| Total (Overall) | 185 (51.4%) | 175 (48.6%) |
Production, Transportation and Moving Occupations
The most common Production, Transportation and Moving occupations in Lumpkin are Production (80 | 22.2%), and Transportation (17 | 4.7%).
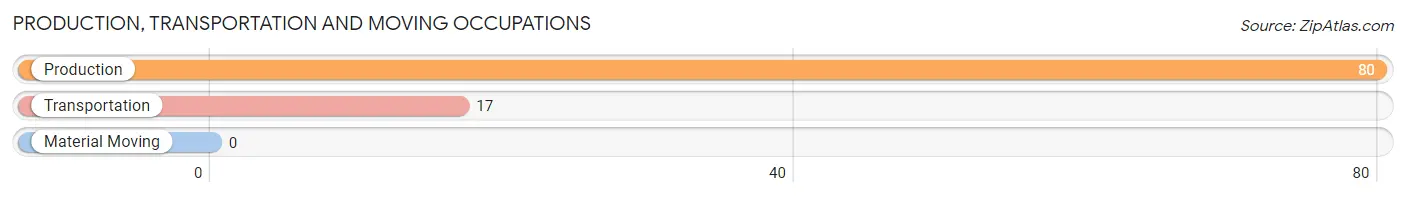
Production, Transportation and Moving Occupations by Sex
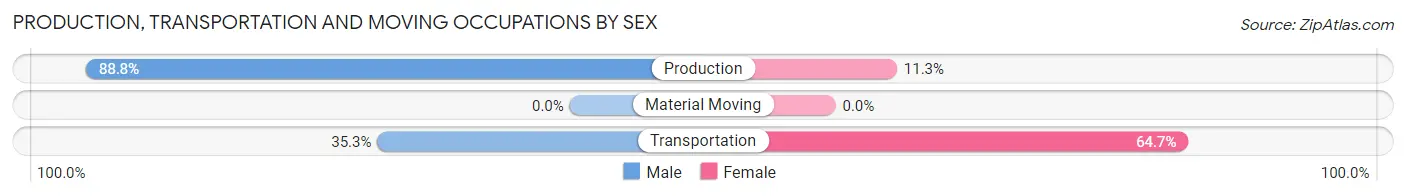
| Occupation | Male | Female |
| Production | 71 (88.7%) | 9 (11.3%) |
| Transportation | 6 (35.3%) | 11 (64.7%) |
| Material Moving | 0 (0.0%) | 0 (0.0%) |
| Total (Category) | 77 (79.4%) | 20 (20.6%) |
| Total (Overall) | 185 (51.4%) | 175 (48.6%) |
Employment Industries by Sex in Lumpkin
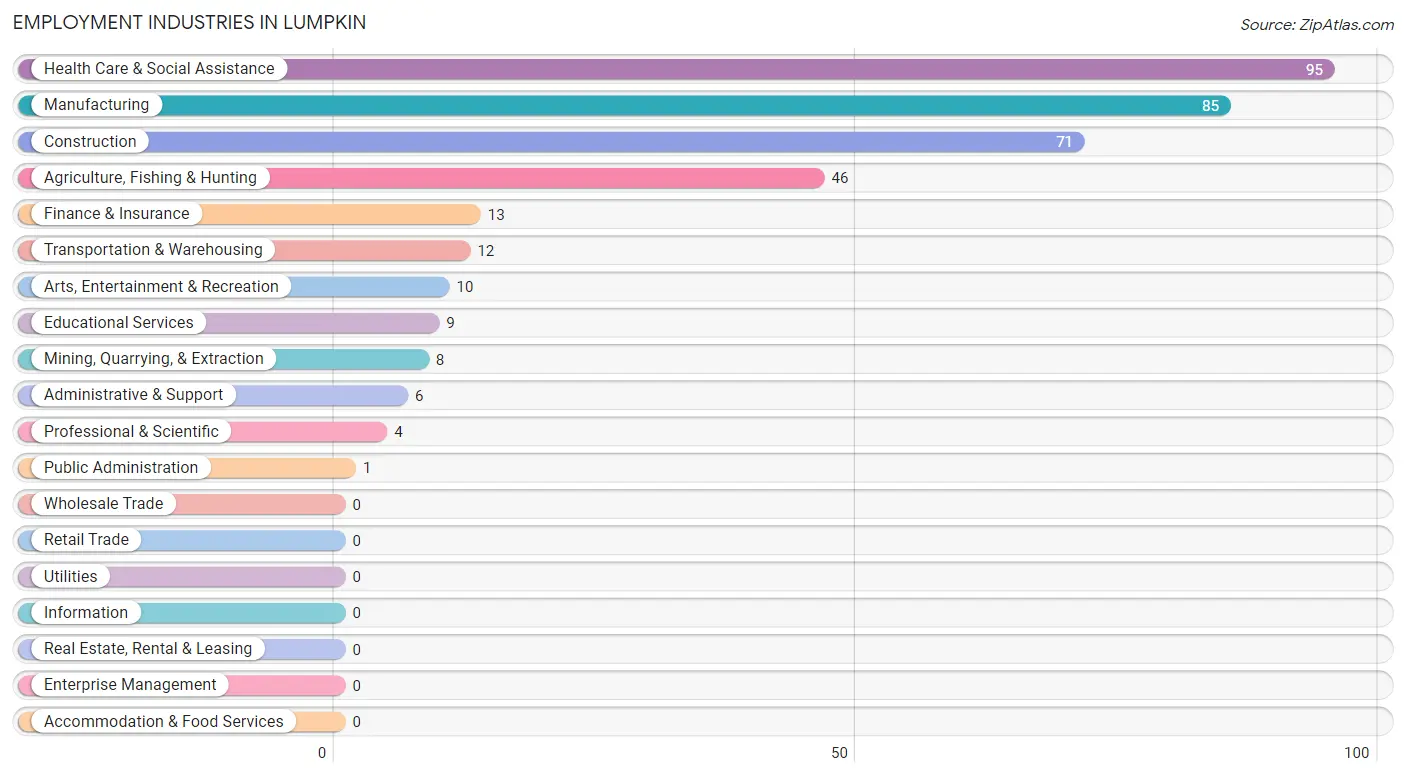
Employment Industries in Lumpkin
The major employment industries in Lumpkin include Health Care & Social Assistance (95 | 26.4%), Manufacturing (85 | 23.6%), Construction (71 | 19.7%), Agriculture, Fishing & Hunting (46 | 12.8%), and Finance & Insurance (13 | 3.6%).
Employment Industries by Sex in Lumpkin
The Lumpkin industries that see more men than women are Mining, Quarrying, & Extraction (100.0%), Construction (100.0%), and Professional & Scientific (100.0%), whereas the industries that tend to have a higher number of women are Transportation & Warehousing (100.0%), Finance & Insurance (100.0%), and Administrative & Support (100.0%).
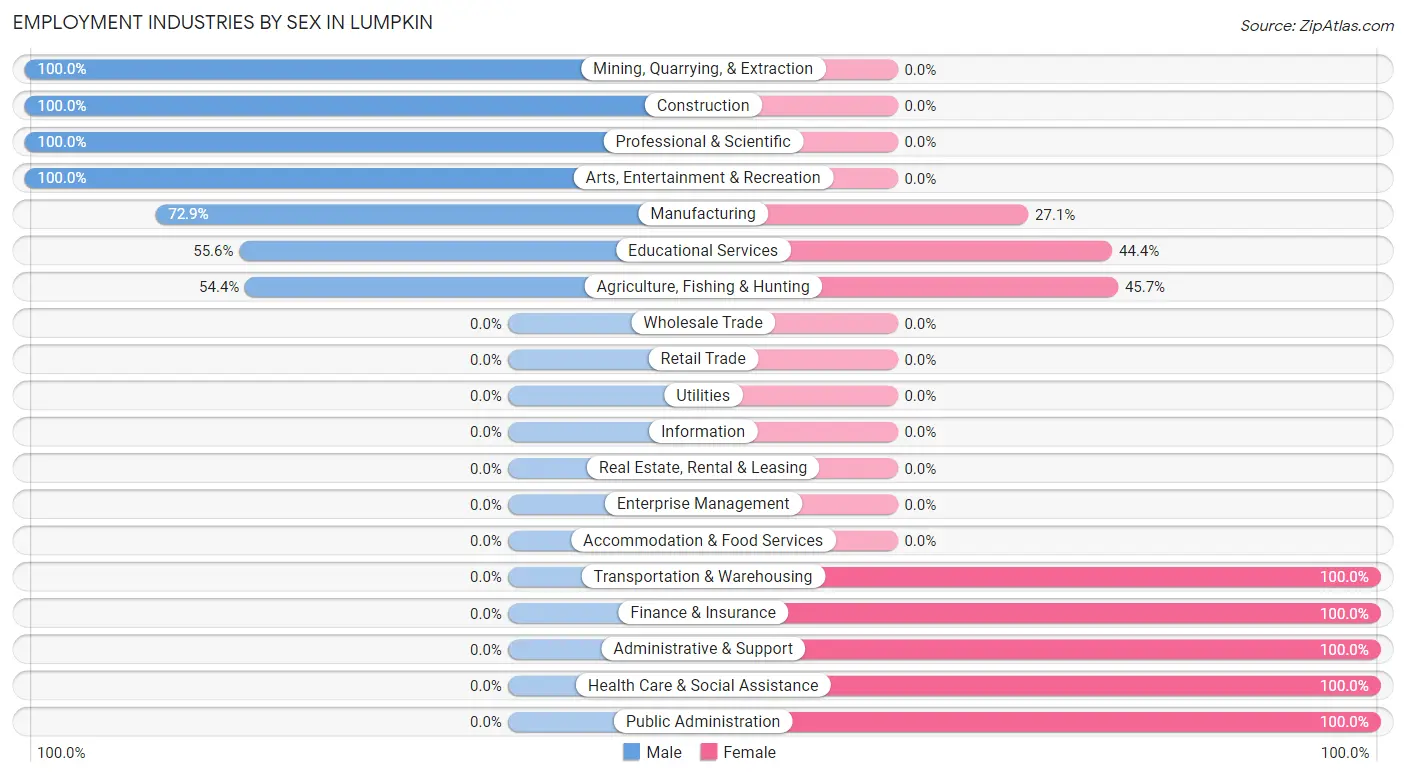
| Industry | Male | Female |
| Agriculture, Fishing & Hunting | 25 (54.3%) | 21 (45.7%) |
| Mining, Quarrying, & Extraction | 8 (100.0%) | 0 (0.0%) |
| Construction | 71 (100.0%) | 0 (0.0%) |
| Manufacturing | 62 (72.9%) | 23 (27.1%) |
| Wholesale Trade | 0 (0.0%) | 0 (0.0%) |
| Retail Trade | 0 (0.0%) | 0 (0.0%) |
| Transportation & Warehousing | 0 (0.0%) | 12 (100.0%) |
| Utilities | 0 (0.0%) | 0 (0.0%) |
| Information | 0 (0.0%) | 0 (0.0%) |
| Finance & Insurance | 0 (0.0%) | 13 (100.0%) |
| Real Estate, Rental & Leasing | 0 (0.0%) | 0 (0.0%) |
| Professional & Scientific | 4 (100.0%) | 0 (0.0%) |
| Enterprise Management | 0 (0.0%) | 0 (0.0%) |
| Administrative & Support | 0 (0.0%) | 6 (100.0%) |
| Educational Services | 5 (55.6%) | 4 (44.4%) |
| Health Care & Social Assistance | 0 (0.0%) | 95 (100.0%) |
| Arts, Entertainment & Recreation | 10 (100.0%) | 0 (0.0%) |
| Accommodation & Food Services | 0 (0.0%) | 0 (0.0%) |
| Public Administration | 0 (0.0%) | 1 (100.0%) |
| Total | 185 (51.4%) | 175 (48.6%) |
Education in Lumpkin
School Enrollment in Lumpkin
The most common levels of schooling among the 194 students in Lumpkin are college / undergraduate (61 | 31.4%), elementary school (52 | 26.8%), and high school (37 | 19.1%).
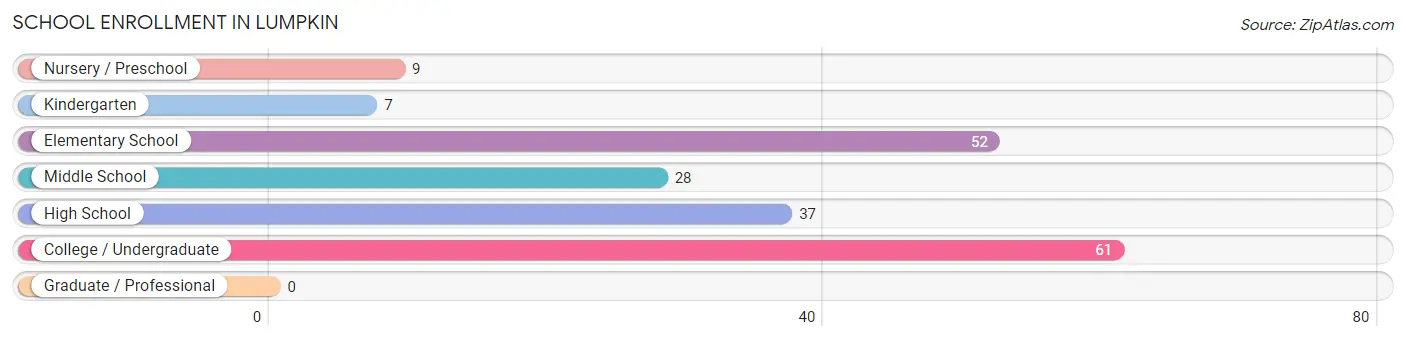
| School Level | # Students | % Students |
| Nursery / Preschool | 9 | 4.6% |
| Kindergarten | 7 | 3.6% |
| Elementary School | 52 | 26.8% |
| Middle School | 28 | 14.4% |
| High School | 37 | 19.1% |
| College / Undergraduate | 61 | 31.4% |
| Graduate / Professional | 0 | 0.0% |
| Total | 194 | 100.0% |
School Enrollment by Age by Funding Source in Lumpkin
Out of a total of 194 students who are enrolled in schools in Lumpkin, 14 (7.2%) attend a private institution, while the remaining 180 (92.8%) are enrolled in public schools. The age group of 18 to 19 year olds has the highest likelihood of being enrolled in private schools, with 10 (83.3% in the age bracket) enrolled. Conversely, the age group of 3 to 4 year olds has the lowest likelihood of being enrolled in a private school, with 9 (100.0% in the age bracket) attending a public institution.
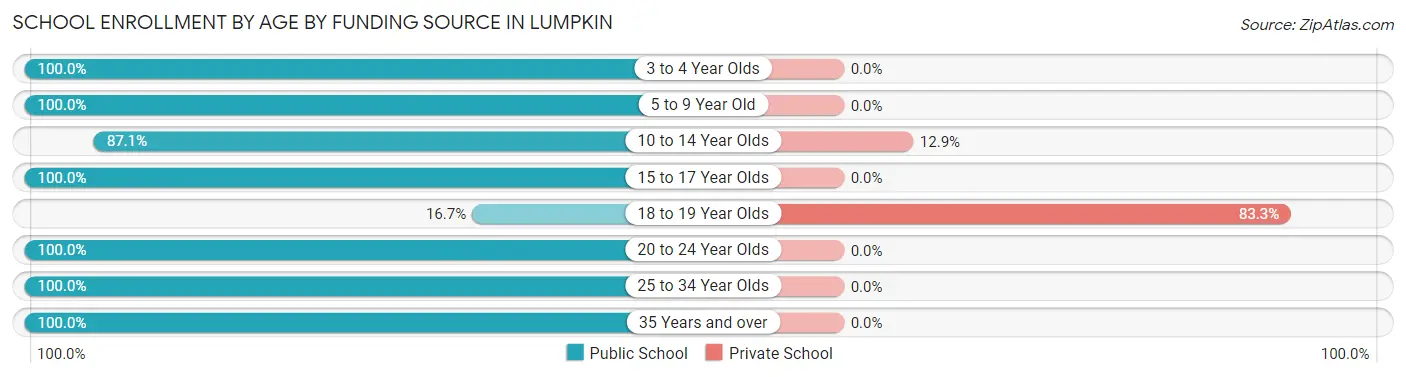
| Age Bracket | Public School | Private School |
| 3 to 4 Year Olds | 9 (100.0%) | 0 (0.0%) |
| 5 to 9 Year Old | 59 (100.0%) | 0 (0.0%) |
| 10 to 14 Year Olds | 27 (87.1%) | 4 (12.9%) |
| 15 to 17 Year Olds | 14 (100.0%) | 0 (0.0%) |
| 18 to 19 Year Olds | 2 (16.7%) | 10 (83.3%) |
| 20 to 24 Year Olds | 40 (100.0%) | 0 (0.0%) |
| 25 to 34 Year Olds | 8 (100.0%) | 0 (0.0%) |
| 35 Years and over | 21 (100.0%) | 0 (0.0%) |
| Total | 180 (92.8%) | 14 (7.2%) |
Educational Attainment by Field of Study in Lumpkin
Arts & humanities (24 | 33.8%), business (16 | 22.5%), education (11 | 15.5%), social sciences (9 | 12.7%), and visual & performing arts (5 | 7.0%) are the most common fields of study among 71 individuals in Lumpkin who have obtained a bachelor's degree or higher.
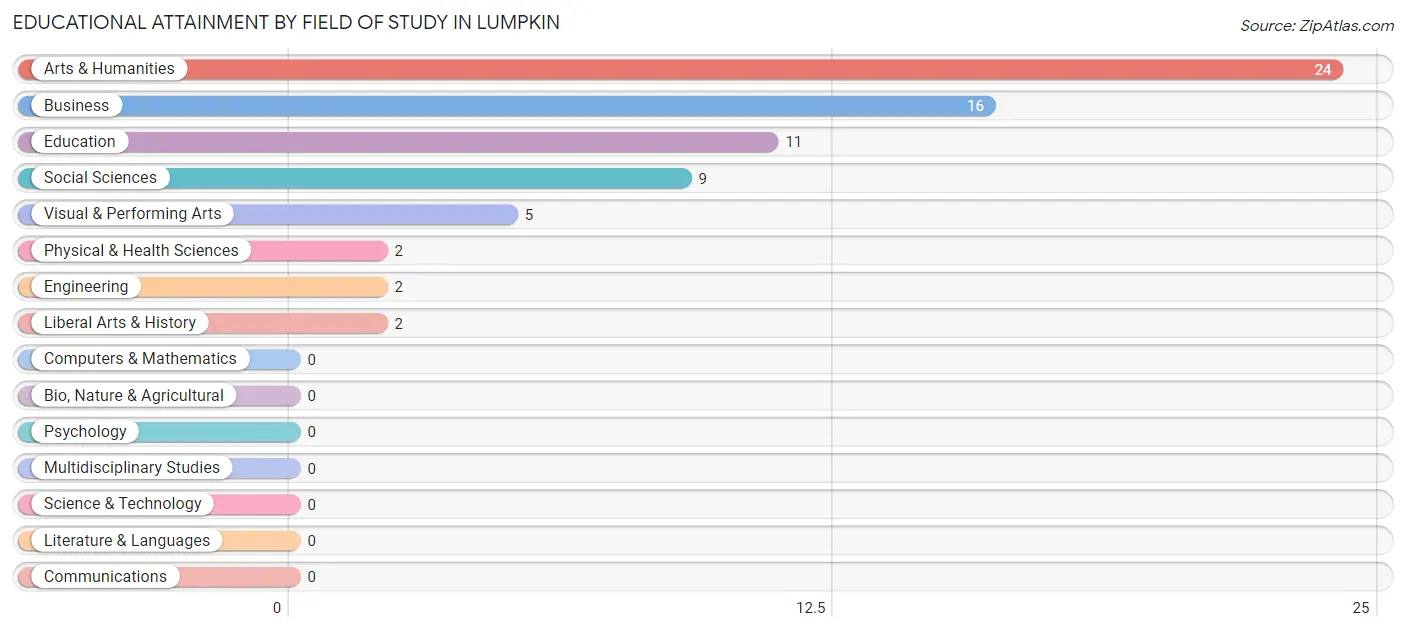
| Field of Study | # Graduates | % Graduates |
| Computers & Mathematics | 0 | 0.0% |
| Bio, Nature & Agricultural | 0 | 0.0% |
| Physical & Health Sciences | 2 | 2.8% |
| Psychology | 0 | 0.0% |
| Social Sciences | 9 | 12.7% |
| Engineering | 2 | 2.8% |
| Multidisciplinary Studies | 0 | 0.0% |
| Science & Technology | 0 | 0.0% |
| Business | 16 | 22.5% |
| Education | 11 | 15.5% |
| Literature & Languages | 0 | 0.0% |
| Liberal Arts & History | 2 | 2.8% |
| Visual & Performing Arts | 5 | 7.0% |
| Communications | 0 | 0.0% |
| Arts & Humanities | 24 | 33.8% |
| Total | 71 | 100.0% |
Transportation & Commute in Lumpkin
Vehicle Availability by Sex in Lumpkin
The most prevalent vehicle ownership categories in Lumpkin are males with 1 vehicle (67, accounting for 37.0%) and females with 1 vehicle (55, making up 39.6%).
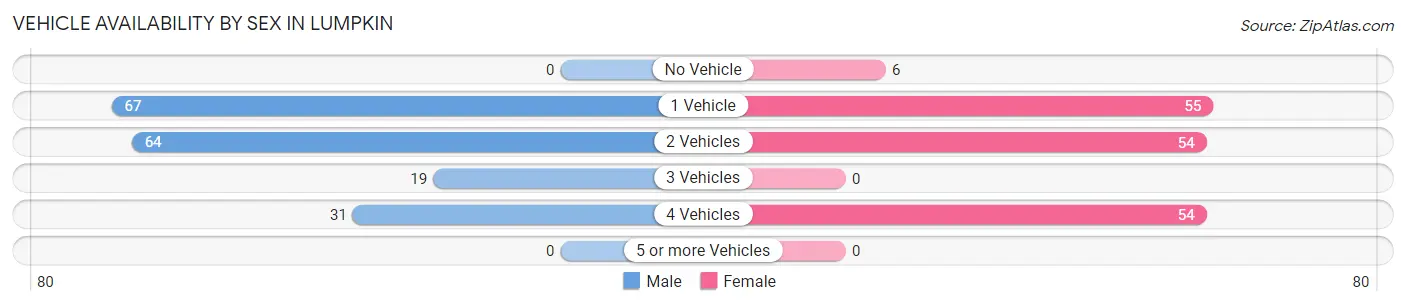
| Vehicles Available | Male | Female |
| No Vehicle | 0 (0.0%) | 6 (3.5%) |
| 1 Vehicle | 67 (37.0%) | 55 (32.5%) |
| 2 Vehicles | 64 (35.4%) | 54 (32.0%) |
| 3 Vehicles | 19 (10.5%) | 0 (0.0%) |
| 4 Vehicles | 31 (17.1%) | 54 (32.0%) |
| 5 or more Vehicles | 0 (0.0%) | 0 (0.0%) |
| Total | 181 (100.0%) | 169 (100.0%) |
Commute Time in Lumpkin
The most frequently occuring commute durations in Lumpkin are 60 to 89 minutes (113 commuters, 32.3%), 45 to 59 minutes (112 commuters, 32.0%), and less than 5 minutes (73 commuters, 20.9%).
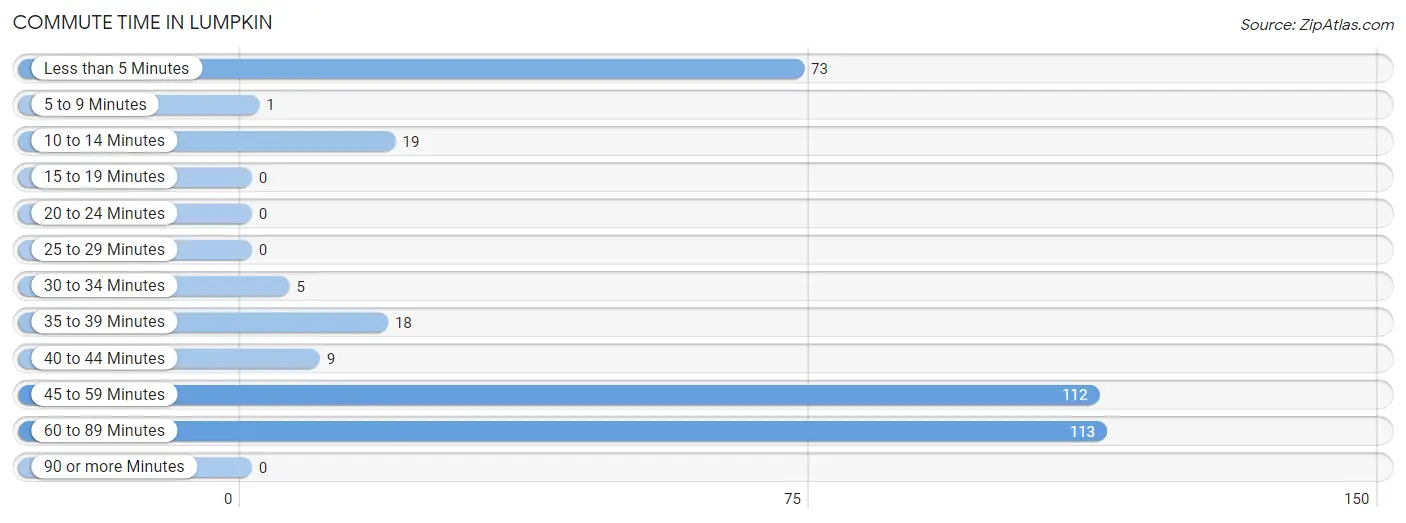
| Commute Time | # Commuters | % Commuters |
| Less than 5 Minutes | 73 | 20.9% |
| 5 to 9 Minutes | 1 | 0.3% |
| 10 to 14 Minutes | 19 | 5.4% |
| 15 to 19 Minutes | 0 | 0.0% |
| 20 to 24 Minutes | 0 | 0.0% |
| 25 to 29 Minutes | 0 | 0.0% |
| 30 to 34 Minutes | 5 | 1.4% |
| 35 to 39 Minutes | 18 | 5.1% |
| 40 to 44 Minutes | 9 | 2.6% |
| 45 to 59 Minutes | 112 | 32.0% |
| 60 to 89 Minutes | 113 | 32.3% |
| 90 or more Minutes | 0 | 0.0% |
Commute Time by Sex in Lumpkin
The most common commute times in Lumpkin are 60 to 89 minutes (92 commuters, 50.8%) for males and 45 to 59 minutes (97 commuters, 57.4%) for females.
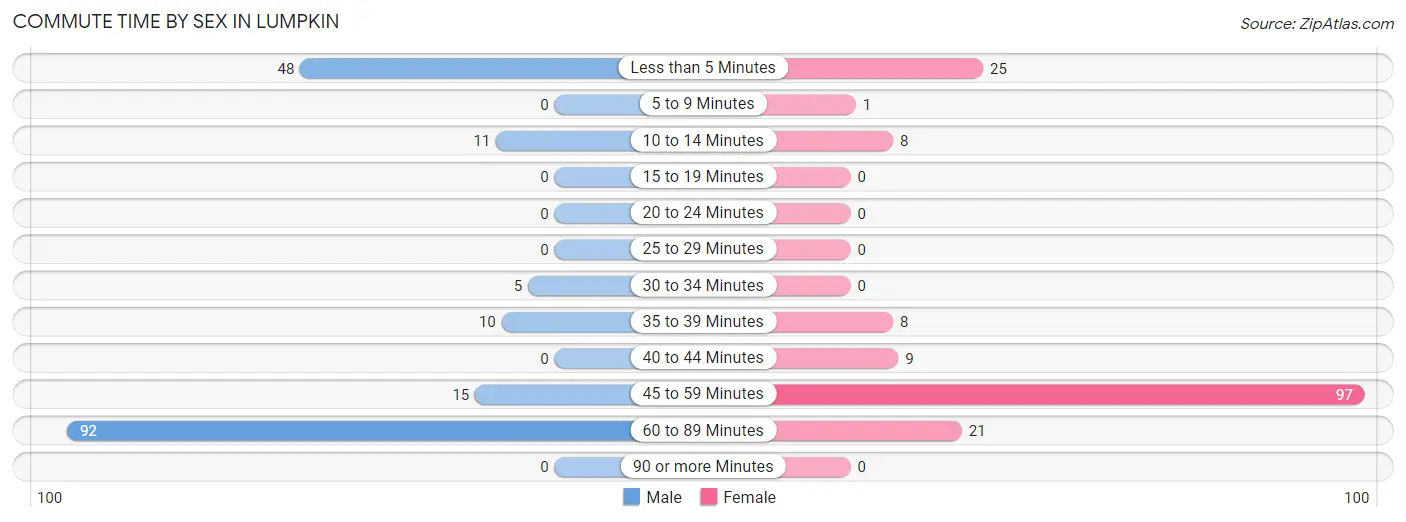
| Commute Time | Male | Female |
| Less than 5 Minutes | 48 (26.5%) | 25 (14.8%) |
| 5 to 9 Minutes | 0 (0.0%) | 1 (0.6%) |
| 10 to 14 Minutes | 11 (6.1%) | 8 (4.7%) |
| 15 to 19 Minutes | 0 (0.0%) | 0 (0.0%) |
| 20 to 24 Minutes | 0 (0.0%) | 0 (0.0%) |
| 25 to 29 Minutes | 0 (0.0%) | 0 (0.0%) |
| 30 to 34 Minutes | 5 (2.8%) | 0 (0.0%) |
| 35 to 39 Minutes | 10 (5.5%) | 8 (4.7%) |
| 40 to 44 Minutes | 0 (0.0%) | 9 (5.3%) |
| 45 to 59 Minutes | 15 (8.3%) | 97 (57.4%) |
| 60 to 89 Minutes | 92 (50.8%) | 21 (12.4%) |
| 90 or more Minutes | 0 (0.0%) | 0 (0.0%) |
Time of Departure to Work by Sex in Lumpkin
The most frequent times of departure to work in Lumpkin are 6:30 AM to 6:59 AM (58, 32.0%) for males and 8:00 AM to 8:29 AM (50, 29.6%) for females.
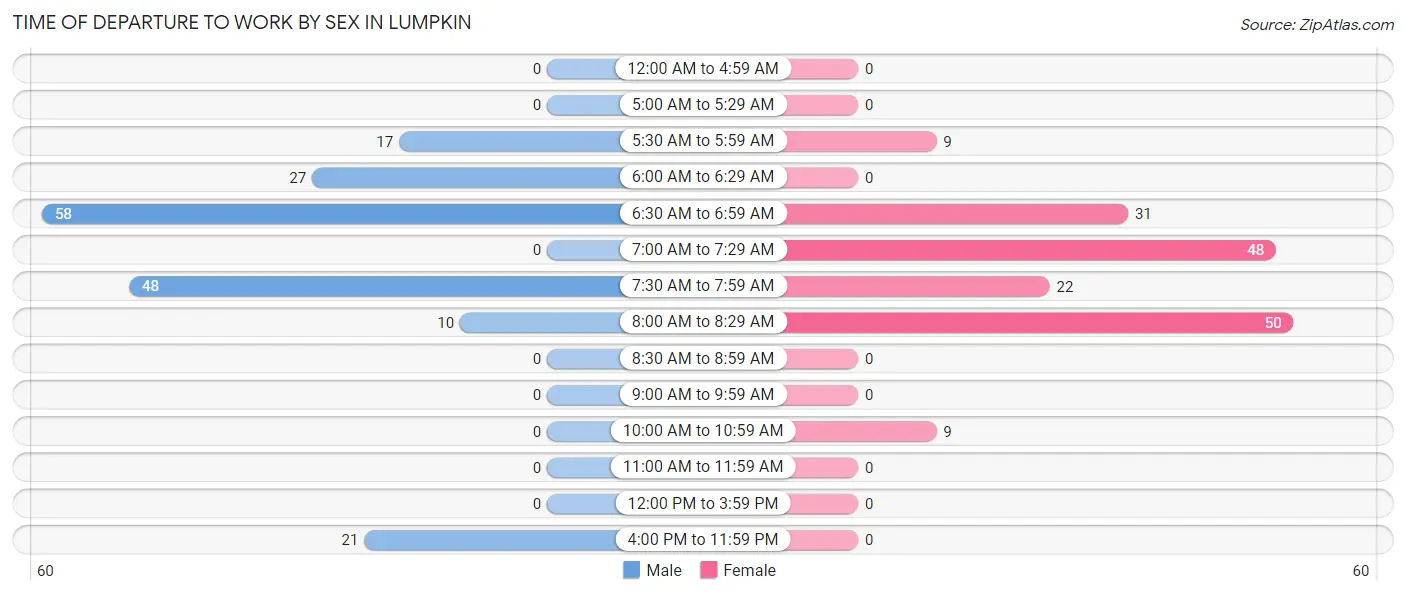
| Time of Departure | Male | Female |
| 12:00 AM to 4:59 AM | 0 (0.0%) | 0 (0.0%) |
| 5:00 AM to 5:29 AM | 0 (0.0%) | 0 (0.0%) |
| 5:30 AM to 5:59 AM | 17 (9.4%) | 9 (5.3%) |
| 6:00 AM to 6:29 AM | 27 (14.9%) | 0 (0.0%) |
| 6:30 AM to 6:59 AM | 58 (32.0%) | 31 (18.3%) |
| 7:00 AM to 7:29 AM | 0 (0.0%) | 48 (28.4%) |
| 7:30 AM to 7:59 AM | 48 (26.5%) | 22 (13.0%) |
| 8:00 AM to 8:29 AM | 10 (5.5%) | 50 (29.6%) |
| 8:30 AM to 8:59 AM | 0 (0.0%) | 0 (0.0%) |
| 9:00 AM to 9:59 AM | 0 (0.0%) | 0 (0.0%) |
| 10:00 AM to 10:59 AM | 0 (0.0%) | 9 (5.3%) |
| 11:00 AM to 11:59 AM | 0 (0.0%) | 0 (0.0%) |
| 12:00 PM to 3:59 PM | 0 (0.0%) | 0 (0.0%) |
| 4:00 PM to 11:59 PM | 21 (11.6%) | 0 (0.0%) |
| Total | 181 (100.0%) | 169 (100.0%) |
Housing Occupancy in Lumpkin
Occupancy by Ownership in Lumpkin
Of the total 420 dwellings in Lumpkin, owner-occupied units account for 241 (57.4%), while renter-occupied units make up 179 (42.6%).
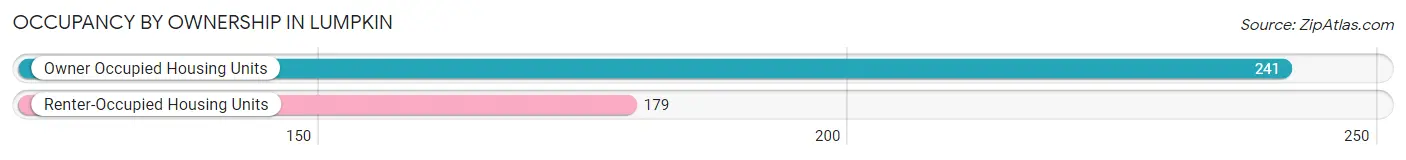
| Occupancy | # Housing Units | % Housing Units |
| Owner Occupied Housing Units | 241 | 57.4% |
| Renter-Occupied Housing Units | 179 | 42.6% |
| Total Occupied Housing Units | 420 | 100.0% |
Occupancy by Household Size in Lumpkin
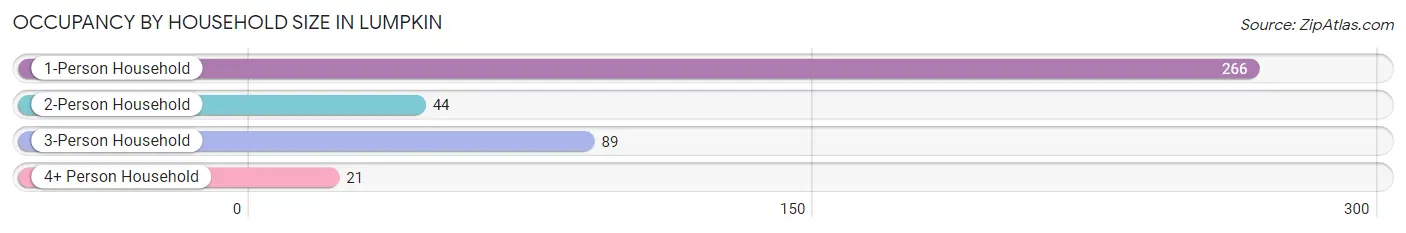
| Household Size | # Housing Units | % Housing Units |
| 1-Person Household | 266 | 63.3% |
| 2-Person Household | 44 | 10.5% |
| 3-Person Household | 89 | 21.2% |
| 4+ Person Household | 21 | 5.0% |
| Total Housing Units | 420 | 100.0% |
Occupancy by Ownership by Household Size in Lumpkin
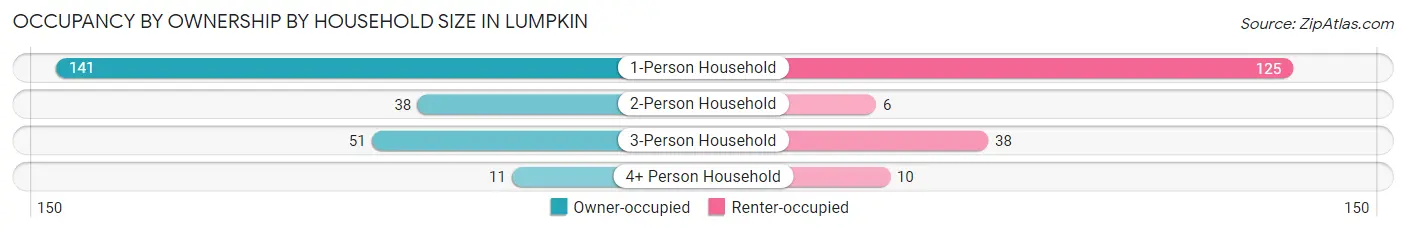
| Household Size | Owner-occupied | Renter-occupied |
| 1-Person Household | 141 (53.0%) | 125 (47.0%) |
| 2-Person Household | 38 (86.4%) | 6 (13.6%) |
| 3-Person Household | 51 (57.3%) | 38 (42.7%) |
| 4+ Person Household | 11 (52.4%) | 10 (47.6%) |
| Total Housing Units | 241 (57.4%) | 179 (42.6%) |
Occupancy by Educational Attainment in Lumpkin
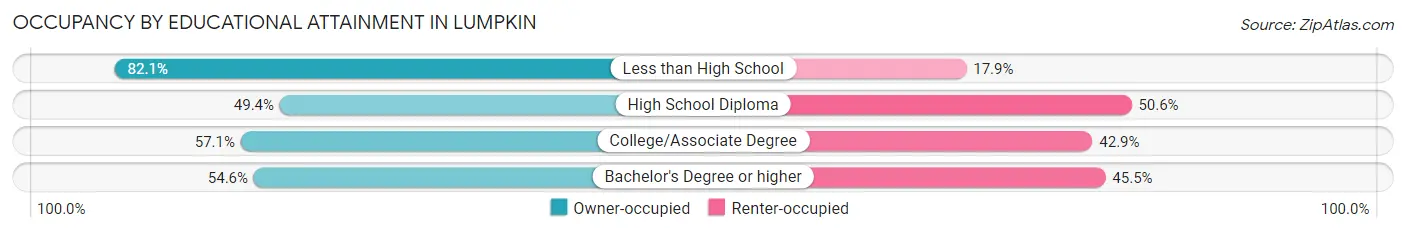
| Household Size | Owner-occupied | Renter-occupied |
| Less than High School | 69 (82.1%) | 15 (17.9%) |
| High School Diploma | 122 (49.4%) | 125 (50.6%) |
| College/Associate Degree | 32 (57.1%) | 24 (42.9%) |
| Bachelor's Degree or higher | 18 (54.5%) | 15 (45.5%) |
Occupancy by Age of Householder in Lumpkin
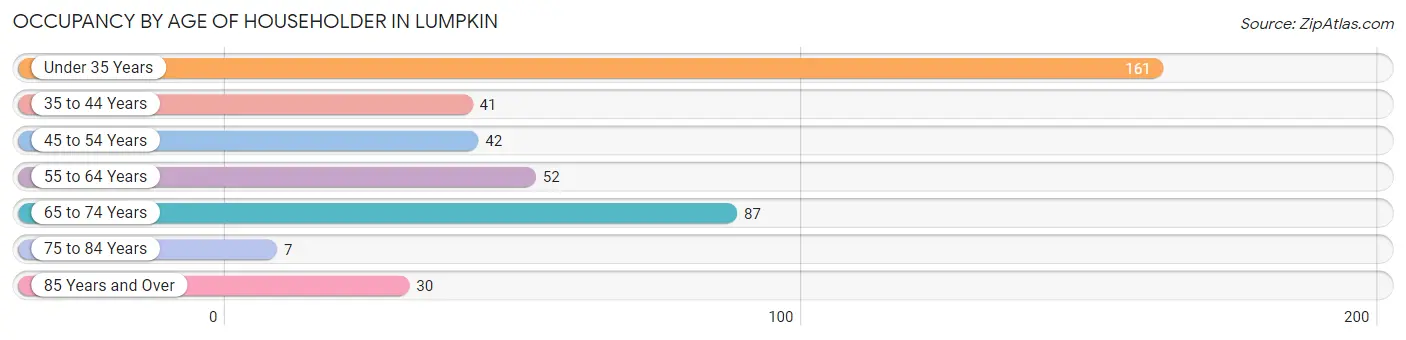
| Age Bracket | # Households | % Households |
| Under 35 Years | 161 | 38.3% |
| 35 to 44 Years | 41 | 9.8% |
| 45 to 54 Years | 42 | 10.0% |
| 55 to 64 Years | 52 | 12.4% |
| 65 to 74 Years | 87 | 20.7% |
| 75 to 84 Years | 7 | 1.7% |
| 85 Years and Over | 30 | 7.1% |
| Total | 420 | 100.0% |
Housing Finances in Lumpkin
Median Income by Occupancy in Lumpkin
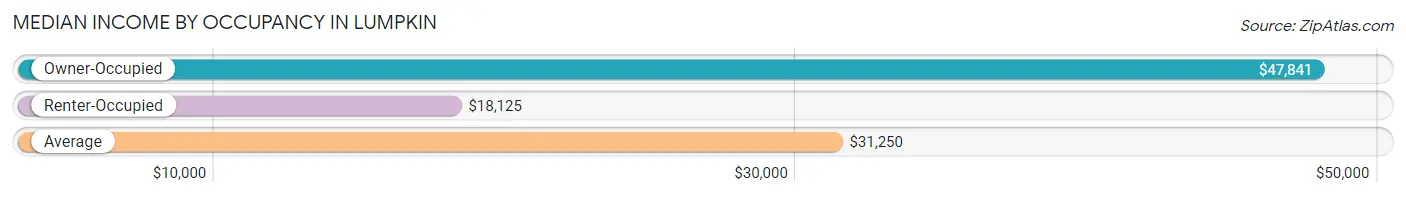
| Occupancy Type | # Households | Median Income |
| Owner-Occupied | 241 (57.4%) | $47,841 |
| Renter-Occupied | 179 (42.6%) | $18,125 |
| Average | 420 (100.0%) | $31,250 |
Occupancy by Householder Income Bracket in Lumpkin
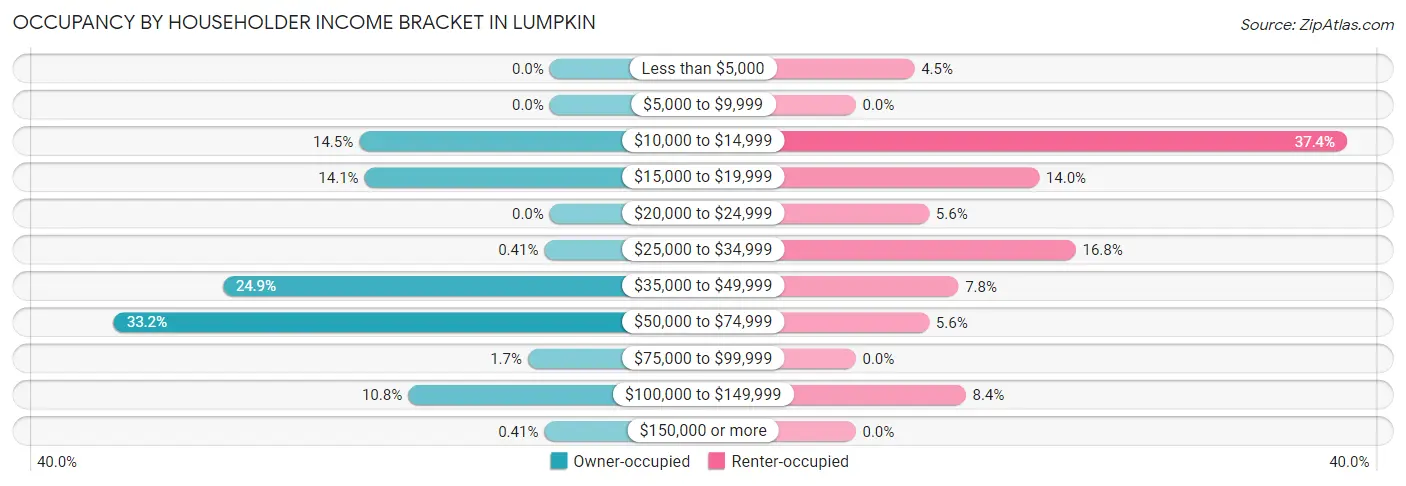
| Income Bracket | Owner-occupied | Renter-occupied |
| Less than $5,000 | 0 (0.0%) | 8 (4.5%) |
| $5,000 to $9,999 | 0 (0.0%) | 0 (0.0%) |
| $10,000 to $14,999 | 35 (14.5%) | 67 (37.4%) |
| $15,000 to $19,999 | 34 (14.1%) | 25 (14.0%) |
| $20,000 to $24,999 | 0 (0.0%) | 10 (5.6%) |
| $25,000 to $34,999 | 1 (0.4%) | 30 (16.8%) |
| $35,000 to $49,999 | 60 (24.9%) | 14 (7.8%) |
| $50,000 to $74,999 | 80 (33.2%) | 10 (5.6%) |
| $75,000 to $99,999 | 4 (1.7%) | 0 (0.0%) |
| $100,000 to $149,999 | 26 (10.8%) | 15 (8.4%) |
| $150,000 or more | 1 (0.4%) | 0 (0.0%) |
| Total | 241 (100.0%) | 179 (100.0%) |
Monthly Housing Cost Tiers in Lumpkin
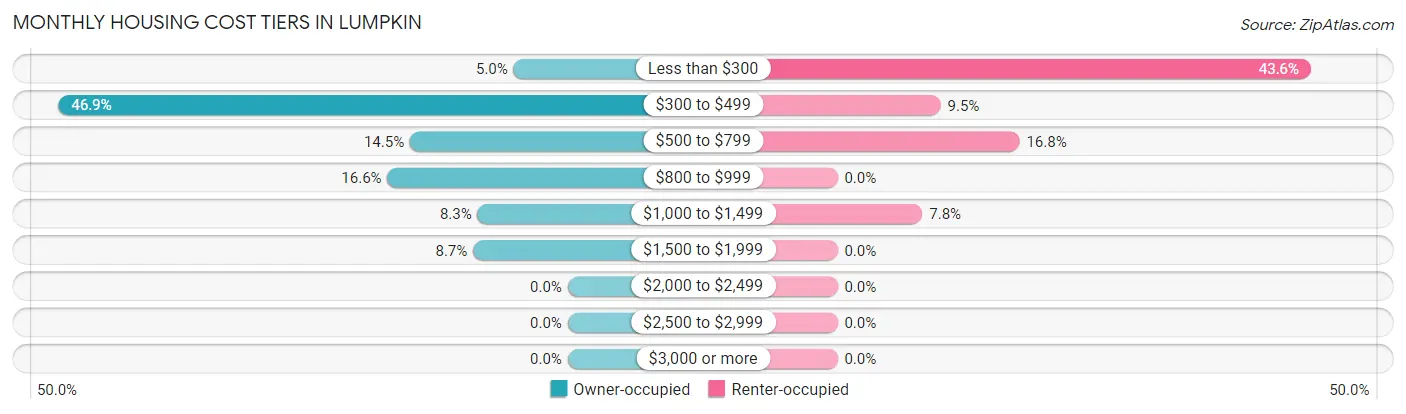
| Monthly Cost | Owner-occupied | Renter-occupied |
| Less than $300 | 12 (5.0%) | 78 (43.6%) |
| $300 to $499 | 113 (46.9%) | 17 (9.5%) |
| $500 to $799 | 35 (14.5%) | 30 (16.8%) |
| $800 to $999 | 40 (16.6%) | 0 (0.0%) |
| $1,000 to $1,499 | 20 (8.3%) | 14 (7.8%) |
| $1,500 to $1,999 | 21 (8.7%) | 0 (0.0%) |
| $2,000 to $2,499 | 0 (0.0%) | 0 (0.0%) |
| $2,500 to $2,999 | 0 (0.0%) | 0 (0.0%) |
| $3,000 or more | 0 (0.0%) | 0 (0.0%) |
| Total | 241 (100.0%) | 179 (100.0%) |
Physical Housing Characteristics in Lumpkin
Housing Structures in Lumpkin
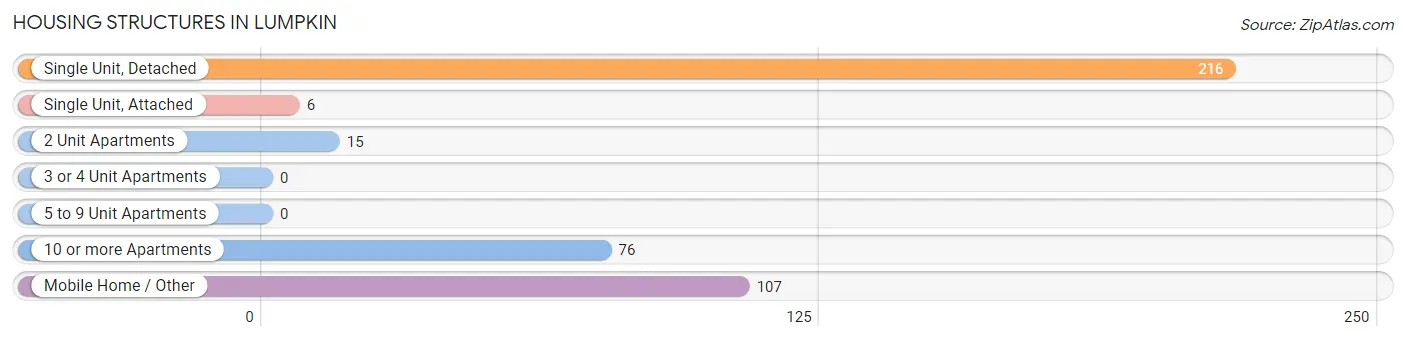
| Structure Type | # Housing Units | % Housing Units |
| Single Unit, Detached | 216 | 51.4% |
| Single Unit, Attached | 6 | 1.4% |
| 2 Unit Apartments | 15 | 3.6% |
| 3 or 4 Unit Apartments | 0 | 0.0% |
| 5 to 9 Unit Apartments | 0 | 0.0% |
| 10 or more Apartments | 76 | 18.1% |
| Mobile Home / Other | 107 | 25.5% |
| Total | 420 | 100.0% |
Housing Structures by Occupancy in Lumpkin
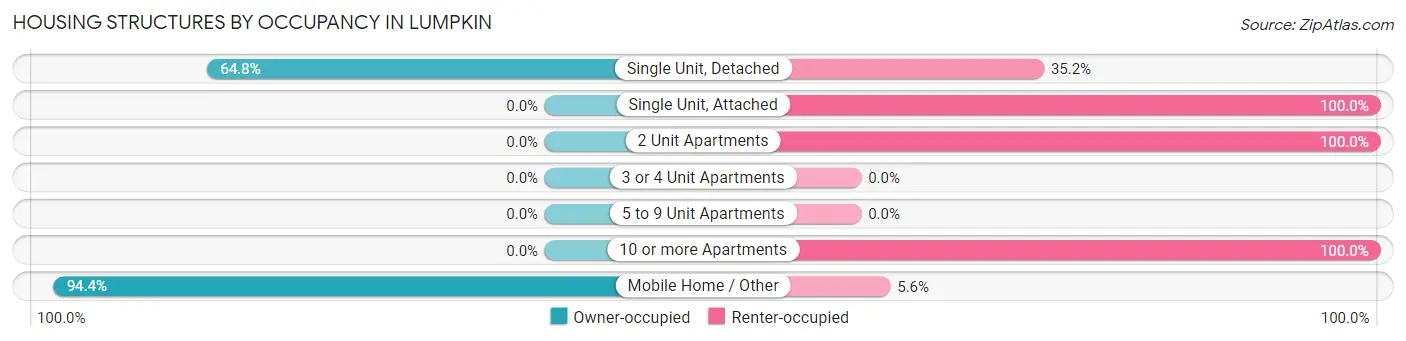
| Structure Type | Owner-occupied | Renter-occupied |
| Single Unit, Detached | 140 (64.8%) | 76 (35.2%) |
| Single Unit, Attached | 0 (0.0%) | 6 (100.0%) |
| 2 Unit Apartments | 0 (0.0%) | 15 (100.0%) |
| 3 or 4 Unit Apartments | 0 (0.0%) | 0 (0.0%) |
| 5 to 9 Unit Apartments | 0 (0.0%) | 0 (0.0%) |
| 10 or more Apartments | 0 (0.0%) | 76 (100.0%) |
| Mobile Home / Other | 101 (94.4%) | 6 (5.6%) |
| Total | 241 (57.4%) | 179 (42.6%) |
Housing Structures by Number of Rooms in Lumpkin
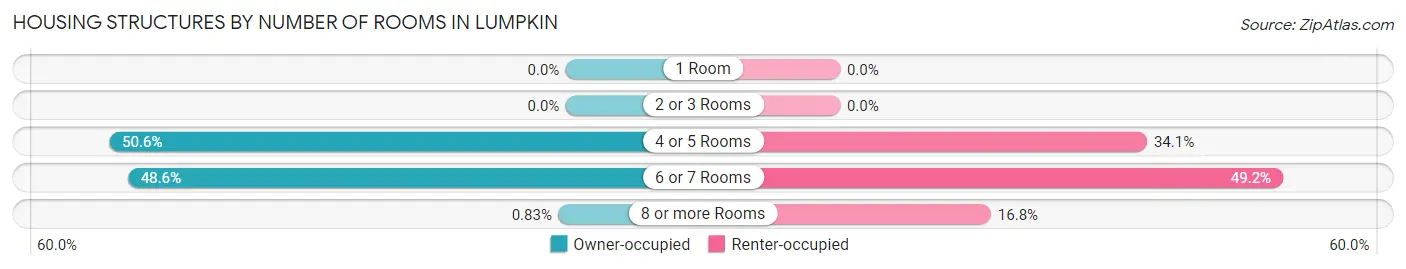
| Number of Rooms | Owner-occupied | Renter-occupied |
| 1 Room | 0 (0.0%) | 0 (0.0%) |
| 2 or 3 Rooms | 0 (0.0%) | 0 (0.0%) |
| 4 or 5 Rooms | 122 (50.6%) | 61 (34.1%) |
| 6 or 7 Rooms | 117 (48.5%) | 88 (49.2%) |
| 8 or more Rooms | 2 (0.8%) | 30 (16.8%) |
| Total | 241 (100.0%) | 179 (100.0%) |
Housing Structure by Heating Type in Lumpkin
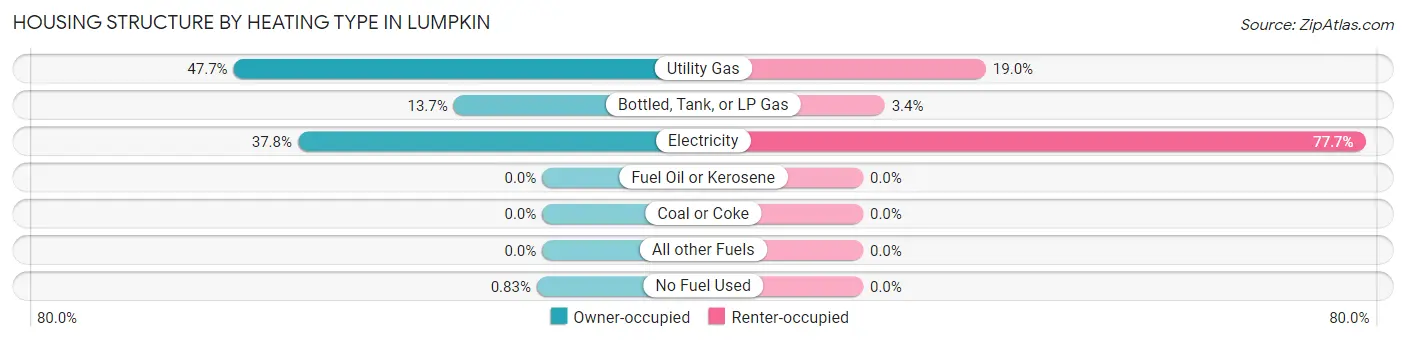
| Heating Type | Owner-occupied | Renter-occupied |
| Utility Gas | 115 (47.7%) | 34 (19.0%) |
| Bottled, Tank, or LP Gas | 33 (13.7%) | 6 (3.4%) |
| Electricity | 91 (37.8%) | 139 (77.6%) |
| Fuel Oil or Kerosene | 0 (0.0%) | 0 (0.0%) |
| Coal or Coke | 0 (0.0%) | 0 (0.0%) |
| All other Fuels | 0 (0.0%) | 0 (0.0%) |
| No Fuel Used | 2 (0.8%) | 0 (0.0%) |
| Total | 241 (100.0%) | 179 (100.0%) |
Household Vehicle Usage in Lumpkin
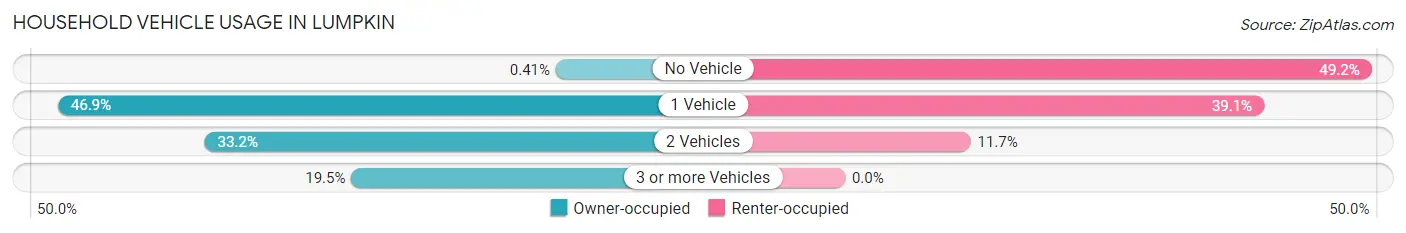
| Vehicles per Household | Owner-occupied | Renter-occupied |
| No Vehicle | 1 (0.4%) | 88 (49.2%) |
| 1 Vehicle | 113 (46.9%) | 70 (39.1%) |
| 2 Vehicles | 80 (33.2%) | 21 (11.7%) |
| 3 or more Vehicles | 47 (19.5%) | 0 (0.0%) |
| Total | 241 (100.0%) | 179 (100.0%) |
Real Estate & Mortgages in Lumpkin
Real Estate and Mortgage Overview in Lumpkin
| Characteristic | Without Mortgage | With Mortgage |
| Housing Units | 151 | 90 |
| Median Property Value | $41,800 | $85,200 |
| Median Household Income | $53,750 | $1 |
| Monthly Housing Costs | $455 | $0 |
| Real Estate Taxes | $888 | $8 |
Property Value by Mortgage Status in Lumpkin
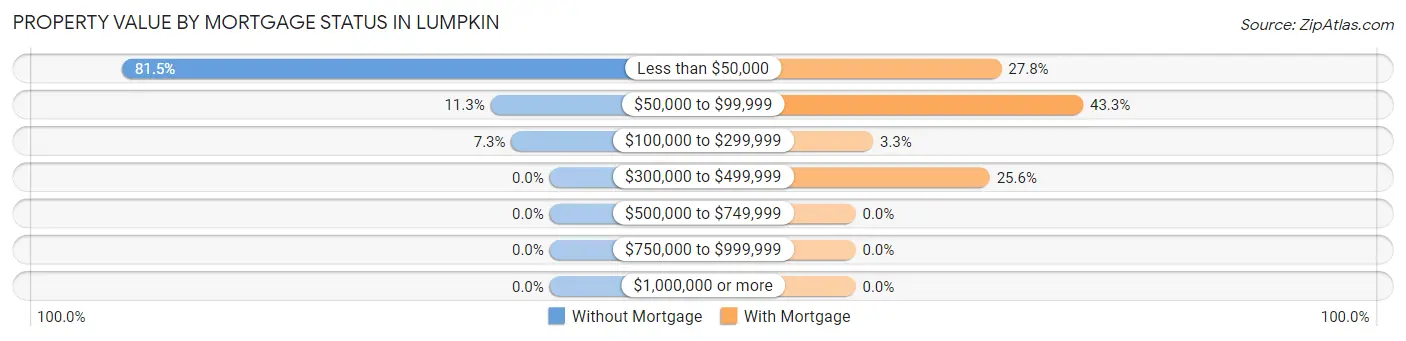
| Property Value | Without Mortgage | With Mortgage |
| Less than $50,000 | 123 (81.5%) | 25 (27.8%) |
| $50,000 to $99,999 | 17 (11.3%) | 39 (43.3%) |
| $100,000 to $299,999 | 11 (7.3%) | 3 (3.3%) |
| $300,000 to $499,999 | 0 (0.0%) | 23 (25.6%) |
| $500,000 to $749,999 | 0 (0.0%) | 0 (0.0%) |
| $750,000 to $999,999 | 0 (0.0%) | 0 (0.0%) |
| $1,000,000 or more | 0 (0.0%) | 0 (0.0%) |
| Total | 151 (100.0%) | 90 (100.0%) |
Household Income by Mortgage Status in Lumpkin
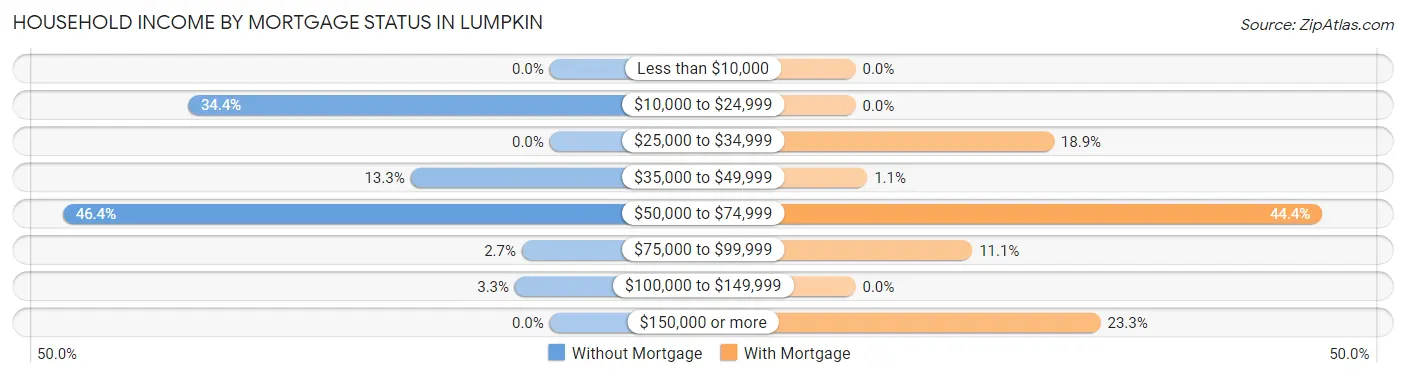
| Household Income | Without Mortgage | With Mortgage |
| Less than $10,000 | 0 (0.0%) | 0 (0.0%) |
| $10,000 to $24,999 | 52 (34.4%) | 0 (0.0%) |
| $25,000 to $34,999 | 0 (0.0%) | 17 (18.9%) |
| $35,000 to $49,999 | 20 (13.3%) | 1 (1.1%) |
| $50,000 to $74,999 | 70 (46.4%) | 40 (44.4%) |
| $75,000 to $99,999 | 4 (2.6%) | 10 (11.1%) |
| $100,000 to $149,999 | 5 (3.3%) | 0 (0.0%) |
| $150,000 or more | 0 (0.0%) | 21 (23.3%) |
| Total | 151 (100.0%) | 90 (100.0%) |
Property Value to Household Income Ratio in Lumpkin
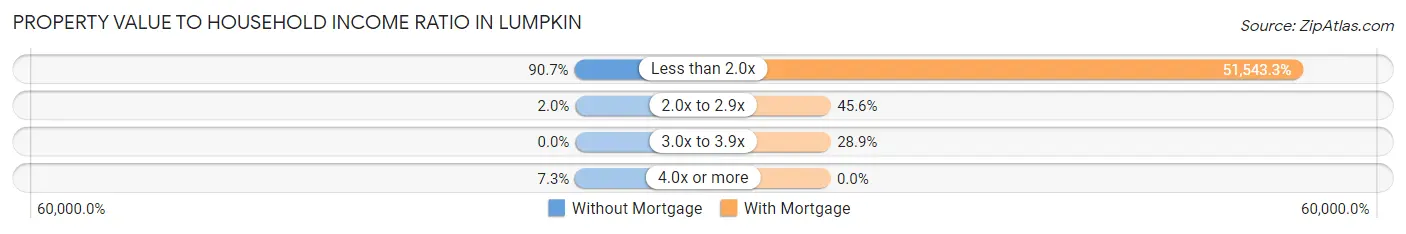
| Value-to-Income Ratio | Without Mortgage | With Mortgage |
| Less than 2.0x | 137 (90.7%) | 46,389 (51,543.3%) |
| 2.0x to 2.9x | 3 (2.0%) | 41 (45.6%) |
| 3.0x to 3.9x | 0 (0.0%) | 26 (28.9%) |
| 4.0x or more | 11 (7.3%) | 0 (0.0%) |
| Total | 151 (100.0%) | 90 (100.0%) |
Real Estate Taxes by Mortgage Status in Lumpkin
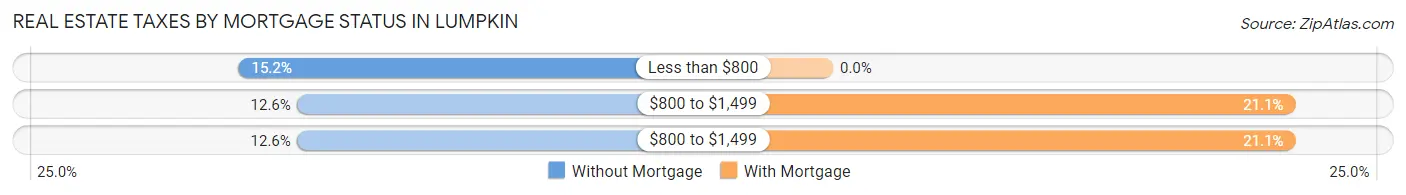
| Property Taxes | Without Mortgage | With Mortgage |
| Less than $800 | 23 (15.2%) | 0 (0.0%) |
| $800 to $1,499 | 19 (12.6%) | 19 (21.1%) |
| $800 to $1,499 | 19 (12.6%) | 19 (21.1%) |
| Total | 151 (100.0%) | 90 (100.0%) |
Health & Disability in Lumpkin
Health Insurance Coverage by Age in Lumpkin
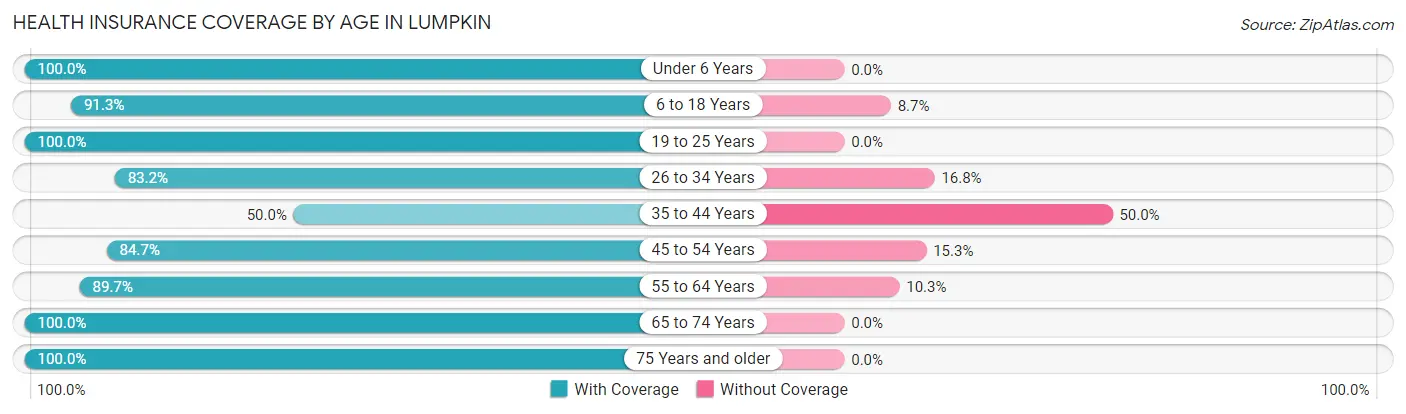
| Age Bracket | With Coverage | Without Coverage |
| Under 6 Years | 15 (100.0%) | 0 (0.0%) |
| 6 to 18 Years | 116 (91.3%) | 11 (8.7%) |
| 19 to 25 Years | 40 (100.0%) | 0 (0.0%) |
| 26 to 34 Years | 193 (83.2%) | 39 (16.8%) |
| 35 to 44 Years | 31 (50.0%) | 31 (50.0%) |
| 45 to 54 Years | 61 (84.7%) | 11 (15.3%) |
| 55 to 64 Years | 70 (89.7%) | 8 (10.3%) |
| 65 to 74 Years | 107 (100.0%) | 0 (0.0%) |
| 75 Years and older | 43 (100.0%) | 0 (0.0%) |
| Total | 676 (87.1%) | 100 (12.9%) |
Health Insurance Coverage by Citizenship Status in Lumpkin
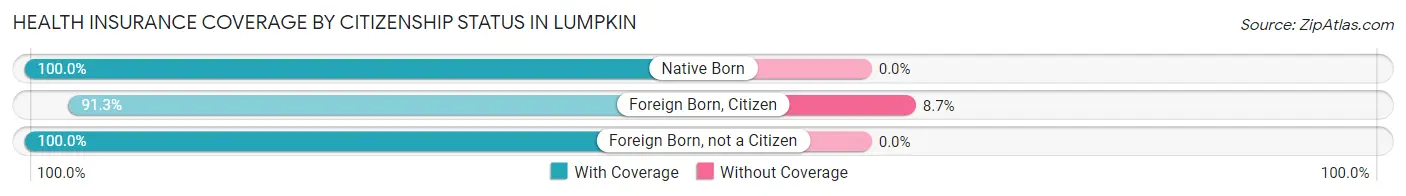
| Citizenship Status | With Coverage | Without Coverage |
| Native Born | 15 (100.0%) | 0 (0.0%) |
| Foreign Born, Citizen | 116 (91.3%) | 11 (8.7%) |
| Foreign Born, not a Citizen | 40 (100.0%) | 0 (0.0%) |
Health Insurance Coverage by Household Income in Lumpkin
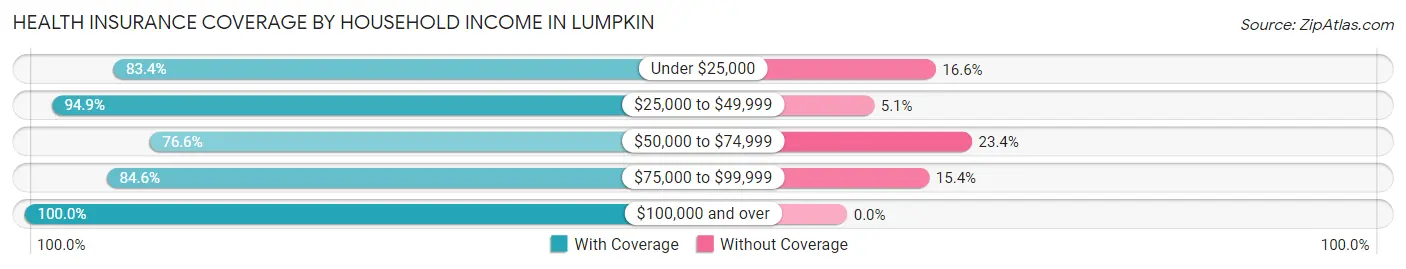
| Household Income | With Coverage | Without Coverage |
| Under $25,000 | 211 (83.4%) | 42 (16.6%) |
| $25,000 to $49,999 | 169 (94.9%) | 9 (5.1%) |
| $50,000 to $74,999 | 154 (76.6%) | 47 (23.4%) |
| $75,000 to $99,999 | 11 (84.6%) | 2 (15.4%) |
| $100,000 and over | 131 (100.0%) | 0 (0.0%) |
Public vs Private Health Insurance Coverage by Age in Lumpkin
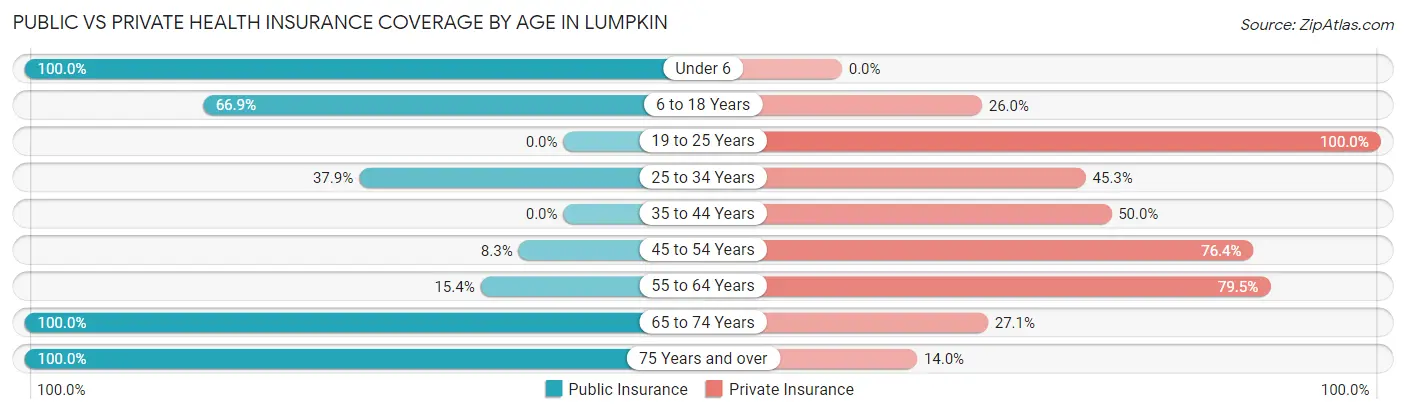
| Age Bracket | Public Insurance | Private Insurance |
| Under 6 | 15 (100.0%) | 0 (0.0%) |
| 6 to 18 Years | 85 (66.9%) | 33 (26.0%) |
| 19 to 25 Years | 0 (0.0%) | 40 (100.0%) |
| 25 to 34 Years | 88 (37.9%) | 105 (45.3%) |
| 35 to 44 Years | 0 (0.0%) | 31 (50.0%) |
| 45 to 54 Years | 6 (8.3%) | 55 (76.4%) |
| 55 to 64 Years | 12 (15.4%) | 62 (79.5%) |
| 65 to 74 Years | 107 (100.0%) | 29 (27.1%) |
| 75 Years and over | 43 (100.0%) | 6 (14.0%) |
| Total | 356 (45.9%) | 361 (46.5%) |
Disability Status by Sex by Age in Lumpkin
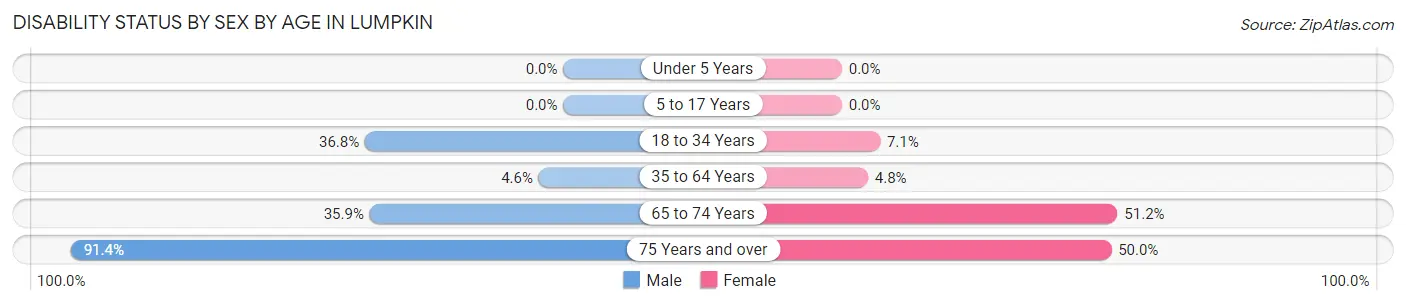
| Age Bracket | Male | Female |
| Under 5 Years | 0 (0.0%) | 0 (0.0%) |
| 5 to 17 Years | 0 (0.0%) | 0 (0.0%) |
| 18 to 34 Years | 67 (36.8%) | 8 (7.1%) |
| 35 to 64 Years | 4 (4.5%) | 6 (4.8%) |
| 65 to 74 Years | 23 (35.9%) | 22 (51.2%) |
| 75 Years and over | 32 (91.4%) | 4 (50.0%) |
Disability Class by Sex by Age in Lumpkin
Disability Class: Hearing Difficulty
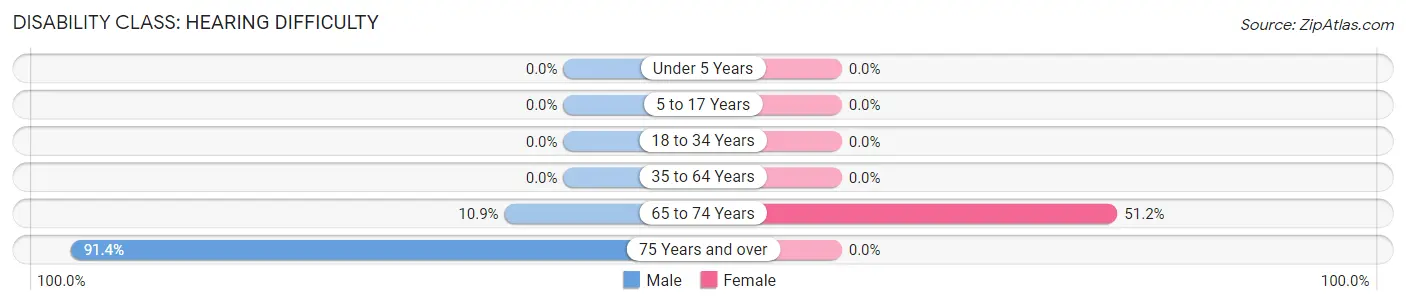
| Age Bracket | Male | Female |
| Under 5 Years | 0 (0.0%) | 0 (0.0%) |
| 5 to 17 Years | 0 (0.0%) | 0 (0.0%) |
| 18 to 34 Years | 0 (0.0%) | 0 (0.0%) |
| 35 to 64 Years | 0 (0.0%) | 0 (0.0%) |
| 65 to 74 Years | 7 (10.9%) | 22 (51.2%) |
| 75 Years and over | 32 (91.4%) | 0 (0.0%) |
Disability Class: Vision Difficulty
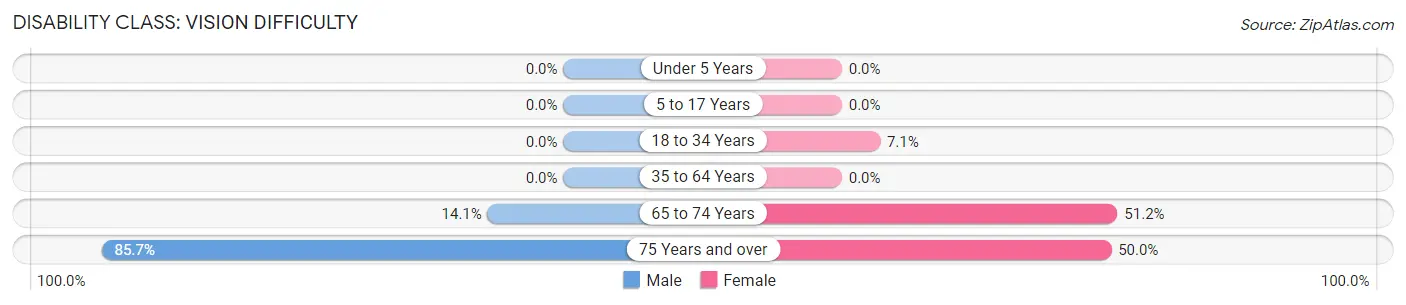
| Age Bracket | Male | Female |
| Under 5 Years | 0 (0.0%) | 0 (0.0%) |
| 5 to 17 Years | 0 (0.0%) | 0 (0.0%) |
| 18 to 34 Years | 0 (0.0%) | 8 (7.1%) |
| 35 to 64 Years | 0 (0.0%) | 0 (0.0%) |
| 65 to 74 Years | 9 (14.1%) | 22 (51.2%) |
| 75 Years and over | 30 (85.7%) | 4 (50.0%) |
Disability Class: Cognitive Difficulty
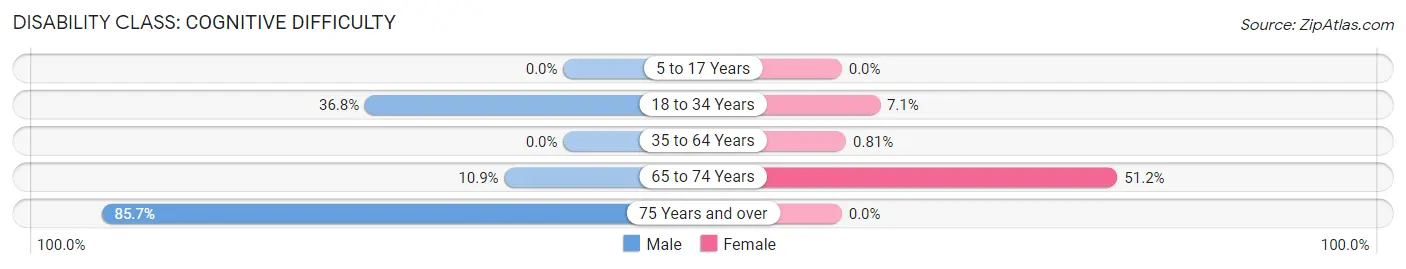
| Age Bracket | Male | Female |
| 5 to 17 Years | 0 (0.0%) | 0 (0.0%) |
| 18 to 34 Years | 67 (36.8%) | 8 (7.1%) |
| 35 to 64 Years | 0 (0.0%) | 1 (0.8%) |
| 65 to 74 Years | 7 (10.9%) | 22 (51.2%) |
| 75 Years and over | 30 (85.7%) | 0 (0.0%) |
Disability Class: Ambulatory Difficulty
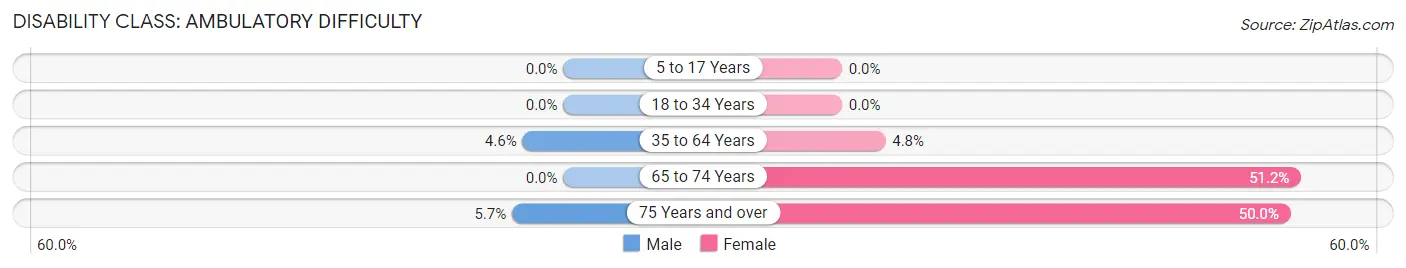
| Age Bracket | Male | Female |
| 5 to 17 Years | 0 (0.0%) | 0 (0.0%) |
| 18 to 34 Years | 0 (0.0%) | 0 (0.0%) |
| 35 to 64 Years | 4 (4.5%) | 6 (4.8%) |
| 65 to 74 Years | 0 (0.0%) | 22 (51.2%) |
| 75 Years and over | 2 (5.7%) | 4 (50.0%) |
Disability Class: Self-Care Difficulty
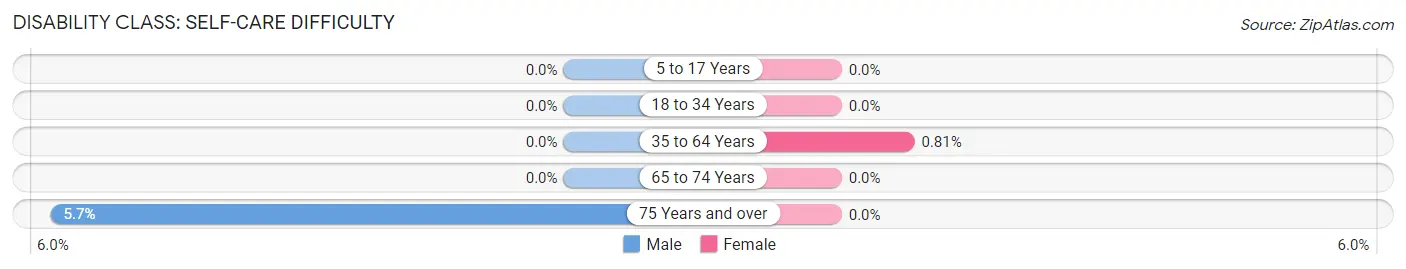
| Age Bracket | Male | Female |
| 5 to 17 Years | 0 (0.0%) | 0 (0.0%) |
| 18 to 34 Years | 0 (0.0%) | 0 (0.0%) |
| 35 to 64 Years | 0 (0.0%) | 1 (0.8%) |
| 65 to 74 Years | 0 (0.0%) | 0 (0.0%) |
| 75 Years and over | 2 (5.7%) | 0 (0.0%) |
Technology Access in Lumpkin
Computing Device Access in Lumpkin
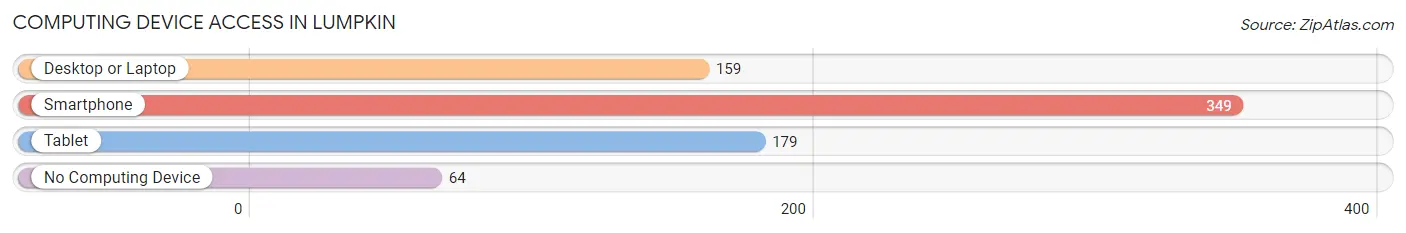
| Device Type | # Households | % Households |
| Desktop or Laptop | 159 | 37.9% |
| Smartphone | 349 | 83.1% |
| Tablet | 179 | 42.6% |
| No Computing Device | 64 | 15.2% |
| Total | 420 | 100.0% |
Internet Access in Lumpkin
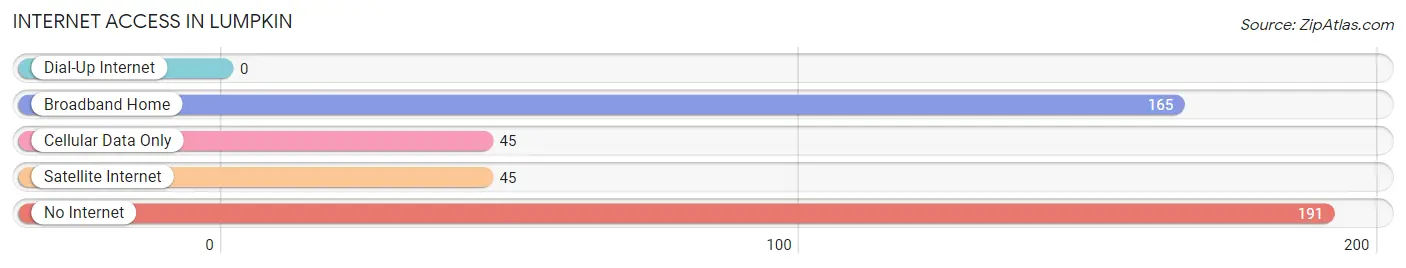
| Internet Type | # Households | % Households |
| Dial-Up Internet | 0 | 0.0% |
| Broadband Home | 165 | 39.3% |
| Cellular Data Only | 45 | 10.7% |
| Satellite Internet | 45 | 10.7% |
| No Internet | 191 | 45.5% |
| Total | 420 | 100.0% |
Lumpkin Summary
Lumpkin, Georgia is a small town located in Stewart County, in the southwestern part of the state. It is situated on the banks of the Chattahoochee River, and is part of the Columbus, Georgia metropolitan area. The town was founded in 1832 and named after Wilson Lumpkin, the Governor of Georgia at the time. The population of Lumpkin was 1,845 as of the 2010 census.
History
Lumpkin was founded in 1832 and named after Wilson Lumpkin, the Governor of Georgia at the time. The town was originally a trading post for the Creek Indians, and was the site of a major battle during the Creek War of 1836. The town was also the site of a major Civil War battle in 1864, when Union forces under General William T. Sherman captured the town. After the war, the town was rebuilt and became a center for cotton production.
Geography
Lumpkin is located in Stewart County, in the southwestern part of the state. It is situated on the banks of the Chattahoochee River, and is part of the Columbus, Georgia metropolitan area. The town is located at an elevation of 441 feet above sea level. The climate is humid subtropical, with hot summers and mild winters.
Economy
Lumpkin’s economy is largely based on agriculture. The town is home to several farms, which produce cotton, corn, soybeans, and other crops. The town is also home to several manufacturing plants, which produce a variety of products, including furniture, textiles, and automotive parts. In addition, the town is home to several retail stores, restaurants, and other businesses.
Demographics
As of the 2010 census, the population of Lumpkin was 1,845. The racial makeup of the town was 79.2% White, 17.3% African American, 0.3% Native American, 0.2% Asian, 0.1% Pacific Islander, and 2.9% from other races. The median household income was $30,938, and the median family income was $37,917. The per capita income was $15,845. The town’s poverty rate was 22.3%.
Lumpkin is a small town with a rich history and a diverse economy. It is home to several farms, manufacturing plants, and other businesses, and is a popular destination for tourists and outdoor enthusiasts. The town is also home to a diverse population, with a variety of racial and ethnic backgrounds.
Common Questions
What is Per Capita Income in Lumpkin?
Per Capita income in Lumpkin is $23,710.
What is the Median Family Income in Lumpkin?
Median Family Income in Lumpkin is $44,659.
What is the Median Household income in Lumpkin?
Median Household Income in Lumpkin is $31,250.
What is Family Income Deficit in Lumpkin?
Family Income Deficit in Lumpkin is $4,897.
Families that are below poverty line in Lumpkin earn $4,897 less on average than the poverty threshold level.
What is Inequality or Gini Index in Lumpkin?
Inequality or Gini Index in Lumpkin is 0.42.
What is the Total Population of Lumpkin?
Total Population of Lumpkin is 776.
What is the Total Male Population of Lumpkin?
Total Male Population of Lumpkin is 416.
What is the Total Female Population of Lumpkin?
Total Female Population of Lumpkin is 360.
What is the Ratio of Males per 100 Females in Lumpkin?
There are 115.56 Males per 100 Females in Lumpkin.
What is the Ratio of Females per 100 Males in Lumpkin?
There are 86.54 Females per 100 Males in Lumpkin.
What is the Median Population Age in Lumpkin?
Median Population Age in Lumpkin is 34.5 Years.
What is the Average Family Size in Lumpkin
Average Family Size in Lumpkin is 3.3 People.
What is the Average Household Size in Lumpkin
Average Household Size in Lumpkin is 1.9 People.
How Large is the Labor Force in Lumpkin?
There are 360 People in the Labor Forcein in Lumpkin.
What is the Percentage of People in the Labor Force in Lumpkin?
53.7% of People are in the Labor Force in Lumpkin.