Pulaski, GA Map & Demographics
Pulaski Map
Pulaski Overview
$24,099
PER CAPITA INCOME
$90,313
AVG FAMILY INCOME
$61,786
AVG HOUSEHOLD INCOME
30.0%
WAGE / INCOME GAP [ % ]
70.0¢/ $1
WAGE / INCOME GAP [ $ ]
0.31
INEQUALITY / GINI INDEX
230
TOTAL POPULATION
90
MALE POPULATION
140
FEMALE POPULATION
64.29
MALES / 100 FEMALES
155.56
FEMALES / 100 MALES
56.0
MEDIAN AGE
3.2
AVG FAMILY SIZE
2.9
AVG HOUSEHOLD SIZE
92
LABOR FORCE [ PEOPLE ]
44.0%
PERCENT IN LABOR FORCE
Pulaski Zip Codes
Pulaski Area Codes
Income in Pulaski
Income Overview in Pulaski
Per Capita Income in Pulaski is $24,099, while median incomes of families and households are $90,313 and $61,786 respectively.
| Characteristic | Number | Measure |
| Per Capita Income | 230 | $24,099 |
| Median Family Income | 35 | $90,313 |
| Mean Family Income | 35 | $96,009 |
| Median Household Income | 50 | $61,786 |
| Mean Household Income | 50 | $80,870 |
| Income Deficit | 35 | $0 |
| Wage / Income Gap (%) | 230 | 30.04% |
| Wage / Income Gap ($) | 230 | 69.96¢ per $1 |
| Gini / Inequality Index | 230 | 0.31 |
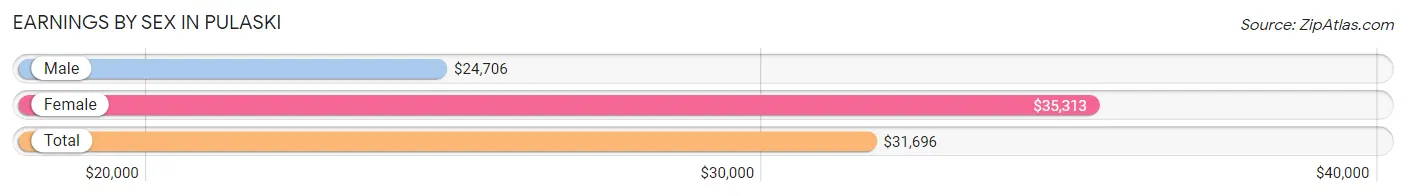
Earnings by Sex in Pulaski
Average Earnings in Pulaski are $31,696, $24,706 for men and $35,313 for women, a difference of 30.0%.
| Sex | Number | Average Earnings |
| Male | 54 (58.1%) | $24,706 |
| Female | 39 (41.9%) | $35,313 |
| Total | 93 (100.0%) | $31,696 |
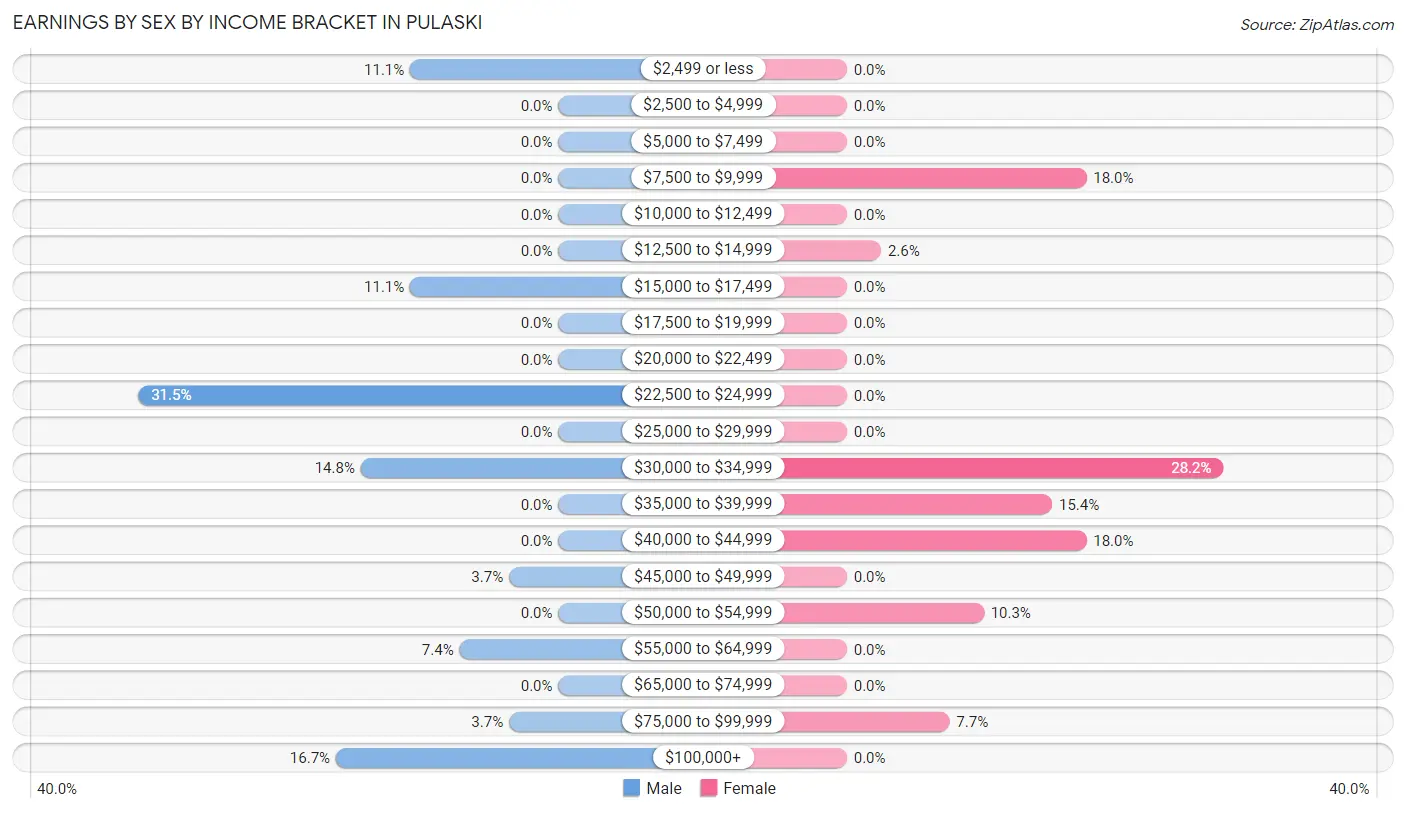
Earnings by Sex by Income Bracket in Pulaski
The most common earnings brackets in Pulaski are $22,500 to $24,999 for men (17 | 31.5%) and $30,000 to $34,999 for women (11 | 28.2%).
| Income | Male | Female |
| $2,499 or less | 6 (11.1%) | 0 (0.0%) |
| $2,500 to $4,999 | 0 (0.0%) | 0 (0.0%) |
| $5,000 to $7,499 | 0 (0.0%) | 0 (0.0%) |
| $7,500 to $9,999 | 0 (0.0%) | 7 (17.9%) |
| $10,000 to $12,499 | 0 (0.0%) | 0 (0.0%) |
| $12,500 to $14,999 | 0 (0.0%) | 1 (2.6%) |
| $15,000 to $17,499 | 6 (11.1%) | 0 (0.0%) |
| $17,500 to $19,999 | 0 (0.0%) | 0 (0.0%) |
| $20,000 to $22,499 | 0 (0.0%) | 0 (0.0%) |
| $22,500 to $24,999 | 17 (31.5%) | 0 (0.0%) |
| $25,000 to $29,999 | 0 (0.0%) | 0 (0.0%) |
| $30,000 to $34,999 | 8 (14.8%) | 11 (28.2%) |
| $35,000 to $39,999 | 0 (0.0%) | 6 (15.4%) |
| $40,000 to $44,999 | 0 (0.0%) | 7 (17.9%) |
| $45,000 to $49,999 | 2 (3.7%) | 0 (0.0%) |
| $50,000 to $54,999 | 0 (0.0%) | 4 (10.3%) |
| $55,000 to $64,999 | 4 (7.4%) | 0 (0.0%) |
| $65,000 to $74,999 | 0 (0.0%) | 0 (0.0%) |
| $75,000 to $99,999 | 2 (3.7%) | 3 (7.7%) |
| $100,000+ | 9 (16.7%) | 0 (0.0%) |
| Total | 54 (100.0%) | 39 (100.0%) |
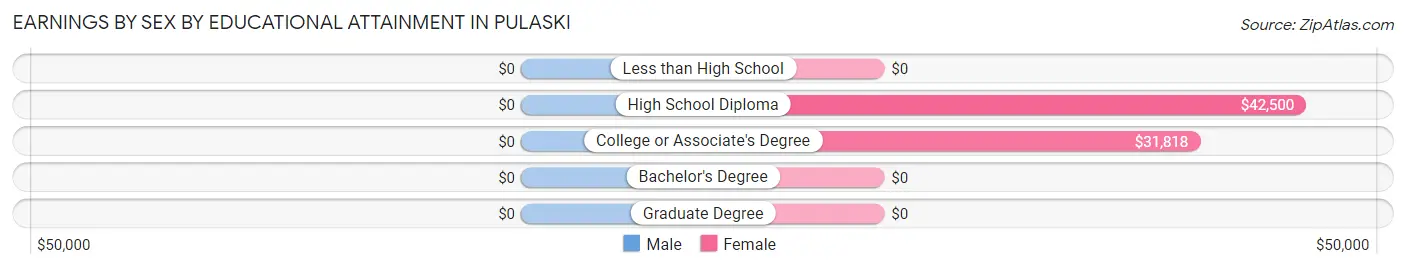
Earnings by Sex by Educational Attainment in Pulaski
| Educational Attainment | Male Income | Female Income |
| Less than High School | - | - |
| High School Diploma | - | - |
| College or Associate's Degree | - | - |
| Bachelor's Degree | - | - |
| Graduate Degree | - | - |
| Total | $33,000 | $35,313 |
Family Income in Pulaski
Family Income Brackets in Pulaski
According to the Pulaski family income data, there are 15 families falling into the $50,000 to $74,999 income range, which is the most common income bracket and makes up 42.9% of all families.
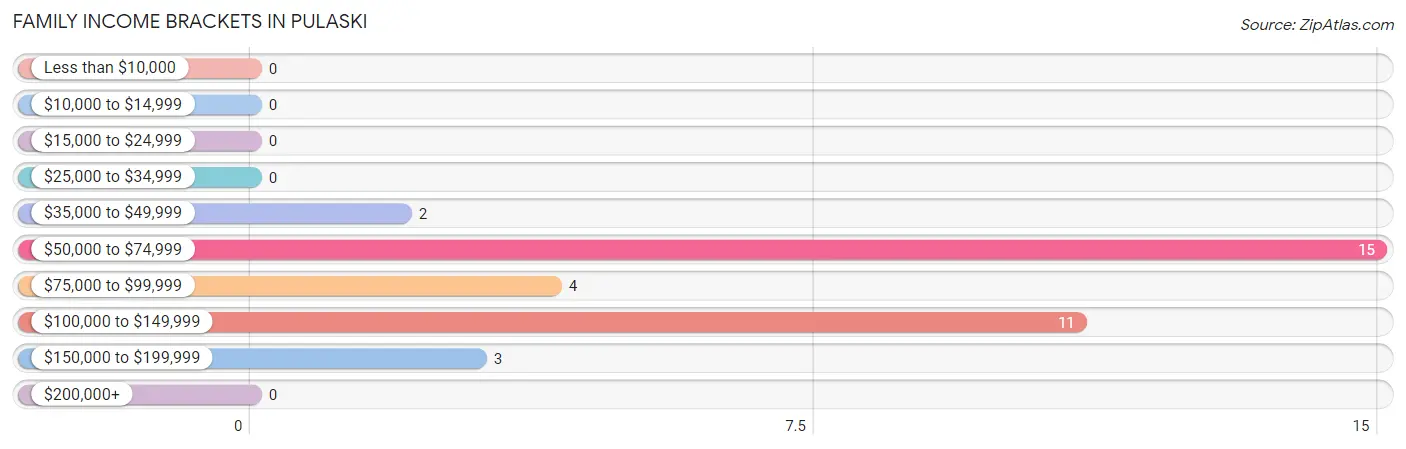
| Income Bracket | # Families | % Families |
| Less than $10,000 | 0 | 0.0% |
| $10,000 to $14,999 | 0 | 0.0% |
| $15,000 to $24,999 | 0 | 0.0% |
| $25,000 to $34,999 | 0 | 0.0% |
| $35,000 to $49,999 | 2 | 5.7% |
| $50,000 to $74,999 | 15 | 42.9% |
| $75,000 to $99,999 | 4 | 11.4% |
| $100,000 to $149,999 | 11 | 31.4% |
| $150,000 to $199,999 | 3 | 8.6% |
| $200,000+ | 0 | 0.0% |
Family Income by Famaliy Size in Pulaski
2-person families (20 | 57.1%) account for the highest median family income in Pulaski with $115,000 per family, while 2-person families (20 | 57.1%) have the highest median income of $57,500 per family member.
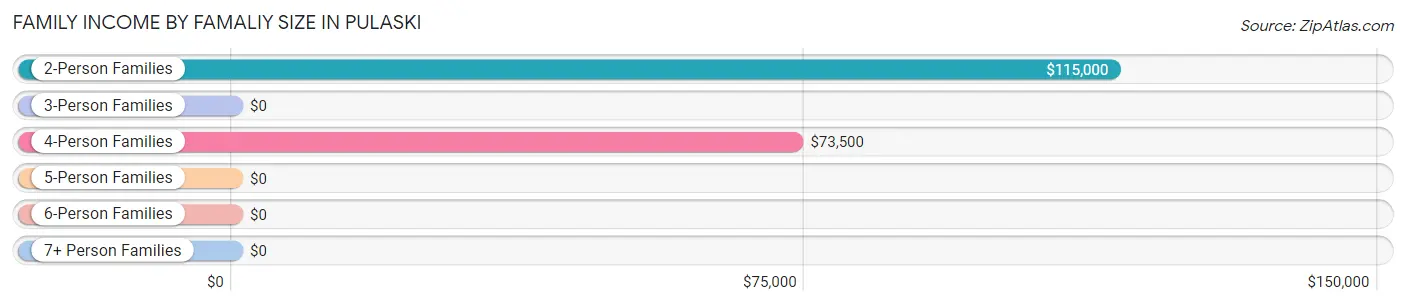
| Income Bracket | # Families | Median Income |
| 2-Person Families | 20 (57.1%) | $115,000 |
| 3-Person Families | 7 (20.0%) | $0 |
| 4-Person Families | 8 (22.9%) | $73,500 |
| 5-Person Families | 0 (0.0%) | $0 |
| 6-Person Families | 0 (0.0%) | $0 |
| 7+ Person Families | 0 (0.0%) | $0 |
| Total | 35 (100.0%) | $90,313 |
Family Income by Number of Earners in Pulaski
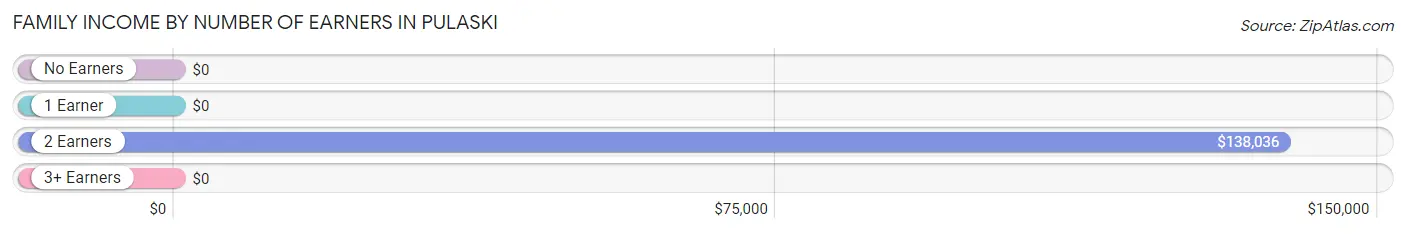
| Number of Earners | # Families | Median Income |
| No Earners | 6 (17.1%) | $0 |
| 1 Earner | 6 (17.1%) | $0 |
| 2 Earners | 17 (48.6%) | $138,036 |
| 3+ Earners | 6 (17.1%) | $0 |
| Total | 35 (100.0%) | $90,313 |
Household Income in Pulaski
Household Income Brackets in Pulaski
With 24 households falling in the category, the $50,000 to $74,999 income range is the most frequent in Pulaski, accounting for 48.0% of all households.
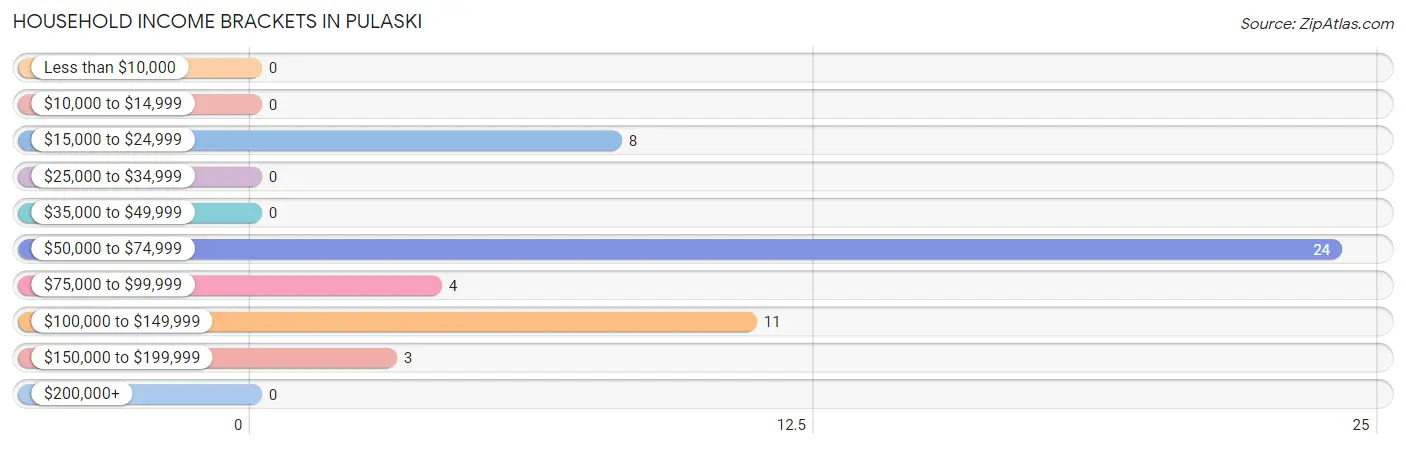
| Income Bracket | # Households | % Households |
| Less than $10,000 | 0 | 0.0% |
| $10,000 to $14,999 | 0 | 0.0% |
| $15,000 to $24,999 | 8 | 16.0% |
| $25,000 to $34,999 | 0 | 0.0% |
| $35,000 to $49,999 | 0 | 0.0% |
| $50,000 to $74,999 | 24 | 48.0% |
| $75,000 to $99,999 | 4 | 8.0% |
| $100,000 to $149,999 | 11 | 22.0% |
| $150,000 to $199,999 | 3 | 6.0% |
| $200,000+ | 0 | 0.0% |
Household Income by Householder Age in Pulaski
The median household income in Pulaski is $61,786, with the highest median household income of $130,833 found in the 45 to 64 years age bracket for the primary householder. A total of 24 households (48.0%) fall into this category.
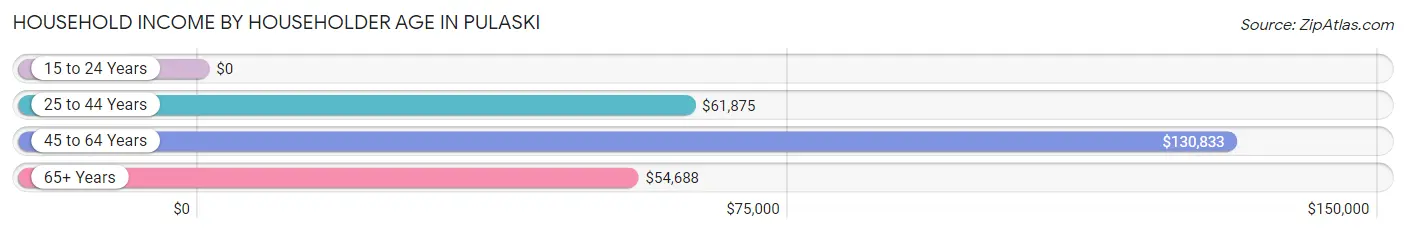
| Income Bracket | # Households | Median Income |
| 15 to 24 Years | 0 (0.0%) | $0 |
| 25 to 44 Years | 13 (26.0%) | $61,875 |
| 45 to 64 Years | 24 (48.0%) | $130,833 |
| 65+ Years | 13 (26.0%) | $54,688 |
| Total | 50 (100.0%) | $61,786 |
Poverty in Pulaski
Income Below Poverty by Sex and Age in Pulaski
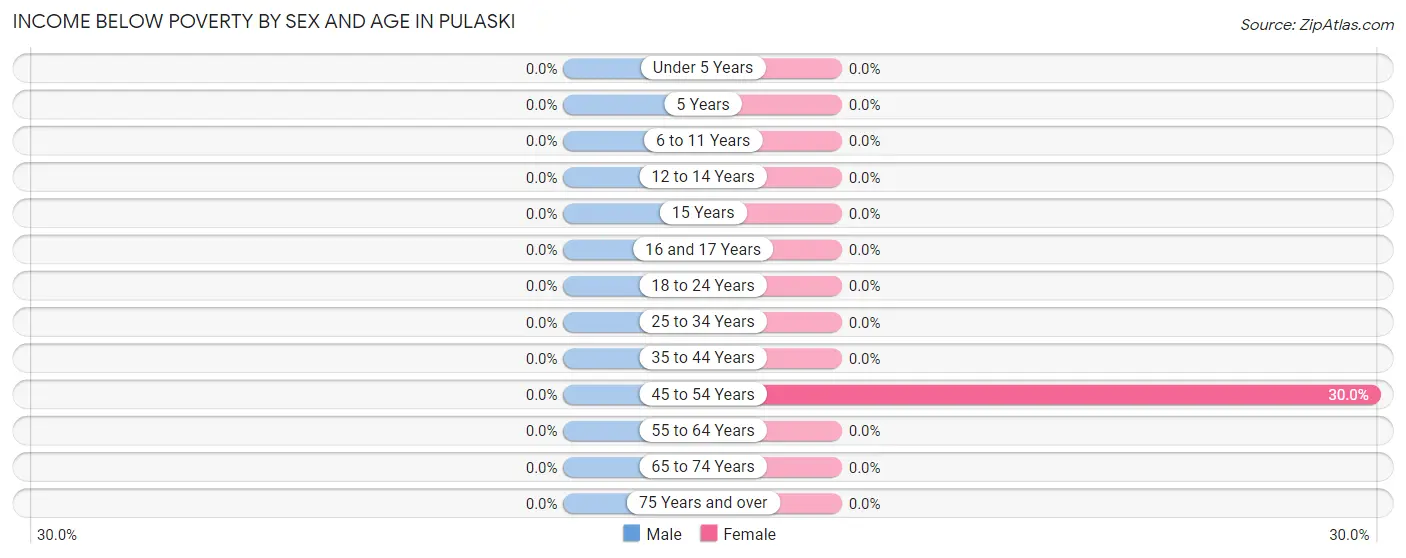
| Age Bracket | Male | Female |
| Under 5 Years | 0 (0.0%) | 0 (0.0%) |
| 5 Years | 0 (0.0%) | 0 (0.0%) |
| 6 to 11 Years | 0 (0.0%) | 0 (0.0%) |
| 12 to 14 Years | 0 (0.0%) | 0 (0.0%) |
| 15 Years | 0 (0.0%) | 0 (0.0%) |
| 16 and 17 Years | 0 (0.0%) | 0 (0.0%) |
| 18 to 24 Years | 0 (0.0%) | 0 (0.0%) |
| 25 to 34 Years | 0 (0.0%) | 0 (0.0%) |
| 35 to 44 Years | 0 (0.0%) | 0 (0.0%) |
| 45 to 54 Years | 0 (0.0%) | 3 (30.0%) |
| 55 to 64 Years | 0 (0.0%) | 0 (0.0%) |
| 65 to 74 Years | 0 (0.0%) | 0 (0.0%) |
| 75 Years and over | 0 (0.0%) | 0 (0.0%) |
| Total | 0 (0.0%) | 3 (3.7%) |
Income Above Poverty by Sex and Age in Pulaski
According to the poverty statistics in Pulaski, males aged under 5 years and females aged 6 to 11 years are the age groups that are most secure financially, with 100.0% of males and 100.0% of females in these age groups living above the poverty line.
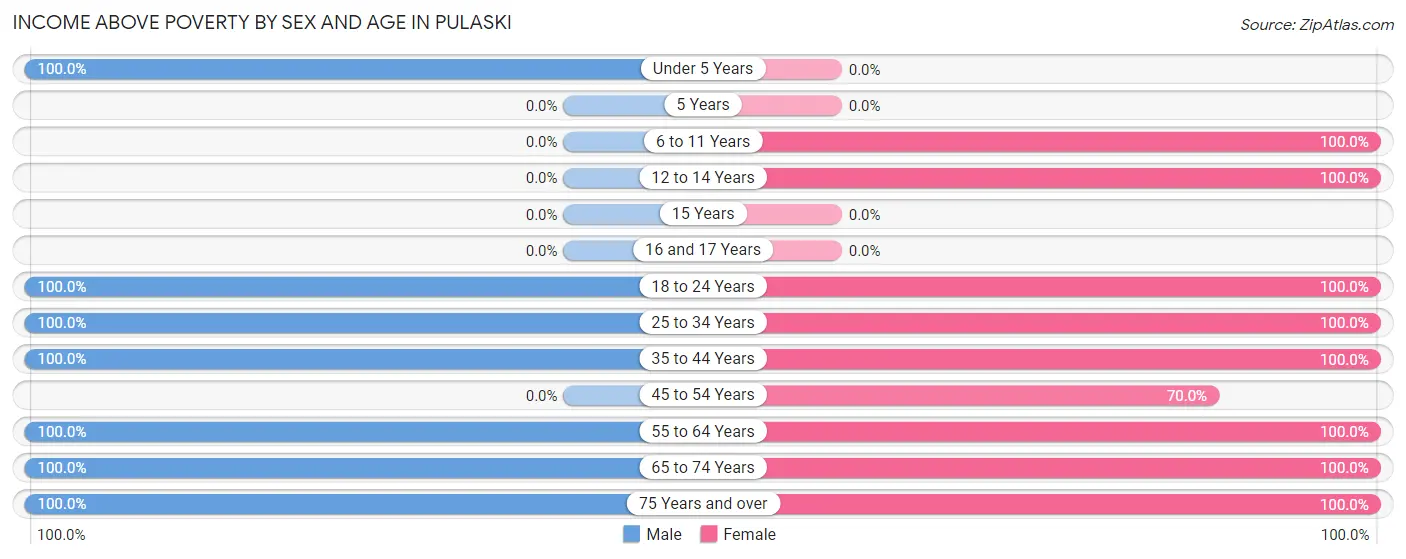
| Age Bracket | Male | Female |
| Under 5 Years | 3 (100.0%) | 0 (0.0%) |
| 5 Years | 0 (0.0%) | 0 (0.0%) |
| 6 to 11 Years | 0 (0.0%) | 17 (100.0%) |
| 12 to 14 Years | 0 (0.0%) | 1 (100.0%) |
| 15 Years | 0 (0.0%) | 0 (0.0%) |
| 16 and 17 Years | 0 (0.0%) | 0 (0.0%) |
| 18 to 24 Years | 12 (100.0%) | 2 (100.0%) |
| 25 to 34 Years | 22 (100.0%) | 18 (100.0%) |
| 35 to 44 Years | 3 (100.0%) | 7 (100.0%) |
| 45 to 54 Years | 0 (0.0%) | 7 (70.0%) |
| 55 to 64 Years | 15 (100.0%) | 13 (100.0%) |
| 65 to 74 Years | 3 (100.0%) | 9 (100.0%) |
| 75 Years and over | 5 (100.0%) | 3 (100.0%) |
| Total | 63 (100.0%) | 77 (96.3%) |
Income Below Poverty Among Married-Couple Families in Pulaski
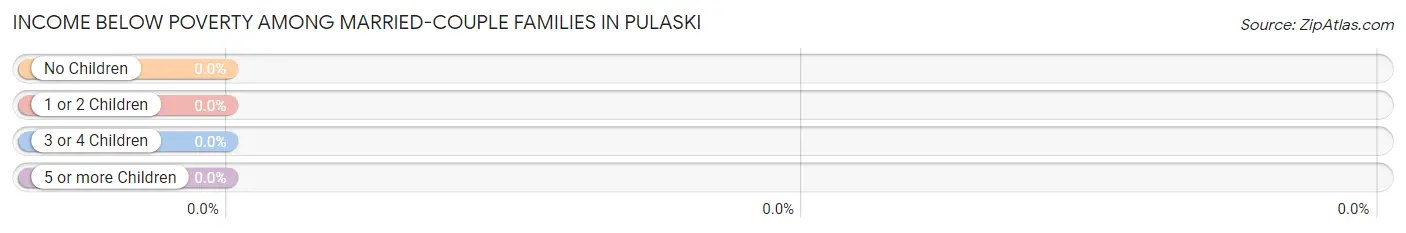
| Children | Above Poverty | Below Poverty |
| No Children | 19 (100.0%) | 0 (0.0%) |
| 1 or 2 Children | 7 (100.0%) | 0 (0.0%) |
| 3 or 4 Children | 0 (0.0%) | 0 (0.0%) |
| 5 or more Children | 0 (0.0%) | 0 (0.0%) |
| Total | 26 (100.0%) | 0 (0.0%) |
Income Below Poverty Among Single-Parent Households in Pulaski
| Children | Single Father | Single Mother |
| No Children | 0 (0.0%) | 0 (0.0%) |
| 1 or 2 Children | 0 (0.0%) | 0 (0.0%) |
| 3 or 4 Children | 0 (0.0%) | 0 (0.0%) |
| 5 or more Children | 0 (0.0%) | 0 (0.0%) |
| Total | 0 (0.0%) | 0 (0.0%) |
Income Below Poverty Among Married-Couple vs Single-Parent Households in Pulaski
| Children | Married-Couple Families | Single-Parent Households |
| No Children | 0 (0.0%) | 0 (0.0%) |
| 1 or 2 Children | 0 (0.0%) | 0 (0.0%) |
| 3 or 4 Children | 0 (0.0%) | 0 (0.0%) |
| 5 or more Children | 0 (0.0%) | 0 (0.0%) |
| Total | 0 (0.0%) | 0 (0.0%) |
Race in Pulaski
The most populous races in Pulaski are White / Caucasian (155 | 67.4%), Black / African American (63 | 27.4%), and Two or more Races (12 | 5.2%).
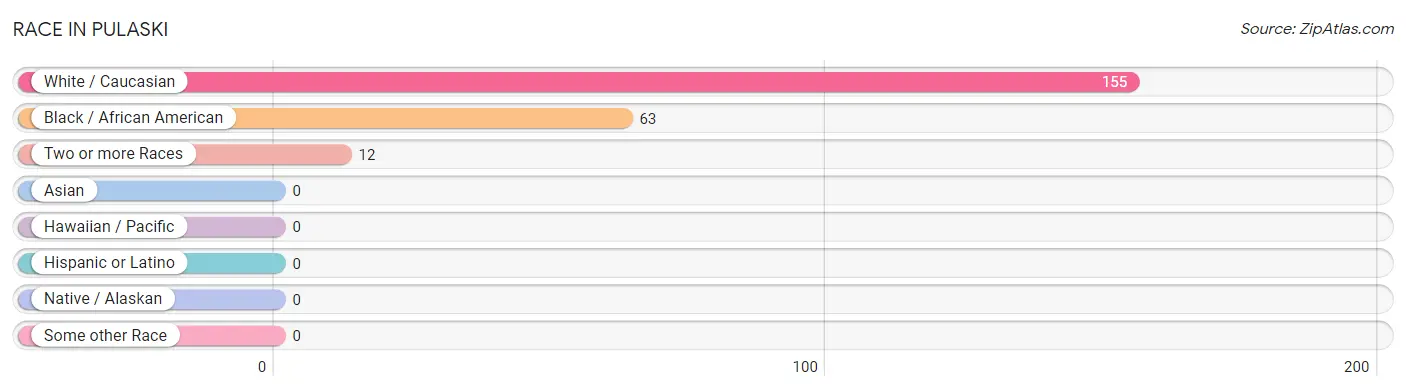
| Race | # Population | % Population |
| Asian | 0 | 0.0% |
| Black / African American | 63 | 27.4% |
| Hawaiian / Pacific | 0 | 0.0% |
| Hispanic or Latino | 0 | 0.0% |
| Native / Alaskan | 0 | 0.0% |
| White / Caucasian | 155 | 67.4% |
| Two or more Races | 12 | 5.2% |
| Some other Race | 0 | 0.0% |
| Total | 230 | 100.0% |
Ancestry in Pulaski
The most populous ancestries reported in Pulaski are American (62 | 27.0%), English (12 | 5.2%), and Canadian (5 | 2.2%), together accounting for 34.4% of all Pulaski residents.
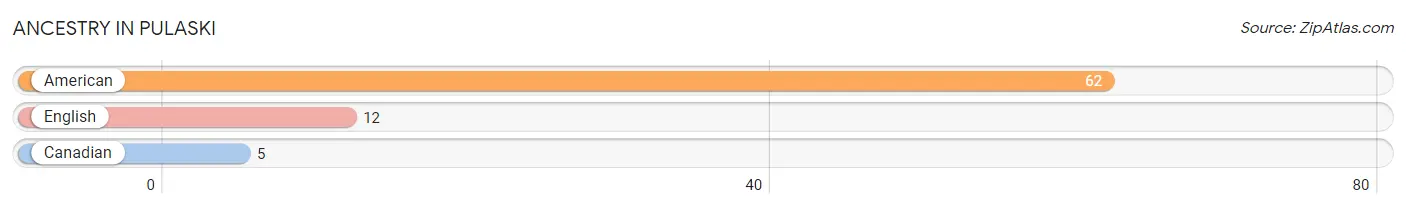
| Ancestry | # Population | % Population |
| American | 62 | 27.0% |
| Canadian | 5 | 2.2% |
| English | 12 | 5.2% | View All 3 Rows |
Immigrants in Pulaski
The most numerous immigrant groups reported in Pulaski came from , and Canada (5 | 2.2%), together accounting for 2.2% of all Pulaski residents.

| Immigration Origin | # Population | % Population |
| Canada | 5 | 2.2% | View All 1 Rows |
Sex and Age in Pulaski
Sex and Age in Pulaski
The most populous age groups in Pulaski are 60 to 64 Years (23 | 25.6%) for men and 60 to 64 Years (24 | 17.1%) for women.
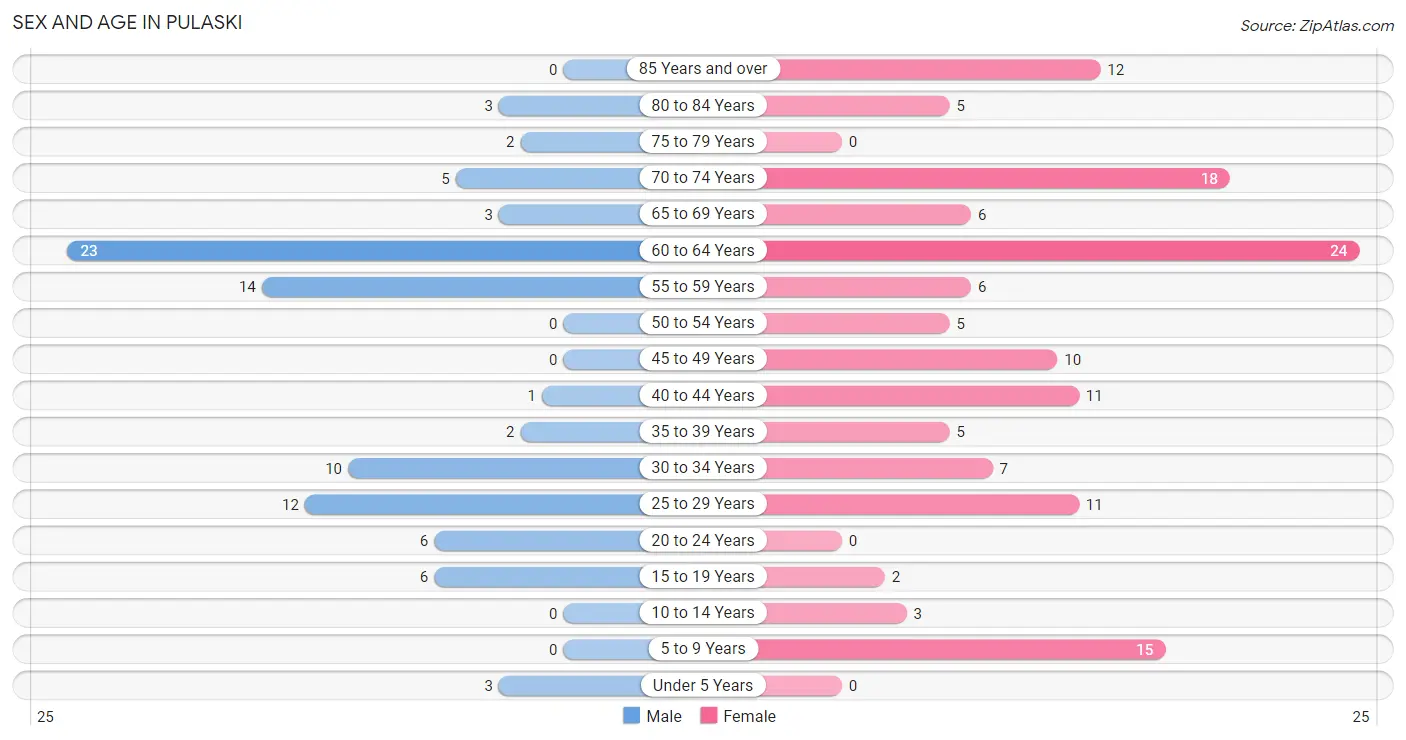
| Age Bracket | Male | Female |
| Under 5 Years | 3 (3.3%) | 0 (0.0%) |
| 5 to 9 Years | 0 (0.0%) | 15 (10.7%) |
| 10 to 14 Years | 0 (0.0%) | 3 (2.1%) |
| 15 to 19 Years | 6 (6.7%) | 2 (1.4%) |
| 20 to 24 Years | 6 (6.7%) | 0 (0.0%) |
| 25 to 29 Years | 12 (13.3%) | 11 (7.9%) |
| 30 to 34 Years | 10 (11.1%) | 7 (5.0%) |
| 35 to 39 Years | 2 (2.2%) | 5 (3.6%) |
| 40 to 44 Years | 1 (1.1%) | 11 (7.9%) |
| 45 to 49 Years | 0 (0.0%) | 10 (7.1%) |
| 50 to 54 Years | 0 (0.0%) | 5 (3.6%) |
| 55 to 59 Years | 14 (15.6%) | 6 (4.3%) |
| 60 to 64 Years | 23 (25.6%) | 24 (17.1%) |
| 65 to 69 Years | 3 (3.3%) | 6 (4.3%) |
| 70 to 74 Years | 5 (5.6%) | 18 (12.9%) |
| 75 to 79 Years | 2 (2.2%) | 0 (0.0%) |
| 80 to 84 Years | 3 (3.3%) | 5 (3.6%) |
| 85 Years and over | 0 (0.0%) | 12 (8.6%) |
| Total | 90 (100.0%) | 140 (100.0%) |
Families and Households in Pulaski
Median Family Size in Pulaski
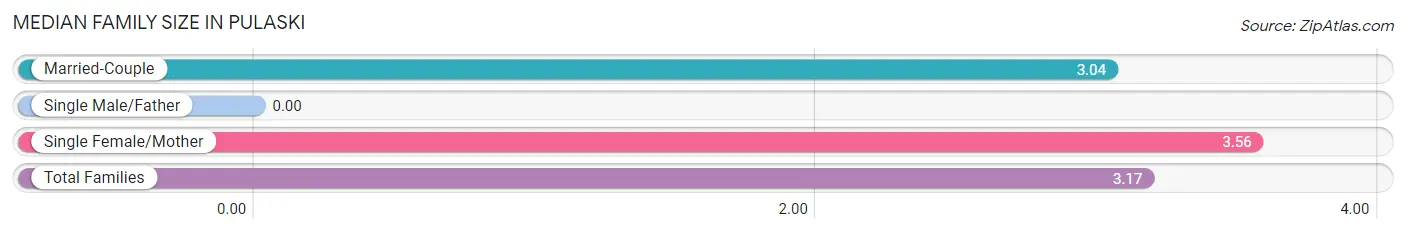
| Family Type | # Families | Family Size |
| Married-Couple | 26 (74.3%) | 3.04 |
| Single Male/Father | 0 (0.0%) | - |
| Single Female/Mother | 9 (25.7%) | 3.56 |
| Total Families | 35 (100.0%) | 3.17 |
Median Household Size in Pulaski
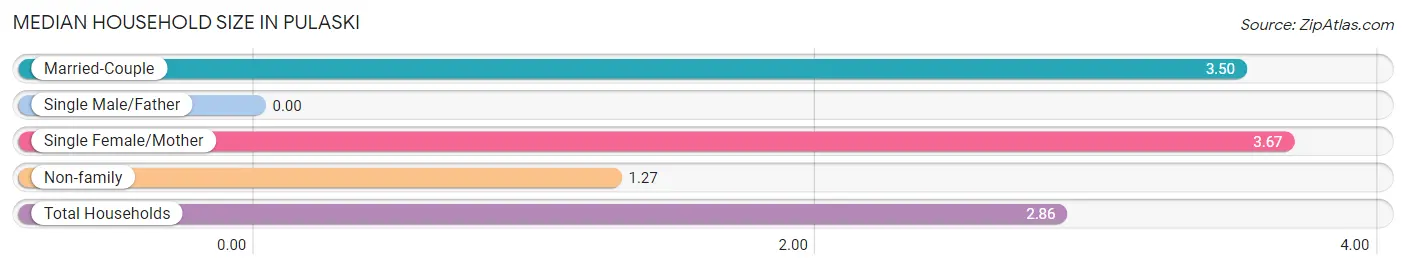
| Household Type | # Households | Household Size |
| Married-Couple | 26 (52.0%) | 3.50 |
| Single Male/Father | 0 (0.0%) | - |
| Single Female/Mother | 9 (18.0%) | 3.67 |
| Non-family | 15 (30.0%) | 1.27 |
| Total Households | 50 (100.0%) | 2.86 |
Household Size by Marriage Status in Pulaski
Out of a total of 50 households in Pulaski, 35 (70.0%) are family households, while 15 (30.0%) are nonfamily households. The most numerous type of family households are 2-person households, comprising 20, and the most common type of nonfamily households are 1-person households, comprising 12.
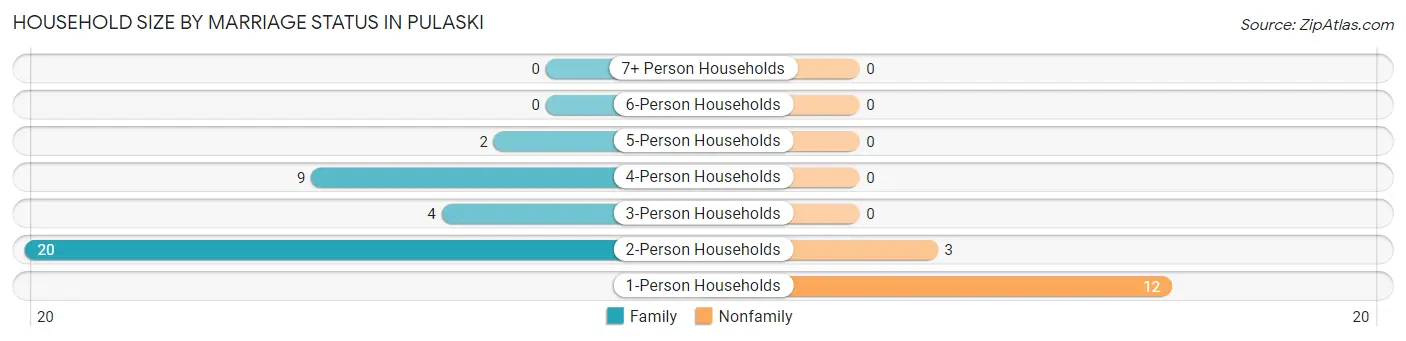
| Household Size | Family Households | Nonfamily Households |
| 1-Person Households | - | 12 (24.0%) |
| 2-Person Households | 20 (40.0%) | 3 (6.0%) |
| 3-Person Households | 4 (8.0%) | 0 (0.0%) |
| 4-Person Households | 9 (18.0%) | 0 (0.0%) |
| 5-Person Households | 2 (4.0%) | 0 (0.0%) |
| 6-Person Households | 0 (0.0%) | 0 (0.0%) |
| 7+ Person Households | 0 (0.0%) | 0 (0.0%) |
| Total | 35 (70.0%) | 15 (30.0%) |
Female Fertility in Pulaski
Fertility by Age in Pulaski
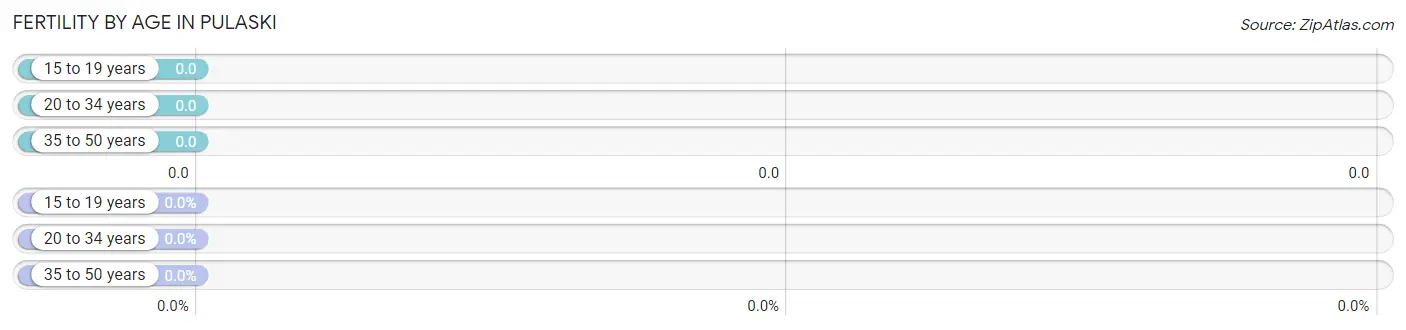
| Age Bracket | Women with Births | Births / 1,000 Women |
| 15 to 19 years | 0 (0.0%) | 0.0 |
| 20 to 34 years | 0 (0.0%) | 0.0 |
| 35 to 50 years | 0 (0.0%) | 0.0 |
| Total | 0 (0.0%) | 0.0 |
Fertility by Age by Marriage Status in Pulaski
| Age Bracket | Married | Unmarried |
| 15 to 19 years | 0 (0.0%) | 0 (0.0%) |
| 20 to 34 years | 0 (0.0%) | 0 (0.0%) |
| 35 to 50 years | 0 (0.0%) | 0 (0.0%) |
| Total | 0 (0.0%) | 0 (0.0%) |
Fertility by Education in Pulaski
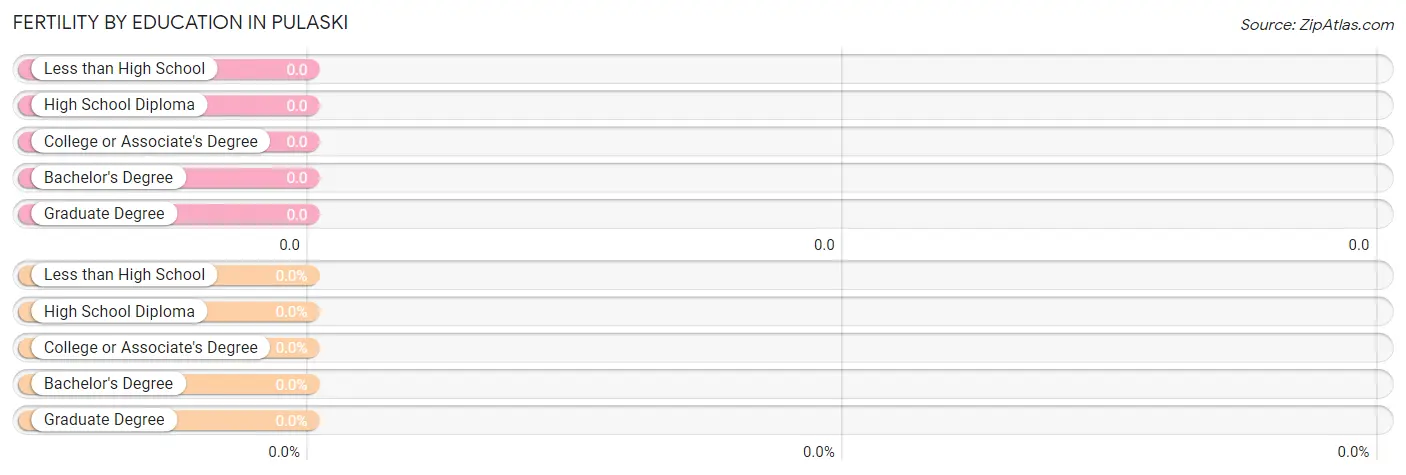
| Educational Attainment | Women with Births | Births / 1,000 Women |
| Less than High School | 0 (0.0%) | 0.0 |
| High School Diploma | 0 (0.0%) | 0.0 |
| College or Associate's Degree | 0 (0.0%) | 0.0 |
| Bachelor's Degree | 0 (0.0%) | 0.0 |
| Graduate Degree | 0 (0.0%) | 0.0 |
| Total | 0 (0.0%) | 0.0 |
Fertility by Education by Marriage Status in Pulaski
| Educational Attainment | Married | Unmarried |
| Less than High School | 0 (0.0%) | 0 (0.0%) |
| High School Diploma | 0 (0.0%) | 0 (0.0%) |
| College or Associate's Degree | 0 (0.0%) | 0 (0.0%) |
| Bachelor's Degree | 0 (0.0%) | 0 (0.0%) |
| Graduate Degree | 0 (0.0%) | 0 (0.0%) |
| Total | 0 (0.0%) | 0 (0.0%) |
Employment Characteristics in Pulaski
Employment by Class of Employer in Pulaski
Among the 92 employed individuals in Pulaski, private company employees (66 | 71.7%), local government employees (11 | 12.0%), and not-for-profit organizations (7 | 7.6%) make up the most common classes of employment.
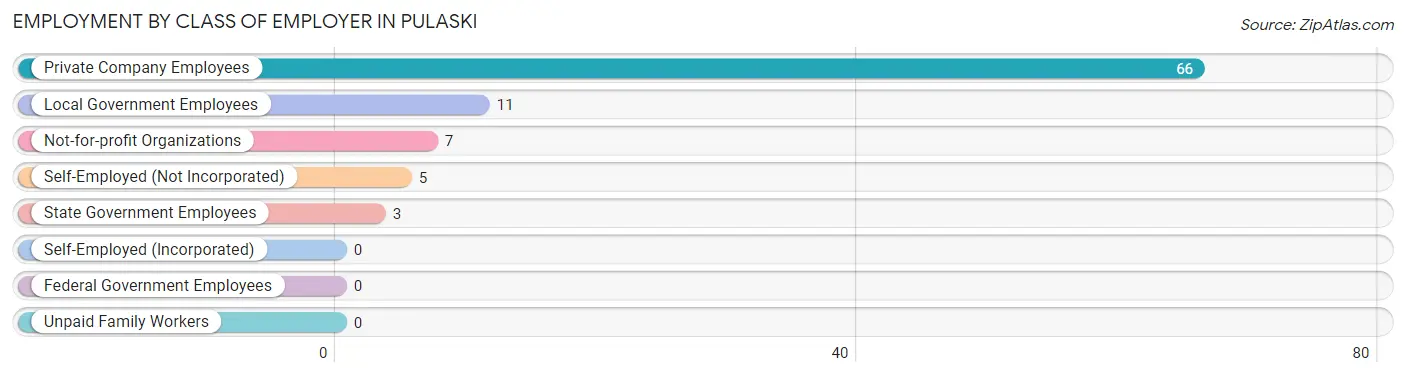
| Employer Class | # Employees | % Employees |
| Private Company Employees | 66 | 71.7% |
| Self-Employed (Incorporated) | 0 | 0.0% |
| Self-Employed (Not Incorporated) | 5 | 5.4% |
| Not-for-profit Organizations | 7 | 7.6% |
| Local Government Employees | 11 | 12.0% |
| State Government Employees | 3 | 3.3% |
| Federal Government Employees | 0 | 0.0% |
| Unpaid Family Workers | 0 | 0.0% |
| Total | 92 | 100.0% |
Employment Status by Age in Pulaski
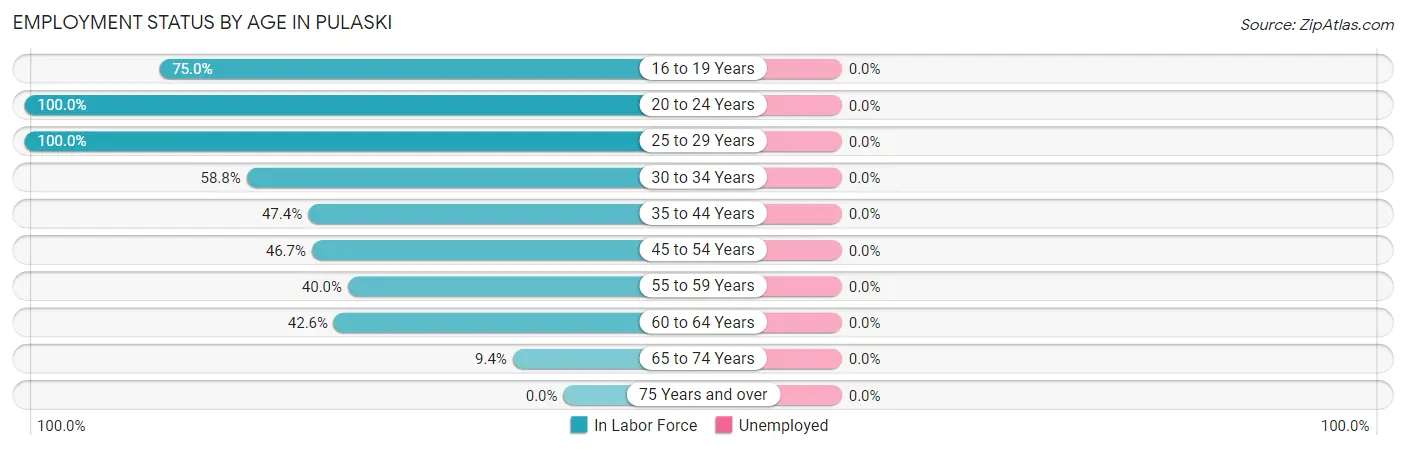
| Age Bracket | In Labor Force | Unemployed |
| 16 to 19 Years | 6 (75.0%) | 0 (0.0%) |
| 20 to 24 Years | 6 (100.0%) | 0 (0.0%) |
| 25 to 29 Years | 23 (100.0%) | 0 (0.0%) |
| 30 to 34 Years | 10 (58.8%) | 0 (0.0%) |
| 35 to 44 Years | 9 (47.4%) | 0 (0.0%) |
| 45 to 54 Years | 7 (46.7%) | 0 (0.0%) |
| 55 to 59 Years | 8 (40.0%) | 0 (0.0%) |
| 60 to 64 Years | 20 (42.6%) | 0 (0.0%) |
| 65 to 74 Years | 3 (9.4%) | 0 (0.0%) |
| 75 Years and over | 0 (0.0%) | 0 (0.0%) |
| Total | 92 (44.0%) | 0 (0.0%) |
Employment Status by Educational Attainment in Pulaski
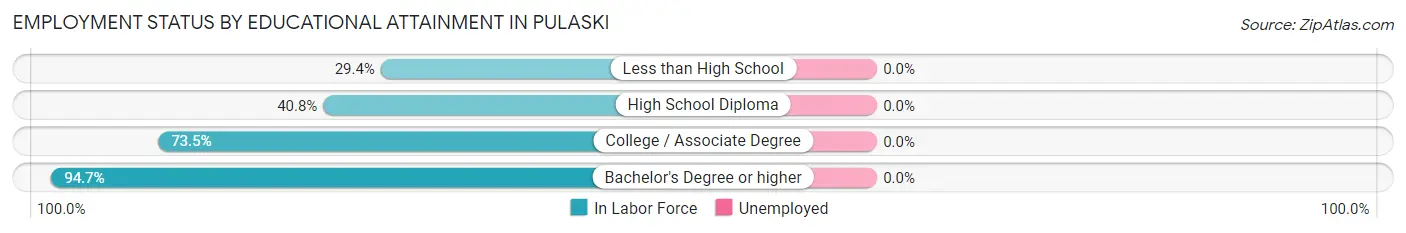
| Educational Attainment | In Labor Force | Unemployed |
| Less than High School | 5 (29.4%) | 0 (0.0%) |
| High School Diploma | 29 (40.8%) | 0 (0.0%) |
| College / Associate Degree | 25 (73.5%) | 0 (0.0%) |
| Bachelor's Degree or higher | 18 (94.7%) | 0 (0.0%) |
| Total | 77 (54.6%) | 0 (0.0%) |
Employment Occupations by Sex in Pulaski
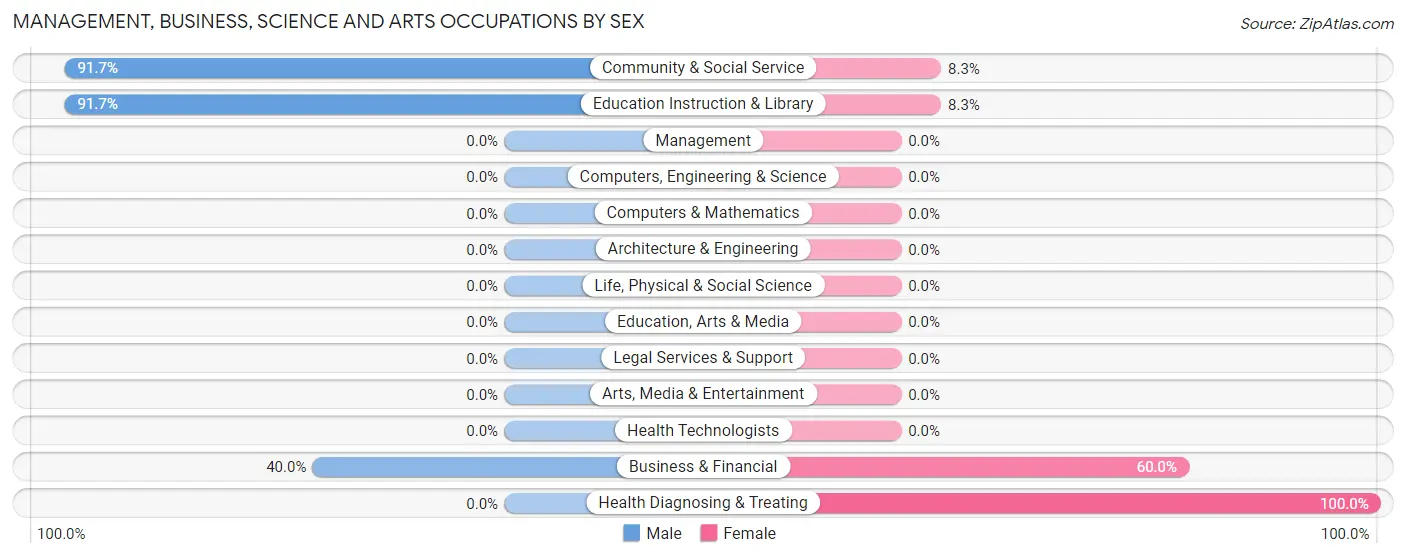
Management, Business, Science and Arts Occupations
The most common Management, Business, Science and Arts occupations in Pulaski are Community & Social Service (12 | 13.0%), Education Instruction & Library (12 | 13.0%), Health Diagnosing & Treating (11 | 12.0%), and Business & Financial (5 | 5.4%).
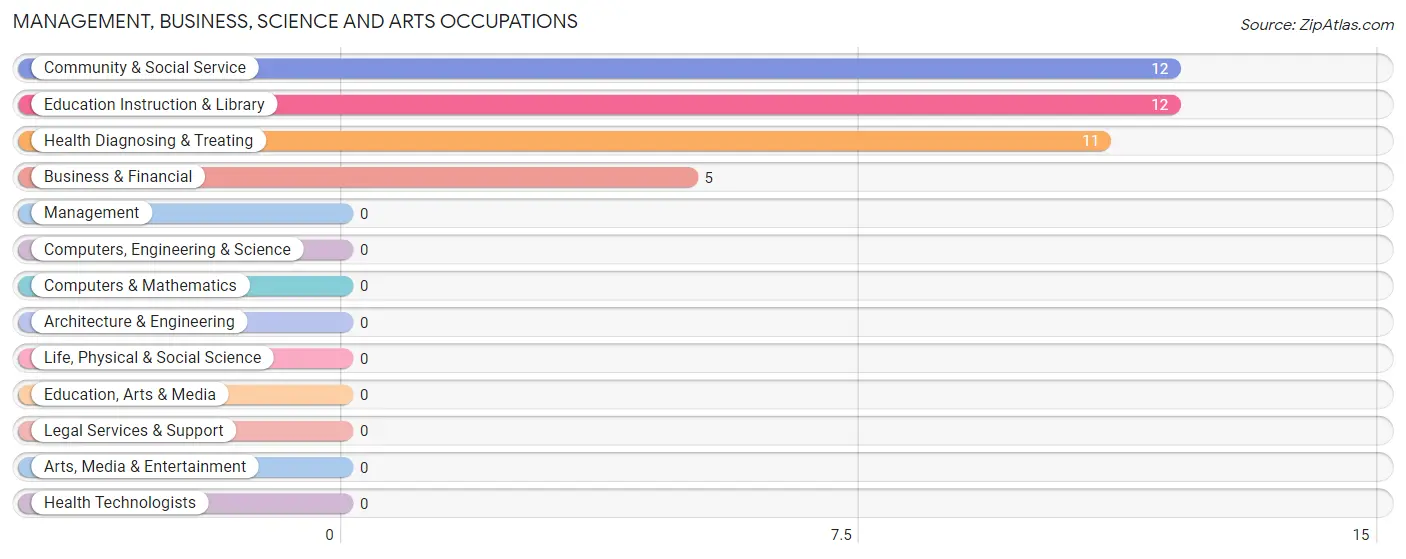
Management, Business, Science and Arts Occupations by Sex
Within the Management, Business, Science and Arts occupations in Pulaski, the most male-oriented occupations are Community & Social Service (91.7%), Education Instruction & Library (91.7%), and Business & Financial (40.0%), while the most female-oriented occupations are Health Diagnosing & Treating (100.0%), Business & Financial (60.0%), and Community & Social Service (8.3%).
| Occupation | Male | Female |
| Management | 0 (0.0%) | 0 (0.0%) |
| Business & Financial | 2 (40.0%) | 3 (60.0%) |
| Computers, Engineering & Science | 0 (0.0%) | 0 (0.0%) |
| Computers & Mathematics | 0 (0.0%) | 0 (0.0%) |
| Architecture & Engineering | 0 (0.0%) | 0 (0.0%) |
| Life, Physical & Social Science | 0 (0.0%) | 0 (0.0%) |
| Community & Social Service | 11 (91.7%) | 1 (8.3%) |
| Education, Arts & Media | 0 (0.0%) | 0 (0.0%) |
| Legal Services & Support | 0 (0.0%) | 0 (0.0%) |
| Education Instruction & Library | 11 (91.7%) | 1 (8.3%) |
| Arts, Media & Entertainment | 0 (0.0%) | 0 (0.0%) |
| Health Diagnosing & Treating | 0 (0.0%) | 11 (100.0%) |
| Health Technologists | 0 (0.0%) | 0 (0.0%) |
| Total (Category) | 13 (46.4%) | 15 (53.6%) |
| Total (Overall) | 54 (58.7%) | 38 (41.3%) |
Services Occupations
The most common Services occupations in Pulaski are , and Healthcare Support (12 | 13.0%).
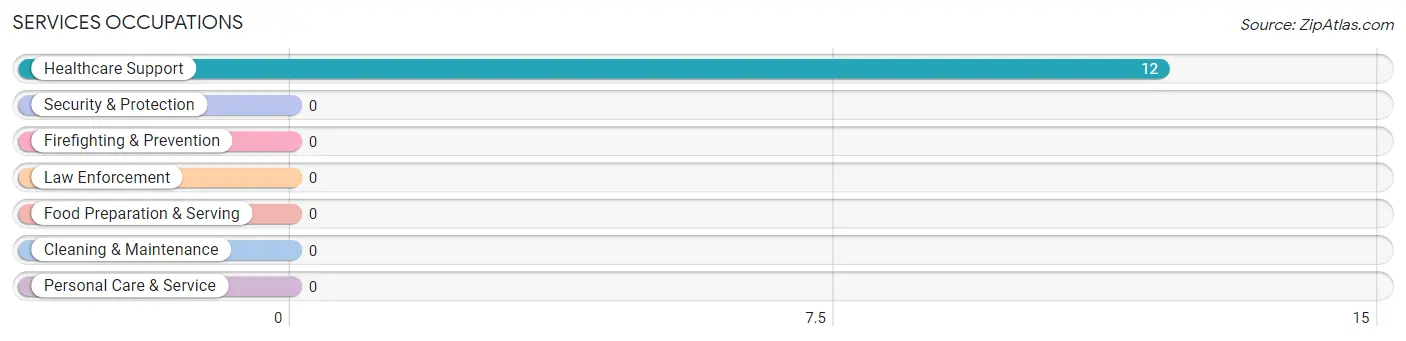
Services Occupations by Sex
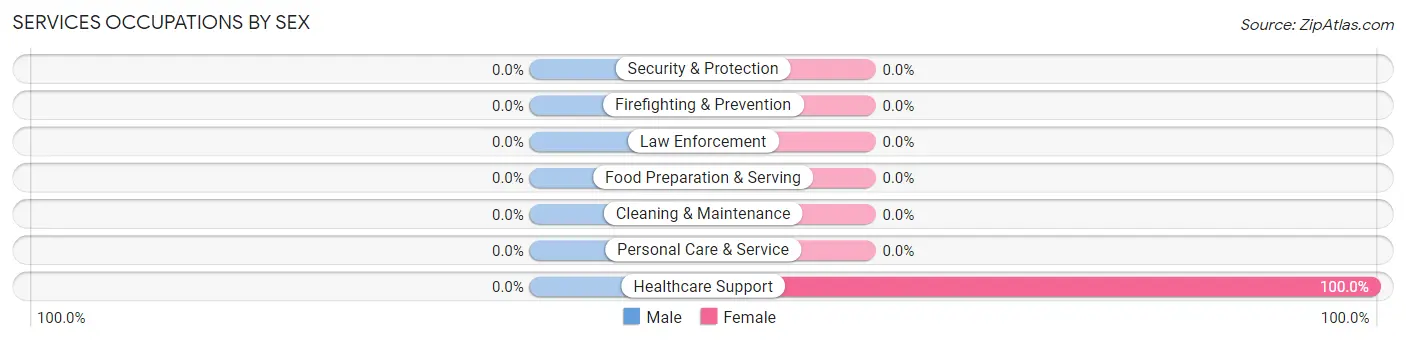
| Occupation | Male | Female |
| Healthcare Support | 0 (0.0%) | 12 (100.0%) |
| Security & Protection | 0 (0.0%) | 0 (0.0%) |
| Firefighting & Prevention | 0 (0.0%) | 0 (0.0%) |
| Law Enforcement | 0 (0.0%) | 0 (0.0%) |
| Food Preparation & Serving | 0 (0.0%) | 0 (0.0%) |
| Cleaning & Maintenance | 0 (0.0%) | 0 (0.0%) |
| Personal Care & Service | 0 (0.0%) | 0 (0.0%) |
| Total (Category) | 0 (0.0%) | 12 (100.0%) |
| Total (Overall) | 54 (58.7%) | 38 (41.3%) |
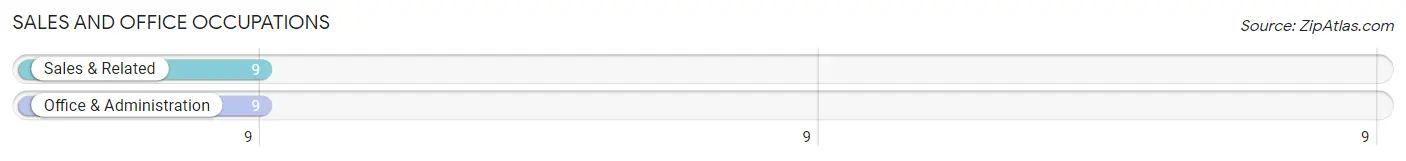
Sales and Office Occupations
The most common Sales and Office occupations in Pulaski are Sales & Related (9 | 9.8%), and Office & Administration (9 | 9.8%).
Sales and Office Occupations by Sex

| Occupation | Male | Female |
| Sales & Related | 9 (100.0%) | 0 (0.0%) |
| Office & Administration | 0 (0.0%) | 9 (100.0%) |
| Total (Category) | 9 (50.0%) | 9 (50.0%) |
| Total (Overall) | 54 (58.7%) | 38 (41.3%) |
Natural Resources, Construction and Maintenance Occupations
The most common Natural Resources, Construction and Maintenance occupations in Pulaski are Construction & Extraction (5 | 5.4%), and Installation, Maintenance & Repair (2 | 2.2%).
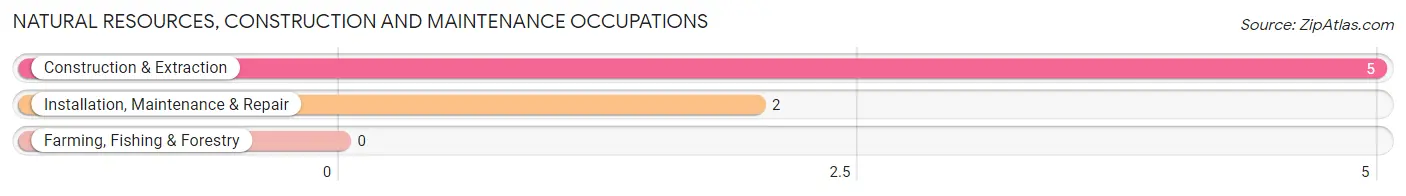
Natural Resources, Construction and Maintenance Occupations by Sex
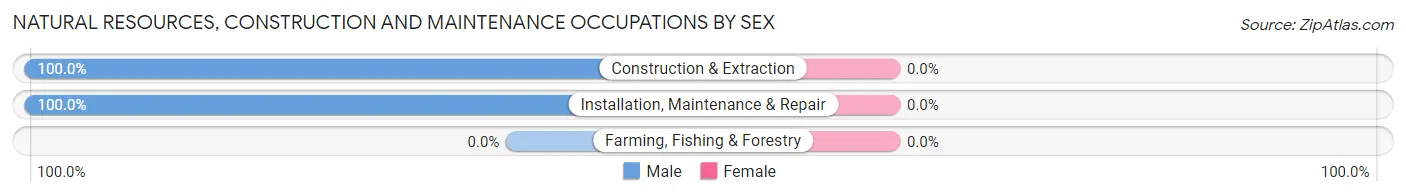
| Occupation | Male | Female |
| Farming, Fishing & Forestry | 0 (0.0%) | 0 (0.0%) |
| Construction & Extraction | 5 (100.0%) | 0 (0.0%) |
| Installation, Maintenance & Repair | 2 (100.0%) | 0 (0.0%) |
| Total (Category) | 7 (100.0%) | 0 (0.0%) |
| Total (Overall) | 54 (58.7%) | 38 (41.3%) |
Production, Transportation and Moving Occupations
The most common Production, Transportation and Moving occupations in Pulaski are Production (20 | 21.7%), and Material Moving (7 | 7.6%).
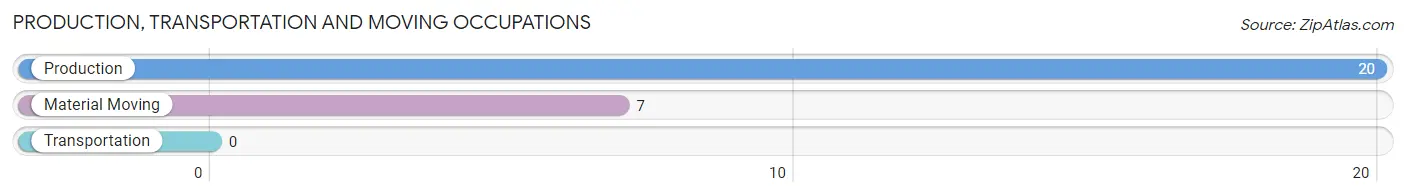
Production, Transportation and Moving Occupations by Sex
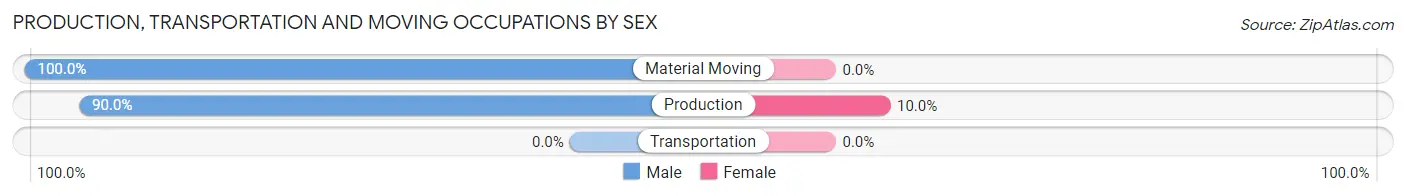
| Occupation | Male | Female |
| Production | 18 (90.0%) | 2 (10.0%) |
| Transportation | 0 (0.0%) | 0 (0.0%) |
| Material Moving | 7 (100.0%) | 0 (0.0%) |
| Total (Category) | 25 (92.6%) | 2 (7.4%) |
| Total (Overall) | 54 (58.7%) | 38 (41.3%) |
Employment Industries by Sex in Pulaski
Employment Industries in Pulaski
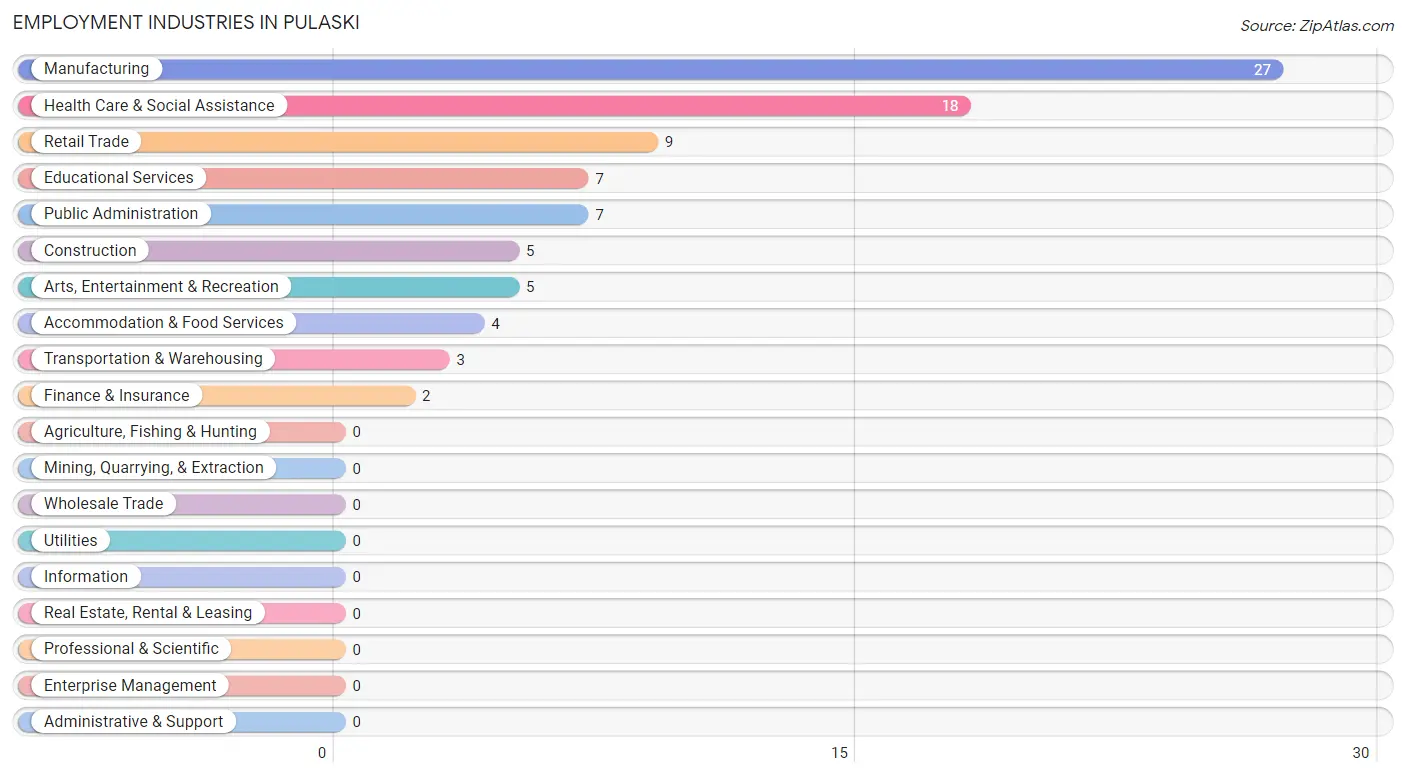
The major employment industries in Pulaski include Manufacturing (27 | 29.3%), Health Care & Social Assistance (18 | 19.6%), Retail Trade (9 | 9.8%), Educational Services (7 | 7.6%), and Public Administration (7 | 7.6%).
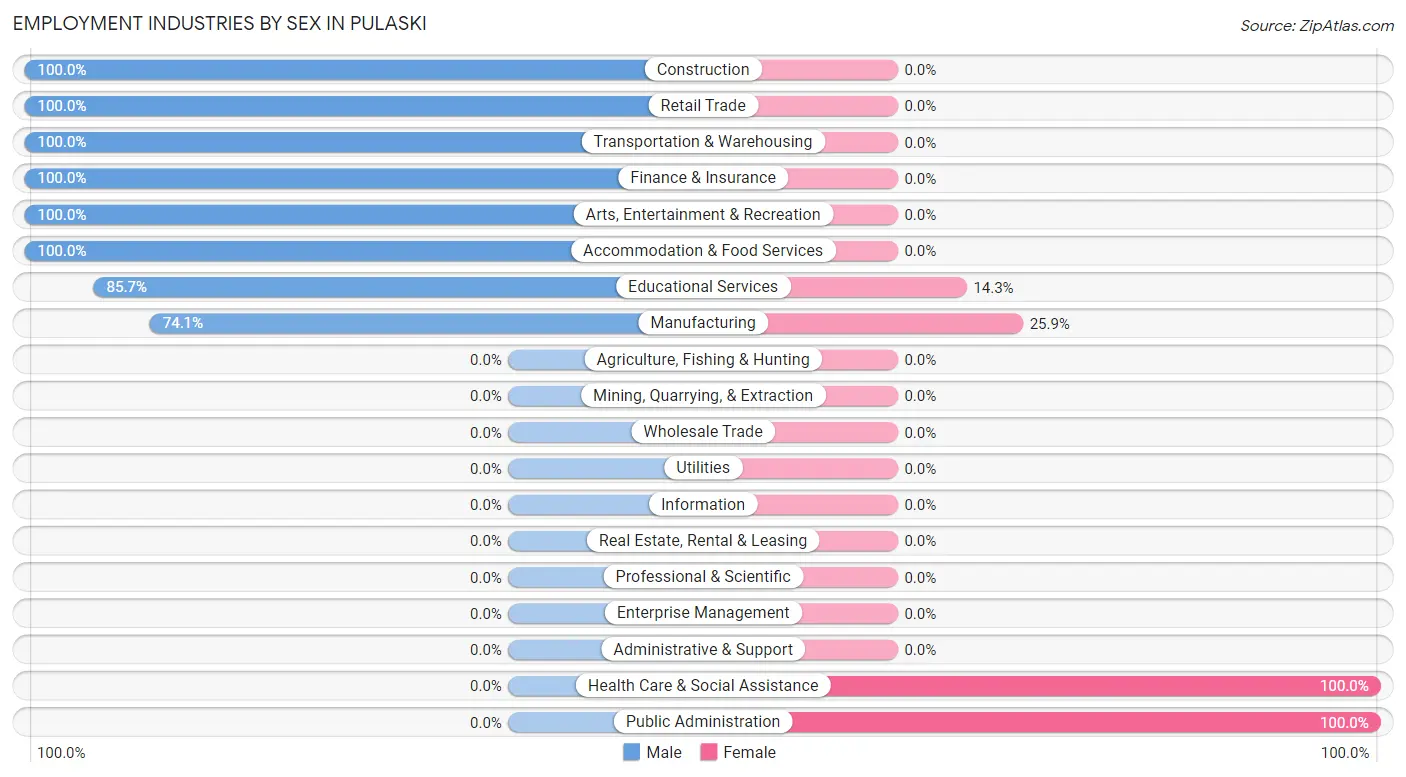
Employment Industries by Sex in Pulaski
The Pulaski industries that see more men than women are Construction (100.0%), Retail Trade (100.0%), and Transportation & Warehousing (100.0%), whereas the industries that tend to have a higher number of women are Health Care & Social Assistance (100.0%), Public Administration (100.0%), and Manufacturing (25.9%).
| Industry | Male | Female |
| Agriculture, Fishing & Hunting | 0 (0.0%) | 0 (0.0%) |
| Mining, Quarrying, & Extraction | 0 (0.0%) | 0 (0.0%) |
| Construction | 5 (100.0%) | 0 (0.0%) |
| Manufacturing | 20 (74.1%) | 7 (25.9%) |
| Wholesale Trade | 0 (0.0%) | 0 (0.0%) |
| Retail Trade | 9 (100.0%) | 0 (0.0%) |
| Transportation & Warehousing | 3 (100.0%) | 0 (0.0%) |
| Utilities | 0 (0.0%) | 0 (0.0%) |
| Information | 0 (0.0%) | 0 (0.0%) |
| Finance & Insurance | 2 (100.0%) | 0 (0.0%) |
| Real Estate, Rental & Leasing | 0 (0.0%) | 0 (0.0%) |
| Professional & Scientific | 0 (0.0%) | 0 (0.0%) |
| Enterprise Management | 0 (0.0%) | 0 (0.0%) |
| Administrative & Support | 0 (0.0%) | 0 (0.0%) |
| Educational Services | 6 (85.7%) | 1 (14.3%) |
| Health Care & Social Assistance | 0 (0.0%) | 18 (100.0%) |
| Arts, Entertainment & Recreation | 5 (100.0%) | 0 (0.0%) |
| Accommodation & Food Services | 4 (100.0%) | 0 (0.0%) |
| Public Administration | 0 (0.0%) | 7 (100.0%) |
| Total | 54 (58.7%) | 38 (41.3%) |
Education in Pulaski
School Enrollment in Pulaski
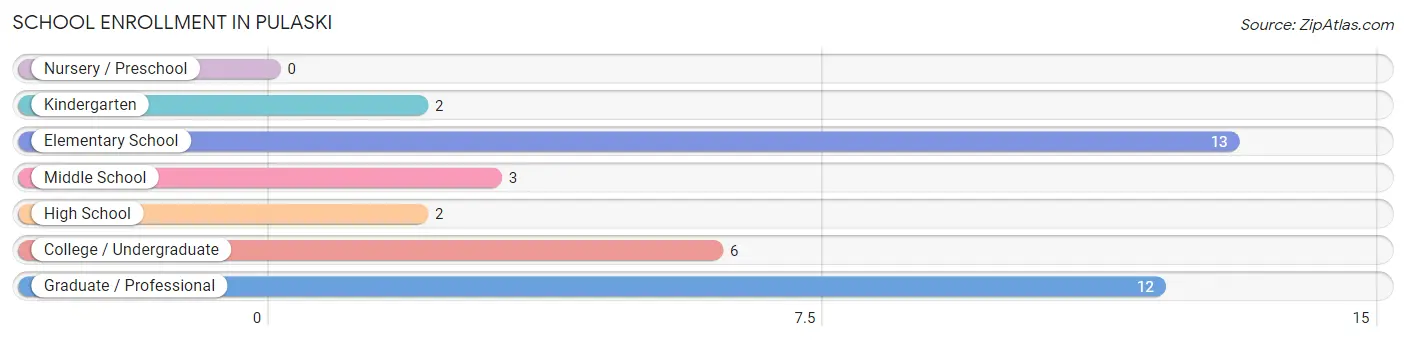
The most common levels of schooling among the 38 students in Pulaski are elementary school (13 | 34.2%), graduate / professional (12 | 31.6%), and college / undergraduate (6 | 15.8%).
| School Level | # Students | % Students |
| Nursery / Preschool | 0 | 0.0% |
| Kindergarten | 2 | 5.3% |
| Elementary School | 13 | 34.2% |
| Middle School | 3 | 7.9% |
| High School | 2 | 5.3% |
| College / Undergraduate | 6 | 15.8% |
| Graduate / Professional | 12 | 31.6% |
| Total | 38 | 100.0% |
School Enrollment by Age by Funding Source in Pulaski
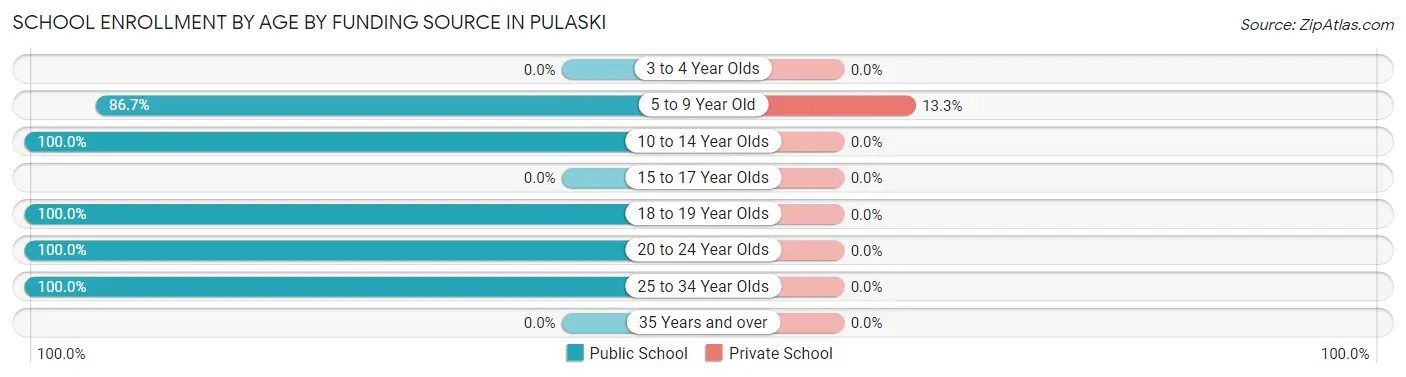
Out of a total of 38 students who are enrolled in schools in Pulaski, 2 (5.3%) attend a private institution, while the remaining 36 (94.7%) are enrolled in public schools. The age group of 5 to 9 year old has the highest likelihood of being enrolled in private schools, with 2 (13.3% in the age bracket) enrolled. Conversely, the age group of 10 to 14 year olds has the lowest likelihood of being enrolled in a private school, with 3 (100.0% in the age bracket) attending a public institution.
| Age Bracket | Public School | Private School |
| 3 to 4 Year Olds | 0 (0.0%) | 0 (0.0%) |
| 5 to 9 Year Old | 13 (86.7%) | 2 (13.3%) |
| 10 to 14 Year Olds | 3 (100.0%) | 0 (0.0%) |
| 15 to 17 Year Olds | 0 (0.0%) | 0 (0.0%) |
| 18 to 19 Year Olds | 2 (100.0%) | 0 (0.0%) |
| 20 to 24 Year Olds | 6 (100.0%) | 0 (0.0%) |
| 25 to 34 Year Olds | 12 (100.0%) | 0 (0.0%) |
| 35 Years and over | 0 (0.0%) | 0 (0.0%) |
| Total | 36 (94.7%) | 2 (5.3%) |
Educational Attainment by Field of Study in Pulaski
Education (17 | 46.0%), business (9 | 24.3%), communications (6 | 16.2%), computers & mathematics (4 | 10.8%), and science & technology (1 | 2.7%) are the most common fields of study among 37 individuals in Pulaski who have obtained a bachelor's degree or higher.
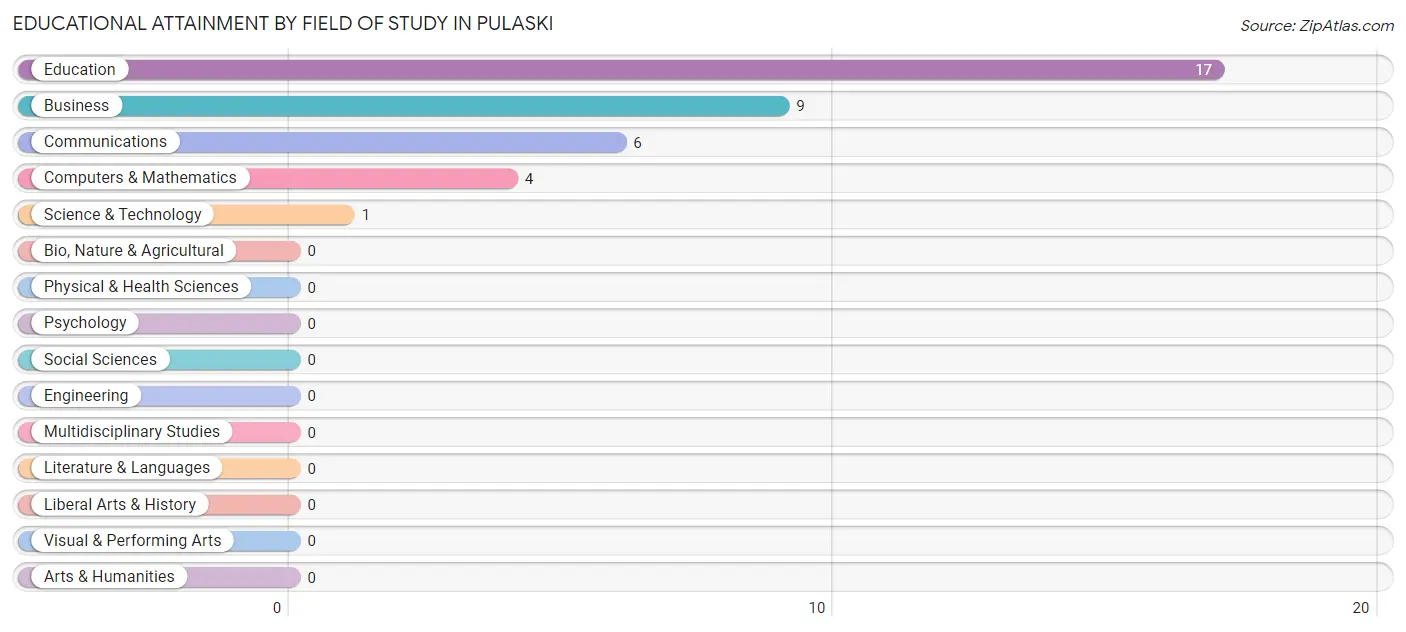
| Field of Study | # Graduates | % Graduates |
| Computers & Mathematics | 4 | 10.8% |
| Bio, Nature & Agricultural | 0 | 0.0% |
| Physical & Health Sciences | 0 | 0.0% |
| Psychology | 0 | 0.0% |
| Social Sciences | 0 | 0.0% |
| Engineering | 0 | 0.0% |
| Multidisciplinary Studies | 0 | 0.0% |
| Science & Technology | 1 | 2.7% |
| Business | 9 | 24.3% |
| Education | 17 | 46.0% |
| Literature & Languages | 0 | 0.0% |
| Liberal Arts & History | 0 | 0.0% |
| Visual & Performing Arts | 0 | 0.0% |
| Communications | 6 | 16.2% |
| Arts & Humanities | 0 | 0.0% |
| Total | 37 | 100.0% |
Transportation & Commute in Pulaski
Vehicle Availability by Sex in Pulaski
The most prevalent vehicle ownership categories in Pulaski are males with 3 vehicles (24, accounting for 44.4%) and females with 3 vehicles (15, making up 63.2%).
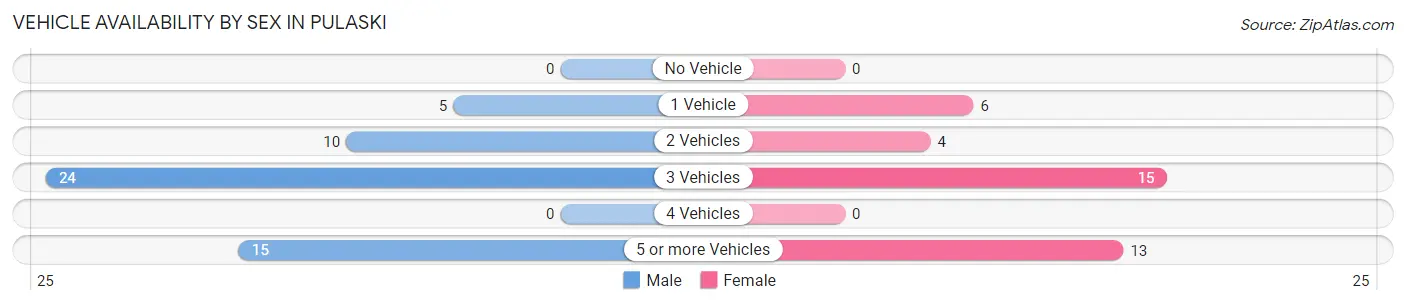
| Vehicles Available | Male | Female |
| No Vehicle | 0 (0.0%) | 0 (0.0%) |
| 1 Vehicle | 5 (9.3%) | 6 (15.8%) |
| 2 Vehicles | 10 (18.5%) | 4 (10.5%) |
| 3 Vehicles | 24 (44.4%) | 15 (39.5%) |
| 4 Vehicles | 0 (0.0%) | 0 (0.0%) |
| 5 or more Vehicles | 15 (27.8%) | 13 (34.2%) |
| Total | 54 (100.0%) | 38 (100.0%) |
Commute Time in Pulaski
The most frequently occuring commute durations in Pulaski are 25 to 29 minutes (30 commuters, 33.7%), 10 to 14 minutes (27 commuters, 30.3%), and 20 to 24 minutes (13 commuters, 14.6%).
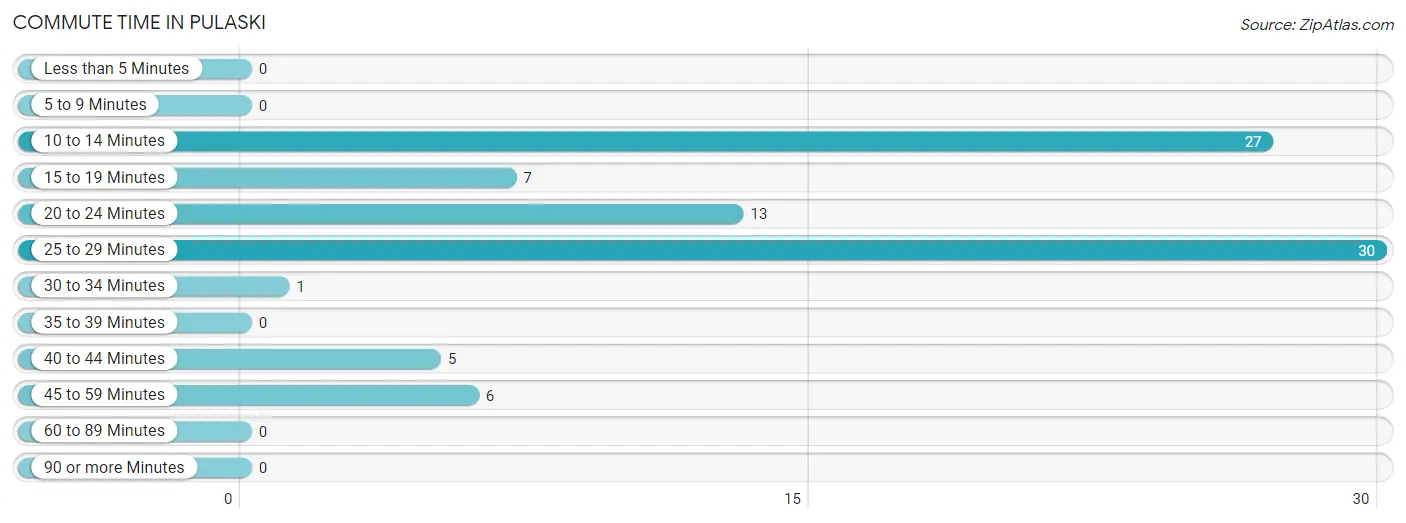
| Commute Time | # Commuters | % Commuters |
| Less than 5 Minutes | 0 | 0.0% |
| 5 to 9 Minutes | 0 | 0.0% |
| 10 to 14 Minutes | 27 | 30.3% |
| 15 to 19 Minutes | 7 | 7.9% |
| 20 to 24 Minutes | 13 | 14.6% |
| 25 to 29 Minutes | 30 | 33.7% |
| 30 to 34 Minutes | 1 | 1.1% |
| 35 to 39 Minutes | 0 | 0.0% |
| 40 to 44 Minutes | 5 | 5.6% |
| 45 to 59 Minutes | 6 | 6.7% |
| 60 to 89 Minutes | 0 | 0.0% |
| 90 or more Minutes | 0 | 0.0% |
Commute Time by Sex in Pulaski
The most common commute times in Pulaski are 10 to 14 minutes (20 commuters, 37.0%) for males and 25 to 29 minutes (13 commuters, 37.1%) for females.
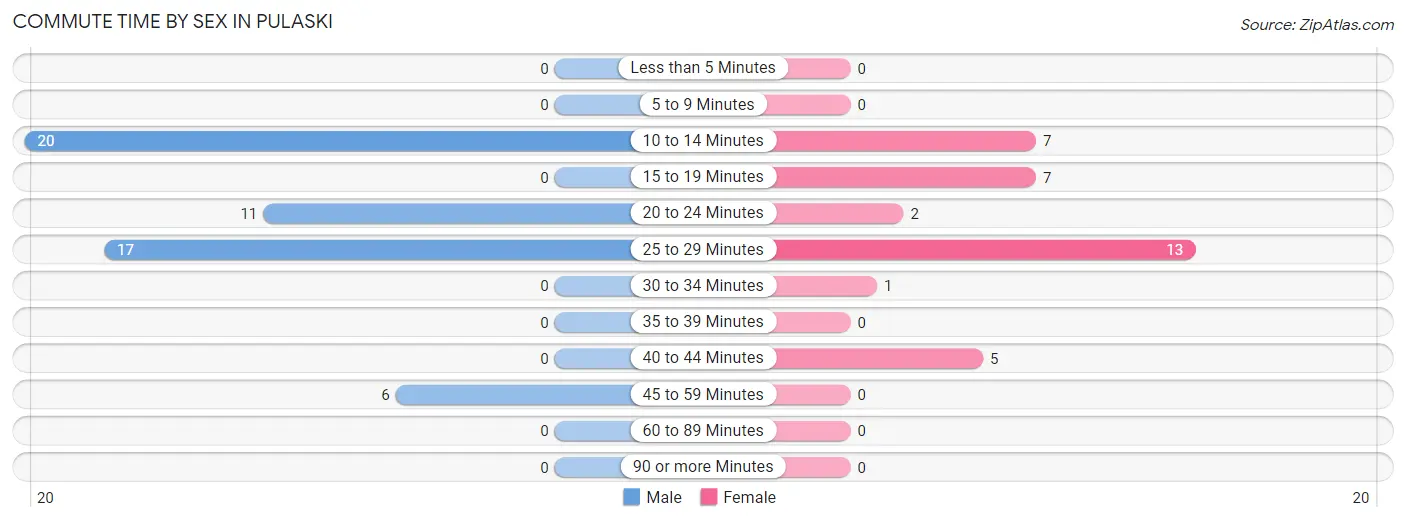
| Commute Time | Male | Female |
| Less than 5 Minutes | 0 (0.0%) | 0 (0.0%) |
| 5 to 9 Minutes | 0 (0.0%) | 0 (0.0%) |
| 10 to 14 Minutes | 20 (37.0%) | 7 (20.0%) |
| 15 to 19 Minutes | 0 (0.0%) | 7 (20.0%) |
| 20 to 24 Minutes | 11 (20.4%) | 2 (5.7%) |
| 25 to 29 Minutes | 17 (31.5%) | 13 (37.1%) |
| 30 to 34 Minutes | 0 (0.0%) | 1 (2.9%) |
| 35 to 39 Minutes | 0 (0.0%) | 0 (0.0%) |
| 40 to 44 Minutes | 0 (0.0%) | 5 (14.3%) |
| 45 to 59 Minutes | 6 (11.1%) | 0 (0.0%) |
| 60 to 89 Minutes | 0 (0.0%) | 0 (0.0%) |
| 90 or more Minutes | 0 (0.0%) | 0 (0.0%) |
Time of Departure to Work by Sex in Pulaski
The most frequent times of departure to work in Pulaski are 7:00 AM to 7:29 AM (15, 27.8%) for males and 7:30 AM to 7:59 AM (11, 31.4%) for females.
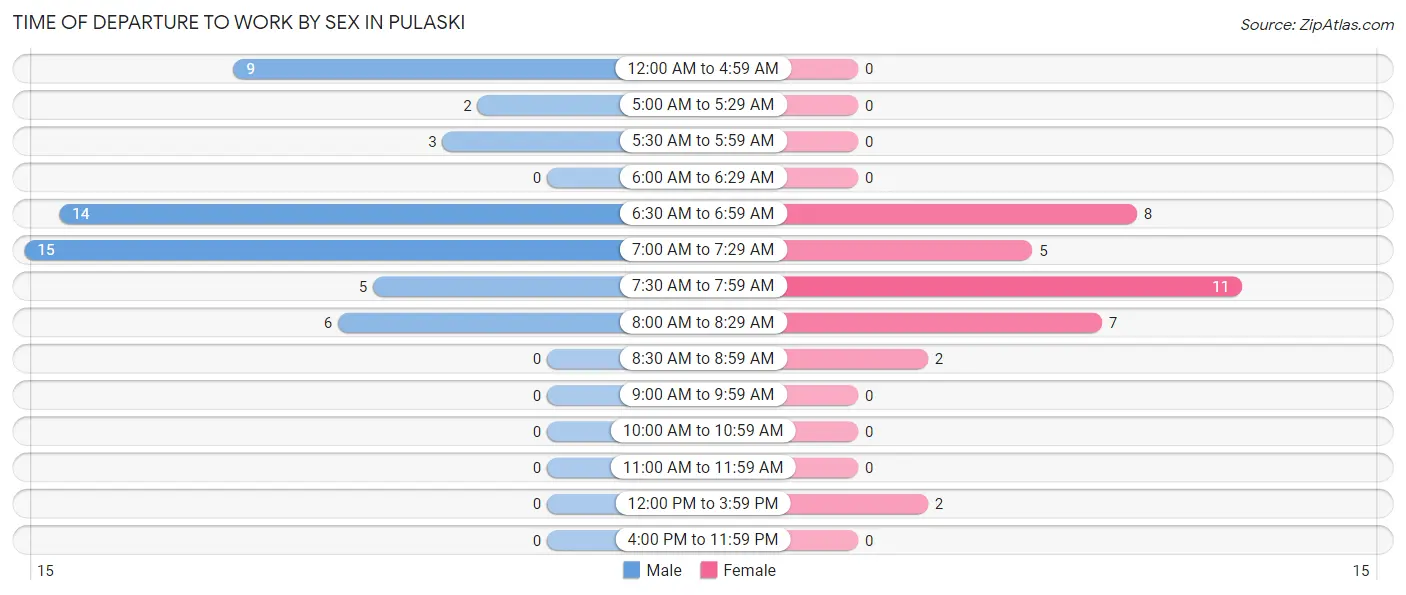
| Time of Departure | Male | Female |
| 12:00 AM to 4:59 AM | 9 (16.7%) | 0 (0.0%) |
| 5:00 AM to 5:29 AM | 2 (3.7%) | 0 (0.0%) |
| 5:30 AM to 5:59 AM | 3 (5.6%) | 0 (0.0%) |
| 6:00 AM to 6:29 AM | 0 (0.0%) | 0 (0.0%) |
| 6:30 AM to 6:59 AM | 14 (25.9%) | 8 (22.9%) |
| 7:00 AM to 7:29 AM | 15 (27.8%) | 5 (14.3%) |
| 7:30 AM to 7:59 AM | 5 (9.3%) | 11 (31.4%) |
| 8:00 AM to 8:29 AM | 6 (11.1%) | 7 (20.0%) |
| 8:30 AM to 8:59 AM | 0 (0.0%) | 2 (5.7%) |
| 9:00 AM to 9:59 AM | 0 (0.0%) | 0 (0.0%) |
| 10:00 AM to 10:59 AM | 0 (0.0%) | 0 (0.0%) |
| 11:00 AM to 11:59 AM | 0 (0.0%) | 0 (0.0%) |
| 12:00 PM to 3:59 PM | 0 (0.0%) | 2 (5.7%) |
| 4:00 PM to 11:59 PM | 0 (0.0%) | 0 (0.0%) |
| Total | 54 (100.0%) | 35 (100.0%) |
Housing Occupancy in Pulaski
Occupancy by Ownership in Pulaski
Of the total 50 dwellings in Pulaski, owner-occupied units account for 41 (82.0%), while renter-occupied units make up 9 (18.0%).
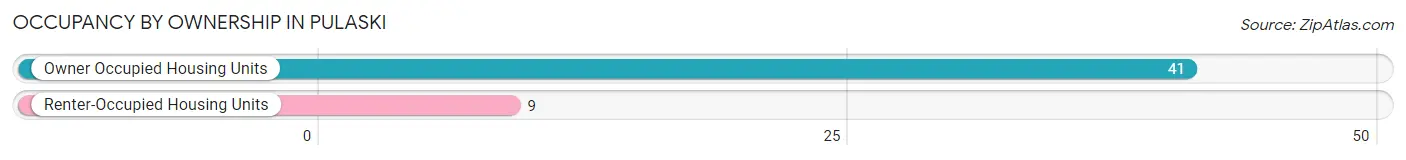
| Occupancy | # Housing Units | % Housing Units |
| Owner Occupied Housing Units | 41 | 82.0% |
| Renter-Occupied Housing Units | 9 | 18.0% |
| Total Occupied Housing Units | 50 | 100.0% |
Occupancy by Household Size in Pulaski
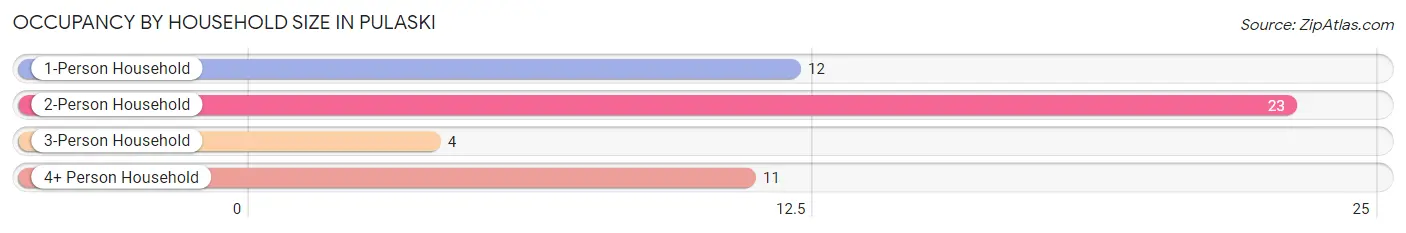
| Household Size | # Housing Units | % Housing Units |
| 1-Person Household | 12 | 24.0% |
| 2-Person Household | 23 | 46.0% |
| 3-Person Household | 4 | 8.0% |
| 4+ Person Household | 11 | 22.0% |
| Total Housing Units | 50 | 100.0% |
Occupancy by Ownership by Household Size in Pulaski
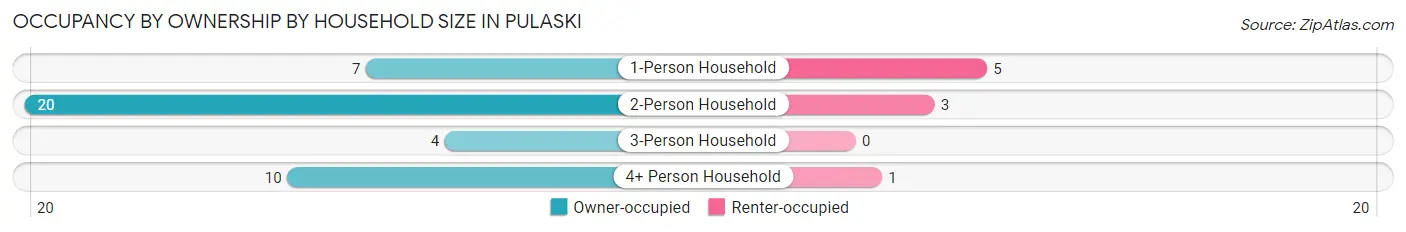
| Household Size | Owner-occupied | Renter-occupied |
| 1-Person Household | 7 (58.3%) | 5 (41.7%) |
| 2-Person Household | 20 (87.0%) | 3 (13.0%) |
| 3-Person Household | 4 (100.0%) | 0 (0.0%) |
| 4+ Person Household | 10 (90.9%) | 1 (9.1%) |
| Total Housing Units | 41 (82.0%) | 9 (18.0%) |
Occupancy by Educational Attainment in Pulaski
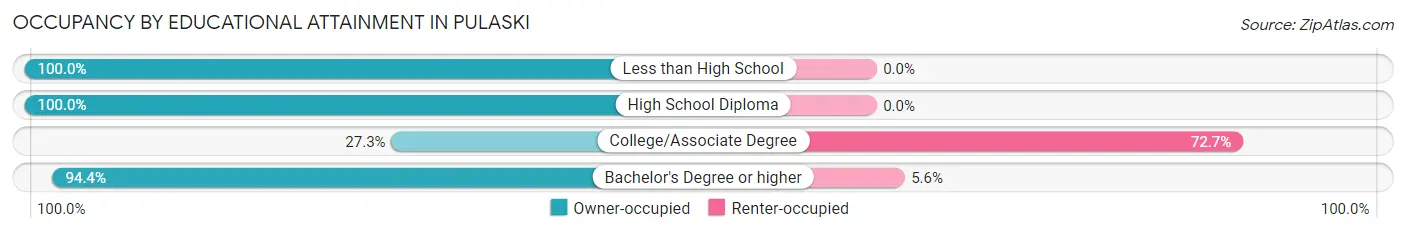
| Household Size | Owner-occupied | Renter-occupied |
| Less than High School | 5 (100.0%) | 0 (0.0%) |
| High School Diploma | 16 (100.0%) | 0 (0.0%) |
| College/Associate Degree | 3 (27.3%) | 8 (72.7%) |
| Bachelor's Degree or higher | 17 (94.4%) | 1 (5.6%) |
Occupancy by Age of Householder in Pulaski
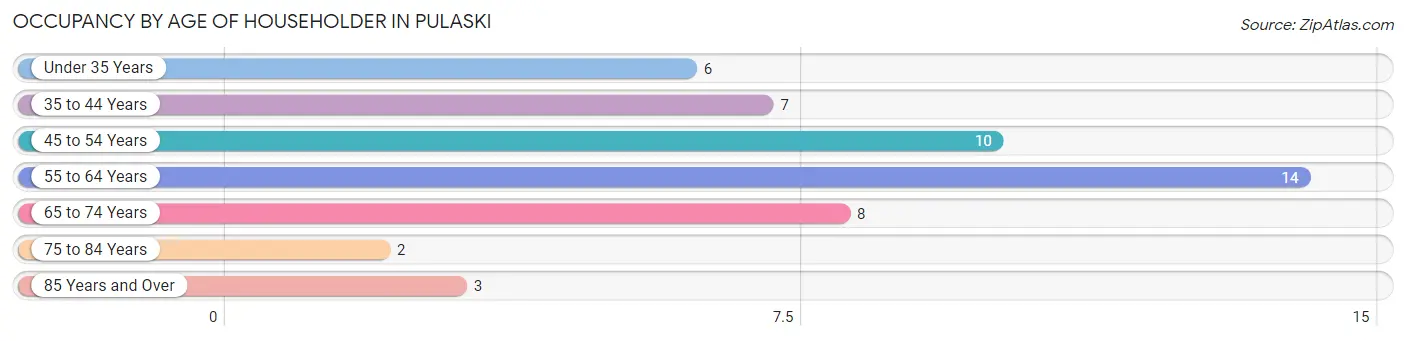
| Age Bracket | # Households | % Households |
| Under 35 Years | 6 | 12.0% |
| 35 to 44 Years | 7 | 14.0% |
| 45 to 54 Years | 10 | 20.0% |
| 55 to 64 Years | 14 | 28.0% |
| 65 to 74 Years | 8 | 16.0% |
| 75 to 84 Years | 2 | 4.0% |
| 85 Years and Over | 3 | 6.0% |
| Total | 50 | 100.0% |
Housing Finances in Pulaski
Median Income by Occupancy in Pulaski
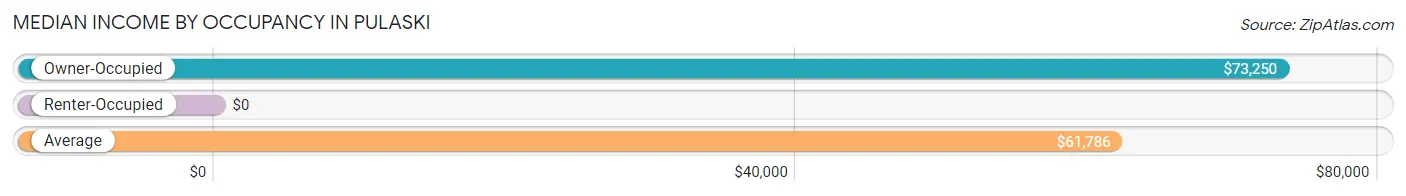
| Occupancy Type | # Households | Median Income |
| Owner-Occupied | 41 (82.0%) | $73,250 |
| Renter-Occupied | 9 (18.0%) | $0 |
| Average | 50 (100.0%) | $61,786 |
Occupancy by Householder Income Bracket in Pulaski
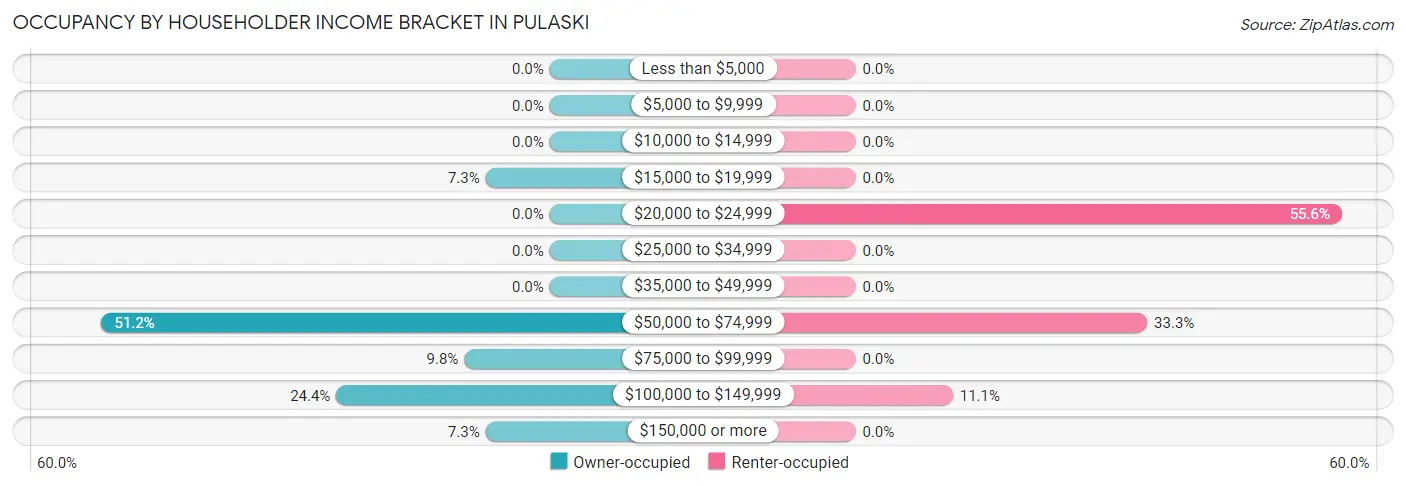
| Income Bracket | Owner-occupied | Renter-occupied |
| Less than $5,000 | 0 (0.0%) | 0 (0.0%) |
| $5,000 to $9,999 | 0 (0.0%) | 0 (0.0%) |
| $10,000 to $14,999 | 0 (0.0%) | 0 (0.0%) |
| $15,000 to $19,999 | 3 (7.3%) | 0 (0.0%) |
| $20,000 to $24,999 | 0 (0.0%) | 5 (55.6%) |
| $25,000 to $34,999 | 0 (0.0%) | 0 (0.0%) |
| $35,000 to $49,999 | 0 (0.0%) | 0 (0.0%) |
| $50,000 to $74,999 | 21 (51.2%) | 3 (33.3%) |
| $75,000 to $99,999 | 4 (9.8%) | 0 (0.0%) |
| $100,000 to $149,999 | 10 (24.4%) | 1 (11.1%) |
| $150,000 or more | 3 (7.3%) | 0 (0.0%) |
| Total | 41 (100.0%) | 9 (100.0%) |
Monthly Housing Cost Tiers in Pulaski
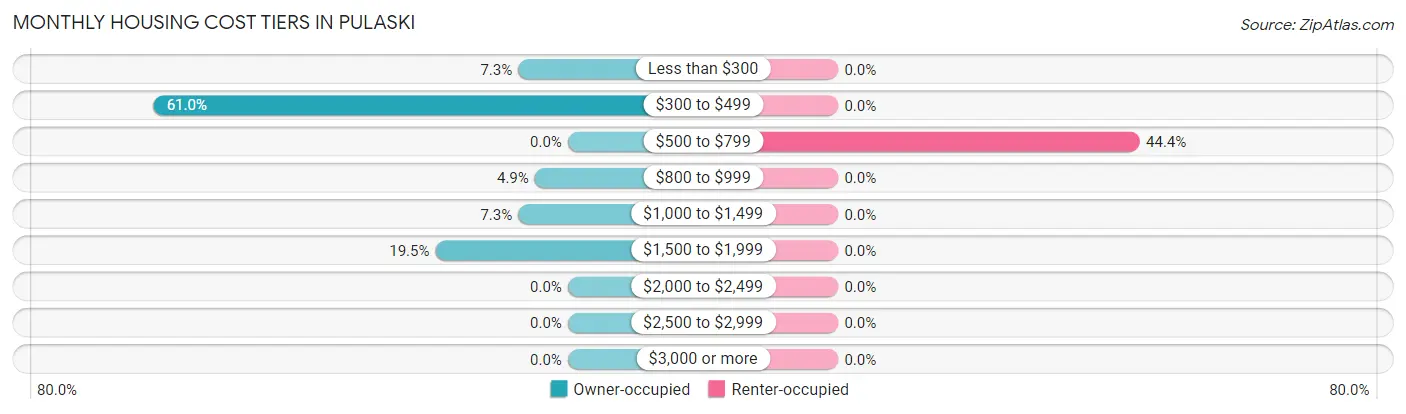
| Monthly Cost | Owner-occupied | Renter-occupied |
| Less than $300 | 3 (7.3%) | 0 (0.0%) |
| $300 to $499 | 25 (61.0%) | 0 (0.0%) |
| $500 to $799 | 0 (0.0%) | 4 (44.4%) |
| $800 to $999 | 2 (4.9%) | 0 (0.0%) |
| $1,000 to $1,499 | 3 (7.3%) | 0 (0.0%) |
| $1,500 to $1,999 | 8 (19.5%) | 0 (0.0%) |
| $2,000 to $2,499 | 0 (0.0%) | 0 (0.0%) |
| $2,500 to $2,999 | 0 (0.0%) | 0 (0.0%) |
| $3,000 or more | 0 (0.0%) | 0 (0.0%) |
| Total | 41 (100.0%) | 9 (100.0%) |
Physical Housing Characteristics in Pulaski
Housing Structures in Pulaski
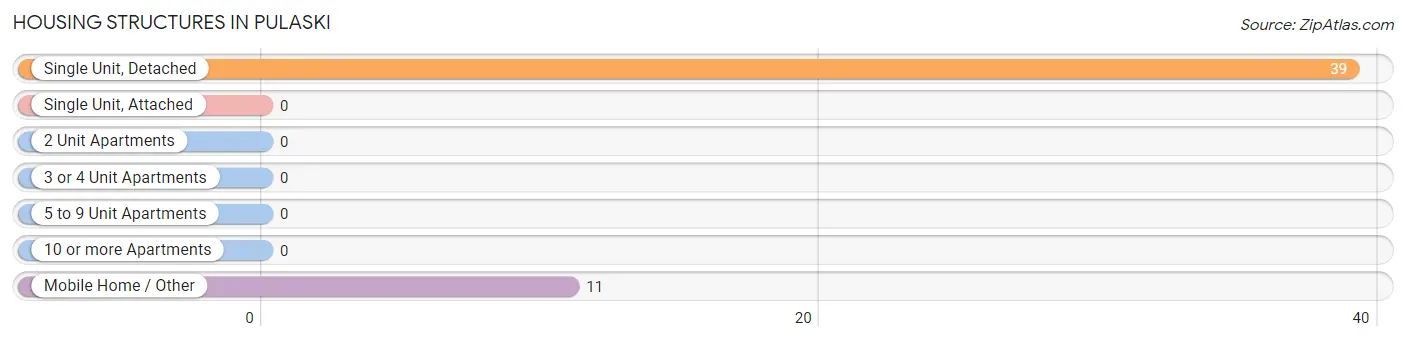
| Structure Type | # Housing Units | % Housing Units |
| Single Unit, Detached | 39 | 78.0% |
| Single Unit, Attached | 0 | 0.0% |
| 2 Unit Apartments | 0 | 0.0% |
| 3 or 4 Unit Apartments | 0 | 0.0% |
| 5 to 9 Unit Apartments | 0 | 0.0% |
| 10 or more Apartments | 0 | 0.0% |
| Mobile Home / Other | 11 | 22.0% |
| Total | 50 | 100.0% |
Housing Structures by Occupancy in Pulaski
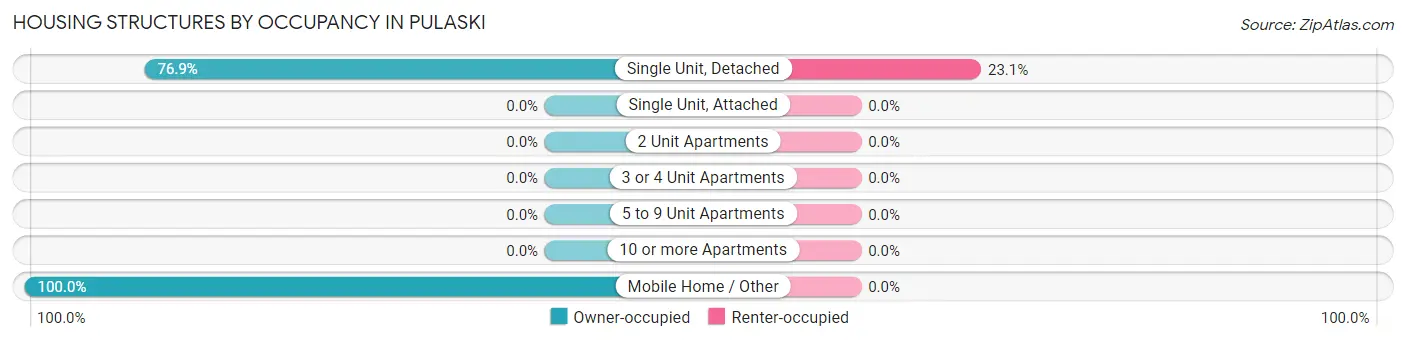
| Structure Type | Owner-occupied | Renter-occupied |
| Single Unit, Detached | 30 (76.9%) | 9 (23.1%) |
| Single Unit, Attached | 0 (0.0%) | 0 (0.0%) |
| 2 Unit Apartments | 0 (0.0%) | 0 (0.0%) |
| 3 or 4 Unit Apartments | 0 (0.0%) | 0 (0.0%) |
| 5 to 9 Unit Apartments | 0 (0.0%) | 0 (0.0%) |
| 10 or more Apartments | 0 (0.0%) | 0 (0.0%) |
| Mobile Home / Other | 11 (100.0%) | 0 (0.0%) |
| Total | 41 (82.0%) | 9 (18.0%) |
Housing Structures by Number of Rooms in Pulaski
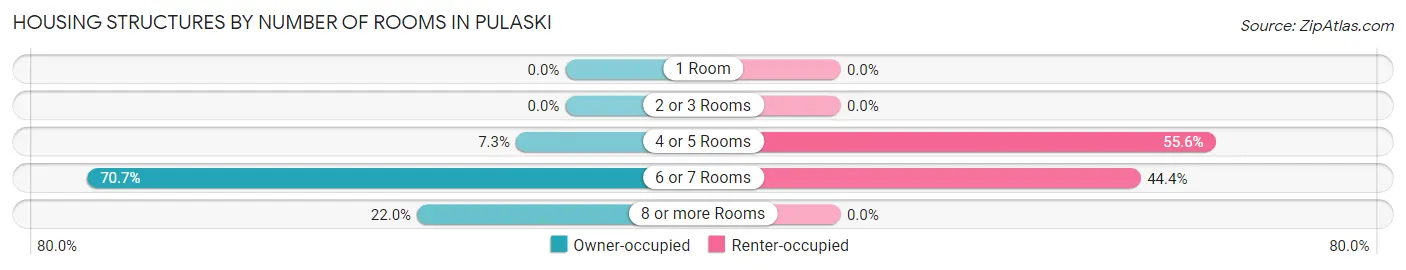
| Number of Rooms | Owner-occupied | Renter-occupied |
| 1 Room | 0 (0.0%) | 0 (0.0%) |
| 2 or 3 Rooms | 0 (0.0%) | 0 (0.0%) |
| 4 or 5 Rooms | 3 (7.3%) | 5 (55.6%) |
| 6 or 7 Rooms | 29 (70.7%) | 4 (44.4%) |
| 8 or more Rooms | 9 (22.0%) | 0 (0.0%) |
| Total | 41 (100.0%) | 9 (100.0%) |
Housing Structure by Heating Type in Pulaski
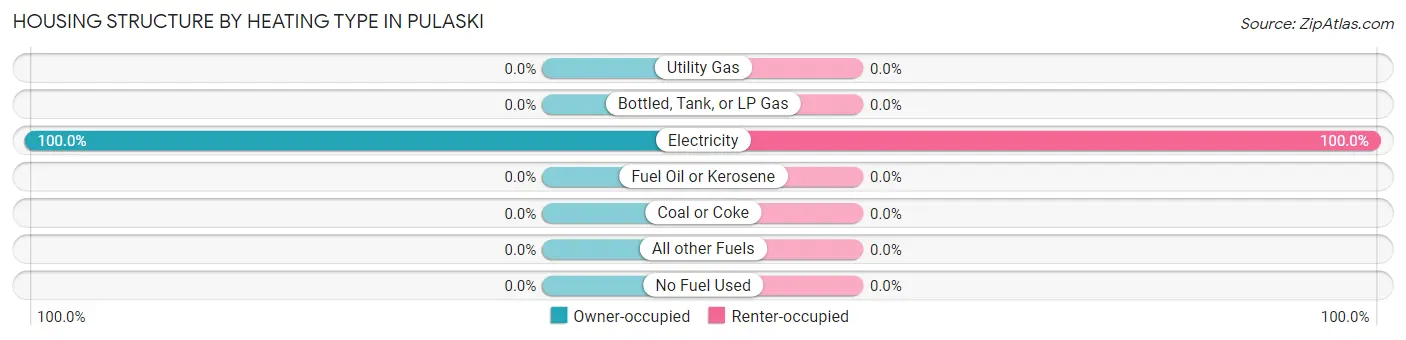
| Heating Type | Owner-occupied | Renter-occupied |
| Utility Gas | 0 (0.0%) | 0 (0.0%) |
| Bottled, Tank, or LP Gas | 0 (0.0%) | 0 (0.0%) |
| Electricity | 41 (100.0%) | 9 (100.0%) |
| Fuel Oil or Kerosene | 0 (0.0%) | 0 (0.0%) |
| Coal or Coke | 0 (0.0%) | 0 (0.0%) |
| All other Fuels | 0 (0.0%) | 0 (0.0%) |
| No Fuel Used | 0 (0.0%) | 0 (0.0%) |
| Total | 41 (100.0%) | 9 (100.0%) |
Household Vehicle Usage in Pulaski
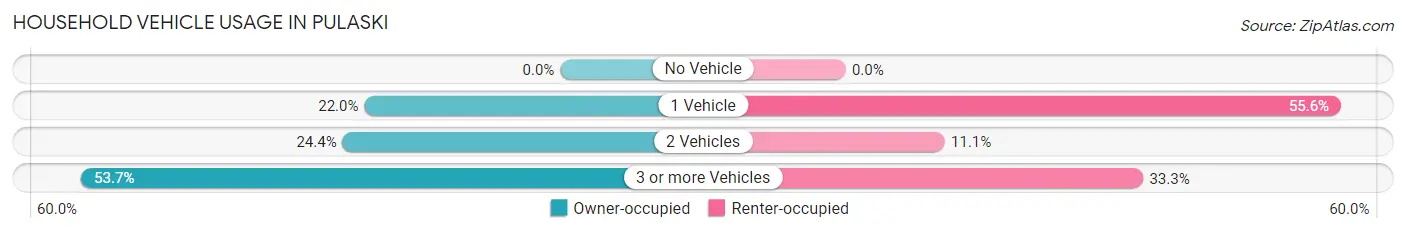
| Vehicles per Household | Owner-occupied | Renter-occupied |
| No Vehicle | 0 (0.0%) | 0 (0.0%) |
| 1 Vehicle | 9 (22.0%) | 5 (55.6%) |
| 2 Vehicles | 10 (24.4%) | 1 (11.1%) |
| 3 or more Vehicles | 22 (53.7%) | 3 (33.3%) |
| Total | 41 (100.0%) | 9 (100.0%) |
Real Estate & Mortgages in Pulaski
Real Estate and Mortgage Overview in Pulaski
| Characteristic | Without Mortgage | With Mortgage |
| Housing Units | 28 | 13 |
| Median Property Value | $108,300 | $93,000 |
| Median Household Income | $76,250 | $3 |
| Monthly Housing Costs | $396 | $0 |
| Real Estate Taxes | $1,236 | $2 |
Property Value by Mortgage Status in Pulaski
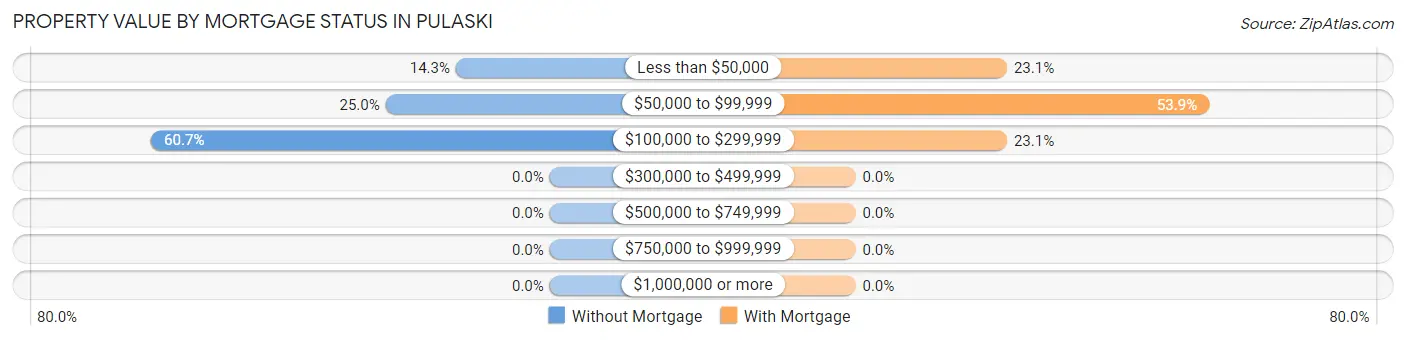
| Property Value | Without Mortgage | With Mortgage |
| Less than $50,000 | 4 (14.3%) | 3 (23.1%) |
| $50,000 to $99,999 | 7 (25.0%) | 7 (53.8%) |
| $100,000 to $299,999 | 17 (60.7%) | 3 (23.1%) |
| $300,000 to $499,999 | 0 (0.0%) | 0 (0.0%) |
| $500,000 to $749,999 | 0 (0.0%) | 0 (0.0%) |
| $750,000 to $999,999 | 0 (0.0%) | 0 (0.0%) |
| $1,000,000 or more | 0 (0.0%) | 0 (0.0%) |
| Total | 28 (100.0%) | 13 (100.0%) |
Household Income by Mortgage Status in Pulaski
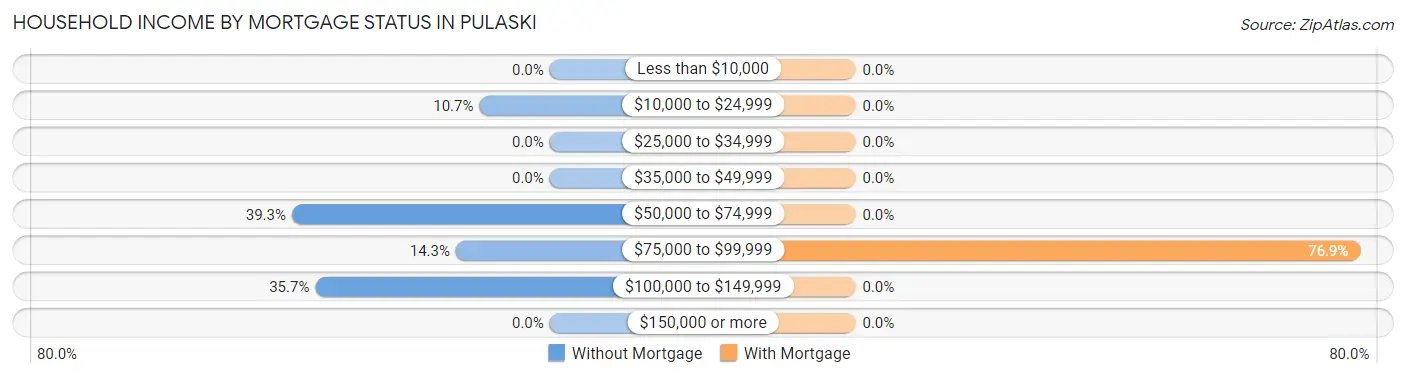
| Household Income | Without Mortgage | With Mortgage |
| Less than $10,000 | 0 (0.0%) | 0 (0.0%) |
| $10,000 to $24,999 | 3 (10.7%) | 0 (0.0%) |
| $25,000 to $34,999 | 0 (0.0%) | 0 (0.0%) |
| $35,000 to $49,999 | 0 (0.0%) | 0 (0.0%) |
| $50,000 to $74,999 | 11 (39.3%) | 0 (0.0%) |
| $75,000 to $99,999 | 4 (14.3%) | 10 (76.9%) |
| $100,000 to $149,999 | 10 (35.7%) | 0 (0.0%) |
| $150,000 or more | 0 (0.0%) | 0 (0.0%) |
| Total | 28 (100.0%) | 13 (100.0%) |
Property Value to Household Income Ratio in Pulaski
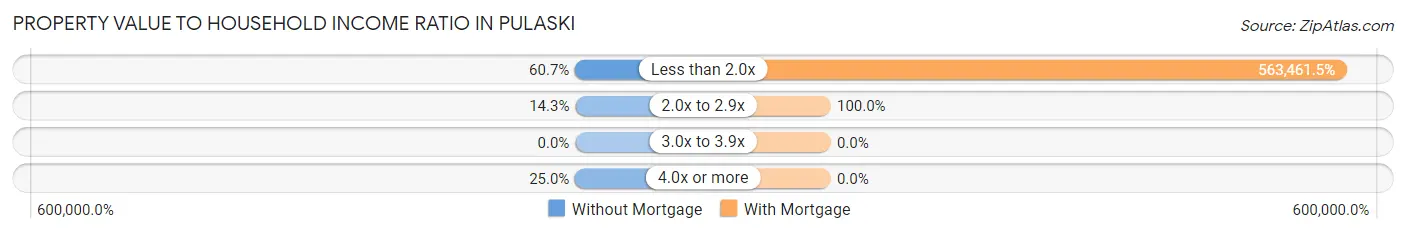
| Value-to-Income Ratio | Without Mortgage | With Mortgage |
| Less than 2.0x | 17 (60.7%) | 73,250 (563,461.5%) |
| 2.0x to 2.9x | 4 (14.3%) | 13 (100.0%) |
| 3.0x to 3.9x | 0 (0.0%) | 0 (0.0%) |
| 4.0x or more | 7 (25.0%) | 0 (0.0%) |
| Total | 28 (100.0%) | 13 (100.0%) |
Real Estate Taxes by Mortgage Status in Pulaski
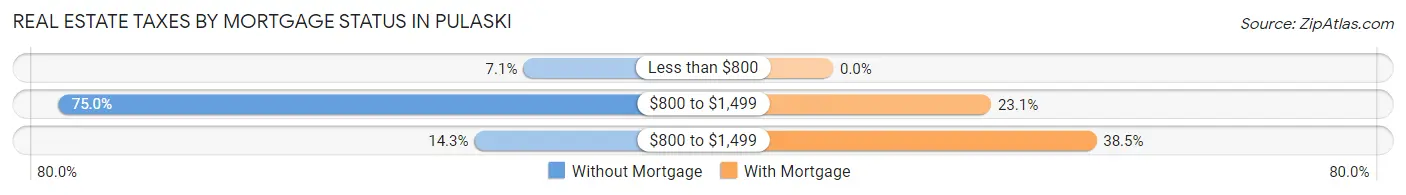
| Property Taxes | Without Mortgage | With Mortgage |
| Less than $800 | 2 (7.1%) | 0 (0.0%) |
| $800 to $1,499 | 21 (75.0%) | 3 (23.1%) |
| $800 to $1,499 | 4 (14.3%) | 5 (38.5%) |
| Total | 28 (100.0%) | 13 (100.0%) |
Health & Disability in Pulaski
Health Insurance Coverage by Age in Pulaski
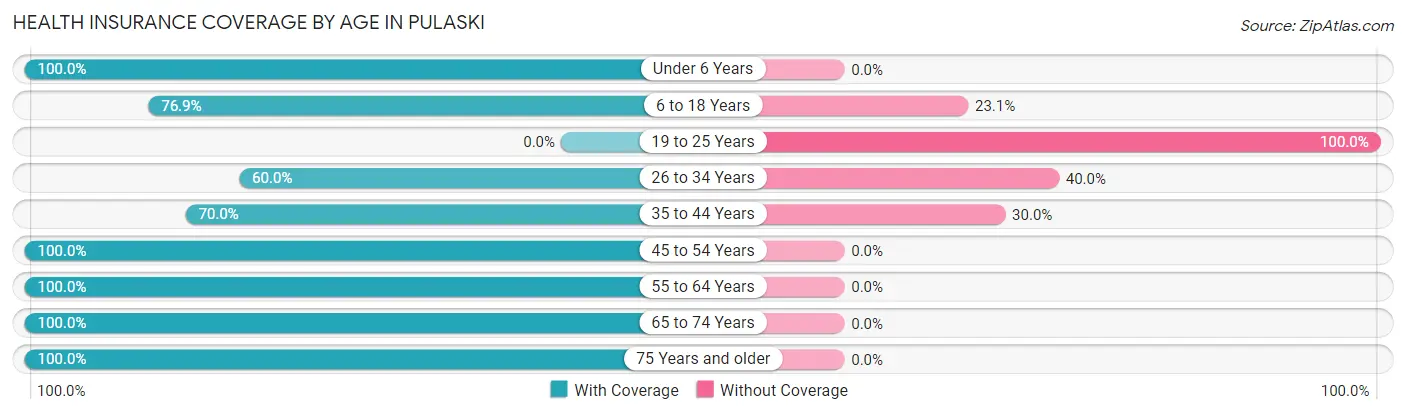
| Age Bracket | With Coverage | Without Coverage |
| Under 6 Years | 3 (100.0%) | 0 (0.0%) |
| 6 to 18 Years | 20 (76.9%) | 6 (23.1%) |
| 19 to 25 Years | 0 (0.0%) | 6 (100.0%) |
| 26 to 34 Years | 24 (60.0%) | 16 (40.0%) |
| 35 to 44 Years | 7 (70.0%) | 3 (30.0%) |
| 45 to 54 Years | 10 (100.0%) | 0 (0.0%) |
| 55 to 64 Years | 28 (100.0%) | 0 (0.0%) |
| 65 to 74 Years | 12 (100.0%) | 0 (0.0%) |
| 75 Years and older | 8 (100.0%) | 0 (0.0%) |
| Total | 112 (78.3%) | 31 (21.7%) |
Health Insurance Coverage by Citizenship Status in Pulaski
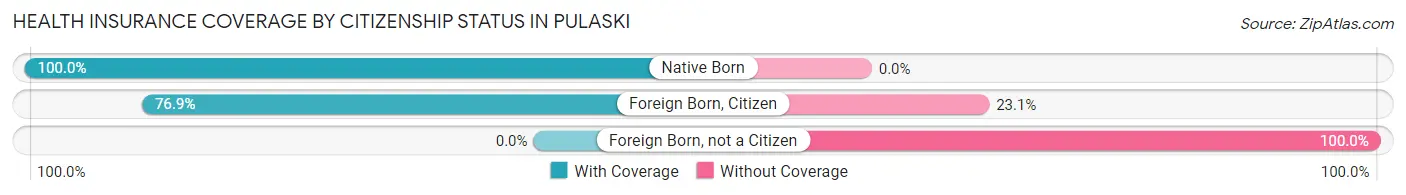
| Citizenship Status | With Coverage | Without Coverage |
| Native Born | 3 (100.0%) | 0 (0.0%) |
| Foreign Born, Citizen | 20 (76.9%) | 6 (23.1%) |
| Foreign Born, not a Citizen | 0 (0.0%) | 6 (100.0%) |
Health Insurance Coverage by Household Income in Pulaski
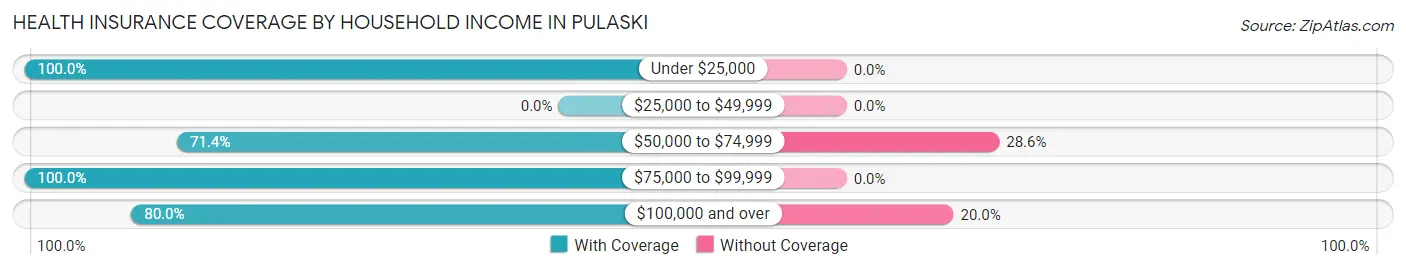
| Household Income | With Coverage | Without Coverage |
| Under $25,000 | 8 (100.0%) | 0 (0.0%) |
| $25,000 to $49,999 | 0 (0.0%) | 0 (0.0%) |
| $50,000 to $74,999 | 50 (71.4%) | 20 (28.6%) |
| $75,000 to $99,999 | 10 (100.0%) | 0 (0.0%) |
| $100,000 and over | 44 (80.0%) | 11 (20.0%) |
Public vs Private Health Insurance Coverage by Age in Pulaski
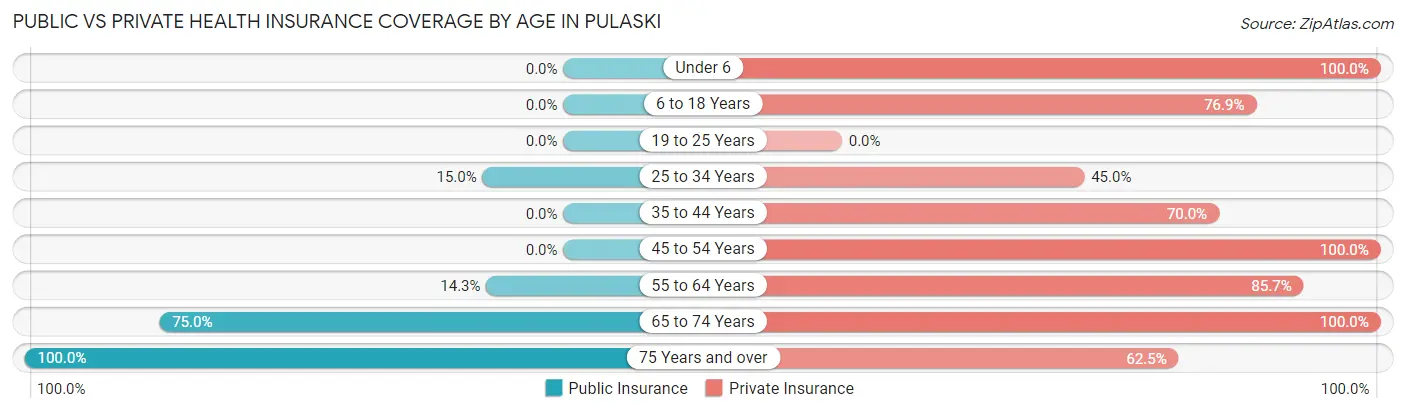
| Age Bracket | Public Insurance | Private Insurance |
| Under 6 | 0 (0.0%) | 3 (100.0%) |
| 6 to 18 Years | 0 (0.0%) | 20 (76.9%) |
| 19 to 25 Years | 0 (0.0%) | 0 (0.0%) |
| 25 to 34 Years | 6 (15.0%) | 18 (45.0%) |
| 35 to 44 Years | 0 (0.0%) | 7 (70.0%) |
| 45 to 54 Years | 0 (0.0%) | 10 (100.0%) |
| 55 to 64 Years | 4 (14.3%) | 24 (85.7%) |
| 65 to 74 Years | 9 (75.0%) | 12 (100.0%) |
| 75 Years and over | 8 (100.0%) | 5 (62.5%) |
| Total | 27 (18.9%) | 99 (69.2%) |
Disability Status by Sex by Age in Pulaski
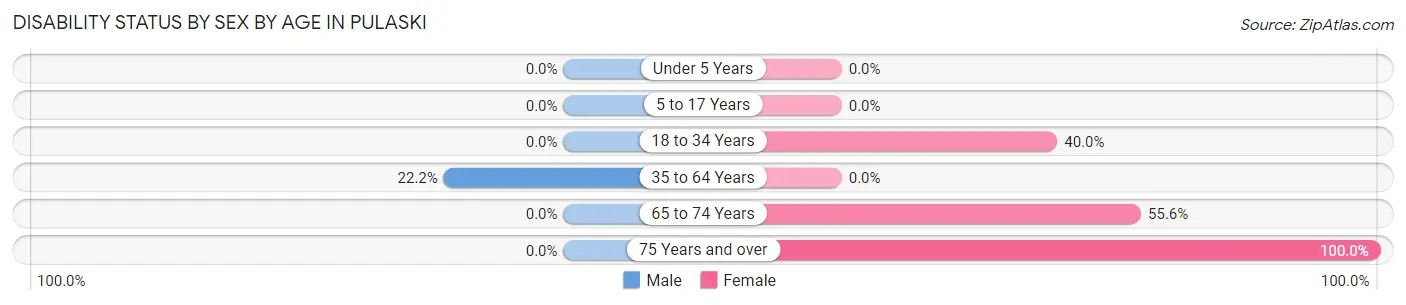
| Age Bracket | Male | Female |
| Under 5 Years | 0 (0.0%) | 0 (0.0%) |
| 5 to 17 Years | 0 (0.0%) | 0 (0.0%) |
| 18 to 34 Years | 0 (0.0%) | 8 (40.0%) |
| 35 to 64 Years | 4 (22.2%) | 0 (0.0%) |
| 65 to 74 Years | 0 (0.0%) | 5 (55.6%) |
| 75 Years and over | 0 (0.0%) | 3 (100.0%) |
Disability Class by Sex by Age in Pulaski
Disability Class: Hearing Difficulty
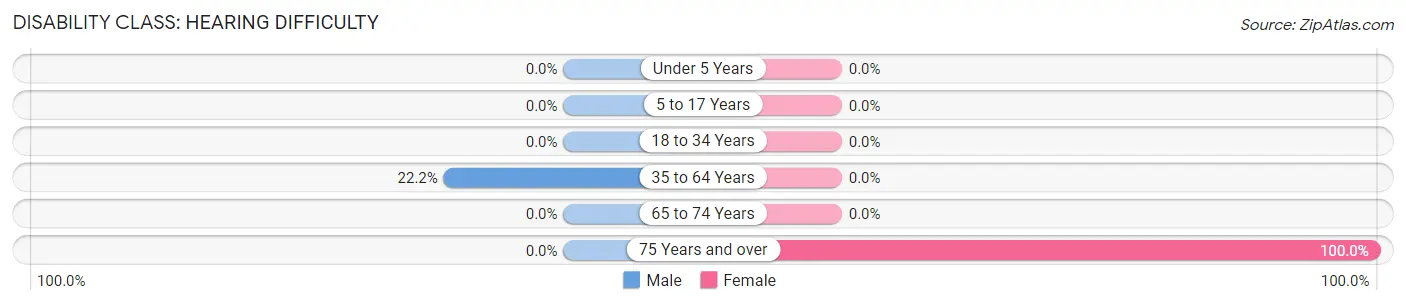
| Age Bracket | Male | Female |
| Under 5 Years | 0 (0.0%) | 0 (0.0%) |
| 5 to 17 Years | 0 (0.0%) | 0 (0.0%) |
| 18 to 34 Years | 0 (0.0%) | 0 (0.0%) |
| 35 to 64 Years | 4 (22.2%) | 0 (0.0%) |
| 65 to 74 Years | 0 (0.0%) | 0 (0.0%) |
| 75 Years and over | 0 (0.0%) | 3 (100.0%) |
Disability Class: Vision Difficulty
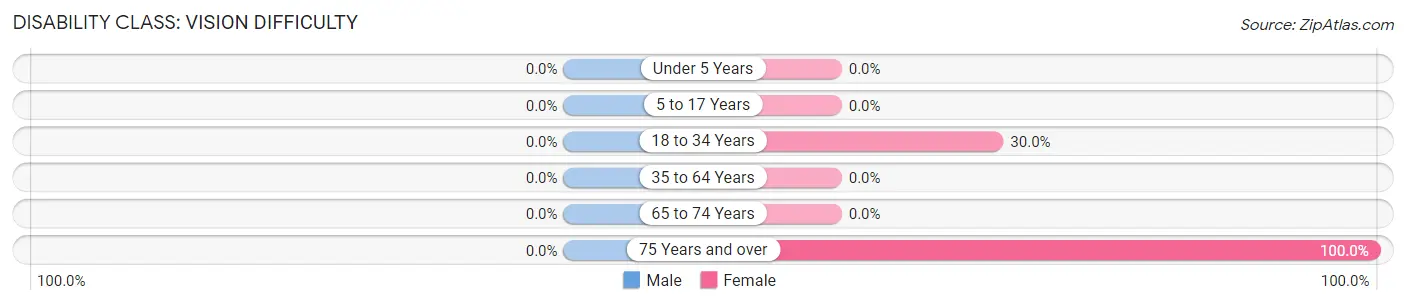
| Age Bracket | Male | Female |
| Under 5 Years | 0 (0.0%) | 0 (0.0%) |
| 5 to 17 Years | 0 (0.0%) | 0 (0.0%) |
| 18 to 34 Years | 0 (0.0%) | 6 (30.0%) |
| 35 to 64 Years | 0 (0.0%) | 0 (0.0%) |
| 65 to 74 Years | 0 (0.0%) | 0 (0.0%) |
| 75 Years and over | 0 (0.0%) | 3 (100.0%) |
Disability Class: Cognitive Difficulty
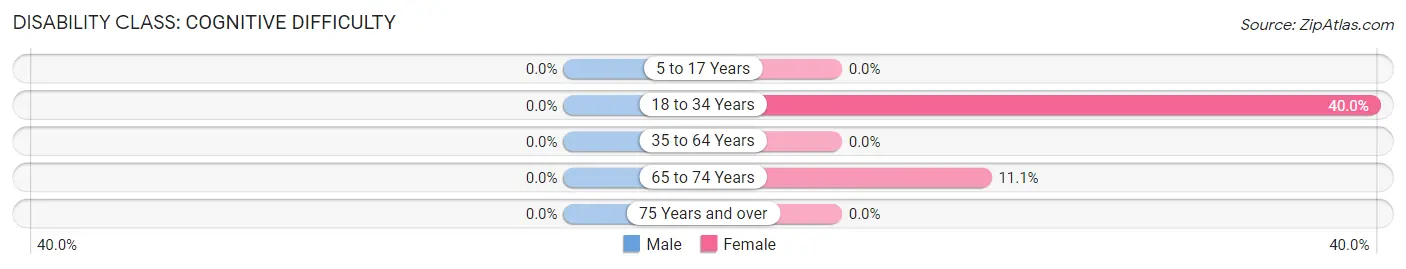
| Age Bracket | Male | Female |
| 5 to 17 Years | 0 (0.0%) | 0 (0.0%) |
| 18 to 34 Years | 0 (0.0%) | 8 (40.0%) |
| 35 to 64 Years | 0 (0.0%) | 0 (0.0%) |
| 65 to 74 Years | 0 (0.0%) | 1 (11.1%) |
| 75 Years and over | 0 (0.0%) | 0 (0.0%) |
Disability Class: Ambulatory Difficulty
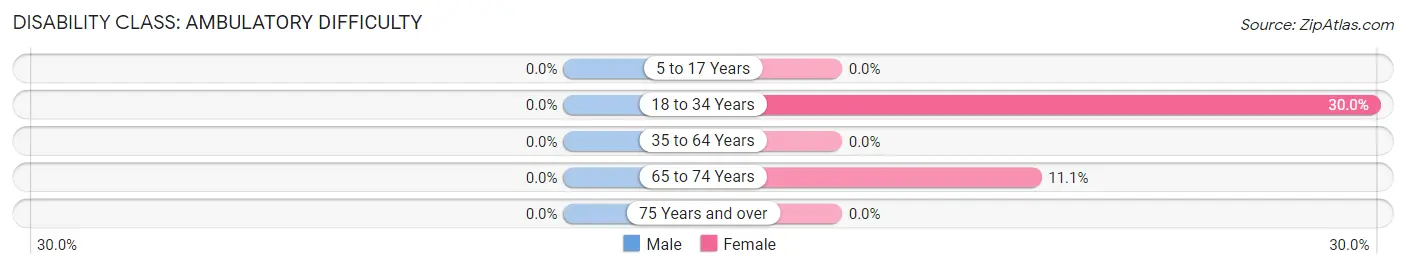
| Age Bracket | Male | Female |
| 5 to 17 Years | 0 (0.0%) | 0 (0.0%) |
| 18 to 34 Years | 0 (0.0%) | 6 (30.0%) |
| 35 to 64 Years | 0 (0.0%) | 0 (0.0%) |
| 65 to 74 Years | 0 (0.0%) | 1 (11.1%) |
| 75 Years and over | 0 (0.0%) | 0 (0.0%) |
Disability Class: Self-Care Difficulty

| Age Bracket | Male | Female |
| 5 to 17 Years | 0 (0.0%) | 0 (0.0%) |
| 18 to 34 Years | 0 (0.0%) | 6 (30.0%) |
| 35 to 64 Years | 0 (0.0%) | 0 (0.0%) |
| 65 to 74 Years | 0 (0.0%) | 1 (11.1%) |
| 75 Years and over | 0 (0.0%) | 0 (0.0%) |
Technology Access in Pulaski
Computing Device Access in Pulaski
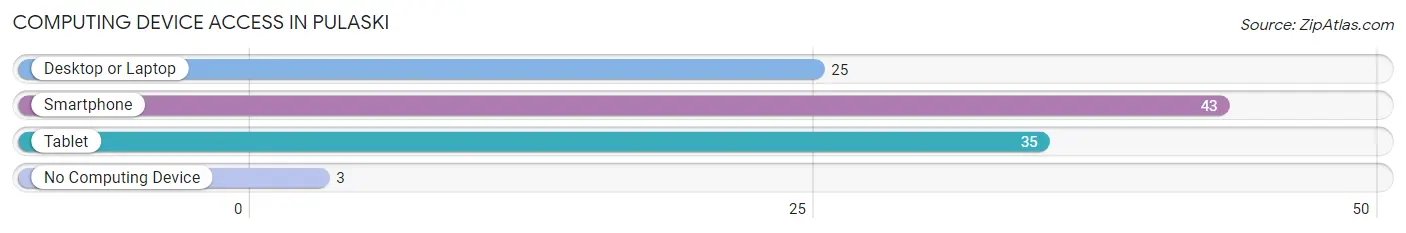
| Device Type | # Households | % Households |
| Desktop or Laptop | 25 | 50.0% |
| Smartphone | 43 | 86.0% |
| Tablet | 35 | 70.0% |
| No Computing Device | 3 | 6.0% |
| Total | 50 | 100.0% |
Internet Access in Pulaski
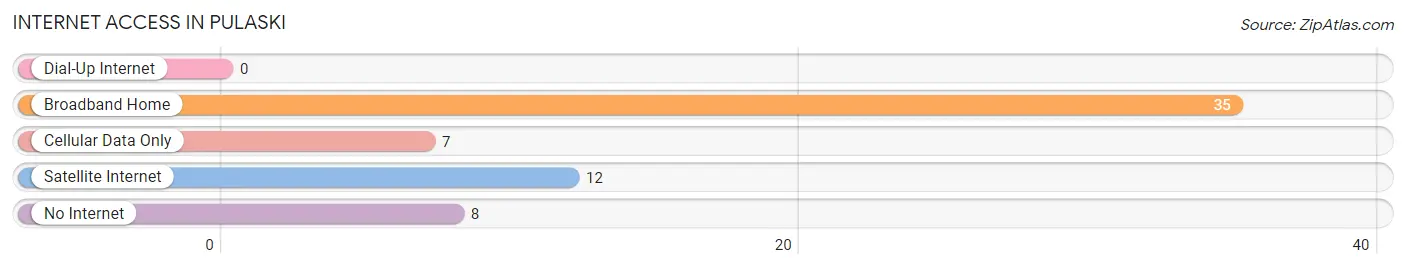
| Internet Type | # Households | % Households |
| Dial-Up Internet | 0 | 0.0% |
| Broadband Home | 35 | 70.0% |
| Cellular Data Only | 7 | 14.0% |
| Satellite Internet | 12 | 24.0% |
| No Internet | 8 | 16.0% |
| Total | 50 | 100.0% |
Pulaski Summary
Pulaski, Georgia is a small town located in the southwestern part of the state, in the heart of the Georgia Piedmont. It is situated in the middle of a triangle formed by the cities of Macon, Atlanta, and Augusta. The town is named after Count Casimir Pulaski, a Polish-born Revolutionary War hero who died in the Battle of Savannah in 1779.
History
Pulaski was founded in 1820 by a group of settlers from North Carolina. The town was originally called “Pulaski Court House” and was the county seat of Pulaski County. The town was incorporated in 1837 and the name was changed to Pulaski.
The town was a major stop on the Central of Georgia Railroad, which connected Savannah to Atlanta. The railroad brought economic growth to the area and helped to make Pulaski a major agricultural center. The town was also home to several cotton mills, which provided employment for many of the town’s residents.
In the late 19th century, Pulaski was a popular destination for wealthy tourists from the North. The town was known for its mineral springs, which were believed to have healing properties. The town also had several hotels and resorts, which attracted visitors from all over the country.
Geography
Pulaski is located in the southwestern part of Georgia, in the heart of the Georgia Piedmont. The town is situated in the middle of a triangle formed by the cities of Macon, Atlanta, and Augusta. The town is located on the banks of the Ocmulgee River, which flows through the town.
The town is surrounded by rolling hills and is home to several small lakes and ponds. The town is also home to several parks, including the Pulaski County Park, which offers camping, fishing, and hiking.
Economy
The economy of Pulaski is largely based on agriculture. The town is home to several farms, which produce a variety of crops, including cotton, corn, soybeans, and peanuts. The town is also home to several poultry farms, which produce eggs and poultry products.
The town is also home to several manufacturing companies, which produce a variety of products, including furniture, textiles, and automotive parts. The town is also home to several retail stores, which sell a variety of goods.
Demographics
As of the 2010 census, the population of Pulaski was 4,845. The town has a population that is predominantly white (83.3%), with African Americans making up the largest minority group (14.2%). The town also has a small Hispanic population (1.7%).
The median household income in Pulaski is $37,941, which is slightly lower than the state average of $41,890. The town has a poverty rate of 17.3%, which is slightly higher than the state average of 16.3%.
Conclusion
Pulaski, Georgia is a small town located in the southwestern part of the state, in the heart of the Georgia Piedmont. The town was founded in 1820 and was a major stop on the Central of Georgia Railroad. The town is largely based on agriculture and is home to several farms, manufacturing companies, and retail stores. The population of Pulaski is predominantly white, with African Americans making up the largest minority group. The median household income in Pulaski is slightly lower than the state average, and the town has a poverty rate that is slightly higher than the state average.
Common Questions
What is Per Capita Income in Pulaski?
Per Capita income in Pulaski is $24,099.
What is the Median Family Income in Pulaski?
Median Family Income in Pulaski is $90,313.
What is the Median Household income in Pulaski?
Median Household Income in Pulaski is $61,786.
What is Income or Wage Gap in Pulaski?
Income or Wage Gap in Pulaski is 30.0%.
Women in Pulaski earn 70.0 cents for every dollar earned by a man.
What is Inequality or Gini Index in Pulaski?
Inequality or Gini Index in Pulaski is 0.31.
What is the Total Population of Pulaski?
Total Population of Pulaski is 230.
What is the Total Male Population of Pulaski?
Total Male Population of Pulaski is 90.
What is the Total Female Population of Pulaski?
Total Female Population of Pulaski is 140.
What is the Ratio of Males per 100 Females in Pulaski?
There are 64.29 Males per 100 Females in Pulaski.
What is the Ratio of Females per 100 Males in Pulaski?
There are 155.56 Females per 100 Males in Pulaski.
What is the Median Population Age in Pulaski?
Median Population Age in Pulaski is 56.0 Years.
What is the Average Family Size in Pulaski
Average Family Size in Pulaski is 3.2 People.
What is the Average Household Size in Pulaski
Average Household Size in Pulaski is 2.9 People.
How Large is the Labor Force in Pulaski?
There are 92 People in the Labor Forcein in Pulaski.
What is the Percentage of People in the Labor Force in Pulaski?
44.0% of People are in the Labor Force in Pulaski.