Zip Codes with the Highest Percentage of Population Employed in Health Diagnosing & Treating in Alpharetta, GA
RELATED REPORTS & OPTIONS
Health Diagnosing & Treating
Alpharetta
Compare Zip Codes
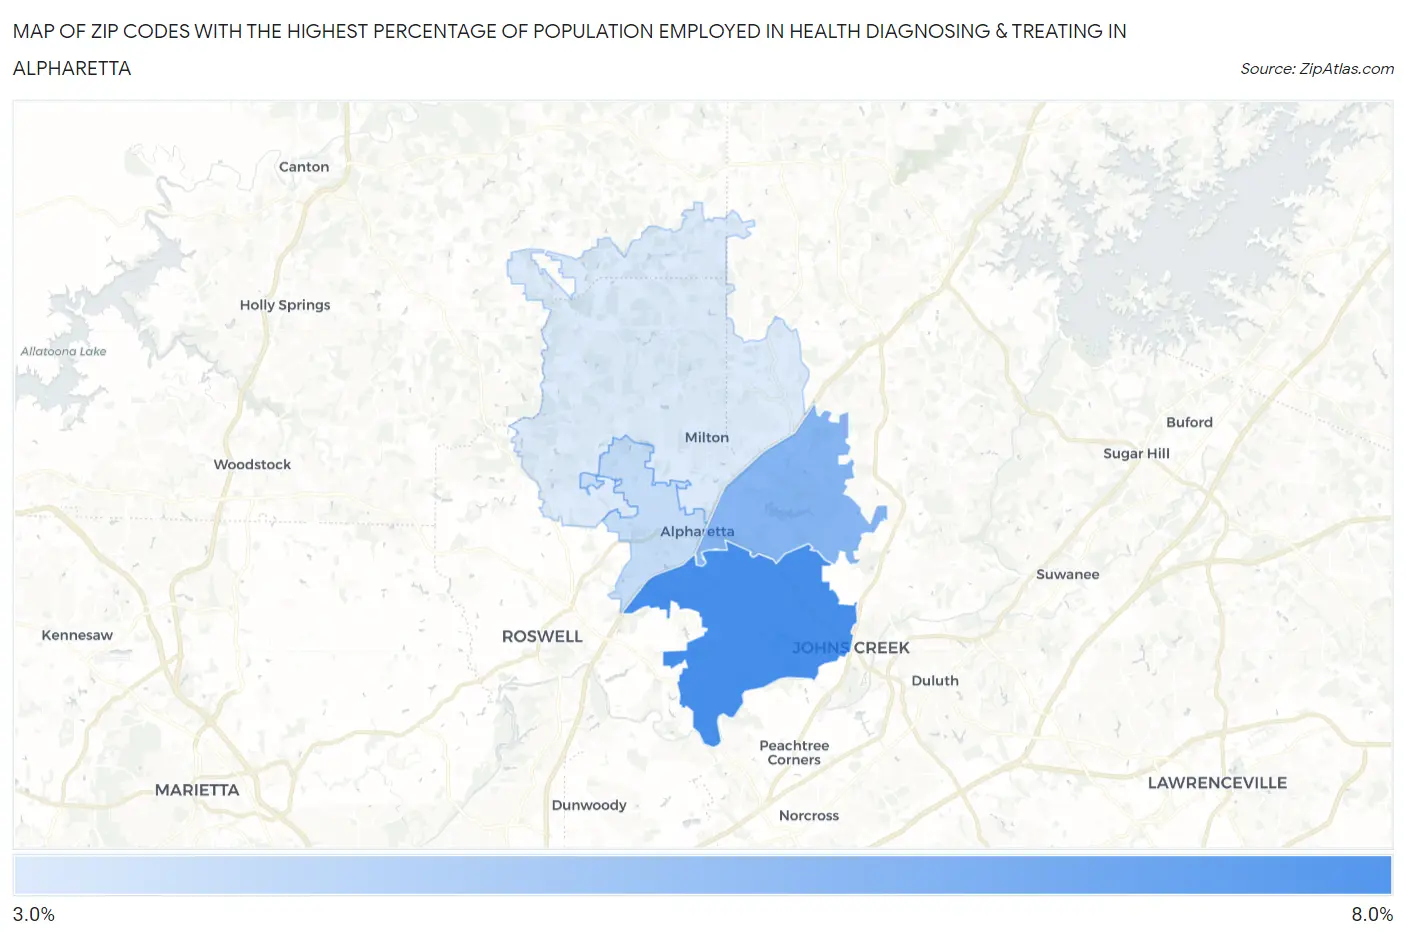
Map of Zip Codes with the Highest Percentage of Population Employed in Health Diagnosing & Treating in Alpharetta
3.7%
6.7%
Zip Codes with the Highest Percentage of Population Employed in Health Diagnosing & Treating in Alpharetta, GA
| Zip Code | % Employed | vs State | vs National | |
| 1. | 30022 | 6.7% | 5.7%(+1.04)#215 | 6.2%(+0.501)#11,166 |
| 2. | 30005 | 5.4% | 5.7%(-0.278)#335 | 6.2%(-0.817)#16,056 |
| 3. | 30009 | 4.1% | 5.7%(-1.59)#461 | 6.2%(-2.13)#21,017 |
| 4. | 30004 | 3.7% | 5.7%(-2.05)#508 | 6.2%(-2.59)#22,442 |
1
Common Questions
What are the Top 3 Zip Codes with the Highest Percentage of Population Employed in Health Diagnosing & Treating in Alpharetta, GA?
Top 3 Zip Codes with the Highest Percentage of Population Employed in Health Diagnosing & Treating in Alpharetta, GA are:
What zip code has the Highest Percentage of Population Employed in Health Diagnosing & Treating in Alpharetta, GA?
30022 has the Highest Percentage of Population Employed in Health Diagnosing & Treating in Alpharetta, GA with 6.7%.
What is the Percentage of Population Employed in Health Diagnosing & Treating in Alpharetta, GA?
Percentage of Population Employed in Health Diagnosing & Treating in Alpharetta is 6.3%.
What is the Percentage of Population Employed in Health Diagnosing & Treating in Georgia?
Percentage of Population Employed in Health Diagnosing & Treating in Georgia is 5.7%.
What is the Percentage of Population Employed in Health Diagnosing & Treating in the United States?
Percentage of Population Employed in Health Diagnosing & Treating in the United States is 6.2%.