Zip Codes with the Highest Percentage of Population Employed in Health Diagnosing & Treating in Snellville, GA
RELATED REPORTS & OPTIONS
Health Diagnosing & Treating
Snellville
Compare Zip Codes
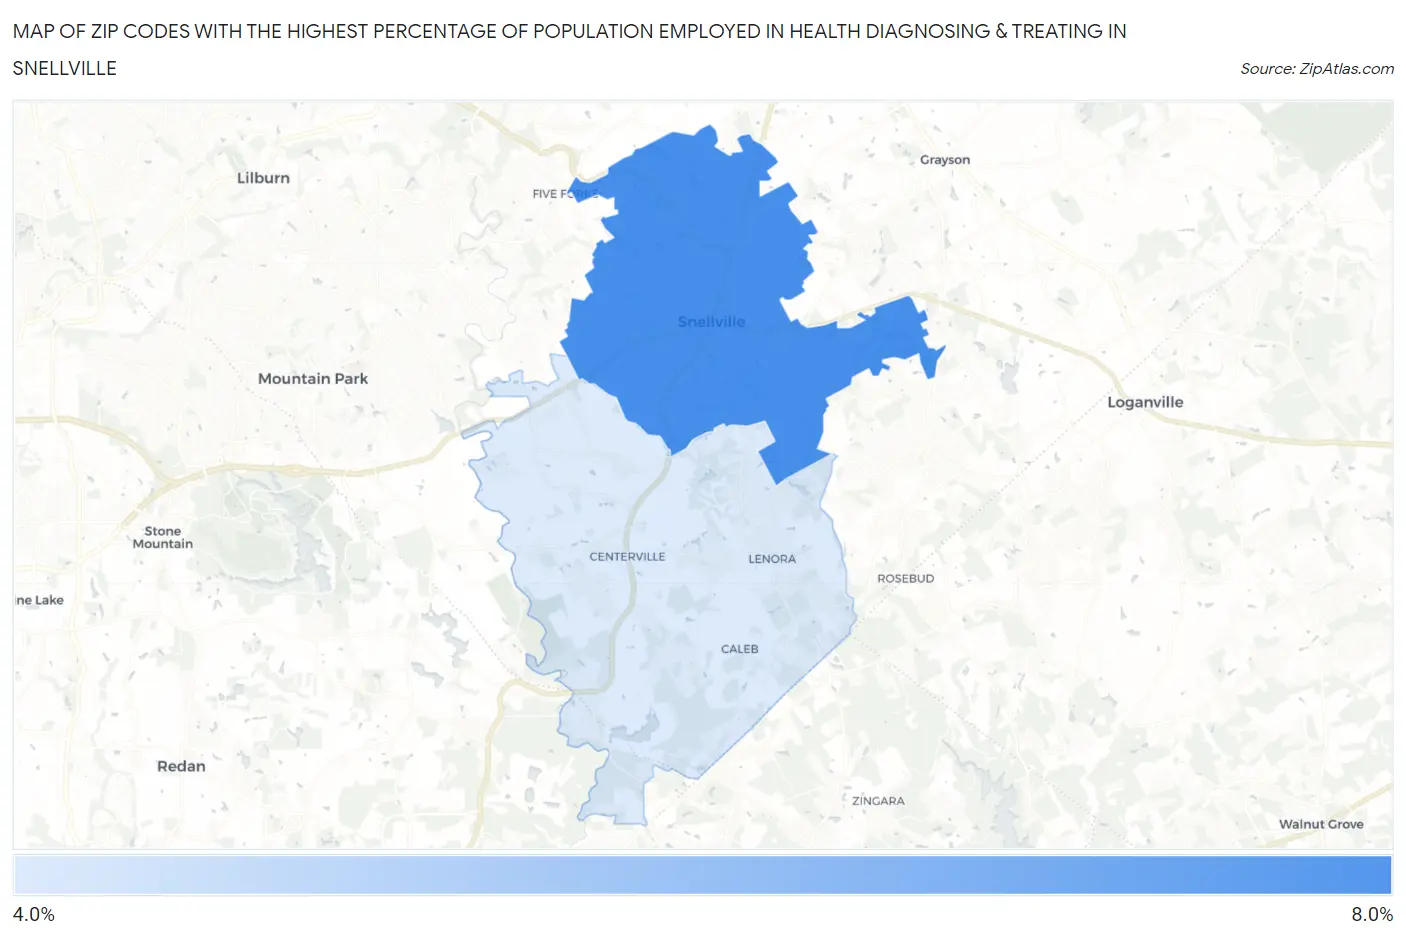
Map of Zip Codes with the Highest Percentage of Population Employed in Health Diagnosing & Treating in Snellville
4.8%
6.4%
Zip Codes with the Highest Percentage of Population Employed in Health Diagnosing & Treating in Snellville, GA
| Zip Code | % Employed | vs State | vs National | |
| 1. | 30078 | 6.4% | 5.7%(+0.684)#244 | 6.2%(+0.145)#12,419 |
| 2. | 30039 | 4.8% | 5.7%(-0.934)#397 | 6.2%(-1.47)#18,599 |
1
Common Questions
What are the Top Zip Codes with the Highest Percentage of Population Employed in Health Diagnosing & Treating in Snellville, GA?
Top Zip Codes with the Highest Percentage of Population Employed in Health Diagnosing & Treating in Snellville, GA are:
What zip code has the Highest Percentage of Population Employed in Health Diagnosing & Treating in Snellville, GA?
30078 has the Highest Percentage of Population Employed in Health Diagnosing & Treating in Snellville, GA with 6.4%.
What is the Percentage of Population Employed in Health Diagnosing & Treating in Snellville, GA?
Percentage of Population Employed in Health Diagnosing & Treating in Snellville is 7.0%.
What is the Percentage of Population Employed in Health Diagnosing & Treating in Georgia?
Percentage of Population Employed in Health Diagnosing & Treating in Georgia is 5.7%.
What is the Percentage of Population Employed in Health Diagnosing & Treating in the United States?
Percentage of Population Employed in Health Diagnosing & Treating in the United States is 6.2%.