Zip Codes with the Highest Percentage of Population Employed in Health Diagnosing & Treating in Mcdonough, GA
RELATED REPORTS & OPTIONS
Health Diagnosing & Treating
Mcdonough
Compare Zip Codes
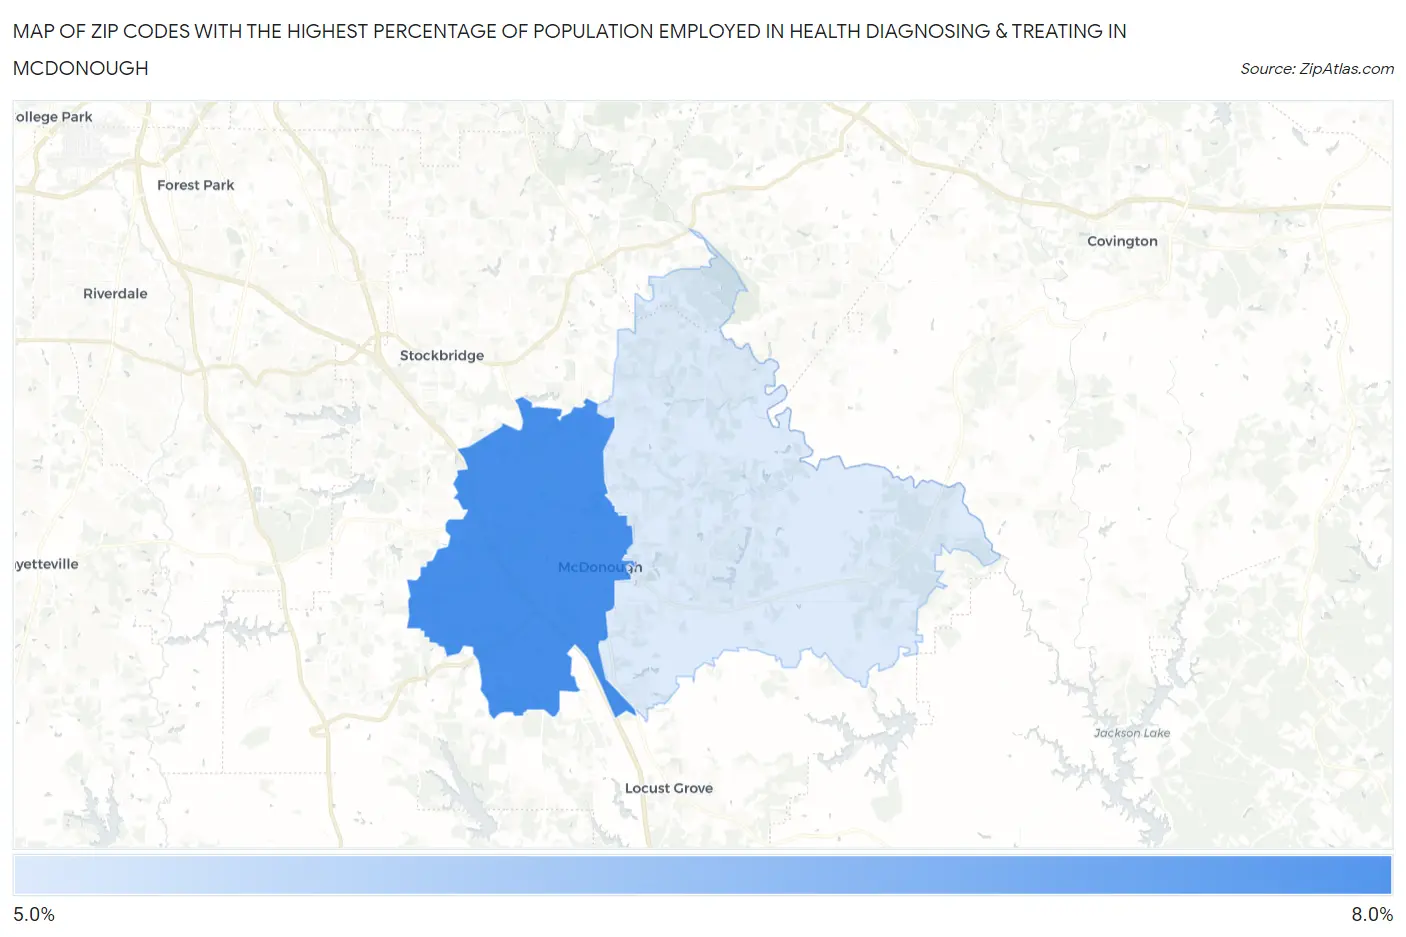
Map of Zip Codes with the Highest Percentage of Population Employed in Health Diagnosing & Treating in Mcdonough
5.6%
7.6%
Zip Codes with the Highest Percentage of Population Employed in Health Diagnosing & Treating in Mcdonough, GA
| Zip Code | % Employed | vs State | vs National | |
| 1. | 30253 | 7.6% | 5.7%(+1.91)#153 | 6.2%(+1.37)#8,483 |
| 2. | 30252 | 5.6% | 5.7%(-0.059)#314 | 6.2%(-0.598)#15,199 |
1
Common Questions
What are the Top Zip Codes with the Highest Percentage of Population Employed in Health Diagnosing & Treating in Mcdonough, GA?
Top Zip Codes with the Highest Percentage of Population Employed in Health Diagnosing & Treating in Mcdonough, GA are:
What zip code has the Highest Percentage of Population Employed in Health Diagnosing & Treating in Mcdonough, GA?
30253 has the Highest Percentage of Population Employed in Health Diagnosing & Treating in Mcdonough, GA with 7.6%.
What is the Percentage of Population Employed in Health Diagnosing & Treating in Mcdonough, GA?
Percentage of Population Employed in Health Diagnosing & Treating in Mcdonough is 4.7%.
What is the Percentage of Population Employed in Health Diagnosing & Treating in Georgia?
Percentage of Population Employed in Health Diagnosing & Treating in Georgia is 5.7%.
What is the Percentage of Population Employed in Health Diagnosing & Treating in the United States?
Percentage of Population Employed in Health Diagnosing & Treating in the United States is 6.2%.