Zip Codes with the Highest Percentage of Population Employed in Health Diagnosing & Treating in Stone Mountain, GA
RELATED REPORTS & OPTIONS
Health Diagnosing & Treating
Stone Mountain
Compare Zip Codes
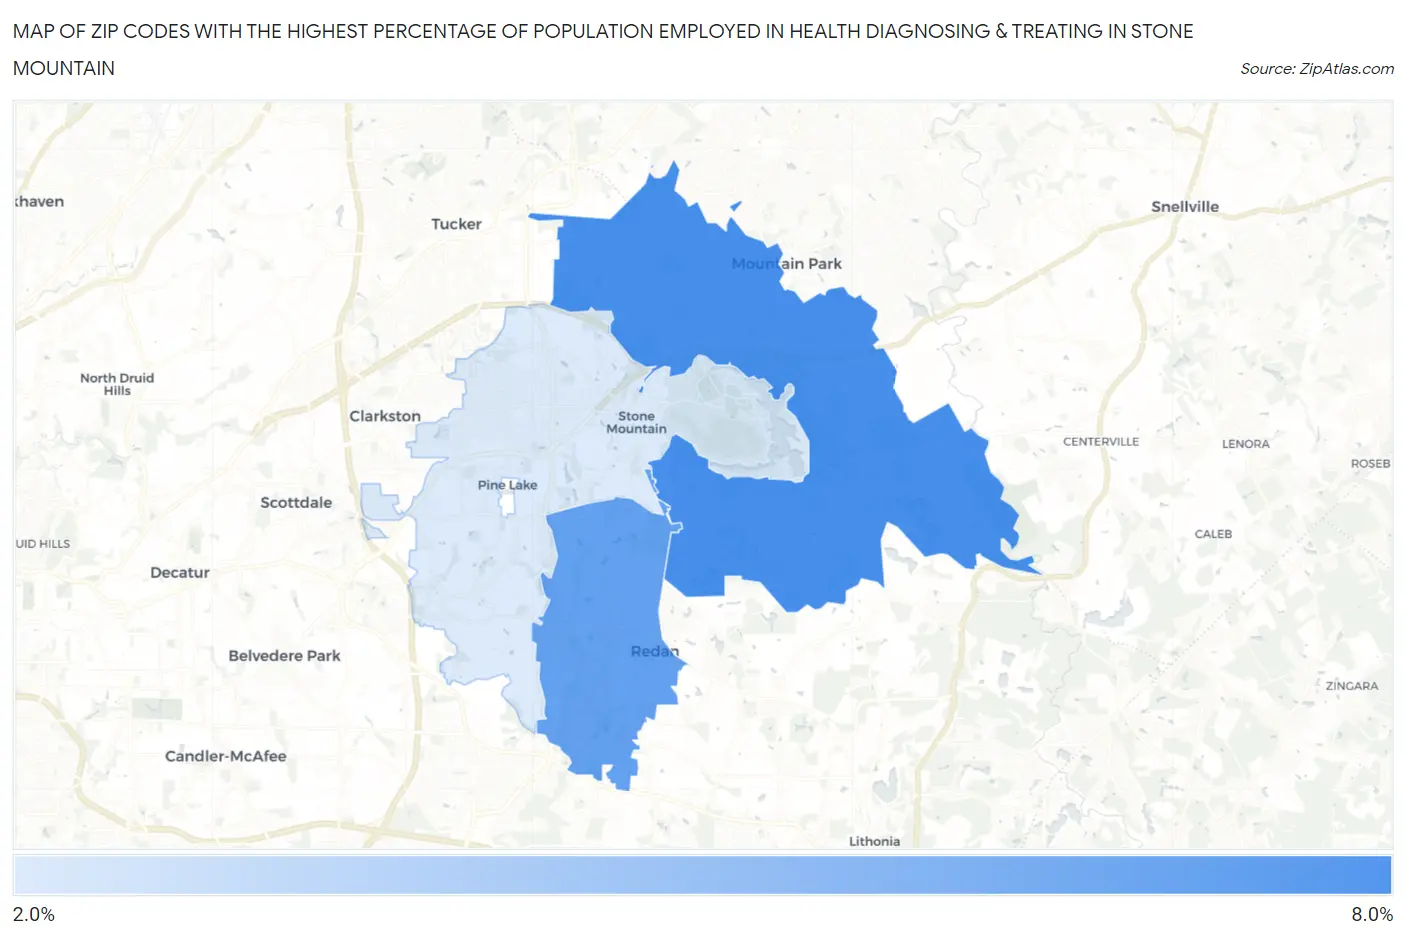
Map of Zip Codes with the Highest Percentage of Population Employed in Health Diagnosing & Treating in Stone Mountain
2.6%
6.8%
Zip Codes with the Highest Percentage of Population Employed in Health Diagnosing & Treating in Stone Mountain, GA
| Zip Code | % Employed | vs State | vs National | |
| 1. | 30087 | 6.8% | 5.7%(+1.10)#209 | 6.2%(+0.562)#10,976 |
| 2. | 30088 | 6.0% | 5.7%(+0.310)#280 | 6.2%(-0.230)#13,817 |
| 3. | 30083 | 2.6% | 5.7%(-3.13)#580 | 6.2%(-3.67)#25,344 |
1
Common Questions
What are the Top Zip Codes with the Highest Percentage of Population Employed in Health Diagnosing & Treating in Stone Mountain, GA?
Top Zip Codes with the Highest Percentage of Population Employed in Health Diagnosing & Treating in Stone Mountain, GA are:
What zip code has the Highest Percentage of Population Employed in Health Diagnosing & Treating in Stone Mountain, GA?
30087 has the Highest Percentage of Population Employed in Health Diagnosing & Treating in Stone Mountain, GA with 6.8%.
What is the Percentage of Population Employed in Health Diagnosing & Treating in Stone Mountain, GA?
Percentage of Population Employed in Health Diagnosing & Treating in Stone Mountain is 2.2%.
What is the Percentage of Population Employed in Health Diagnosing & Treating in Georgia?
Percentage of Population Employed in Health Diagnosing & Treating in Georgia is 5.7%.
What is the Percentage of Population Employed in Health Diagnosing & Treating in the United States?
Percentage of Population Employed in Health Diagnosing & Treating in the United States is 6.2%.