Crooked Creek, GA Map & Demographics
Crooked Creek Map
Crooked Creek Overview
$24,082
PER CAPITA INCOME
$64,948
AVG FAMILY INCOME
$27,366
AVG HOUSEHOLD INCOME
0.42
INEQUALITY / GINI INDEX
674
TOTAL POPULATION
296
MALE POPULATION
378
FEMALE POPULATION
78.31
MALES / 100 FEMALES
127.70
FEMALES / 100 MALES
63.5
MEDIAN AGE
2.7
AVG FAMILY SIZE
1.8
AVG HOUSEHOLD SIZE
204
LABOR FORCE [ PEOPLE ]
36.9%
PERCENT IN LABOR FORCE
2.0%
UNEMPLOYMENT RATE
Income in Crooked Creek
Income Overview in Crooked Creek
Per Capita Income in Crooked Creek is $24,082, while median incomes of families and households are $64,948 and $27,366 respectively.
| Characteristic | Number | Measure |
| Per Capita Income | 674 | $24,082 |
| Median Family Income | 175 | $64,948 |
| Mean Family Income | 175 | $71,900 |
| Median Household Income | 369 | $27,366 |
| Mean Household Income | 369 | $44,152 |
| Income Deficit | 175 | $0 |
| Wage / Income Gap (%) | 674 | 0.00% |
| Wage / Income Gap ($) | 674 | 100.00¢ per $1 |
| Gini / Inequality Index | 674 | 0.42 |
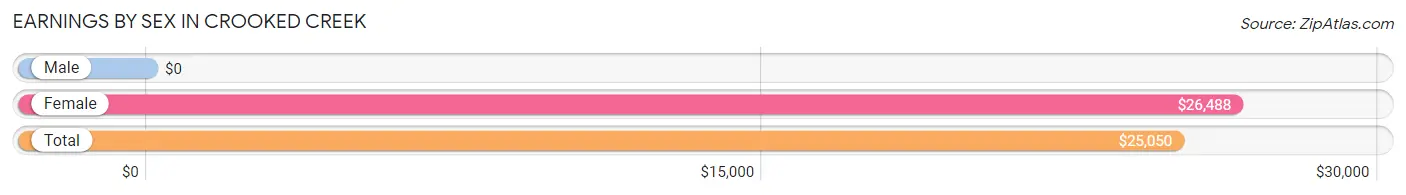
Earnings by Sex in Crooked Creek
| Sex | Number | Average Earnings |
| Male | 136 (60.4%) | $0 |
| Female | 89 (39.6%) | $26,488 |
| Total | 225 (100.0%) | $25,050 |
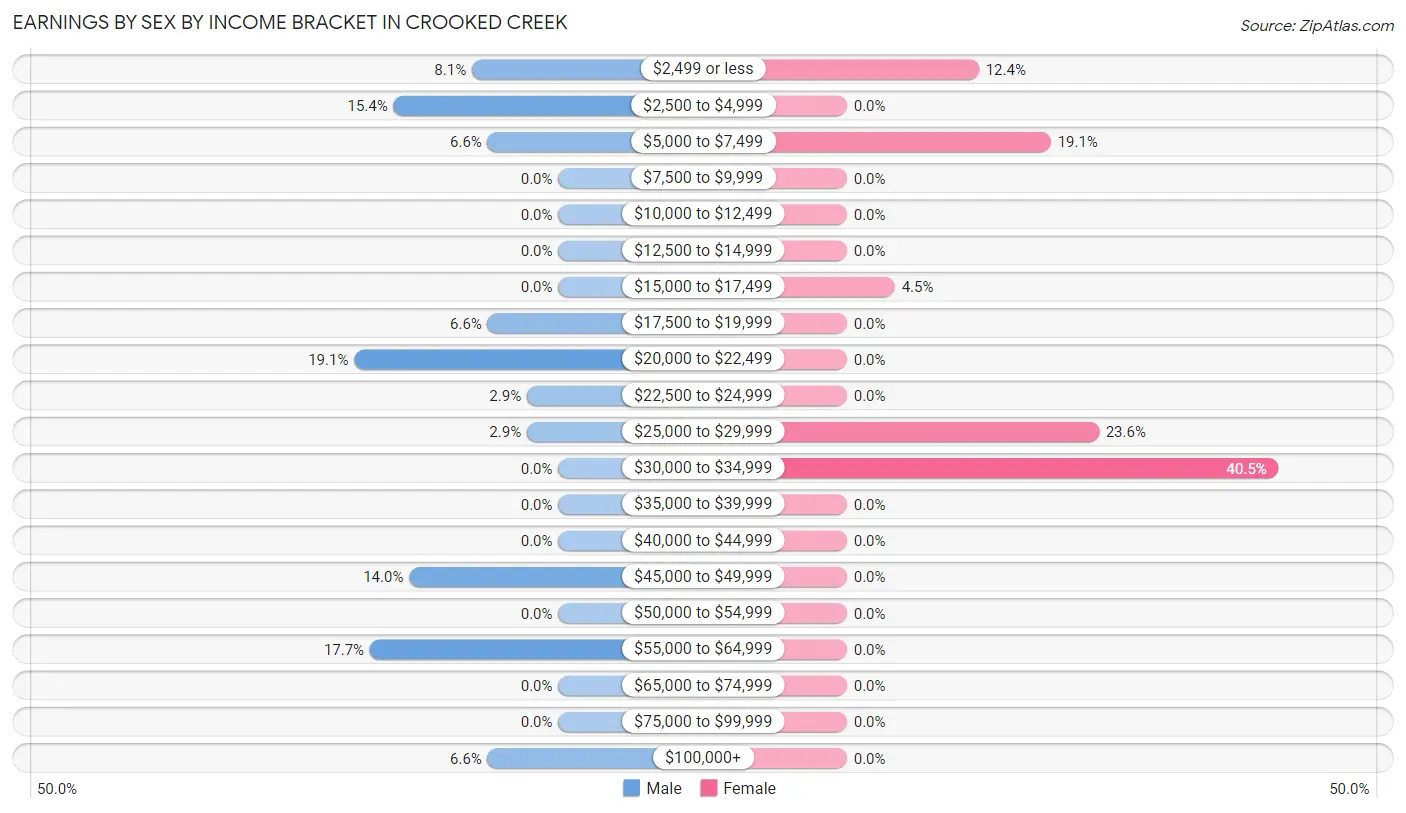
Earnings by Sex by Income Bracket in Crooked Creek
The most common earnings brackets in Crooked Creek are $20,000 to $22,499 for men (26 | 19.1%) and $30,000 to $34,999 for women (36 | 40.5%).
| Income | Male | Female |
| $2,499 or less | 11 (8.1%) | 11 (12.4%) |
| $2,500 to $4,999 | 21 (15.4%) | 0 (0.0%) |
| $5,000 to $7,499 | 9 (6.6%) | 17 (19.1%) |
| $7,500 to $9,999 | 0 (0.0%) | 0 (0.0%) |
| $10,000 to $12,499 | 0 (0.0%) | 0 (0.0%) |
| $12,500 to $14,999 | 0 (0.0%) | 0 (0.0%) |
| $15,000 to $17,499 | 0 (0.0%) | 4 (4.5%) |
| $17,500 to $19,999 | 9 (6.6%) | 0 (0.0%) |
| $20,000 to $22,499 | 26 (19.1%) | 0 (0.0%) |
| $22,500 to $24,999 | 4 (2.9%) | 0 (0.0%) |
| $25,000 to $29,999 | 4 (2.9%) | 21 (23.6%) |
| $30,000 to $34,999 | 0 (0.0%) | 36 (40.5%) |
| $35,000 to $39,999 | 0 (0.0%) | 0 (0.0%) |
| $40,000 to $44,999 | 0 (0.0%) | 0 (0.0%) |
| $45,000 to $49,999 | 19 (14.0%) | 0 (0.0%) |
| $50,000 to $54,999 | 0 (0.0%) | 0 (0.0%) |
| $55,000 to $64,999 | 24 (17.6%) | 0 (0.0%) |
| $65,000 to $74,999 | 0 (0.0%) | 0 (0.0%) |
| $75,000 to $99,999 | 0 (0.0%) | 0 (0.0%) |
| $100,000+ | 9 (6.6%) | 0 (0.0%) |
| Total | 136 (100.0%) | 89 (100.0%) |
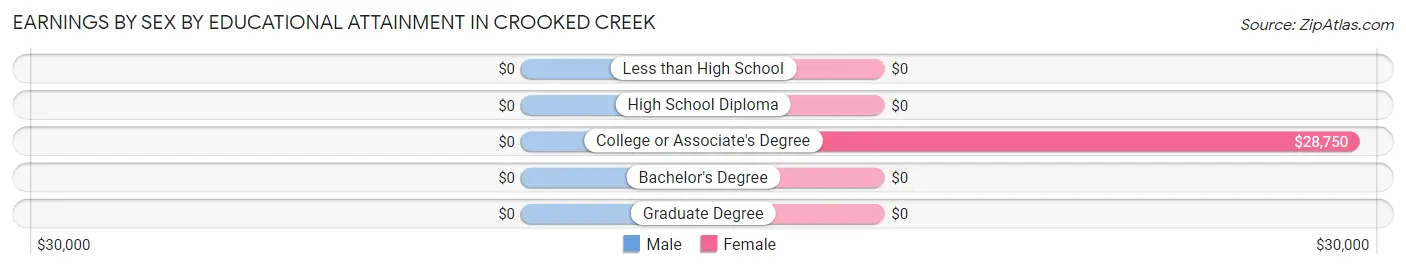
Earnings by Sex by Educational Attainment in Crooked Creek
| Educational Attainment | Male Income | Female Income |
| Less than High School | - | - |
| High School Diploma | - | - |
| College or Associate's Degree | - | - |
| Bachelor's Degree | - | - |
| Graduate Degree | - | - |
| Total | - | - |
Family Income in Crooked Creek
Family Income Brackets in Crooked Creek
According to the Crooked Creek family income data, there are 60 families falling into the $75,000 to $99,999 income range, which is the most common income bracket and makes up 34.3% of all families.
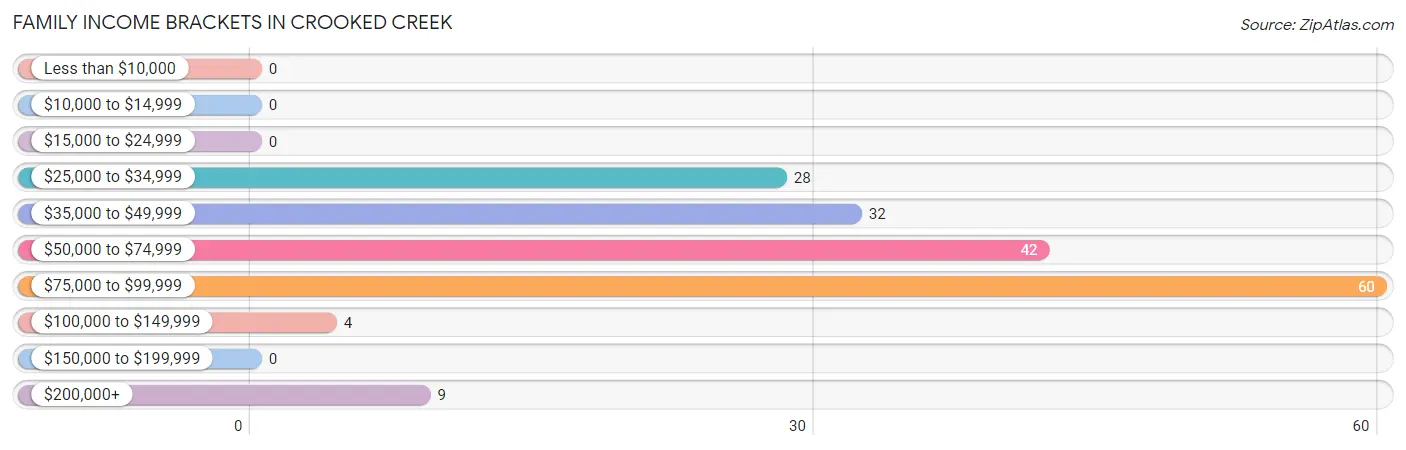
| Income Bracket | # Families | % Families |
| Less than $10,000 | 0 | 0.0% |
| $10,000 to $14,999 | 0 | 0.0% |
| $15,000 to $24,999 | 0 | 0.0% |
| $25,000 to $34,999 | 28 | 16.0% |
| $35,000 to $49,999 | 32 | 18.3% |
| $50,000 to $74,999 | 42 | 24.0% |
| $75,000 to $99,999 | 60 | 34.3% |
| $100,000 to $149,999 | 4 | 2.3% |
| $150,000 to $199,999 | 0 | 0.0% |
| $200,000+ | 9 | 5.1% |
Family Income by Famaliy Size in Crooked Creek
3-person families (45 | 25.7%) account for the highest median family income in Crooked Creek with $64,844 per family, while 2-person families (81 | 46.3%) have the highest median income of $24,323 per family member.
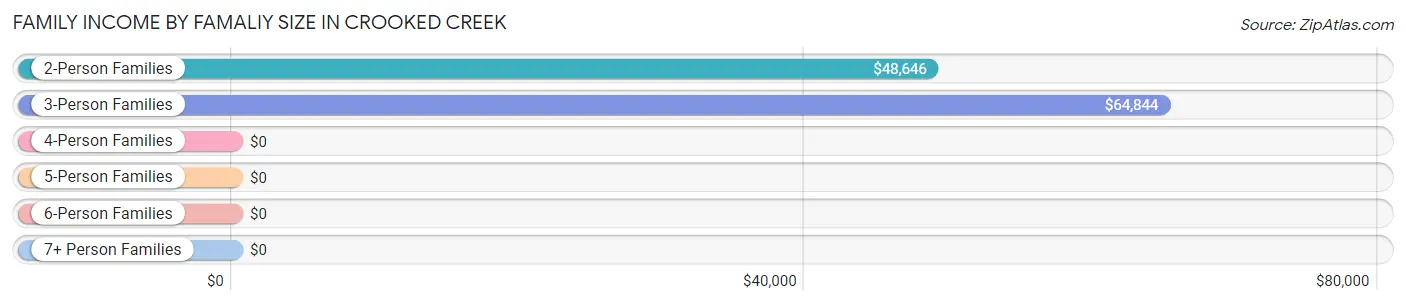
| Income Bracket | # Families | Median Income |
| 2-Person Families | 81 (46.3%) | $48,646 |
| 3-Person Families | 45 (25.7%) | $64,844 |
| 4-Person Families | 36 (20.6%) | $0 |
| 5-Person Families | 13 (7.4%) | $0 |
| 6-Person Families | 0 (0.0%) | $0 |
| 7+ Person Families | 0 (0.0%) | $0 |
| Total | 175 (100.0%) | $64,948 |
Family Income by Number of Earners in Crooked Creek
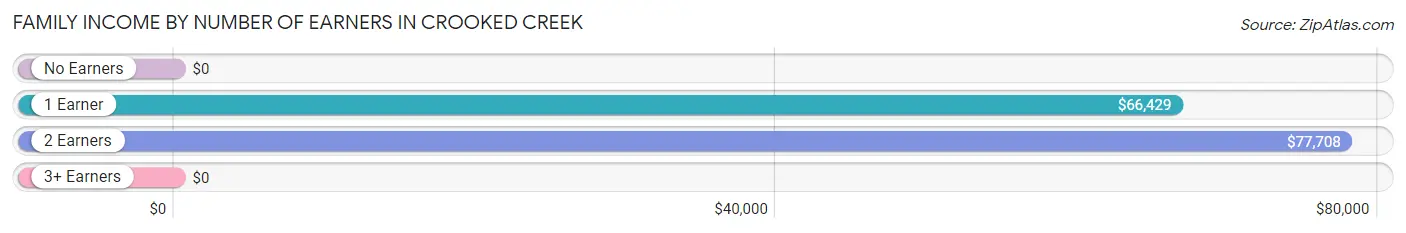
| Number of Earners | # Families | Median Income |
| No Earners | 46 (26.3%) | $0 |
| 1 Earner | 56 (32.0%) | $66,429 |
| 2 Earners | 66 (37.7%) | $77,708 |
| 3+ Earners | 7 (4.0%) | $0 |
| Total | 175 (100.0%) | $64,948 |
Household Income in Crooked Creek
Household Income Brackets in Crooked Creek
With 127 households falling in the category, the $15,000 to $24,999 income range is the most frequent in Crooked Creek, accounting for 34.4% of all households.
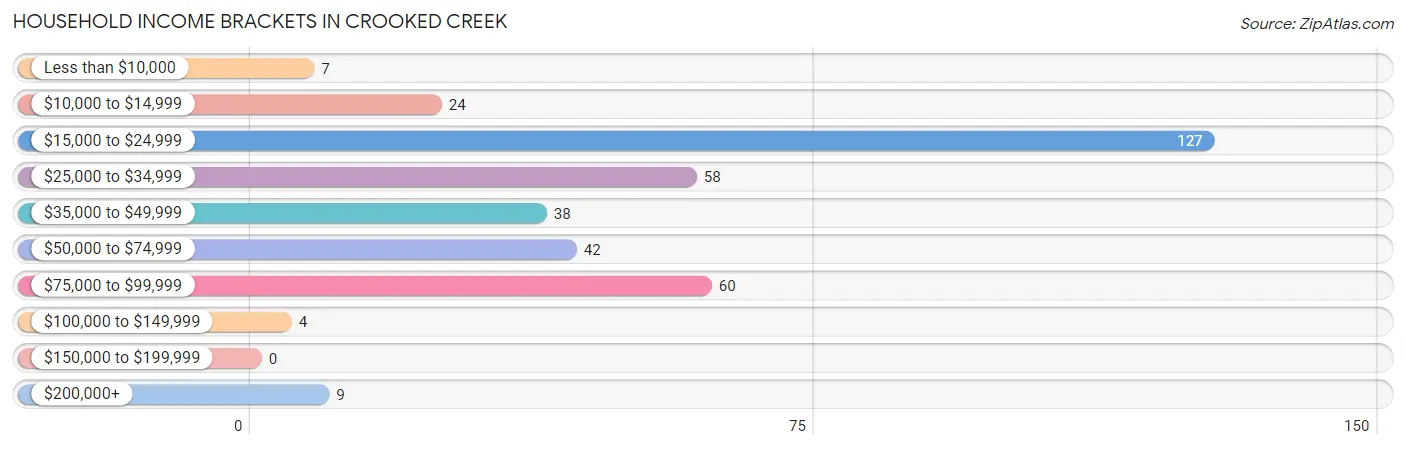
| Income Bracket | # Households | % Households |
| Less than $10,000 | 7 | 1.9% |
| $10,000 to $14,999 | 24 | 6.5% |
| $15,000 to $24,999 | 127 | 34.4% |
| $25,000 to $34,999 | 58 | 15.7% |
| $35,000 to $49,999 | 38 | 10.3% |
| $50,000 to $74,999 | 42 | 11.4% |
| $75,000 to $99,999 | 60 | 16.3% |
| $100,000 to $149,999 | 4 | 1.1% |
| $150,000 to $199,999 | 0 | 0.0% |
| $200,000+ | 9 | 2.4% |
Household Income by Householder Age in Crooked Creek
The median household income in Crooked Creek is $27,366, with the highest median household income of $35,938 found in the 45 to 64 years age bracket for the primary householder. A total of 105 households (28.5%) fall into this category.
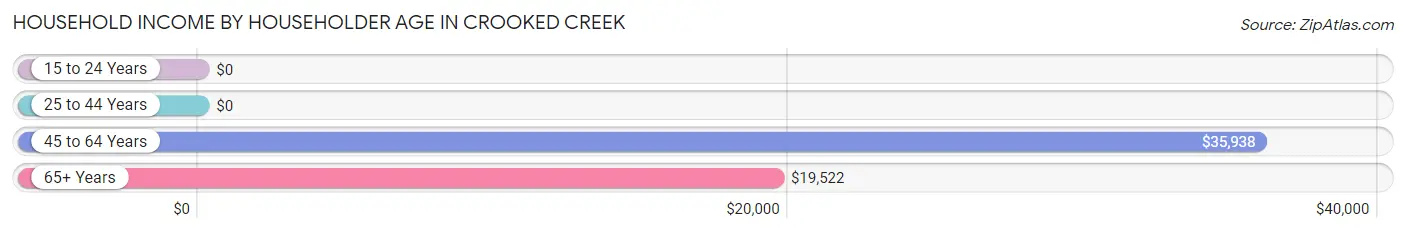
| Income Bracket | # Households | Median Income |
| 15 to 24 Years | 0 (0.0%) | $0 |
| 25 to 44 Years | 43 (11.7%) | $0 |
| 45 to 64 Years | 105 (28.5%) | $35,938 |
| 65+ Years | 221 (59.9%) | $19,522 |
| Total | 369 (100.0%) | $27,366 |
Poverty in Crooked Creek
Income Below Poverty by Sex and Age in Crooked Creek
With 17.9% poverty level for males and 14.3% for females among the residents of Crooked Creek, 12 to 14 year old males and 5 year old females are the most vulnerable to poverty, with 5 males (100.0%) and 4 females (100.0%) in their respective age groups living below the poverty level.
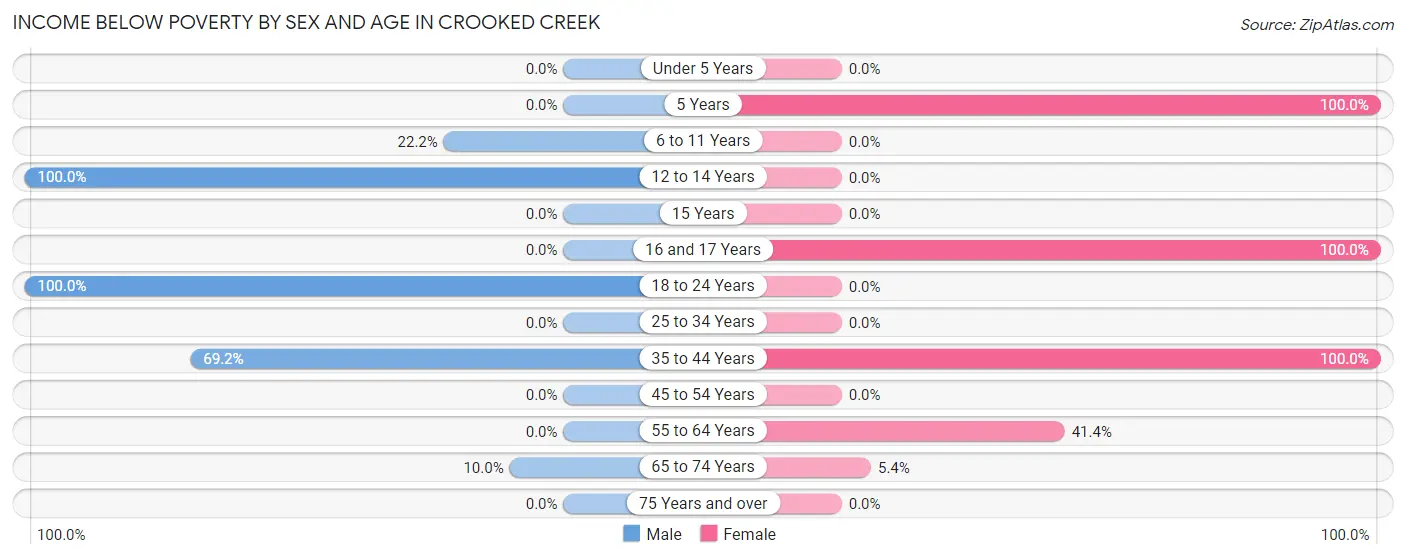
| Age Bracket | Male | Female |
| Under 5 Years | 0 (0.0%) | 0 (0.0%) |
| 5 Years | 0 (0.0%) | 4 (100.0%) |
| 6 to 11 Years | 18 (22.2%) | 0 (0.0%) |
| 12 to 14 Years | 5 (100.0%) | 0 (0.0%) |
| 15 Years | 0 (0.0%) | 0 (0.0%) |
| 16 and 17 Years | 0 (0.0%) | 5 (100.0%) |
| 18 to 24 Years | 14 (100.0%) | 0 (0.0%) |
| 25 to 34 Years | 0 (0.0%) | 0 (0.0%) |
| 35 to 44 Years | 9 (69.2%) | 11 (100.0%) |
| 45 to 54 Years | 0 (0.0%) | 0 (0.0%) |
| 55 to 64 Years | 0 (0.0%) | 24 (41.4%) |
| 65 to 74 Years | 7 (10.0%) | 10 (5.4%) |
| 75 Years and over | 0 (0.0%) | 0 (0.0%) |
| Total | 53 (17.9%) | 54 (14.3%) |
Income Above Poverty by Sex and Age in Crooked Creek
According to the poverty statistics in Crooked Creek, males aged 25 to 34 years and females aged under 5 years are the age groups that are most secure financially, with 100.0% of males and 100.0% of females in these age groups living above the poverty line.
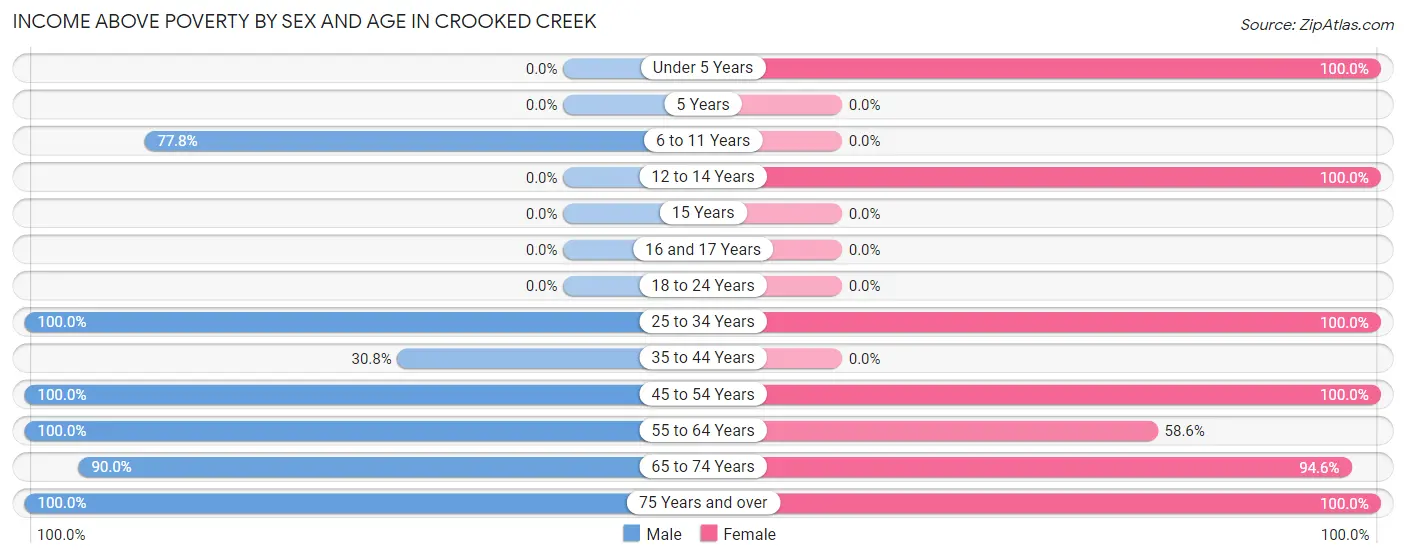
| Age Bracket | Male | Female |
| Under 5 Years | 0 (0.0%) | 18 (100.0%) |
| 5 Years | 0 (0.0%) | 0 (0.0%) |
| 6 to 11 Years | 63 (77.8%) | 0 (0.0%) |
| 12 to 14 Years | 0 (0.0%) | 13 (100.0%) |
| 15 Years | 0 (0.0%) | 0 (0.0%) |
| 16 and 17 Years | 0 (0.0%) | 0 (0.0%) |
| 18 to 24 Years | 0 (0.0%) | 0 (0.0%) |
| 25 to 34 Years | 23 (100.0%) | 36 (100.0%) |
| 35 to 44 Years | 4 (30.8%) | 0 (0.0%) |
| 45 to 54 Years | 44 (100.0%) | 17 (100.0%) |
| 55 to 64 Years | 9 (100.0%) | 34 (58.6%) |
| 65 to 74 Years | 63 (90.0%) | 174 (94.6%) |
| 75 Years and over | 37 (100.0%) | 32 (100.0%) |
| Total | 243 (82.1%) | 324 (85.7%) |
Income Below Poverty Among Married-Couple Families in Crooked Creek
The poverty statistics for married-couple families in Crooked Creek show that 4.7% or 7 of the total 149 families live below the poverty line. Families with 1 or 2 children have the highest poverty rate of 10.4%, comprising of 7 families. On the other hand, families with no children have the lowest poverty rate of 0.0%, which includes 0 families.
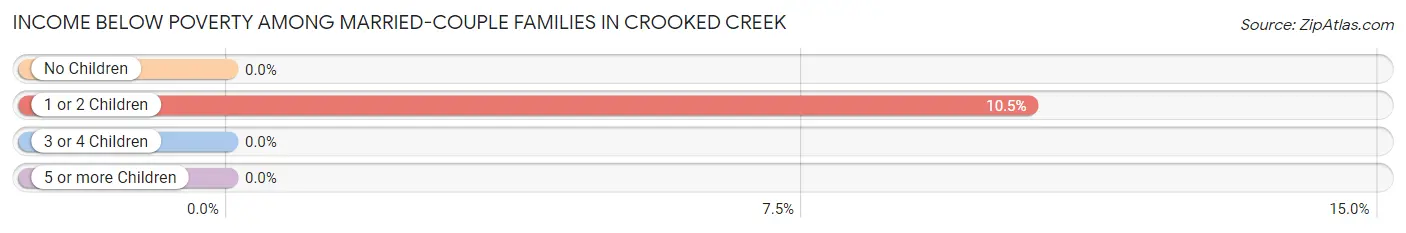
| Children | Above Poverty | Below Poverty |
| No Children | 82 (100.0%) | 0 (0.0%) |
| 1 or 2 Children | 60 (89.5%) | 7 (10.4%) |
| 3 or 4 Children | 0 (0.0%) | 0 (0.0%) |
| 5 or more Children | 0 (0.0%) | 0 (0.0%) |
| Total | 142 (95.3%) | 7 (4.7%) |
Income Below Poverty Among Single-Parent Households in Crooked Creek
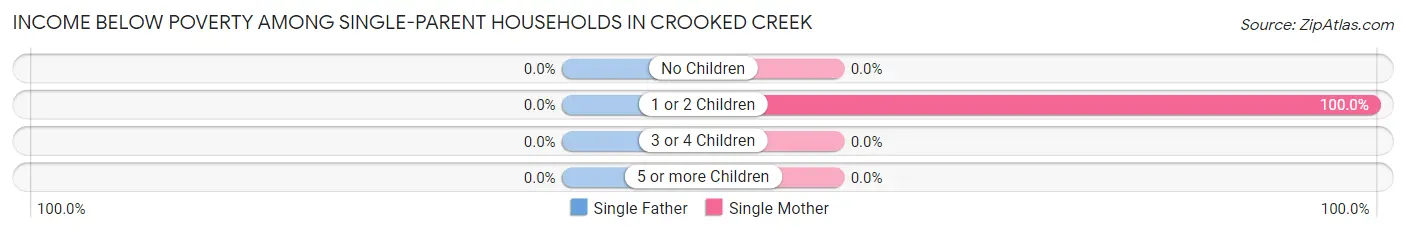
| Children | Single Father | Single Mother |
| No Children | 0 (0.0%) | 0 (0.0%) |
| 1 or 2 Children | 0 (0.0%) | 6 (100.0%) |
| 3 or 4 Children | 0 (0.0%) | 0 (0.0%) |
| 5 or more Children | 0 (0.0%) | 0 (0.0%) |
| Total | 0 (0.0%) | 6 (100.0%) |
Income Below Poverty Among Married-Couple vs Single-Parent Households in Crooked Creek
The poverty data for Crooked Creek shows that 7 of the married-couple family households (4.7%) and 6 of the single-parent households (23.1%) are living below the poverty level. Within the married-couple family households, those with 1 or 2 children have the highest poverty rate, with 7 households (10.4%) falling below the poverty line. Among the single-parent households, those with 1 or 2 children have the highest poverty rate, with 6 household (23.1%) living below poverty.
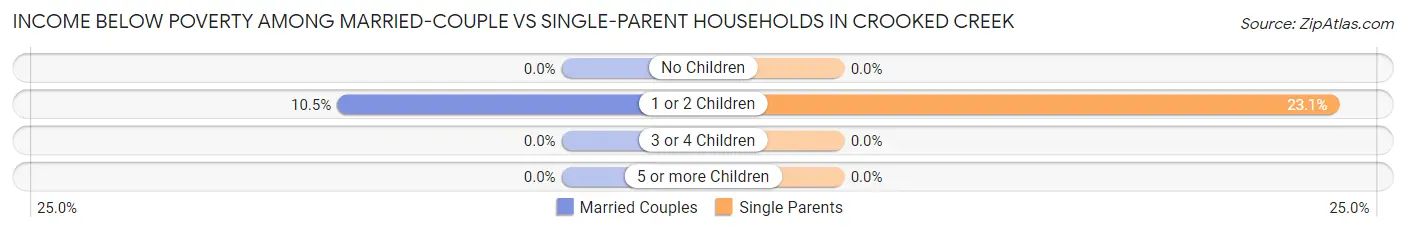
| Children | Married-Couple Families | Single-Parent Households |
| No Children | 0 (0.0%) | 0 (0.0%) |
| 1 or 2 Children | 7 (10.4%) | 6 (23.1%) |
| 3 or 4 Children | 0 (0.0%) | 0 (0.0%) |
| 5 or more Children | 0 (0.0%) | 0 (0.0%) |
| Total | 7 (4.7%) | 6 (23.1%) |
Race in Crooked Creek
The most populous races in Crooked Creek are White / Caucasian (506 | 75.1%), Two or more Races (83 | 12.3%), and Black / African American (79 | 11.7%).
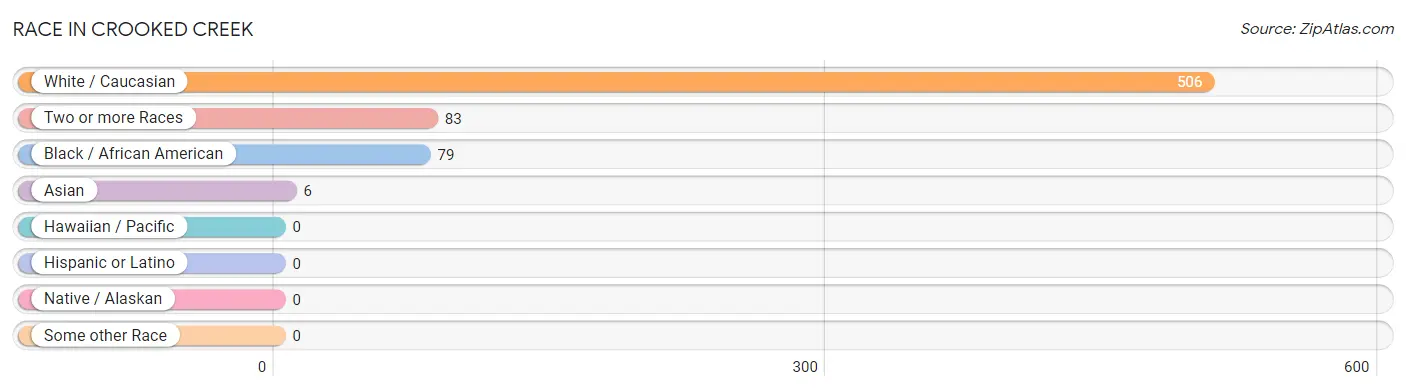
| Race | # Population | % Population |
| Asian | 6 | 0.9% |
| Black / African American | 79 | 11.7% |
| Hawaiian / Pacific | 0 | 0.0% |
| Hispanic or Latino | 0 | 0.0% |
| Native / Alaskan | 0 | 0.0% |
| White / Caucasian | 506 | 75.1% |
| Two or more Races | 83 | 12.3% |
| Some other Race | 0 | 0.0% |
| Total | 674 | 100.0% |
Ancestry in Crooked Creek
The most populous ancestries reported in Crooked Creek are English (127 | 18.8%), American (116 | 17.2%), Irish (61 | 9.0%), Italian (43 | 6.4%), and Polish (40 | 5.9%), together accounting for 57.4% of all Crooked Creek residents.
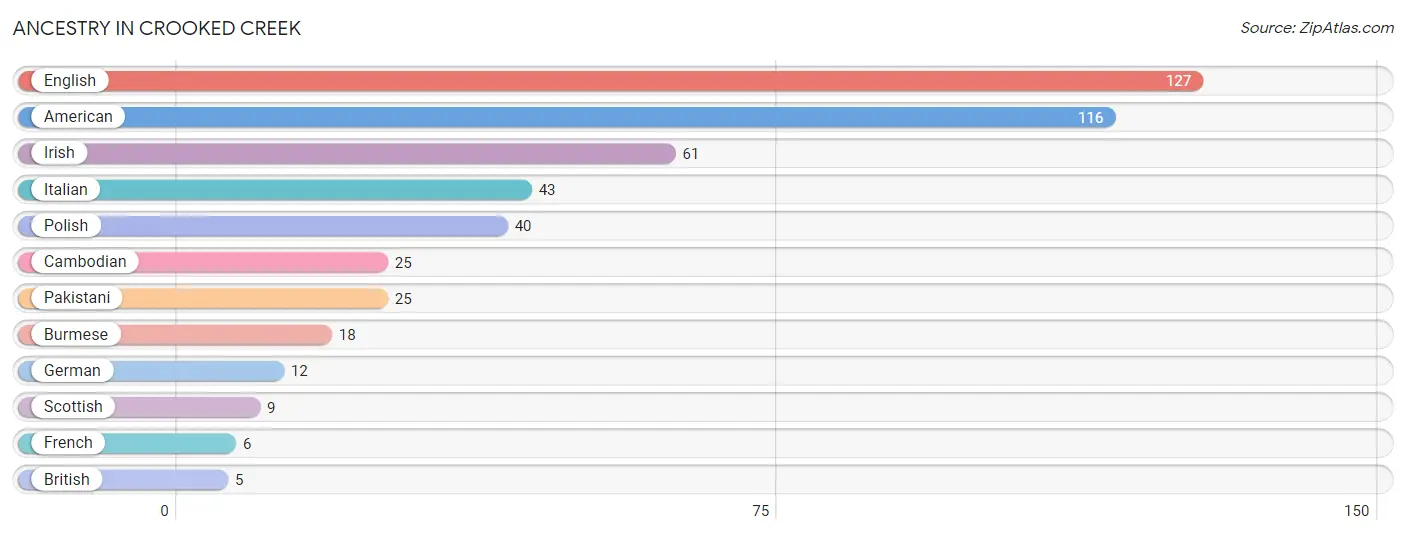
| Ancestry | # Population | % Population |
| American | 116 | 17.2% |
| British | 5 | 0.7% |
| Burmese | 18 | 2.7% |
| Cambodian | 25 | 3.7% |
| English | 127 | 18.8% |
| French | 6 | 0.9% |
| German | 12 | 1.8% |
| Irish | 61 | 9.0% |
| Italian | 43 | 6.4% |
| Pakistani | 25 | 3.7% |
| Polish | 40 | 5.9% |
| Scottish | 9 | 1.3% | View All 12 Rows |
Immigrants in Crooked Creek
The most numerous immigrant groups reported in Crooked Creek came from Asia (24 | 3.6%), Eastern Asia (18 | 2.7%), Korea (18 | 2.7%), Indonesia (6 | 0.9%), and South Eastern Asia (6 | 0.9%), together accounting for 10.7% of all Crooked Creek residents.
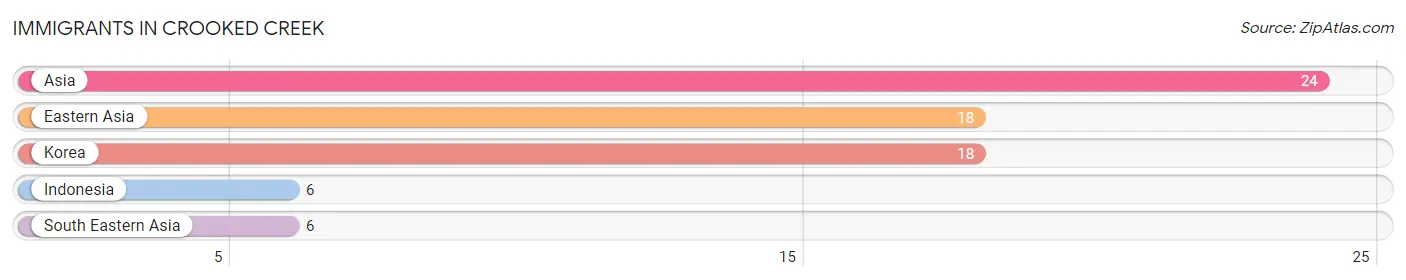
| Immigration Origin | # Population | % Population |
| Asia | 24 | 3.6% |
| Eastern Asia | 18 | 2.7% |
| Indonesia | 6 | 0.9% |
| Korea | 18 | 2.7% |
| South Eastern Asia | 6 | 0.9% | View All 5 Rows |
Sex and Age in Crooked Creek
Sex and Age in Crooked Creek
The most populous age groups in Crooked Creek are 10 to 14 Years (61 | 20.6%) for men and 65 to 69 Years (165 | 43.6%) for women.
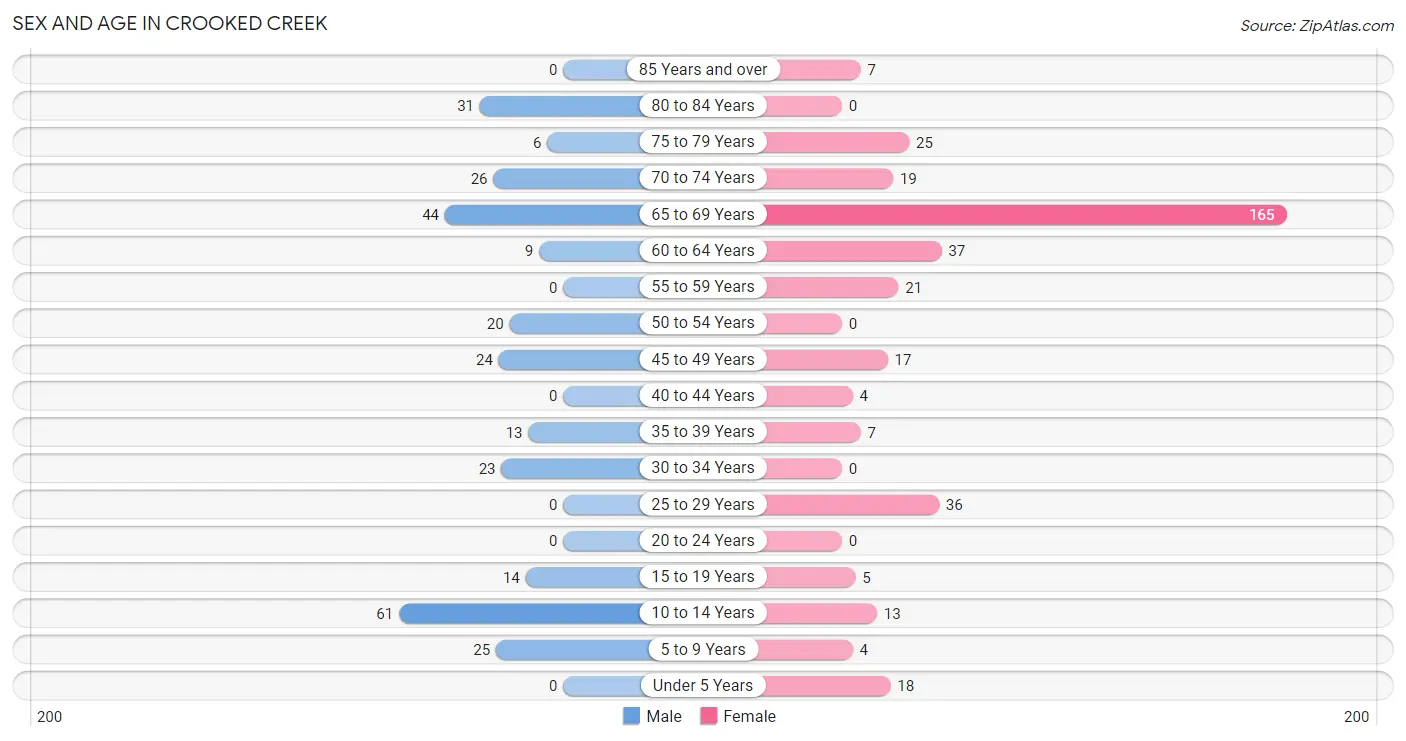
| Age Bracket | Male | Female |
| Under 5 Years | 0 (0.0%) | 18 (4.8%) |
| 5 to 9 Years | 25 (8.5%) | 4 (1.1%) |
| 10 to 14 Years | 61 (20.6%) | 13 (3.4%) |
| 15 to 19 Years | 14 (4.7%) | 5 (1.3%) |
| 20 to 24 Years | 0 (0.0%) | 0 (0.0%) |
| 25 to 29 Years | 0 (0.0%) | 36 (9.5%) |
| 30 to 34 Years | 23 (7.8%) | 0 (0.0%) |
| 35 to 39 Years | 13 (4.4%) | 7 (1.8%) |
| 40 to 44 Years | 0 (0.0%) | 4 (1.1%) |
| 45 to 49 Years | 24 (8.1%) | 17 (4.5%) |
| 50 to 54 Years | 20 (6.8%) | 0 (0.0%) |
| 55 to 59 Years | 0 (0.0%) | 21 (5.6%) |
| 60 to 64 Years | 9 (3.0%) | 37 (9.8%) |
| 65 to 69 Years | 44 (14.9%) | 165 (43.6%) |
| 70 to 74 Years | 26 (8.8%) | 19 (5.0%) |
| 75 to 79 Years | 6 (2.0%) | 25 (6.6%) |
| 80 to 84 Years | 31 (10.5%) | 0 (0.0%) |
| 85 Years and over | 0 (0.0%) | 7 (1.8%) |
| Total | 296 (100.0%) | 378 (100.0%) |
Families and Households in Crooked Creek
Median Family Size in Crooked Creek
The median family size in Crooked Creek is 2.71 persons per family, with single female/mother families (6 | 3.4%) accounting for the largest median family size of 4.17 persons per family. On the other hand, single male/father families (20 | 11.4%) represent the smallest median family size with 1.65 persons per family.
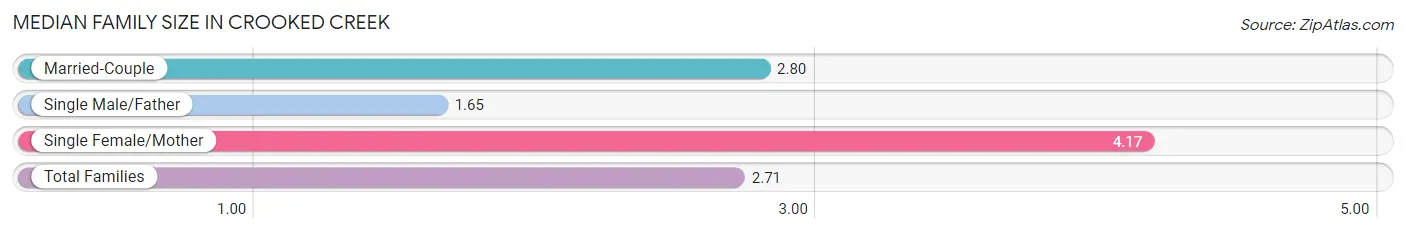
| Family Type | # Families | Family Size |
| Married-Couple | 149 (85.1%) | 2.80 |
| Single Male/Father | 20 (11.4%) | 1.65 |
| Single Female/Mother | 6 (3.4%) | 4.17 |
| Total Families | 175 (100.0%) | 2.71 |
Median Household Size in Crooked Creek
The median household size in Crooked Creek is 1.83 persons per household, with single female/mother households (6 | 1.6%) accounting for the largest median household size of 4.17 persons per household. non-family households (194 | 52.6%) represent the smallest median household size with 1.03 persons per household.
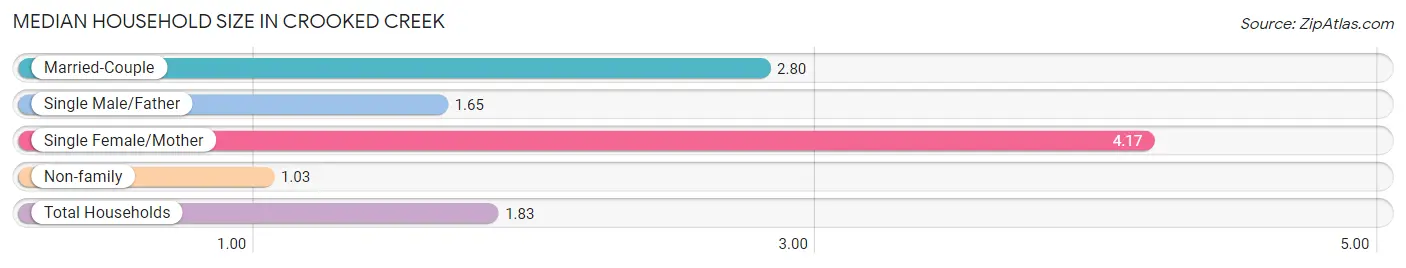
| Household Type | # Households | Household Size |
| Married-Couple | 149 (40.4%) | 2.80 |
| Single Male/Father | 20 (5.4%) | 1.65 |
| Single Female/Mother | 6 (1.6%) | 4.17 |
| Non-family | 194 (52.6%) | 1.03 |
| Total Households | 369 (100.0%) | 1.83 |
Household Size by Marriage Status in Crooked Creek
Out of a total of 369 households in Crooked Creek, 175 (47.4%) are family households, while 194 (52.6%) are nonfamily households. The most numerous type of family households are 2-person households, comprising 81, and the most common type of nonfamily households are 1-person households, comprising 190.
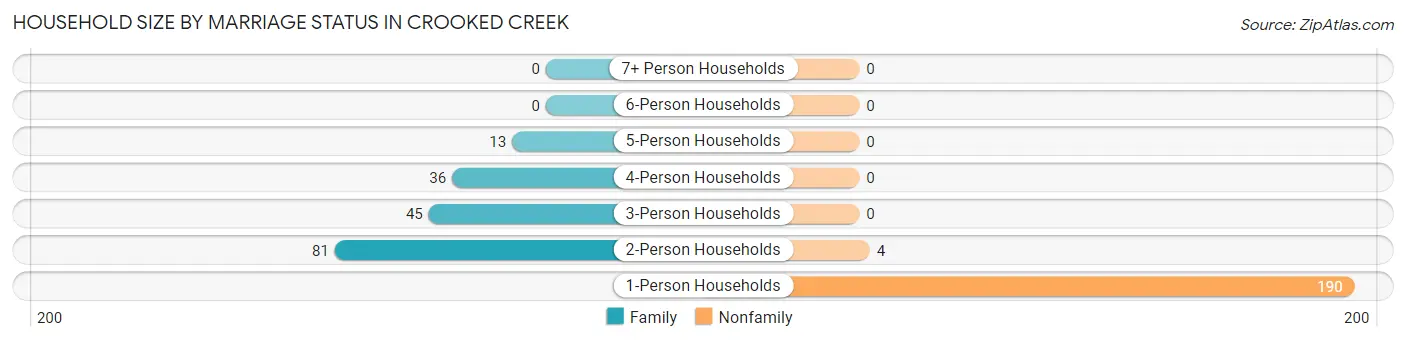
| Household Size | Family Households | Nonfamily Households |
| 1-Person Households | - | 190 (51.5%) |
| 2-Person Households | 81 (22.0%) | 4 (1.1%) |
| 3-Person Households | 45 (12.2%) | 0 (0.0%) |
| 4-Person Households | 36 (9.8%) | 0 (0.0%) |
| 5-Person Households | 13 (3.5%) | 0 (0.0%) |
| 6-Person Households | 0 (0.0%) | 0 (0.0%) |
| 7+ Person Households | 0 (0.0%) | 0 (0.0%) |
| Total | 175 (47.4%) | 194 (52.6%) |
Female Fertility in Crooked Creek
Fertility by Age in Crooked Creek
| Age Bracket | Women with Births | Births / 1,000 Women |
| 15 to 19 years | 0 (0.0%) | 0.0 |
| 20 to 34 years | 0 (0.0%) | 0.0 |
| 35 to 50 years | 0 (0.0%) | 0.0 |
| Total | 0 (0.0%) | 0.0 |
Fertility by Age by Marriage Status in Crooked Creek
| Age Bracket | Married | Unmarried |
| 15 to 19 years | 0 (0.0%) | 0 (0.0%) |
| 20 to 34 years | 0 (0.0%) | 0 (0.0%) |
| 35 to 50 years | 0 (0.0%) | 0 (0.0%) |
| Total | 0 (0.0%) | 0 (0.0%) |
Fertility by Education in Crooked Creek
| Educational Attainment | Women with Births | Births / 1,000 Women |
| Less than High School | 0 (0.0%) | 0.0 |
| High School Diploma | 0 (0.0%) | 0.0 |
| College or Associate's Degree | 0 (0.0%) | 0.0 |
| Bachelor's Degree | 0 (0.0%) | 0.0 |
| Graduate Degree | 0 (0.0%) | 0.0 |
| Total | 0 (0.0%) | 0.0 |
Fertility by Education by Marriage Status in Crooked Creek
| Educational Attainment | Married | Unmarried |
| Less than High School | 0 (0.0%) | 0 (0.0%) |
| High School Diploma | 0 (0.0%) | 0 (0.0%) |
| College or Associate's Degree | 0 (0.0%) | 0 (0.0%) |
| Bachelor's Degree | 0 (0.0%) | 0 (0.0%) |
| Graduate Degree | 0 (0.0%) | 0 (0.0%) |
| Total | 0 (0.0%) | 0 (0.0%) |
Employment Characteristics in Crooked Creek
Employment by Class of Employer in Crooked Creek
Among the 200 employed individuals in Crooked Creek, private company employees (179 | 89.5%), state government employees (9 | 4.5%), and self-employed (not incorporated) (8 | 4.0%) make up the most common classes of employment.
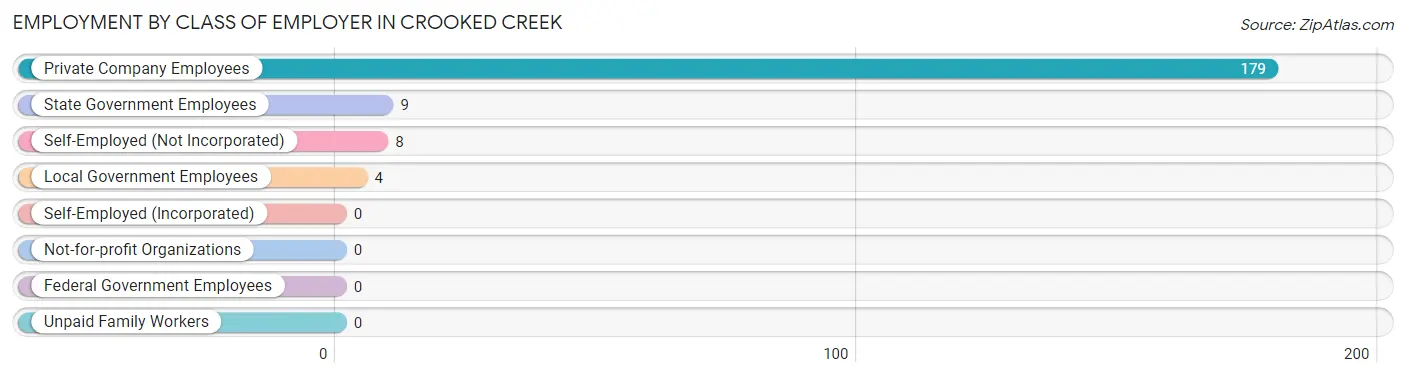
| Employer Class | # Employees | % Employees |
| Private Company Employees | 179 | 89.5% |
| Self-Employed (Incorporated) | 0 | 0.0% |
| Self-Employed (Not Incorporated) | 8 | 4.0% |
| Not-for-profit Organizations | 0 | 0.0% |
| Local Government Employees | 4 | 2.0% |
| State Government Employees | 9 | 4.5% |
| Federal Government Employees | 0 | 0.0% |
| Unpaid Family Workers | 0 | 0.0% |
| Total | 200 | 100.0% |
Employment Status by Age in Crooked Creek
According to the labor force statistics for Crooked Creek, out of the total population over 16 years of age (553), 36.9% or 204 individuals are in the labor force, with 2.0% or 4 of them unemployed. The age group with the highest labor force participation rate is 25 to 29 years, with 100.0% or 36 individuals in the labor force. Within the labor force, the 35 to 44 years age range has the highest percentage of unemployed individuals, with 16.7% or 4 of them being unemployed.
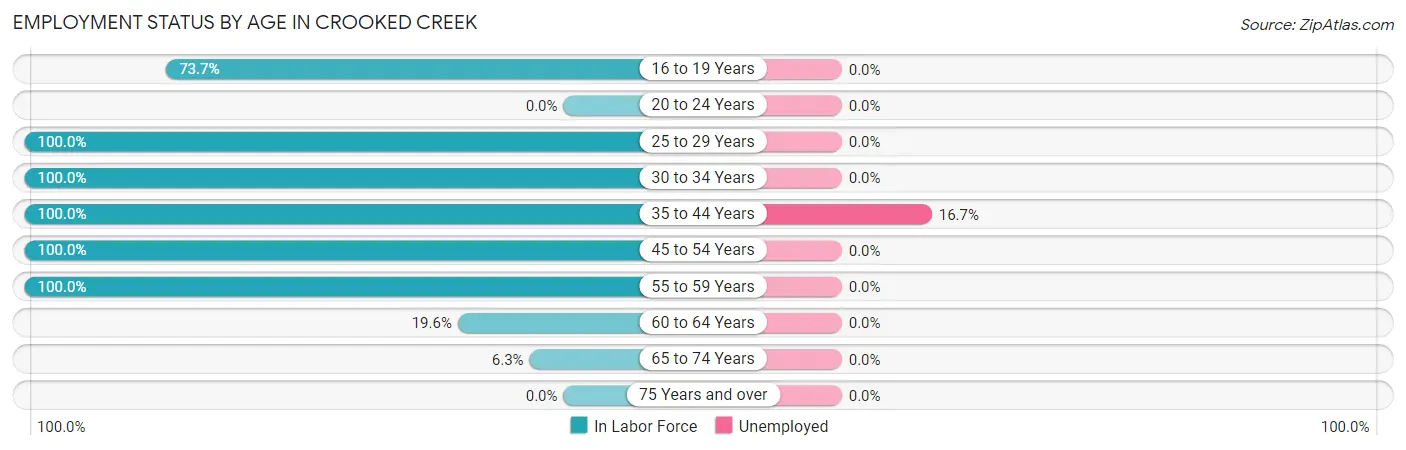
| Age Bracket | In Labor Force | Unemployed |
| 16 to 19 Years | 14 (73.7%) | 0 (0.0%) |
| 20 to 24 Years | 0 (0.0%) | 0 (0.0%) |
| 25 to 29 Years | 36 (100.0%) | 0 (0.0%) |
| 30 to 34 Years | 23 (100.0%) | 0 (0.0%) |
| 35 to 44 Years | 24 (100.0%) | 4 (16.7%) |
| 45 to 54 Years | 61 (100.0%) | 0 (0.0%) |
| 55 to 59 Years | 21 (100.0%) | 0 (0.0%) |
| 60 to 64 Years | 9 (19.6%) | 0 (0.0%) |
| 65 to 74 Years | 16 (6.3%) | 0 (0.0%) |
| 75 Years and over | 0 (0.0%) | 0 (0.0%) |
| Total | 204 (36.9%) | 4 (2.0%) |
Employment Status by Educational Attainment in Crooked Creek
According to labor force statistics for Crooked Creek, 82.5% of individuals (174) out of the total population between 25 and 64 years of age (211) are in the labor force, with 2.3% or 4 of them being unemployed. The group with the highest labor force participation rate are those with the educational attainment of bachelor's degree or higher, with 100.0% or 13 individuals in the labor force. Within the labor force, individuals with high school diploma education have the highest percentage of unemployment, with 4.8% or 4 of them being unemployed.
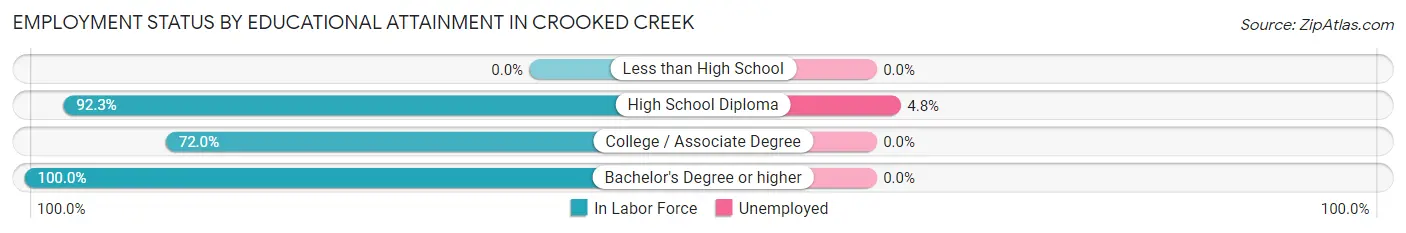
| Educational Attainment | In Labor Force | Unemployed |
| Less than High School | 0 (0.0%) | 0 (0.0%) |
| High School Diploma | 84 (92.3%) | 4 (4.8%) |
| College / Associate Degree | 77 (72.0%) | 0 (0.0%) |
| Bachelor's Degree or higher | 13 (100.0%) | 0 (0.0%) |
| Total | 174 (82.5%) | 5 (2.3%) |
Employment Occupations by Sex in Crooked Creek
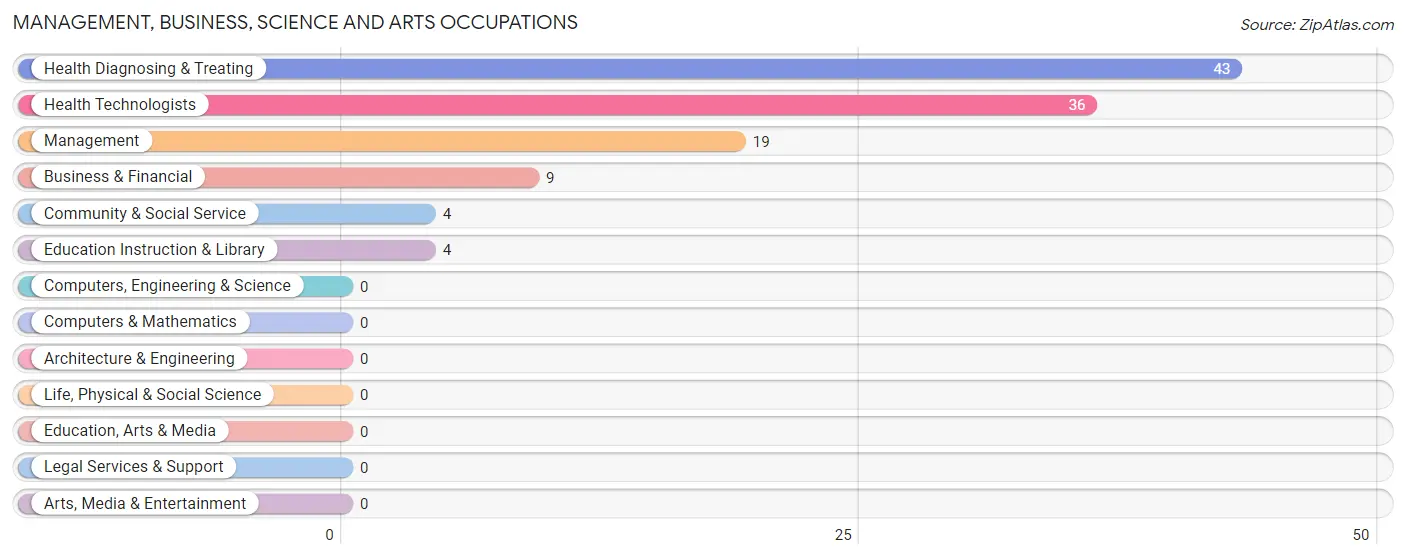
Management, Business, Science and Arts Occupations
The most common Management, Business, Science and Arts occupations in Crooked Creek are Health Diagnosing & Treating (43 | 21.5%), Health Technologists (36 | 18.0%), Management (19 | 9.5%), Business & Financial (9 | 4.5%), and Community & Social Service (4 | 2.0%).
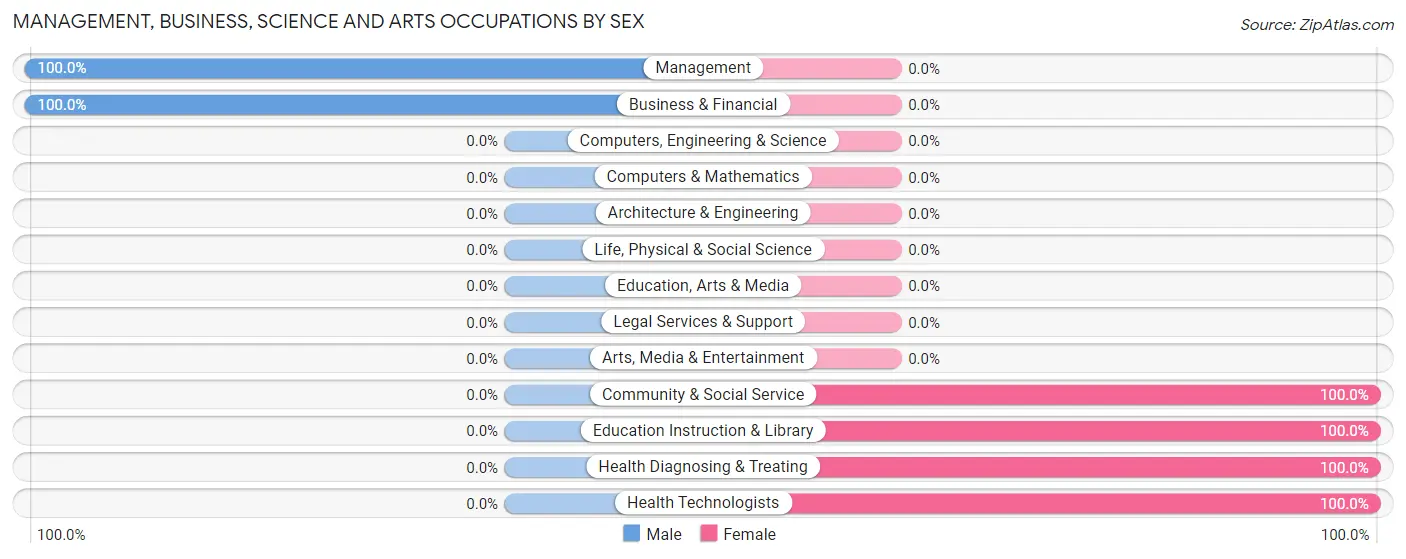
Management, Business, Science and Arts Occupations by Sex
Within the Management, Business, Science and Arts occupations in Crooked Creek, the most male-oriented occupations are Management (100.0%), and Business & Financial (100.0%), while the most female-oriented occupations are Community & Social Service (100.0%), Education Instruction & Library (100.0%), and Health Diagnosing & Treating (100.0%).
| Occupation | Male | Female |
| Management | 19 (100.0%) | 0 (0.0%) |
| Business & Financial | 9 (100.0%) | 0 (0.0%) |
| Computers, Engineering & Science | 0 (0.0%) | 0 (0.0%) |
| Computers & Mathematics | 0 (0.0%) | 0 (0.0%) |
| Architecture & Engineering | 0 (0.0%) | 0 (0.0%) |
| Life, Physical & Social Science | 0 (0.0%) | 0 (0.0%) |
| Community & Social Service | 0 (0.0%) | 4 (100.0%) |
| Education, Arts & Media | 0 (0.0%) | 0 (0.0%) |
| Legal Services & Support | 0 (0.0%) | 0 (0.0%) |
| Education Instruction & Library | 0 (0.0%) | 4 (100.0%) |
| Arts, Media & Entertainment | 0 (0.0%) | 0 (0.0%) |
| Health Diagnosing & Treating | 0 (0.0%) | 43 (100.0%) |
| Health Technologists | 0 (0.0%) | 36 (100.0%) |
| Total (Category) | 28 (37.3%) | 47 (62.7%) |
| Total (Overall) | 111 (55.5%) | 89 (44.5%) |
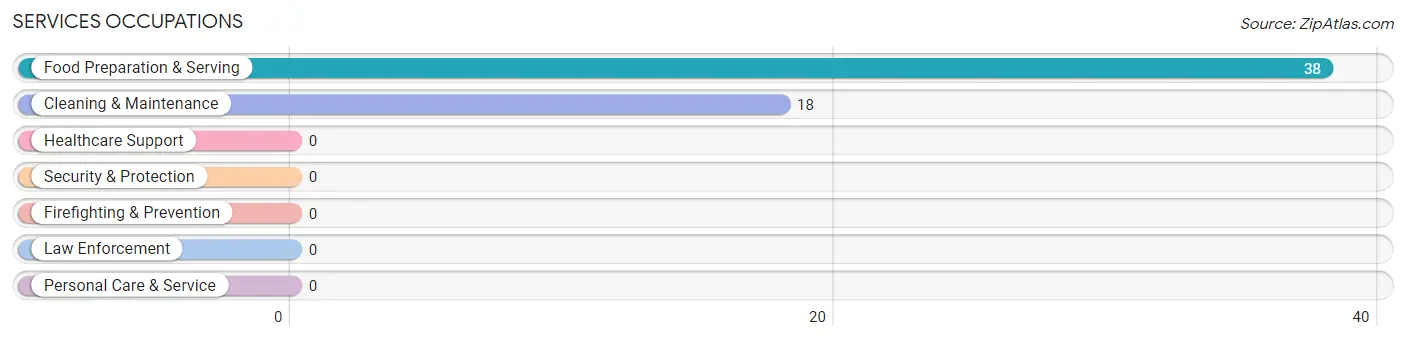
Services Occupations
The most common Services occupations in Crooked Creek are Food Preparation & Serving (38 | 19.0%), and Cleaning & Maintenance (18 | 9.0%).
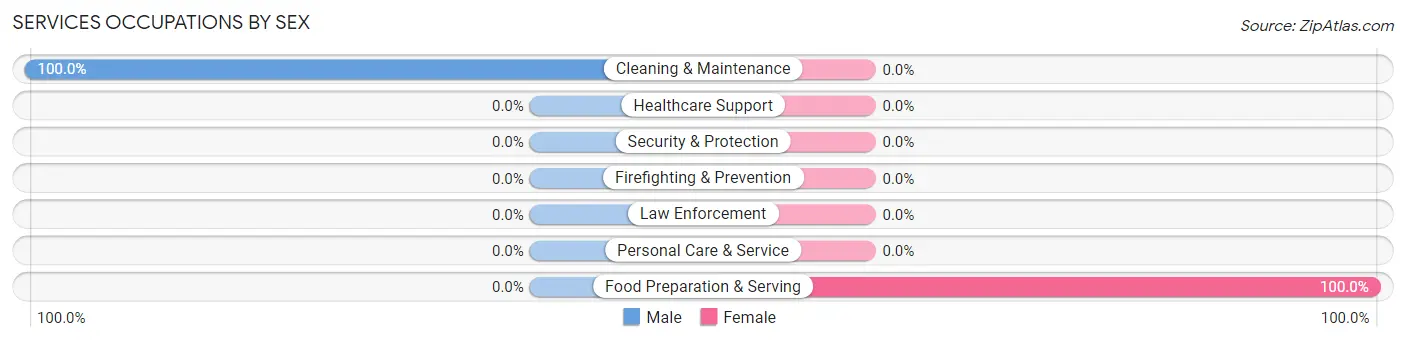
Services Occupations by Sex
| Occupation | Male | Female |
| Healthcare Support | 0 (0.0%) | 0 (0.0%) |
| Security & Protection | 0 (0.0%) | 0 (0.0%) |
| Firefighting & Prevention | 0 (0.0%) | 0 (0.0%) |
| Law Enforcement | 0 (0.0%) | 0 (0.0%) |
| Food Preparation & Serving | 0 (0.0%) | 38 (100.0%) |
| Cleaning & Maintenance | 18 (100.0%) | 0 (0.0%) |
| Personal Care & Service | 0 (0.0%) | 0 (0.0%) |
| Total (Category) | 18 (32.1%) | 38 (67.9%) |
| Total (Overall) | 111 (55.5%) | 89 (44.5%) |
Sales and Office Occupations
The most common Sales and Office occupations in Crooked Creek are Office & Administration (8 | 4.0%), and Sales & Related (5 | 2.5%).
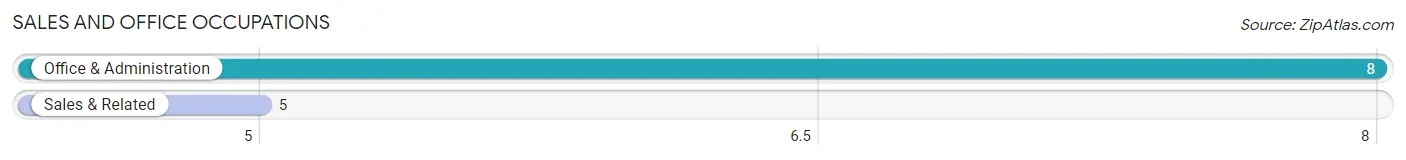
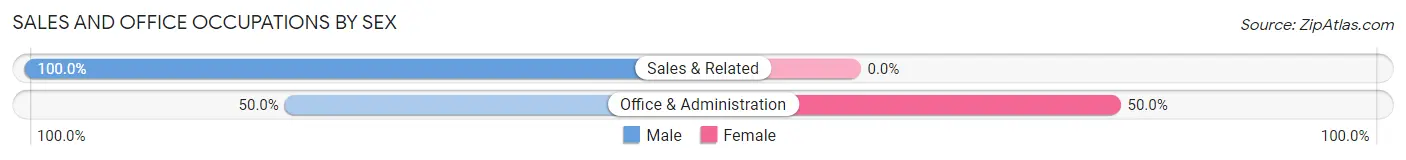
Sales and Office Occupations by Sex
| Occupation | Male | Female |
| Sales & Related | 5 (100.0%) | 0 (0.0%) |
| Office & Administration | 4 (50.0%) | 4 (50.0%) |
| Total (Category) | 9 (69.2%) | 4 (30.8%) |
| Total (Overall) | 111 (55.5%) | 89 (44.5%) |
Natural Resources, Construction and Maintenance Occupations
The most common Natural Resources, Construction and Maintenance occupations in Crooked Creek are , and Installation, Maintenance & Repair (20 | 10.0%).
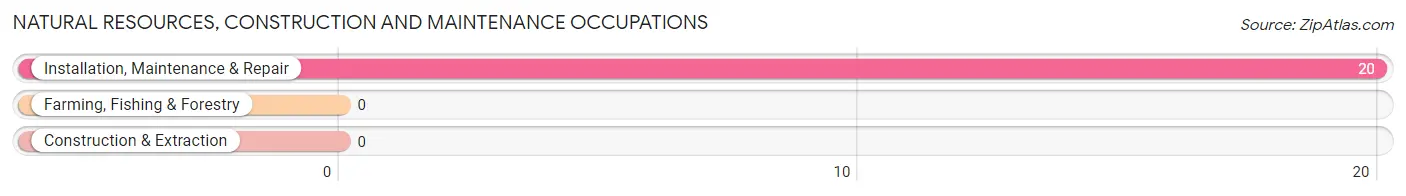
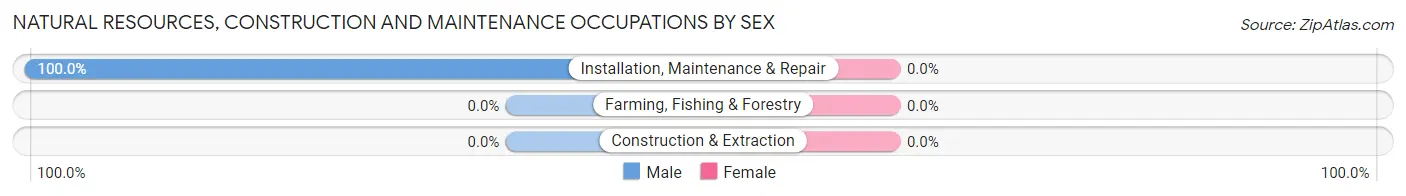
Natural Resources, Construction and Maintenance Occupations by Sex
| Occupation | Male | Female |
| Farming, Fishing & Forestry | 0 (0.0%) | 0 (0.0%) |
| Construction & Extraction | 0 (0.0%) | 0 (0.0%) |
| Installation, Maintenance & Repair | 20 (100.0%) | 0 (0.0%) |
| Total (Category) | 20 (100.0%) | 0 (0.0%) |
| Total (Overall) | 111 (55.5%) | 89 (44.5%) |
Production, Transportation and Moving Occupations
The most common Production, Transportation and Moving occupations in Crooked Creek are Material Moving (30 | 15.0%), and Transportation (6 | 3.0%).
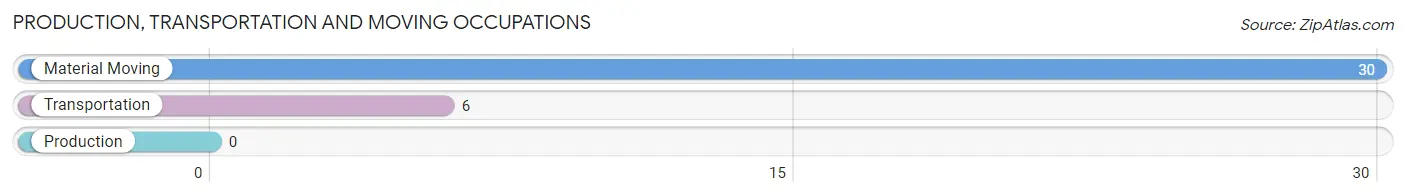
Production, Transportation and Moving Occupations by Sex
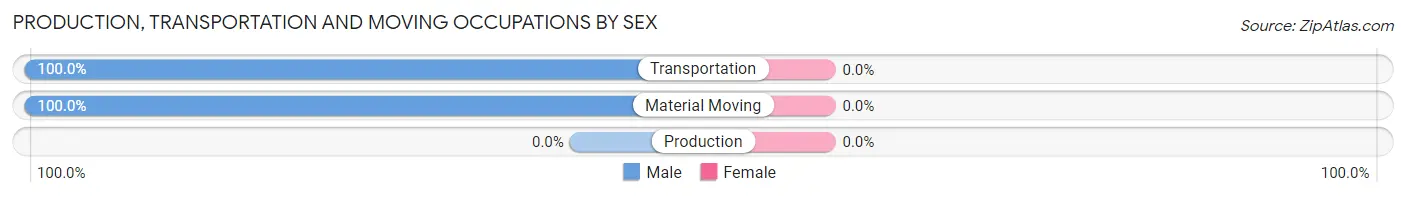
| Occupation | Male | Female |
| Production | 0 (0.0%) | 0 (0.0%) |
| Transportation | 6 (100.0%) | 0 (0.0%) |
| Material Moving | 30 (100.0%) | 0 (0.0%) |
| Total (Category) | 36 (100.0%) | 0 (0.0%) |
| Total (Overall) | 111 (55.5%) | 89 (44.5%) |
Employment Industries by Sex in Crooked Creek
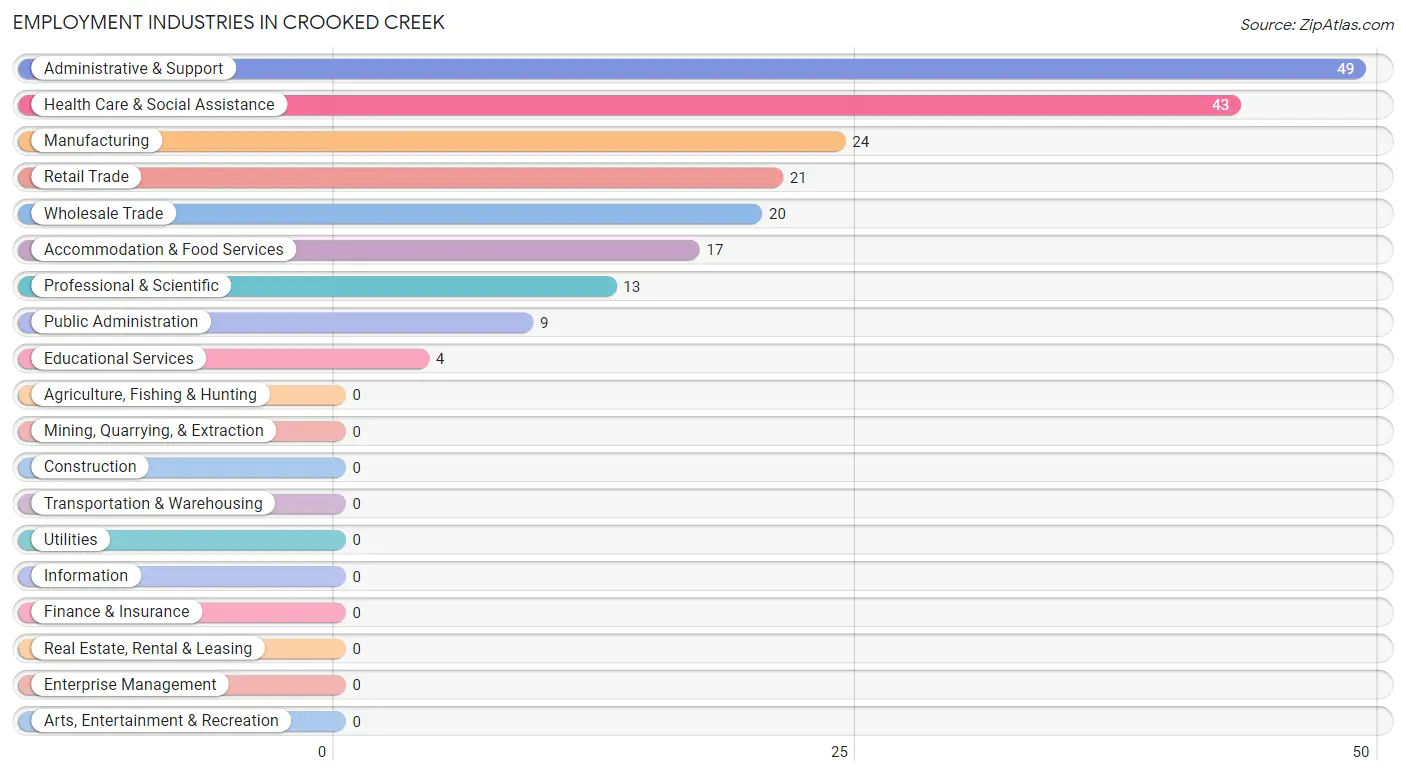
Employment Industries in Crooked Creek
The major employment industries in Crooked Creek include Administrative & Support (49 | 24.5%), Health Care & Social Assistance (43 | 21.5%), Manufacturing (24 | 12.0%), Retail Trade (21 | 10.5%), and Wholesale Trade (20 | 10.0%).
Employment Industries by Sex in Crooked Creek
The Crooked Creek industries that see more men than women are Manufacturing (100.0%), Wholesale Trade (100.0%), and Retail Trade (100.0%), whereas the industries that tend to have a higher number of women are Educational Services (100.0%), Health Care & Social Assistance (100.0%), and Accommodation & Food Services (100.0%).
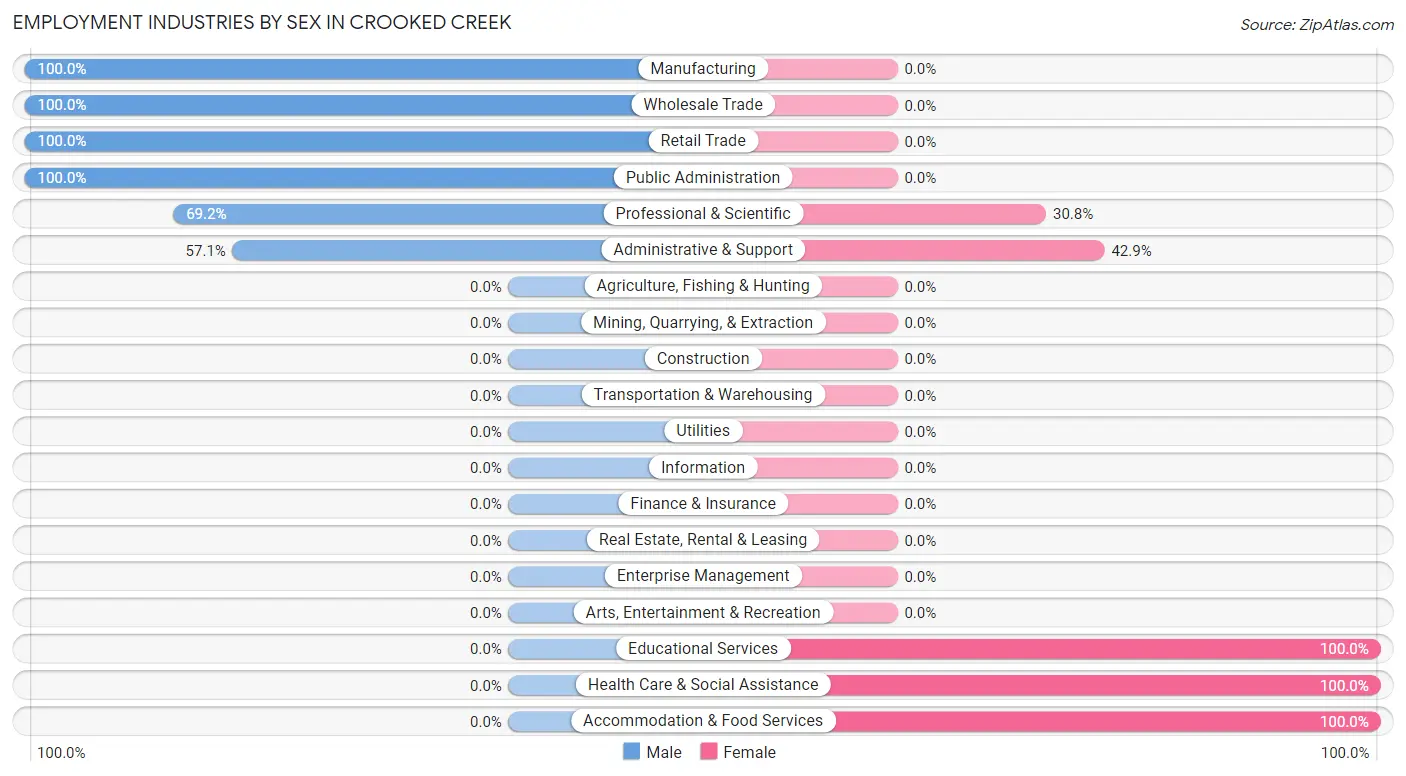
| Industry | Male | Female |
| Agriculture, Fishing & Hunting | 0 (0.0%) | 0 (0.0%) |
| Mining, Quarrying, & Extraction | 0 (0.0%) | 0 (0.0%) |
| Construction | 0 (0.0%) | 0 (0.0%) |
| Manufacturing | 24 (100.0%) | 0 (0.0%) |
| Wholesale Trade | 20 (100.0%) | 0 (0.0%) |
| Retail Trade | 21 (100.0%) | 0 (0.0%) |
| Transportation & Warehousing | 0 (0.0%) | 0 (0.0%) |
| Utilities | 0 (0.0%) | 0 (0.0%) |
| Information | 0 (0.0%) | 0 (0.0%) |
| Finance & Insurance | 0 (0.0%) | 0 (0.0%) |
| Real Estate, Rental & Leasing | 0 (0.0%) | 0 (0.0%) |
| Professional & Scientific | 9 (69.2%) | 4 (30.8%) |
| Enterprise Management | 0 (0.0%) | 0 (0.0%) |
| Administrative & Support | 28 (57.1%) | 21 (42.9%) |
| Educational Services | 0 (0.0%) | 4 (100.0%) |
| Health Care & Social Assistance | 0 (0.0%) | 43 (100.0%) |
| Arts, Entertainment & Recreation | 0 (0.0%) | 0 (0.0%) |
| Accommodation & Food Services | 0 (0.0%) | 17 (100.0%) |
| Public Administration | 9 (100.0%) | 0 (0.0%) |
| Total | 111 (55.5%) | 89 (44.5%) |
Education in Crooked Creek
School Enrollment in Crooked Creek
The most common levels of schooling among the 119 students in Crooked Creek are middle school (56 | 47.1%), college / undergraduate (36 | 30.2%), and elementary school (18 | 15.1%).
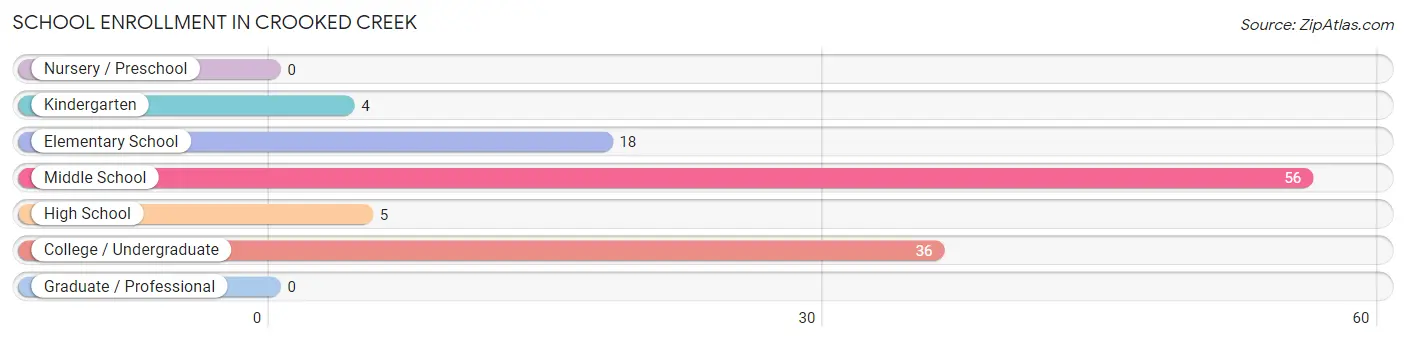
| School Level | # Students | % Students |
| Nursery / Preschool | 0 | 0.0% |
| Kindergarten | 4 | 3.4% |
| Elementary School | 18 | 15.1% |
| Middle School | 56 | 47.1% |
| High School | 5 | 4.2% |
| College / Undergraduate | 36 | 30.2% |
| Graduate / Professional | 0 | 0.0% |
| Total | 119 | 100.0% |
School Enrollment by Age by Funding Source in Crooked Creek
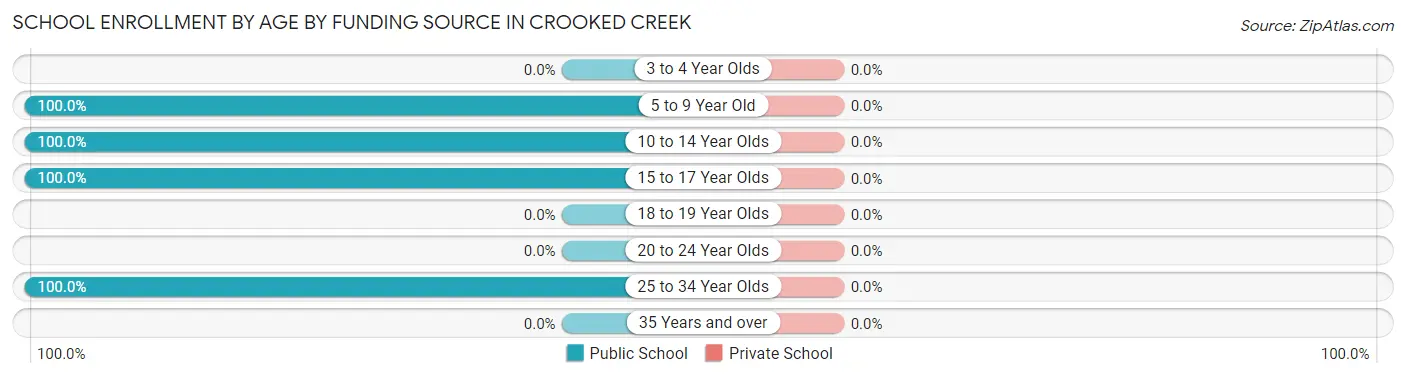
| Age Bracket | Public School | Private School |
| 3 to 4 Year Olds | 0 (0.0%) | 0 (0.0%) |
| 5 to 9 Year Old | 4 (100.0%) | 0 (0.0%) |
| 10 to 14 Year Olds | 74 (100.0%) | 0 (0.0%) |
| 15 to 17 Year Olds | 5 (100.0%) | 0 (0.0%) |
| 18 to 19 Year Olds | 0 (0.0%) | 0 (0.0%) |
| 20 to 24 Year Olds | 0 (0.0%) | 0 (0.0%) |
| 25 to 34 Year Olds | 36 (100.0%) | 0 (0.0%) |
| 35 Years and over | 0 (0.0%) | 0 (0.0%) |
| Total | 119 (100.0%) | 0 (0.0%) |
Educational Attainment by Field of Study in Crooked Creek
Literature & languages (18 | 41.9%), business (11 | 25.6%), engineering (9 | 20.9%), and science & technology (5 | 11.6%) are the most common fields of study among 43 individuals in Crooked Creek who have obtained a bachelor's degree or higher.
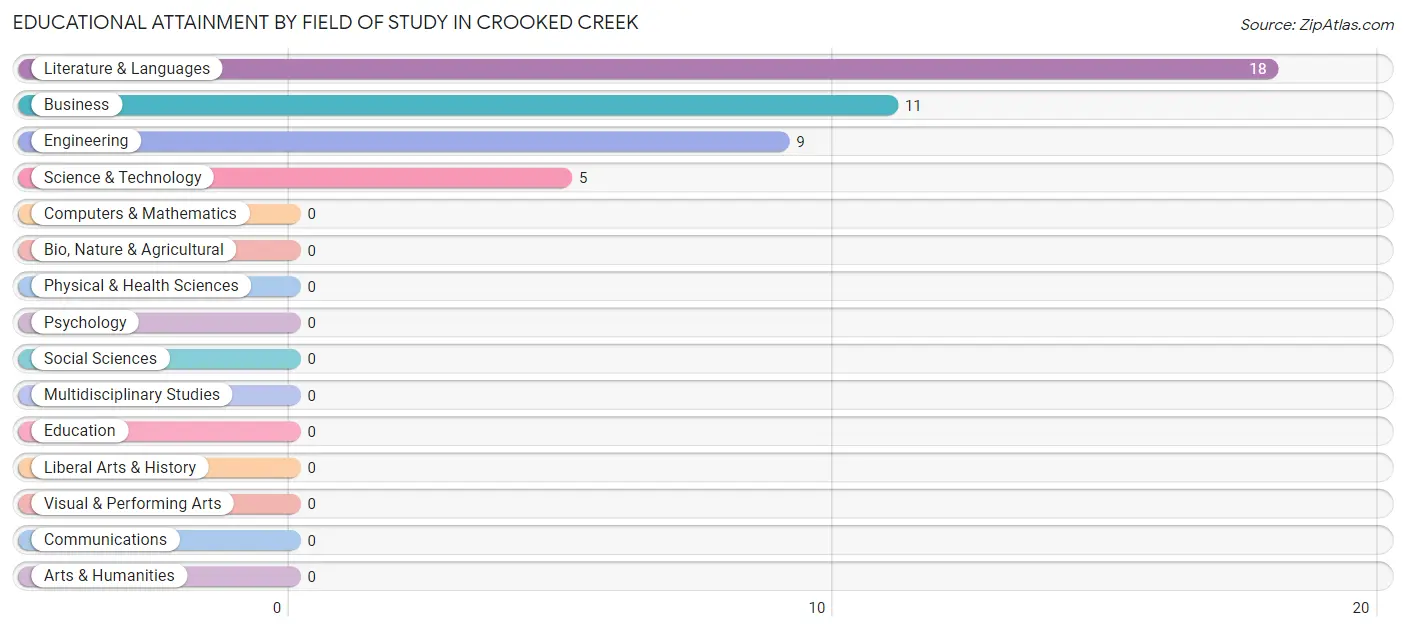
| Field of Study | # Graduates | % Graduates |
| Computers & Mathematics | 0 | 0.0% |
| Bio, Nature & Agricultural | 0 | 0.0% |
| Physical & Health Sciences | 0 | 0.0% |
| Psychology | 0 | 0.0% |
| Social Sciences | 0 | 0.0% |
| Engineering | 9 | 20.9% |
| Multidisciplinary Studies | 0 | 0.0% |
| Science & Technology | 5 | 11.6% |
| Business | 11 | 25.6% |
| Education | 0 | 0.0% |
| Literature & Languages | 18 | 41.9% |
| Liberal Arts & History | 0 | 0.0% |
| Visual & Performing Arts | 0 | 0.0% |
| Communications | 0 | 0.0% |
| Arts & Humanities | 0 | 0.0% |
| Total | 43 | 100.0% |
Transportation & Commute in Crooked Creek
Vehicle Availability by Sex in Crooked Creek
The most prevalent vehicle ownership categories in Crooked Creek are males with 2 vehicles (77, accounting for 69.4%) and females with 2 vehicles (28, making up 86.5%).
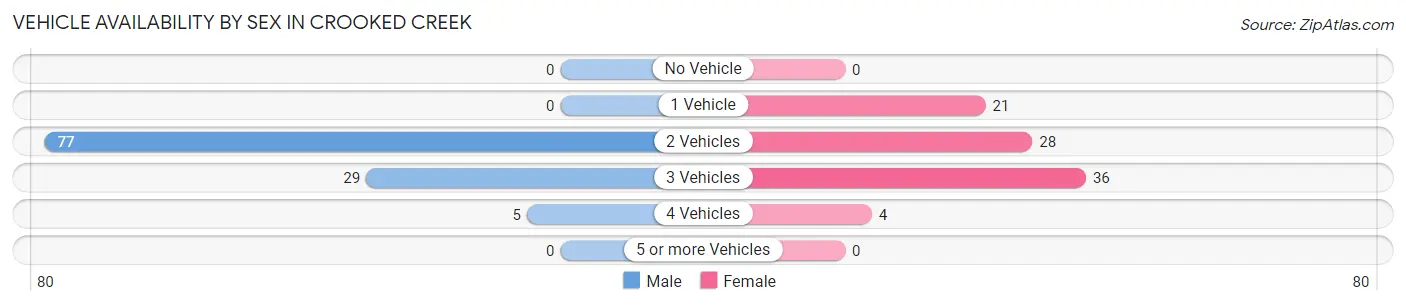
| Vehicles Available | Male | Female |
| No Vehicle | 0 (0.0%) | 0 (0.0%) |
| 1 Vehicle | 0 (0.0%) | 21 (23.6%) |
| 2 Vehicles | 77 (69.4%) | 28 (31.5%) |
| 3 Vehicles | 29 (26.1%) | 36 (40.5%) |
| 4 Vehicles | 5 (4.5%) | 4 (4.5%) |
| 5 or more Vehicles | 0 (0.0%) | 0 (0.0%) |
| Total | 111 (100.0%) | 89 (100.0%) |
Commute Time in Crooked Creek
The most frequently occuring commute durations in Crooked Creek are 45 to 59 minutes (61 commuters, 31.1%), 10 to 14 minutes (42 commuters, 21.4%), and 20 to 24 minutes (24 commuters, 12.2%).
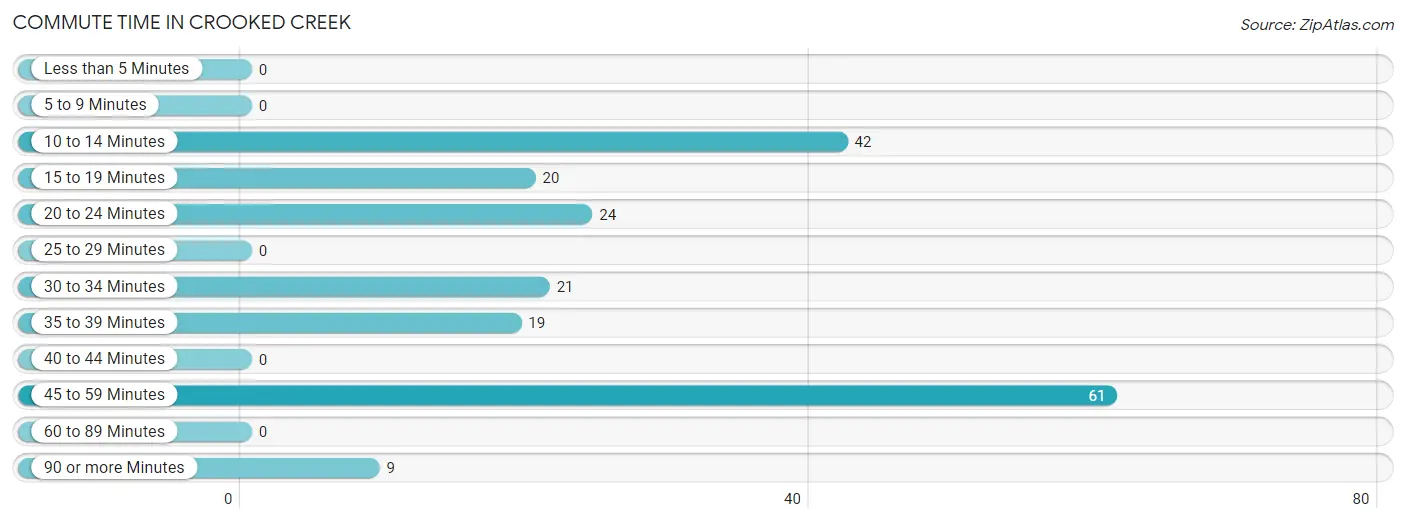
| Commute Time | # Commuters | % Commuters |
| Less than 5 Minutes | 0 | 0.0% |
| 5 to 9 Minutes | 0 | 0.0% |
| 10 to 14 Minutes | 42 | 21.4% |
| 15 to 19 Minutes | 20 | 10.2% |
| 20 to 24 Minutes | 24 | 12.2% |
| 25 to 29 Minutes | 0 | 0.0% |
| 30 to 34 Minutes | 21 | 10.7% |
| 35 to 39 Minutes | 19 | 9.7% |
| 40 to 44 Minutes | 0 | 0.0% |
| 45 to 59 Minutes | 61 | 31.1% |
| 60 to 89 Minutes | 0 | 0.0% |
| 90 or more Minutes | 9 | 4.6% |
Commute Time by Sex in Crooked Creek
The most common commute times in Crooked Creek are 45 to 59 minutes (37 commuters, 33.3%) for males and 10 to 14 minutes (36 commuters, 42.3%) for females.
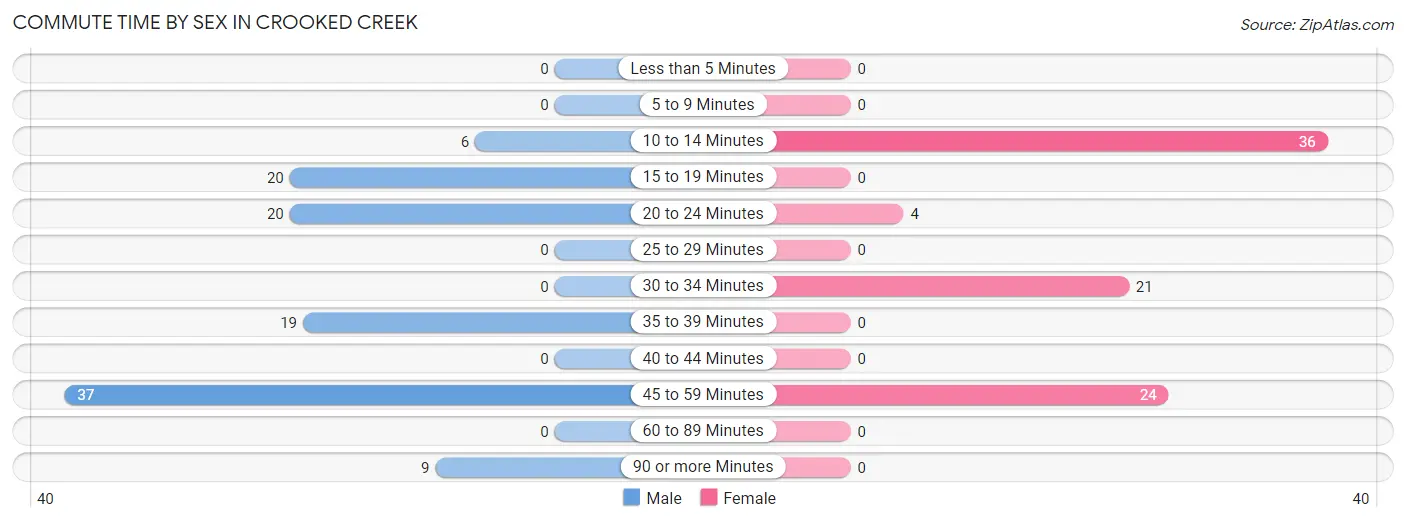
| Commute Time | Male | Female |
| Less than 5 Minutes | 0 (0.0%) | 0 (0.0%) |
| 5 to 9 Minutes | 0 (0.0%) | 0 (0.0%) |
| 10 to 14 Minutes | 6 (5.4%) | 36 (42.3%) |
| 15 to 19 Minutes | 20 (18.0%) | 0 (0.0%) |
| 20 to 24 Minutes | 20 (18.0%) | 4 (4.7%) |
| 25 to 29 Minutes | 0 (0.0%) | 0 (0.0%) |
| 30 to 34 Minutes | 0 (0.0%) | 21 (24.7%) |
| 35 to 39 Minutes | 19 (17.1%) | 0 (0.0%) |
| 40 to 44 Minutes | 0 (0.0%) | 0 (0.0%) |
| 45 to 59 Minutes | 37 (33.3%) | 24 (28.2%) |
| 60 to 89 Minutes | 0 (0.0%) | 0 (0.0%) |
| 90 or more Minutes | 9 (8.1%) | 0 (0.0%) |
Time of Departure to Work by Sex in Crooked Creek
The most frequent times of departure to work in Crooked Creek are 12:00 AM to 4:59 AM (35, 31.5%) for males and 12:00 PM to 3:59 PM (45, 52.9%) for females.
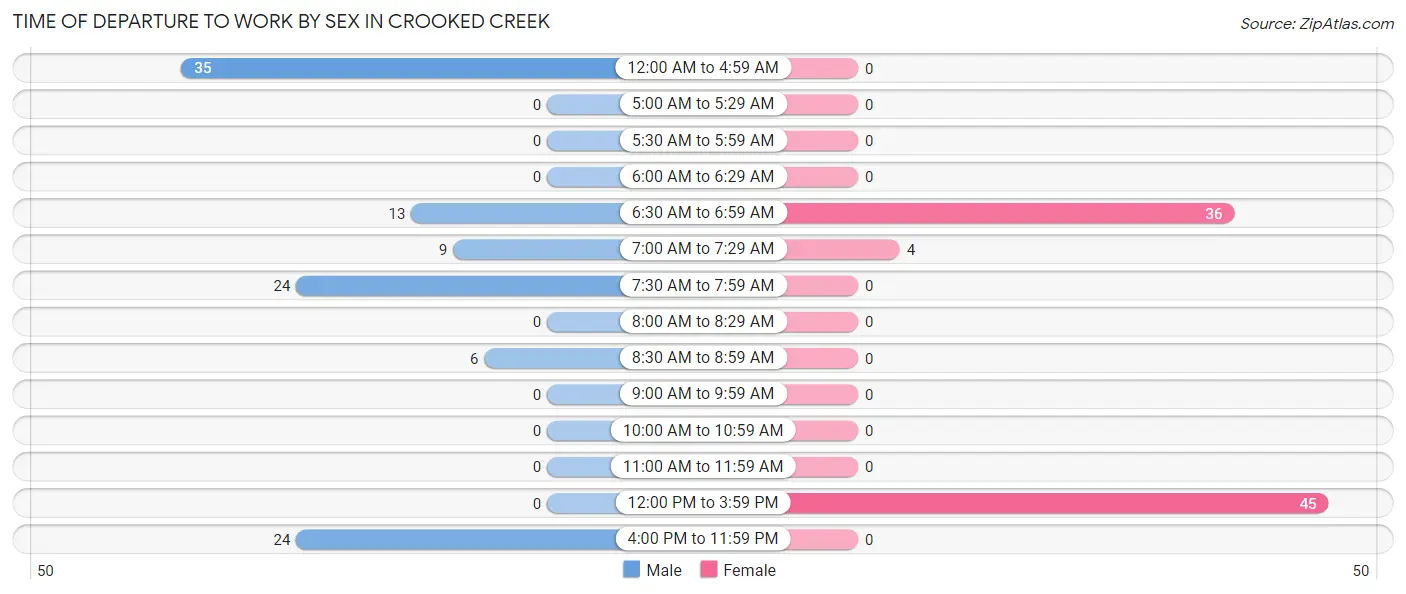
| Time of Departure | Male | Female |
| 12:00 AM to 4:59 AM | 35 (31.5%) | 0 (0.0%) |
| 5:00 AM to 5:29 AM | 0 (0.0%) | 0 (0.0%) |
| 5:30 AM to 5:59 AM | 0 (0.0%) | 0 (0.0%) |
| 6:00 AM to 6:29 AM | 0 (0.0%) | 0 (0.0%) |
| 6:30 AM to 6:59 AM | 13 (11.7%) | 36 (42.3%) |
| 7:00 AM to 7:29 AM | 9 (8.1%) | 4 (4.7%) |
| 7:30 AM to 7:59 AM | 24 (21.6%) | 0 (0.0%) |
| 8:00 AM to 8:29 AM | 0 (0.0%) | 0 (0.0%) |
| 8:30 AM to 8:59 AM | 6 (5.4%) | 0 (0.0%) |
| 9:00 AM to 9:59 AM | 0 (0.0%) | 0 (0.0%) |
| 10:00 AM to 10:59 AM | 0 (0.0%) | 0 (0.0%) |
| 11:00 AM to 11:59 AM | 0 (0.0%) | 0 (0.0%) |
| 12:00 PM to 3:59 PM | 0 (0.0%) | 45 (52.9%) |
| 4:00 PM to 11:59 PM | 24 (21.6%) | 0 (0.0%) |
| Total | 111 (100.0%) | 85 (100.0%) |
Housing Occupancy in Crooked Creek
Occupancy by Ownership in Crooked Creek
Of the total 369 dwellings in Crooked Creek, owner-occupied units account for 179 (48.5%), while renter-occupied units make up 190 (51.5%).
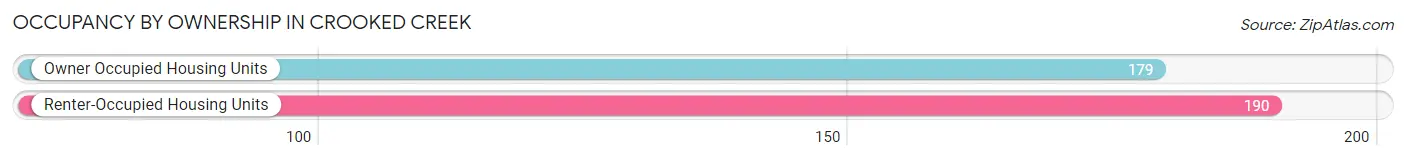
| Occupancy | # Housing Units | % Housing Units |
| Owner Occupied Housing Units | 179 | 48.5% |
| Renter-Occupied Housing Units | 190 | 51.5% |
| Total Occupied Housing Units | 369 | 100.0% |
Occupancy by Household Size in Crooked Creek
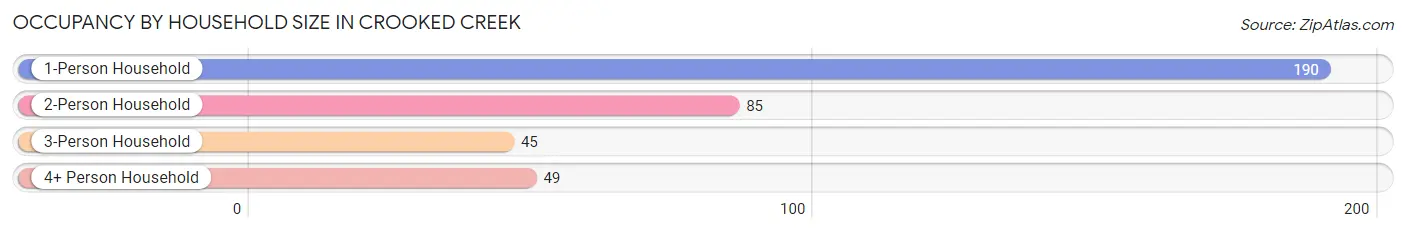
| Household Size | # Housing Units | % Housing Units |
| 1-Person Household | 190 | 51.5% |
| 2-Person Household | 85 | 23.0% |
| 3-Person Household | 45 | 12.2% |
| 4+ Person Household | 49 | 13.3% |
| Total Housing Units | 369 | 100.0% |
Occupancy by Ownership by Household Size in Crooked Creek
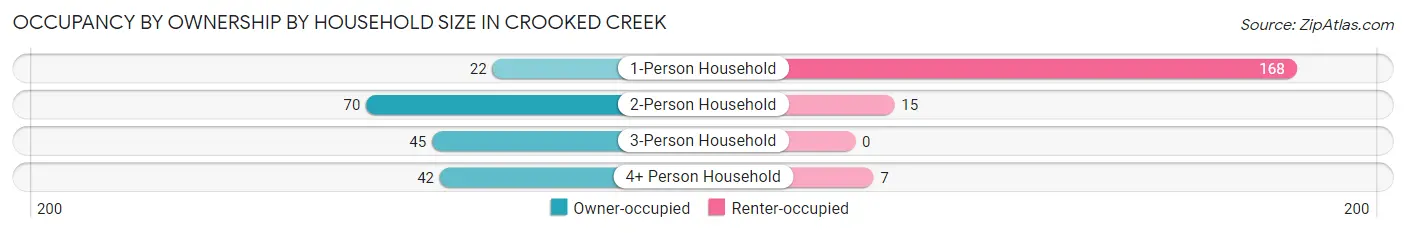
| Household Size | Owner-occupied | Renter-occupied |
| 1-Person Household | 22 (11.6%) | 168 (88.4%) |
| 2-Person Household | 70 (82.4%) | 15 (17.6%) |
| 3-Person Household | 45 (100.0%) | 0 (0.0%) |
| 4+ Person Household | 42 (85.7%) | 7 (14.3%) |
| Total Housing Units | 179 (48.5%) | 190 (51.5%) |
Occupancy by Educational Attainment in Crooked Creek
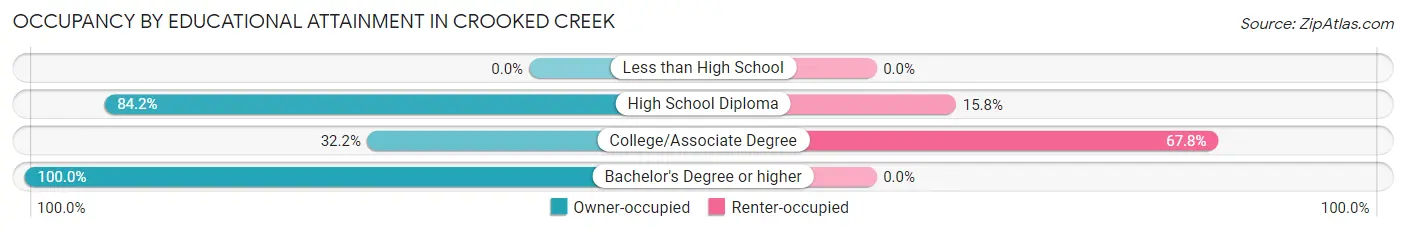
| Household Size | Owner-occupied | Renter-occupied |
| Less than High School | 0 (0.0%) | 0 (0.0%) |
| High School Diploma | 80 (84.2%) | 15 (15.8%) |
| College/Associate Degree | 83 (32.2%) | 175 (67.8%) |
| Bachelor's Degree or higher | 16 (100.0%) | 0 (0.0%) |
Occupancy by Age of Householder in Crooked Creek
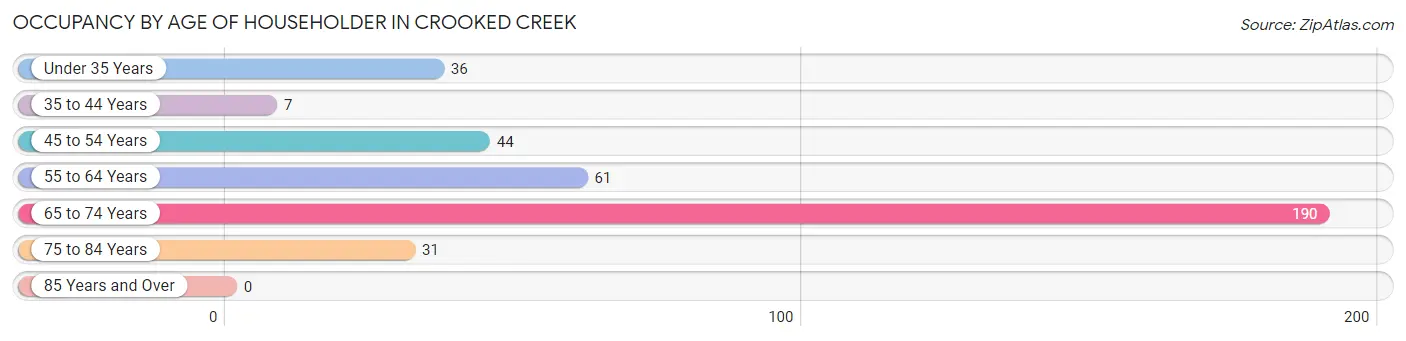
| Age Bracket | # Households | % Households |
| Under 35 Years | 36 | 9.8% |
| 35 to 44 Years | 7 | 1.9% |
| 45 to 54 Years | 44 | 11.9% |
| 55 to 64 Years | 61 | 16.5% |
| 65 to 74 Years | 190 | 51.5% |
| 75 to 84 Years | 31 | 8.4% |
| 85 Years and Over | 0 | 0.0% |
| Total | 369 | 100.0% |
Housing Finances in Crooked Creek
Median Income by Occupancy in Crooked Creek
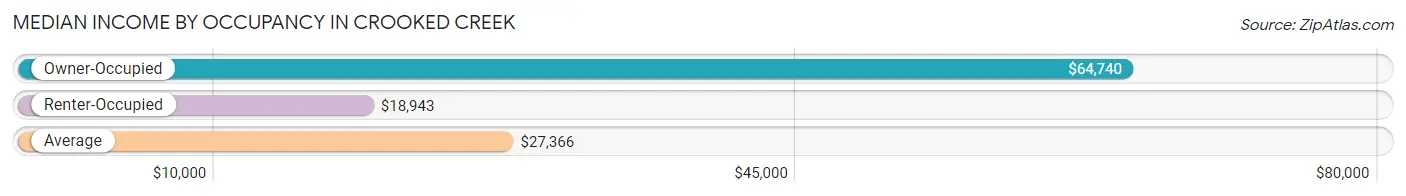
| Occupancy Type | # Households | Median Income |
| Owner-Occupied | 179 (48.5%) | $64,740 |
| Renter-Occupied | 190 (51.5%) | $18,943 |
| Average | 369 (100.0%) | $27,366 |
Occupancy by Householder Income Bracket in Crooked Creek
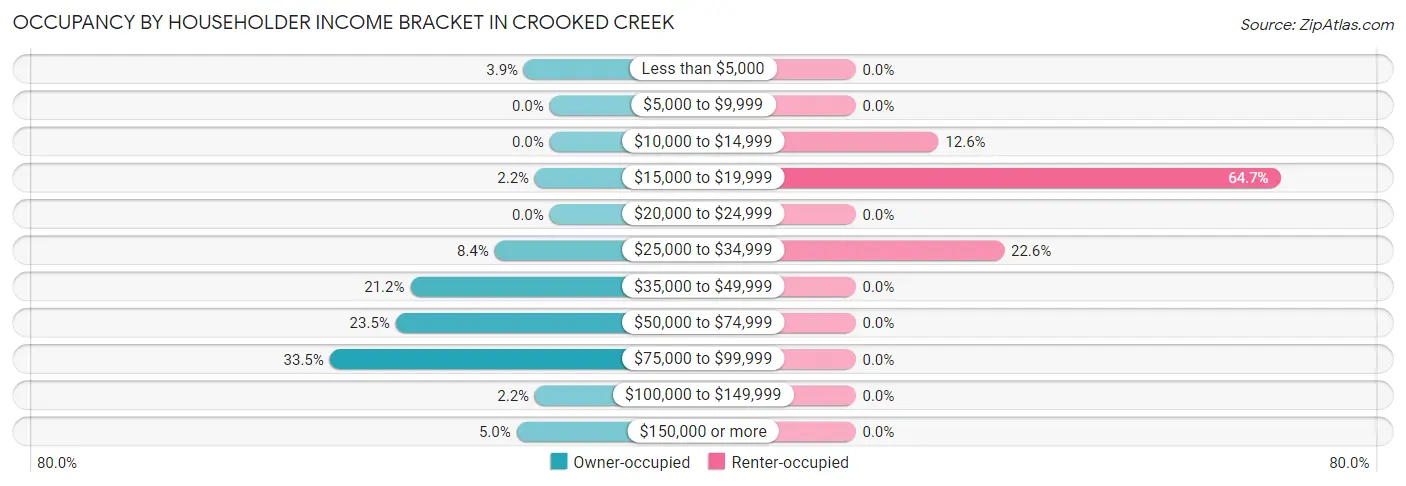
| Income Bracket | Owner-occupied | Renter-occupied |
| Less than $5,000 | 7 (3.9%) | 0 (0.0%) |
| $5,000 to $9,999 | 0 (0.0%) | 0 (0.0%) |
| $10,000 to $14,999 | 0 (0.0%) | 24 (12.6%) |
| $15,000 to $19,999 | 4 (2.2%) | 123 (64.7%) |
| $20,000 to $24,999 | 0 (0.0%) | 0 (0.0%) |
| $25,000 to $34,999 | 15 (8.4%) | 43 (22.6%) |
| $35,000 to $49,999 | 38 (21.2%) | 0 (0.0%) |
| $50,000 to $74,999 | 42 (23.5%) | 0 (0.0%) |
| $75,000 to $99,999 | 60 (33.5%) | 0 (0.0%) |
| $100,000 to $149,999 | 4 (2.2%) | 0 (0.0%) |
| $150,000 or more | 9 (5.0%) | 0 (0.0%) |
| Total | 179 (100.0%) | 190 (100.0%) |
Monthly Housing Cost Tiers in Crooked Creek
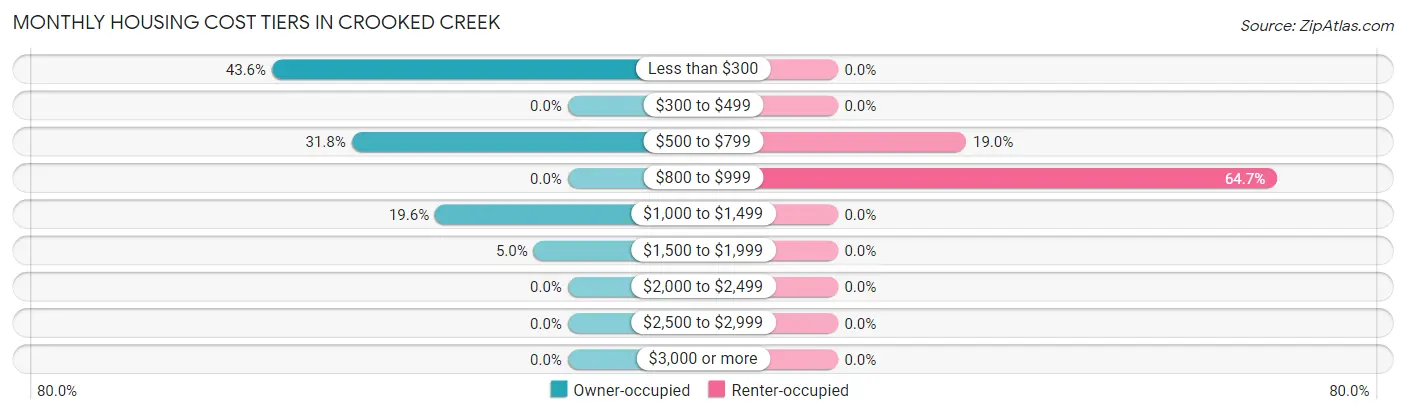
| Monthly Cost | Owner-occupied | Renter-occupied |
| Less than $300 | 78 (43.6%) | 0 (0.0%) |
| $300 to $499 | 0 (0.0%) | 0 (0.0%) |
| $500 to $799 | 57 (31.8%) | 36 (19.0%) |
| $800 to $999 | 0 (0.0%) | 123 (64.7%) |
| $1,000 to $1,499 | 35 (19.6%) | 0 (0.0%) |
| $1,500 to $1,999 | 9 (5.0%) | 0 (0.0%) |
| $2,000 to $2,499 | 0 (0.0%) | 0 (0.0%) |
| $2,500 to $2,999 | 0 (0.0%) | 0 (0.0%) |
| $3,000 or more | 0 (0.0%) | 0 (0.0%) |
| Total | 179 (100.0%) | 190 (100.0%) |
Physical Housing Characteristics in Crooked Creek
Housing Structures in Crooked Creek
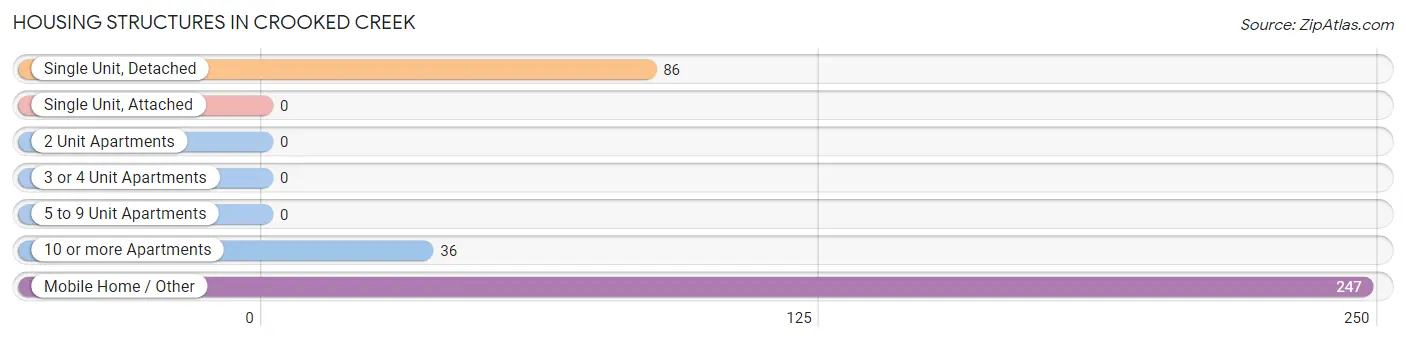
| Structure Type | # Housing Units | % Housing Units |
| Single Unit, Detached | 86 | 23.3% |
| Single Unit, Attached | 0 | 0.0% |
| 2 Unit Apartments | 0 | 0.0% |
| 3 or 4 Unit Apartments | 0 | 0.0% |
| 5 to 9 Unit Apartments | 0 | 0.0% |
| 10 or more Apartments | 36 | 9.8% |
| Mobile Home / Other | 247 | 66.9% |
| Total | 369 | 100.0% |
Housing Structures by Occupancy in Crooked Creek
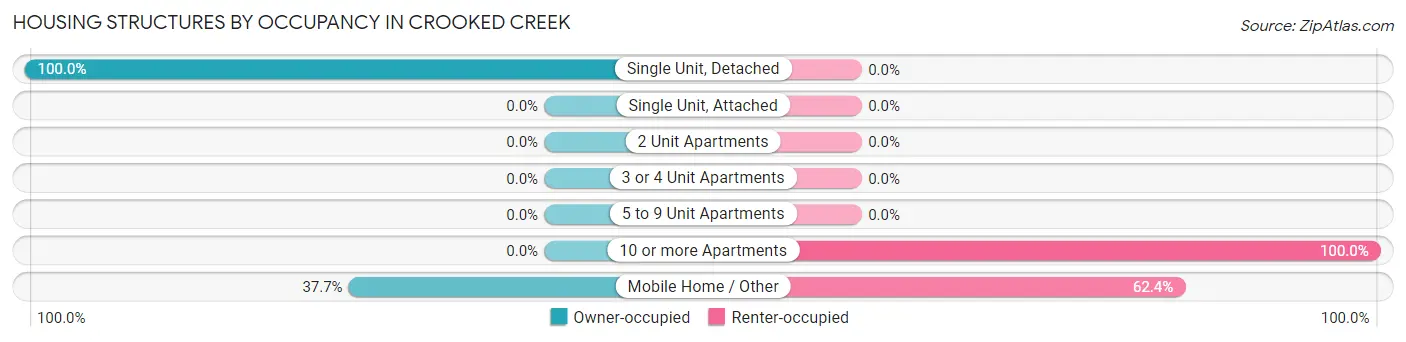
| Structure Type | Owner-occupied | Renter-occupied |
| Single Unit, Detached | 86 (100.0%) | 0 (0.0%) |
| Single Unit, Attached | 0 (0.0%) | 0 (0.0%) |
| 2 Unit Apartments | 0 (0.0%) | 0 (0.0%) |
| 3 or 4 Unit Apartments | 0 (0.0%) | 0 (0.0%) |
| 5 to 9 Unit Apartments | 0 (0.0%) | 0 (0.0%) |
| 10 or more Apartments | 0 (0.0%) | 36 (100.0%) |
| Mobile Home / Other | 93 (37.7%) | 154 (62.4%) |
| Total | 179 (48.5%) | 190 (51.5%) |
Housing Structures by Number of Rooms in Crooked Creek
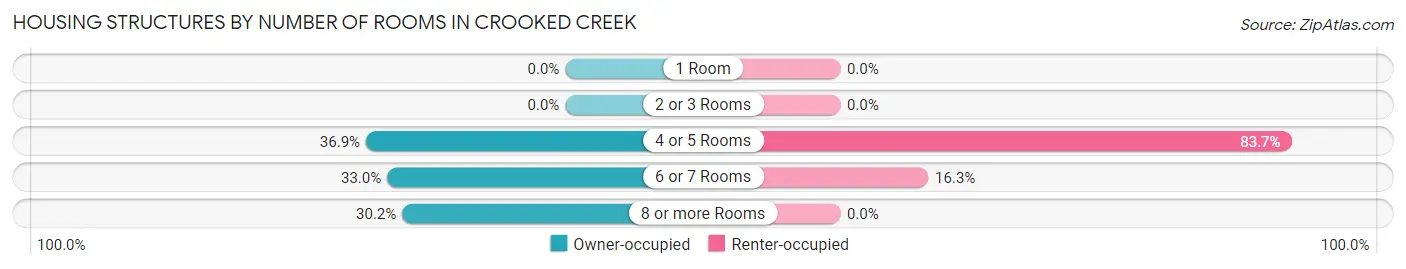
| Number of Rooms | Owner-occupied | Renter-occupied |
| 1 Room | 0 (0.0%) | 0 (0.0%) |
| 2 or 3 Rooms | 0 (0.0%) | 0 (0.0%) |
| 4 or 5 Rooms | 66 (36.9%) | 159 (83.7%) |
| 6 or 7 Rooms | 59 (33.0%) | 31 (16.3%) |
| 8 or more Rooms | 54 (30.2%) | 0 (0.0%) |
| Total | 179 (100.0%) | 190 (100.0%) |
Housing Structure by Heating Type in Crooked Creek
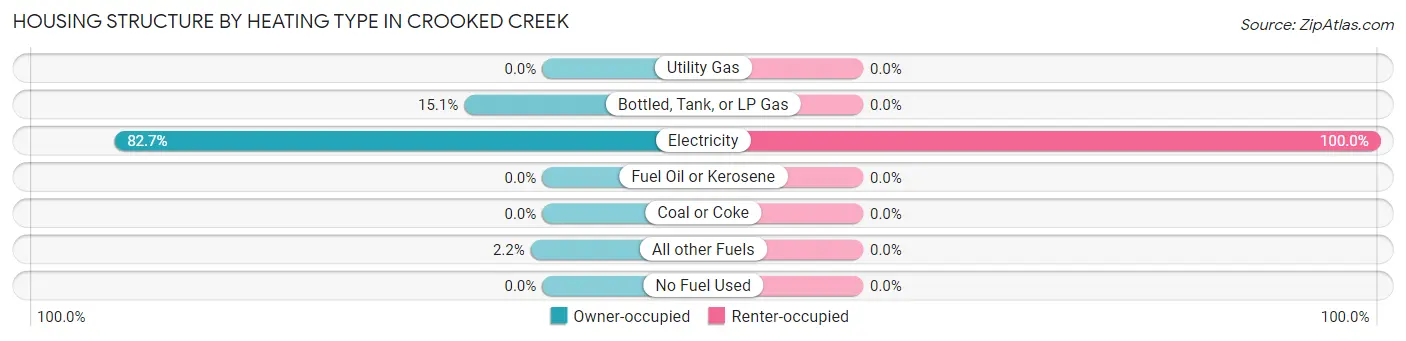
| Heating Type | Owner-occupied | Renter-occupied |
| Utility Gas | 0 (0.0%) | 0 (0.0%) |
| Bottled, Tank, or LP Gas | 27 (15.1%) | 0 (0.0%) |
| Electricity | 148 (82.7%) | 190 (100.0%) |
| Fuel Oil or Kerosene | 0 (0.0%) | 0 (0.0%) |
| Coal or Coke | 0 (0.0%) | 0 (0.0%) |
| All other Fuels | 4 (2.2%) | 0 (0.0%) |
| No Fuel Used | 0 (0.0%) | 0 (0.0%) |
| Total | 179 (100.0%) | 190 (100.0%) |
Household Vehicle Usage in Crooked Creek
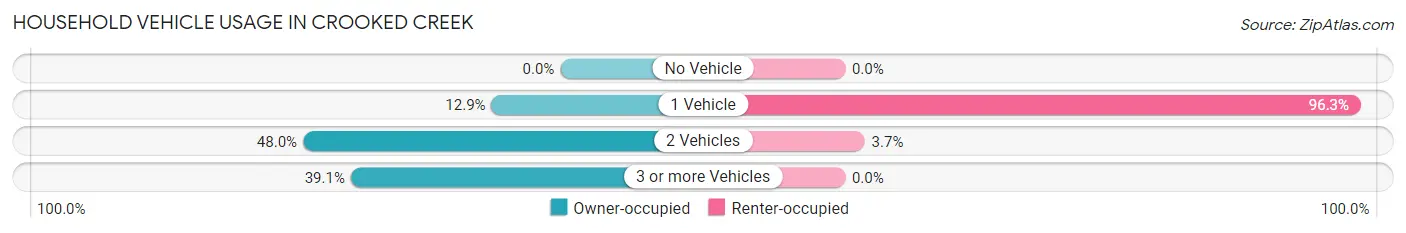
| Vehicles per Household | Owner-occupied | Renter-occupied |
| No Vehicle | 0 (0.0%) | 0 (0.0%) |
| 1 Vehicle | 23 (12.9%) | 183 (96.3%) |
| 2 Vehicles | 86 (48.0%) | 7 (3.7%) |
| 3 or more Vehicles | 70 (39.1%) | 0 (0.0%) |
| Total | 179 (100.0%) | 190 (100.0%) |
Real Estate & Mortgages in Crooked Creek
Real Estate and Mortgage Overview in Crooked Creek
| Characteristic | Without Mortgage | With Mortgage |
| Housing Units | 139 | 40 |
| Median Property Value | - | - |
| Median Household Income | $73,036 | $9 |
| Monthly Housing Costs | - | - |
| Real Estate Taxes | - | - |
Property Value by Mortgage Status in Crooked Creek
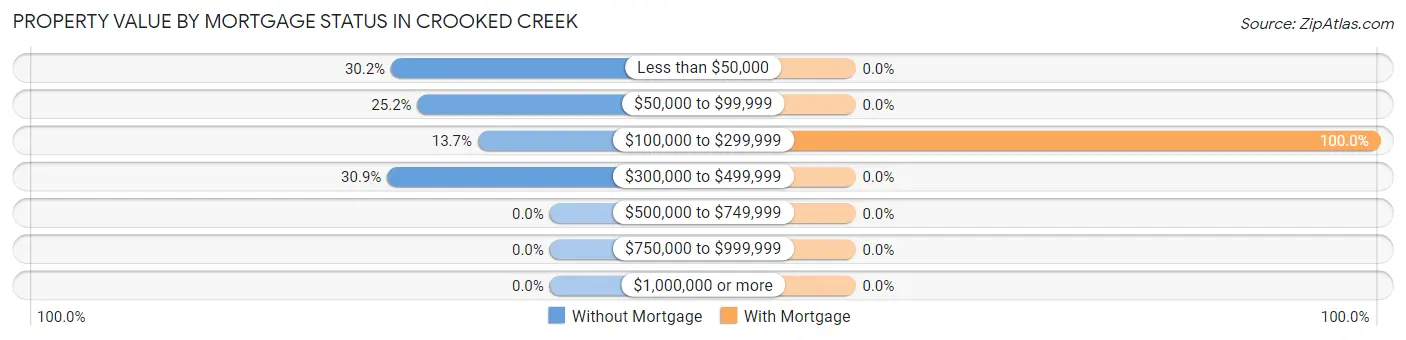
| Property Value | Without Mortgage | With Mortgage |
| Less than $50,000 | 42 (30.2%) | 0 (0.0%) |
| $50,000 to $99,999 | 35 (25.2%) | 0 (0.0%) |
| $100,000 to $299,999 | 19 (13.7%) | 40 (100.0%) |
| $300,000 to $499,999 | 43 (30.9%) | 0 (0.0%) |
| $500,000 to $749,999 | 0 (0.0%) | 0 (0.0%) |
| $750,000 to $999,999 | 0 (0.0%) | 0 (0.0%) |
| $1,000,000 or more | 0 (0.0%) | 0 (0.0%) |
| Total | 139 (100.0%) | 40 (100.0%) |
Household Income by Mortgage Status in Crooked Creek
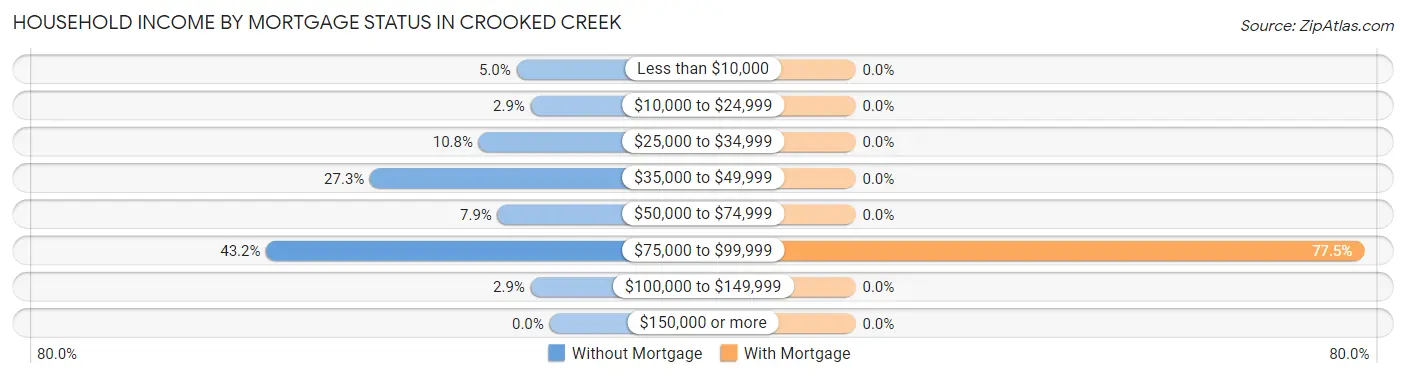
| Household Income | Without Mortgage | With Mortgage |
| Less than $10,000 | 7 (5.0%) | 0 (0.0%) |
| $10,000 to $24,999 | 4 (2.9%) | 0 (0.0%) |
| $25,000 to $34,999 | 15 (10.8%) | 0 (0.0%) |
| $35,000 to $49,999 | 38 (27.3%) | 0 (0.0%) |
| $50,000 to $74,999 | 11 (7.9%) | 0 (0.0%) |
| $75,000 to $99,999 | 60 (43.2%) | 31 (77.5%) |
| $100,000 to $149,999 | 4 (2.9%) | 0 (0.0%) |
| $150,000 or more | 0 (0.0%) | 0 (0.0%) |
| Total | 139 (100.0%) | 40 (100.0%) |
Property Value to Household Income Ratio in Crooked Creek
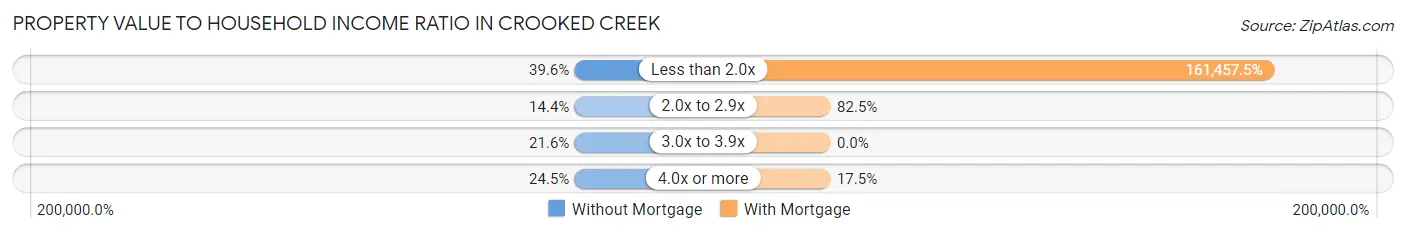
| Value-to-Income Ratio | Without Mortgage | With Mortgage |
| Less than 2.0x | 55 (39.6%) | 64,583 (161,457.5%) |
| 2.0x to 2.9x | 20 (14.4%) | 33 (82.5%) |
| 3.0x to 3.9x | 30 (21.6%) | 0 (0.0%) |
| 4.0x or more | 34 (24.5%) | 7 (17.5%) |
| Total | 139 (100.0%) | 40 (100.0%) |
Real Estate Taxes by Mortgage Status in Crooked Creek
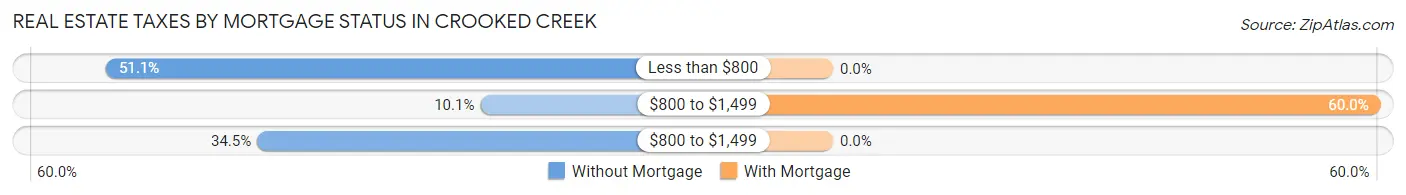
| Property Taxes | Without Mortgage | With Mortgage |
| Less than $800 | 71 (51.1%) | 0 (0.0%) |
| $800 to $1,499 | 14 (10.1%) | 24 (60.0%) |
| $800 to $1,499 | 48 (34.5%) | 0 (0.0%) |
| Total | 139 (100.0%) | 40 (100.0%) |
Health & Disability in Crooked Creek
Health Insurance Coverage by Age in Crooked Creek
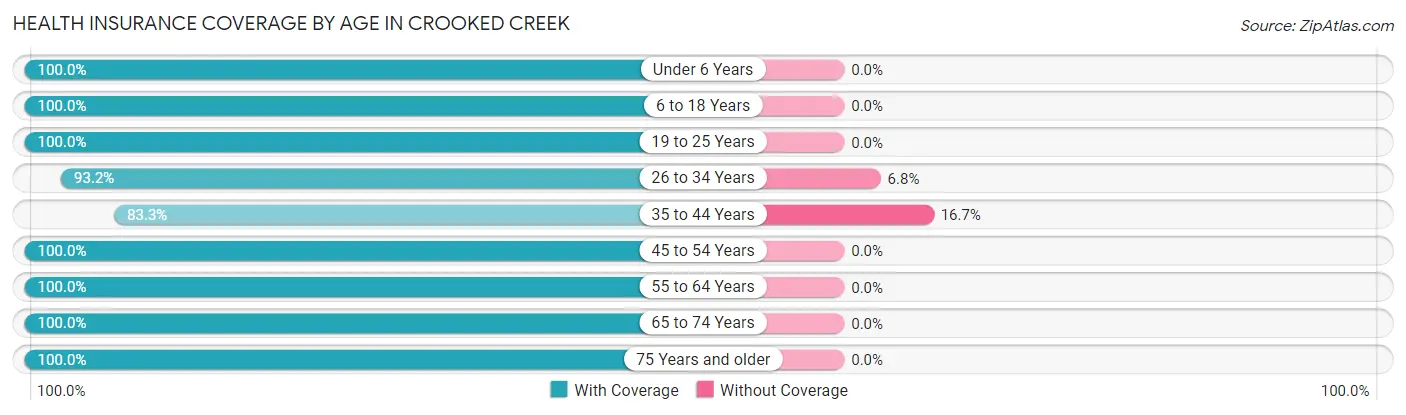
| Age Bracket | With Coverage | Without Coverage |
| Under 6 Years | 22 (100.0%) | 0 (0.0%) |
| 6 to 18 Years | 113 (100.0%) | 0 (0.0%) |
| 19 to 25 Years | 5 (100.0%) | 0 (0.0%) |
| 26 to 34 Years | 55 (93.2%) | 4 (6.8%) |
| 35 to 44 Years | 20 (83.3%) | 4 (16.7%) |
| 45 to 54 Years | 61 (100.0%) | 0 (0.0%) |
| 55 to 64 Years | 67 (100.0%) | 0 (0.0%) |
| 65 to 74 Years | 254 (100.0%) | 0 (0.0%) |
| 75 Years and older | 69 (100.0%) | 0 (0.0%) |
| Total | 666 (98.8%) | 8 (1.2%) |
Health Insurance Coverage by Citizenship Status in Crooked Creek
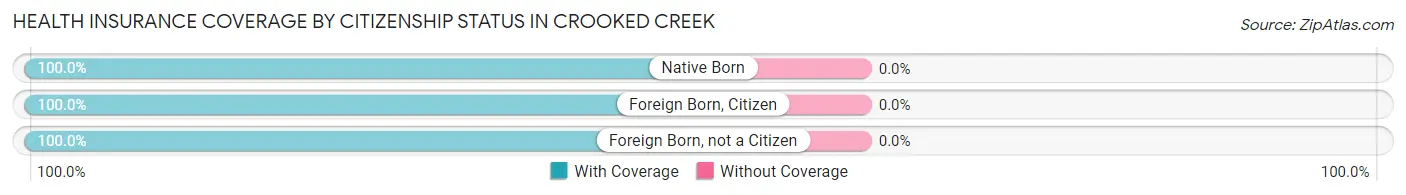
| Citizenship Status | With Coverage | Without Coverage |
| Native Born | 22 (100.0%) | 0 (0.0%) |
| Foreign Born, Citizen | 113 (100.0%) | 0 (0.0%) |
| Foreign Born, not a Citizen | 5 (100.0%) | 0 (0.0%) |
Health Insurance Coverage by Household Income in Crooked Creek
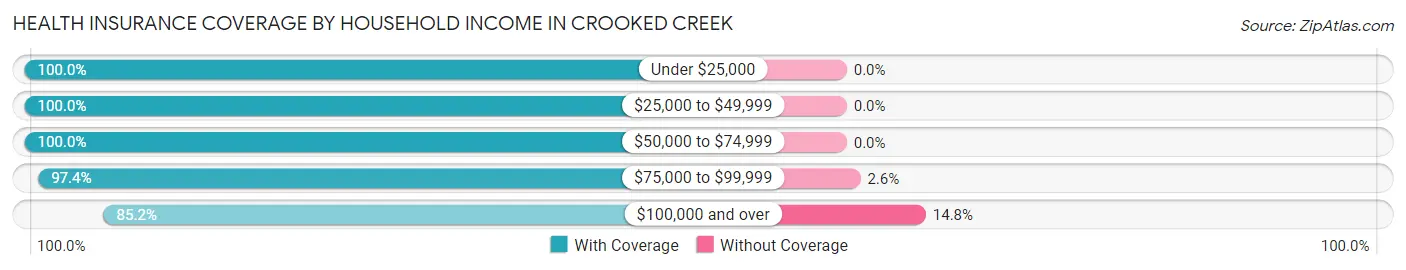
| Household Income | With Coverage | Without Coverage |
| Under $25,000 | 163 (100.0%) | 0 (0.0%) |
| $25,000 to $49,999 | 198 (100.0%) | 0 (0.0%) |
| $50,000 to $74,999 | 130 (100.0%) | 0 (0.0%) |
| $75,000 to $99,999 | 152 (97.4%) | 4 (2.6%) |
| $100,000 and over | 23 (85.2%) | 4 (14.8%) |
Public vs Private Health Insurance Coverage by Age in Crooked Creek
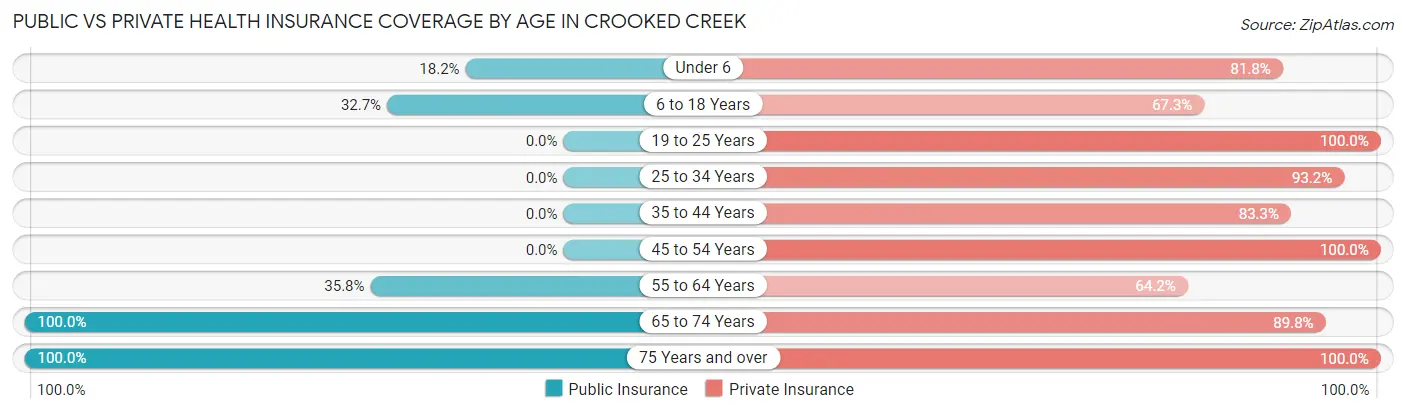
| Age Bracket | Public Insurance | Private Insurance |
| Under 6 | 4 (18.2%) | 18 (81.8%) |
| 6 to 18 Years | 37 (32.7%) | 76 (67.3%) |
| 19 to 25 Years | 0 (0.0%) | 5 (100.0%) |
| 25 to 34 Years | 0 (0.0%) | 55 (93.2%) |
| 35 to 44 Years | 0 (0.0%) | 20 (83.3%) |
| 45 to 54 Years | 0 (0.0%) | 61 (100.0%) |
| 55 to 64 Years | 24 (35.8%) | 43 (64.2%) |
| 65 to 74 Years | 254 (100.0%) | 228 (89.8%) |
| 75 Years and over | 69 (100.0%) | 69 (100.0%) |
| Total | 388 (57.6%) | 575 (85.3%) |
Disability Status by Sex by Age in Crooked Creek
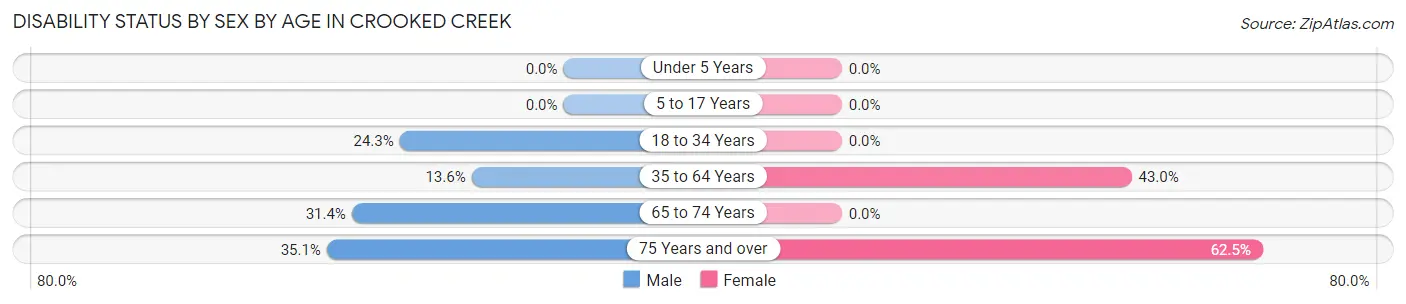
| Age Bracket | Male | Female |
| Under 5 Years | 0 (0.0%) | 0 (0.0%) |
| 5 to 17 Years | 0 (0.0%) | 0 (0.0%) |
| 18 to 34 Years | 9 (24.3%) | 0 (0.0%) |
| 35 to 64 Years | 9 (13.6%) | 37 (43.0%) |
| 65 to 74 Years | 22 (31.4%) | 0 (0.0%) |
| 75 Years and over | 13 (35.1%) | 20 (62.5%) |
Disability Class by Sex by Age in Crooked Creek
Disability Class: Hearing Difficulty
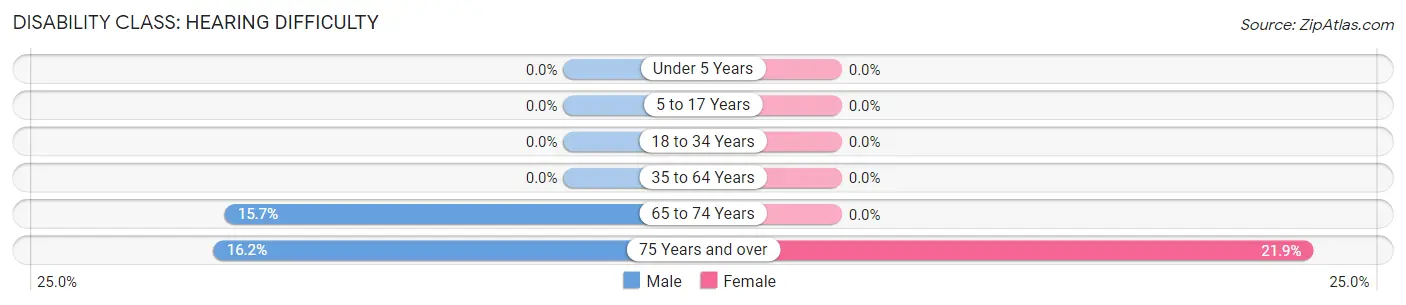
| Age Bracket | Male | Female |
| Under 5 Years | 0 (0.0%) | 0 (0.0%) |
| 5 to 17 Years | 0 (0.0%) | 0 (0.0%) |
| 18 to 34 Years | 0 (0.0%) | 0 (0.0%) |
| 35 to 64 Years | 0 (0.0%) | 0 (0.0%) |
| 65 to 74 Years | 11 (15.7%) | 0 (0.0%) |
| 75 Years and over | 6 (16.2%) | 7 (21.9%) |
Disability Class: Vision Difficulty
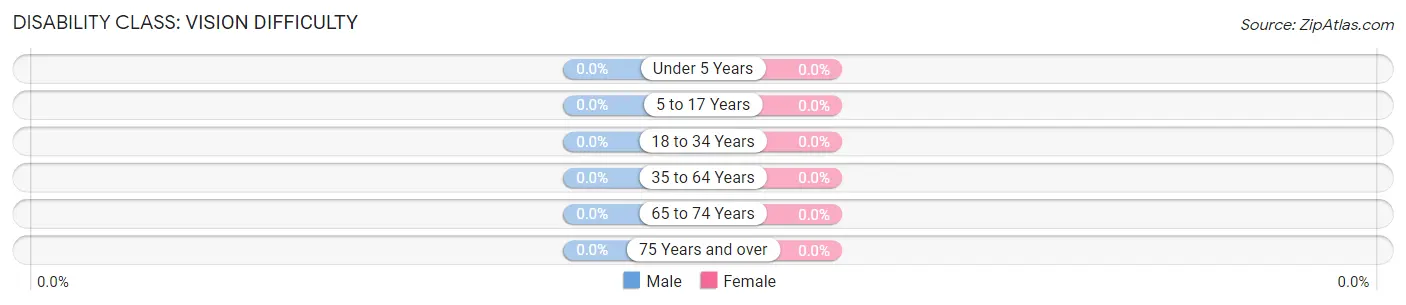
| Age Bracket | Male | Female |
| Under 5 Years | 0 (0.0%) | 0 (0.0%) |
| 5 to 17 Years | 0 (0.0%) | 0 (0.0%) |
| 18 to 34 Years | 0 (0.0%) | 0 (0.0%) |
| 35 to 64 Years | 0 (0.0%) | 0 (0.0%) |
| 65 to 74 Years | 0 (0.0%) | 0 (0.0%) |
| 75 Years and over | 0 (0.0%) | 0 (0.0%) |
Disability Class: Cognitive Difficulty
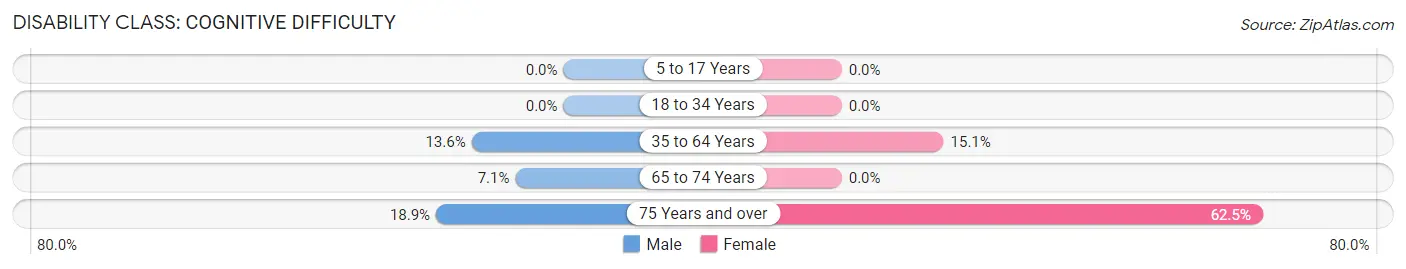
| Age Bracket | Male | Female |
| 5 to 17 Years | 0 (0.0%) | 0 (0.0%) |
| 18 to 34 Years | 0 (0.0%) | 0 (0.0%) |
| 35 to 64 Years | 9 (13.6%) | 13 (15.1%) |
| 65 to 74 Years | 5 (7.1%) | 0 (0.0%) |
| 75 Years and over | 7 (18.9%) | 20 (62.5%) |
Disability Class: Ambulatory Difficulty
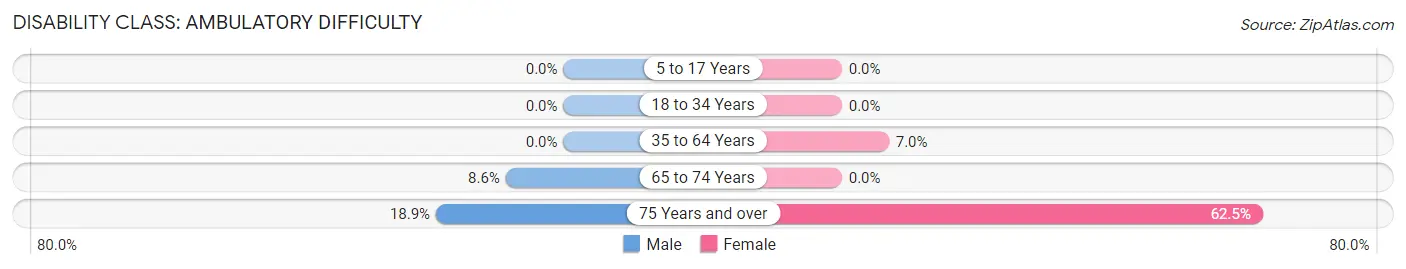
| Age Bracket | Male | Female |
| 5 to 17 Years | 0 (0.0%) | 0 (0.0%) |
| 18 to 34 Years | 0 (0.0%) | 0 (0.0%) |
| 35 to 64 Years | 0 (0.0%) | 6 (7.0%) |
| 65 to 74 Years | 6 (8.6%) | 0 (0.0%) |
| 75 Years and over | 7 (18.9%) | 20 (62.5%) |
Disability Class: Self-Care Difficulty
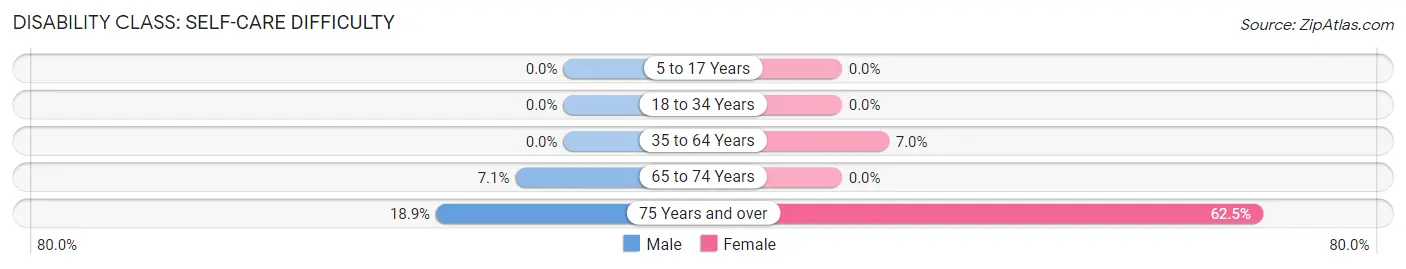
| Age Bracket | Male | Female |
| 5 to 17 Years | 0 (0.0%) | 0 (0.0%) |
| 18 to 34 Years | 0 (0.0%) | 0 (0.0%) |
| 35 to 64 Years | 0 (0.0%) | 6 (7.0%) |
| 65 to 74 Years | 5 (7.1%) | 0 (0.0%) |
| 75 Years and over | 7 (18.9%) | 20 (62.5%) |
Technology Access in Crooked Creek
Computing Device Access in Crooked Creek
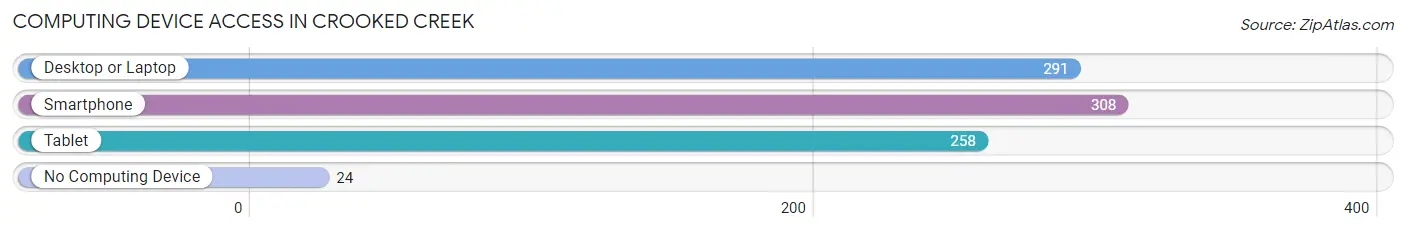
| Device Type | # Households | % Households |
| Desktop or Laptop | 291 | 78.9% |
| Smartphone | 308 | 83.5% |
| Tablet | 258 | 69.9% |
| No Computing Device | 24 | 6.5% |
| Total | 369 | 100.0% |
Internet Access in Crooked Creek
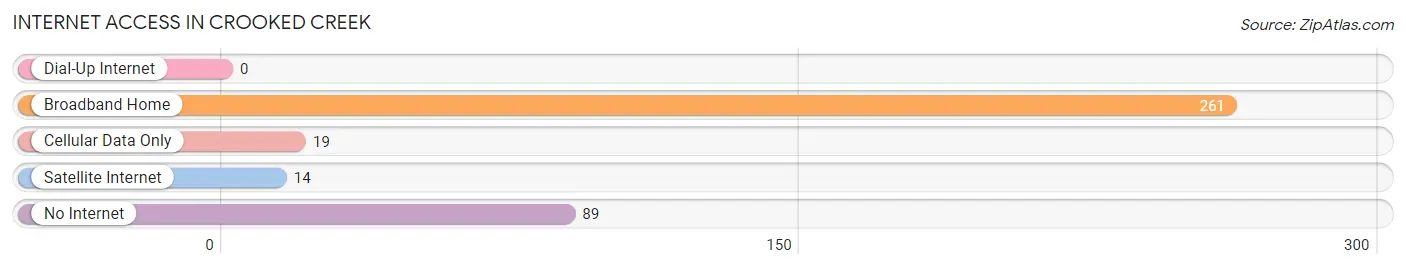
| Internet Type | # Households | % Households |
| Dial-Up Internet | 0 | 0.0% |
| Broadband Home | 261 | 70.7% |
| Cellular Data Only | 19 | 5.1% |
| Satellite Internet | 14 | 3.8% |
| No Internet | 89 | 24.1% |
| Total | 369 | 100.0% |
Crooked Creek Summary
Crooked Creek is a small unincorporated community located in the state of Georgia, United States. It is situated in the northern part of the state, in the county of Forsyth. The community is located on the banks of the Crooked Creek, a tributary of the Chattahoochee River.
History
The area around Crooked Creek was first settled in the early 1800s by settlers from North Carolina. The community was originally known as “Creektown” and was located near the intersection of two major roads, the Old Federal Road and the Unicoi Turnpike. The community was later renamed Crooked Creek after the creek that runs through the area.
In the late 1800s, the community was home to a number of small businesses, including a general store, a blacksmith shop, and a cotton gin. The community also had a post office, which was established in 1887.
In the early 1900s, the community began to decline as the railroad bypassed the area. The post office closed in 1915 and the businesses in the area began to close as well.
Geography
Crooked Creek is located in the northern part of the state of Georgia, in the county of Forsyth. The community is situated on the banks of the Crooked Creek, a tributary of the Chattahoochee River. The area is mostly rural, with rolling hills and forests.
The climate in the area is humid subtropical, with hot summers and mild winters. The average annual temperature is around 64°F (18°C). The average annual precipitation is around 50 inches (127 cm).
Economy
The economy of Crooked Creek is largely based on agriculture. The area is home to a number of farms, which produce a variety of crops, including corn, soybeans, cotton, and peanuts. The area is also home to a number of small businesses, including a general store, a gas station, and a few restaurants.
Demographics
As of the 2010 census, the population of Crooked Creek was 1,072. The racial makeup of the community was 97.3% White, 0.9% African American, 0.3% Native American, 0.2% Asian, and 1.3% from other races. The median household income was $37,917, and the median family income was $45,625.
Conclusion
Crooked Creek is a small unincorporated community located in the northern part of the state of Georgia. The community is situated on the banks of the Crooked Creek, a tributary of the Chattahoochee River. The economy of the area is largely based on agriculture, and the population is mostly White. The median household income is around $37,917, and the median family income is around $45,625.
Common Questions
What is Per Capita Income in Crooked Creek?
Per Capita income in Crooked Creek is $24,082.
What is the Median Family Income in Crooked Creek?
Median Family Income in Crooked Creek is $64,948.
What is the Median Household income in Crooked Creek?
Median Household Income in Crooked Creek is $27,366.
What is Inequality or Gini Index in Crooked Creek?
Inequality or Gini Index in Crooked Creek is 0.42.
What is the Total Population of Crooked Creek?
Total Population of Crooked Creek is 674.
What is the Total Male Population of Crooked Creek?
Total Male Population of Crooked Creek is 296.
What is the Total Female Population of Crooked Creek?
Total Female Population of Crooked Creek is 378.
What is the Ratio of Males per 100 Females in Crooked Creek?
There are 78.31 Males per 100 Females in Crooked Creek.
What is the Ratio of Females per 100 Males in Crooked Creek?
There are 127.70 Females per 100 Males in Crooked Creek.
What is the Median Population Age in Crooked Creek?
Median Population Age in Crooked Creek is 63.5 Years.
What is the Average Family Size in Crooked Creek
Average Family Size in Crooked Creek is 2.7 People.
What is the Average Household Size in Crooked Creek
Average Household Size in Crooked Creek is 1.8 People.
How Large is the Labor Force in Crooked Creek?
There are 204 People in the Labor Forcein in Crooked Creek.
What is the Percentage of People in the Labor Force in Crooked Creek?
36.9% of People are in the Labor Force in Crooked Creek.
What is the Unemployment Rate in Crooked Creek?
Unemployment Rate in Crooked Creek is 2.0%.