Zip Codes with the Highest Percentage of Population Employed in Health Diagnosing & Treating in Norcross, GA
RELATED REPORTS & OPTIONS
Health Diagnosing & Treating
Norcross
Compare Zip Codes
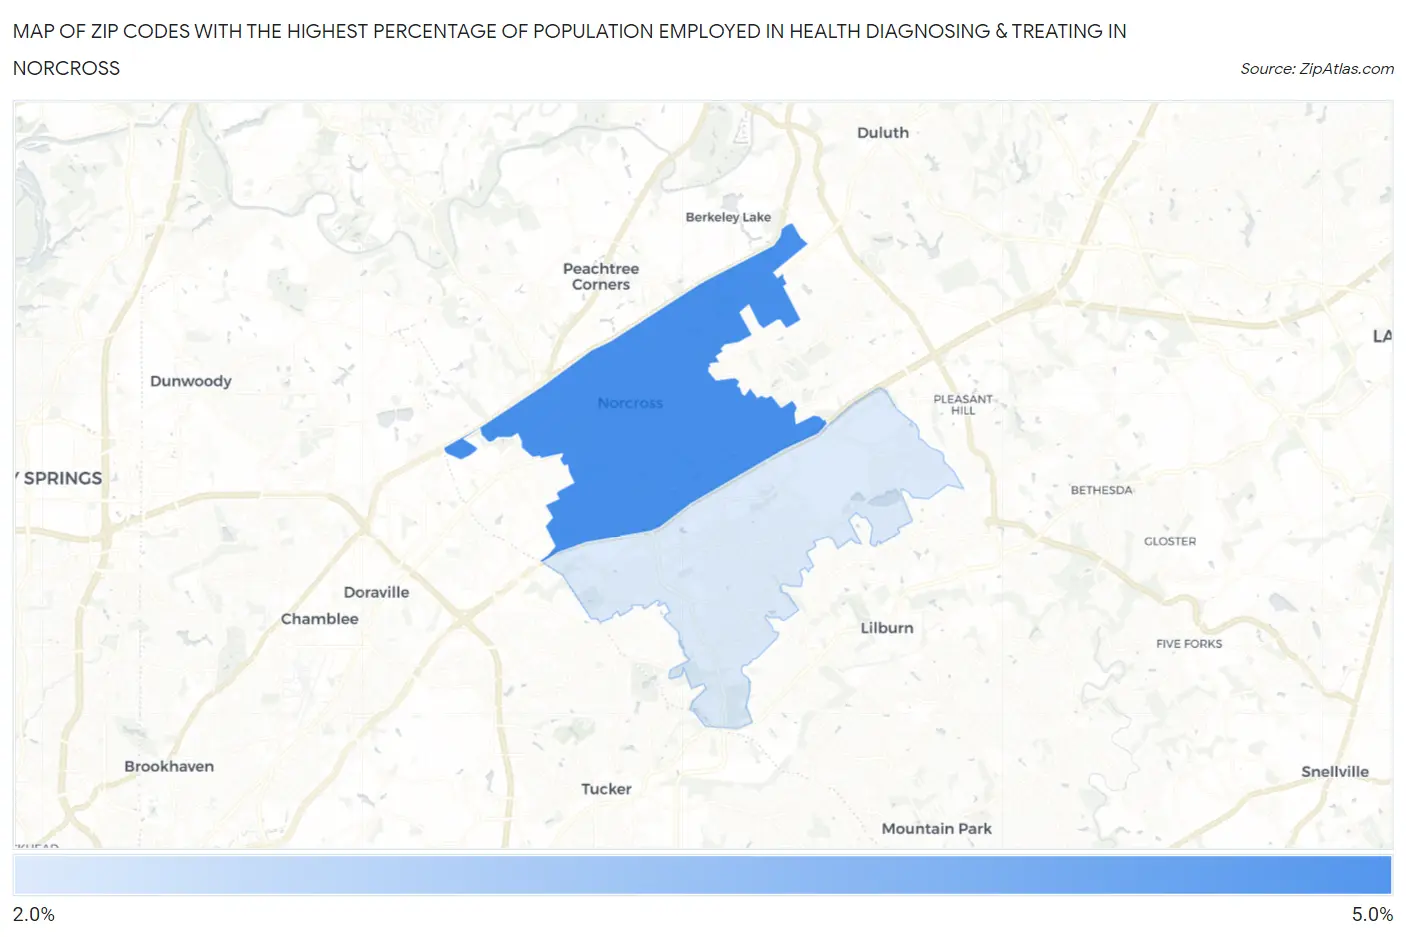
Map of Zip Codes with the Highest Percentage of Population Employed in Health Diagnosing & Treating in Norcross
3.0%
4.6%
Zip Codes with the Highest Percentage of Population Employed in Health Diagnosing & Treating in Norcross, GA
| Zip Code | % Employed | vs State | vs National | |
| 1. | 30071 | 4.6% | 5.7%(-1.15)#421 | 6.2%(-1.69)#19,427 |
| 2. | 30093 | 3.0% | 5.7%(-2.74)#554 | 6.2%(-3.27)#24,395 |
1
Common Questions
What are the Top Zip Codes with the Highest Percentage of Population Employed in Health Diagnosing & Treating in Norcross, GA?
Top Zip Codes with the Highest Percentage of Population Employed in Health Diagnosing & Treating in Norcross, GA are:
What zip code has the Highest Percentage of Population Employed in Health Diagnosing & Treating in Norcross, GA?
30071 has the Highest Percentage of Population Employed in Health Diagnosing & Treating in Norcross, GA with 4.6%.
What is the Percentage of Population Employed in Health Diagnosing & Treating in Norcross, GA?
Percentage of Population Employed in Health Diagnosing & Treating in Norcross is 4.7%.
What is the Percentage of Population Employed in Health Diagnosing & Treating in Georgia?
Percentage of Population Employed in Health Diagnosing & Treating in Georgia is 5.7%.
What is the Percentage of Population Employed in Health Diagnosing & Treating in the United States?
Percentage of Population Employed in Health Diagnosing & Treating in the United States is 6.2%.