Zip Codes with the Highest Percentage of Population Employed in Health Diagnosing & Treating in Woodstock, GA
RELATED REPORTS & OPTIONS
Health Diagnosing & Treating
Woodstock
Compare Zip Codes
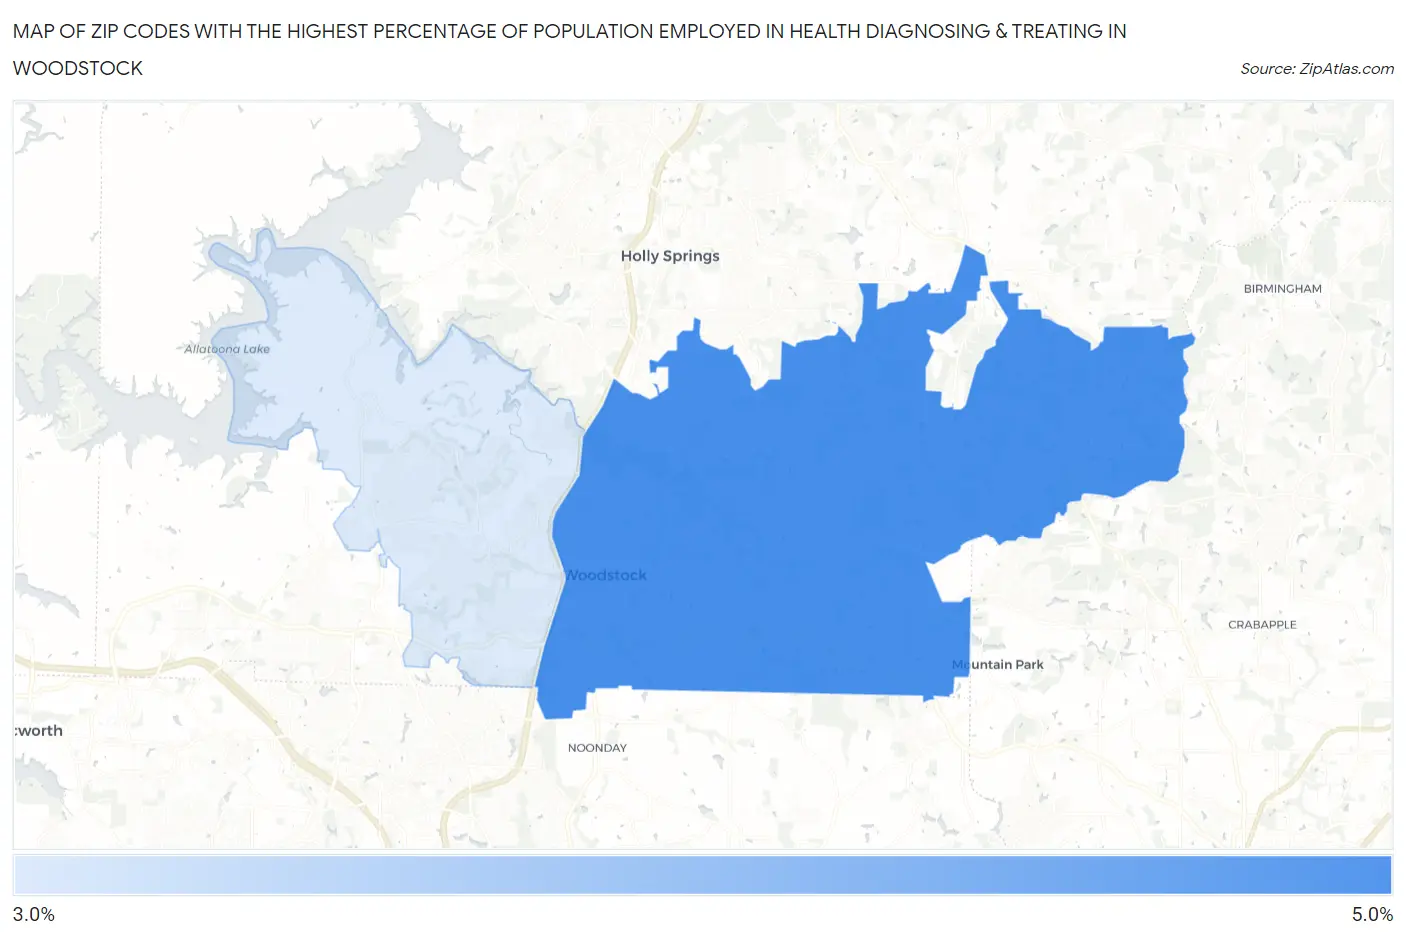
Map of Zip Codes with the Highest Percentage of Population Employed in Health Diagnosing & Treating in Woodstock
3.7%
4.9%
Zip Codes with the Highest Percentage of Population Employed in Health Diagnosing & Treating in Woodstock, GA
| Zip Code | % Employed | vs State | vs National | |
| 1. | 30188 | 4.9% | 5.7%(-0.805)#387 | 6.2%(-1.34)#18,093 |
| 2. | 30189 | 3.7% | 5.7%(-2.01)#502 | 6.2%(-2.55)#22,299 |
1
Common Questions
What are the Top Zip Codes with the Highest Percentage of Population Employed in Health Diagnosing & Treating in Woodstock, GA?
Top Zip Codes with the Highest Percentage of Population Employed in Health Diagnosing & Treating in Woodstock, GA are:
What zip code has the Highest Percentage of Population Employed in Health Diagnosing & Treating in Woodstock, GA?
30188 has the Highest Percentage of Population Employed in Health Diagnosing & Treating in Woodstock, GA with 4.9%.
What is the Percentage of Population Employed in Health Diagnosing & Treating in Woodstock, GA?
Percentage of Population Employed in Health Diagnosing & Treating in Woodstock is 5.2%.
What is the Percentage of Population Employed in Health Diagnosing & Treating in Georgia?
Percentage of Population Employed in Health Diagnosing & Treating in Georgia is 5.7%.
What is the Percentage of Population Employed in Health Diagnosing & Treating in the United States?
Percentage of Population Employed in Health Diagnosing & Treating in the United States is 6.2%.