Pearson, GA Map & Demographics
Pearson Map
Pearson Overview
$21,903
PER CAPITA INCOME
$30,948
AVG FAMILY INCOME
$30,455
AVG HOUSEHOLD INCOME
18.2%
WAGE / INCOME GAP [ % ]
81.8¢/ $1
WAGE / INCOME GAP [ $ ]
0.43
INEQUALITY / GINI INDEX
1,826
TOTAL POPULATION
902
MALE POPULATION
924
FEMALE POPULATION
97.62
MALES / 100 FEMALES
102.44
FEMALES / 100 MALES
34.9
MEDIAN AGE
3.1
AVG FAMILY SIZE
2.5
AVG HOUSEHOLD SIZE
922
LABOR FORCE [ PEOPLE ]
63.6%
PERCENT IN LABOR FORCE
4.8%
UNEMPLOYMENT RATE
Pearson Zip Codes
Pearson Area Codes
Income in Pearson
Income Overview in Pearson
Per Capita Income in Pearson is $21,903, while median incomes of families and households are $30,948 and $30,455 respectively.
| Characteristic | Number | Measure |
| Per Capita Income | 1,826 | $21,903 |
| Median Family Income | 473 | $30,948 |
| Mean Family Income | 473 | $55,875 |
| Median Household Income | 714 | $30,455 |
| Mean Household Income | 714 | $48,276 |
| Income Deficit | 473 | $0 |
| Wage / Income Gap (%) | 1,826 | 18.21% |
| Wage / Income Gap ($) | 1,826 | 81.79¢ per $1 |
| Gini / Inequality Index | 1,826 | 0.43 |
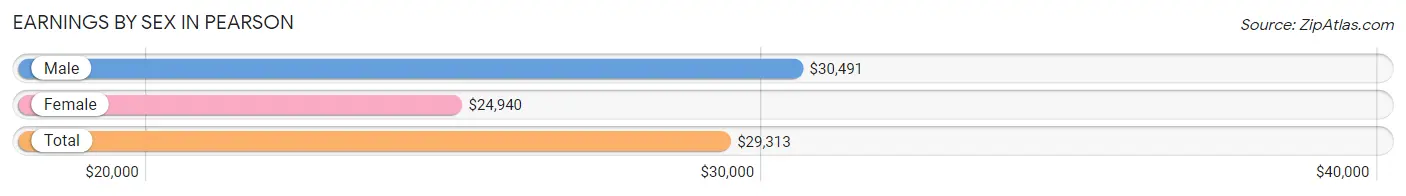
Earnings by Sex in Pearson
Average Earnings in Pearson are $29,313, $30,491 for men and $24,940 for women, a difference of 18.2%.
| Sex | Number | Average Earnings |
| Male | 578 (62.0%) | $30,491 |
| Female | 355 (38.1%) | $24,940 |
| Total | 933 (100.0%) | $29,313 |
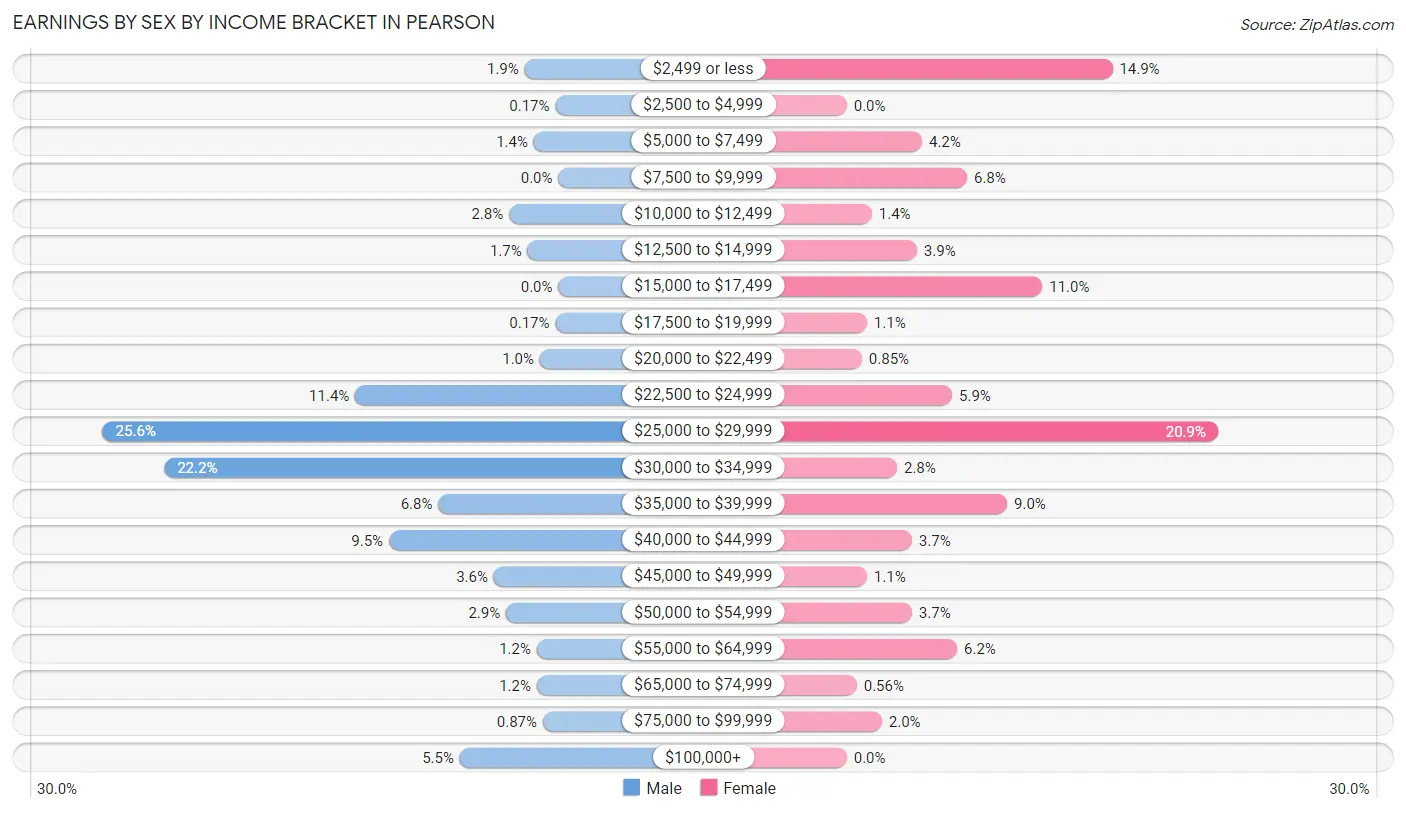
Earnings by Sex by Income Bracket in Pearson
The most common earnings brackets in Pearson are $25,000 to $29,999 for men (148 | 25.6%) and $25,000 to $29,999 for women (74 | 20.8%).
| Income | Male | Female |
| $2,499 or less | 11 (1.9%) | 53 (14.9%) |
| $2,500 to $4,999 | 1 (0.2%) | 0 (0.0%) |
| $5,000 to $7,499 | 8 (1.4%) | 15 (4.2%) |
| $7,500 to $9,999 | 0 (0.0%) | 24 (6.8%) |
| $10,000 to $12,499 | 16 (2.8%) | 5 (1.4%) |
| $12,500 to $14,999 | 10 (1.7%) | 14 (3.9%) |
| $15,000 to $17,499 | 0 (0.0%) | 39 (11.0%) |
| $17,500 to $19,999 | 1 (0.2%) | 4 (1.1%) |
| $20,000 to $22,499 | 6 (1.0%) | 3 (0.9%) |
| $22,500 to $24,999 | 66 (11.4%) | 21 (5.9%) |
| $25,000 to $29,999 | 148 (25.6%) | 74 (20.8%) |
| $30,000 to $34,999 | 128 (22.2%) | 10 (2.8%) |
| $35,000 to $39,999 | 39 (6.8%) | 32 (9.0%) |
| $40,000 to $44,999 | 55 (9.5%) | 13 (3.7%) |
| $45,000 to $49,999 | 21 (3.6%) | 4 (1.1%) |
| $50,000 to $54,999 | 17 (2.9%) | 13 (3.7%) |
| $55,000 to $64,999 | 7 (1.2%) | 22 (6.2%) |
| $65,000 to $74,999 | 7 (1.2%) | 2 (0.6%) |
| $75,000 to $99,999 | 5 (0.9%) | 7 (2.0%) |
| $100,000+ | 32 (5.5%) | 0 (0.0%) |
| Total | 578 (100.0%) | 355 (100.0%) |
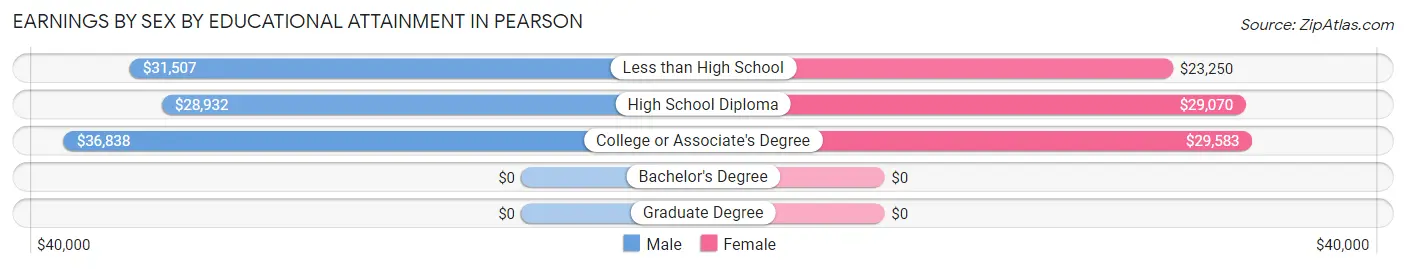
Earnings by Sex by Educational Attainment in Pearson
Average earnings in Pearson are $30,826 for men and $28,500 for women, a difference of 7.5%. Men with an educational attainment of college or associate's degree enjoy the highest average annual earnings of $36,838, while those with high school diploma education earn the least with $28,932. Women with an educational attainment of college or associate's degree earn the most with the average annual earnings of $29,583, while those with less than high school education have the smallest earnings of $23,250.
| Educational Attainment | Male Income | Female Income |
| Less than High School | $31,507 | $23,250 |
| High School Diploma | $28,932 | $29,070 |
| College or Associate's Degree | $36,838 | $29,583 |
| Bachelor's Degree | - | - |
| Graduate Degree | - | - |
| Total | $30,826 | $28,500 |
Family Income in Pearson
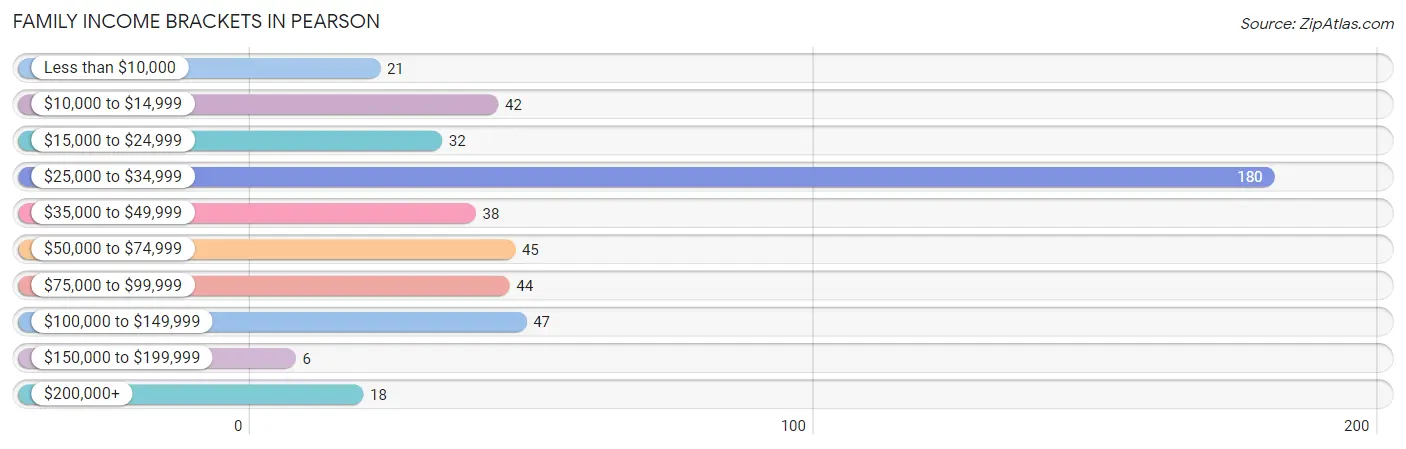
Family Income Brackets in Pearson
According to the Pearson family income data, there are 180 families falling into the $25,000 to $34,999 income range, which is the most common income bracket and makes up 38.1% of all families. Conversely, the $150,000 to $199,999 income bracket is the least frequent group with only 6 families (1.3%) belonging to this category.
| Income Bracket | # Families | % Families |
| Less than $10,000 | 21 | 4.4% |
| $10,000 to $14,999 | 42 | 8.9% |
| $15,000 to $24,999 | 32 | 6.8% |
| $25,000 to $34,999 | 180 | 38.1% |
| $35,000 to $49,999 | 38 | 8.0% |
| $50,000 to $74,999 | 45 | 9.5% |
| $75,000 to $99,999 | 44 | 9.3% |
| $100,000 to $149,999 | 47 | 9.9% |
| $150,000 to $199,999 | 6 | 1.3% |
| $200,000+ | 18 | 3.8% |
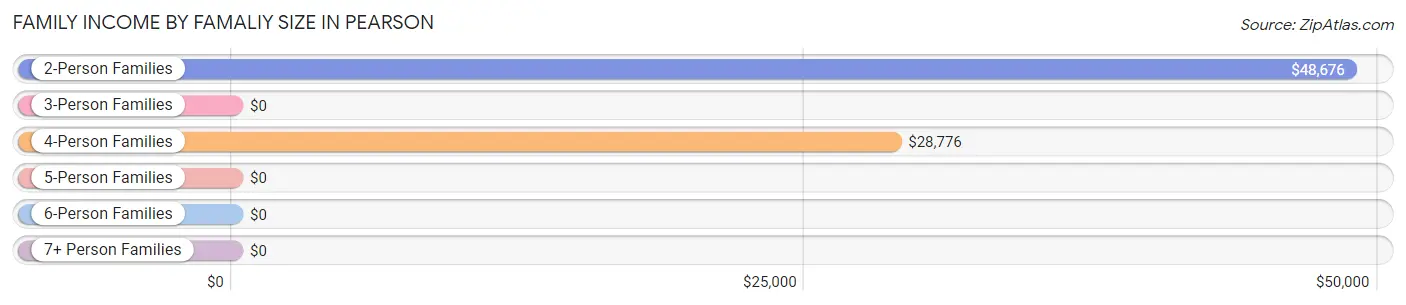
Family Income by Famaliy Size in Pearson
2-person families (104 | 22.0%) account for the highest median family income in Pearson with $48,676 per family, while 2-person families (104 | 22.0%) have the highest median income of $24,338 per family member.
| Income Bracket | # Families | Median Income |
| 2-Person Families | 104 (22.0%) | $48,676 |
| 3-Person Families | 188 (39.8%) | $0 |
| 4-Person Families | 132 (27.9%) | $28,776 |
| 5-Person Families | 33 (7.0%) | $0 |
| 6-Person Families | 16 (3.4%) | $0 |
| 7+ Person Families | 0 (0.0%) | $0 |
| Total | 473 (100.0%) | $30,948 |
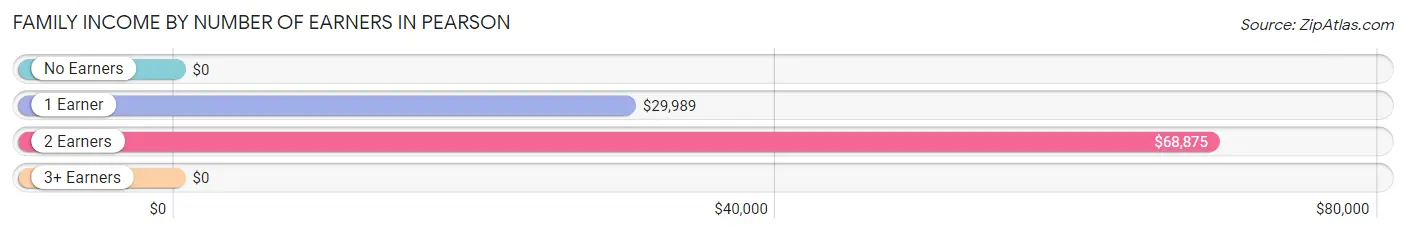
Family Income by Number of Earners in Pearson
| Number of Earners | # Families | Median Income |
| No Earners | 54 (11.4%) | $0 |
| 1 Earner | 259 (54.8%) | $29,989 |
| 2 Earners | 123 (26.0%) | $68,875 |
| 3+ Earners | 37 (7.8%) | $0 |
| Total | 473 (100.0%) | $30,948 |
Household Income in Pearson
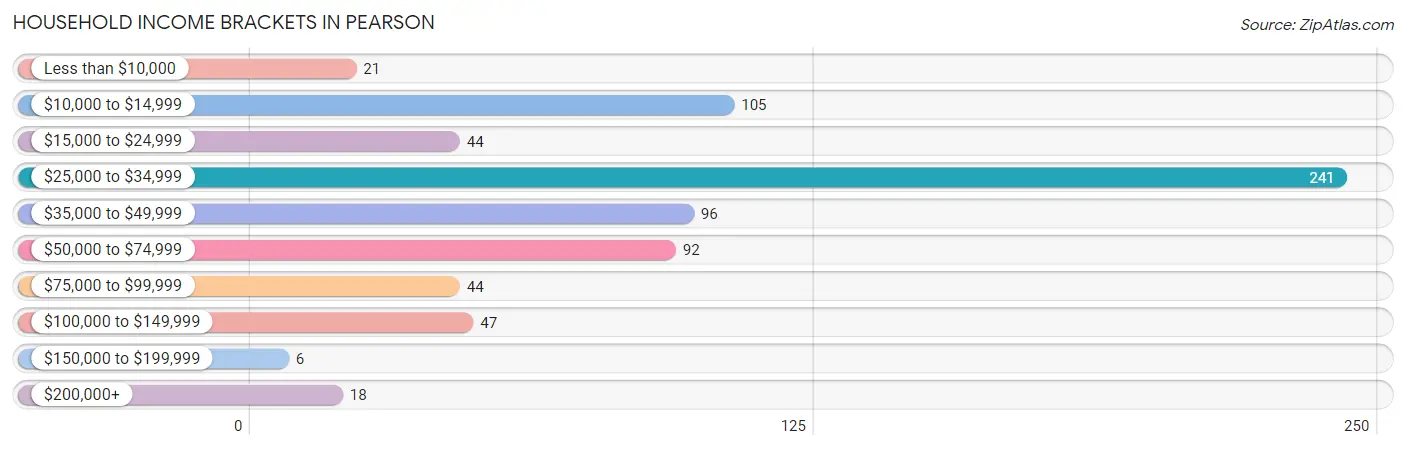
Household Income Brackets in Pearson
With 241 households falling in the category, the $25,000 to $34,999 income range is the most frequent in Pearson, accounting for 33.8% of all households. In contrast, only 6 households (0.8%) fall into the $150,000 to $199,999 income bracket, making it the least populous group.
| Income Bracket | # Households | % Households |
| Less than $10,000 | 21 | 2.9% |
| $10,000 to $14,999 | 105 | 14.7% |
| $15,000 to $24,999 | 44 | 6.2% |
| $25,000 to $34,999 | 241 | 33.8% |
| $35,000 to $49,999 | 96 | 13.4% |
| $50,000 to $74,999 | 92 | 12.9% |
| $75,000 to $99,999 | 44 | 6.2% |
| $100,000 to $149,999 | 47 | 6.6% |
| $150,000 to $199,999 | 6 | 0.8% |
| $200,000+ | 18 | 2.5% |
Household Income by Householder Age in Pearson
The median household income in Pearson is $30,455, with the highest median household income of $48,224 found in the 45 to 64 years age bracket for the primary householder. A total of 171 households (23.9%) fall into this category. Meanwhile, the 15 to 24 years age bracket for the primary householder has the lowest median household income of $0, with 16 households (2.2%) in this group.
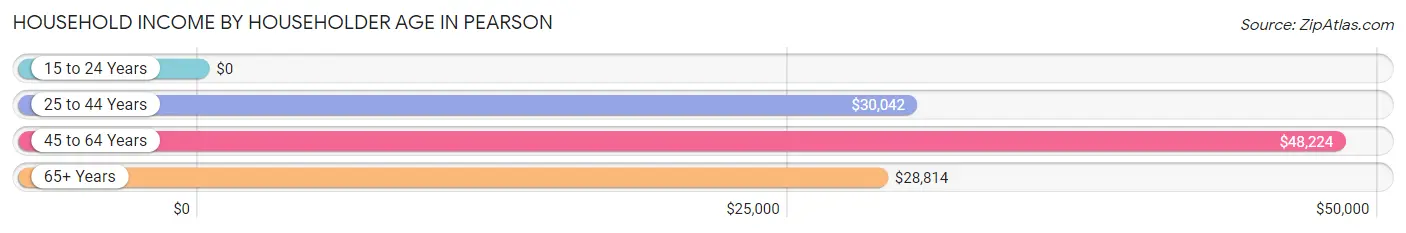
| Income Bracket | # Households | Median Income |
| 15 to 24 Years | 16 (2.2%) | $0 |
| 25 to 44 Years | 366 (51.3%) | $30,042 |
| 45 to 64 Years | 171 (23.9%) | $48,224 |
| 65+ Years | 161 (22.6%) | $28,814 |
| Total | 714 (100.0%) | $30,455 |
Poverty in Pearson
Income Below Poverty by Sex and Age in Pearson
With 41.0% poverty level for males and 33.1% for females among the residents of Pearson, under 5 year old males and 12 to 14 year old females are the most vulnerable to poverty, with 40 males (100.0%) and 34 females (100.0%) in their respective age groups living below the poverty level.
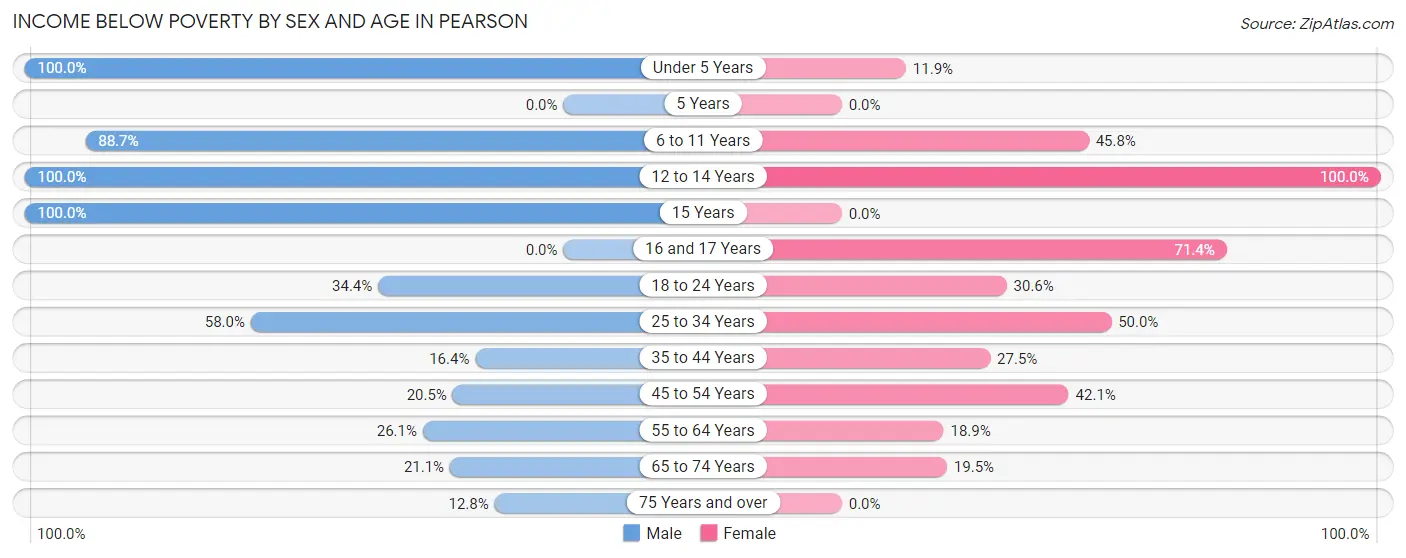
| Age Bracket | Male | Female |
| Under 5 Years | 40 (100.0%) | 15 (11.9%) |
| 5 Years | 0 (0.0%) | 0 (0.0%) |
| 6 to 11 Years | 63 (88.7%) | 22 (45.8%) |
| 12 to 14 Years | 36 (100.0%) | 34 (100.0%) |
| 15 Years | 10 (100.0%) | 0 (0.0%) |
| 16 and 17 Years | 0 (0.0%) | 30 (71.4%) |
| 18 to 24 Years | 22 (34.4%) | 26 (30.6%) |
| 25 to 34 Years | 94 (58.0%) | 84 (50.0%) |
| 35 to 44 Years | 36 (16.4%) | 38 (27.5%) |
| 45 to 54 Years | 23 (20.5%) | 24 (42.1%) |
| 55 to 64 Years | 24 (26.1%) | 17 (18.9%) |
| 65 to 74 Years | 4 (21.0%) | 16 (19.5%) |
| 75 Years and over | 6 (12.8%) | 0 (0.0%) |
| Total | 358 (41.0%) | 306 (33.1%) |
Income Above Poverty by Sex and Age in Pearson
According to the poverty statistics in Pearson, males aged 75 years and over and females aged 5 years are the age groups that are most secure financially, with 87.2% of males and 100.0% of females in these age groups living above the poverty line.
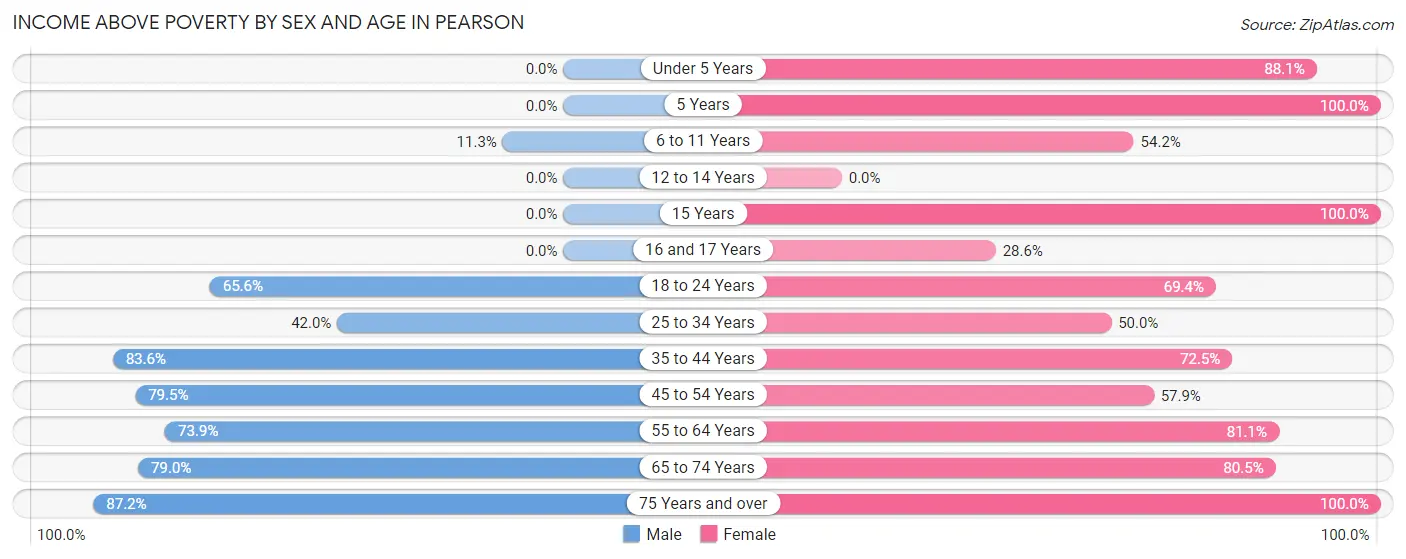
| Age Bracket | Male | Female |
| Under 5 Years | 0 (0.0%) | 111 (88.1%) |
| 5 Years | 0 (0.0%) | 3 (100.0%) |
| 6 to 11 Years | 8 (11.3%) | 26 (54.2%) |
| 12 to 14 Years | 0 (0.0%) | 0 (0.0%) |
| 15 Years | 0 (0.0%) | 9 (100.0%) |
| 16 and 17 Years | 0 (0.0%) | 12 (28.6%) |
| 18 to 24 Years | 42 (65.6%) | 59 (69.4%) |
| 25 to 34 Years | 68 (42.0%) | 84 (50.0%) |
| 35 to 44 Years | 184 (83.6%) | 100 (72.5%) |
| 45 to 54 Years | 89 (79.5%) | 33 (57.9%) |
| 55 to 64 Years | 68 (73.9%) | 73 (81.1%) |
| 65 to 74 Years | 15 (78.9%) | 66 (80.5%) |
| 75 Years and over | 41 (87.2%) | 42 (100.0%) |
| Total | 515 (59.0%) | 618 (66.9%) |
Income Below Poverty Among Married-Couple Families in Pearson
The poverty statistics for married-couple families in Pearson show that 38.2% or 142 of the total 372 families live below the poverty line. Families with 3 or 4 children have the highest poverty rate of 73.9%, comprising of 34 families. On the other hand, families with no children have the lowest poverty rate of 7.5%, which includes 10 families.
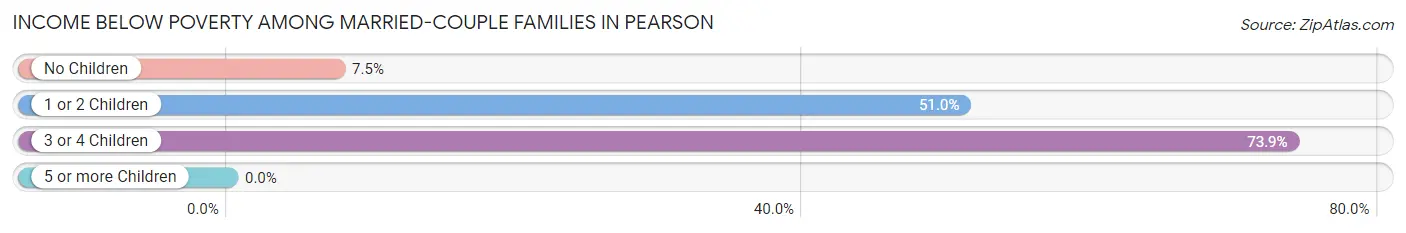
| Children | Above Poverty | Below Poverty |
| No Children | 124 (92.5%) | 10 (7.5%) |
| 1 or 2 Children | 94 (49.0%) | 98 (51.0%) |
| 3 or 4 Children | 12 (26.1%) | 34 (73.9%) |
| 5 or more Children | 0 (0.0%) | 0 (0.0%) |
| Total | 230 (61.8%) | 142 (38.2%) |
Income Below Poverty Among Single-Parent Households in Pearson
According to the poverty data in Pearson, 50.0% or 6 single-father households and 70.8% or 63 single-mother households are living below the poverty line. Among single-father households, those with no children have the highest poverty rate, with 6 households (50.0%) experiencing poverty. Likewise, among single-mother households, those with 1 or 2 children have the highest poverty rate, with 63 households (91.3%) falling below the poverty line.
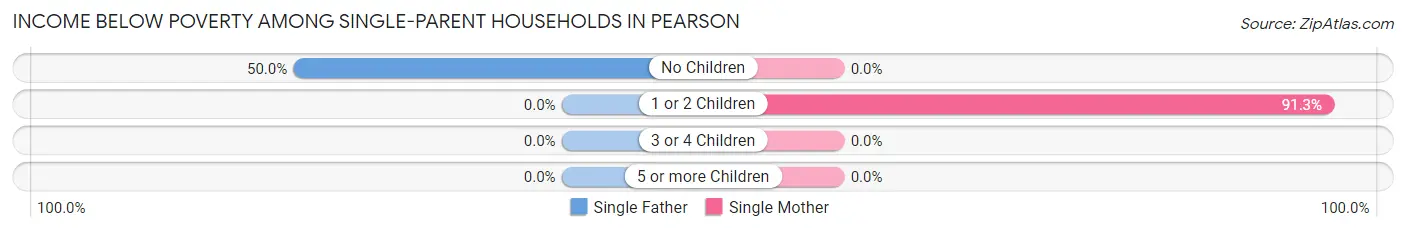
| Children | Single Father | Single Mother |
| No Children | 6 (50.0%) | 0 (0.0%) |
| 1 or 2 Children | 0 (0.0%) | 63 (91.3%) |
| 3 or 4 Children | 0 (0.0%) | 0 (0.0%) |
| 5 or more Children | 0 (0.0%) | 0 (0.0%) |
| Total | 6 (50.0%) | 63 (70.8%) |
Income Below Poverty Among Married-Couple vs Single-Parent Households in Pearson
The poverty data for Pearson shows that 142 of the married-couple family households (38.2%) and 69 of the single-parent households (68.3%) are living below the poverty level. Within the married-couple family households, those with 3 or 4 children have the highest poverty rate, with 34 households (73.9%) falling below the poverty line. Among the single-parent households, those with 1 or 2 children have the highest poverty rate, with 63 household (91.3%) living below poverty.
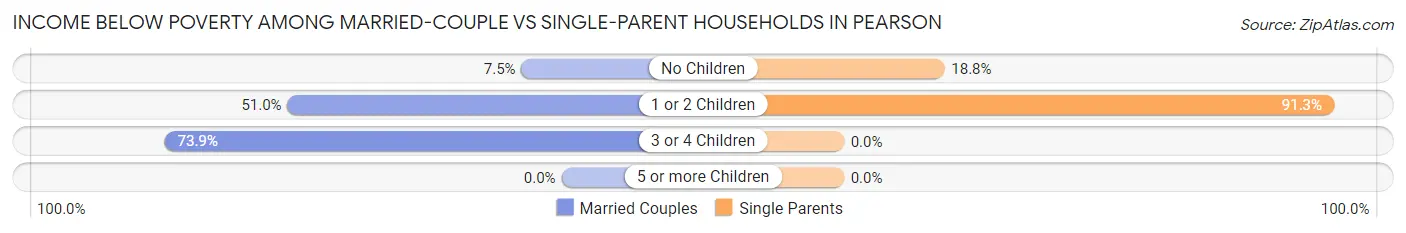
| Children | Married-Couple Families | Single-Parent Households |
| No Children | 10 (7.5%) | 6 (18.8%) |
| 1 or 2 Children | 98 (51.0%) | 63 (91.3%) |
| 3 or 4 Children | 34 (73.9%) | 0 (0.0%) |
| 5 or more Children | 0 (0.0%) | 0 (0.0%) |
| Total | 142 (38.2%) | 69 (68.3%) |
Race in Pearson
The most populous races in Pearson are Hispanic or Latino (744 | 40.7%), White / Caucasian (714 | 39.1%), and Black / African American (579 | 31.7%).
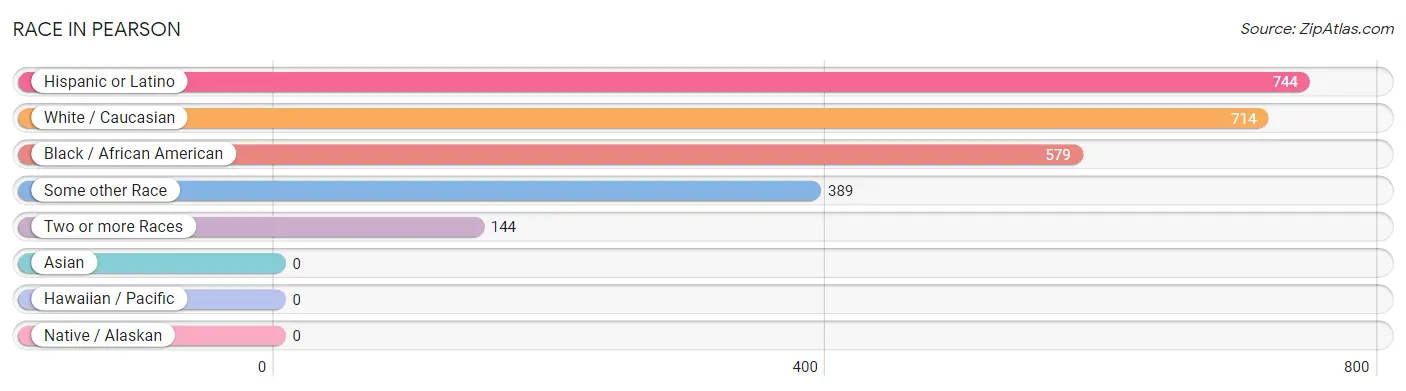
| Race | # Population | % Population |
| Asian | 0 | 0.0% |
| Black / African American | 579 | 31.7% |
| Hawaiian / Pacific | 0 | 0.0% |
| Hispanic or Latino | 744 | 40.7% |
| Native / Alaskan | 0 | 0.0% |
| White / Caucasian | 714 | 39.1% |
| Two or more Races | 144 | 7.9% |
| Some other Race | 389 | 21.3% |
| Total | 1,826 | 100.0% |
Ancestry in Pearson
The most populous ancestries reported in Pearson are Mexican (655 | 35.9%), Central American (89 | 4.9%), Honduran (80 | 4.4%), Irish (70 | 3.8%), and American (69 | 3.8%), together accounting for 52.7% of all Pearson residents.
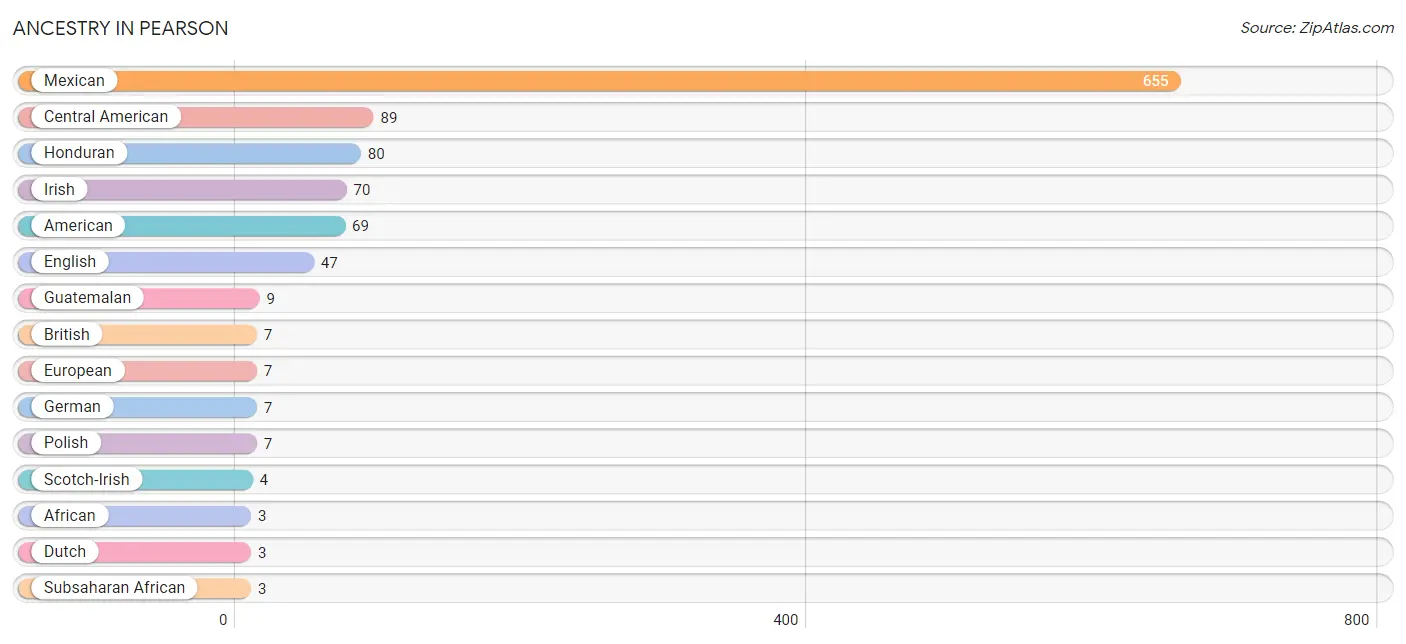
| Ancestry | # Population | % Population |
| African | 3 | 0.2% |
| American | 69 | 3.8% |
| British | 7 | 0.4% |
| Central American | 89 | 4.9% |
| Dutch | 3 | 0.2% |
| English | 47 | 2.6% |
| European | 7 | 0.4% |
| German | 7 | 0.4% |
| Guatemalan | 9 | 0.5% |
| Honduran | 80 | 4.4% |
| Irish | 70 | 3.8% |
| Mexican | 655 | 35.9% |
| Polish | 7 | 0.4% |
| Scotch-Irish | 4 | 0.2% |
| Subsaharan African | 3 | 0.2% | View All 15 Rows |
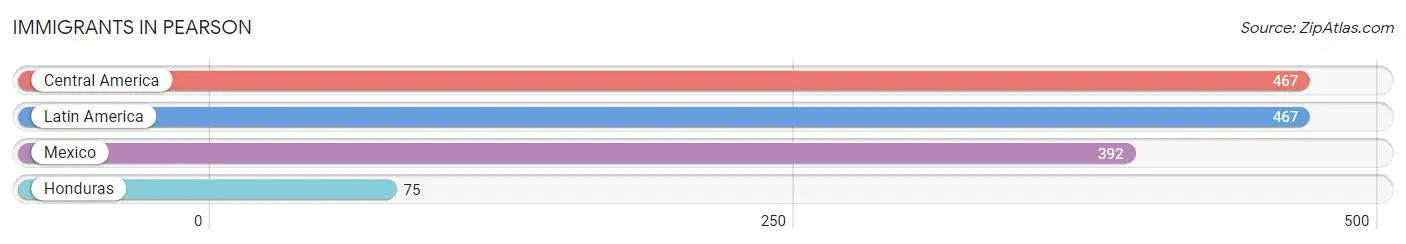
Immigrants in Pearson
The most numerous immigrant groups reported in Pearson came from Central America (467 | 25.6%), Latin America (467 | 25.6%), Mexico (392 | 21.5%), and Honduras (75 | 4.1%), together accounting for 76.7% of all Pearson residents.
| Immigration Origin | # Population | % Population |
| Central America | 467 | 25.6% |
| Honduras | 75 | 4.1% |
| Latin America | 467 | 25.6% |
| Mexico | 392 | 21.5% | View All 4 Rows |
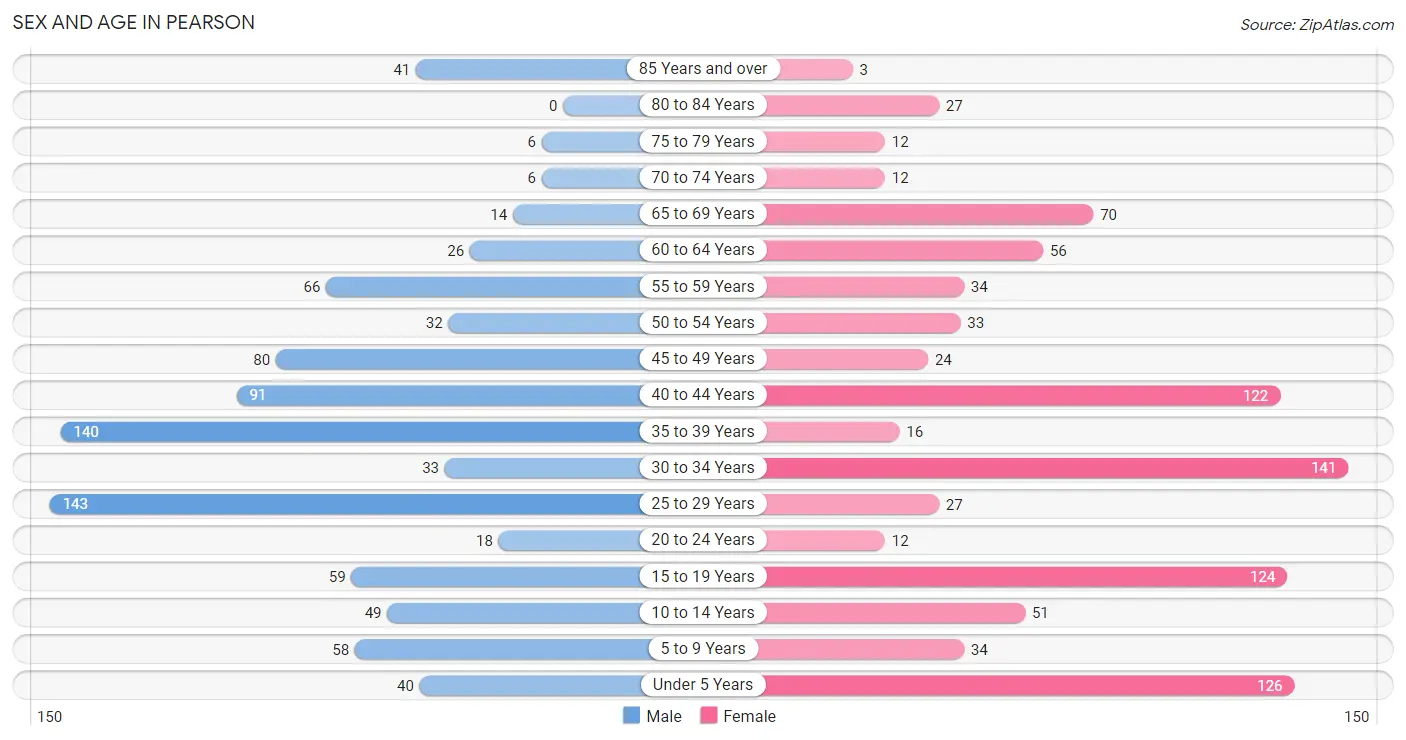
Sex and Age in Pearson
Sex and Age in Pearson
The most populous age groups in Pearson are 25 to 29 Years (143 | 15.9%) for men and 30 to 34 Years (141 | 15.3%) for women.
| Age Bracket | Male | Female |
| Under 5 Years | 40 (4.4%) | 126 (13.6%) |
| 5 to 9 Years | 58 (6.4%) | 34 (3.7%) |
| 10 to 14 Years | 49 (5.4%) | 51 (5.5%) |
| 15 to 19 Years | 59 (6.5%) | 124 (13.4%) |
| 20 to 24 Years | 18 (2.0%) | 12 (1.3%) |
| 25 to 29 Years | 143 (15.9%) | 27 (2.9%) |
| 30 to 34 Years | 33 (3.7%) | 141 (15.3%) |
| 35 to 39 Years | 140 (15.5%) | 16 (1.7%) |
| 40 to 44 Years | 91 (10.1%) | 122 (13.2%) |
| 45 to 49 Years | 80 (8.9%) | 24 (2.6%) |
| 50 to 54 Years | 32 (3.5%) | 33 (3.6%) |
| 55 to 59 Years | 66 (7.3%) | 34 (3.7%) |
| 60 to 64 Years | 26 (2.9%) | 56 (6.1%) |
| 65 to 69 Years | 14 (1.5%) | 70 (7.6%) |
| 70 to 74 Years | 6 (0.7%) | 12 (1.3%) |
| 75 to 79 Years | 6 (0.7%) | 12 (1.3%) |
| 80 to 84 Years | 0 (0.0%) | 27 (2.9%) |
| 85 Years and over | 41 (4.5%) | 3 (0.3%) |
| Total | 902 (100.0%) | 924 (100.0%) |
Families and Households in Pearson
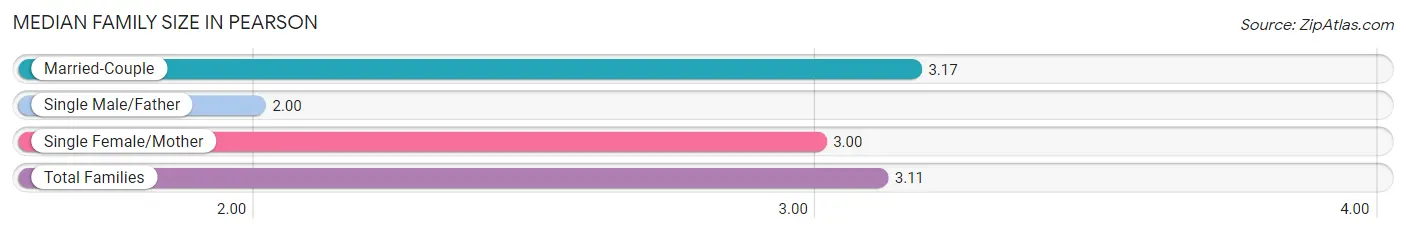
Median Family Size in Pearson
The median family size in Pearson is 3.11 persons per family, with married-couple families (372 | 78.6%) accounting for the largest median family size of 3.17 persons per family. On the other hand, single male/father families (12 | 2.5%) represent the smallest median family size with 2.00 persons per family.
| Family Type | # Families | Family Size |
| Married-Couple | 372 (78.6%) | 3.17 |
| Single Male/Father | 12 (2.5%) | 2.00 |
| Single Female/Mother | 89 (18.8%) | 3.00 |
| Total Families | 473 (100.0%) | 3.11 |
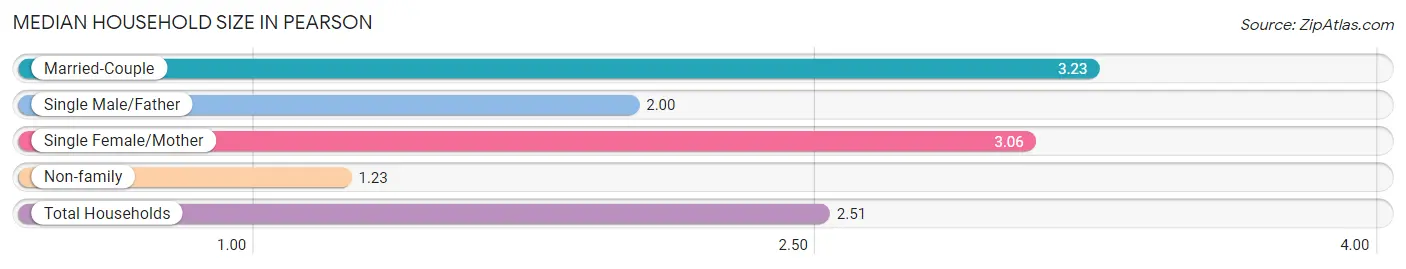
Median Household Size in Pearson
The median household size in Pearson is 2.51 persons per household, with married-couple households (372 | 52.1%) accounting for the largest median household size of 3.23 persons per household. non-family households (241 | 33.8%) represent the smallest median household size with 1.23 persons per household.
| Household Type | # Households | Household Size |
| Married-Couple | 372 (52.1%) | 3.23 |
| Single Male/Father | 12 (1.7%) | 2.00 |
| Single Female/Mother | 89 (12.5%) | 3.06 |
| Non-family | 241 (33.8%) | 1.23 |
| Total Households | 714 (100.0%) | 2.51 |
Household Size by Marriage Status in Pearson
Out of a total of 714 households in Pearson, 473 (66.2%) are family households, while 241 (33.8%) are nonfamily households. The most numerous type of family households are 3-person households, comprising 194, and the most common type of nonfamily households are 1-person households, comprising 188.
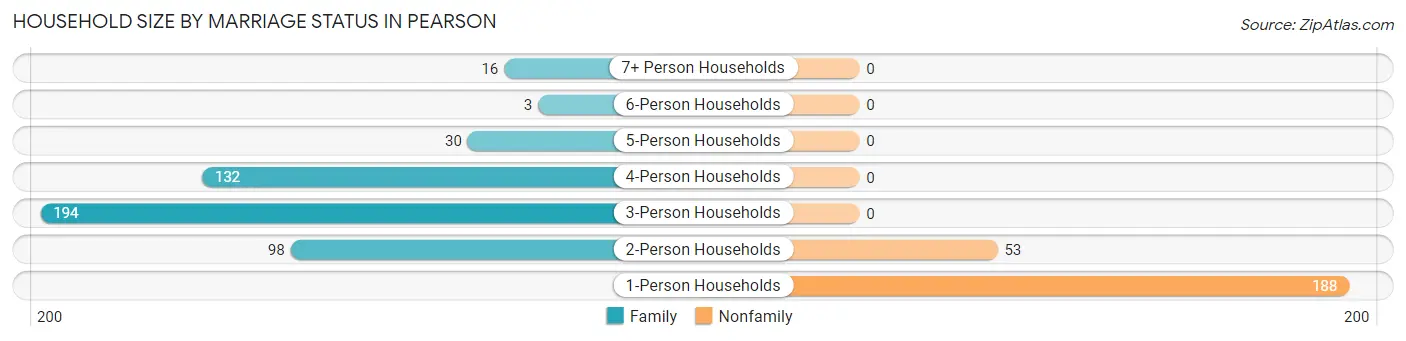
| Household Size | Family Households | Nonfamily Households |
| 1-Person Households | - | 188 (26.3%) |
| 2-Person Households | 98 (13.7%) | 53 (7.4%) |
| 3-Person Households | 194 (27.2%) | 0 (0.0%) |
| 4-Person Households | 132 (18.5%) | 0 (0.0%) |
| 5-Person Households | 30 (4.2%) | 0 (0.0%) |
| 6-Person Households | 3 (0.4%) | 0 (0.0%) |
| 7+ Person Households | 16 (2.2%) | 0 (0.0%) |
| Total | 473 (66.2%) | 241 (33.8%) |
Female Fertility in Pearson
Fertility by Age in Pearson
Average fertility rate in Pearson is 55.0 births per 1,000 women. Women in the age bracket of 20 to 34 years have the highest fertility rate with 144.0 births per 1,000 women. Women in the age bracket of 20 to 34 years acount for 100.0% of all women with births.
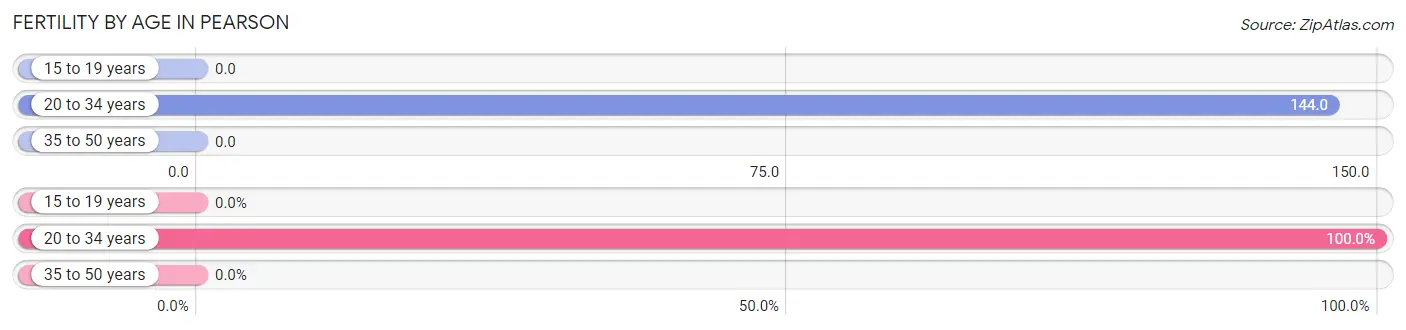
| Age Bracket | Women with Births | Births / 1,000 Women |
| 15 to 19 years | 0 (0.0%) | 0.0 |
| 20 to 34 years | 26 (100.0%) | 144.0 |
| 35 to 50 years | 0 (0.0%) | 0.0 |
| Total | 26 (100.0%) | 55.0 |
Fertility by Age by Marriage Status in Pearson
69.2% of women with births (26) in Pearson are married. The highest percentage of unmarried women with births falls into 20 to 34 years age bracket with 30.8% of them unmarried at the time of birth, while the lowest percentage of unmarried women with births belong to 20 to 34 years age bracket with 30.8% of them unmarried.
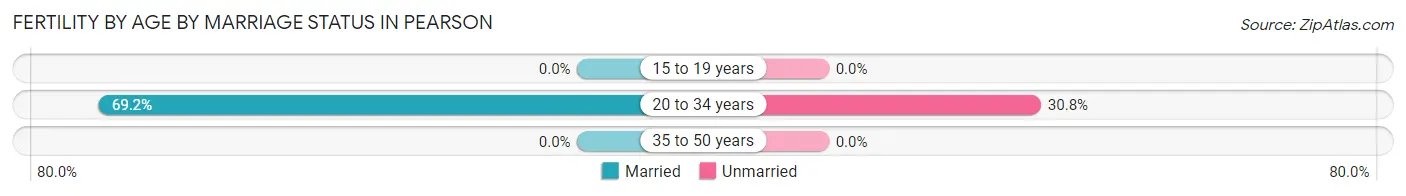
| Age Bracket | Married | Unmarried |
| 15 to 19 years | 0 (0.0%) | 0 (0.0%) |
| 20 to 34 years | 18 (69.2%) | 8 (30.8%) |
| 35 to 50 years | 0 (0.0%) | 0 (0.0%) |
| Total | 18 (69.2%) | 8 (30.8%) |
Fertility by Education in Pearson
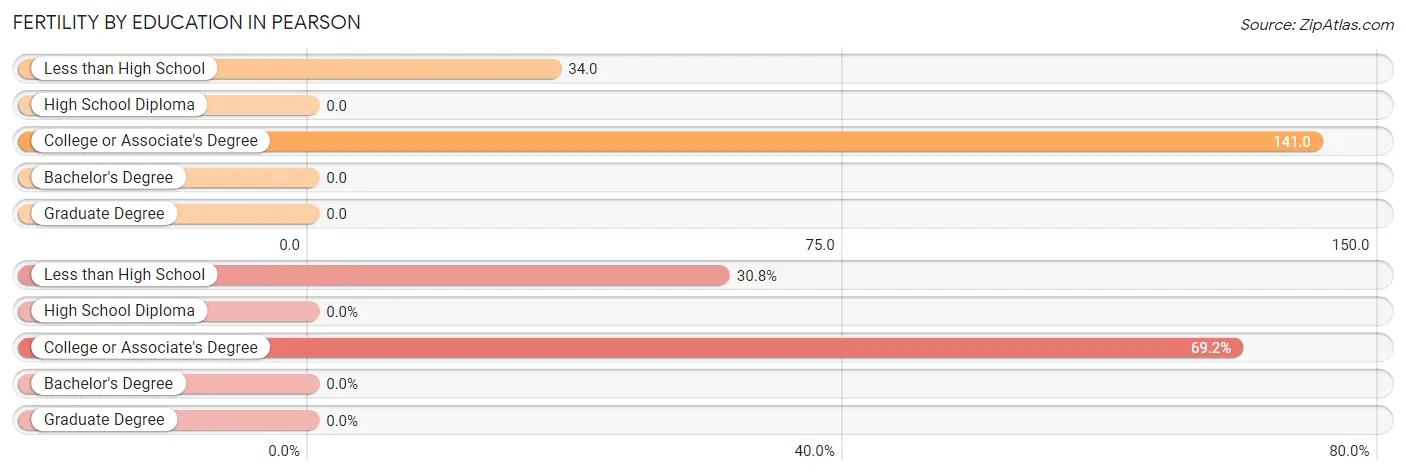
| Educational Attainment | Women with Births | Births / 1,000 Women |
| Less than High School | 8 (30.8%) | 34.0 |
| High School Diploma | 0 (0.0%) | 0.0 |
| College or Associate's Degree | 18 (69.2%) | 141.0 |
| Bachelor's Degree | 0 (0.0%) | 0.0 |
| Graduate Degree | 0 (0.0%) | 0.0 |
| Total | 26 (100.0%) | 55.0 |
Fertility by Education by Marriage Status in Pearson
30.8% of women with births in Pearson are unmarried. Women with the educational attainment of college or associate's degree are most likely to be married with 100.0% of them married at childbirth, while women with the educational attainment of less than high school are least likely to be married with 100.0% of them unmarried at childbirth.
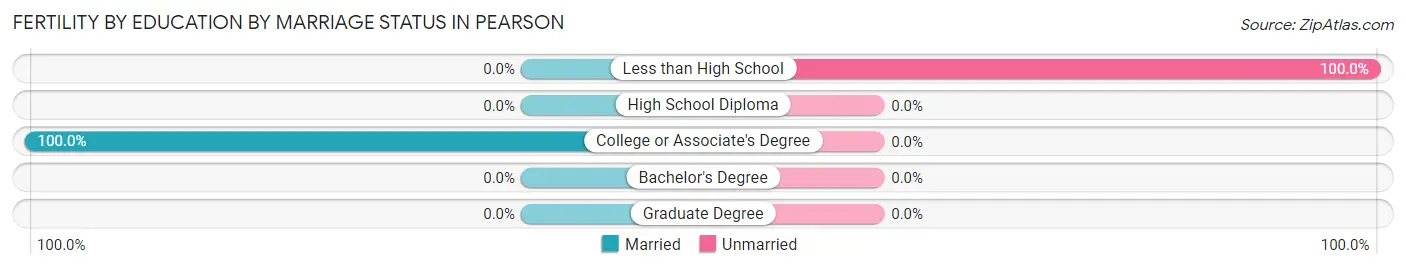
| Educational Attainment | Married | Unmarried |
| Less than High School | 0 (0.0%) | 8 (100.0%) |
| High School Diploma | 0 (0.0%) | 0 (0.0%) |
| College or Associate's Degree | 18 (100.0%) | 0 (0.0%) |
| Bachelor's Degree | 0 (0.0%) | 0 (0.0%) |
| Graduate Degree | 0 (0.0%) | 0 (0.0%) |
| Total | 18 (69.2%) | 8 (30.8%) |
Employment Characteristics in Pearson
Employment by Class of Employer in Pearson
Among the 874 employed individuals in Pearson, private company employees (696 | 79.6%), self-employed (not incorporated) (82 | 9.4%), and local government employees (55 | 6.3%) make up the most common classes of employment.
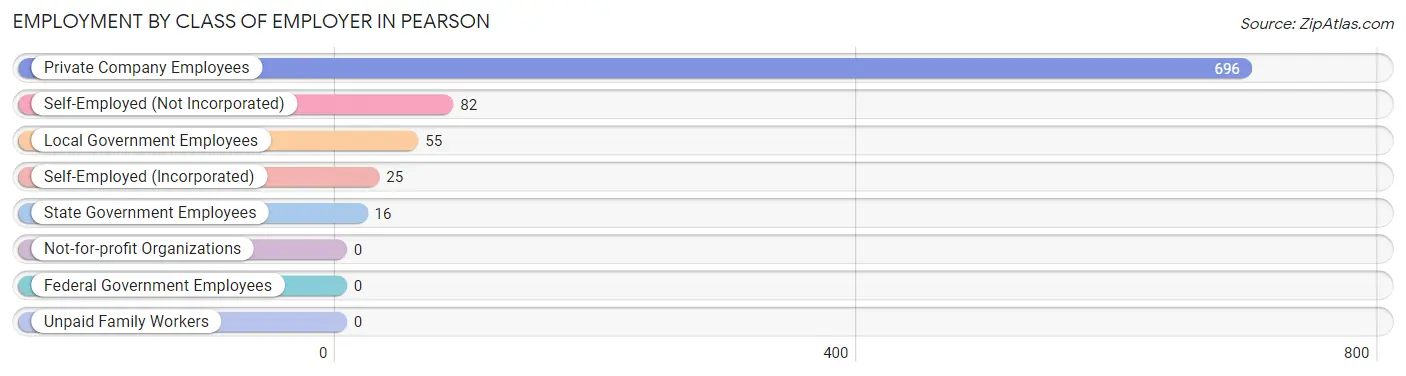
| Employer Class | # Employees | % Employees |
| Private Company Employees | 696 | 79.6% |
| Self-Employed (Incorporated) | 25 | 2.9% |
| Self-Employed (Not Incorporated) | 82 | 9.4% |
| Not-for-profit Organizations | 0 | 0.0% |
| Local Government Employees | 55 | 6.3% |
| State Government Employees | 16 | 1.8% |
| Federal Government Employees | 0 | 0.0% |
| Unpaid Family Workers | 0 | 0.0% |
| Total | 874 | 100.0% |
Employment Status by Age in Pearson
According to the labor force statistics for Pearson, out of the total population over 16 years of age (1,449), 63.6% or 922 individuals are in the labor force, with 4.8% or 44 of them unemployed. The age group with the highest labor force participation rate is 55 to 59 years, with 90.0% or 90 individuals in the labor force. Within the labor force, the 55 to 59 years age range has the highest percentage of unemployed individuals, with 18.9% or 17 of them being unemployed.
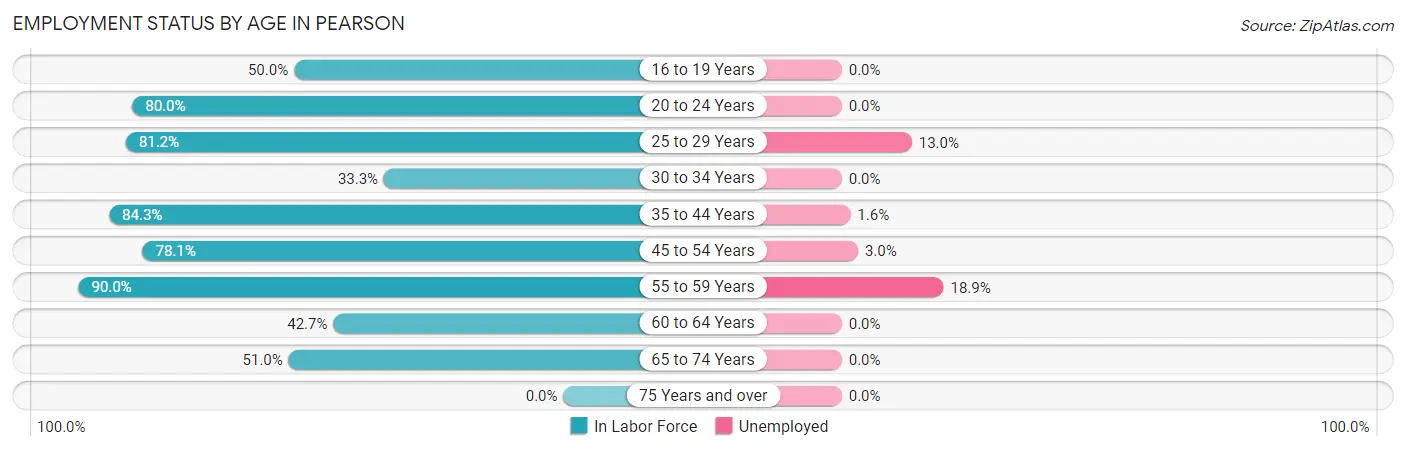
| Age Bracket | In Labor Force | Unemployed |
| 16 to 19 Years | 82 (50.0%) | 0 (0.0%) |
| 20 to 24 Years | 24 (80.0%) | 0 (0.0%) |
| 25 to 29 Years | 138 (81.2%) | 18 (13.0%) |
| 30 to 34 Years | 58 (33.3%) | 0 (0.0%) |
| 35 to 44 Years | 311 (84.3%) | 5 (1.6%) |
| 45 to 54 Years | 132 (78.1%) | 4 (3.0%) |
| 55 to 59 Years | 90 (90.0%) | 17 (18.9%) |
| 60 to 64 Years | 35 (42.7%) | 0 (0.0%) |
| 65 to 74 Years | 52 (51.0%) | 0 (0.0%) |
| 75 Years and over | 0 (0.0%) | 0 (0.0%) |
| Total | 922 (63.6%) | 44 (4.8%) |
Employment Status by Educational Attainment in Pearson
According to labor force statistics for Pearson, 71.8% of individuals (764) out of the total population between 25 and 64 years of age (1,064) are in the labor force, with 5.8% or 44 of them being unemployed. The group with the highest labor force participation rate are those with the educational attainment of bachelor's degree or higher, with 100.0% or 10 individuals in the labor force. Within the labor force, individuals with college / associate degree education have the highest percentage of unemployment, with 12.5% or 15 of them being unemployed.
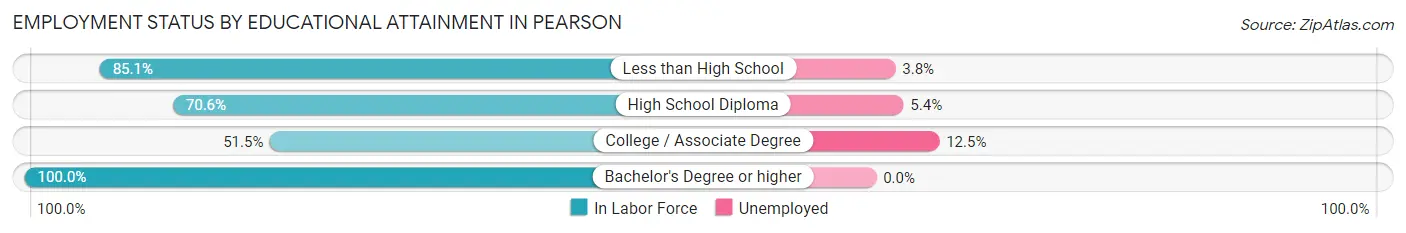
| Educational Attainment | In Labor Force | Unemployed |
| Less than High School | 320 (85.1%) | 14 (3.8%) |
| High School Diploma | 314 (70.6%) | 24 (5.4%) |
| College / Associate Degree | 120 (51.5%) | 29 (12.5%) |
| Bachelor's Degree or higher | 10 (100.0%) | 0 (0.0%) |
| Total | 764 (71.8%) | 62 (5.8%) |
Employment Occupations by Sex in Pearson
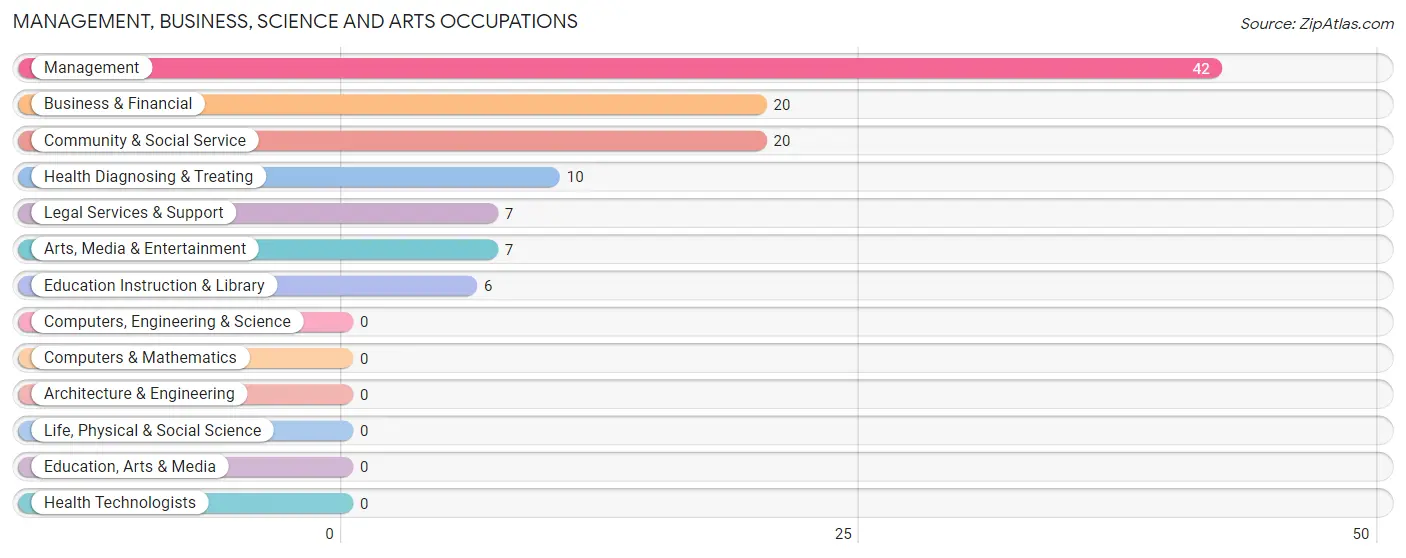
Management, Business, Science and Arts Occupations
The most common Management, Business, Science and Arts occupations in Pearson are Management (42 | 4.8%), Business & Financial (20 | 2.3%), Community & Social Service (20 | 2.3%), Health Diagnosing & Treating (10 | 1.1%), and Legal Services & Support (7 | 0.8%).
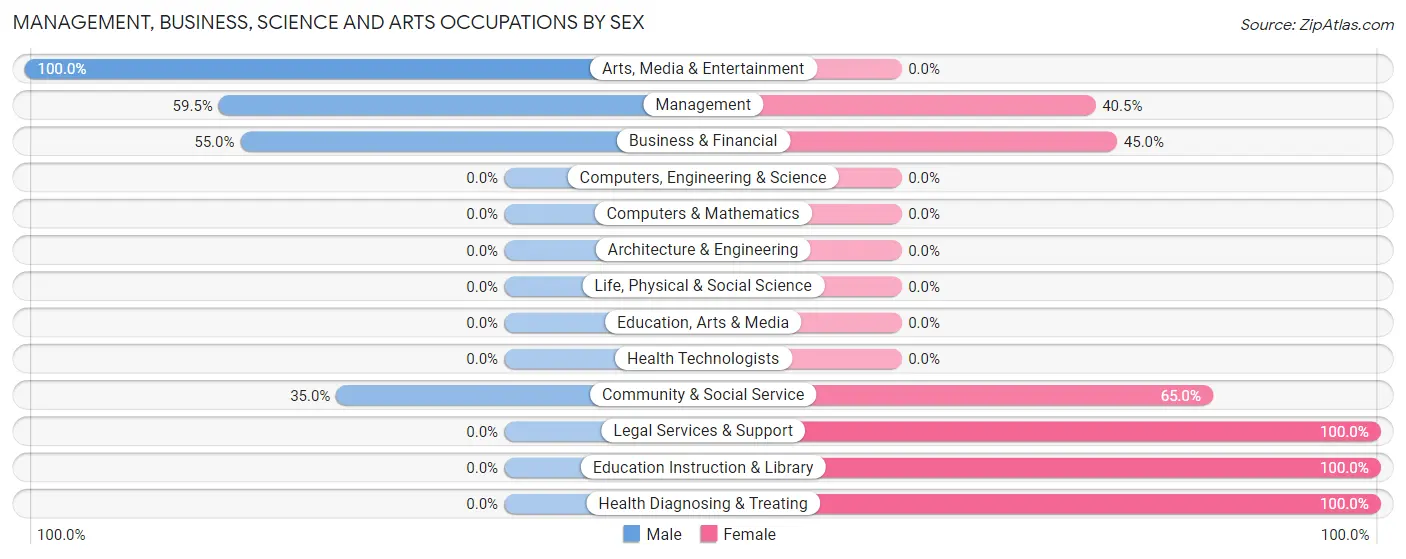
Management, Business, Science and Arts Occupations by Sex
Within the Management, Business, Science and Arts occupations in Pearson, the most male-oriented occupations are Arts, Media & Entertainment (100.0%), Management (59.5%), and Business & Financial (55.0%), while the most female-oriented occupations are Legal Services & Support (100.0%), Education Instruction & Library (100.0%), and Health Diagnosing & Treating (100.0%).
| Occupation | Male | Female |
| Management | 25 (59.5%) | 17 (40.5%) |
| Business & Financial | 11 (55.0%) | 9 (45.0%) |
| Computers, Engineering & Science | 0 (0.0%) | 0 (0.0%) |
| Computers & Mathematics | 0 (0.0%) | 0 (0.0%) |
| Architecture & Engineering | 0 (0.0%) | 0 (0.0%) |
| Life, Physical & Social Science | 0 (0.0%) | 0 (0.0%) |
| Community & Social Service | 7 (35.0%) | 13 (65.0%) |
| Education, Arts & Media | 0 (0.0%) | 0 (0.0%) |
| Legal Services & Support | 0 (0.0%) | 7 (100.0%) |
| Education Instruction & Library | 0 (0.0%) | 6 (100.0%) |
| Arts, Media & Entertainment | 7 (100.0%) | 0 (0.0%) |
| Health Diagnosing & Treating | 0 (0.0%) | 10 (100.0%) |
| Health Technologists | 0 (0.0%) | 0 (0.0%) |
| Total (Category) | 43 (46.7%) | 49 (53.3%) |
| Total (Overall) | 530 (60.4%) | 348 (39.6%) |
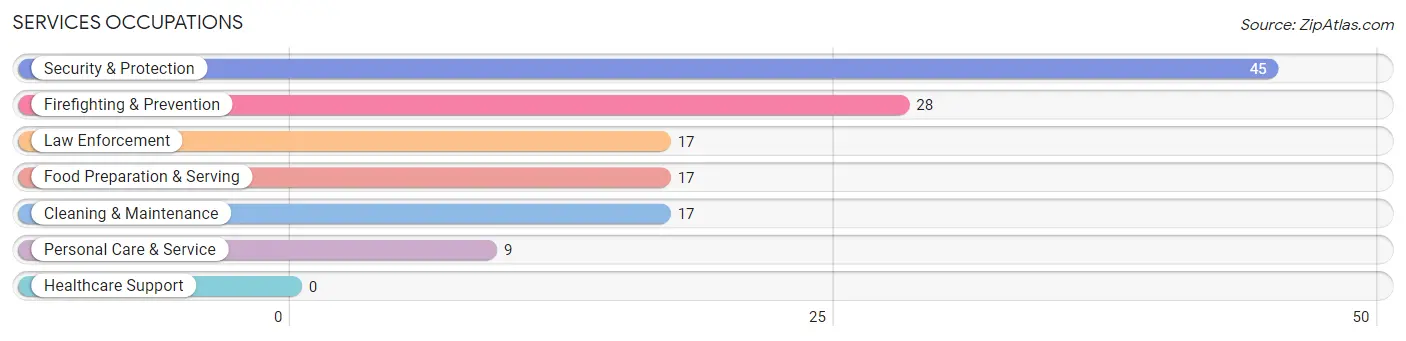
Services Occupations
The most common Services occupations in Pearson are Security & Protection (45 | 5.1%), Firefighting & Prevention (28 | 3.2%), Law Enforcement (17 | 1.9%), Food Preparation & Serving (17 | 1.9%), and Cleaning & Maintenance (17 | 1.9%).
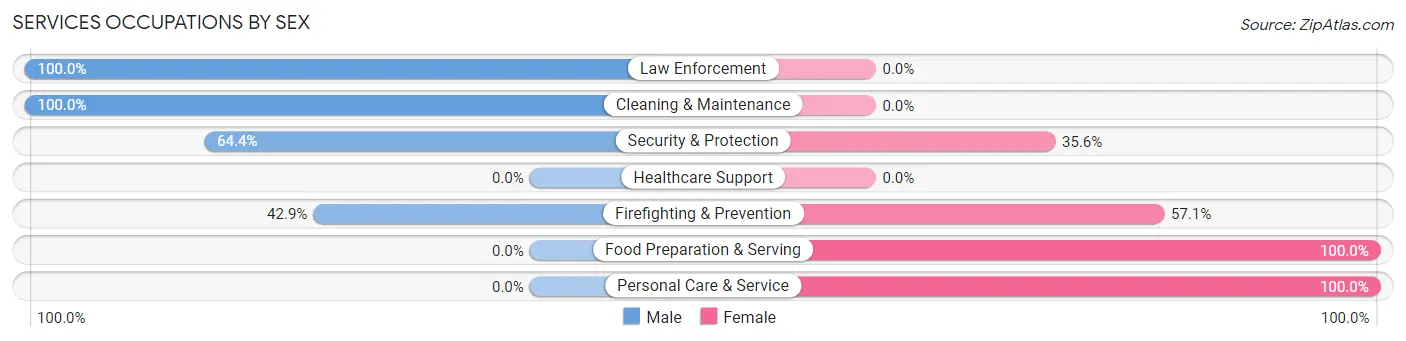
Services Occupations by Sex
Within the Services occupations in Pearson, the most male-oriented occupations are Law Enforcement (100.0%), Cleaning & Maintenance (100.0%), and Security & Protection (64.4%), while the most female-oriented occupations are Food Preparation & Serving (100.0%), Personal Care & Service (100.0%), and Firefighting & Prevention (57.1%).
| Occupation | Male | Female |
| Healthcare Support | 0 (0.0%) | 0 (0.0%) |
| Security & Protection | 29 (64.4%) | 16 (35.6%) |
| Firefighting & Prevention | 12 (42.9%) | 16 (57.1%) |
| Law Enforcement | 17 (100.0%) | 0 (0.0%) |
| Food Preparation & Serving | 0 (0.0%) | 17 (100.0%) |
| Cleaning & Maintenance | 17 (100.0%) | 0 (0.0%) |
| Personal Care & Service | 0 (0.0%) | 9 (100.0%) |
| Total (Category) | 46 (52.3%) | 42 (47.7%) |
| Total (Overall) | 530 (60.4%) | 348 (39.6%) |
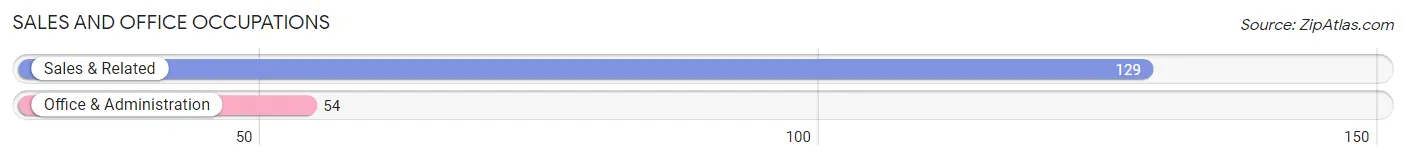
Sales and Office Occupations
The most common Sales and Office occupations in Pearson are Sales & Related (129 | 14.7%), and Office & Administration (54 | 6.1%).
Sales and Office Occupations by Sex
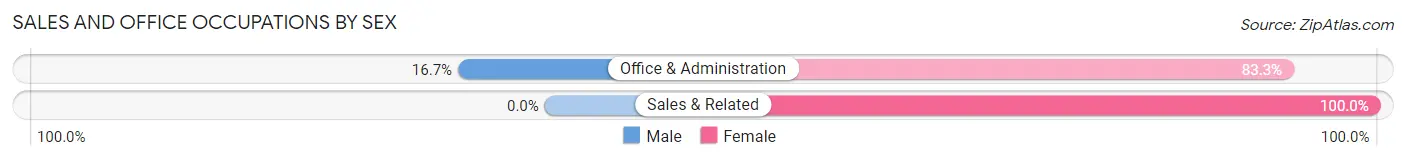
| Occupation | Male | Female |
| Sales & Related | 0 (0.0%) | 129 (100.0%) |
| Office & Administration | 9 (16.7%) | 45 (83.3%) |
| Total (Category) | 9 (4.9%) | 174 (95.1%) |
| Total (Overall) | 530 (60.4%) | 348 (39.6%) |
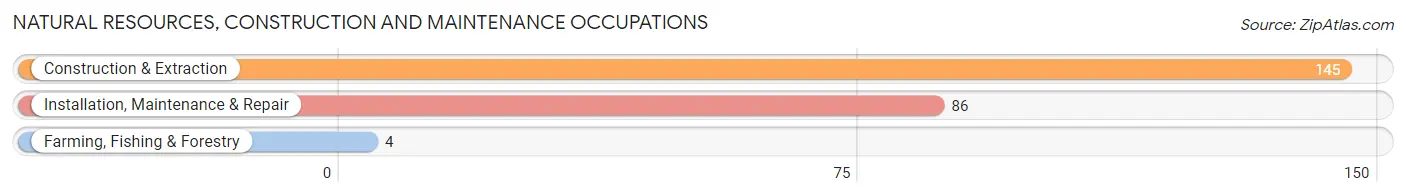
Natural Resources, Construction and Maintenance Occupations
The most common Natural Resources, Construction and Maintenance occupations in Pearson are Construction & Extraction (145 | 16.5%), Installation, Maintenance & Repair (86 | 9.8%), and Farming, Fishing & Forestry (4 | 0.5%).
Natural Resources, Construction and Maintenance Occupations by Sex
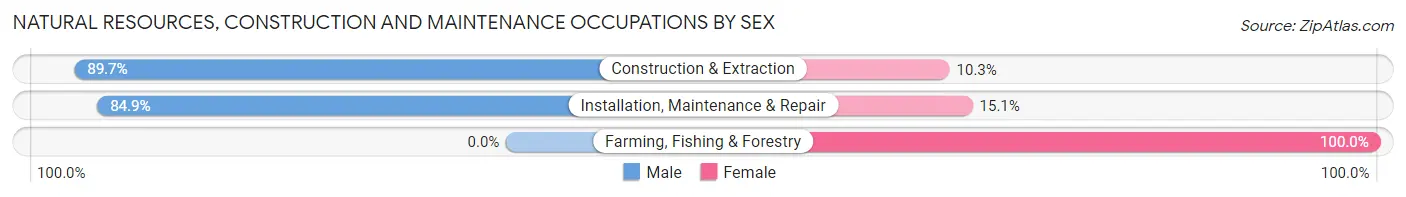
| Occupation | Male | Female |
| Farming, Fishing & Forestry | 0 (0.0%) | 4 (100.0%) |
| Construction & Extraction | 130 (89.7%) | 15 (10.3%) |
| Installation, Maintenance & Repair | 73 (84.9%) | 13 (15.1%) |
| Total (Category) | 203 (86.4%) | 32 (13.6%) |
| Total (Overall) | 530 (60.4%) | 348 (39.6%) |
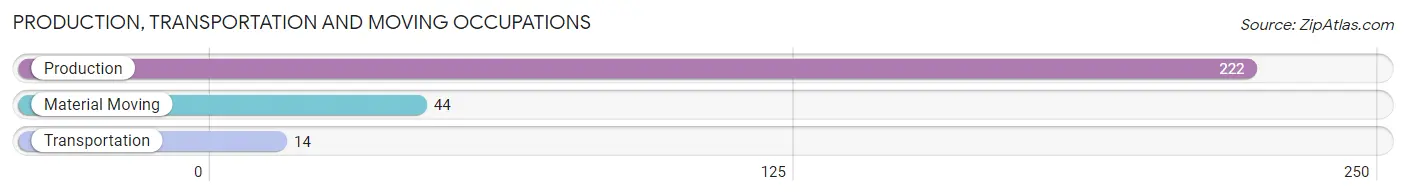
Production, Transportation and Moving Occupations
The most common Production, Transportation and Moving occupations in Pearson are Production (222 | 25.3%), Material Moving (44 | 5.0%), and Transportation (14 | 1.6%).
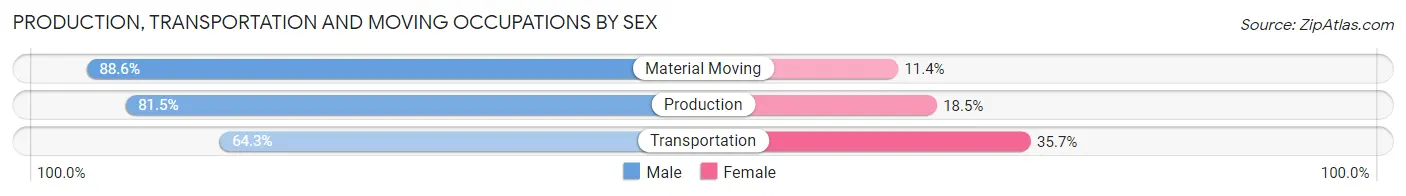
Production, Transportation and Moving Occupations by Sex
| Occupation | Male | Female |
| Production | 181 (81.5%) | 41 (18.5%) |
| Transportation | 9 (64.3%) | 5 (35.7%) |
| Material Moving | 39 (88.6%) | 5 (11.4%) |
| Total (Category) | 229 (81.8%) | 51 (18.2%) |
| Total (Overall) | 530 (60.4%) | 348 (39.6%) |
Employment Industries by Sex in Pearson
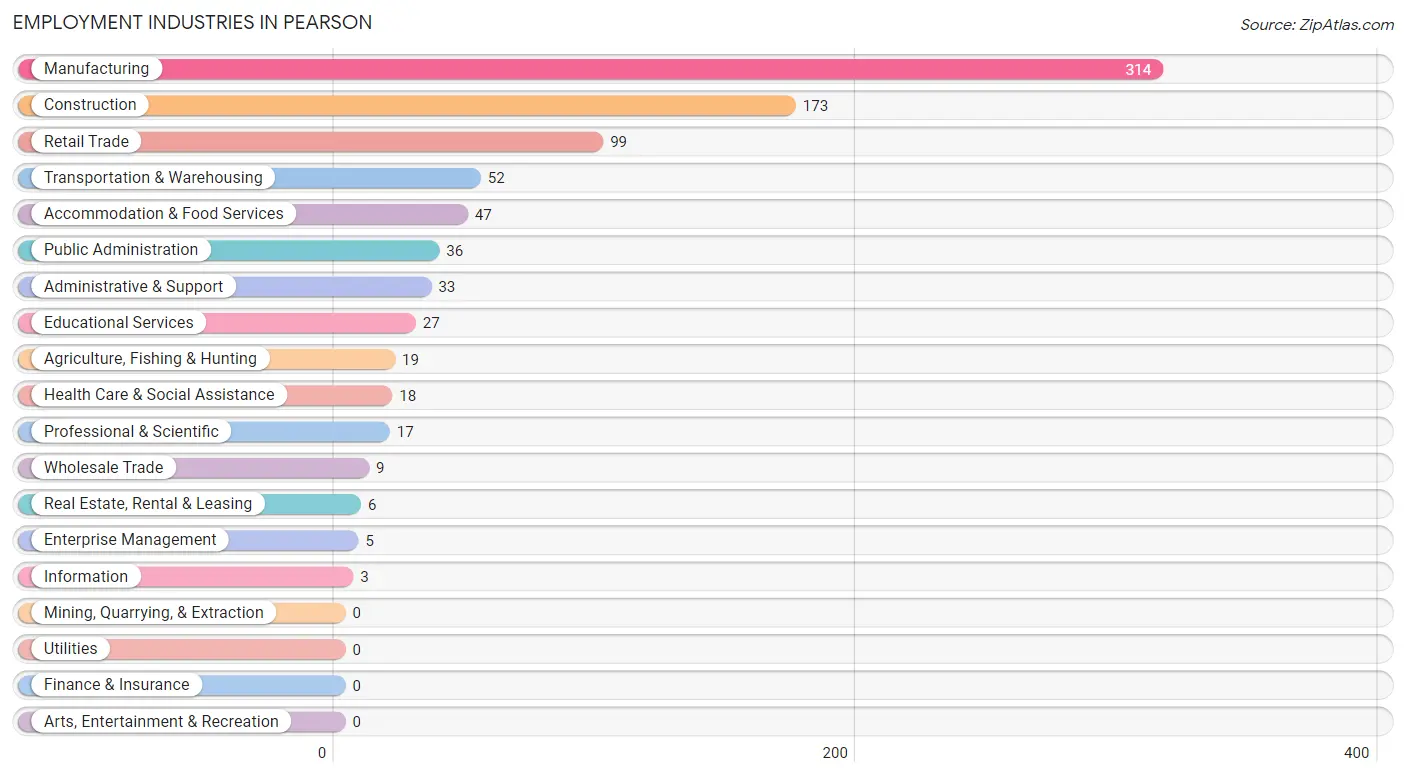
Employment Industries in Pearson
The major employment industries in Pearson include Manufacturing (314 | 35.8%), Construction (173 | 19.7%), Retail Trade (99 | 11.3%), Transportation & Warehousing (52 | 5.9%), and Accommodation & Food Services (47 | 5.3%).
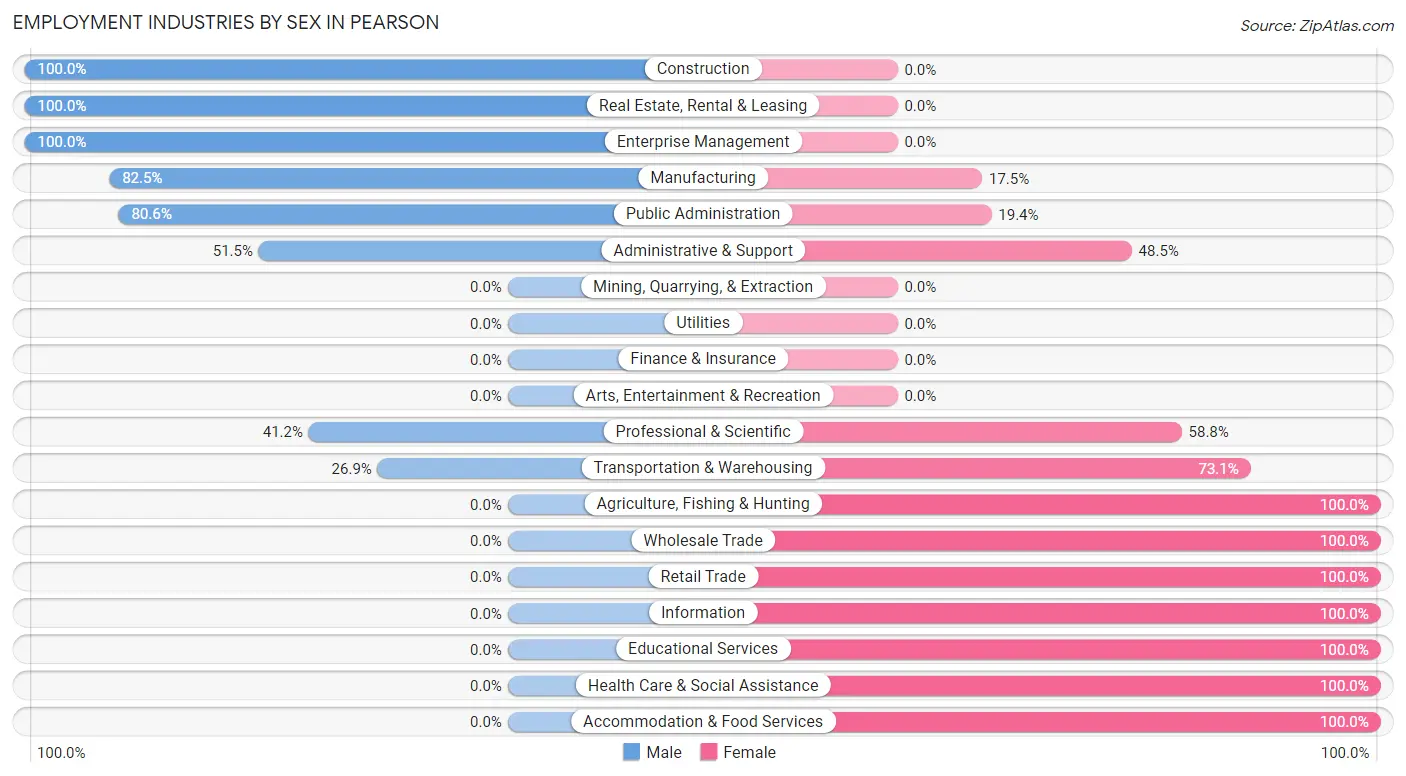
Employment Industries by Sex in Pearson
The Pearson industries that see more men than women are Construction (100.0%), Real Estate, Rental & Leasing (100.0%), and Enterprise Management (100.0%), whereas the industries that tend to have a higher number of women are Agriculture, Fishing & Hunting (100.0%), Wholesale Trade (100.0%), and Retail Trade (100.0%).
| Industry | Male | Female |
| Agriculture, Fishing & Hunting | 0 (0.0%) | 19 (100.0%) |
| Mining, Quarrying, & Extraction | 0 (0.0%) | 0 (0.0%) |
| Construction | 173 (100.0%) | 0 (0.0%) |
| Manufacturing | 259 (82.5%) | 55 (17.5%) |
| Wholesale Trade | 0 (0.0%) | 9 (100.0%) |
| Retail Trade | 0 (0.0%) | 99 (100.0%) |
| Transportation & Warehousing | 14 (26.9%) | 38 (73.1%) |
| Utilities | 0 (0.0%) | 0 (0.0%) |
| Information | 0 (0.0%) | 3 (100.0%) |
| Finance & Insurance | 0 (0.0%) | 0 (0.0%) |
| Real Estate, Rental & Leasing | 6 (100.0%) | 0 (0.0%) |
| Professional & Scientific | 7 (41.2%) | 10 (58.8%) |
| Enterprise Management | 5 (100.0%) | 0 (0.0%) |
| Administrative & Support | 17 (51.5%) | 16 (48.5%) |
| Educational Services | 0 (0.0%) | 27 (100.0%) |
| Health Care & Social Assistance | 0 (0.0%) | 18 (100.0%) |
| Arts, Entertainment & Recreation | 0 (0.0%) | 0 (0.0%) |
| Accommodation & Food Services | 0 (0.0%) | 47 (100.0%) |
| Public Administration | 29 (80.6%) | 7 (19.4%) |
| Total | 530 (60.4%) | 348 (39.6%) |
Education in Pearson
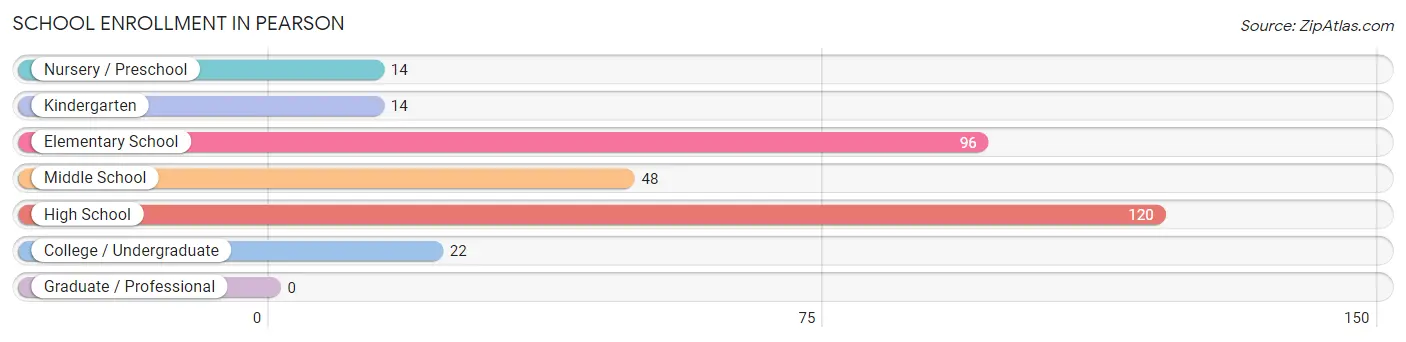
School Enrollment in Pearson
The most common levels of schooling among the 314 students in Pearson are high school (120 | 38.2%), elementary school (96 | 30.6%), and middle school (48 | 15.3%).
| School Level | # Students | % Students |
| Nursery / Preschool | 14 | 4.5% |
| Kindergarten | 14 | 4.5% |
| Elementary School | 96 | 30.6% |
| Middle School | 48 | 15.3% |
| High School | 120 | 38.2% |
| College / Undergraduate | 22 | 7.0% |
| Graduate / Professional | 0 | 0.0% |
| Total | 314 | 100.0% |
School Enrollment by Age by Funding Source in Pearson
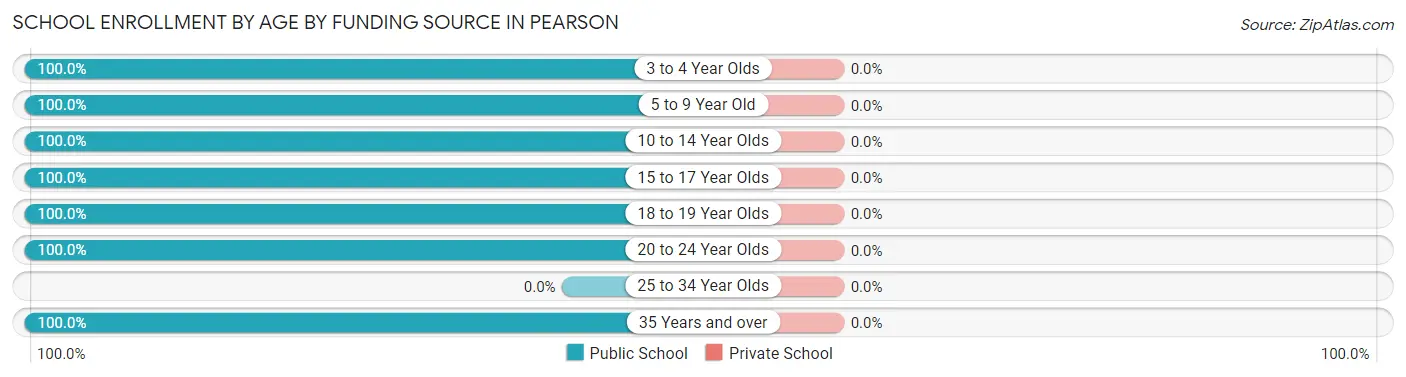
| Age Bracket | Public School | Private School |
| 3 to 4 Year Olds | 11 (100.0%) | 0 (0.0%) |
| 5 to 9 Year Old | 92 (100.0%) | 0 (0.0%) |
| 10 to 14 Year Olds | 100 (100.0%) | 0 (0.0%) |
| 15 to 17 Year Olds | 30 (100.0%) | 0 (0.0%) |
| 18 to 19 Year Olds | 59 (100.0%) | 0 (0.0%) |
| 20 to 24 Year Olds | 6 (100.0%) | 0 (0.0%) |
| 25 to 34 Year Olds | 0 (0.0%) | 0 (0.0%) |
| 35 Years and over | 16 (100.0%) | 0 (0.0%) |
| Total | 314 (100.0%) | 0 (0.0%) |
Educational Attainment by Field of Study in Pearson
Education (26 | 78.8%), arts & humanities (5 | 15.1%), and social sciences (2 | 6.1%) are the most common fields of study among 33 individuals in Pearson who have obtained a bachelor's degree or higher.
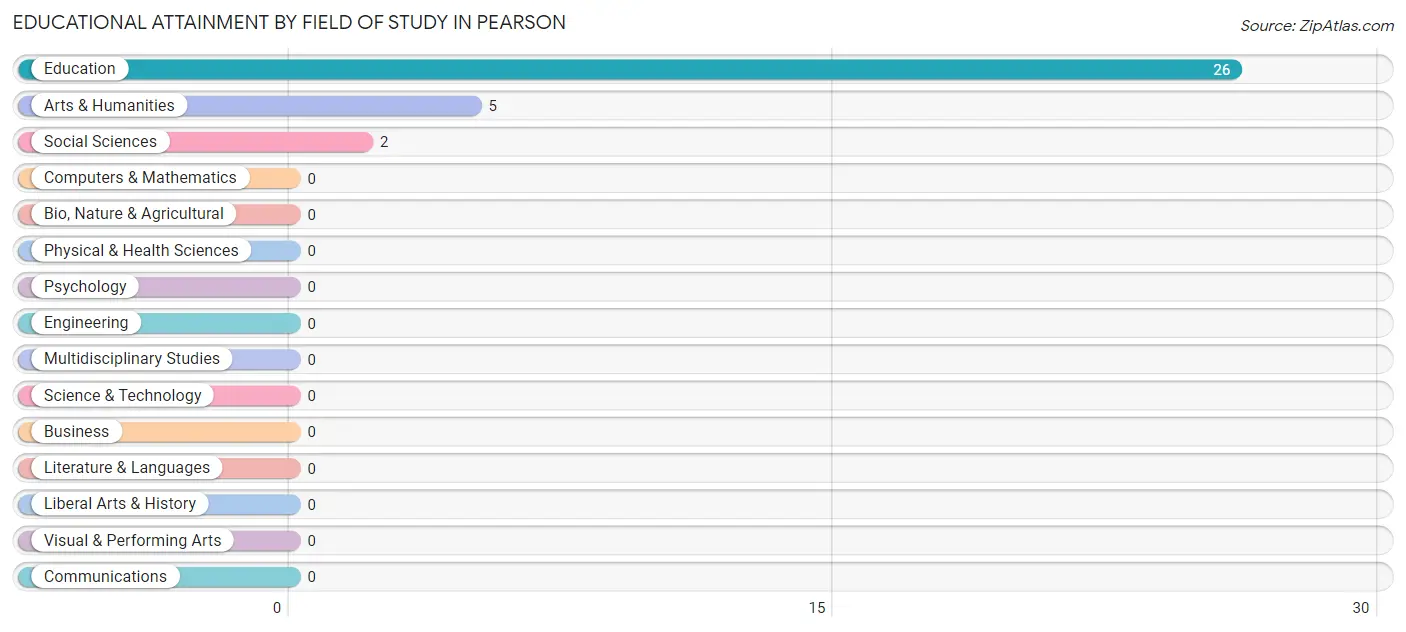
| Field of Study | # Graduates | % Graduates |
| Computers & Mathematics | 0 | 0.0% |
| Bio, Nature & Agricultural | 0 | 0.0% |
| Physical & Health Sciences | 0 | 0.0% |
| Psychology | 0 | 0.0% |
| Social Sciences | 2 | 6.1% |
| Engineering | 0 | 0.0% |
| Multidisciplinary Studies | 0 | 0.0% |
| Science & Technology | 0 | 0.0% |
| Business | 0 | 0.0% |
| Education | 26 | 78.8% |
| Literature & Languages | 0 | 0.0% |
| Liberal Arts & History | 0 | 0.0% |
| Visual & Performing Arts | 0 | 0.0% |
| Communications | 0 | 0.0% |
| Arts & Humanities | 5 | 15.1% |
| Total | 33 | 100.0% |
Transportation & Commute in Pearson
Vehicle Availability by Sex in Pearson
The most prevalent vehicle ownership categories in Pearson are males with 1 vehicle (376, accounting for 70.9%) and females with 1 vehicle (161, making up 109.3%).
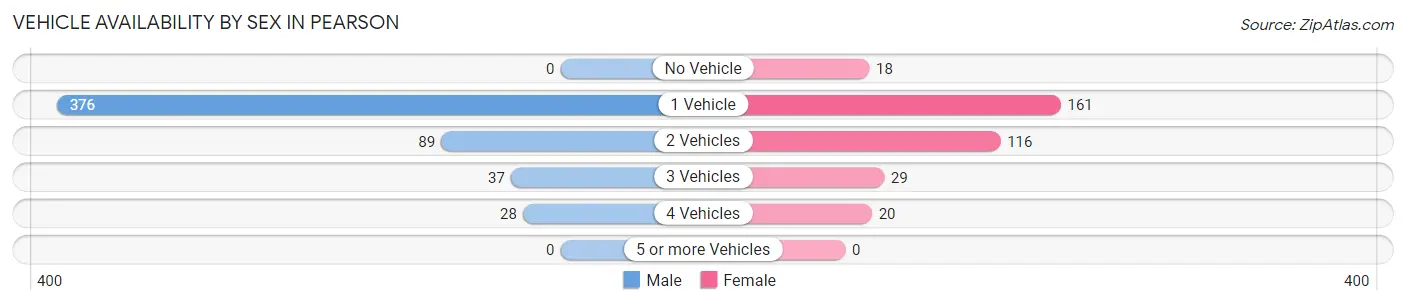
| Vehicles Available | Male | Female |
| No Vehicle | 0 (0.0%) | 18 (5.2%) |
| 1 Vehicle | 376 (70.9%) | 161 (46.8%) |
| 2 Vehicles | 89 (16.8%) | 116 (33.7%) |
| 3 Vehicles | 37 (7.0%) | 29 (8.4%) |
| 4 Vehicles | 28 (5.3%) | 20 (5.8%) |
| 5 or more Vehicles | 0 (0.0%) | 0 (0.0%) |
| Total | 530 (100.0%) | 344 (100.0%) |
Commute Time in Pearson
The most frequently occuring commute durations in Pearson are 20 to 24 minutes (357 commuters, 41.7%), 30 to 34 minutes (137 commuters, 16.0%), and 5 to 9 minutes (123 commuters, 14.3%).
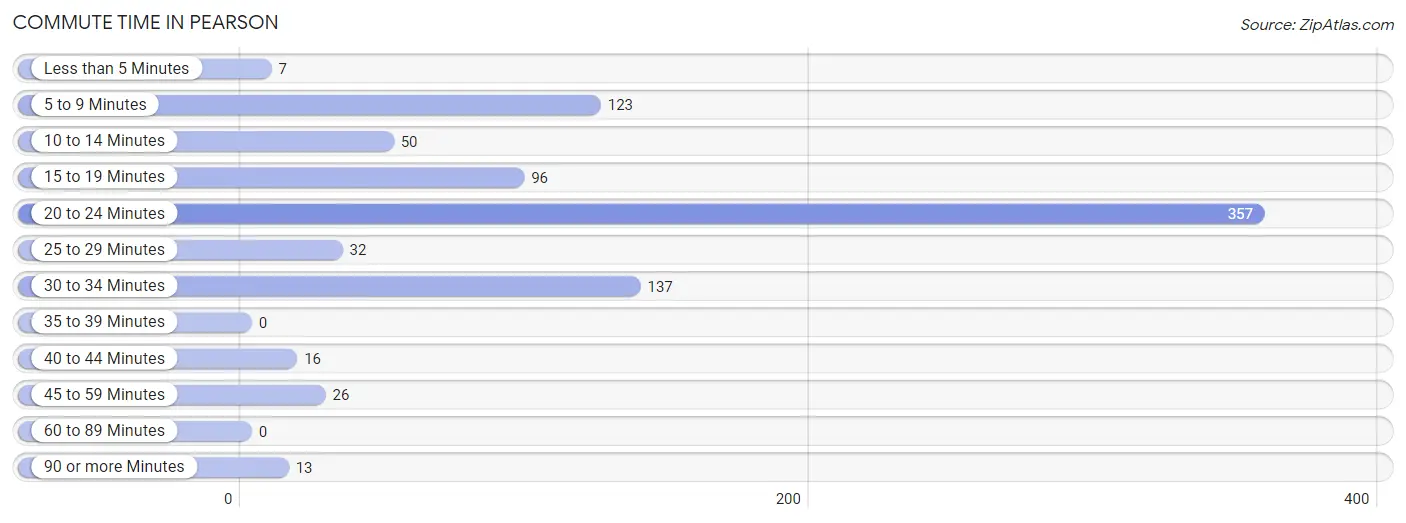
| Commute Time | # Commuters | % Commuters |
| Less than 5 Minutes | 7 | 0.8% |
| 5 to 9 Minutes | 123 | 14.3% |
| 10 to 14 Minutes | 50 | 5.8% |
| 15 to 19 Minutes | 96 | 11.2% |
| 20 to 24 Minutes | 357 | 41.7% |
| 25 to 29 Minutes | 32 | 3.7% |
| 30 to 34 Minutes | 137 | 16.0% |
| 35 to 39 Minutes | 0 | 0.0% |
| 40 to 44 Minutes | 16 | 1.9% |
| 45 to 59 Minutes | 26 | 3.0% |
| 60 to 89 Minutes | 0 | 0.0% |
| 90 or more Minutes | 13 | 1.5% |
Commute Time by Sex in Pearson
The most common commute times in Pearson are 20 to 24 minutes (215 commuters, 41.5%) for males and 20 to 24 minutes (142 commuters, 41.9%) for females.
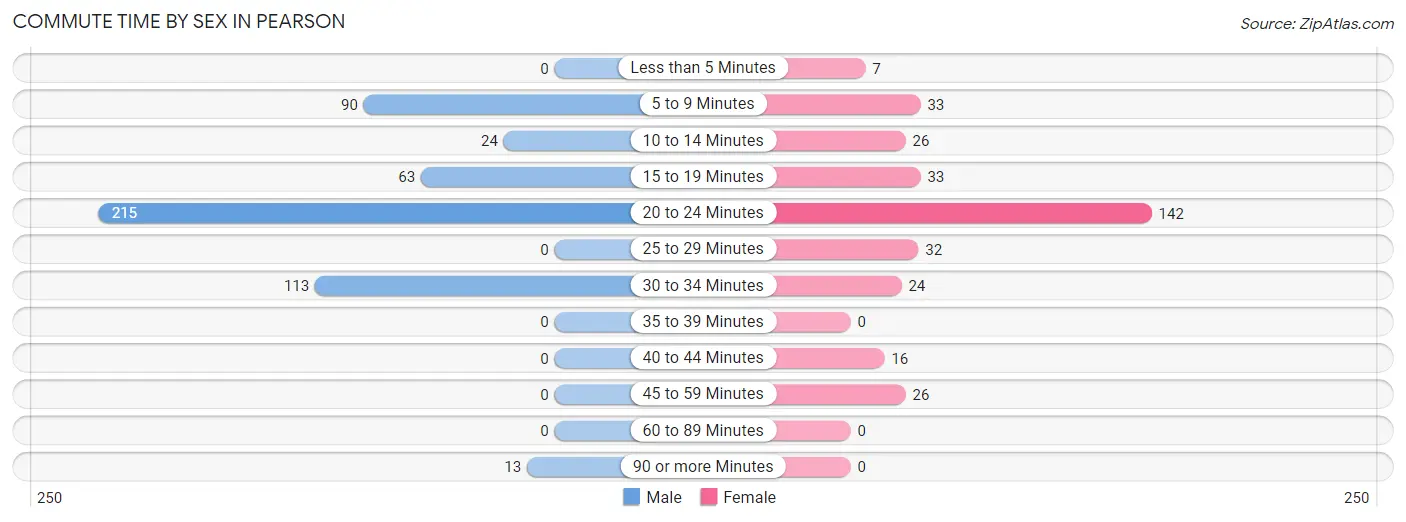
| Commute Time | Male | Female |
| Less than 5 Minutes | 0 (0.0%) | 7 (2.1%) |
| 5 to 9 Minutes | 90 (17.4%) | 33 (9.7%) |
| 10 to 14 Minutes | 24 (4.6%) | 26 (7.7%) |
| 15 to 19 Minutes | 63 (12.2%) | 33 (9.7%) |
| 20 to 24 Minutes | 215 (41.5%) | 142 (41.9%) |
| 25 to 29 Minutes | 0 (0.0%) | 32 (9.4%) |
| 30 to 34 Minutes | 113 (21.8%) | 24 (7.1%) |
| 35 to 39 Minutes | 0 (0.0%) | 0 (0.0%) |
| 40 to 44 Minutes | 0 (0.0%) | 16 (4.7%) |
| 45 to 59 Minutes | 0 (0.0%) | 26 (7.7%) |
| 60 to 89 Minutes | 0 (0.0%) | 0 (0.0%) |
| 90 or more Minutes | 13 (2.5%) | 0 (0.0%) |
Time of Departure to Work by Sex in Pearson
The most frequent times of departure to work in Pearson are 6:00 AM to 6:29 AM (144, 27.8%) for males and 6:00 AM to 6:29 AM (63, 18.6%) for females.
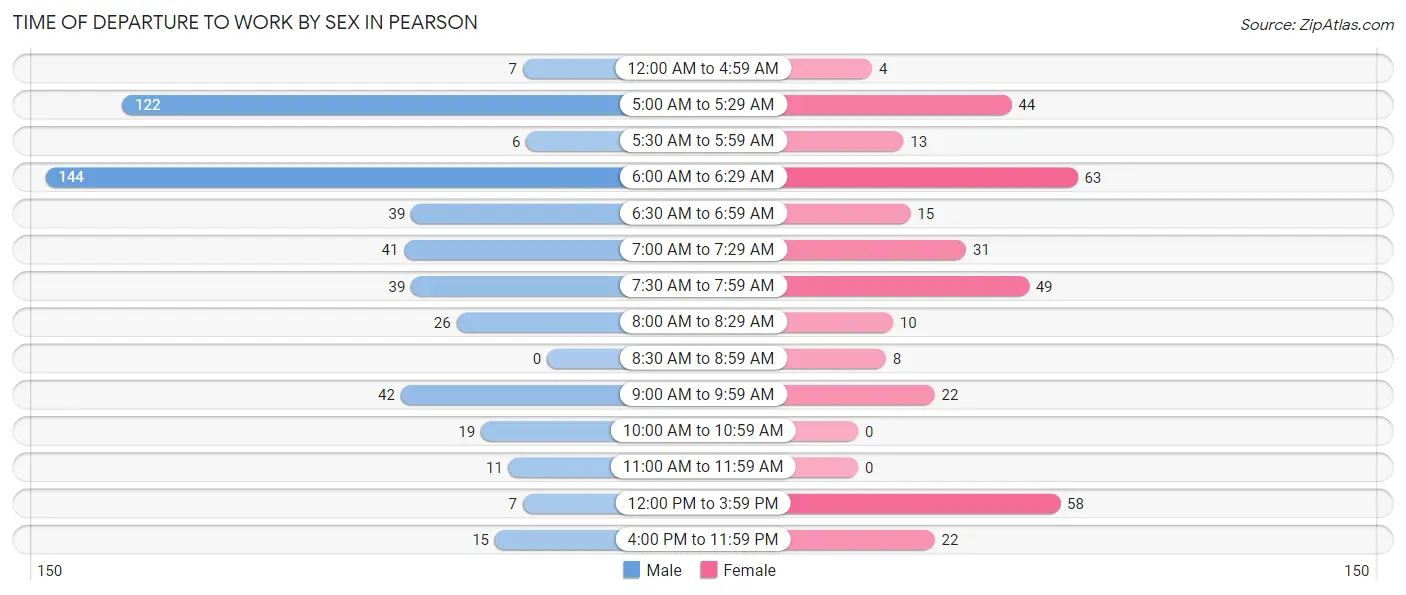
| Time of Departure | Male | Female |
| 12:00 AM to 4:59 AM | 7 (1.3%) | 4 (1.2%) |
| 5:00 AM to 5:29 AM | 122 (23.5%) | 44 (13.0%) |
| 5:30 AM to 5:59 AM | 6 (1.2%) | 13 (3.8%) |
| 6:00 AM to 6:29 AM | 144 (27.8%) | 63 (18.6%) |
| 6:30 AM to 6:59 AM | 39 (7.5%) | 15 (4.4%) |
| 7:00 AM to 7:29 AM | 41 (7.9%) | 31 (9.1%) |
| 7:30 AM to 7:59 AM | 39 (7.5%) | 49 (14.4%) |
| 8:00 AM to 8:29 AM | 26 (5.0%) | 10 (2.9%) |
| 8:30 AM to 8:59 AM | 0 (0.0%) | 8 (2.4%) |
| 9:00 AM to 9:59 AM | 42 (8.1%) | 22 (6.5%) |
| 10:00 AM to 10:59 AM | 19 (3.7%) | 0 (0.0%) |
| 11:00 AM to 11:59 AM | 11 (2.1%) | 0 (0.0%) |
| 12:00 PM to 3:59 PM | 7 (1.3%) | 58 (17.1%) |
| 4:00 PM to 11:59 PM | 15 (2.9%) | 22 (6.5%) |
| Total | 518 (100.0%) | 339 (100.0%) |
Housing Occupancy in Pearson
Occupancy by Ownership in Pearson
Of the total 714 dwellings in Pearson, owner-occupied units account for 402 (56.3%), while renter-occupied units make up 312 (43.7%).
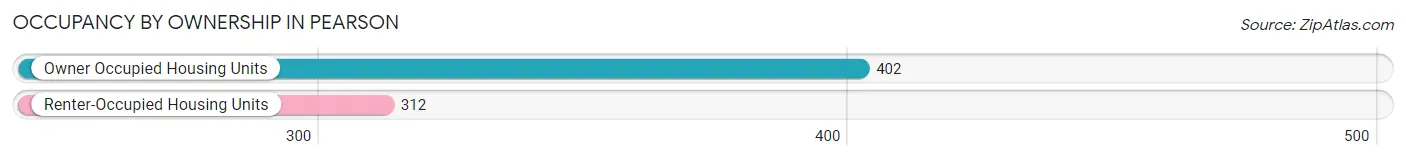
| Occupancy | # Housing Units | % Housing Units |
| Owner Occupied Housing Units | 402 | 56.3% |
| Renter-Occupied Housing Units | 312 | 43.7% |
| Total Occupied Housing Units | 714 | 100.0% |
Occupancy by Household Size in Pearson
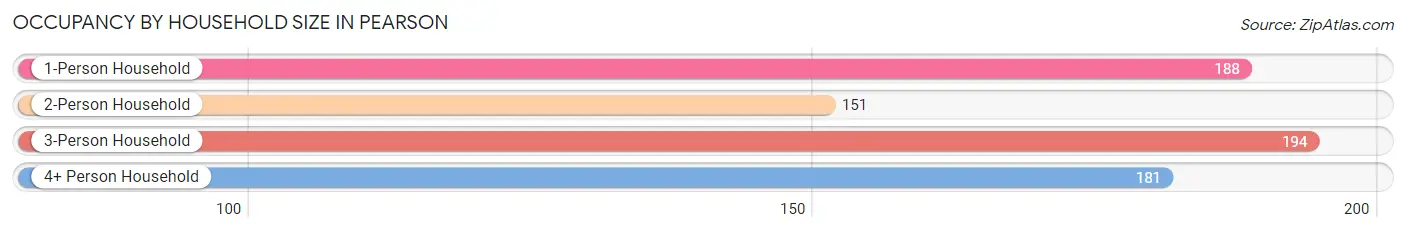
| Household Size | # Housing Units | % Housing Units |
| 1-Person Household | 188 | 26.3% |
| 2-Person Household | 151 | 21.1% |
| 3-Person Household | 194 | 27.2% |
| 4+ Person Household | 181 | 25.4% |
| Total Housing Units | 714 | 100.0% |
Occupancy by Ownership by Household Size in Pearson
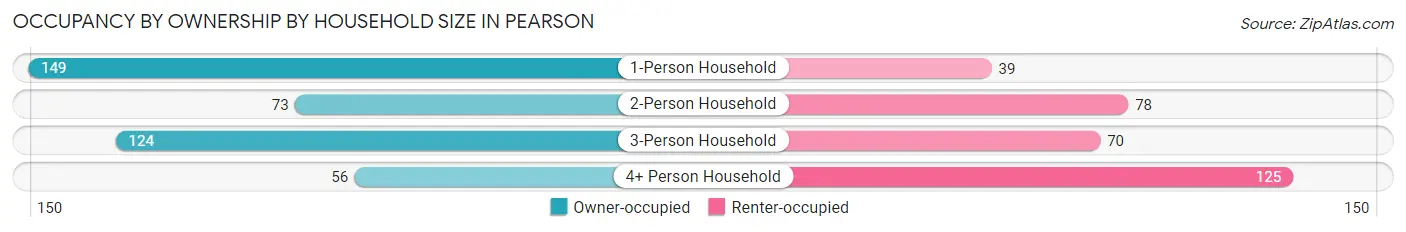
| Household Size | Owner-occupied | Renter-occupied |
| 1-Person Household | 149 (79.3%) | 39 (20.7%) |
| 2-Person Household | 73 (48.3%) | 78 (51.7%) |
| 3-Person Household | 124 (63.9%) | 70 (36.1%) |
| 4+ Person Household | 56 (30.9%) | 125 (69.1%) |
| Total Housing Units | 402 (56.3%) | 312 (43.7%) |
Occupancy by Educational Attainment in Pearson
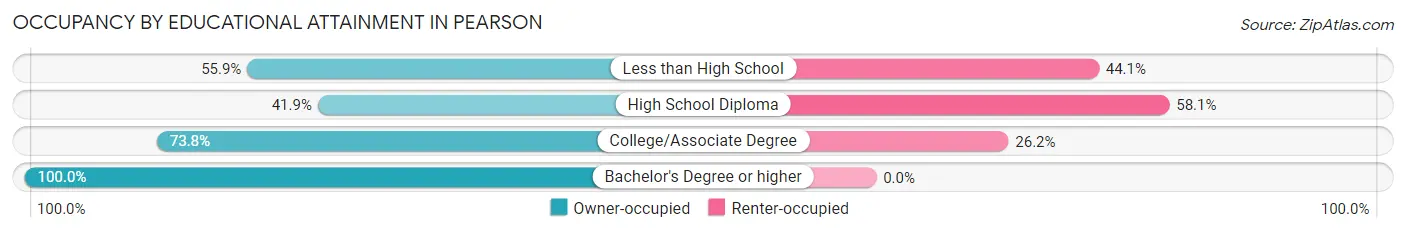
| Household Size | Owner-occupied | Renter-occupied |
| Less than High School | 100 (55.9%) | 79 (44.1%) |
| High School Diploma | 129 (41.9%) | 179 (58.1%) |
| College/Associate Degree | 152 (73.8%) | 54 (26.2%) |
| Bachelor's Degree or higher | 21 (100.0%) | 0 (0.0%) |
Occupancy by Age of Householder in Pearson
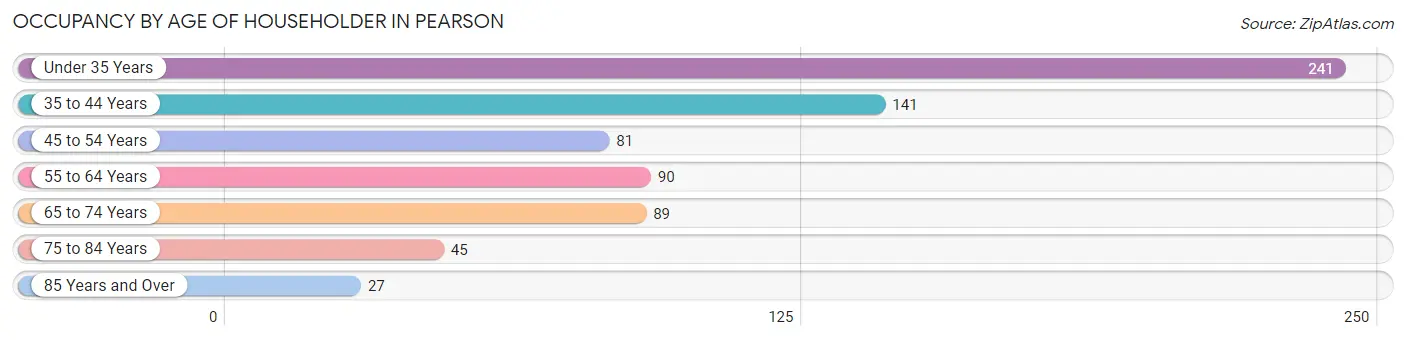
| Age Bracket | # Households | % Households |
| Under 35 Years | 241 | 33.8% |
| 35 to 44 Years | 141 | 19.8% |
| 45 to 54 Years | 81 | 11.3% |
| 55 to 64 Years | 90 | 12.6% |
| 65 to 74 Years | 89 | 12.5% |
| 75 to 84 Years | 45 | 6.3% |
| 85 Years and Over | 27 | 3.8% |
| Total | 714 | 100.0% |
Housing Finances in Pearson
Median Income by Occupancy in Pearson
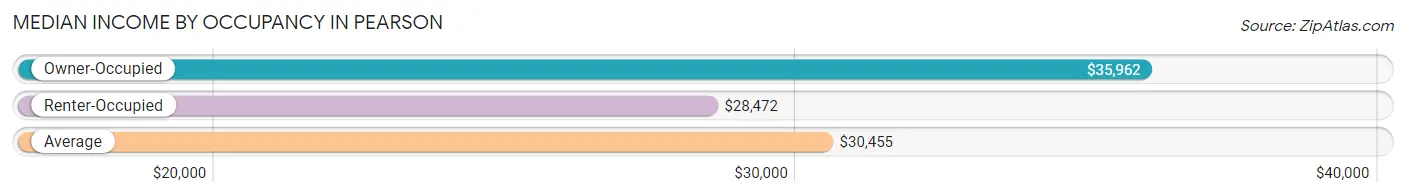
| Occupancy Type | # Households | Median Income |
| Owner-Occupied | 402 (56.3%) | $35,962 |
| Renter-Occupied | 312 (43.7%) | $28,472 |
| Average | 714 (100.0%) | $30,455 |
Occupancy by Householder Income Bracket in Pearson
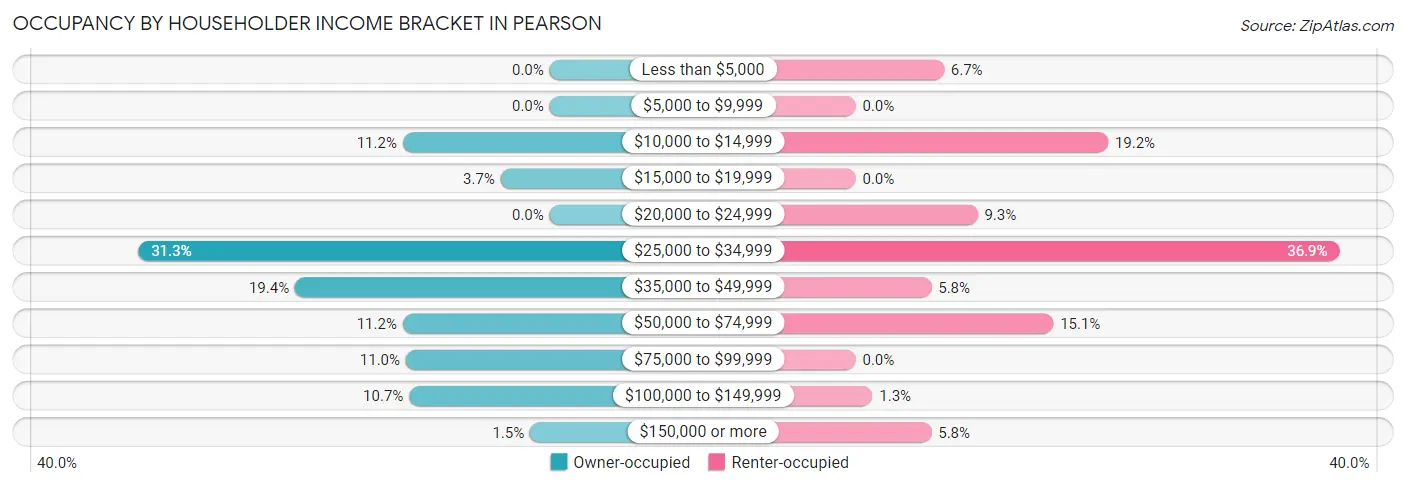
| Income Bracket | Owner-occupied | Renter-occupied |
| Less than $5,000 | 0 (0.0%) | 21 (6.7%) |
| $5,000 to $9,999 | 0 (0.0%) | 0 (0.0%) |
| $10,000 to $14,999 | 45 (11.2%) | 60 (19.2%) |
| $15,000 to $19,999 | 15 (3.7%) | 0 (0.0%) |
| $20,000 to $24,999 | 0 (0.0%) | 29 (9.3%) |
| $25,000 to $34,999 | 126 (31.3%) | 115 (36.9%) |
| $35,000 to $49,999 | 78 (19.4%) | 18 (5.8%) |
| $50,000 to $74,999 | 45 (11.2%) | 47 (15.1%) |
| $75,000 to $99,999 | 44 (11.0%) | 0 (0.0%) |
| $100,000 to $149,999 | 43 (10.7%) | 4 (1.3%) |
| $150,000 or more | 6 (1.5%) | 18 (5.8%) |
| Total | 402 (100.0%) | 312 (100.0%) |
Monthly Housing Cost Tiers in Pearson
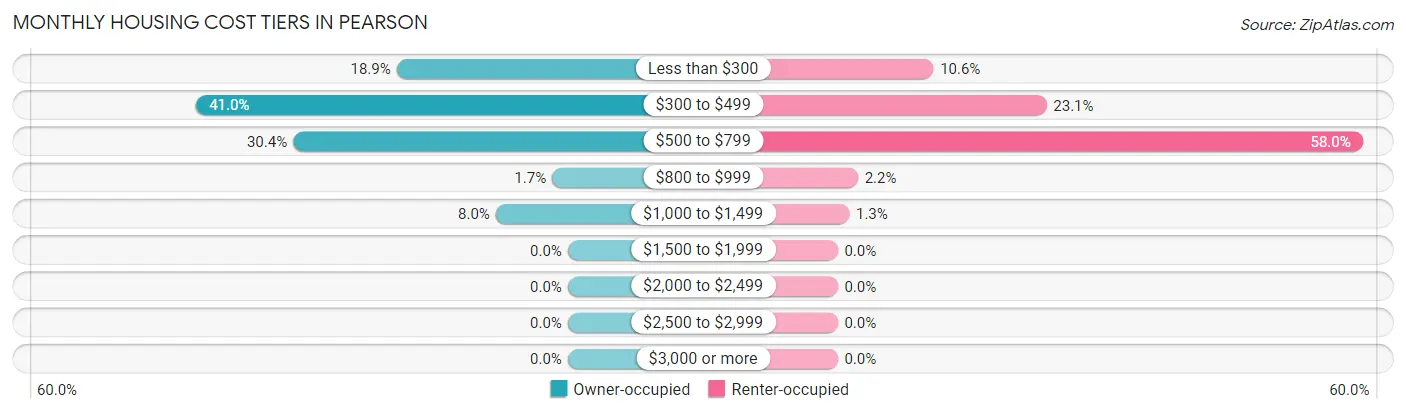
| Monthly Cost | Owner-occupied | Renter-occupied |
| Less than $300 | 76 (18.9%) | 33 (10.6%) |
| $300 to $499 | 165 (41.0%) | 72 (23.1%) |
| $500 to $799 | 122 (30.3%) | 181 (58.0%) |
| $800 to $999 | 7 (1.7%) | 7 (2.2%) |
| $1,000 to $1,499 | 32 (8.0%) | 4 (1.3%) |
| $1,500 to $1,999 | 0 (0.0%) | 0 (0.0%) |
| $2,000 to $2,499 | 0 (0.0%) | 0 (0.0%) |
| $2,500 to $2,999 | 0 (0.0%) | 0 (0.0%) |
| $3,000 or more | 0 (0.0%) | 0 (0.0%) |
| Total | 402 (100.0%) | 312 (100.0%) |
Physical Housing Characteristics in Pearson
Housing Structures in Pearson
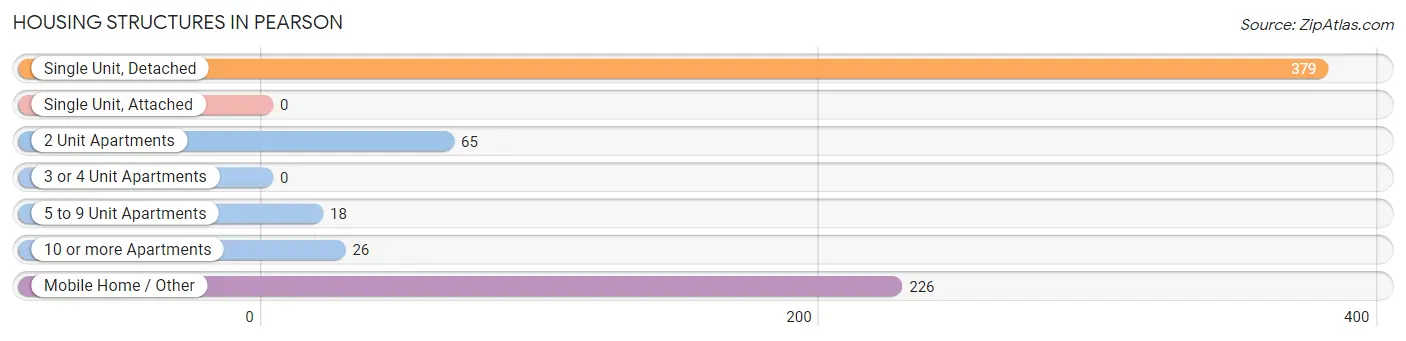
| Structure Type | # Housing Units | % Housing Units |
| Single Unit, Detached | 379 | 53.1% |
| Single Unit, Attached | 0 | 0.0% |
| 2 Unit Apartments | 65 | 9.1% |
| 3 or 4 Unit Apartments | 0 | 0.0% |
| 5 to 9 Unit Apartments | 18 | 2.5% |
| 10 or more Apartments | 26 | 3.6% |
| Mobile Home / Other | 226 | 31.7% |
| Total | 714 | 100.0% |
Housing Structures by Occupancy in Pearson
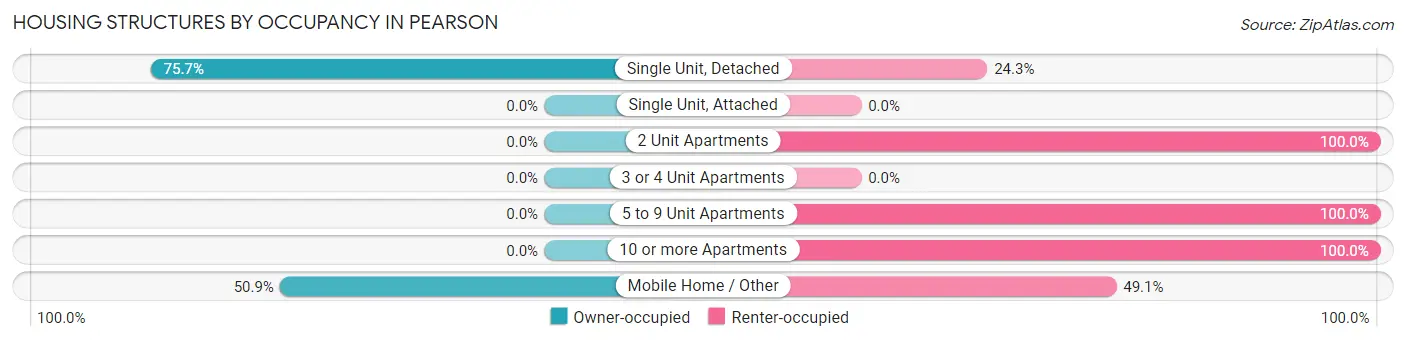
| Structure Type | Owner-occupied | Renter-occupied |
| Single Unit, Detached | 287 (75.7%) | 92 (24.3%) |
| Single Unit, Attached | 0 (0.0%) | 0 (0.0%) |
| 2 Unit Apartments | 0 (0.0%) | 65 (100.0%) |
| 3 or 4 Unit Apartments | 0 (0.0%) | 0 (0.0%) |
| 5 to 9 Unit Apartments | 0 (0.0%) | 18 (100.0%) |
| 10 or more Apartments | 0 (0.0%) | 26 (100.0%) |
| Mobile Home / Other | 115 (50.9%) | 111 (49.1%) |
| Total | 402 (56.3%) | 312 (43.7%) |
Housing Structures by Number of Rooms in Pearson
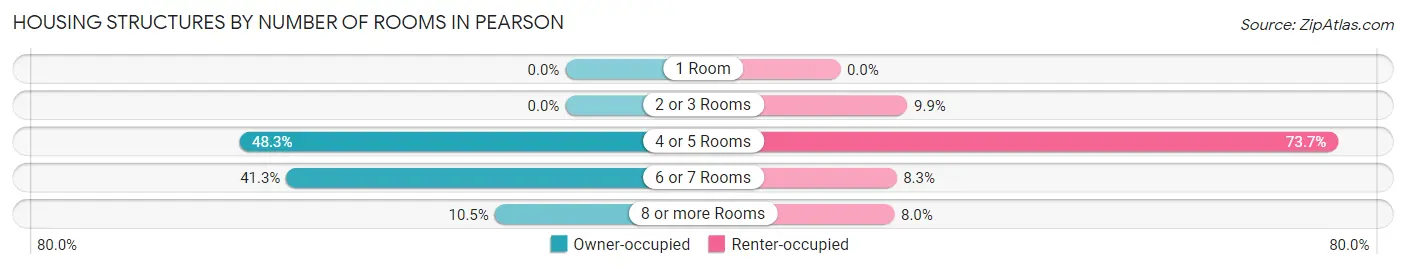
| Number of Rooms | Owner-occupied | Renter-occupied |
| 1 Room | 0 (0.0%) | 0 (0.0%) |
| 2 or 3 Rooms | 0 (0.0%) | 31 (9.9%) |
| 4 or 5 Rooms | 194 (48.3%) | 230 (73.7%) |
| 6 or 7 Rooms | 166 (41.3%) | 26 (8.3%) |
| 8 or more Rooms | 42 (10.4%) | 25 (8.0%) |
| Total | 402 (100.0%) | 312 (100.0%) |
Housing Structure by Heating Type in Pearson
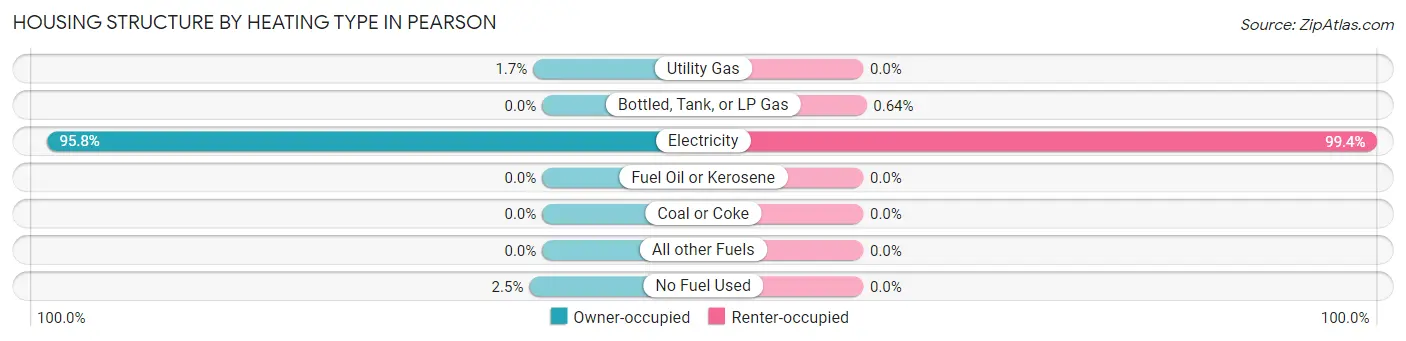
| Heating Type | Owner-occupied | Renter-occupied |
| Utility Gas | 7 (1.7%) | 0 (0.0%) |
| Bottled, Tank, or LP Gas | 0 (0.0%) | 2 (0.6%) |
| Electricity | 385 (95.8%) | 310 (99.4%) |
| Fuel Oil or Kerosene | 0 (0.0%) | 0 (0.0%) |
| Coal or Coke | 0 (0.0%) | 0 (0.0%) |
| All other Fuels | 0 (0.0%) | 0 (0.0%) |
| No Fuel Used | 10 (2.5%) | 0 (0.0%) |
| Total | 402 (100.0%) | 312 (100.0%) |
Household Vehicle Usage in Pearson
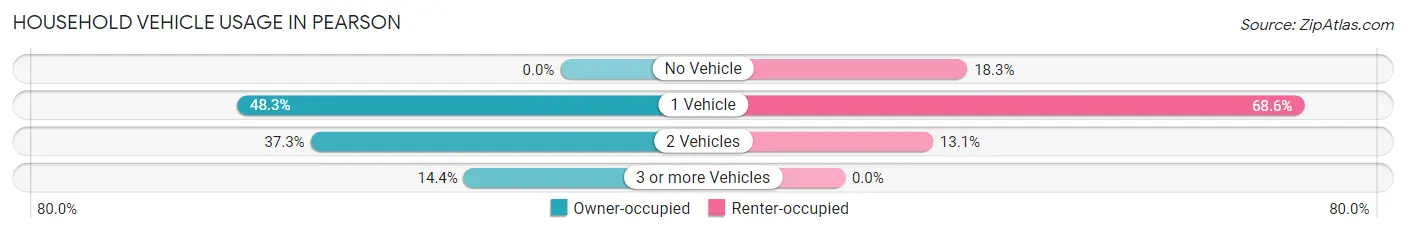
| Vehicles per Household | Owner-occupied | Renter-occupied |
| No Vehicle | 0 (0.0%) | 57 (18.3%) |
| 1 Vehicle | 194 (48.3%) | 214 (68.6%) |
| 2 Vehicles | 150 (37.3%) | 41 (13.1%) |
| 3 or more Vehicles | 58 (14.4%) | 0 (0.0%) |
| Total | 402 (100.0%) | 312 (100.0%) |
Real Estate & Mortgages in Pearson
Real Estate and Mortgage Overview in Pearson
| Characteristic | Without Mortgage | With Mortgage |
| Housing Units | 312 | 90 |
| Median Property Value | $56,800 | $115,900 |
| Median Household Income | $35,192 | $2 |
| Monthly Housing Costs | $336 | $0 |
| Real Estate Taxes | $483 | $0 |
Property Value by Mortgage Status in Pearson
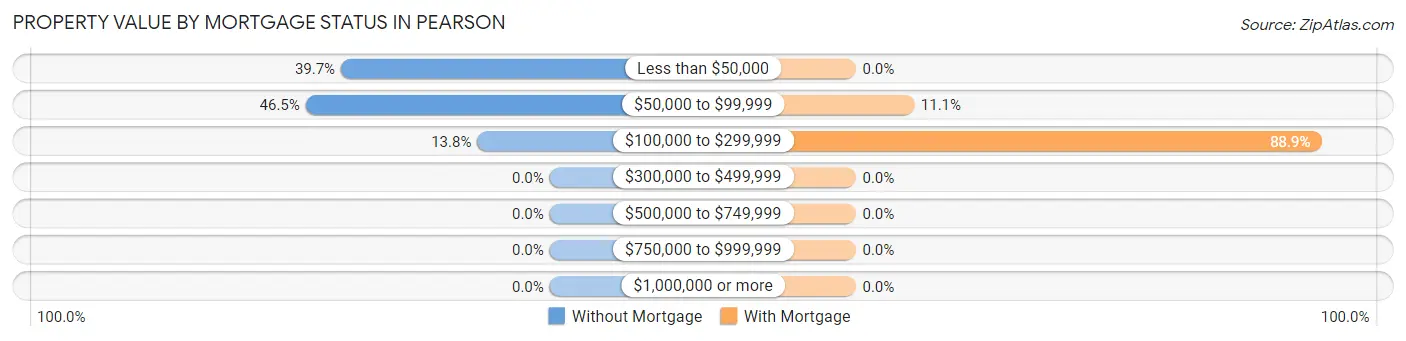
| Property Value | Without Mortgage | With Mortgage |
| Less than $50,000 | 124 (39.7%) | 0 (0.0%) |
| $50,000 to $99,999 | 145 (46.5%) | 10 (11.1%) |
| $100,000 to $299,999 | 43 (13.8%) | 80 (88.9%) |
| $300,000 to $499,999 | 0 (0.0%) | 0 (0.0%) |
| $500,000 to $749,999 | 0 (0.0%) | 0 (0.0%) |
| $750,000 to $999,999 | 0 (0.0%) | 0 (0.0%) |
| $1,000,000 or more | 0 (0.0%) | 0 (0.0%) |
| Total | 312 (100.0%) | 90 (100.0%) |
Household Income by Mortgage Status in Pearson
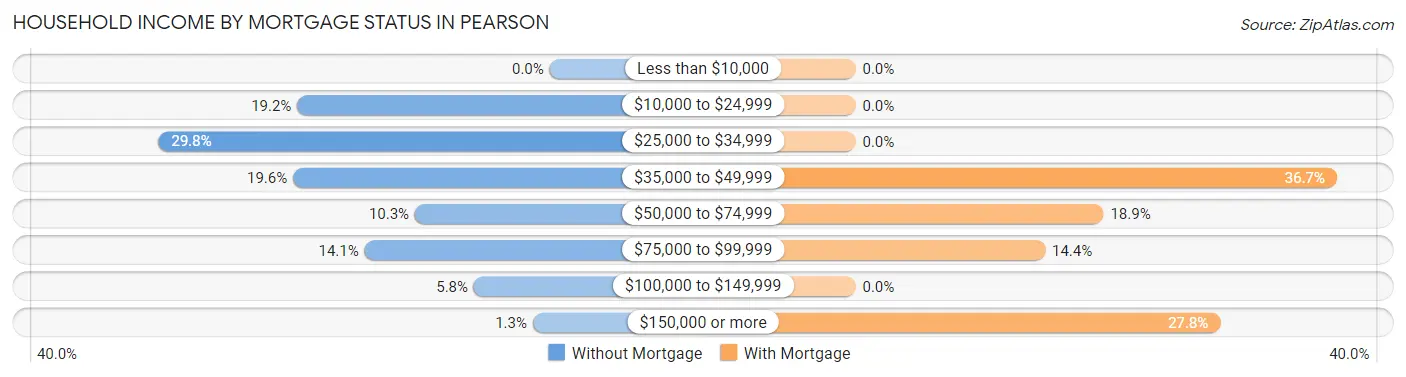
| Household Income | Without Mortgage | With Mortgage |
| Less than $10,000 | 0 (0.0%) | 0 (0.0%) |
| $10,000 to $24,999 | 60 (19.2%) | 0 (0.0%) |
| $25,000 to $34,999 | 93 (29.8%) | 0 (0.0%) |
| $35,000 to $49,999 | 61 (19.6%) | 33 (36.7%) |
| $50,000 to $74,999 | 32 (10.3%) | 17 (18.9%) |
| $75,000 to $99,999 | 44 (14.1%) | 13 (14.4%) |
| $100,000 to $149,999 | 18 (5.8%) | 0 (0.0%) |
| $150,000 or more | 4 (1.3%) | 25 (27.8%) |
| Total | 312 (100.0%) | 90 (100.0%) |
Property Value to Household Income Ratio in Pearson
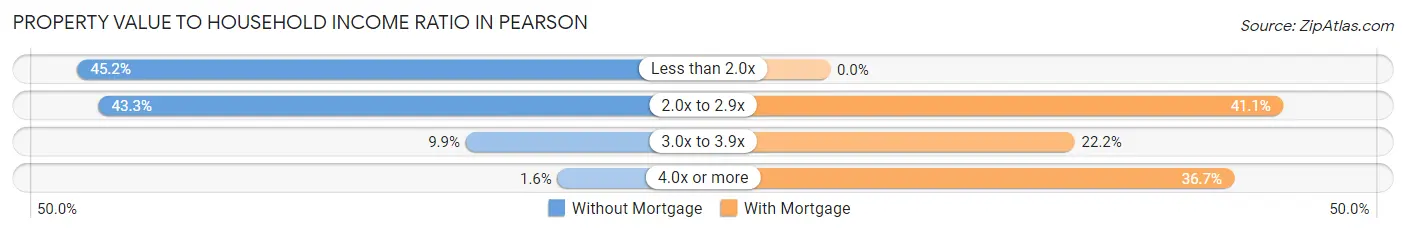
| Value-to-Income Ratio | Without Mortgage | With Mortgage |
| Less than 2.0x | 141 (45.2%) | 0 (0.0%) |
| 2.0x to 2.9x | 135 (43.3%) | 37 (41.1%) |
| 3.0x to 3.9x | 31 (9.9%) | 20 (22.2%) |
| 4.0x or more | 5 (1.6%) | 33 (36.7%) |
| Total | 312 (100.0%) | 90 (100.0%) |
Real Estate Taxes by Mortgage Status in Pearson
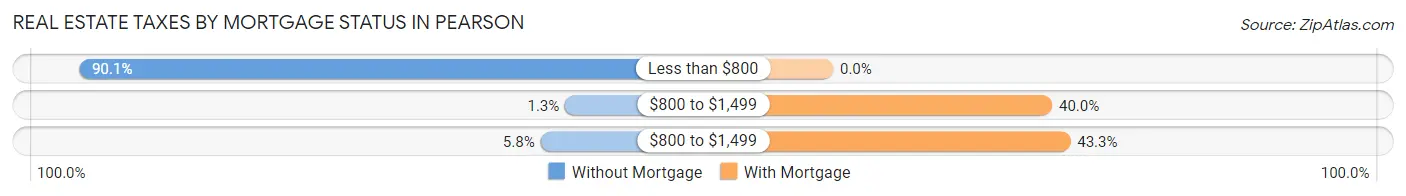
| Property Taxes | Without Mortgage | With Mortgage |
| Less than $800 | 281 (90.1%) | 0 (0.0%) |
| $800 to $1,499 | 4 (1.3%) | 36 (40.0%) |
| $800 to $1,499 | 18 (5.8%) | 39 (43.3%) |
| Total | 312 (100.0%) | 90 (100.0%) |
Health & Disability in Pearson
Health Insurance Coverage by Age in Pearson
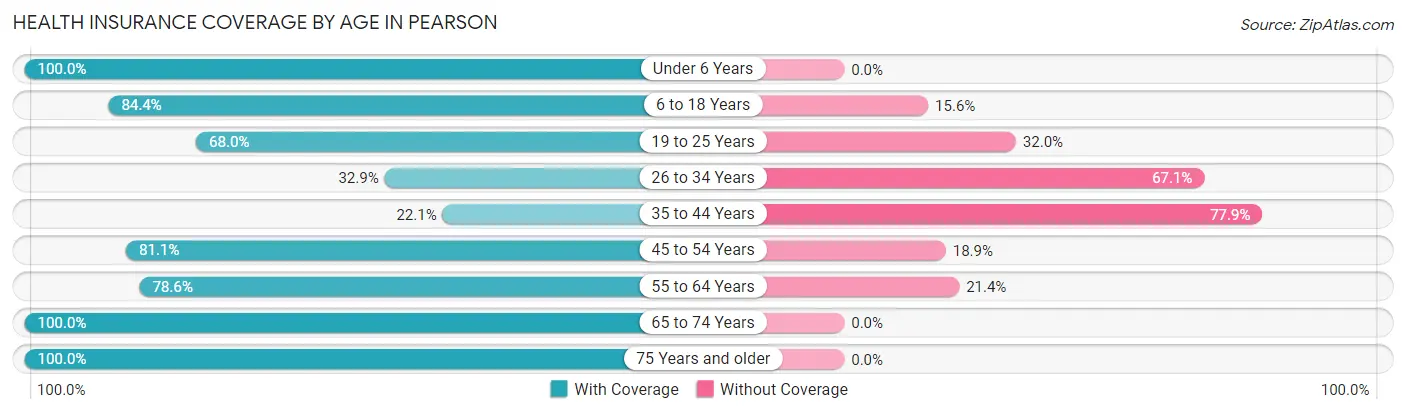
| Age Bracket | With Coverage | Without Coverage |
| Under 6 Years | 169 (100.0%) | 0 (0.0%) |
| 6 to 18 Years | 232 (84.4%) | 43 (15.6%) |
| 19 to 25 Years | 102 (68.0%) | 48 (32.0%) |
| 26 to 34 Years | 100 (32.9%) | 204 (67.1%) |
| 35 to 44 Years | 79 (22.1%) | 279 (77.9%) |
| 45 to 54 Years | 137 (81.1%) | 32 (18.9%) |
| 55 to 64 Years | 143 (78.6%) | 39 (21.4%) |
| 65 to 74 Years | 101 (100.0%) | 0 (0.0%) |
| 75 Years and older | 89 (100.0%) | 0 (0.0%) |
| Total | 1,152 (64.1%) | 645 (35.9%) |
Health Insurance Coverage by Citizenship Status in Pearson
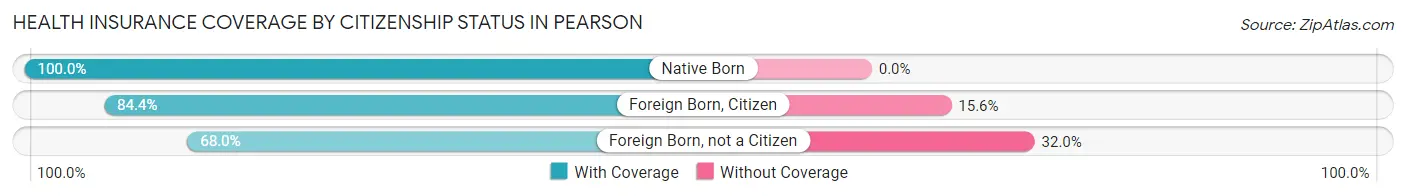
| Citizenship Status | With Coverage | Without Coverage |
| Native Born | 169 (100.0%) | 0 (0.0%) |
| Foreign Born, Citizen | 232 (84.4%) | 43 (15.6%) |
| Foreign Born, not a Citizen | 102 (68.0%) | 48 (32.0%) |
Health Insurance Coverage by Household Income in Pearson
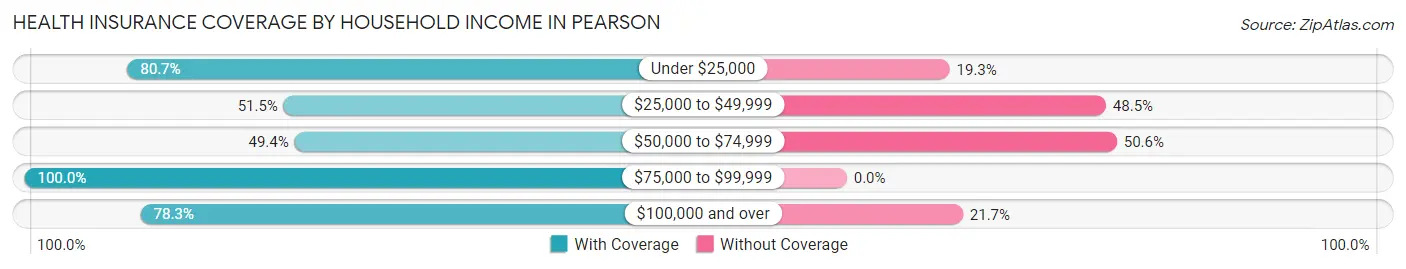
| Household Income | With Coverage | Without Coverage |
| Under $25,000 | 306 (80.7%) | 73 (19.3%) |
| $25,000 to $49,999 | 369 (51.5%) | 348 (48.5%) |
| $50,000 to $74,999 | 170 (49.4%) | 174 (50.6%) |
| $75,000 to $99,999 | 123 (100.0%) | 0 (0.0%) |
| $100,000 and over | 180 (78.3%) | 50 (21.7%) |
Public vs Private Health Insurance Coverage by Age in Pearson
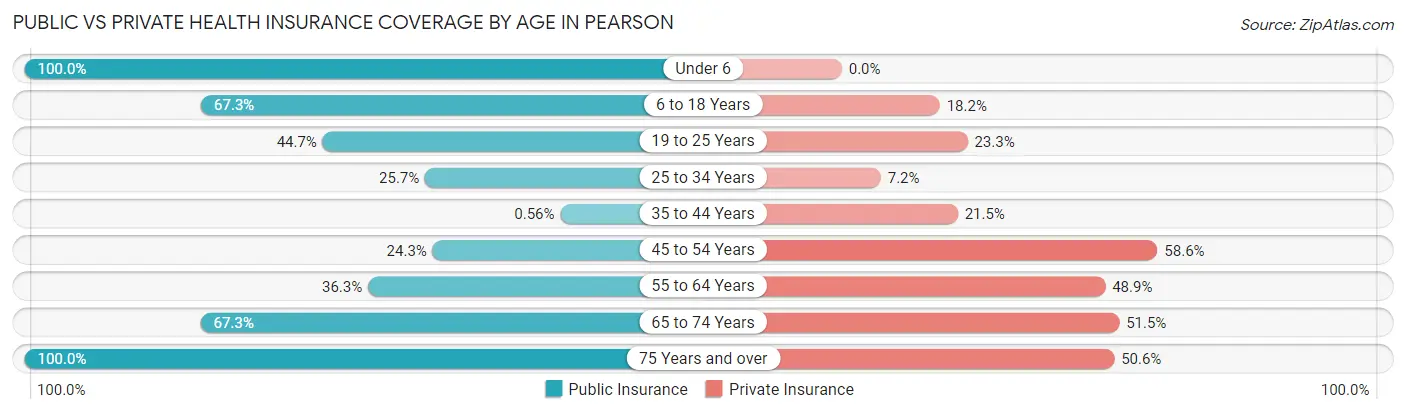
| Age Bracket | Public Insurance | Private Insurance |
| Under 6 | 169 (100.0%) | 0 (0.0%) |
| 6 to 18 Years | 185 (67.3%) | 50 (18.2%) |
| 19 to 25 Years | 67 (44.7%) | 35 (23.3%) |
| 25 to 34 Years | 78 (25.7%) | 22 (7.2%) |
| 35 to 44 Years | 2 (0.6%) | 77 (21.5%) |
| 45 to 54 Years | 41 (24.3%) | 99 (58.6%) |
| 55 to 64 Years | 66 (36.3%) | 89 (48.9%) |
| 65 to 74 Years | 68 (67.3%) | 52 (51.5%) |
| 75 Years and over | 89 (100.0%) | 45 (50.6%) |
| Total | 765 (42.6%) | 469 (26.1%) |
Disability Status by Sex by Age in Pearson
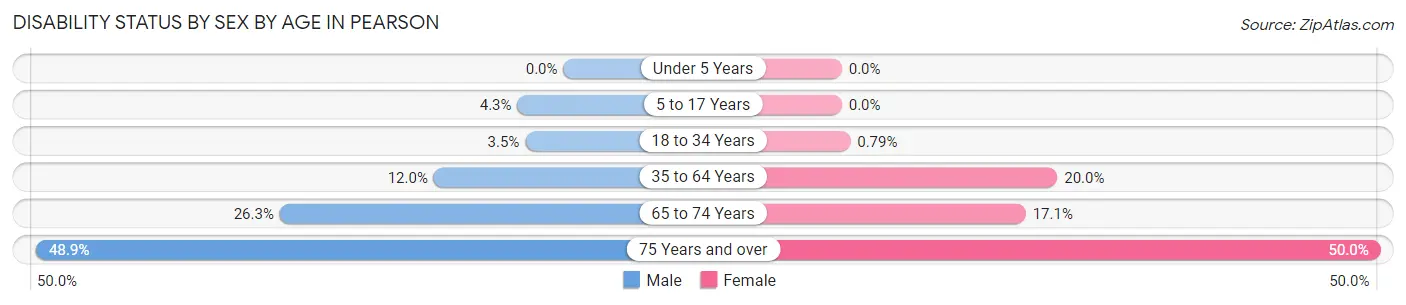
| Age Bracket | Male | Female |
| Under 5 Years | 0 (0.0%) | 0 (0.0%) |
| 5 to 17 Years | 5 (4.3%) | 0 (0.0%) |
| 18 to 34 Years | 8 (3.5%) | 2 (0.8%) |
| 35 to 64 Years | 51 (12.0%) | 57 (20.0%) |
| 65 to 74 Years | 5 (26.3%) | 14 (17.1%) |
| 75 Years and over | 23 (48.9%) | 21 (50.0%) |
Disability Class by Sex by Age in Pearson
Disability Class: Hearing Difficulty
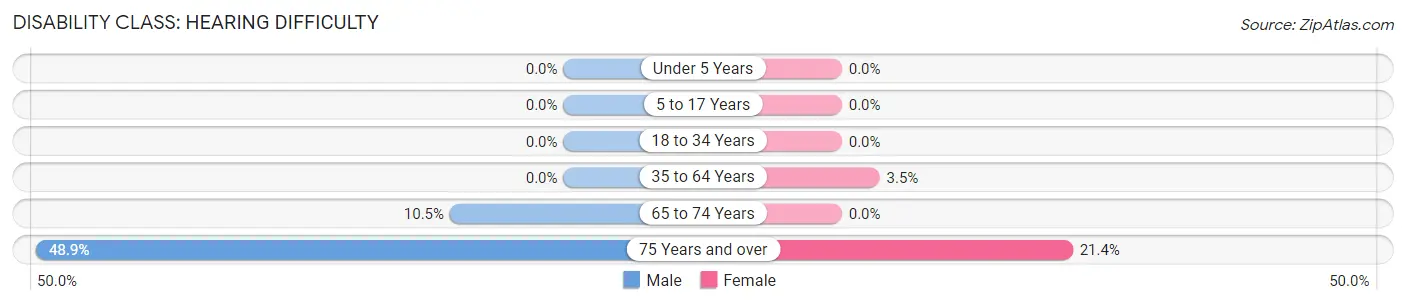
| Age Bracket | Male | Female |
| Under 5 Years | 0 (0.0%) | 0 (0.0%) |
| 5 to 17 Years | 0 (0.0%) | 0 (0.0%) |
| 18 to 34 Years | 0 (0.0%) | 0 (0.0%) |
| 35 to 64 Years | 0 (0.0%) | 10 (3.5%) |
| 65 to 74 Years | 2 (10.5%) | 0 (0.0%) |
| 75 Years and over | 23 (48.9%) | 9 (21.4%) |
Disability Class: Vision Difficulty
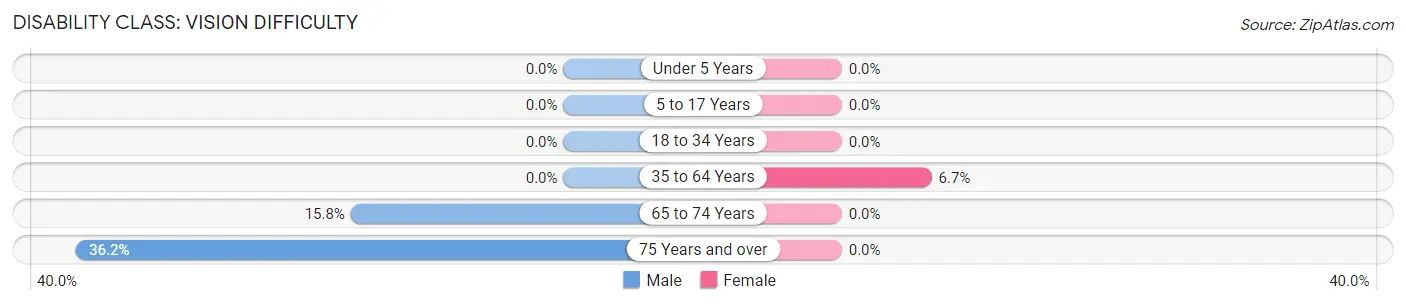
| Age Bracket | Male | Female |
| Under 5 Years | 0 (0.0%) | 0 (0.0%) |
| 5 to 17 Years | 0 (0.0%) | 0 (0.0%) |
| 18 to 34 Years | 0 (0.0%) | 0 (0.0%) |
| 35 to 64 Years | 0 (0.0%) | 19 (6.7%) |
| 65 to 74 Years | 3 (15.8%) | 0 (0.0%) |
| 75 Years and over | 17 (36.2%) | 0 (0.0%) |
Disability Class: Cognitive Difficulty
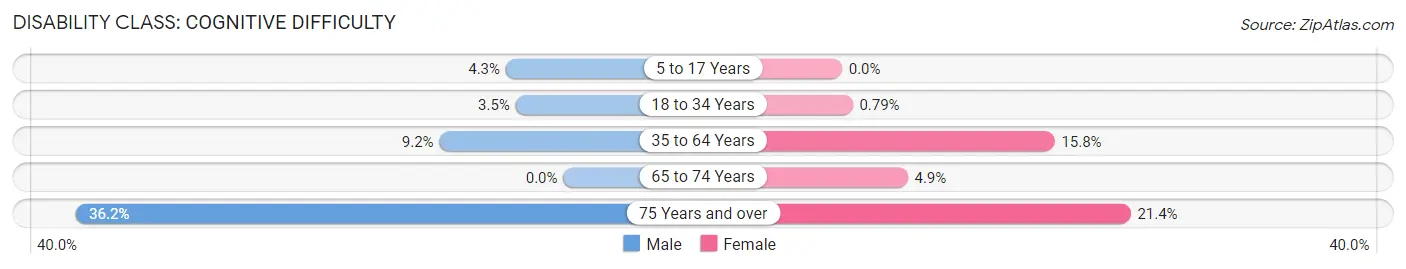
| Age Bracket | Male | Female |
| 5 to 17 Years | 5 (4.3%) | 0 (0.0%) |
| 18 to 34 Years | 8 (3.5%) | 2 (0.8%) |
| 35 to 64 Years | 39 (9.2%) | 45 (15.8%) |
| 65 to 74 Years | 0 (0.0%) | 4 (4.9%) |
| 75 Years and over | 17 (36.2%) | 9 (21.4%) |
Disability Class: Ambulatory Difficulty
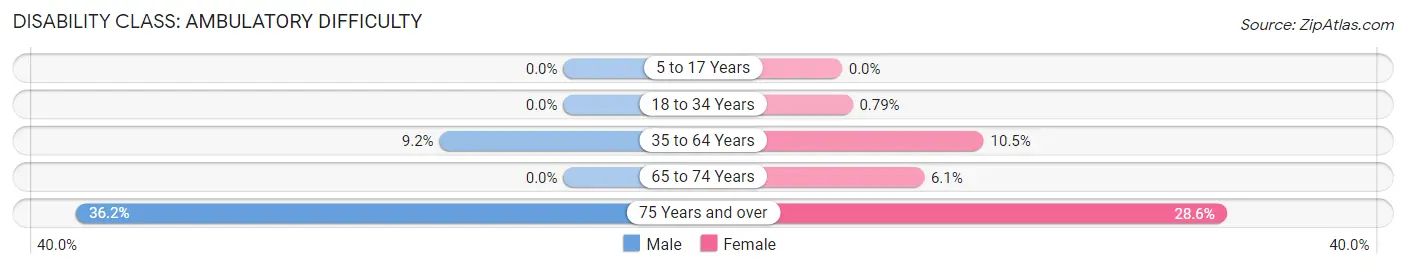
| Age Bracket | Male | Female |
| 5 to 17 Years | 0 (0.0%) | 0 (0.0%) |
| 18 to 34 Years | 0 (0.0%) | 2 (0.8%) |
| 35 to 64 Years | 39 (9.2%) | 30 (10.5%) |
| 65 to 74 Years | 0 (0.0%) | 5 (6.1%) |
| 75 Years and over | 17 (36.2%) | 12 (28.6%) |
Disability Class: Self-Care Difficulty
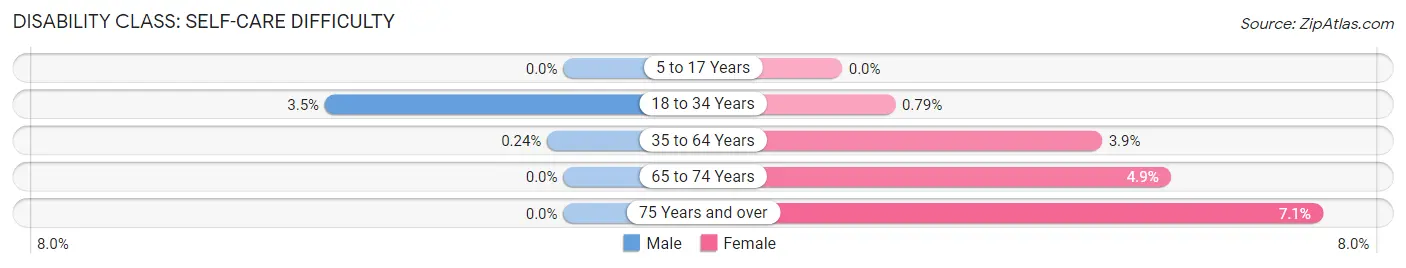
| Age Bracket | Male | Female |
| 5 to 17 Years | 0 (0.0%) | 0 (0.0%) |
| 18 to 34 Years | 8 (3.5%) | 2 (0.8%) |
| 35 to 64 Years | 1 (0.2%) | 11 (3.9%) |
| 65 to 74 Years | 0 (0.0%) | 4 (4.9%) |
| 75 Years and over | 0 (0.0%) | 3 (7.1%) |
Technology Access in Pearson
Computing Device Access in Pearson
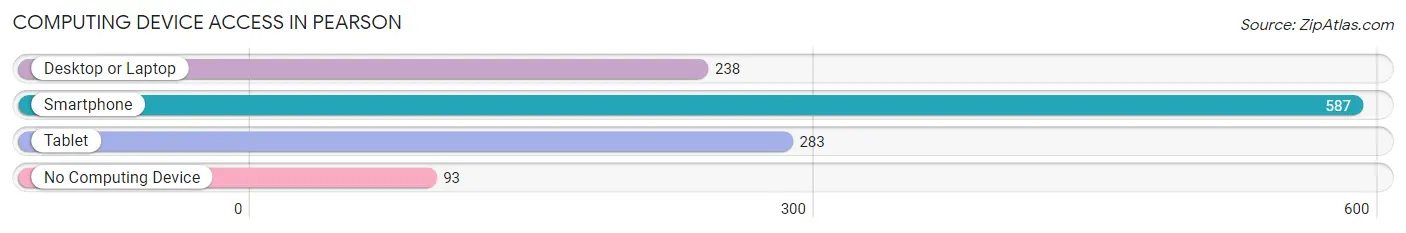
| Device Type | # Households | % Households |
| Desktop or Laptop | 238 | 33.3% |
| Smartphone | 587 | 82.2% |
| Tablet | 283 | 39.6% |
| No Computing Device | 93 | 13.0% |
| Total | 714 | 100.0% |
Internet Access in Pearson
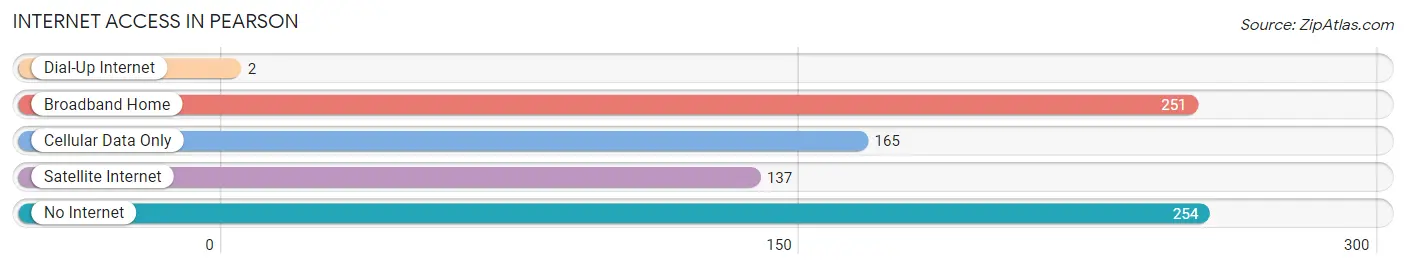
| Internet Type | # Households | % Households |
| Dial-Up Internet | 2 | 0.3% |
| Broadband Home | 251 | 35.1% |
| Cellular Data Only | 165 | 23.1% |
| Satellite Internet | 137 | 19.2% |
| No Internet | 254 | 35.6% |
| Total | 714 | 100.0% |
Pearson Summary
Pearson, Georgia is a small city located in Atkinson County in the southeastern part of the state. It is situated on the banks of the Satilla River, and is the county seat of Atkinson County. The city has a population of approximately 2,500 people, and is part of the Douglas-Coffee Combined Statistical Area.
History
Pearson was founded in 1891 by the Georgia General Assembly, and was named after William Pearson, a prominent local businessman. The city was incorporated in 1895, and was the first city in Atkinson County to be incorporated. The city was originally a farming community, and the main crops grown were cotton, corn, and peanuts.
In the early 1900s, the city began to grow and develop. The first bank was established in 1906, and the first newspaper was published in 1908. The city also had a railroad station, which was built in 1910. The railroad station was a major factor in the growth of the city, as it allowed for the transportation of goods and people to and from the city.
In the 1920s, the city began to experience a period of growth and prosperity. The city was home to several businesses, including a cotton gin, a sawmill, and a brick factory. The city also had a movie theater, a hotel, and several churches.
In the 1950s, the city began to experience a decline in population. This was due to the decline of the cotton industry, as well as the introduction of new technology that made farming more efficient. The city also experienced a decrease in the number of businesses, as many of them moved to larger cities.
Geography
Pearson is located in the southeastern part of the state of Georgia, in Atkinson County. The city is situated on the banks of the Satilla River, and is approximately 30 miles from the Atlantic Ocean. The city has a total area of 2.2 square miles, and has a humid subtropical climate.
The city is surrounded by several small towns and villages, including Douglas, Coffee, and Willacoochee. The city is also located near the Okefenokee National Wildlife Refuge, which is a popular tourist destination.
Economy
The economy of Pearson is largely based on agriculture. The main crops grown in the area are cotton, corn, and peanuts. The city also has several small businesses, including restaurants, retail stores, and service providers.
The city is also home to several manufacturing companies, including a paper mill, a furniture factory, and a plastics factory. The city also has a small airport, which is used for private and commercial flights.
Demographics
As of the 2010 census, Pearson had a population of 2,500 people. The racial makeup of the city was 79.2% White, 17.2% African American, 0.4% Native American, 0.8% Asian, 0.1% Pacific Islander, and 2.3% from other races. The median household income was $25,000, and the median family income was $30,000.
The city has a large number of churches, and the majority of the population is Christian. The city also has a small Jewish community, and there are several synagogues in the city.
Conclusion
Pearson, Georgia is a small city located in Atkinson County in the southeastern part of the state. The city has a population of approximately 2,500 people, and is part of the Douglas-Coffee Combined Statistical Area. The city was founded in 1891, and was originally a farming community. The city has experienced a period of growth and prosperity, and is now home to several businesses and manufacturing companies. The economy of the city is largely based on agriculture, and the main crops grown in the area are cotton, corn, and peanuts. The city also has a large number of churches, and the majority of the population is Christian.
Common Questions
What is Per Capita Income in Pearson?
Per Capita income in Pearson is $21,903.
What is the Median Family Income in Pearson?
Median Family Income in Pearson is $30,948.
What is the Median Household income in Pearson?
Median Household Income in Pearson is $30,455.
What is Income or Wage Gap in Pearson?
Income or Wage Gap in Pearson is 18.2%.
Women in Pearson earn 81.8 cents for every dollar earned by a man.
What is Inequality or Gini Index in Pearson?
Inequality or Gini Index in Pearson is 0.43.
What is the Total Population of Pearson?
Total Population of Pearson is 1,826.
What is the Total Male Population of Pearson?
Total Male Population of Pearson is 902.
What is the Total Female Population of Pearson?
Total Female Population of Pearson is 924.
What is the Ratio of Males per 100 Females in Pearson?
There are 97.62 Males per 100 Females in Pearson.
What is the Ratio of Females per 100 Males in Pearson?
There are 102.44 Females per 100 Males in Pearson.
What is the Median Population Age in Pearson?
Median Population Age in Pearson is 34.9 Years.
What is the Average Family Size in Pearson
Average Family Size in Pearson is 3.1 People.
What is the Average Household Size in Pearson
Average Household Size in Pearson is 2.5 People.
How Large is the Labor Force in Pearson?
There are 922 People in the Labor Forcein in Pearson.
What is the Percentage of People in the Labor Force in Pearson?
63.6% of People are in the Labor Force in Pearson.
What is the Unemployment Rate in Pearson?
Unemployment Rate in Pearson is 4.8%.