Statesboro, GA Map & Demographics
Statesboro Map
Statesboro Overview
$18,069
PER CAPITA INCOME
$50,417
AVG FAMILY INCOME
$38,845
AVG HOUSEHOLD INCOME
3.6%
WAGE / INCOME GAP [ % ]
96.4¢/ $1
WAGE / INCOME GAP [ $ ]
$10,342
FAMILY INCOME DEFICIT
0.45
INEQUALITY / GINI INDEX
33,185
TOTAL POPULATION
15,532
MALE POPULATION
17,653
FEMALE POPULATION
87.99
MALES / 100 FEMALES
113.66
FEMALES / 100 MALES
22.6
MEDIAN AGE
3.0
AVG FAMILY SIZE
2.3
AVG HOUSEHOLD SIZE
16,505
LABOR FORCE [ PEOPLE ]
57.4%
PERCENT IN LABOR FORCE
11.3%
UNEMPLOYMENT RATE
Statesboro Area Codes
Income in Statesboro
Income Overview in Statesboro
Per Capita Income in Statesboro is $18,069, while median incomes of families and households are $50,417 and $38,845 respectively.
| Characteristic | Number | Measure |
| Per Capita Income | 33,185 | $18,069 |
| Median Family Income | 4,811 | $50,417 |
| Mean Family Income | 4,811 | $61,737 |
| Median Household Income | 11,857 | $38,845 |
| Mean Household Income | 11,857 | $48,198 |
| Income Deficit | 4,811 | $10,342 |
| Wage / Income Gap (%) | 33,185 | 3.64% |
| Wage / Income Gap ($) | 33,185 | 96.36¢ per $1 |
| Gini / Inequality Index | 33,185 | 0.45 |
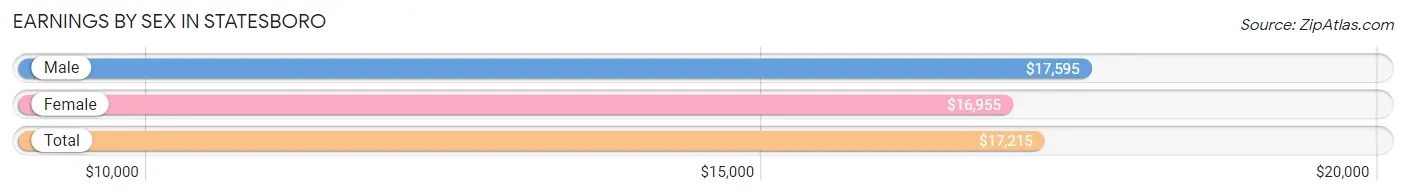
Earnings by Sex in Statesboro
Average Earnings in Statesboro are $17,215, $17,595 for men and $16,955 for women, a difference of 3.6%.
| Sex | Number | Average Earnings |
| Male | 9,281 (51.3%) | $17,595 |
| Female | 8,809 (48.7%) | $16,955 |
| Total | 18,090 (100.0%) | $17,215 |
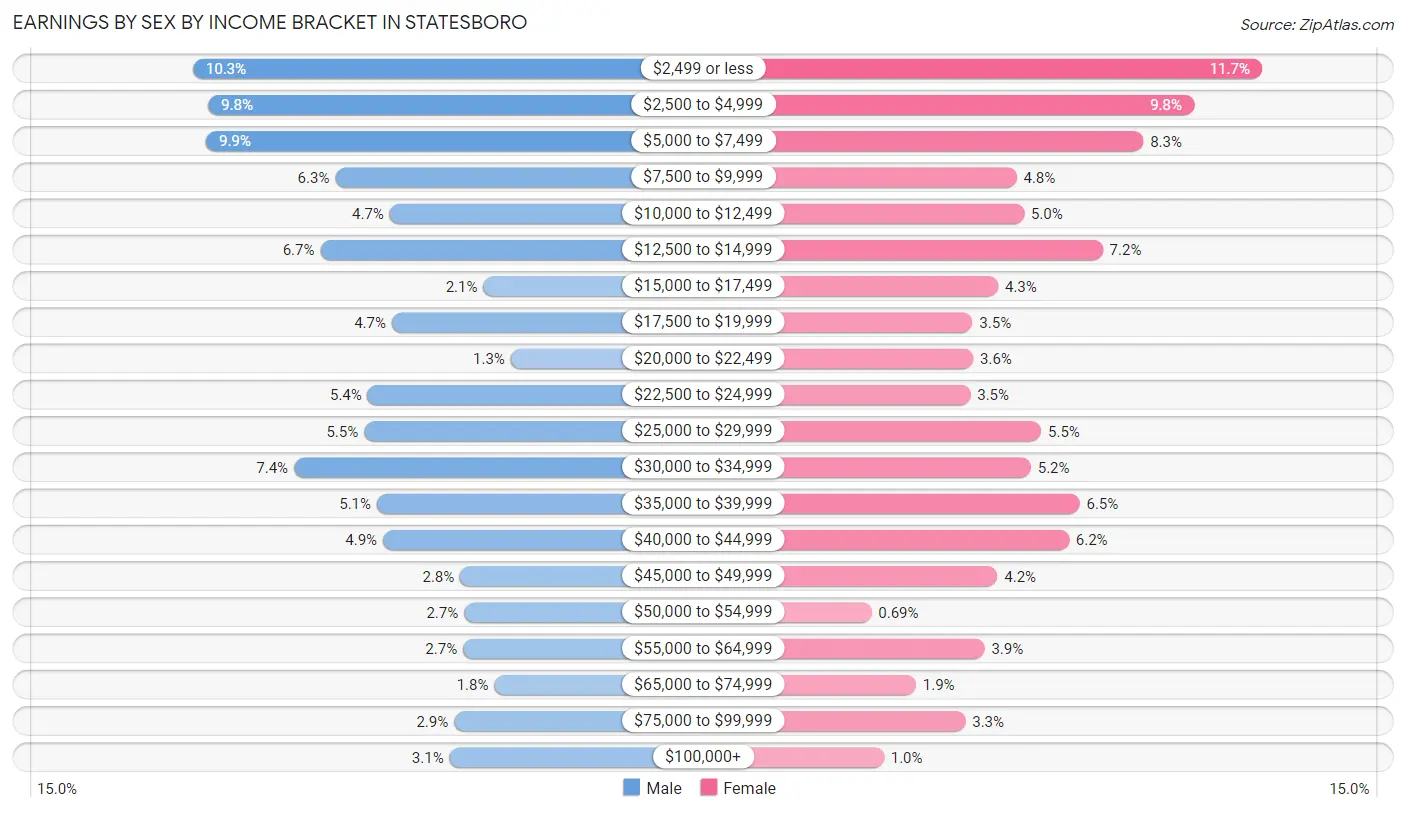
Earnings by Sex by Income Bracket in Statesboro
The most common earnings brackets in Statesboro are $2,499 or less for men (953 | 10.3%) and $2,499 or less for women (1,027 | 11.7%).
| Income | Male | Female |
| $2,499 or less | 953 (10.3%) | 1,027 (11.7%) |
| $2,500 to $4,999 | 913 (9.8%) | 859 (9.8%) |
| $5,000 to $7,499 | 919 (9.9%) | 734 (8.3%) |
| $7,500 to $9,999 | 582 (6.3%) | 420 (4.8%) |
| $10,000 to $12,499 | 440 (4.7%) | 439 (5.0%) |
| $12,500 to $14,999 | 621 (6.7%) | 633 (7.2%) |
| $15,000 to $17,499 | 196 (2.1%) | 374 (4.3%) |
| $17,500 to $19,999 | 434 (4.7%) | 311 (3.5%) |
| $20,000 to $22,499 | 124 (1.3%) | 313 (3.5%) |
| $22,500 to $24,999 | 497 (5.4%) | 306 (3.5%) |
| $25,000 to $29,999 | 507 (5.5%) | 481 (5.5%) |
| $30,000 to $34,999 | 690 (7.4%) | 455 (5.2%) |
| $35,000 to $39,999 | 473 (5.1%) | 576 (6.5%) |
| $40,000 to $44,999 | 458 (4.9%) | 550 (6.2%) |
| $45,000 to $49,999 | 256 (2.8%) | 373 (4.2%) |
| $50,000 to $54,999 | 246 (2.6%) | 61 (0.7%) |
| $55,000 to $64,999 | 249 (2.7%) | 341 (3.9%) |
| $65,000 to $74,999 | 167 (1.8%) | 171 (1.9%) |
| $75,000 to $99,999 | 272 (2.9%) | 293 (3.3%) |
| $100,000+ | 284 (3.1%) | 92 (1.0%) |
| Total | 9,281 (100.0%) | 8,809 (100.0%) |
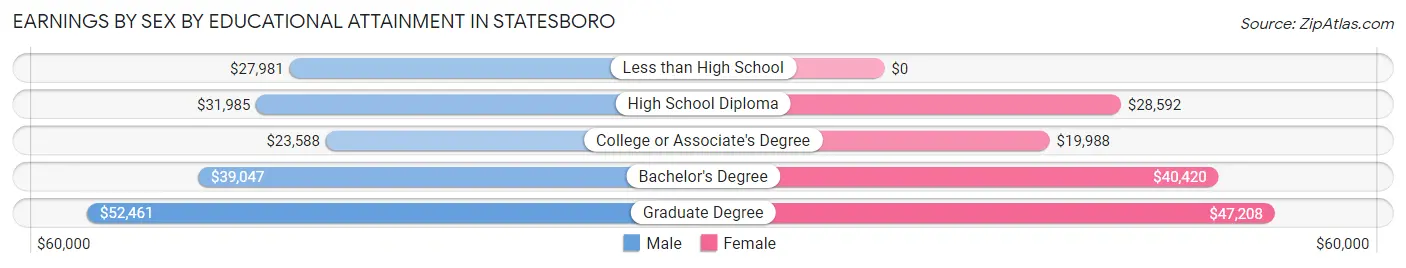
Earnings by Sex by Educational Attainment in Statesboro
Average earnings in Statesboro are $34,663 for men and $33,324 for women, a difference of 3.9%. Men with an educational attainment of graduate degree enjoy the highest average annual earnings of $52,461, while those with college or associate's degree education earn the least with $23,588. Women with an educational attainment of graduate degree earn the most with the average annual earnings of $47,208, while those with college or associate's degree education have the smallest earnings of $19,988.
| Educational Attainment | Male Income | Female Income |
| Less than High School | $27,981 | $0 |
| High School Diploma | $31,985 | $28,592 |
| College or Associate's Degree | $23,588 | $19,988 |
| Bachelor's Degree | $39,047 | $40,420 |
| Graduate Degree | $52,461 | $47,208 |
| Total | $34,663 | $33,324 |
Family Income in Statesboro
Family Income Brackets in Statesboro
According to the Statesboro family income data, there are 977 families falling into the $50,000 to $74,999 income range, which is the most common income bracket and makes up 20.3% of all families. Conversely, the $200,000+ income bracket is the least frequent group with only 87 families (1.8%) belonging to this category.
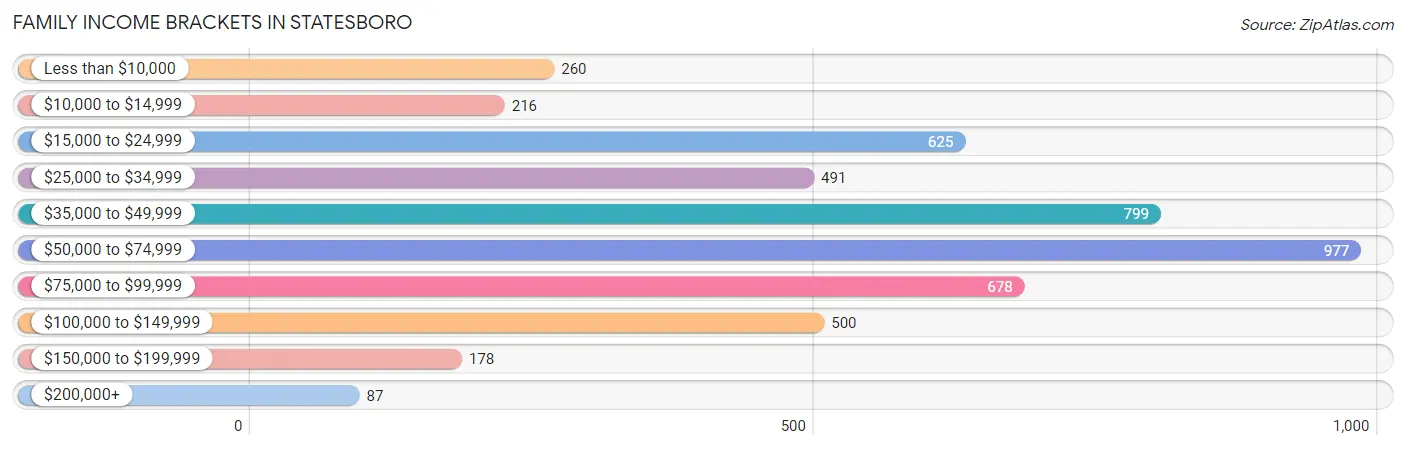
| Income Bracket | # Families | % Families |
| Less than $10,000 | 260 | 5.4% |
| $10,000 to $14,999 | 216 | 4.5% |
| $15,000 to $24,999 | 625 | 13.0% |
| $25,000 to $34,999 | 491 | 10.2% |
| $35,000 to $49,999 | 799 | 16.6% |
| $50,000 to $74,999 | 977 | 20.3% |
| $75,000 to $99,999 | 678 | 14.1% |
| $100,000 to $149,999 | 500 | 10.4% |
| $150,000 to $199,999 | 178 | 3.7% |
| $200,000+ | 87 | 1.8% |
Family Income by Famaliy Size in Statesboro
3-person families (1,019 | 21.2%) account for the highest median family income in Statesboro with $59,258 per family, while 2-person families (2,332 | 48.5%) have the highest median income of $23,714 per family member.
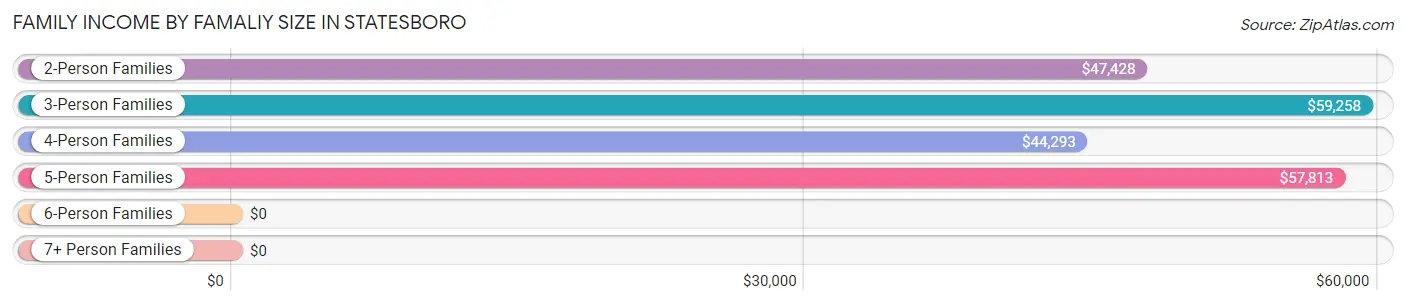
| Income Bracket | # Families | Median Income |
| 2-Person Families | 2,332 (48.5%) | $47,428 |
| 3-Person Families | 1,019 (21.2%) | $59,258 |
| 4-Person Families | 864 (18.0%) | $44,293 |
| 5-Person Families | 308 (6.4%) | $57,813 |
| 6-Person Families | 215 (4.5%) | $0 |
| 7+ Person Families | 73 (1.5%) | $0 |
| Total | 4,811 (100.0%) | $50,417 |
Family Income by Number of Earners in Statesboro
The median family income in Statesboro is $50,417, with families comprising 3+ earners (237) having the highest median family income of $114,830, while families with no earners (714) have the lowest median family income of $31,462, accounting for 4.9% and 14.8% of families, respectively.
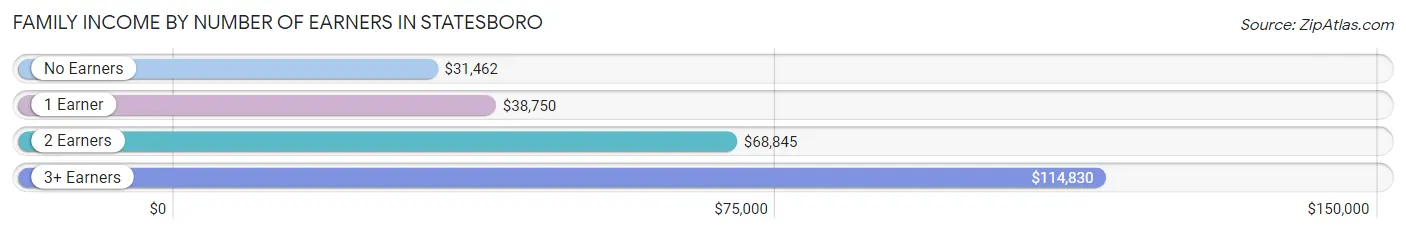
| Number of Earners | # Families | Median Income |
| No Earners | 714 (14.8%) | $31,462 |
| 1 Earner | 2,197 (45.7%) | $38,750 |
| 2 Earners | 1,663 (34.6%) | $68,845 |
| 3+ Earners | 237 (4.9%) | $114,830 |
| Total | 4,811 (100.0%) | $50,417 |
Household Income in Statesboro
Household Income Brackets in Statesboro
With 2,039 households falling in the category, the $35,000 to $49,999 income range is the most frequent in Statesboro, accounting for 17.2% of all households. In contrast, only 166 households (1.4%) fall into the $200,000+ income bracket, making it the least populous group.
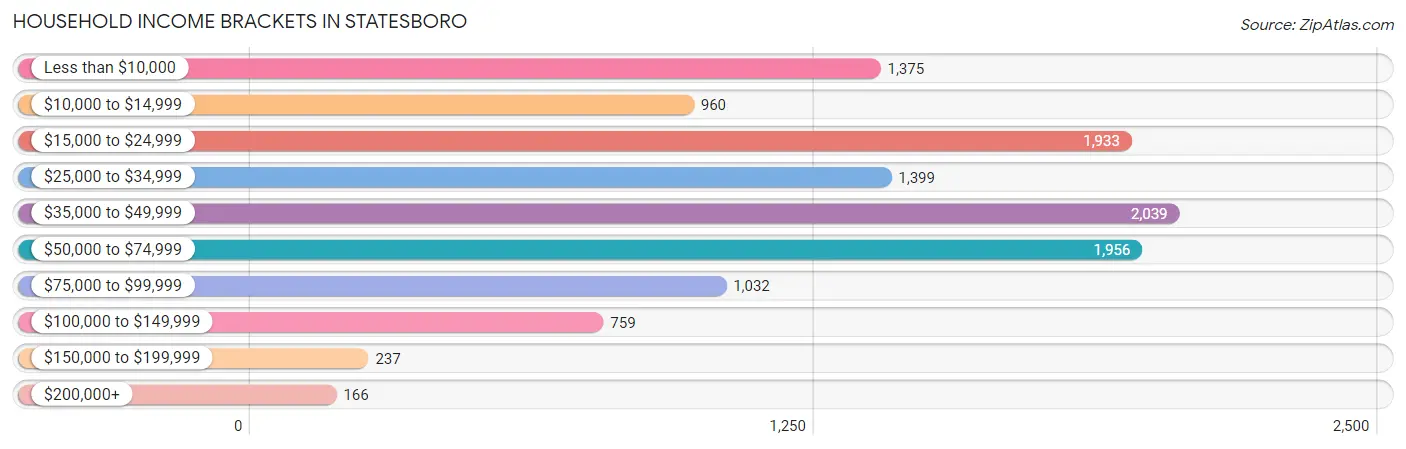
| Income Bracket | # Households | % Households |
| Less than $10,000 | 1,375 | 11.6% |
| $10,000 to $14,999 | 960 | 8.1% |
| $15,000 to $24,999 | 1,933 | 16.3% |
| $25,000 to $34,999 | 1,399 | 11.8% |
| $35,000 to $49,999 | 2,039 | 17.2% |
| $50,000 to $74,999 | 1,956 | 16.5% |
| $75,000 to $99,999 | 1,032 | 8.7% |
| $100,000 to $149,999 | 759 | 6.4% |
| $150,000 to $199,999 | 237 | 2.0% |
| $200,000+ | 166 | 1.4% |
Household Income by Householder Age in Statesboro
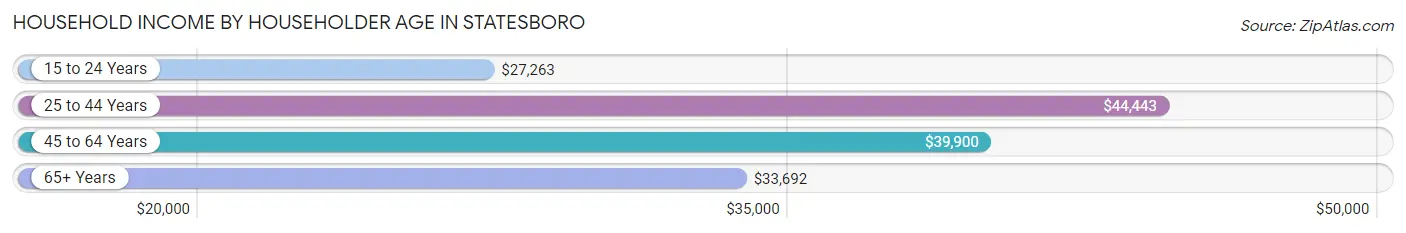
The median household income in Statesboro is $38,845, with the highest median household income of $44,443 found in the 25 to 44 years age bracket for the primary householder. A total of 4,120 households (34.7%) fall into this category. Meanwhile, the 15 to 24 years age bracket for the primary householder has the lowest median household income of $27,263, with 3,291 households (27.8%) in this group.
| Income Bracket | # Households | Median Income |
| 15 to 24 Years | 3,291 (27.8%) | $27,263 |
| 25 to 44 Years | 4,120 (34.7%) | $44,443 |
| 45 to 64 Years | 2,712 (22.9%) | $39,900 |
| 65+ Years | 1,734 (14.6%) | $33,692 |
| Total | 11,857 (100.0%) | $38,845 |
Poverty in Statesboro
Income Below Poverty by Sex and Age in Statesboro
With 37.5% poverty level for males and 36.9% for females among the residents of Statesboro, 15 year old males and 12 to 14 year old females are the most vulnerable to poverty, with 91 males (74.0%) and 247 females (61.4%) in their respective age groups living below the poverty level.
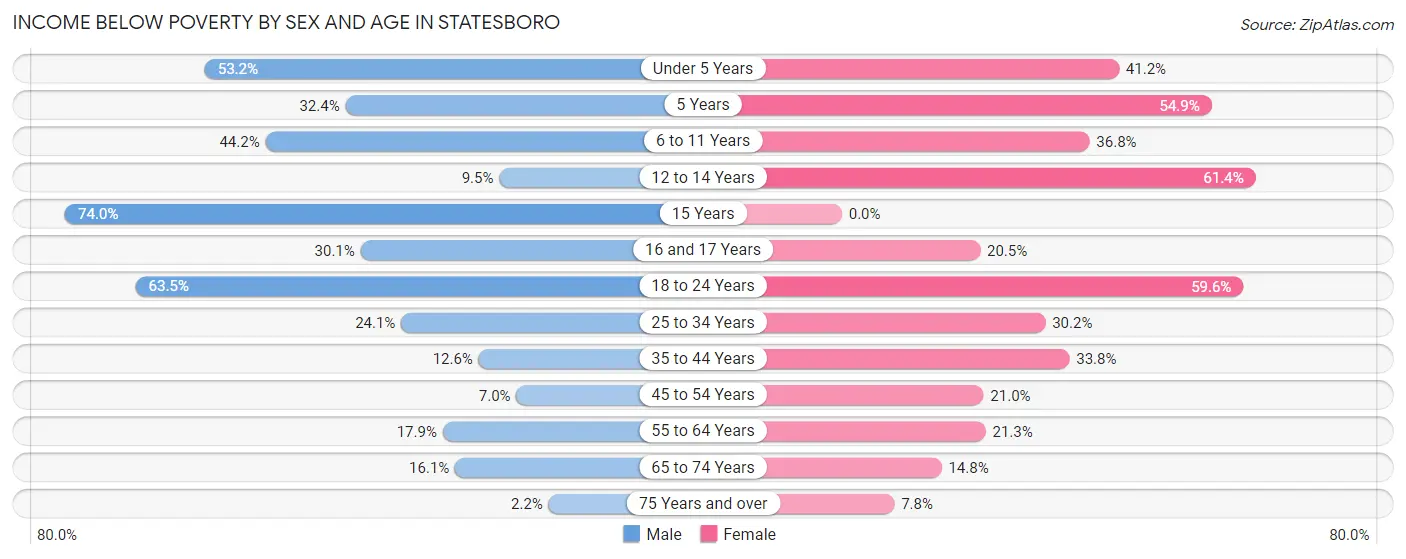
| Age Bracket | Male | Female |
| Under 5 Years | 386 (53.2%) | 265 (41.1%) |
| 5 Years | 11 (32.4%) | 28 (54.9%) |
| 6 to 11 Years | 318 (44.2%) | 364 (36.8%) |
| 12 to 14 Years | 58 (9.5%) | 247 (61.4%) |
| 15 Years | 91 (74.0%) | 0 (0.0%) |
| 16 and 17 Years | 56 (30.1%) | 70 (20.5%) |
| 18 to 24 Years | 2,968 (63.5%) | 2,343 (59.6%) |
| 25 to 34 Years | 567 (24.1%) | 722 (30.2%) |
| 35 to 44 Years | 111 (12.6%) | 431 (33.8%) |
| 45 to 54 Years | 66 (7.0%) | 258 (21.0%) |
| 55 to 64 Years | 120 (17.9%) | 246 (21.3%) |
| 65 to 74 Years | 98 (16.1%) | 120 (14.8%) |
| 75 Years and over | 9 (2.2%) | 51 (7.8%) |
| Total | 4,859 (37.5%) | 5,145 (36.9%) |
Income Above Poverty by Sex and Age in Statesboro
According to the poverty statistics in Statesboro, males aged 75 years and over and females aged 15 years are the age groups that are most secure financially, with 97.8% of males and 100.0% of females in these age groups living above the poverty line.
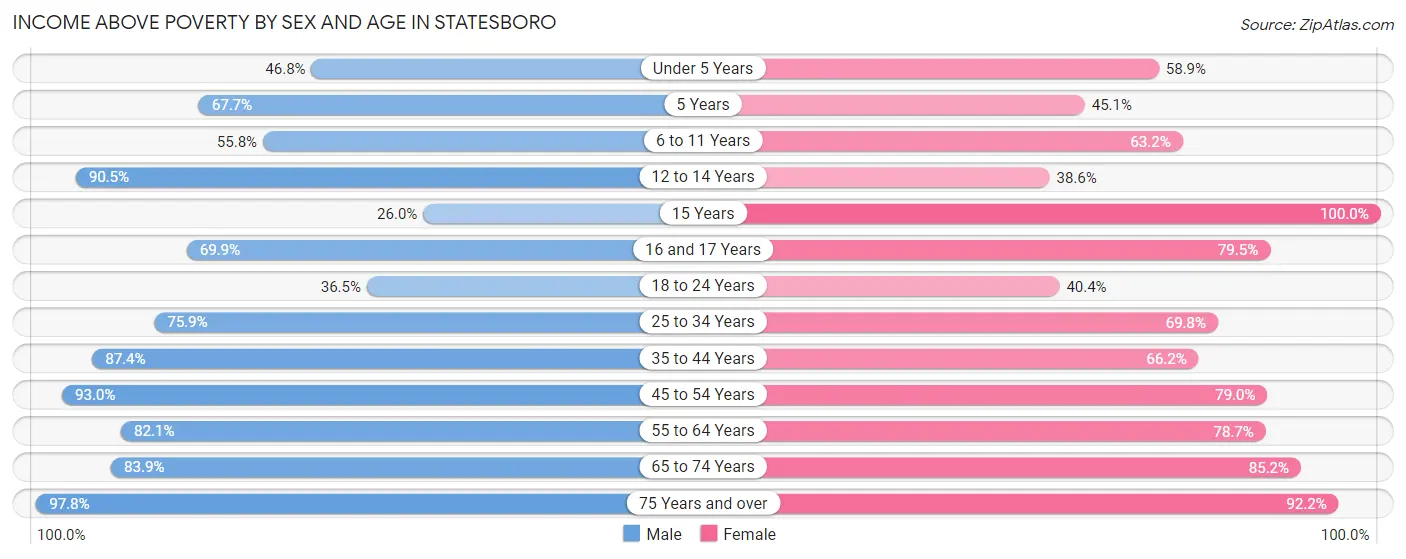
| Age Bracket | Male | Female |
| Under 5 Years | 339 (46.8%) | 379 (58.9%) |
| 5 Years | 23 (67.6%) | 23 (45.1%) |
| 6 to 11 Years | 401 (55.8%) | 626 (63.2%) |
| 12 to 14 Years | 552 (90.5%) | 155 (38.6%) |
| 15 Years | 32 (26.0%) | 78 (100.0%) |
| 16 and 17 Years | 130 (69.9%) | 271 (79.5%) |
| 18 to 24 Years | 1,705 (36.5%) | 1,588 (40.4%) |
| 25 to 34 Years | 1,788 (75.9%) | 1,668 (69.8%) |
| 35 to 44 Years | 772 (87.4%) | 845 (66.2%) |
| 45 to 54 Years | 881 (93.0%) | 969 (79.0%) |
| 55 to 64 Years | 550 (82.1%) | 907 (78.7%) |
| 65 to 74 Years | 512 (83.9%) | 691 (85.2%) |
| 75 Years and over | 404 (97.8%) | 604 (92.2%) |
| Total | 8,089 (62.5%) | 8,804 (63.1%) |
Income Below Poverty Among Married-Couple Families in Statesboro
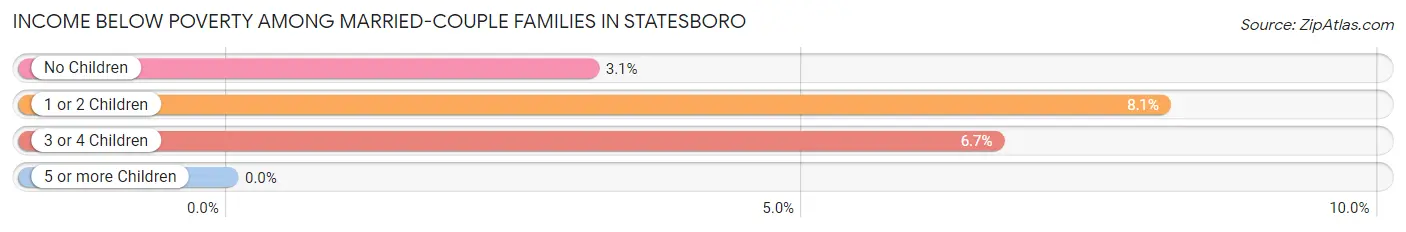
The poverty statistics for married-couple families in Statesboro show that 5.4% or 115 of the total 2,131 families live below the poverty line. Families with 1 or 2 children have the highest poverty rate of 8.1%, comprising of 62 families. On the other hand, families with no children have the lowest poverty rate of 3.1%, which includes 34 families.
| Children | Above Poverty | Below Poverty |
| No Children | 1,048 (96.9%) | 34 (3.1%) |
| 1 or 2 Children | 702 (91.9%) | 62 (8.1%) |
| 3 or 4 Children | 266 (93.3%) | 19 (6.7%) |
| 5 or more Children | 0 (0.0%) | 0 (0.0%) |
| Total | 2,016 (94.6%) | 115 (5.4%) |
Income Below Poverty Among Single-Parent Households in Statesboro
According to the poverty data in Statesboro, 30.9% or 118 single-father households and 35.1% or 807 single-mother households are living below the poverty line. Among single-father households, those with 3 or 4 children have the highest poverty rate, with 46 households (100.0%) experiencing poverty. Likewise, among single-mother households, those with 5 or more children have the highest poverty rate, with 73 households (100.0%) falling below the poverty line.
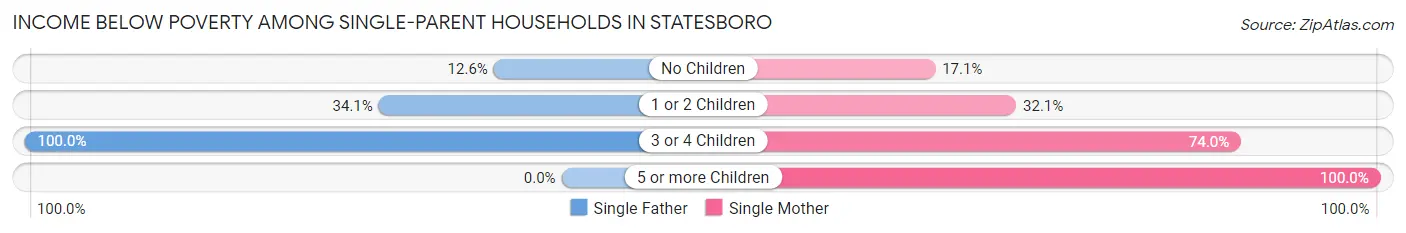
| Children | Single Father | Single Mother |
| No Children | 25 (12.6%) | 135 (17.1%) |
| 1 or 2 Children | 47 (34.1%) | 354 (32.1%) |
| 3 or 4 Children | 46 (100.0%) | 245 (74.0%) |
| 5 or more Children | 0 (0.0%) | 73 (100.0%) |
| Total | 118 (30.9%) | 807 (35.1%) |
Income Below Poverty Among Married-Couple vs Single-Parent Households in Statesboro
The poverty data for Statesboro shows that 115 of the married-couple family households (5.4%) and 925 of the single-parent households (34.5%) are living below the poverty level. Within the married-couple family households, those with 1 or 2 children have the highest poverty rate, with 62 households (8.1%) falling below the poverty line. Among the single-parent households, those with 5 or more children have the highest poverty rate, with 73 household (100.0%) living below poverty.
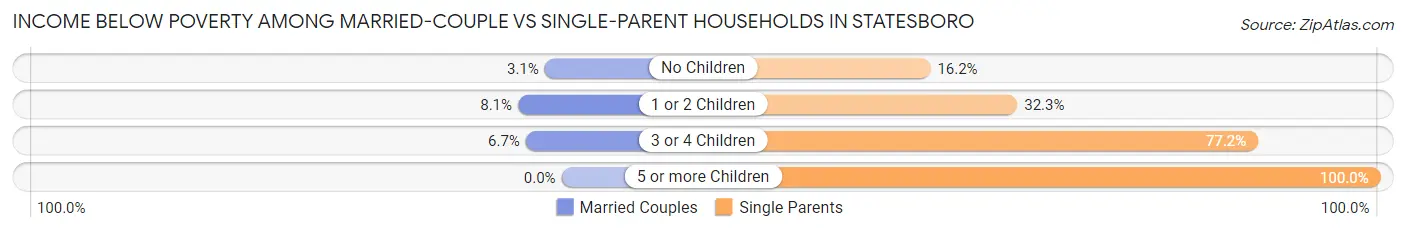
| Children | Married-Couple Families | Single-Parent Households |
| No Children | 34 (3.1%) | 160 (16.2%) |
| 1 or 2 Children | 62 (8.1%) | 401 (32.3%) |
| 3 or 4 Children | 19 (6.7%) | 291 (77.2%) |
| 5 or more Children | 0 (0.0%) | 73 (100.0%) |
| Total | 115 (5.4%) | 925 (34.5%) |
Race in Statesboro
The most populous races in Statesboro are White / Caucasian (15,946 | 48.0%), Black / African American (14,197 | 42.8%), and Two or more Races (1,997 | 6.0%).
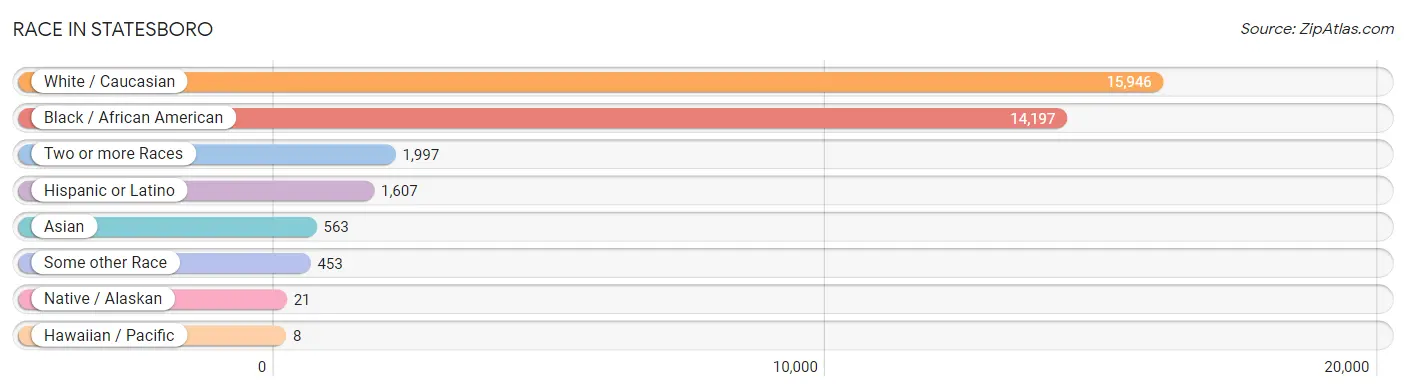
| Race | # Population | % Population |
| Asian | 563 | 1.7% |
| Black / African American | 14,197 | 42.8% |
| Hawaiian / Pacific | 8 | 0.0% |
| Hispanic or Latino | 1,607 | 4.8% |
| Native / Alaskan | 21 | 0.1% |
| White / Caucasian | 15,946 | 48.0% |
| Two or more Races | 1,997 | 6.0% |
| Some other Race | 453 | 1.4% |
| Total | 33,185 | 100.0% |
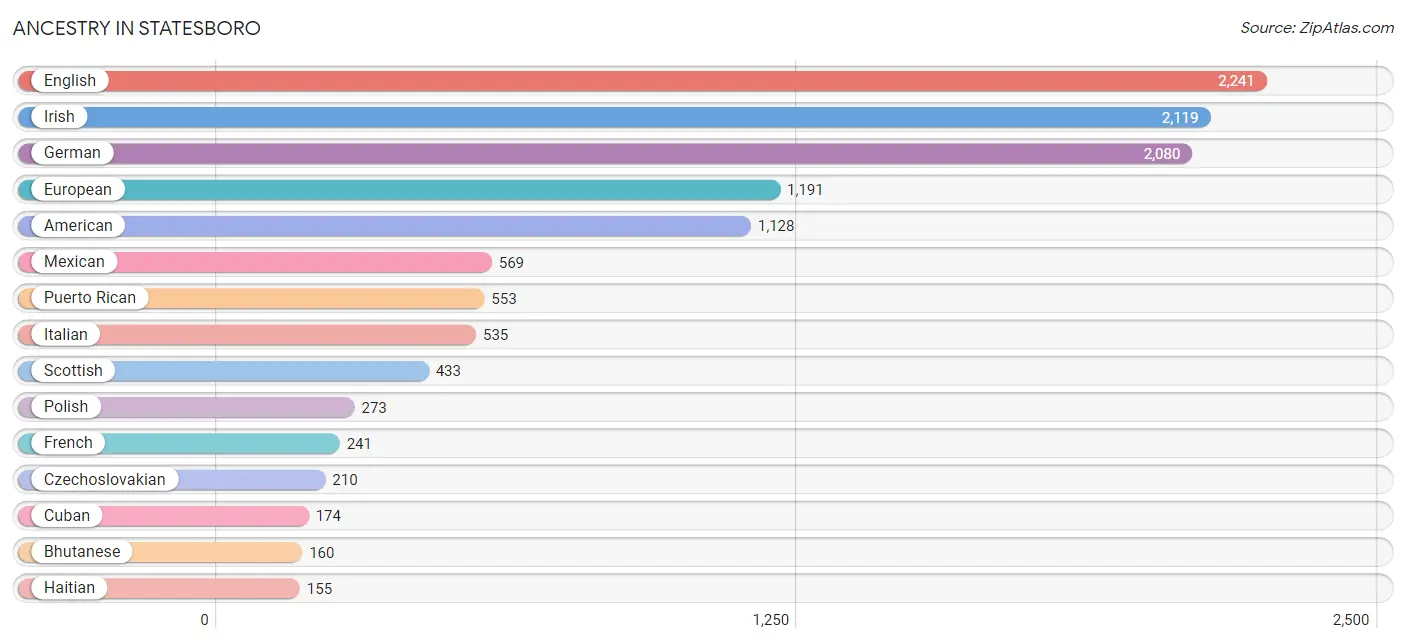
Ancestry in Statesboro
The most populous ancestries reported in Statesboro are English (2,241 | 6.8%), Irish (2,119 | 6.4%), German (2,080 | 6.3%), European (1,191 | 3.6%), and American (1,128 | 3.4%), together accounting for 26.4% of all Statesboro residents.
| Ancestry | # Population | % Population |
| Afghan | 10 | 0.0% |
| African | 28 | 0.1% |
| American | 1,128 | 3.4% |
| Arab | 64 | 0.2% |
| Austrian | 13 | 0.0% |
| Belgian | 18 | 0.1% |
| Bhutanese | 160 | 0.5% |
| Brazilian | 5 | 0.0% |
| British | 153 | 0.5% |
| Burmese | 62 | 0.2% |
| Canadian | 17 | 0.1% |
| Central American | 94 | 0.3% |
| Cherokee | 151 | 0.5% |
| Choctaw | 7 | 0.0% |
| Colombian | 28 | 0.1% |
| Costa Rican | 9 | 0.0% |
| Creek | 6 | 0.0% |
| Cuban | 174 | 0.5% |
| Czech | 48 | 0.1% |
| Czechoslovakian | 210 | 0.6% |
| Danish | 69 | 0.2% |
| Dominican | 20 | 0.1% |
| Dutch | 59 | 0.2% |
| Eastern European | 127 | 0.4% |
| Egyptian | 28 | 0.1% |
| English | 2,241 | 6.8% |
| European | 1,191 | 3.6% |
| Finnish | 93 | 0.3% |
| French | 241 | 0.7% |
| French Canadian | 24 | 0.1% |
| German | 2,080 | 6.3% |
| Ghanaian | 29 | 0.1% |
| Greek | 95 | 0.3% |
| Guatemalan | 6 | 0.0% |
| Haitian | 155 | 0.5% |
| Honduran | 71 | 0.2% |
| Hungarian | 29 | 0.1% |
| Indian (Asian) | 103 | 0.3% |
| Irish | 2,119 | 6.4% |
| Italian | 535 | 1.6% |
| Jamaican | 73 | 0.2% |
| Kenyan | 3 | 0.0% |
| Korean | 48 | 0.1% |
| Lebanese | 36 | 0.1% |
| Mexican | 569 | 1.7% |
| Mexican American Indian | 6 | 0.0% |
| Native Hawaiian | 14 | 0.0% |
| Nigerian | 49 | 0.2% |
| Northern European | 24 | 0.1% |
| Norwegian | 43 | 0.1% |
| Polish | 273 | 0.8% |
| Portuguese | 63 | 0.2% |
| Puerto Rican | 553 | 1.7% |
| Russian | 95 | 0.3% |
| Salvadoran | 8 | 0.0% |
| Scandinavian | 30 | 0.1% |
| Scotch-Irish | 117 | 0.4% |
| Scottish | 433 | 1.3% |
| Sioux | 7 | 0.0% |
| Slovak | 9 | 0.0% |
| Slovene | 114 | 0.3% |
| South African | 6 | 0.0% |
| South American | 45 | 0.1% |
| Spaniard | 48 | 0.1% |
| Spanish | 33 | 0.1% |
| Sri Lankan | 51 | 0.2% |
| Subsaharan African | 150 | 0.4% |
| Swedish | 135 | 0.4% |
| Swiss | 87 | 0.3% |
| Thai | 152 | 0.5% |
| Turkish | 27 | 0.1% |
| Ukrainian | 15 | 0.1% |
| Venezuelan | 17 | 0.1% |
| Vietnamese | 21 | 0.1% |
| Welsh | 36 | 0.1% |
| West Indian | 9 | 0.0% | View All 76 Rows |
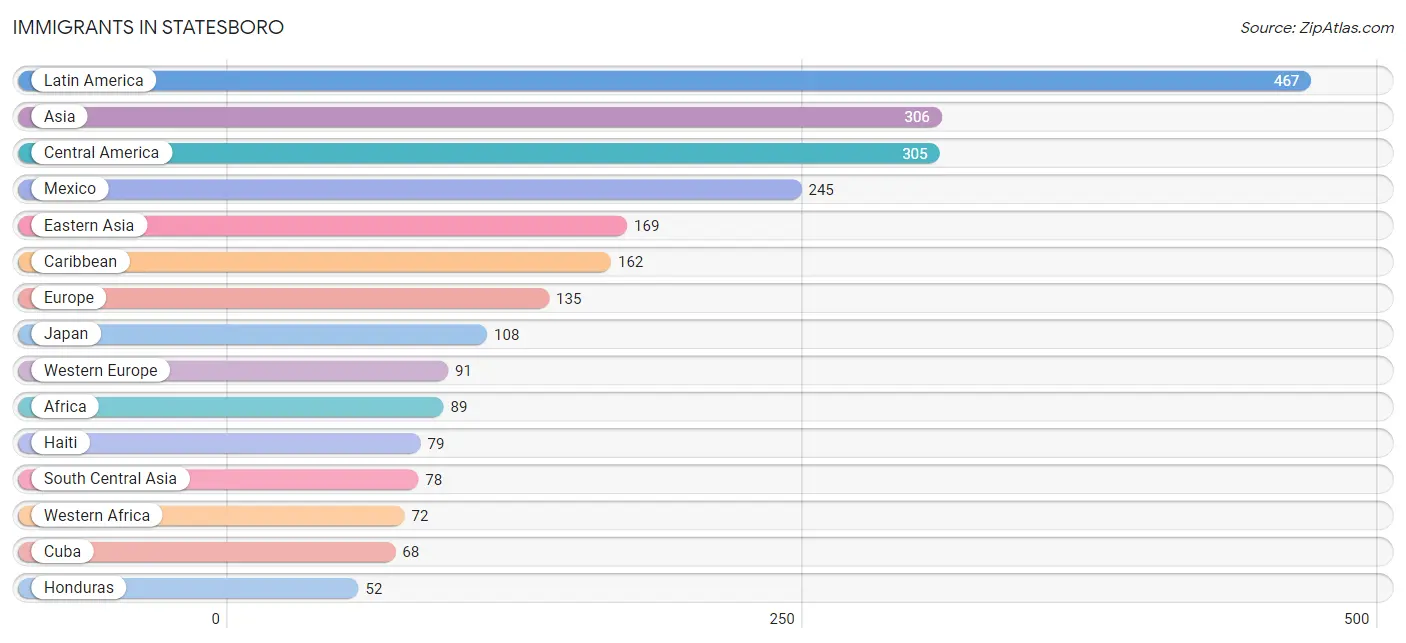
Immigrants in Statesboro
The most numerous immigrant groups reported in Statesboro came from Latin America (467 | 1.4%), Asia (306 | 0.9%), Central America (305 | 0.9%), Mexico (245 | 0.7%), and Eastern Asia (169 | 0.5%), together accounting for 4.5% of all Statesboro residents.
| Immigration Origin | # Population | % Population |
| Afghanistan | 18 | 0.1% |
| Africa | 89 | 0.3% |
| Asia | 306 | 0.9% |
| Bangladesh | 8 | 0.0% |
| Belarus | 19 | 0.1% |
| Belgium | 33 | 0.1% |
| Canada | 49 | 0.2% |
| Caribbean | 162 | 0.5% |
| Central America | 305 | 0.9% |
| China | 44 | 0.1% |
| Cuba | 68 | 0.2% |
| Denmark | 8 | 0.0% |
| Eastern Asia | 169 | 0.5% |
| Eastern Europe | 19 | 0.1% |
| El Salvador | 8 | 0.0% |
| Europe | 135 | 0.4% |
| Germany | 48 | 0.1% |
| Ghana | 29 | 0.1% |
| Haiti | 79 | 0.2% |
| Honduras | 52 | 0.2% |
| India | 52 | 0.2% |
| Jamaica | 6 | 0.0% |
| Japan | 108 | 0.3% |
| Korea | 17 | 0.1% |
| Latin America | 467 | 1.4% |
| Mexico | 245 | 0.7% |
| Nigeria | 43 | 0.1% |
| Northern Europe | 25 | 0.1% |
| Norway | 5 | 0.0% |
| Philippines | 31 | 0.1% |
| South Africa | 17 | 0.1% |
| South Central Asia | 78 | 0.2% |
| South Eastern Asia | 37 | 0.1% |
| Switzerland | 10 | 0.0% |
| Trinidad and Tobago | 9 | 0.0% |
| Turkey | 22 | 0.1% |
| Vietnam | 6 | 0.0% |
| Western Africa | 72 | 0.2% |
| Western Asia | 22 | 0.1% |
| Western Europe | 91 | 0.3% | View All 40 Rows |
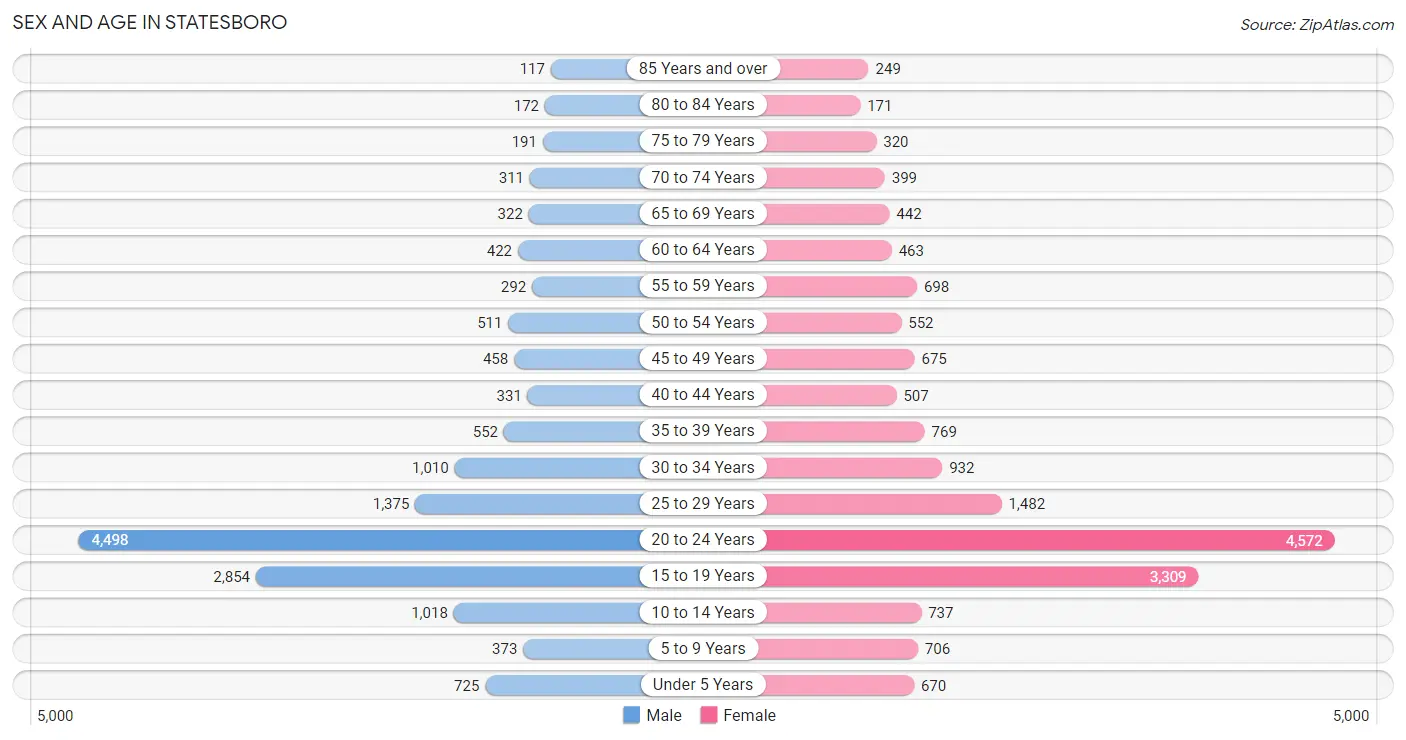
Sex and Age in Statesboro
Sex and Age in Statesboro
The most populous age groups in Statesboro are 20 to 24 Years (4,498 | 29.0%) for men and 20 to 24 Years (4,572 | 25.9%) for women.
| Age Bracket | Male | Female |
| Under 5 Years | 725 (4.7%) | 670 (3.8%) |
| 5 to 9 Years | 373 (2.4%) | 706 (4.0%) |
| 10 to 14 Years | 1,018 (6.6%) | 737 (4.2%) |
| 15 to 19 Years | 2,854 (18.4%) | 3,309 (18.7%) |
| 20 to 24 Years | 4,498 (29.0%) | 4,572 (25.9%) |
| 25 to 29 Years | 1,375 (8.8%) | 1,482 (8.4%) |
| 30 to 34 Years | 1,010 (6.5%) | 932 (5.3%) |
| 35 to 39 Years | 552 (3.5%) | 769 (4.4%) |
| 40 to 44 Years | 331 (2.1%) | 507 (2.9%) |
| 45 to 49 Years | 458 (2.9%) | 675 (3.8%) |
| 50 to 54 Years | 511 (3.3%) | 552 (3.1%) |
| 55 to 59 Years | 292 (1.9%) | 698 (4.0%) |
| 60 to 64 Years | 422 (2.7%) | 463 (2.6%) |
| 65 to 69 Years | 322 (2.1%) | 442 (2.5%) |
| 70 to 74 Years | 311 (2.0%) | 399 (2.3%) |
| 75 to 79 Years | 191 (1.2%) | 320 (1.8%) |
| 80 to 84 Years | 172 (1.1%) | 171 (1.0%) |
| 85 Years and over | 117 (0.7%) | 249 (1.4%) |
| Total | 15,532 (100.0%) | 17,653 (100.0%) |
Families and Households in Statesboro
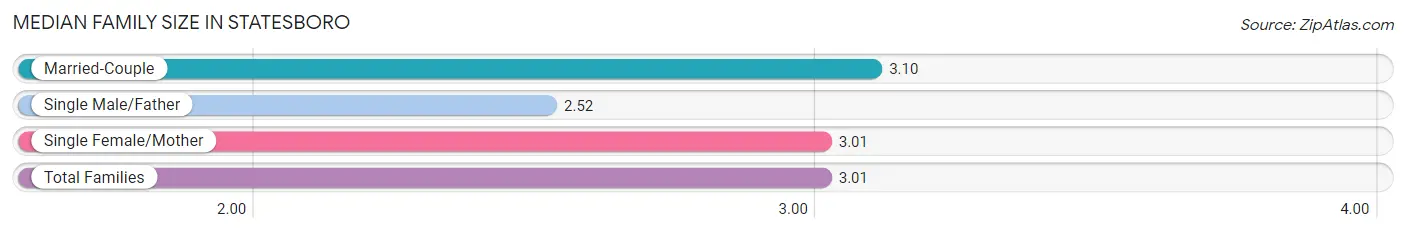
Median Family Size in Statesboro
The median family size in Statesboro is 3.01 persons per family, with married-couple families (2,131 | 44.3%) accounting for the largest median family size of 3.1 persons per family. On the other hand, single male/father families (382 | 7.9%) represent the smallest median family size with 2.52 persons per family.
| Family Type | # Families | Family Size |
| Married-Couple | 2,131 (44.3%) | 3.10 |
| Single Male/Father | 382 (7.9%) | 2.52 |
| Single Female/Mother | 2,298 (47.8%) | 3.01 |
| Total Families | 4,811 (100.0%) | 3.01 |
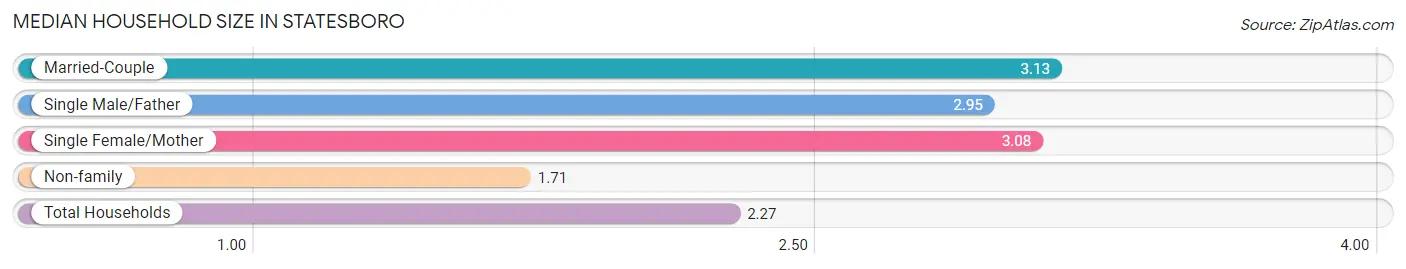
Median Household Size in Statesboro
The median household size in Statesboro is 2.27 persons per household, with married-couple households (2,131 | 18.0%) accounting for the largest median household size of 3.13 persons per household. non-family households (7,046 | 59.4%) represent the smallest median household size with 1.71 persons per household.
| Household Type | # Households | Household Size |
| Married-Couple | 2,131 (18.0%) | 3.13 |
| Single Male/Father | 382 (3.2%) | 2.95 |
| Single Female/Mother | 2,298 (19.4%) | 3.08 |
| Non-family | 7,046 (59.4%) | 1.71 |
| Total Households | 11,857 (100.0%) | 2.27 |
Household Size by Marriage Status in Statesboro
Out of a total of 11,857 households in Statesboro, 4,811 (40.6%) are family households, while 7,046 (59.4%) are nonfamily households. The most numerous type of family households are 2-person households, comprising 2,161, and the most common type of nonfamily households are 1-person households, comprising 4,188.
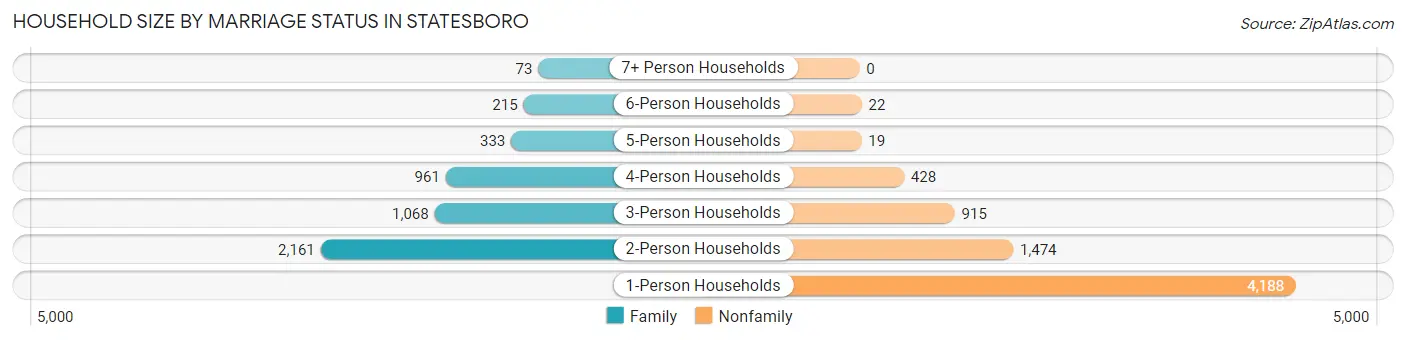
| Household Size | Family Households | Nonfamily Households |
| 1-Person Households | - | 4,188 (35.3%) |
| 2-Person Households | 2,161 (18.2%) | 1,474 (12.4%) |
| 3-Person Households | 1,068 (9.0%) | 915 (7.7%) |
| 4-Person Households | 961 (8.1%) | 428 (3.6%) |
| 5-Person Households | 333 (2.8%) | 19 (0.2%) |
| 6-Person Households | 215 (1.8%) | 22 (0.2%) |
| 7+ Person Households | 73 (0.6%) | 0 (0.0%) |
| Total | 4,811 (40.6%) | 7,046 (59.4%) |
Female Fertility in Statesboro
Fertility by Age in Statesboro
Average fertility rate in Statesboro is 21.0 births per 1,000 women. Women in the age bracket of 20 to 34 years have the highest fertility rate with 28.0 births per 1,000 women. Women in the age bracket of 20 to 34 years acount for 77.5% of all women with births.
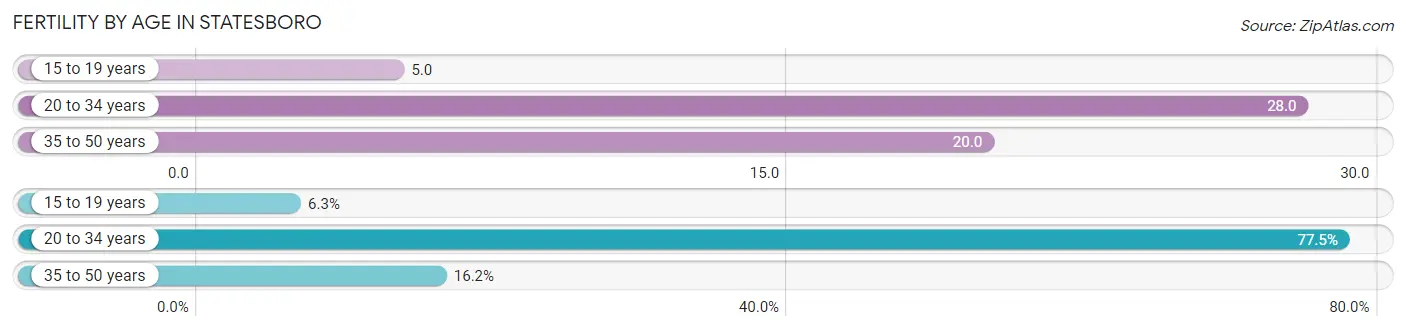
| Age Bracket | Women with Births | Births / 1,000 Women |
| 15 to 19 years | 16 (6.3%) | 5.0 |
| 20 to 34 years | 196 (77.5%) | 28.0 |
| 35 to 50 years | 41 (16.2%) | 20.0 |
| Total | 253 (100.0%) | 21.0 |
Fertility by Age by Marriage Status in Statesboro
51.0% of women with births (253) in Statesboro are married. The highest percentage of unmarried women with births falls into 15 to 19 years age bracket with 100.0% of them unmarried at the time of birth, while the lowest percentage of unmarried women with births belong to 35 to 50 years age bracket with 0.0% of them unmarried.
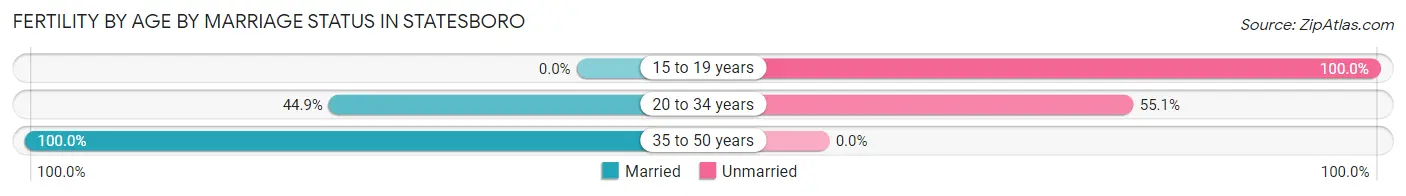
| Age Bracket | Married | Unmarried |
| 15 to 19 years | 0 (0.0%) | 16 (100.0%) |
| 20 to 34 years | 88 (44.9%) | 108 (55.1%) |
| 35 to 50 years | 41 (100.0%) | 0 (0.0%) |
| Total | 129 (51.0%) | 124 (49.0%) |
Fertility by Education in Statesboro
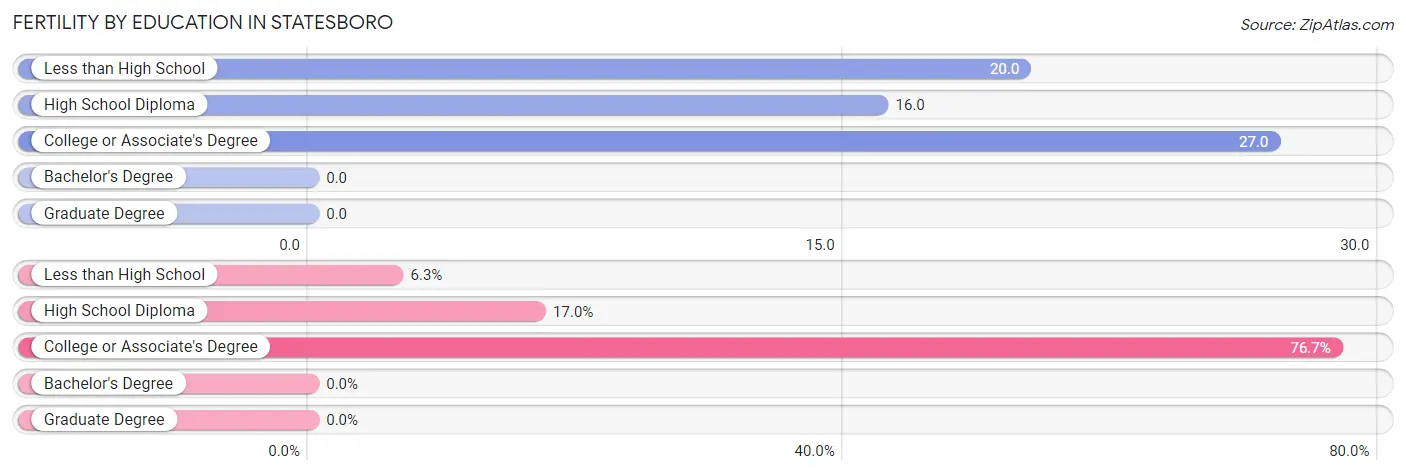
| Educational Attainment | Women with Births | Births / 1,000 Women |
| Less than High School | 16 (6.3%) | 20.0 |
| High School Diploma | 43 (17.0%) | 16.0 |
| College or Associate's Degree | 194 (76.7%) | 27.0 |
| Bachelor's Degree | 0 (0.0%) | 0.0 |
| Graduate Degree | 0 (0.0%) | 0.0 |
| Total | 253 (100.0%) | 21.0 |
Fertility by Education by Marriage Status in Statesboro
49.0% of women with births in Statesboro are unmarried. Women with the educational attainment of college or associate's degree are most likely to be married with 64.9% of them married at childbirth, while women with the educational attainment of less than high school are least likely to be married with 100.0% of them unmarried at childbirth.
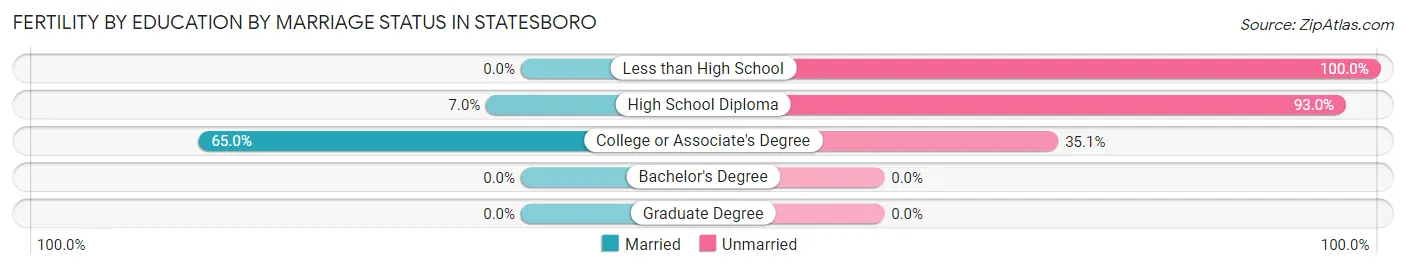
| Educational Attainment | Married | Unmarried |
| Less than High School | 0 (0.0%) | 16 (100.0%) |
| High School Diploma | 3 (7.0%) | 40 (93.0%) |
| College or Associate's Degree | 126 (64.9%) | 68 (35.0%) |
| Bachelor's Degree | 0 (0.0%) | 0 (0.0%) |
| Graduate Degree | 0 (0.0%) | 0 (0.0%) |
| Total | 129 (51.0%) | 124 (49.0%) |
Employment Characteristics in Statesboro
Employment by Class of Employer in Statesboro
Among the 13,976 employed individuals in Statesboro, private company employees (9,061 | 64.8%), state government employees (2,326 | 16.6%), and local government employees (750 | 5.4%) make up the most common classes of employment.
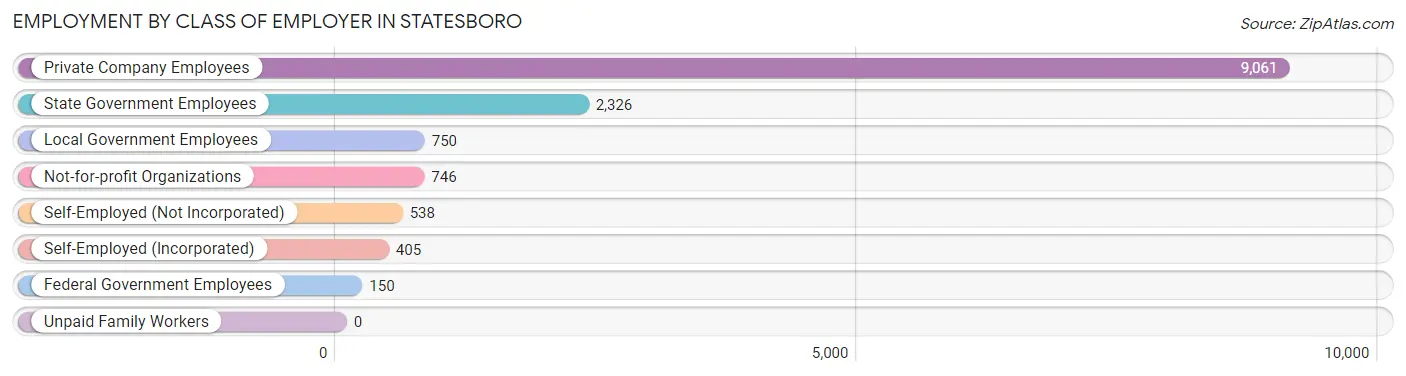
| Employer Class | # Employees | % Employees |
| Private Company Employees | 9,061 | 64.8% |
| Self-Employed (Incorporated) | 405 | 2.9% |
| Self-Employed (Not Incorporated) | 538 | 3.8% |
| Not-for-profit Organizations | 746 | 5.3% |
| Local Government Employees | 750 | 5.4% |
| State Government Employees | 2,326 | 16.6% |
| Federal Government Employees | 150 | 1.1% |
| Unpaid Family Workers | 0 | 0.0% |
| Total | 13,976 | 100.0% |
Employment Status by Age in Statesboro
According to the labor force statistics for Statesboro, out of the total population over 16 years of age (28,754), 57.4% or 16,505 individuals are in the labor force, with 11.3% or 1,865 of them unemployed. The age group with the highest labor force participation rate is 30 to 34 years, with 86.5% or 1,680 individuals in the labor force. Within the labor force, the 16 to 19 years age range has the highest percentage of unemployed individuals, with 27.0% or 512 of them being unemployed.
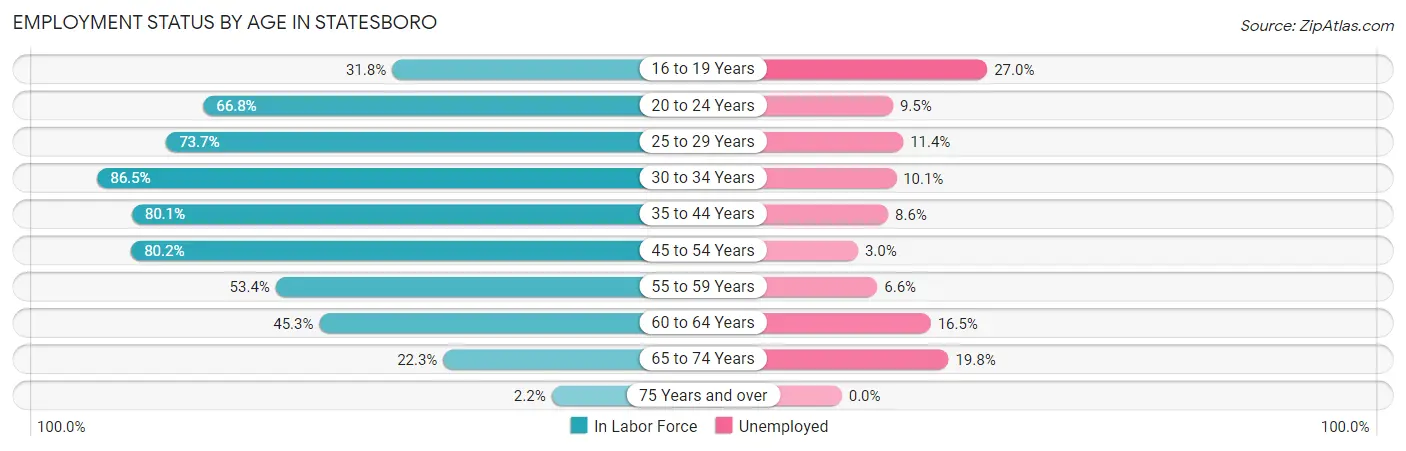
| Age Bracket | In Labor Force | Unemployed |
| 16 to 19 Years | 1,896 (31.8%) | 512 (27.0%) |
| 20 to 24 Years | 6,059 (66.8%) | 576 (9.5%) |
| 25 to 29 Years | 2,106 (73.7%) | 240 (11.4%) |
| 30 to 34 Years | 1,680 (86.5%) | 170 (10.1%) |
| 35 to 44 Years | 1,729 (80.1%) | 149 (8.6%) |
| 45 to 54 Years | 1,761 (80.2%) | 53 (3.0%) |
| 55 to 59 Years | 529 (53.4%) | 35 (6.6%) |
| 60 to 64 Years | 401 (45.3%) | 66 (16.5%) |
| 65 to 74 Years | 329 (22.3%) | 65 (19.8%) |
| 75 Years and over | 27 (2.2%) | 0 (0.0%) |
| Total | 16,505 (57.4%) | 1,865 (11.3%) |
Employment Status by Educational Attainment in Statesboro
According to labor force statistics for Statesboro, 74.4% of individuals (8,206) out of the total population between 25 and 64 years of age (11,029) are in the labor force, with 8.7% or 714 of them being unemployed. The group with the highest labor force participation rate are those with the educational attainment of bachelor's degree or higher, with 88.0% or 2,745 individuals in the labor force. Within the labor force, individuals with less than high school education have the highest percentage of unemployment, with 38.5% or 249 of them being unemployed.
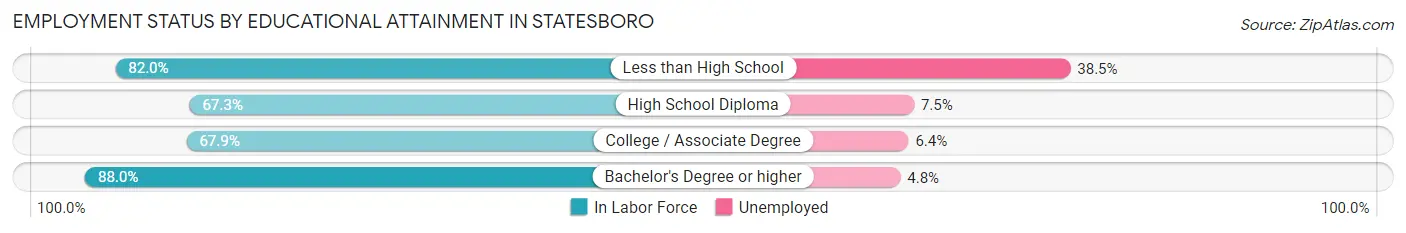
| Educational Attainment | In Labor Force | Unemployed |
| Less than High School | 647 (82.0%) | 304 (38.5%) |
| High School Diploma | 2,156 (67.3%) | 240 (7.5%) |
| College / Associate Degree | 2,660 (67.9%) | 251 (6.4%) |
| Bachelor's Degree or higher | 2,745 (88.0%) | 150 (4.8%) |
| Total | 8,206 (74.4%) | 960 (8.7%) |
Employment Occupations by Sex in Statesboro
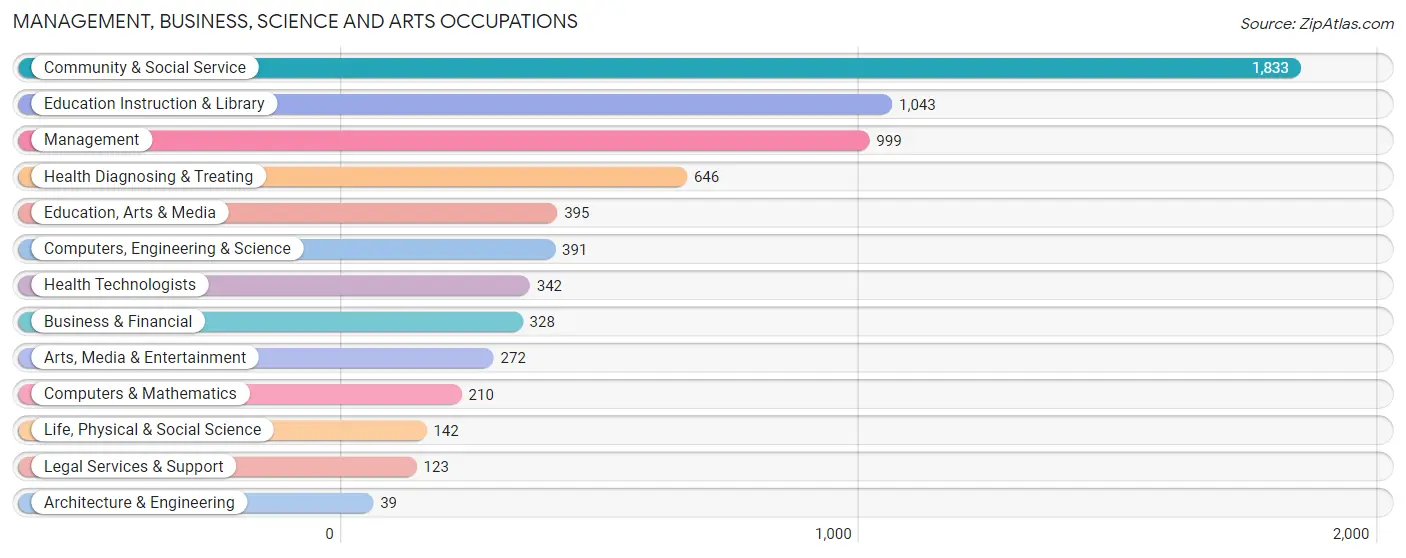
Management, Business, Science and Arts Occupations
The most common Management, Business, Science and Arts occupations in Statesboro are Community & Social Service (1,833 | 12.5%), Education Instruction & Library (1,043 | 7.1%), Management (999 | 6.8%), Health Diagnosing & Treating (646 | 4.4%), and Education, Arts & Media (395 | 2.7%).
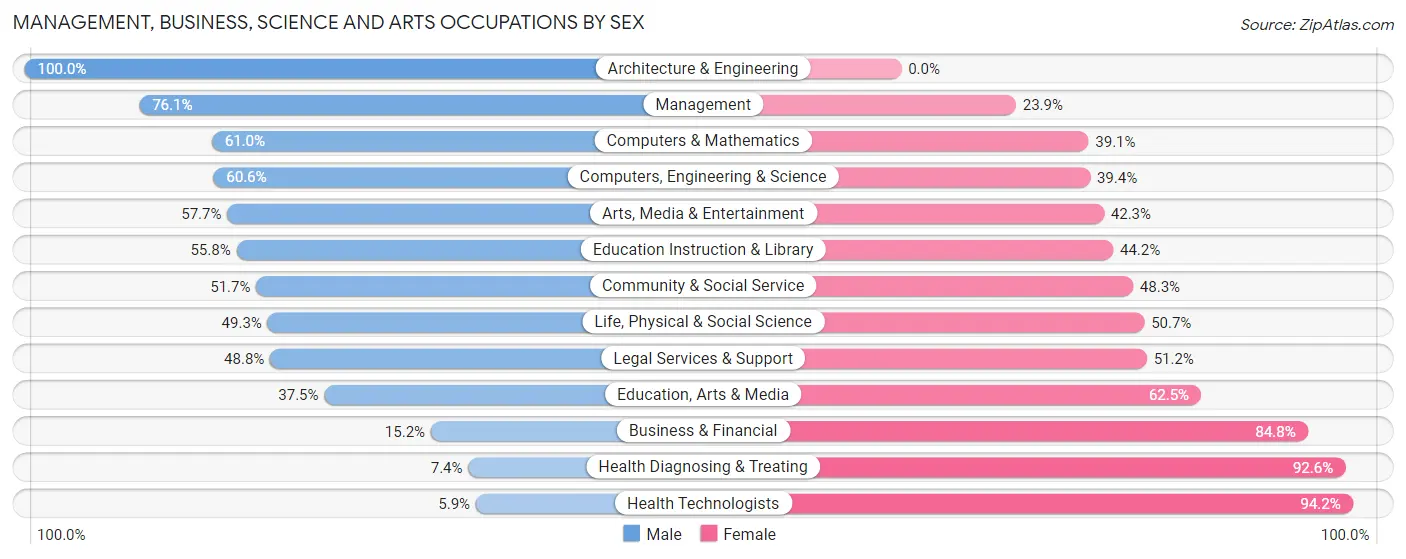
Management, Business, Science and Arts Occupations by Sex
Within the Management, Business, Science and Arts occupations in Statesboro, the most male-oriented occupations are Architecture & Engineering (100.0%), Management (76.1%), and Computers & Mathematics (61.0%), while the most female-oriented occupations are Health Technologists (94.2%), Health Diagnosing & Treating (92.6%), and Business & Financial (84.8%).
| Occupation | Male | Female |
| Management | 760 (76.1%) | 239 (23.9%) |
| Business & Financial | 50 (15.2%) | 278 (84.8%) |
| Computers, Engineering & Science | 237 (60.6%) | 154 (39.4%) |
| Computers & Mathematics | 128 (61.0%) | 82 (39.1%) |
| Architecture & Engineering | 39 (100.0%) | 0 (0.0%) |
| Life, Physical & Social Science | 70 (49.3%) | 72 (50.7%) |
| Community & Social Service | 947 (51.7%) | 886 (48.3%) |
| Education, Arts & Media | 148 (37.5%) | 247 (62.5%) |
| Legal Services & Support | 60 (48.8%) | 63 (51.2%) |
| Education Instruction & Library | 582 (55.8%) | 461 (44.2%) |
| Arts, Media & Entertainment | 157 (57.7%) | 115 (42.3%) |
| Health Diagnosing & Treating | 48 (7.4%) | 598 (92.6%) |
| Health Technologists | 20 (5.9%) | 322 (94.2%) |
| Total (Category) | 2,042 (48.6%) | 2,155 (51.3%) |
| Total (Overall) | 7,456 (51.0%) | 7,169 (49.0%) |
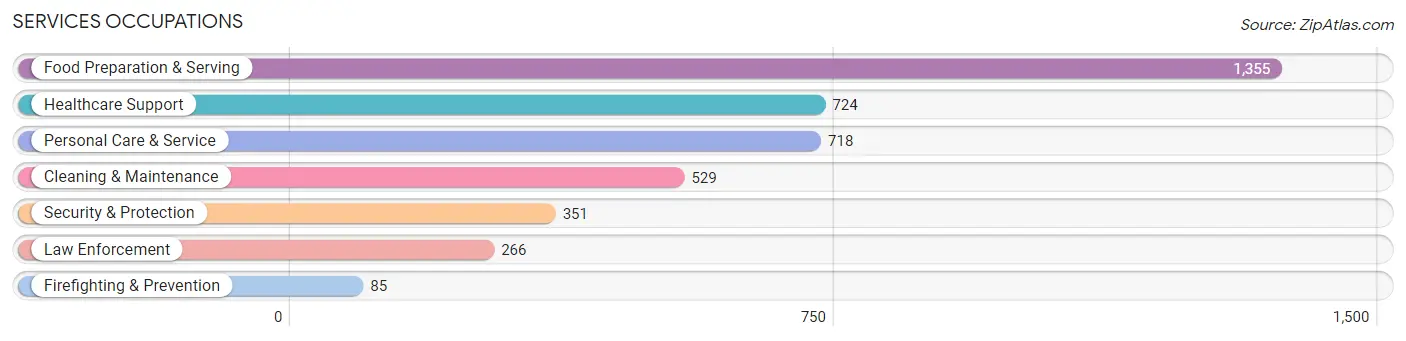
Services Occupations
The most common Services occupations in Statesboro are Food Preparation & Serving (1,355 | 9.3%), Healthcare Support (724 | 5.0%), Personal Care & Service (718 | 4.9%), Cleaning & Maintenance (529 | 3.6%), and Security & Protection (351 | 2.4%).
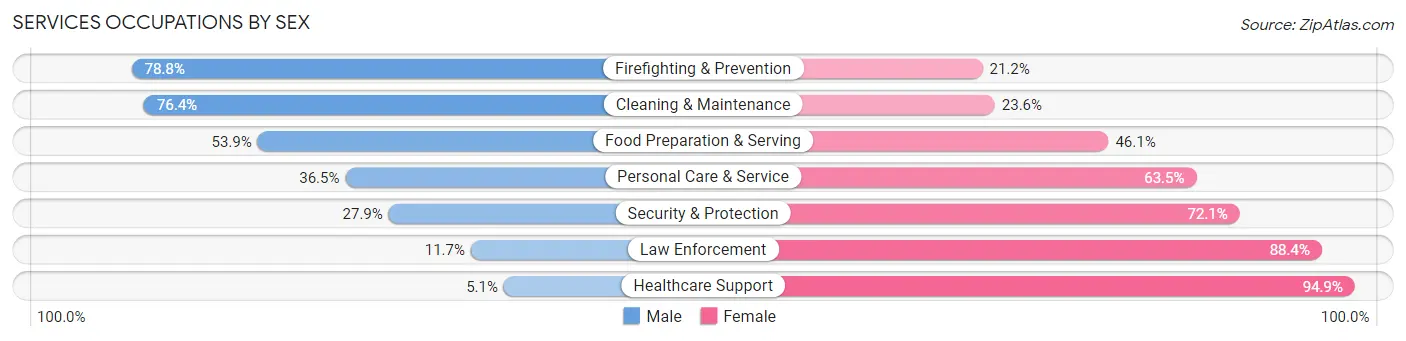
Services Occupations by Sex
Within the Services occupations in Statesboro, the most male-oriented occupations are Firefighting & Prevention (78.8%), Cleaning & Maintenance (76.4%), and Food Preparation & Serving (53.9%), while the most female-oriented occupations are Healthcare Support (94.9%), Law Enforcement (88.3%), and Security & Protection (72.1%).
| Occupation | Male | Female |
| Healthcare Support | 37 (5.1%) | 687 (94.9%) |
| Security & Protection | 98 (27.9%) | 253 (72.1%) |
| Firefighting & Prevention | 67 (78.8%) | 18 (21.2%) |
| Law Enforcement | 31 (11.7%) | 235 (88.3%) |
| Food Preparation & Serving | 730 (53.9%) | 625 (46.1%) |
| Cleaning & Maintenance | 404 (76.4%) | 125 (23.6%) |
| Personal Care & Service | 262 (36.5%) | 456 (63.5%) |
| Total (Category) | 1,531 (41.6%) | 2,146 (58.4%) |
| Total (Overall) | 7,456 (51.0%) | 7,169 (49.0%) |
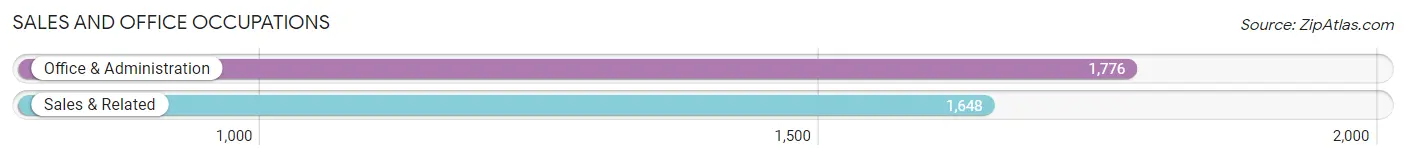
Sales and Office Occupations
The most common Sales and Office occupations in Statesboro are Office & Administration (1,776 | 12.1%), and Sales & Related (1,648 | 11.3%).
Sales and Office Occupations by Sex
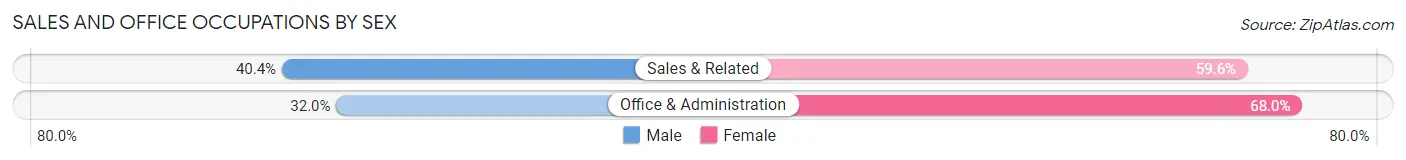
| Occupation | Male | Female |
| Sales & Related | 666 (40.4%) | 982 (59.6%) |
| Office & Administration | 569 (32.0%) | 1,207 (68.0%) |
| Total (Category) | 1,235 (36.1%) | 2,189 (63.9%) |
| Total (Overall) | 7,456 (51.0%) | 7,169 (49.0%) |
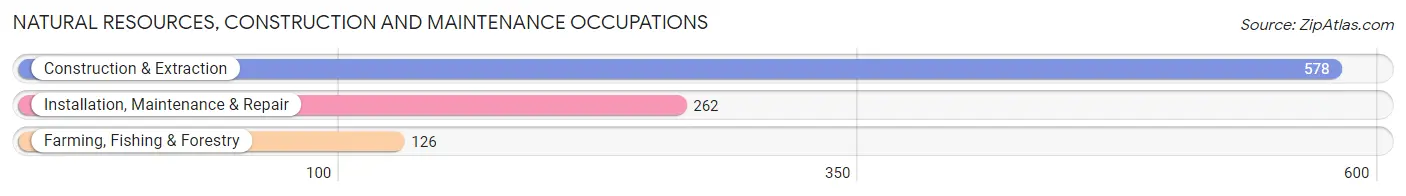
Natural Resources, Construction and Maintenance Occupations
The most common Natural Resources, Construction and Maintenance occupations in Statesboro are Construction & Extraction (578 | 4.0%), Installation, Maintenance & Repair (262 | 1.8%), and Farming, Fishing & Forestry (126 | 0.9%).
Natural Resources, Construction and Maintenance Occupations by Sex
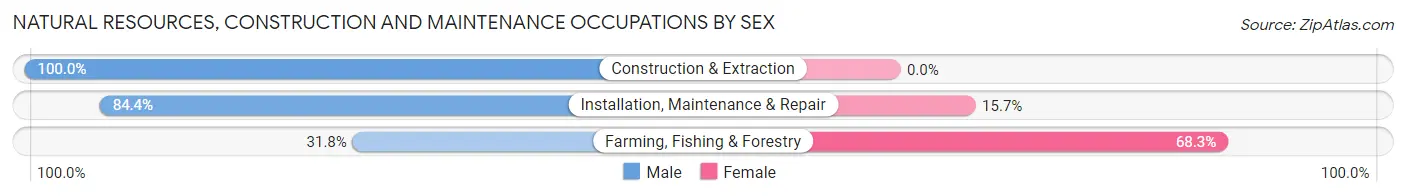
| Occupation | Male | Female |
| Farming, Fishing & Forestry | 40 (31.8%) | 86 (68.2%) |
| Construction & Extraction | 578 (100.0%) | 0 (0.0%) |
| Installation, Maintenance & Repair | 221 (84.4%) | 41 (15.7%) |
| Total (Category) | 839 (86.9%) | 127 (13.2%) |
| Total (Overall) | 7,456 (51.0%) | 7,169 (49.0%) |
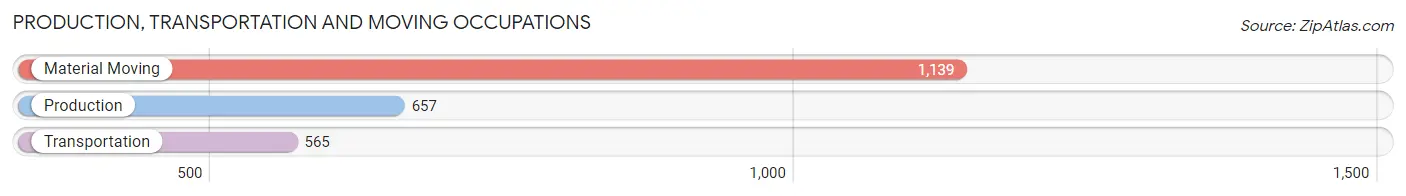
Production, Transportation and Moving Occupations
The most common Production, Transportation and Moving occupations in Statesboro are Material Moving (1,139 | 7.8%), Production (657 | 4.5%), and Transportation (565 | 3.9%).
Production, Transportation and Moving Occupations by Sex
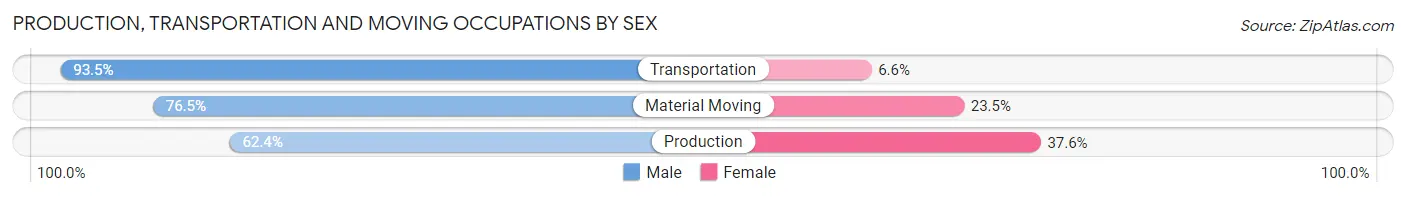
| Occupation | Male | Female |
| Production | 410 (62.4%) | 247 (37.6%) |
| Transportation | 528 (93.4%) | 37 (6.6%) |
| Material Moving | 871 (76.5%) | 268 (23.5%) |
| Total (Category) | 1,809 (76.6%) | 552 (23.4%) |
| Total (Overall) | 7,456 (51.0%) | 7,169 (49.0%) |
Employment Industries by Sex in Statesboro
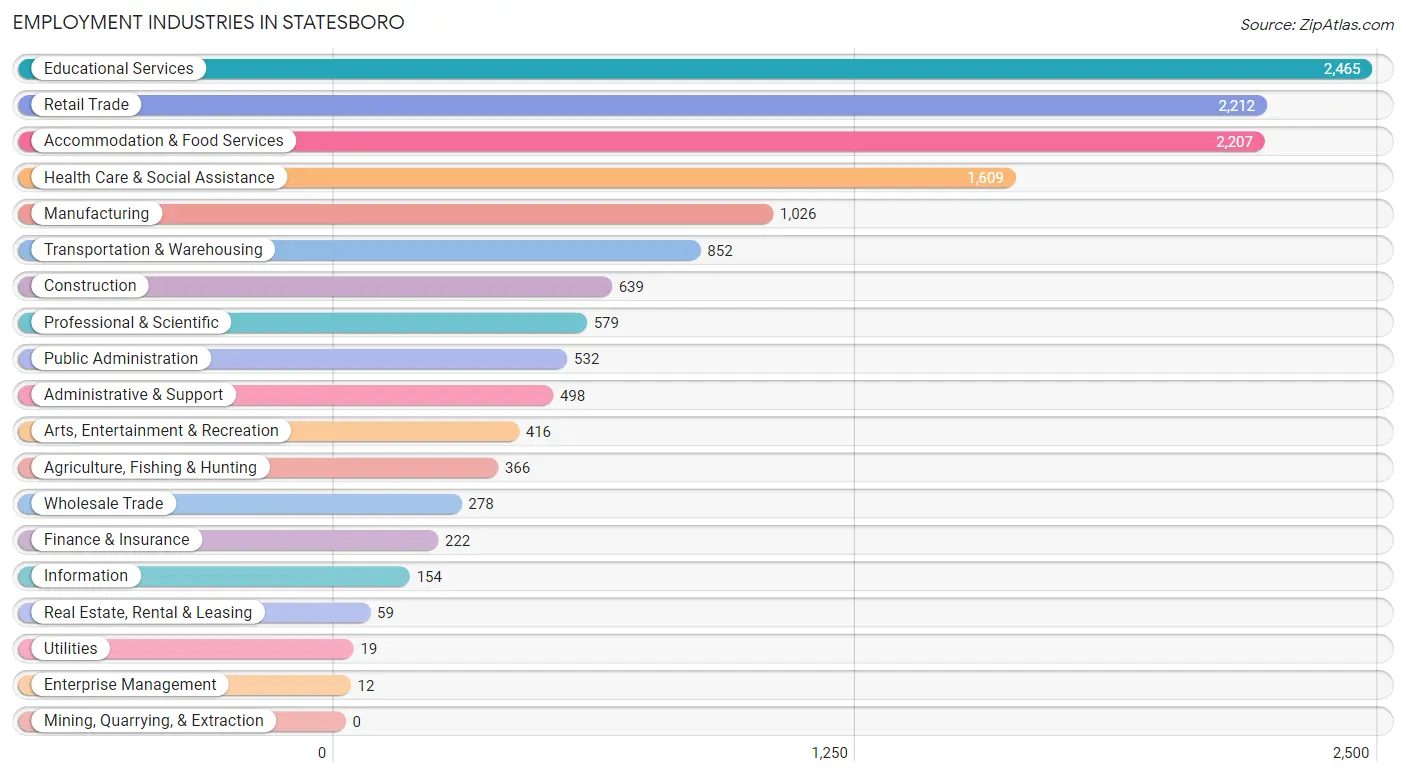
Employment Industries in Statesboro
The major employment industries in Statesboro include Educational Services (2,465 | 16.9%), Retail Trade (2,212 | 15.1%), Accommodation & Food Services (2,207 | 15.1%), Health Care & Social Assistance (1,609 | 11.0%), and Manufacturing (1,026 | 7.0%).
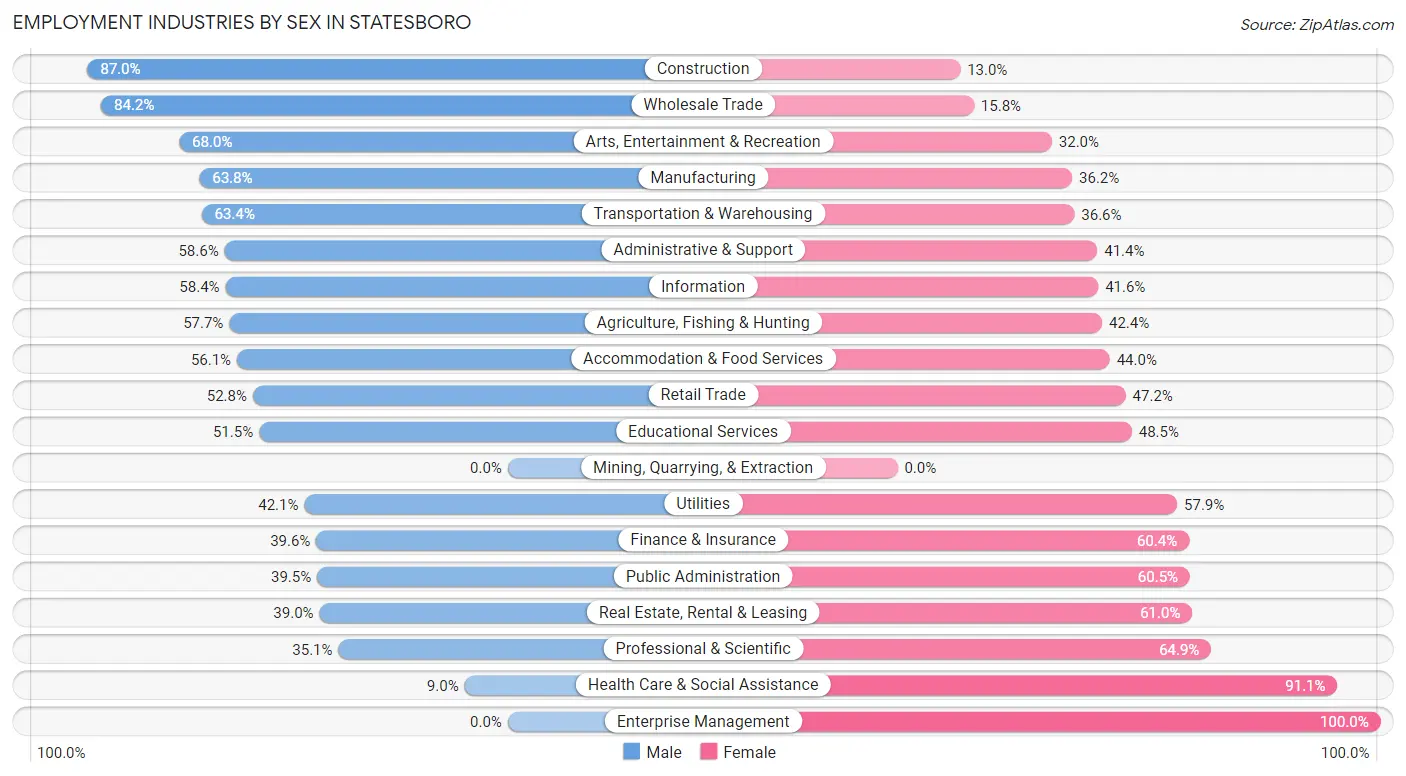
Employment Industries by Sex in Statesboro
The Statesboro industries that see more men than women are Construction (87.0%), Wholesale Trade (84.2%), and Arts, Entertainment & Recreation (68.0%), whereas the industries that tend to have a higher number of women are Enterprise Management (100.0%), Health Care & Social Assistance (91.0%), and Professional & Scientific (64.9%).
| Industry | Male | Female |
| Agriculture, Fishing & Hunting | 211 (57.7%) | 155 (42.3%) |
| Mining, Quarrying, & Extraction | 0 (0.0%) | 0 (0.0%) |
| Construction | 556 (87.0%) | 83 (13.0%) |
| Manufacturing | 655 (63.8%) | 371 (36.2%) |
| Wholesale Trade | 234 (84.2%) | 44 (15.8%) |
| Retail Trade | 1,167 (52.8%) | 1,045 (47.2%) |
| Transportation & Warehousing | 540 (63.4%) | 312 (36.6%) |
| Utilities | 8 (42.1%) | 11 (57.9%) |
| Information | 90 (58.4%) | 64 (41.6%) |
| Finance & Insurance | 88 (39.6%) | 134 (60.4%) |
| Real Estate, Rental & Leasing | 23 (39.0%) | 36 (61.0%) |
| Professional & Scientific | 203 (35.1%) | 376 (64.9%) |
| Enterprise Management | 0 (0.0%) | 12 (100.0%) |
| Administrative & Support | 292 (58.6%) | 206 (41.4%) |
| Educational Services | 1,269 (51.5%) | 1,196 (48.5%) |
| Health Care & Social Assistance | 144 (8.9%) | 1,465 (91.0%) |
| Arts, Entertainment & Recreation | 283 (68.0%) | 133 (32.0%) |
| Accommodation & Food Services | 1,237 (56.0%) | 970 (44.0%) |
| Public Administration | 210 (39.5%) | 322 (60.5%) |
| Total | 7,456 (51.0%) | 7,169 (49.0%) |
Education in Statesboro
School Enrollment in Statesboro
The most common levels of schooling among the 17,036 students in Statesboro are college / undergraduate (11,995 | 70.4%), high school (1,375 | 8.1%), and elementary school (1,268 | 7.4%).
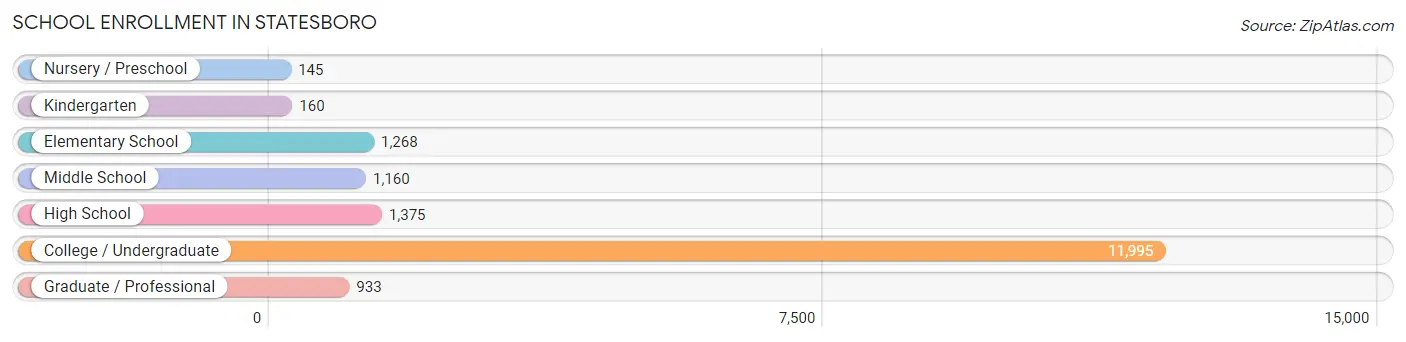
| School Level | # Students | % Students |
| Nursery / Preschool | 145 | 0.9% |
| Kindergarten | 160 | 0.9% |
| Elementary School | 1,268 | 7.4% |
| Middle School | 1,160 | 6.8% |
| High School | 1,375 | 8.1% |
| College / Undergraduate | 11,995 | 70.4% |
| Graduate / Professional | 933 | 5.5% |
| Total | 17,036 | 100.0% |
School Enrollment by Age by Funding Source in Statesboro
Out of a total of 17,036 students who are enrolled in schools in Statesboro, 784 (4.6%) attend a private institution, while the remaining 16,252 (95.4%) are enrolled in public schools. The age group of 35 years and over has the highest likelihood of being enrolled in private schools, with 113 (34.4% in the age bracket) enrolled. Conversely, the age group of 15 to 17 year olds has the lowest likelihood of being enrolled in a private school, with 752 (100.0% in the age bracket) attending a public institution.
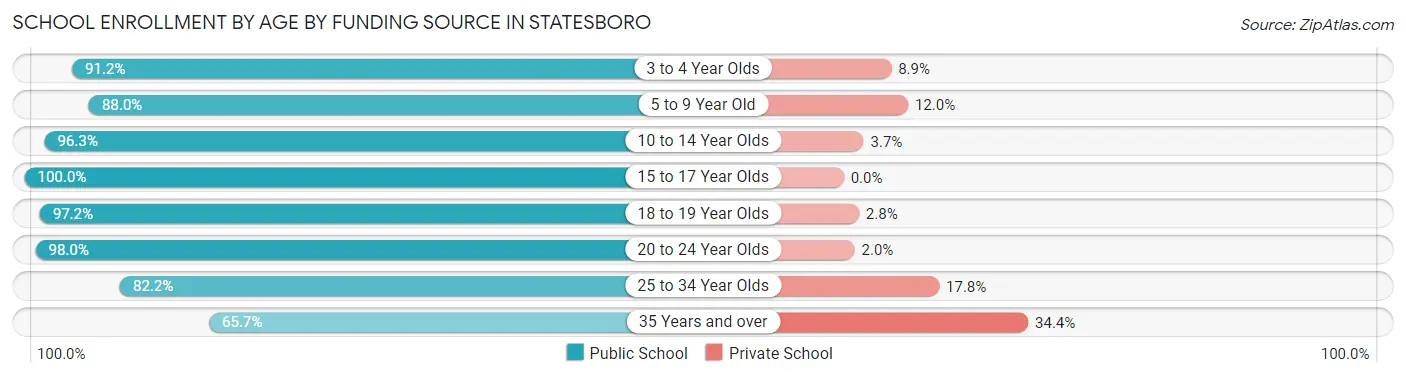
| Age Bracket | Public School | Private School |
| 3 to 4 Year Olds | 103 (91.1%) | 10 (8.8%) |
| 5 to 9 Year Old | 926 (88.0%) | 126 (12.0%) |
| 10 to 14 Year Olds | 1,661 (96.3%) | 64 (3.7%) |
| 15 to 17 Year Olds | 752 (100.0%) | 0 (0.0%) |
| 18 to 19 Year Olds | 4,989 (97.2%) | 146 (2.8%) |
| 20 to 24 Year Olds | 6,760 (98.0%) | 141 (2.0%) |
| 25 to 34 Year Olds | 846 (82.2%) | 183 (17.8%) |
| 35 Years and over | 216 (65.6%) | 113 (34.4%) |
| Total | 16,252 (95.4%) | 784 (4.6%) |
Educational Attainment by Field of Study in Statesboro
Education (627 | 14.9%), business (544 | 12.9%), arts & humanities (432 | 10.2%), liberal arts & history (422 | 10.0%), and science & technology (387 | 9.2%) are the most common fields of study among 4,217 individuals in Statesboro who have obtained a bachelor's degree or higher.
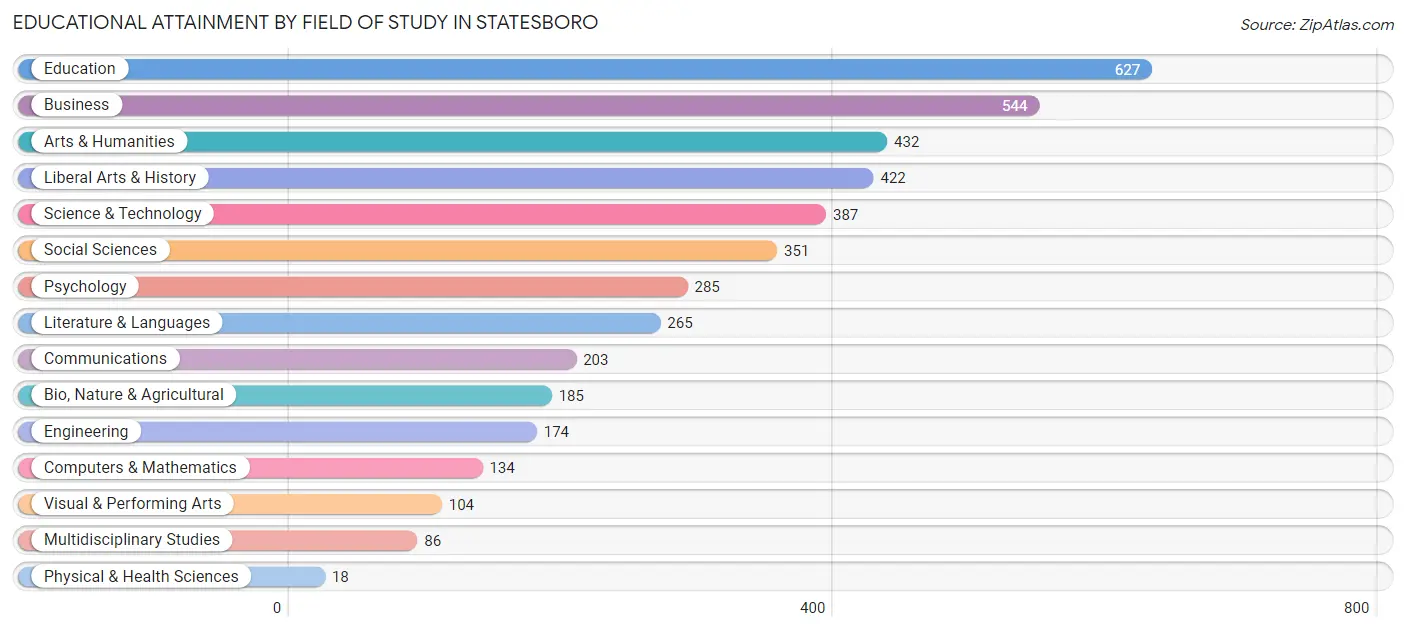
| Field of Study | # Graduates | % Graduates |
| Computers & Mathematics | 134 | 3.2% |
| Bio, Nature & Agricultural | 185 | 4.4% |
| Physical & Health Sciences | 18 | 0.4% |
| Psychology | 285 | 6.8% |
| Social Sciences | 351 | 8.3% |
| Engineering | 174 | 4.1% |
| Multidisciplinary Studies | 86 | 2.0% |
| Science & Technology | 387 | 9.2% |
| Business | 544 | 12.9% |
| Education | 627 | 14.9% |
| Literature & Languages | 265 | 6.3% |
| Liberal Arts & History | 422 | 10.0% |
| Visual & Performing Arts | 104 | 2.5% |
| Communications | 203 | 4.8% |
| Arts & Humanities | 432 | 10.2% |
| Total | 4,217 | 100.0% |
Transportation & Commute in Statesboro
Vehicle Availability by Sex in Statesboro
The most prevalent vehicle ownership categories in Statesboro are males with 2 vehicles (2,403, accounting for 37.1%) and females with 2 vehicles (2,216, making up 39.5%).
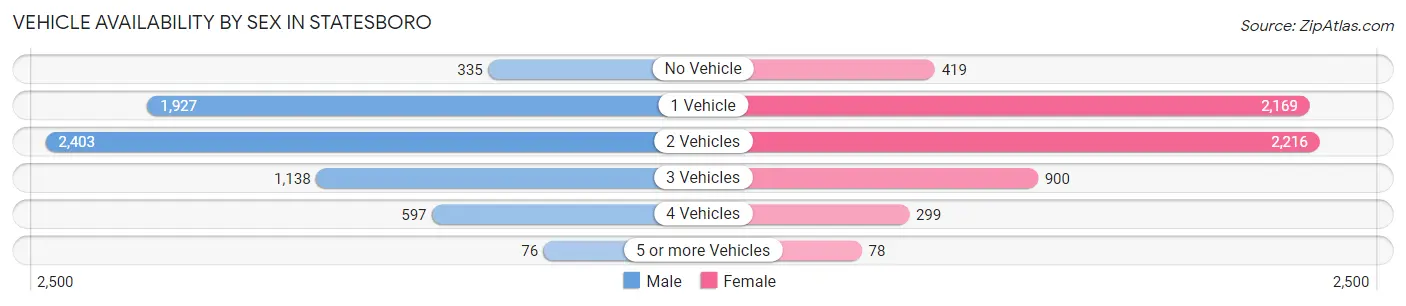
| Vehicles Available | Male | Female |
| No Vehicle | 335 (5.2%) | 419 (6.9%) |
| 1 Vehicle | 1,927 (29.8%) | 2,169 (35.7%) |
| 2 Vehicles | 2,403 (37.1%) | 2,216 (36.4%) |
| 3 Vehicles | 1,138 (17.6%) | 900 (14.8%) |
| 4 Vehicles | 597 (9.2%) | 299 (4.9%) |
| 5 or more Vehicles | 76 (1.2%) | 78 (1.3%) |
| Total | 6,476 (100.0%) | 6,081 (100.0%) |
Commute Time in Statesboro
The most frequently occuring commute durations in Statesboro are 10 to 14 minutes (3,750 commuters, 29.6%), 5 to 9 minutes (2,938 commuters, 23.2%), and 15 to 19 minutes (1,413 commuters, 11.1%).
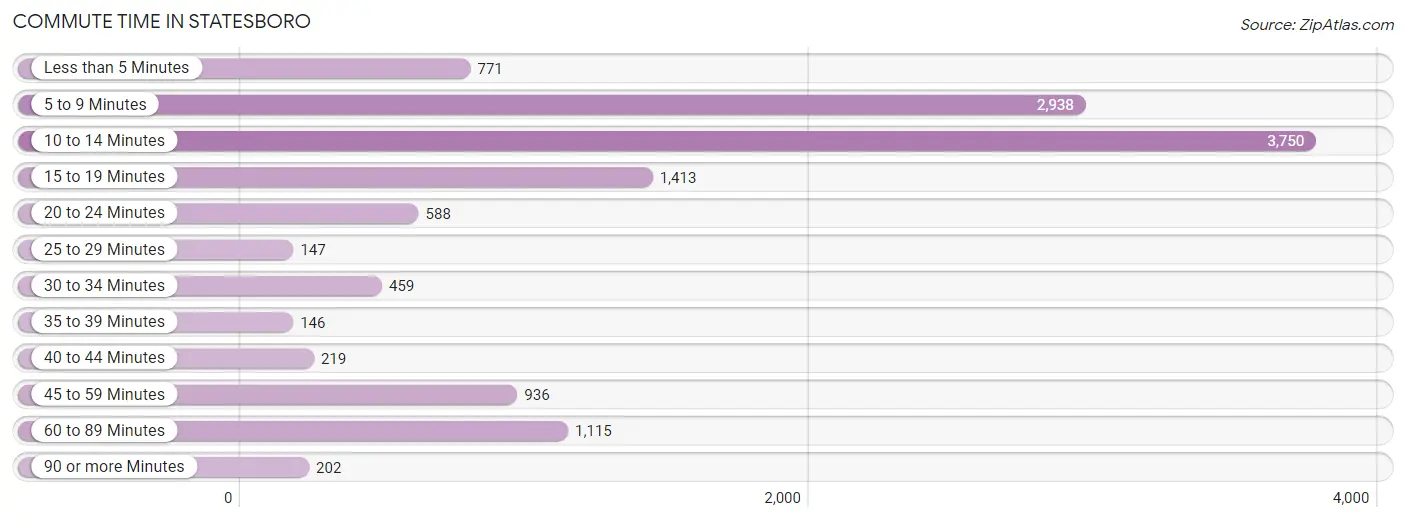
| Commute Time | # Commuters | % Commuters |
| Less than 5 Minutes | 771 | 6.1% |
| 5 to 9 Minutes | 2,938 | 23.2% |
| 10 to 14 Minutes | 3,750 | 29.6% |
| 15 to 19 Minutes | 1,413 | 11.1% |
| 20 to 24 Minutes | 588 | 4.6% |
| 25 to 29 Minutes | 147 | 1.2% |
| 30 to 34 Minutes | 459 | 3.6% |
| 35 to 39 Minutes | 146 | 1.1% |
| 40 to 44 Minutes | 219 | 1.7% |
| 45 to 59 Minutes | 936 | 7.4% |
| 60 to 89 Minutes | 1,115 | 8.8% |
| 90 or more Minutes | 202 | 1.6% |
Commute Time by Sex in Statesboro
The most common commute times in Statesboro are 10 to 14 minutes (2,299 commuters, 34.5%) for males and 5 to 9 minutes (1,575 commuters, 26.2%) for females.
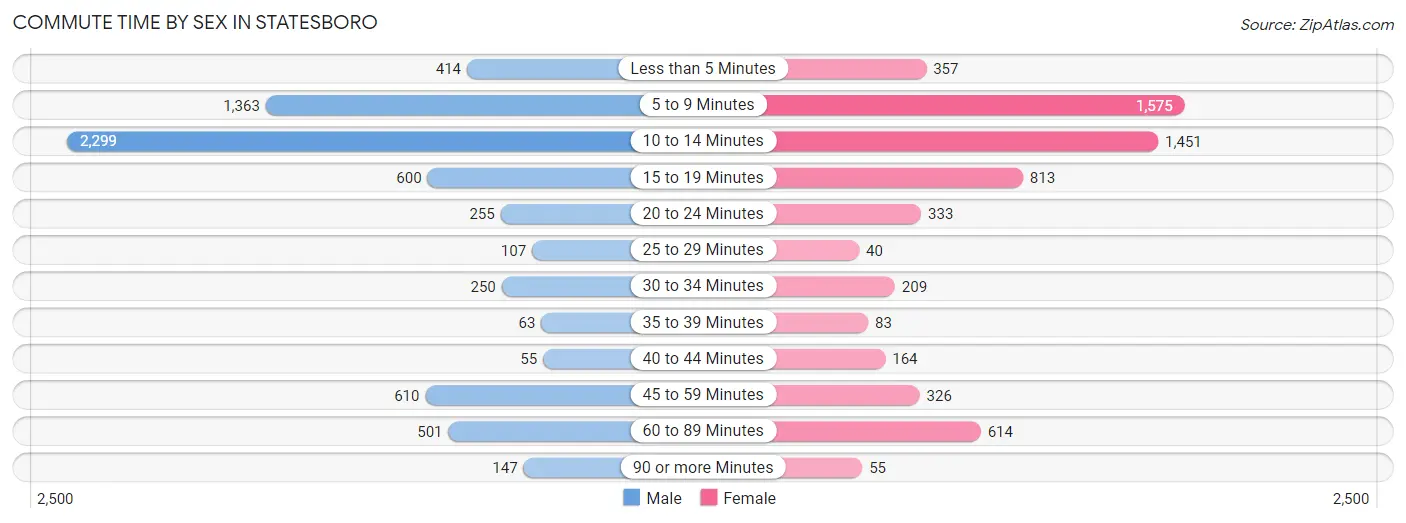
| Commute Time | Male | Female |
| Less than 5 Minutes | 414 (6.2%) | 357 (5.9%) |
| 5 to 9 Minutes | 1,363 (20.4%) | 1,575 (26.2%) |
| 10 to 14 Minutes | 2,299 (34.5%) | 1,451 (24.1%) |
| 15 to 19 Minutes | 600 (9.0%) | 813 (13.5%) |
| 20 to 24 Minutes | 255 (3.8%) | 333 (5.5%) |
| 25 to 29 Minutes | 107 (1.6%) | 40 (0.7%) |
| 30 to 34 Minutes | 250 (3.7%) | 209 (3.5%) |
| 35 to 39 Minutes | 63 (0.9%) | 83 (1.4%) |
| 40 to 44 Minutes | 55 (0.8%) | 164 (2.7%) |
| 45 to 59 Minutes | 610 (9.1%) | 326 (5.4%) |
| 60 to 89 Minutes | 501 (7.5%) | 614 (10.2%) |
| 90 or more Minutes | 147 (2.2%) | 55 (0.9%) |
Time of Departure to Work by Sex in Statesboro
The most frequent times of departure to work in Statesboro are 4:00 PM to 11:59 PM (1,548, 23.2%) for males and 4:00 PM to 11:59 PM (944, 15.7%) for females.
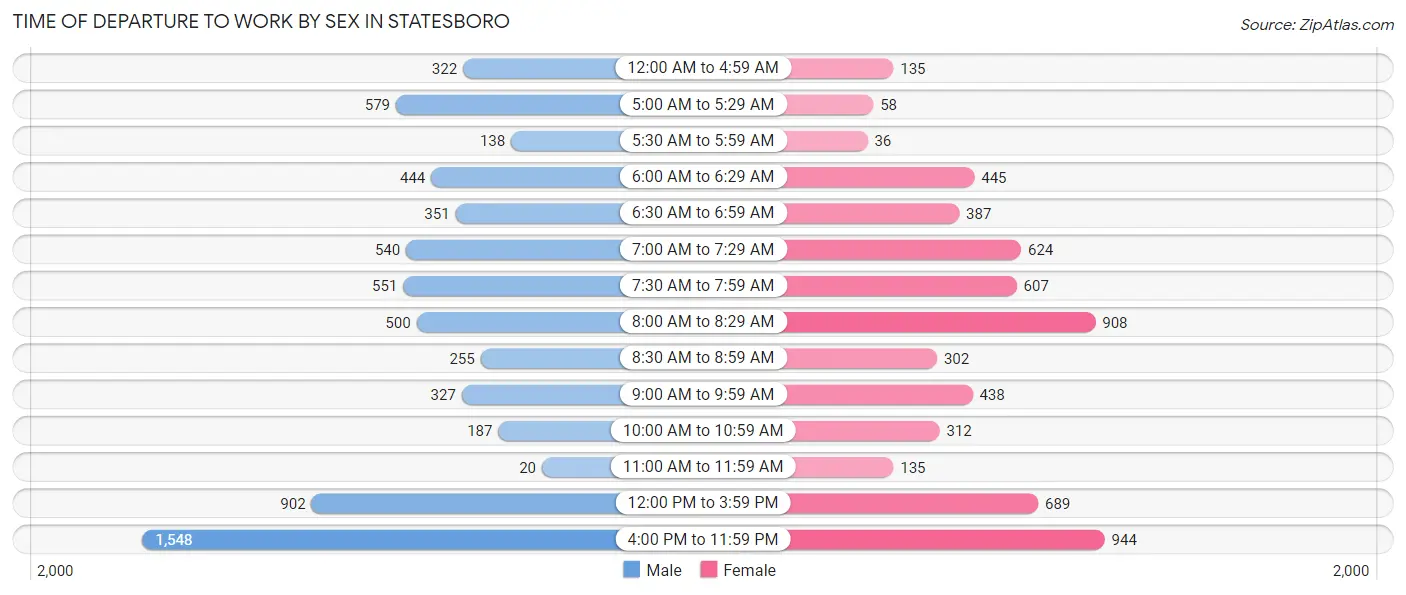
| Time of Departure | Male | Female |
| 12:00 AM to 4:59 AM | 322 (4.8%) | 135 (2.2%) |
| 5:00 AM to 5:29 AM | 579 (8.7%) | 58 (1.0%) |
| 5:30 AM to 5:59 AM | 138 (2.1%) | 36 (0.6%) |
| 6:00 AM to 6:29 AM | 444 (6.7%) | 445 (7.4%) |
| 6:30 AM to 6:59 AM | 351 (5.3%) | 387 (6.4%) |
| 7:00 AM to 7:29 AM | 540 (8.1%) | 624 (10.4%) |
| 7:30 AM to 7:59 AM | 551 (8.3%) | 607 (10.1%) |
| 8:00 AM to 8:29 AM | 500 (7.5%) | 908 (15.1%) |
| 8:30 AM to 8:59 AM | 255 (3.8%) | 302 (5.0%) |
| 9:00 AM to 9:59 AM | 327 (4.9%) | 438 (7.3%) |
| 10:00 AM to 10:59 AM | 187 (2.8%) | 312 (5.2%) |
| 11:00 AM to 11:59 AM | 20 (0.3%) | 135 (2.2%) |
| 12:00 PM to 3:59 PM | 902 (13.5%) | 689 (11.5%) |
| 4:00 PM to 11:59 PM | 1,548 (23.2%) | 944 (15.7%) |
| Total | 6,664 (100.0%) | 6,020 (100.0%) |
Housing Occupancy in Statesboro
Occupancy by Ownership in Statesboro
Of the total 11,857 dwellings in Statesboro, owner-occupied units account for 2,375 (20.0%), while renter-occupied units make up 9,482 (80.0%).
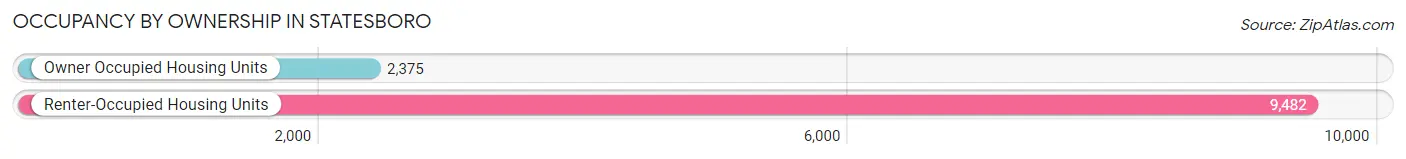
| Occupancy | # Housing Units | % Housing Units |
| Owner Occupied Housing Units | 2,375 | 20.0% |
| Renter-Occupied Housing Units | 9,482 | 80.0% |
| Total Occupied Housing Units | 11,857 | 100.0% |
Occupancy by Household Size in Statesboro
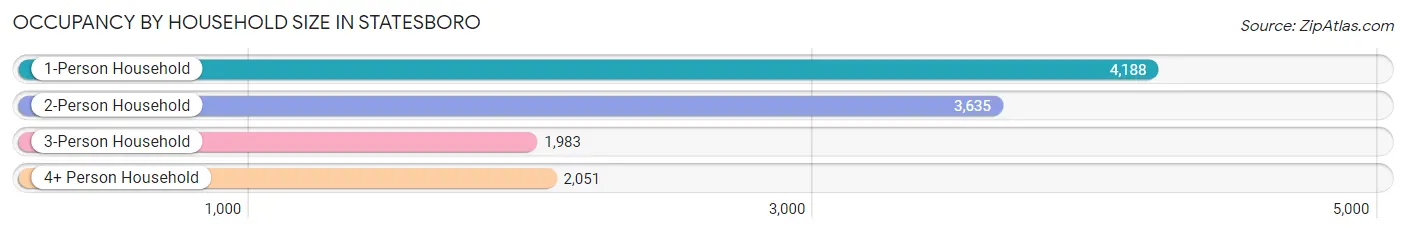
| Household Size | # Housing Units | % Housing Units |
| 1-Person Household | 4,188 | 35.3% |
| 2-Person Household | 3,635 | 30.7% |
| 3-Person Household | 1,983 | 16.7% |
| 4+ Person Household | 2,051 | 17.3% |
| Total Housing Units | 11,857 | 100.0% |
Occupancy by Ownership by Household Size in Statesboro
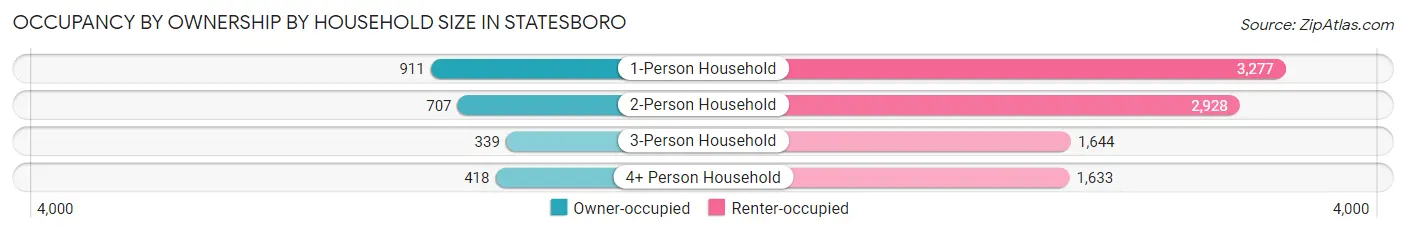
| Household Size | Owner-occupied | Renter-occupied |
| 1-Person Household | 911 (21.7%) | 3,277 (78.2%) |
| 2-Person Household | 707 (19.5%) | 2,928 (80.5%) |
| 3-Person Household | 339 (17.1%) | 1,644 (82.9%) |
| 4+ Person Household | 418 (20.4%) | 1,633 (79.6%) |
| Total Housing Units | 2,375 (20.0%) | 9,482 (80.0%) |
Occupancy by Educational Attainment in Statesboro
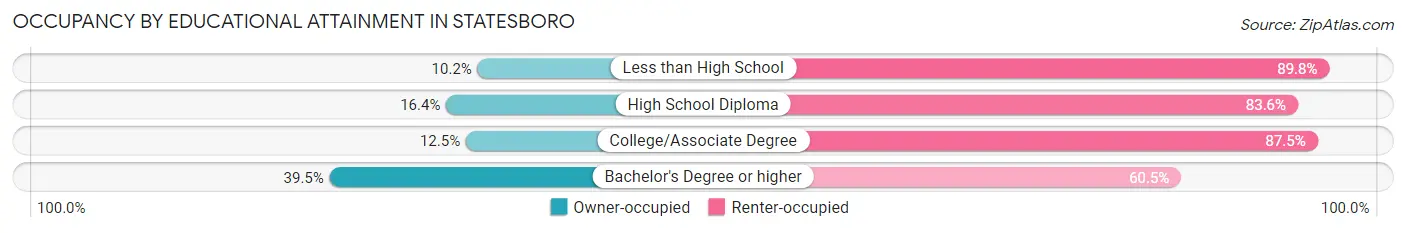
| Household Size | Owner-occupied | Renter-occupied |
| Less than High School | 70 (10.2%) | 618 (89.8%) |
| High School Diploma | 420 (16.4%) | 2,141 (83.6%) |
| College/Associate Degree | 701 (12.5%) | 4,912 (87.5%) |
| Bachelor's Degree or higher | 1,184 (39.5%) | 1,811 (60.5%) |
Occupancy by Age of Householder in Statesboro
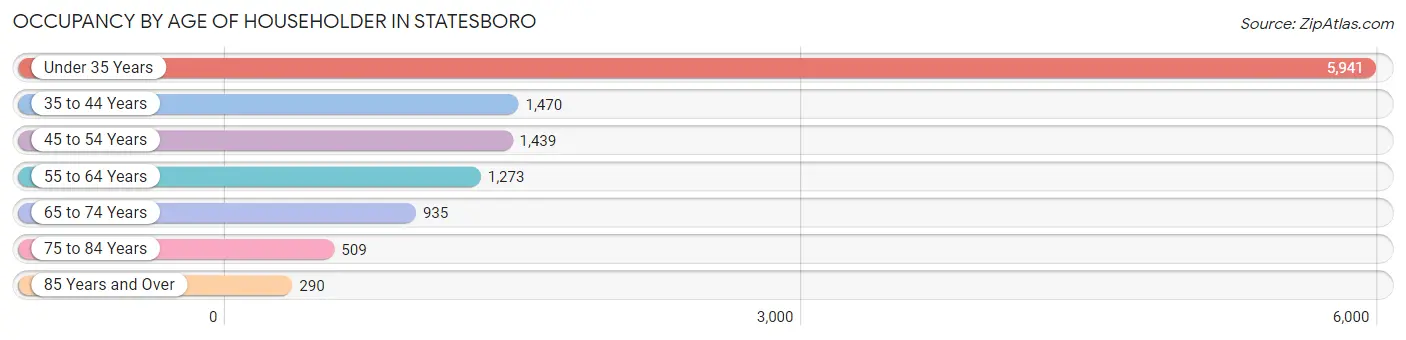
| Age Bracket | # Households | % Households |
| Under 35 Years | 5,941 | 50.1% |
| 35 to 44 Years | 1,470 | 12.4% |
| 45 to 54 Years | 1,439 | 12.1% |
| 55 to 64 Years | 1,273 | 10.7% |
| 65 to 74 Years | 935 | 7.9% |
| 75 to 84 Years | 509 | 4.3% |
| 85 Years and Over | 290 | 2.5% |
| Total | 11,857 | 100.0% |
Housing Finances in Statesboro
Median Income by Occupancy in Statesboro
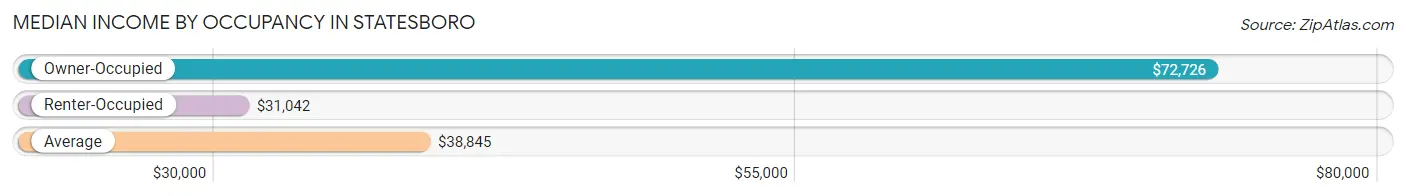
| Occupancy Type | # Households | Median Income |
| Owner-Occupied | 2,375 (20.0%) | $72,726 |
| Renter-Occupied | 9,482 (80.0%) | $31,042 |
| Average | 11,857 (100.0%) | $38,845 |
Occupancy by Householder Income Bracket in Statesboro
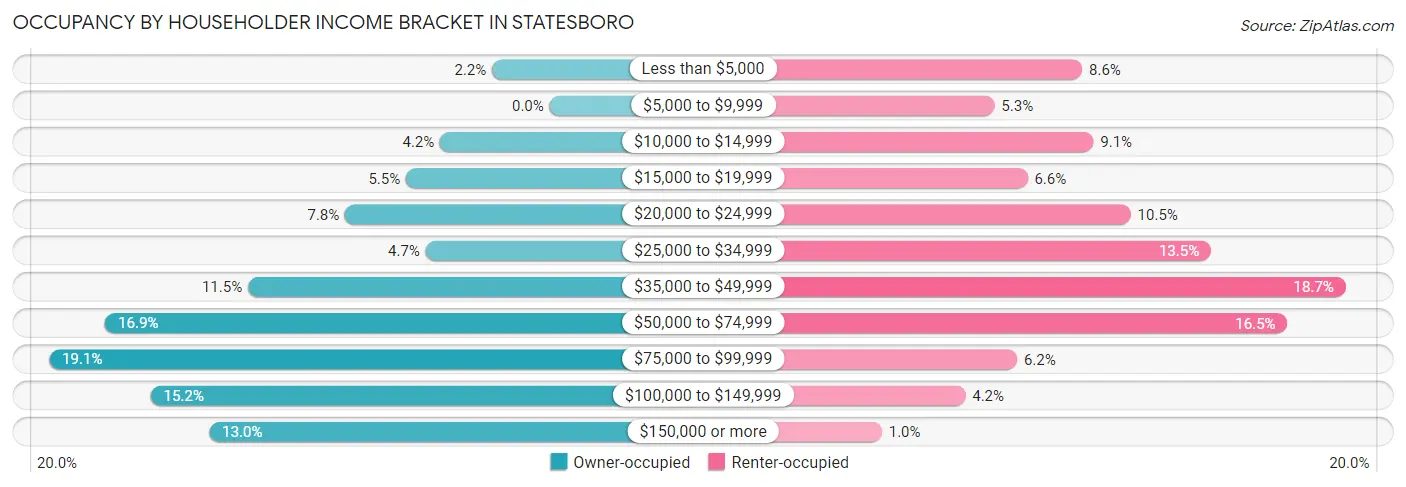
| Income Bracket | Owner-occupied | Renter-occupied |
| Less than $5,000 | 52 (2.2%) | 818 (8.6%) |
| $5,000 to $9,999 | 0 (0.0%) | 502 (5.3%) |
| $10,000 to $14,999 | 99 (4.2%) | 859 (9.1%) |
| $15,000 to $19,999 | 130 (5.5%) | 621 (6.6%) |
| $20,000 to $24,999 | 185 (7.8%) | 994 (10.5%) |
| $25,000 to $34,999 | 112 (4.7%) | 1,284 (13.5%) |
| $35,000 to $49,999 | 273 (11.5%) | 1,770 (18.7%) |
| $50,000 to $74,999 | 402 (16.9%) | 1,560 (16.5%) |
| $75,000 to $99,999 | 453 (19.1%) | 583 (6.1%) |
| $100,000 to $149,999 | 361 (15.2%) | 396 (4.2%) |
| $150,000 or more | 308 (13.0%) | 95 (1.0%) |
| Total | 2,375 (100.0%) | 9,482 (100.0%) |
Monthly Housing Cost Tiers in Statesboro
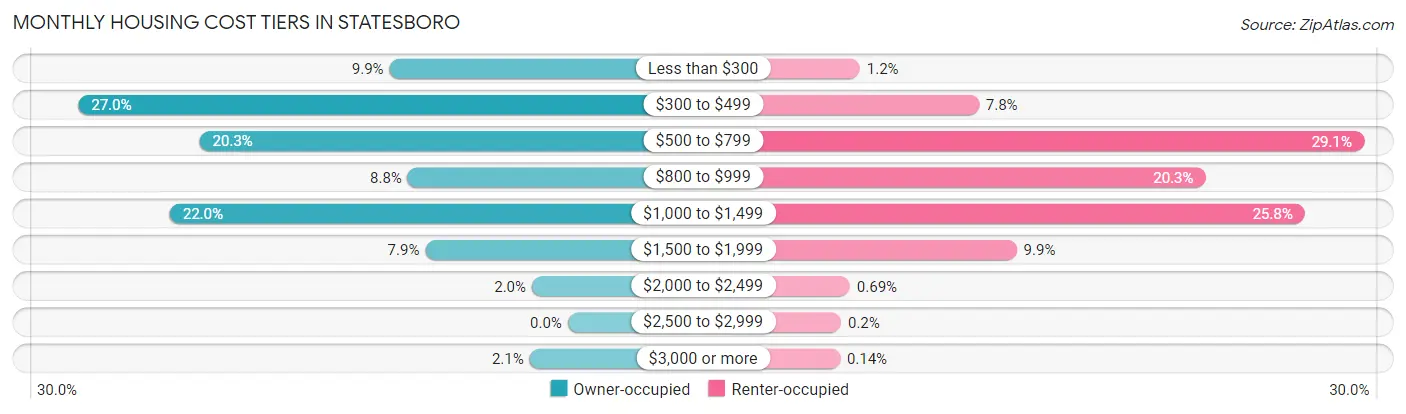
| Monthly Cost | Owner-occupied | Renter-occupied |
| Less than $300 | 234 (9.9%) | 118 (1.2%) |
| $300 to $499 | 642 (27.0%) | 741 (7.8%) |
| $500 to $799 | 483 (20.3%) | 2,756 (29.1%) |
| $800 to $999 | 210 (8.8%) | 1,927 (20.3%) |
| $1,000 to $1,499 | 522 (22.0%) | 2,447 (25.8%) |
| $1,500 to $1,999 | 187 (7.9%) | 939 (9.9%) |
| $2,000 to $2,499 | 47 (2.0%) | 65 (0.7%) |
| $2,500 to $2,999 | 0 (0.0%) | 19 (0.2%) |
| $3,000 or more | 50 (2.1%) | 13 (0.1%) |
| Total | 2,375 (100.0%) | 9,482 (100.0%) |
Physical Housing Characteristics in Statesboro
Housing Structures in Statesboro
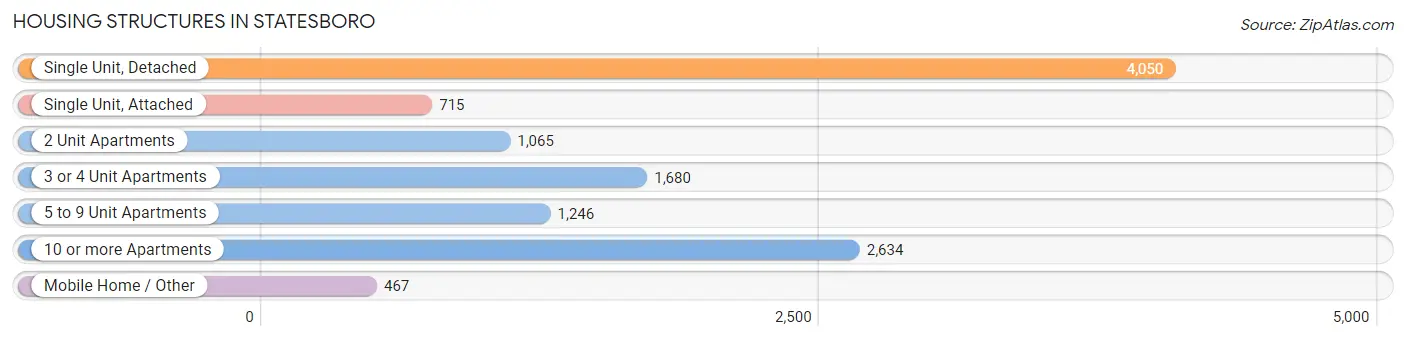
| Structure Type | # Housing Units | % Housing Units |
| Single Unit, Detached | 4,050 | 34.2% |
| Single Unit, Attached | 715 | 6.0% |
| 2 Unit Apartments | 1,065 | 9.0% |
| 3 or 4 Unit Apartments | 1,680 | 14.2% |
| 5 to 9 Unit Apartments | 1,246 | 10.5% |
| 10 or more Apartments | 2,634 | 22.2% |
| Mobile Home / Other | 467 | 3.9% |
| Total | 11,857 | 100.0% |
Housing Structures by Occupancy in Statesboro
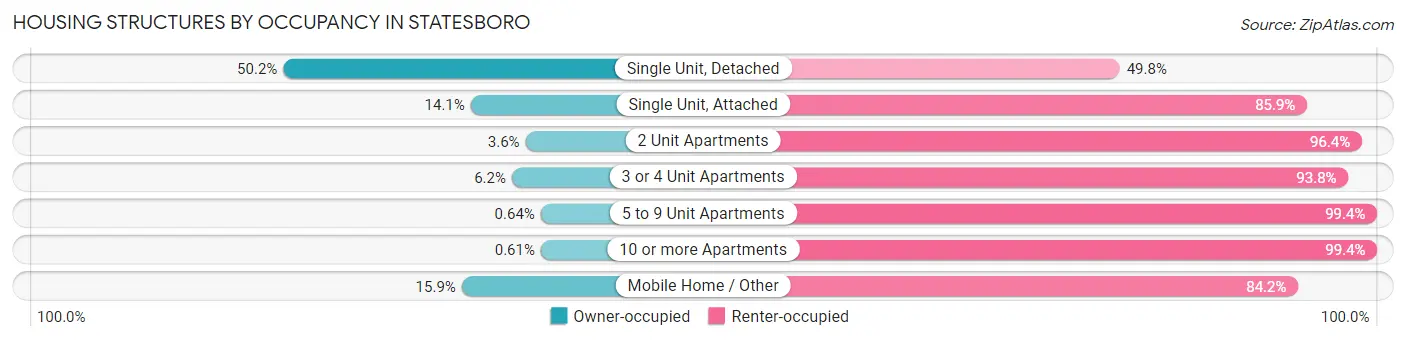
| Structure Type | Owner-occupied | Renter-occupied |
| Single Unit, Detached | 2,034 (50.2%) | 2,016 (49.8%) |
| Single Unit, Attached | 101 (14.1%) | 614 (85.9%) |
| 2 Unit Apartments | 38 (3.6%) | 1,027 (96.4%) |
| 3 or 4 Unit Apartments | 104 (6.2%) | 1,576 (93.8%) |
| 5 to 9 Unit Apartments | 8 (0.6%) | 1,238 (99.4%) |
| 10 or more Apartments | 16 (0.6%) | 2,618 (99.4%) |
| Mobile Home / Other | 74 (15.9%) | 393 (84.2%) |
| Total | 2,375 (20.0%) | 9,482 (80.0%) |
Housing Structures by Number of Rooms in Statesboro
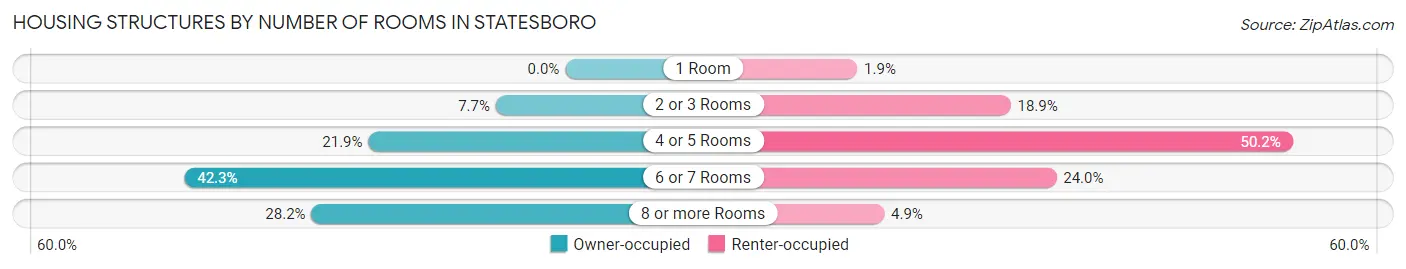
| Number of Rooms | Owner-occupied | Renter-occupied |
| 1 Room | 0 (0.0%) | 181 (1.9%) |
| 2 or 3 Rooms | 183 (7.7%) | 1,796 (18.9%) |
| 4 or 5 Rooms | 519 (21.8%) | 4,763 (50.2%) |
| 6 or 7 Rooms | 1,004 (42.3%) | 2,277 (24.0%) |
| 8 or more Rooms | 669 (28.2%) | 465 (4.9%) |
| Total | 2,375 (100.0%) | 9,482 (100.0%) |
Housing Structure by Heating Type in Statesboro
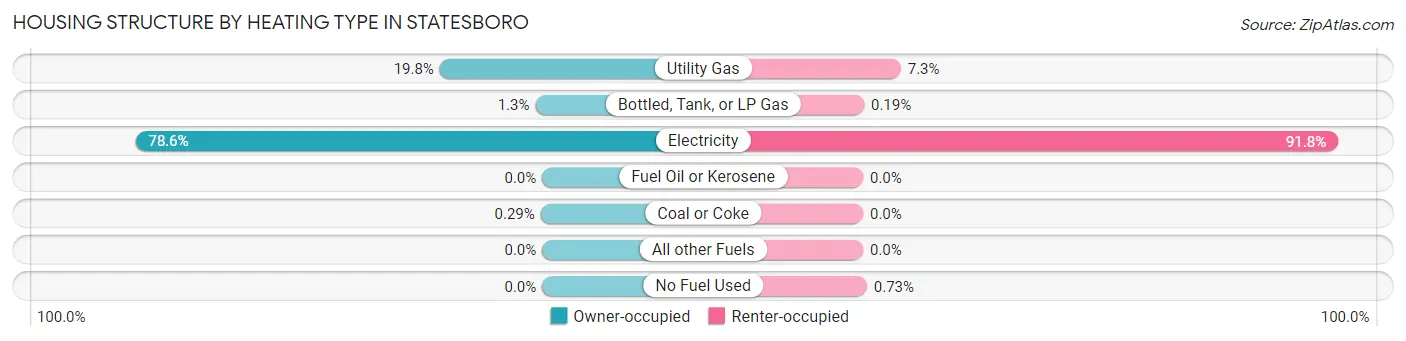
| Heating Type | Owner-occupied | Renter-occupied |
| Utility Gas | 470 (19.8%) | 691 (7.3%) |
| Bottled, Tank, or LP Gas | 31 (1.3%) | 18 (0.2%) |
| Electricity | 1,867 (78.6%) | 8,704 (91.8%) |
| Fuel Oil or Kerosene | 0 (0.0%) | 0 (0.0%) |
| Coal or Coke | 7 (0.3%) | 0 (0.0%) |
| All other Fuels | 0 (0.0%) | 0 (0.0%) |
| No Fuel Used | 0 (0.0%) | 69 (0.7%) |
| Total | 2,375 (100.0%) | 9,482 (100.0%) |
Household Vehicle Usage in Statesboro
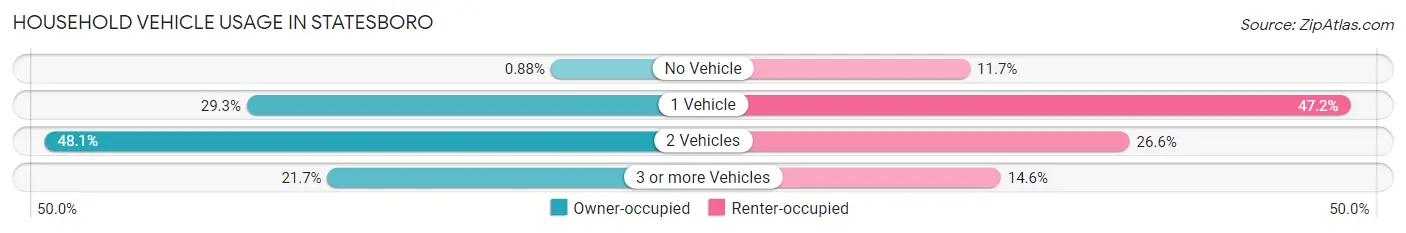
| Vehicles per Household | Owner-occupied | Renter-occupied |
| No Vehicle | 21 (0.9%) | 1,108 (11.7%) |
| 1 Vehicle | 695 (29.3%) | 4,474 (47.2%) |
| 2 Vehicles | 1,143 (48.1%) | 2,520 (26.6%) |
| 3 or more Vehicles | 516 (21.7%) | 1,380 (14.5%) |
| Total | 2,375 (100.0%) | 9,482 (100.0%) |
Real Estate & Mortgages in Statesboro
Real Estate and Mortgage Overview in Statesboro
| Characteristic | Without Mortgage | With Mortgage |
| Housing Units | 1,263 | 1,112 |
| Median Property Value | $127,700 | $165,900 |
| Median Household Income | $54,345 | $202 |
| Monthly Housing Costs | $418 | $50 |
| Real Estate Taxes | $1,219 | $57 |
Property Value by Mortgage Status in Statesboro
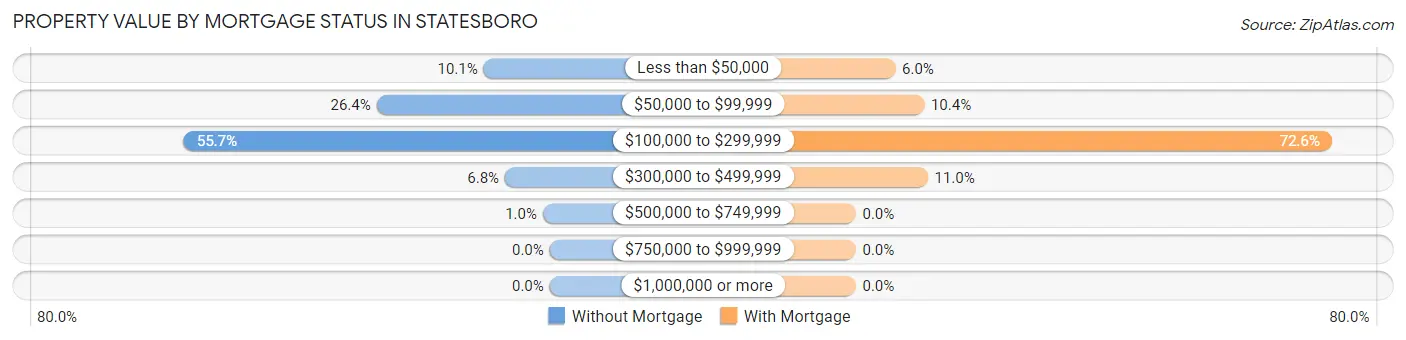
| Property Value | Without Mortgage | With Mortgage |
| Less than $50,000 | 127 (10.1%) | 67 (6.0%) |
| $50,000 to $99,999 | 333 (26.4%) | 116 (10.4%) |
| $100,000 to $299,999 | 704 (55.7%) | 807 (72.6%) |
| $300,000 to $499,999 | 86 (6.8%) | 122 (11.0%) |
| $500,000 to $749,999 | 13 (1.0%) | 0 (0.0%) |
| $750,000 to $999,999 | 0 (0.0%) | 0 (0.0%) |
| $1,000,000 or more | 0 (0.0%) | 0 (0.0%) |
| Total | 1,263 (100.0%) | 1,112 (100.0%) |
Household Income by Mortgage Status in Statesboro
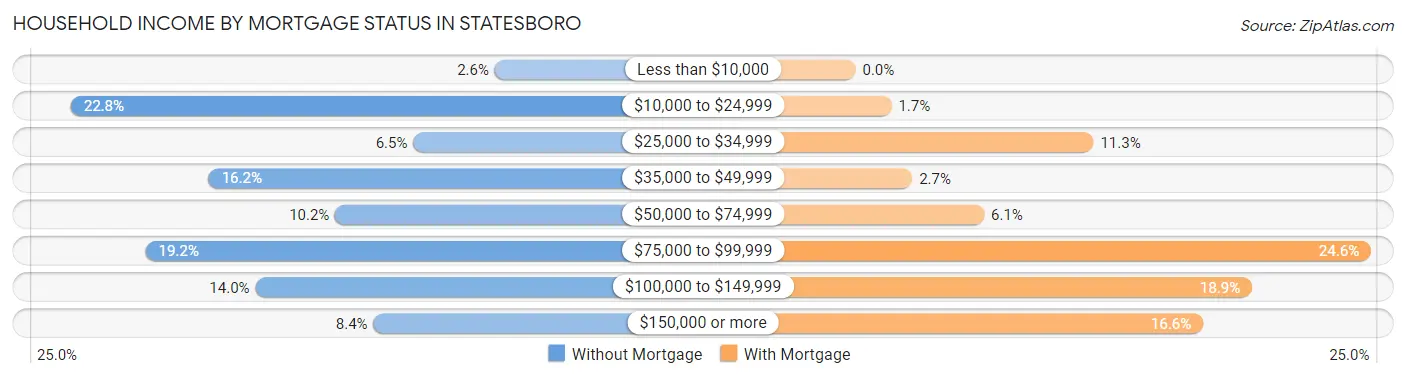
| Household Income | Without Mortgage | With Mortgage |
| Less than $10,000 | 33 (2.6%) | 0 (0.0%) |
| $10,000 to $24,999 | 288 (22.8%) | 19 (1.7%) |
| $25,000 to $34,999 | 82 (6.5%) | 126 (11.3%) |
| $35,000 to $49,999 | 205 (16.2%) | 30 (2.7%) |
| $50,000 to $74,999 | 129 (10.2%) | 68 (6.1%) |
| $75,000 to $99,999 | 243 (19.2%) | 273 (24.5%) |
| $100,000 to $149,999 | 177 (14.0%) | 210 (18.9%) |
| $150,000 or more | 106 (8.4%) | 184 (16.6%) |
| Total | 1,263 (100.0%) | 1,112 (100.0%) |
Property Value to Household Income Ratio in Statesboro
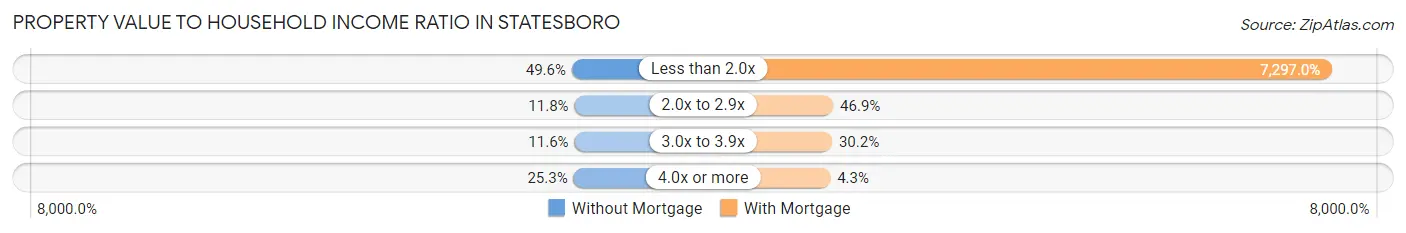
| Value-to-Income Ratio | Without Mortgage | With Mortgage |
| Less than 2.0x | 626 (49.6%) | 81,143 (7,297.0%) |
| 2.0x to 2.9x | 149 (11.8%) | 522 (46.9%) |
| 3.0x to 3.9x | 147 (11.6%) | 336 (30.2%) |
| 4.0x or more | 320 (25.3%) | 48 (4.3%) |
| Total | 1,263 (100.0%) | 1,112 (100.0%) |
Real Estate Taxes by Mortgage Status in Statesboro
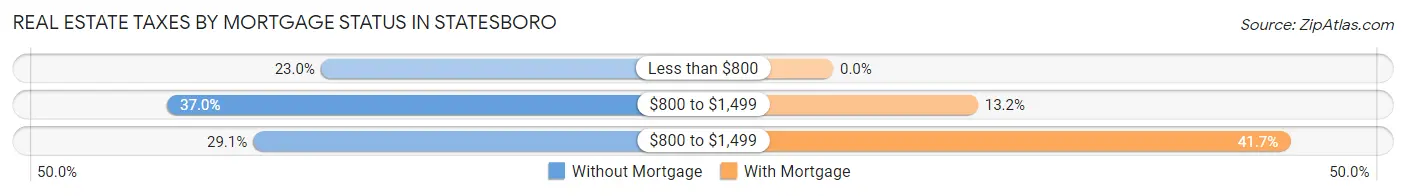
| Property Taxes | Without Mortgage | With Mortgage |
| Less than $800 | 290 (23.0%) | 0 (0.0%) |
| $800 to $1,499 | 467 (37.0%) | 147 (13.2%) |
| $800 to $1,499 | 368 (29.1%) | 464 (41.7%) |
| Total | 1,263 (100.0%) | 1,112 (100.0%) |
Health & Disability in Statesboro
Health Insurance Coverage by Age in Statesboro
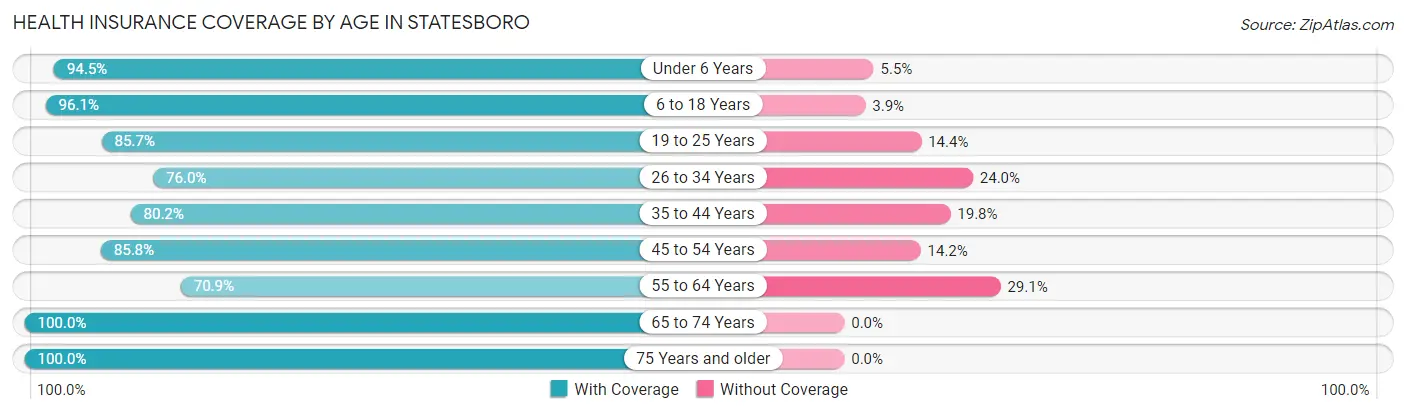
| Age Bracket | With Coverage | Without Coverage |
| Under 6 Years | 1,399 (94.5%) | 81 (5.5%) |
| 6 to 18 Years | 5,502 (96.1%) | 225 (3.9%) |
| 19 to 25 Years | 11,227 (85.7%) | 1,881 (14.3%) |
| 26 to 34 Years | 2,973 (76.0%) | 938 (24.0%) |
| 35 to 44 Years | 1,732 (80.2%) | 427 (19.8%) |
| 45 to 54 Years | 1,875 (85.8%) | 311 (14.2%) |
| 55 to 64 Years | 1,292 (70.9%) | 531 (29.1%) |
| 65 to 74 Years | 1,421 (100.0%) | 0 (0.0%) |
| 75 Years and older | 1,068 (100.0%) | 0 (0.0%) |
| Total | 28,489 (86.6%) | 4,394 (13.4%) |
Health Insurance Coverage by Citizenship Status in Statesboro
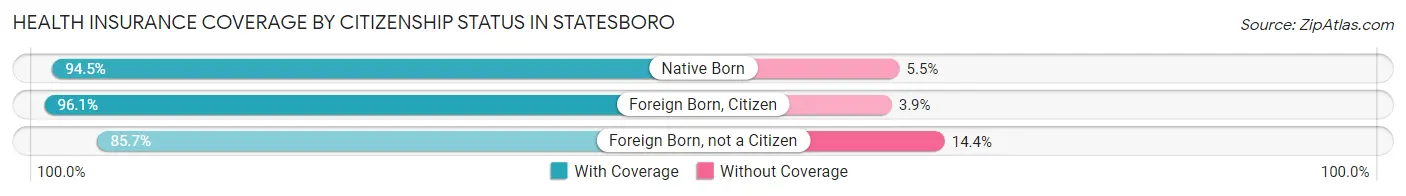
| Citizenship Status | With Coverage | Without Coverage |
| Native Born | 1,399 (94.5%) | 81 (5.5%) |
| Foreign Born, Citizen | 5,502 (96.1%) | 225 (3.9%) |
| Foreign Born, not a Citizen | 11,227 (85.7%) | 1,881 (14.3%) |
Health Insurance Coverage by Household Income in Statesboro
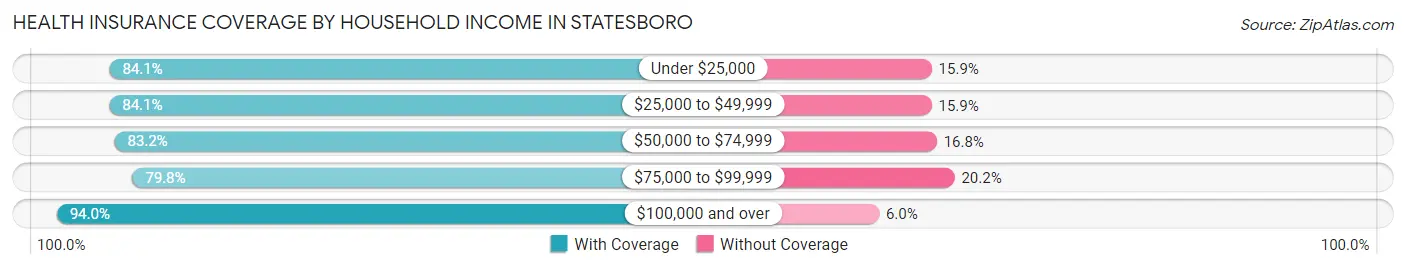
| Household Income | With Coverage | Without Coverage |
| Under $25,000 | 6,793 (84.1%) | 1,284 (15.9%) |
| $25,000 to $49,999 | 6,328 (84.1%) | 1,195 (15.9%) |
| $50,000 to $74,999 | 4,490 (83.2%) | 909 (16.8%) |
| $75,000 to $99,999 | 1,815 (79.8%) | 459 (20.2%) |
| $100,000 and over | 3,370 (94.0%) | 216 (6.0%) |
Public vs Private Health Insurance Coverage by Age in Statesboro
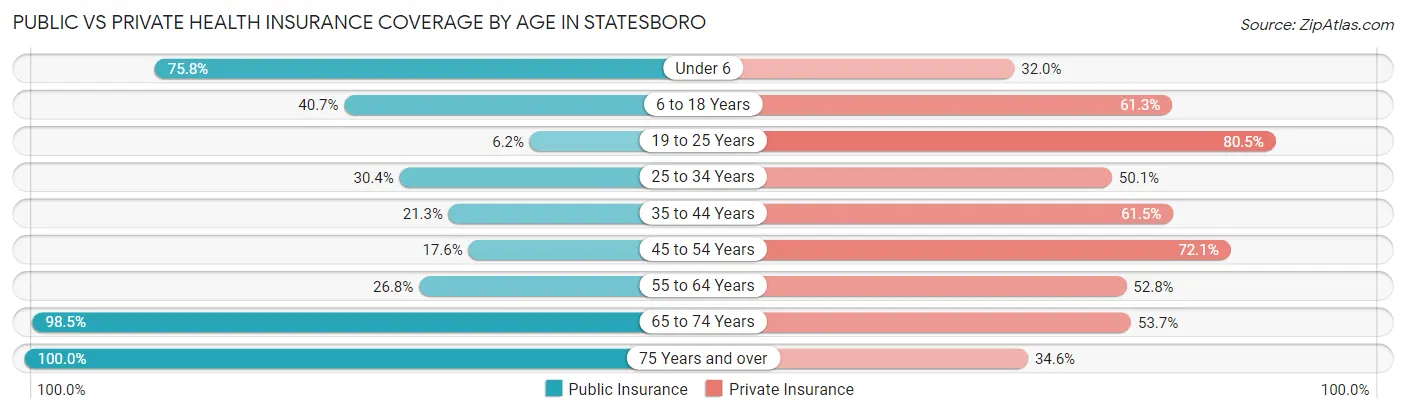
| Age Bracket | Public Insurance | Private Insurance |
| Under 6 | 1,122 (75.8%) | 474 (32.0%) |
| 6 to 18 Years | 2,328 (40.6%) | 3,512 (61.3%) |
| 19 to 25 Years | 815 (6.2%) | 10,555 (80.5%) |
| 25 to 34 Years | 1,189 (30.4%) | 1,961 (50.1%) |
| 35 to 44 Years | 459 (21.3%) | 1,328 (61.5%) |
| 45 to 54 Years | 385 (17.6%) | 1,577 (72.1%) |
| 55 to 64 Years | 488 (26.8%) | 963 (52.8%) |
| 65 to 74 Years | 1,400 (98.5%) | 763 (53.7%) |
| 75 Years and over | 1,068 (100.0%) | 369 (34.5%) |
| Total | 9,254 (28.1%) | 21,502 (65.4%) |
Disability Status by Sex by Age in Statesboro
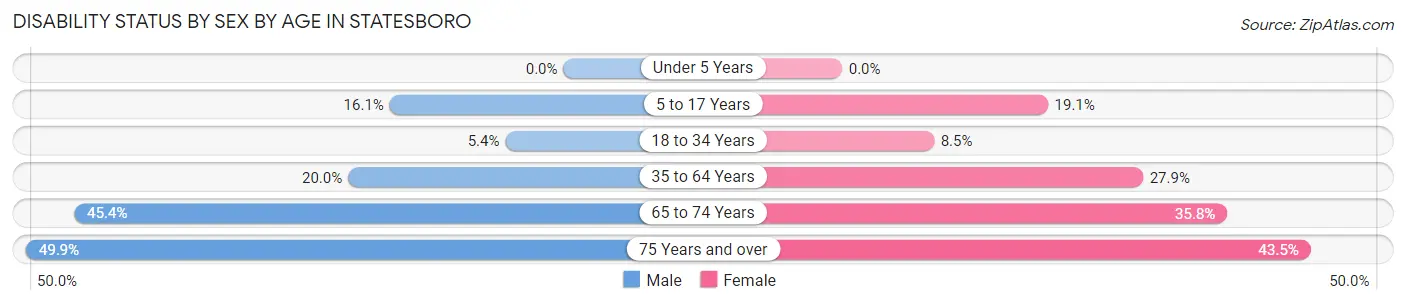
| Age Bracket | Male | Female |
| Under 5 Years | 0 (0.0%) | 0 (0.0%) |
| 5 to 17 Years | 274 (16.1%) | 366 (19.1%) |
| 18 to 34 Years | 506 (5.4%) | 838 (8.5%) |
| 35 to 64 Years | 502 (20.0%) | 1,021 (27.9%) |
| 65 to 74 Years | 277 (45.4%) | 290 (35.8%) |
| 75 Years and over | 206 (49.9%) | 285 (43.5%) |
Disability Class by Sex by Age in Statesboro
Disability Class: Hearing Difficulty
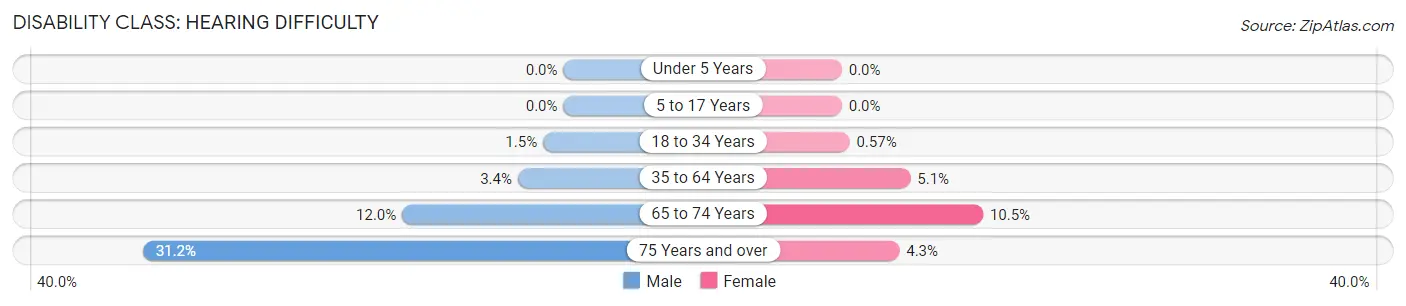
| Age Bracket | Male | Female |
| Under 5 Years | 0 (0.0%) | 0 (0.0%) |
| 5 to 17 Years | 0 (0.0%) | 0 (0.0%) |
| 18 to 34 Years | 142 (1.5%) | 56 (0.6%) |
| 35 to 64 Years | 85 (3.4%) | 186 (5.1%) |
| 65 to 74 Years | 73 (12.0%) | 85 (10.5%) |
| 75 Years and over | 129 (31.2%) | 28 (4.3%) |
Disability Class: Vision Difficulty
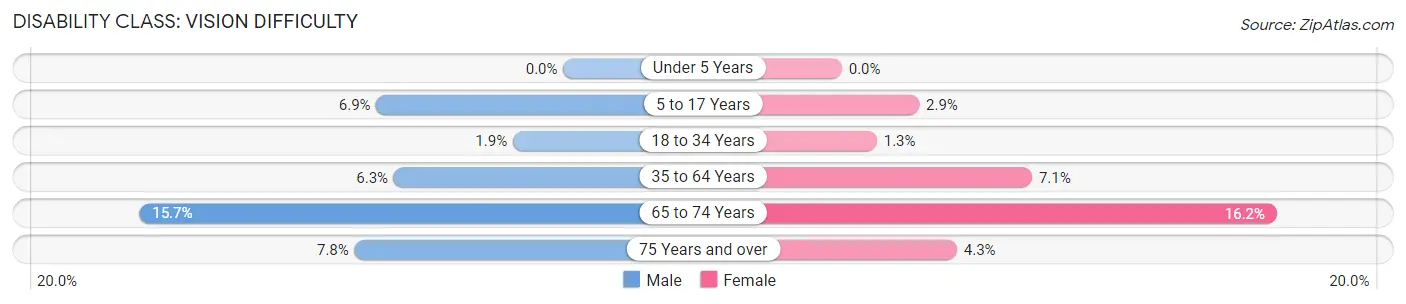
| Age Bracket | Male | Female |
| Under 5 Years | 0 (0.0%) | 0 (0.0%) |
| 5 to 17 Years | 118 (6.9%) | 55 (2.9%) |
| 18 to 34 Years | 176 (1.9%) | 128 (1.3%) |
| 35 to 64 Years | 158 (6.3%) | 258 (7.1%) |
| 65 to 74 Years | 96 (15.7%) | 131 (16.2%) |
| 75 Years and over | 32 (7.7%) | 28 (4.3%) |
Disability Class: Cognitive Difficulty
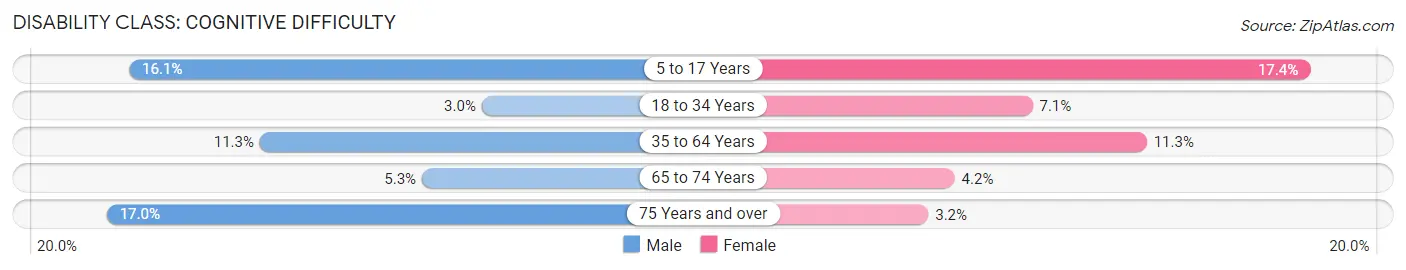
| Age Bracket | Male | Female |
| 5 to 17 Years | 274 (16.1%) | 333 (17.4%) |
| 18 to 34 Years | 285 (3.0%) | 695 (7.1%) |
| 35 to 64 Years | 283 (11.3%) | 414 (11.3%) |
| 65 to 74 Years | 32 (5.2%) | 34 (4.2%) |
| 75 Years and over | 70 (17.0%) | 21 (3.2%) |
Disability Class: Ambulatory Difficulty
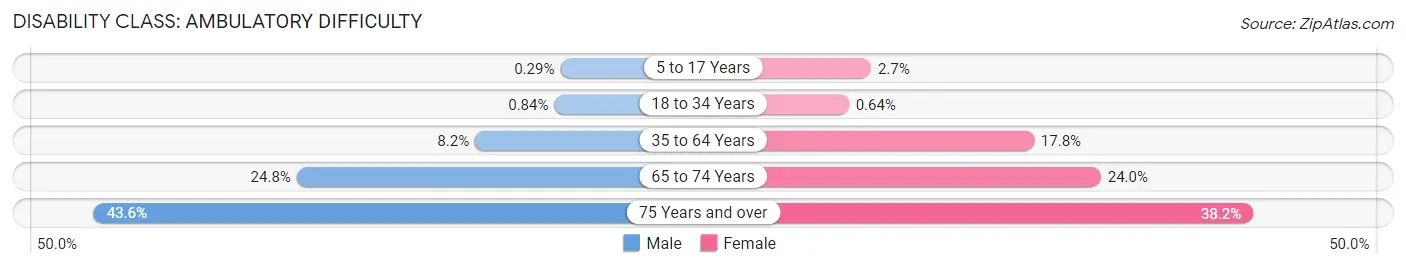
| Age Bracket | Male | Female |
| 5 to 17 Years | 5 (0.3%) | 52 (2.7%) |
| 18 to 34 Years | 79 (0.8%) | 63 (0.6%) |
| 35 to 64 Years | 206 (8.2%) | 652 (17.8%) |
| 65 to 74 Years | 151 (24.7%) | 195 (24.0%) |
| 75 Years and over | 180 (43.6%) | 250 (38.2%) |
Disability Class: Self-Care Difficulty
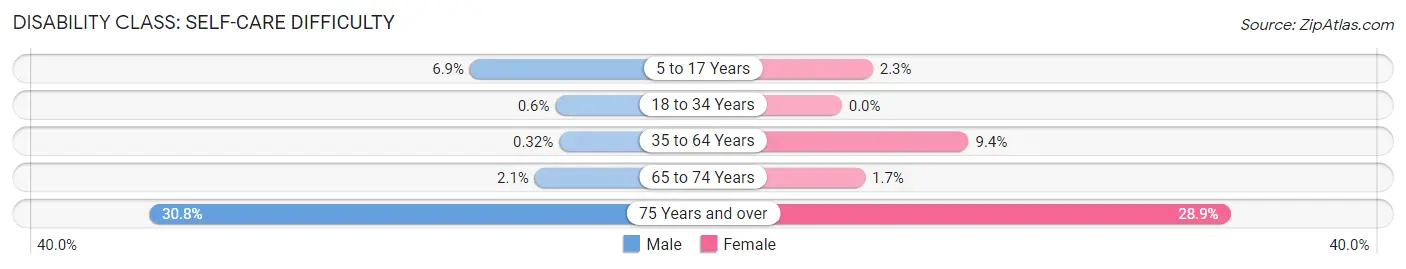
| Age Bracket | Male | Female |
| 5 to 17 Years | 118 (6.9%) | 44 (2.3%) |
| 18 to 34 Years | 56 (0.6%) | 0 (0.0%) |
| 35 to 64 Years | 8 (0.3%) | 344 (9.4%) |
| 65 to 74 Years | 13 (2.1%) | 14 (1.7%) |
| 75 Years and over | 127 (30.7%) | 189 (28.8%) |
Technology Access in Statesboro
Computing Device Access in Statesboro
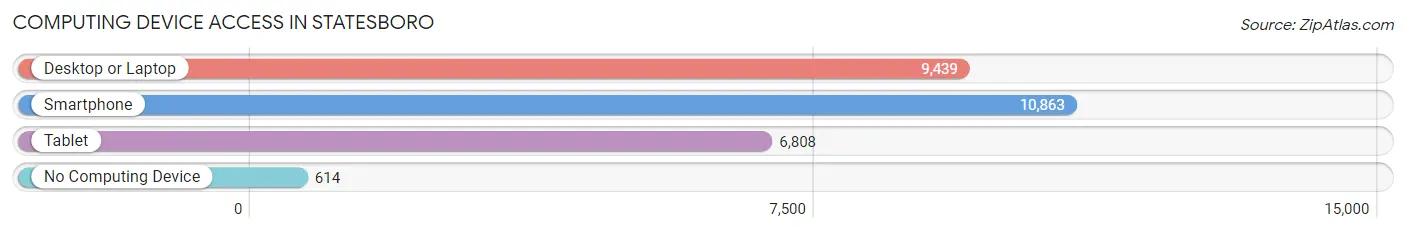
| Device Type | # Households | % Households |
| Desktop or Laptop | 9,439 | 79.6% |
| Smartphone | 10,863 | 91.6% |
| Tablet | 6,808 | 57.4% |
| No Computing Device | 614 | 5.2% |
| Total | 11,857 | 100.0% |
Internet Access in Statesboro
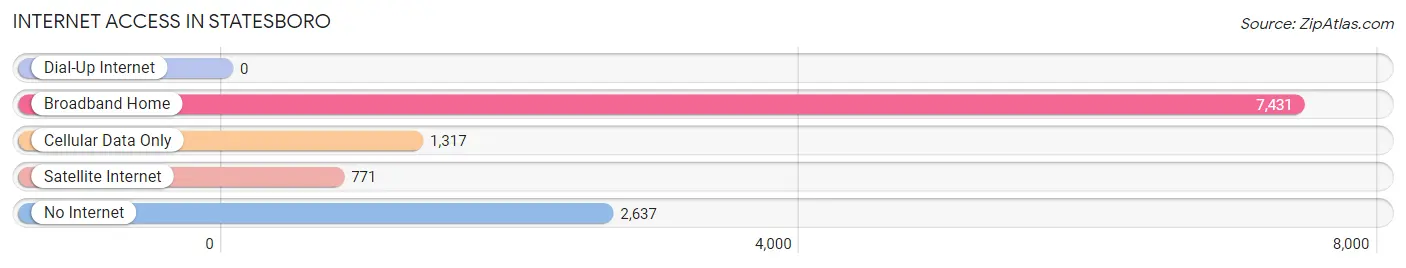
| Internet Type | # Households | % Households |
| Dial-Up Internet | 0 | 0.0% |
| Broadband Home | 7,431 | 62.7% |
| Cellular Data Only | 1,317 | 11.1% |
| Satellite Internet | 771 | 6.5% |
| No Internet | 2,637 | 22.2% |
| Total | 11,857 | 100.0% |
Statesboro Summary
History
The city of Statesboro, Georgia is located in Bulloch County and is the county seat. It is the largest city in the county and is home to Georgia Southern University. The city was founded in 1803 and was originally known as the Town of Statesborough. The city was named after General James States, who was a Revolutionary War hero.
The city was originally a small agricultural community, but it began to grow in the late 19th century when the railroad was built through the area. This allowed for the transportation of goods and services to and from the city. The city also became a center for education with the establishment of Georgia Southern University in 1906.
The city experienced a period of growth in the early 20th century, and by the 1950s, it had become a major industrial center. The city was home to several large manufacturing plants, including a paper mill, a cotton mill, and a canning factory.
The city experienced a decline in the late 20th century as the manufacturing industry began to decline. However, the city has since experienced a resurgence in recent years due to the growth of Georgia Southern University and the development of the downtown area.
Geography
Statesboro is located in the southeastern part of the state of Georgia, approximately 50 miles west of Savannah and 80 miles east of Macon. The city is situated in the Ogeechee River Valley and is surrounded by rolling hills and pine forests. The city is located at an elevation of approximately 300 feet above sea level.
The climate in Statesboro is classified as humid subtropical, with hot, humid summers and mild winters. The average annual temperature is around 70 degrees Fahrenheit, with the average high temperature in the summer months reaching into the mid-90s. The average low temperature in the winter months is around 40 degrees Fahrenheit.
Economy
The economy of Statesboro is largely driven by the presence of Georgia Southern University. The university is the largest employer in the city, with over 5,000 employees. Other major employers in the city include East Georgia Regional Medical Center, Ogeechee Technical College, and the Bulloch County School System.
The city is also home to several large manufacturing plants, including a paper mill, a cotton mill, and a canning factory. The city is also home to several retail stores, restaurants, and other businesses.
Demographics
As of the 2010 census, the population of Statesboro was 28,422. The racial makeup of the city was 57.3% White, 34.2% African American, 0.3% Native American, 2.2% Asian, 0.1% Pacific Islander, 3.7% from other races, and 2.4% from two or more races. Hispanic or Latino of any race were 8.2% of the population.
The median household income in Statesboro was $30,945, and the median family income was $41,845. The per capita income for the city was $17,845. About 17.2% of the population was below the poverty line.
Common Questions
What is Per Capita Income in Statesboro?
Per Capita income in Statesboro is $18,069.
What is the Median Family Income in Statesboro?
Median Family Income in Statesboro is $50,417.
What is the Median Household income in Statesboro?
Median Household Income in Statesboro is $38,845.
What is Income or Wage Gap in Statesboro?
Income or Wage Gap in Statesboro is 3.6%.
Women in Statesboro earn 96.4 cents for every dollar earned by a man.
What is Family Income Deficit in Statesboro?
Family Income Deficit in Statesboro is $10,342.
Families that are below poverty line in Statesboro earn $10,342 less on average than the poverty threshold level.
What is Inequality or Gini Index in Statesboro?
Inequality or Gini Index in Statesboro is 0.45.
What is the Total Population of Statesboro?
Total Population of Statesboro is 33,185.
What is the Total Male Population of Statesboro?
Total Male Population of Statesboro is 15,532.
What is the Total Female Population of Statesboro?
Total Female Population of Statesboro is 17,653.
What is the Ratio of Males per 100 Females in Statesboro?
There are 87.99 Males per 100 Females in Statesboro.
What is the Ratio of Females per 100 Males in Statesboro?
There are 113.66 Females per 100 Males in Statesboro.
What is the Median Population Age in Statesboro?
Median Population Age in Statesboro is 22.6 Years.
What is the Average Family Size in Statesboro
Average Family Size in Statesboro is 3.0 People.
What is the Average Household Size in Statesboro
Average Household Size in Statesboro is 2.3 People.
How Large is the Labor Force in Statesboro?
There are 16,505 People in the Labor Forcein in Statesboro.
What is the Percentage of People in the Labor Force in Statesboro?
57.4% of People are in the Labor Force in Statesboro.
What is the Unemployment Rate in Statesboro?
Unemployment Rate in Statesboro is 11.3%.