Lazy Y U, AZ Map & Demographics
Lazy Y U Map
Lazy Y U Overview
$45,479
PER CAPITA INCOME
$82,625
AVG FAMILY INCOME
$84,000
AVG HOUSEHOLD INCOME
0.41
INEQUALITY / GINI INDEX
368
TOTAL POPULATION
159
MALE POPULATION
209
FEMALE POPULATION
76.08
MALES / 100 FEMALES
131.45
FEMALES / 100 MALES
62.1
MEDIAN AGE
2.9
AVG FAMILY SIZE
2.7
AVG HOUSEHOLD SIZE
173
LABOR FORCE [ PEOPLE ]
53.9%
PERCENT IN LABOR FORCE
Income in Lazy Y U
Income Overview in Lazy Y U
Per Capita Income in Lazy Y U is $45,479, while median incomes of families and households are $82,625 and $84,000 respectively.
| Characteristic | Number | Measure |
| Per Capita Income | 368 | $45,479 |
| Median Family Income | 125 | $82,625 |
| Mean Family Income | 125 | $119,598 |
| Median Household Income | 136 | $84,000 |
| Mean Household Income | 136 | $118,226 |
| Income Deficit | 125 | $0 |
| Wage / Income Gap (%) | 368 | 0.00% |
| Wage / Income Gap ($) | 368 | 100.00¢ per $1 |
| Gini / Inequality Index | 368 | 0.41 |
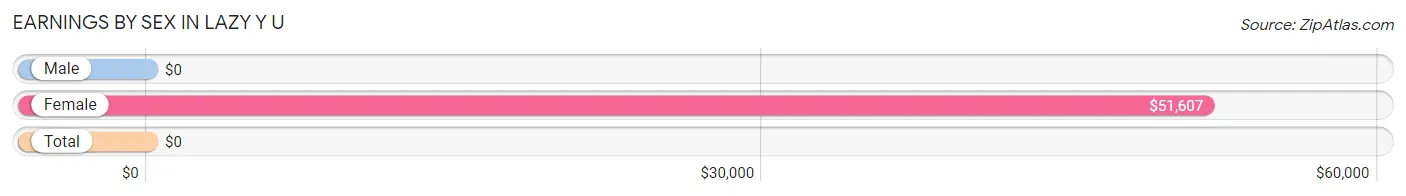
Earnings by Sex in Lazy Y U
| Sex | Number | Average Earnings |
| Male | 85 (49.1%) | $0 |
| Female | 88 (50.9%) | $51,607 |
| Total | 173 (100.0%) | $0 |
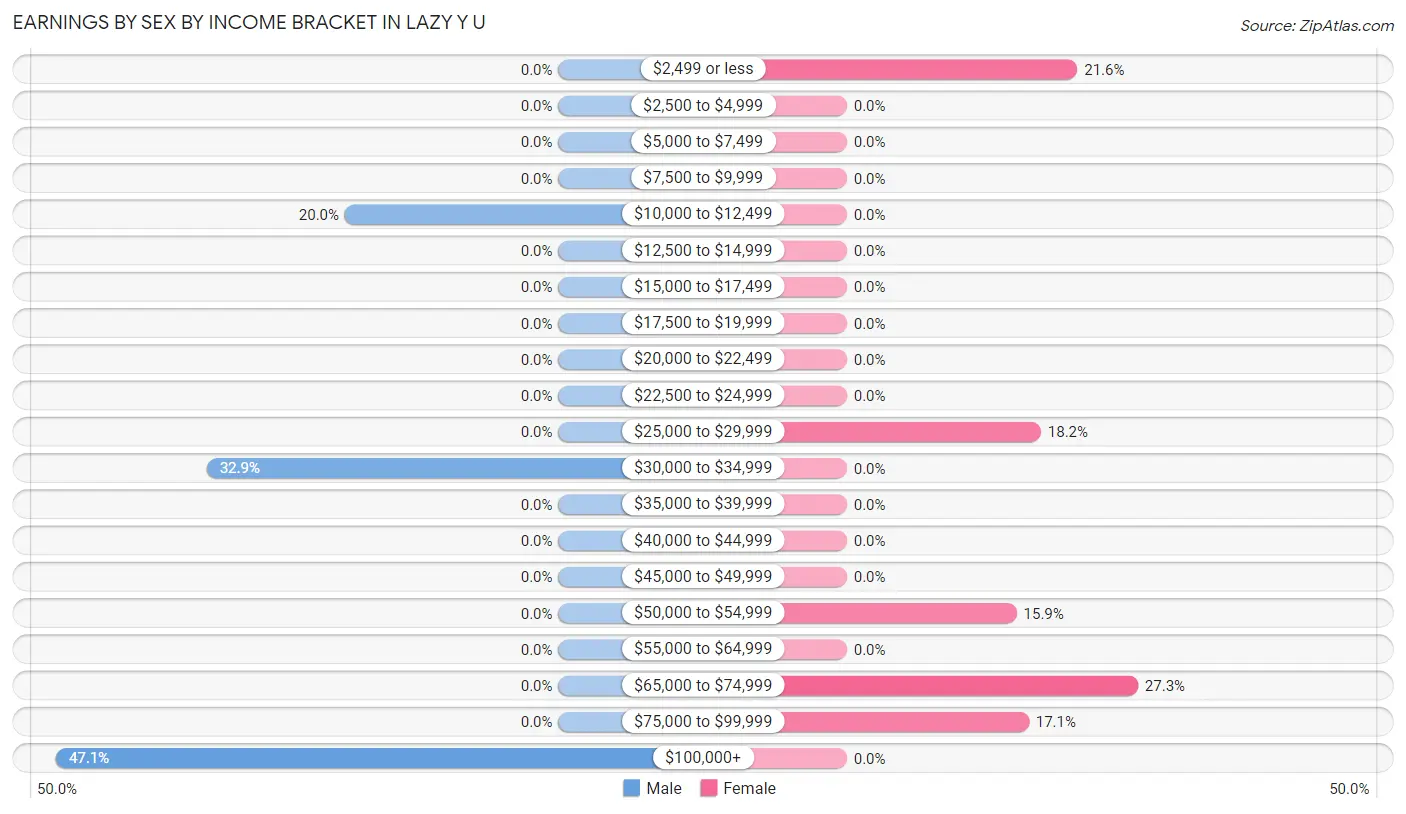
Earnings by Sex by Income Bracket in Lazy Y U
The most common earnings brackets in Lazy Y U are $100,000+ for men (40 | 47.1%) and $65,000 to $74,999 for women (24 | 27.3%).
| Income | Male | Female |
| $2,499 or less | 0 (0.0%) | 19 (21.6%) |
| $2,500 to $4,999 | 0 (0.0%) | 0 (0.0%) |
| $5,000 to $7,499 | 0 (0.0%) | 0 (0.0%) |
| $7,500 to $9,999 | 0 (0.0%) | 0 (0.0%) |
| $10,000 to $12,499 | 17 (20.0%) | 0 (0.0%) |
| $12,500 to $14,999 | 0 (0.0%) | 0 (0.0%) |
| $15,000 to $17,499 | 0 (0.0%) | 0 (0.0%) |
| $17,500 to $19,999 | 0 (0.0%) | 0 (0.0%) |
| $20,000 to $22,499 | 0 (0.0%) | 0 (0.0%) |
| $22,500 to $24,999 | 0 (0.0%) | 0 (0.0%) |
| $25,000 to $29,999 | 0 (0.0%) | 16 (18.2%) |
| $30,000 to $34,999 | 28 (32.9%) | 0 (0.0%) |
| $35,000 to $39,999 | 0 (0.0%) | 0 (0.0%) |
| $40,000 to $44,999 | 0 (0.0%) | 0 (0.0%) |
| $45,000 to $49,999 | 0 (0.0%) | 0 (0.0%) |
| $50,000 to $54,999 | 0 (0.0%) | 14 (15.9%) |
| $55,000 to $64,999 | 0 (0.0%) | 0 (0.0%) |
| $65,000 to $74,999 | 0 (0.0%) | 24 (27.3%) |
| $75,000 to $99,999 | 0 (0.0%) | 15 (17.1%) |
| $100,000+ | 40 (47.1%) | 0 (0.0%) |
| Total | 85 (100.0%) | 88 (100.0%) |
Earnings by Sex by Educational Attainment in Lazy Y U
| Educational Attainment | Male Income | Female Income |
| Less than High School | - | - |
| High School Diploma | - | - |
| College or Associate's Degree | - | - |
| Bachelor's Degree | - | - |
| Graduate Degree | - | - |
| Total | - | - |
Family Income in Lazy Y U
Family Income Brackets in Lazy Y U
According to the Lazy Y U family income data, there are 45 families falling into the $50,000 to $74,999 income range, which is the most common income bracket and makes up 36.0% of all families.
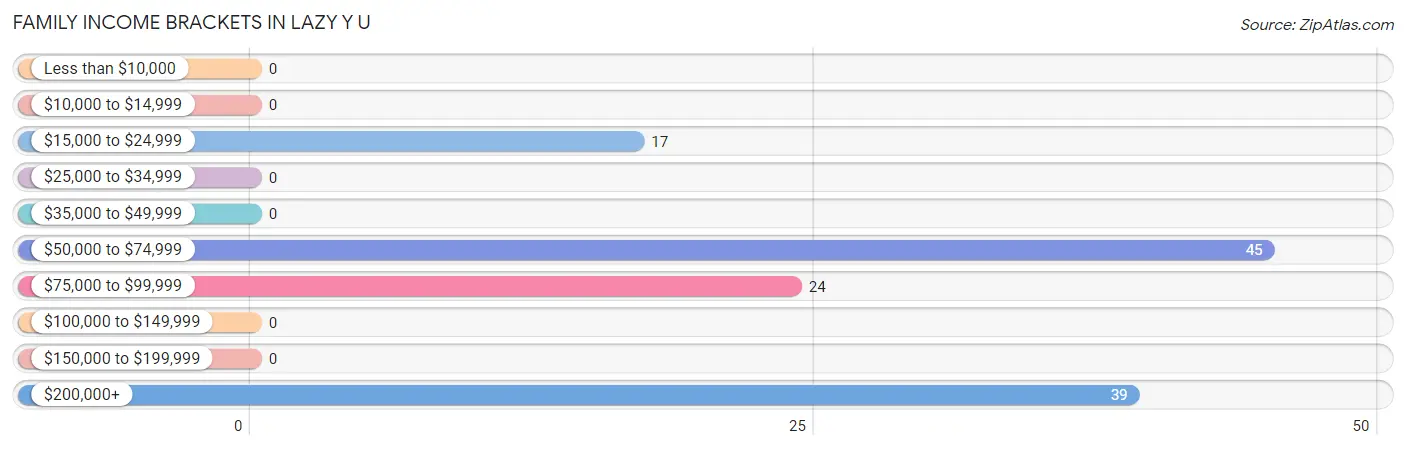
| Income Bracket | # Families | % Families |
| Less than $10,000 | 0 | 0.0% |
| $10,000 to $14,999 | 0 | 0.0% |
| $15,000 to $24,999 | 17 | 13.6% |
| $25,000 to $34,999 | 0 | 0.0% |
| $35,000 to $49,999 | 0 | 0.0% |
| $50,000 to $74,999 | 45 | 36.0% |
| $75,000 to $99,999 | 24 | 19.2% |
| $100,000 to $149,999 | 0 | 0.0% |
| $150,000 to $199,999 | 0 | 0.0% |
| $200,000+ | 39 | 31.2% |
Family Income by Famaliy Size in Lazy Y U
2-person families (82 | 65.6%) account for the highest median family income in Lazy Y U with $59,500 per family, while 2-person families (82 | 65.6%) have the highest median income of $29,750 per family member.
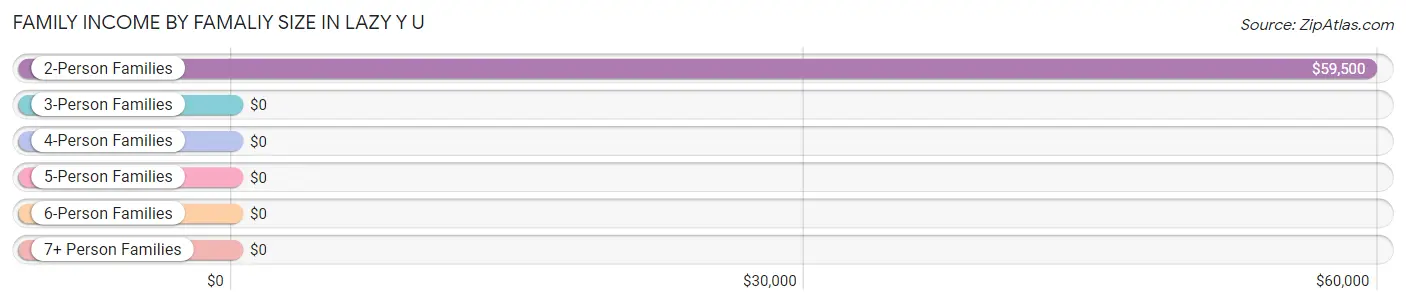
| Income Bracket | # Families | Median Income |
| 2-Person Families | 82 (65.6%) | $59,500 |
| 3-Person Families | 19 (15.2%) | $0 |
| 4-Person Families | 24 (19.2%) | $0 |
| 5-Person Families | 0 (0.0%) | $0 |
| 6-Person Families | 0 (0.0%) | $0 |
| 7+ Person Families | 0 (0.0%) | $0 |
| Total | 125 (100.0%) | $82,625 |
Family Income by Number of Earners in Lazy Y U
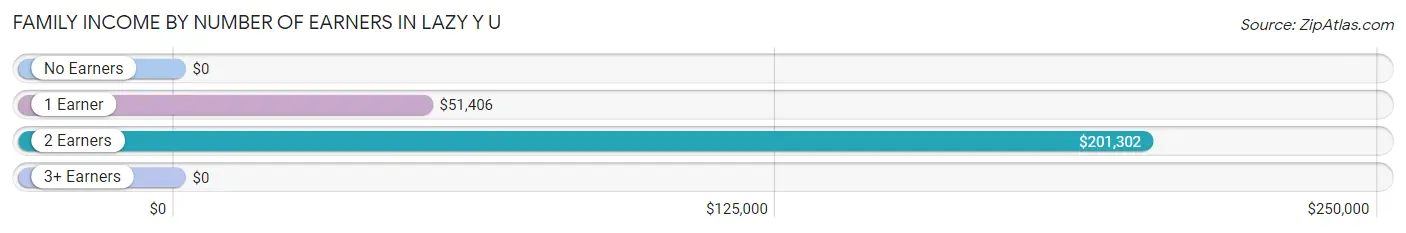
| Number of Earners | # Families | Median Income |
| No Earners | 20 (16.0%) | $0 |
| 1 Earner | 52 (41.6%) | $51,406 |
| 2 Earners | 53 (42.4%) | $201,302 |
| 3+ Earners | 0 (0.0%) | $0 |
| Total | 125 (100.0%) | $82,625 |
Household Income in Lazy Y U
Household Income Brackets in Lazy Y U
With 45 households falling in the category, the $50,000 to $74,999 income range is the most frequent in Lazy Y U, accounting for 33.1% of all households.
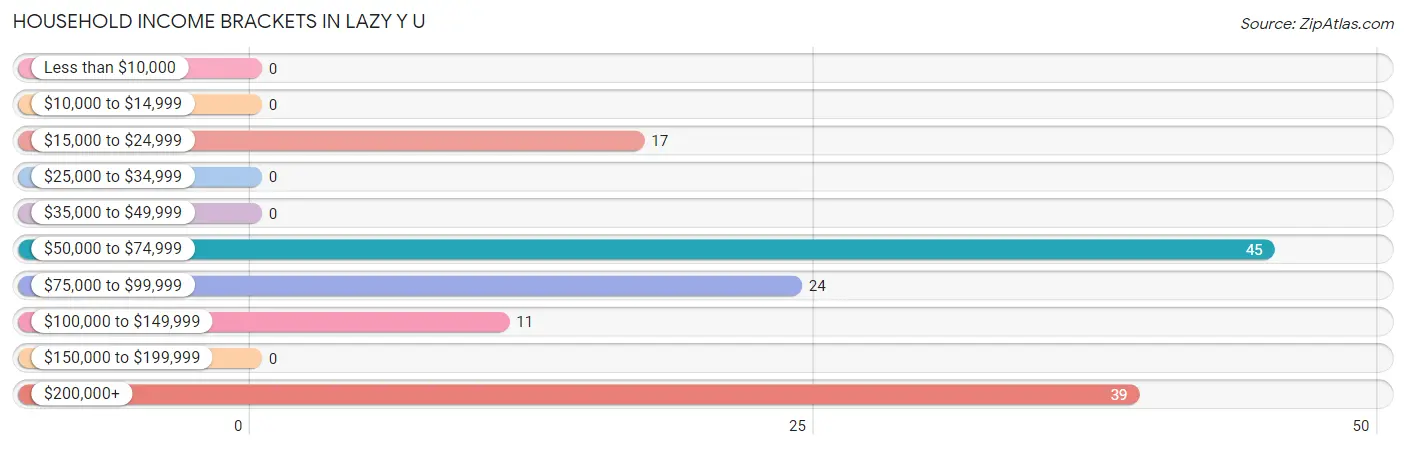
| Income Bracket | # Households | % Households |
| Less than $10,000 | 0 | 0.0% |
| $10,000 to $14,999 | 0 | 0.0% |
| $15,000 to $24,999 | 17 | 12.5% |
| $25,000 to $34,999 | 0 | 0.0% |
| $35,000 to $49,999 | 0 | 0.0% |
| $50,000 to $74,999 | 45 | 33.1% |
| $75,000 to $99,999 | 24 | 17.6% |
| $100,000 to $149,999 | 11 | 8.1% |
| $150,000 to $199,999 | 0 | 0.0% |
| $200,000+ | 39 | 28.7% |
Household Income by Householder Age in Lazy Y U
The median household income in Lazy Y U is $84,000, with the highest median household income of $62,632 found in the 65+ years age bracket for the primary householder. A total of 56 households (41.2%) fall into this category.
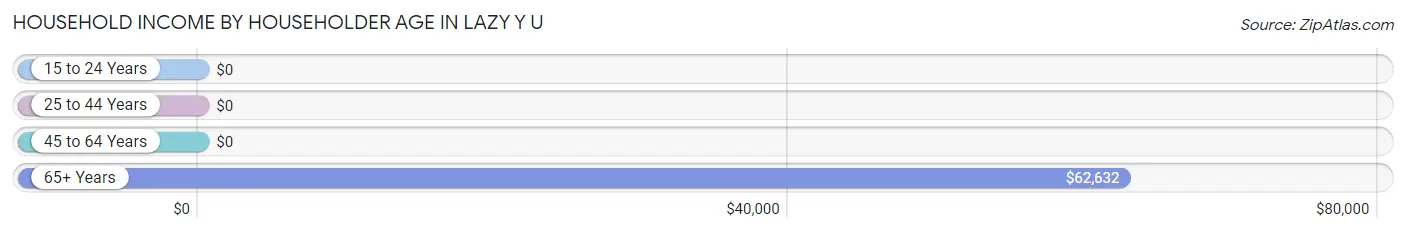
| Income Bracket | # Households | Median Income |
| 15 to 24 Years | 0 (0.0%) | $0 |
| 25 to 44 Years | 24 (17.6%) | $0 |
| 45 to 64 Years | 56 (41.2%) | $0 |
| 65+ Years | 56 (41.2%) | $62,632 |
| Total | 136 (100.0%) | $84,000 |
Poverty in Lazy Y U
Income Below Poverty by Sex and Age in Lazy Y U
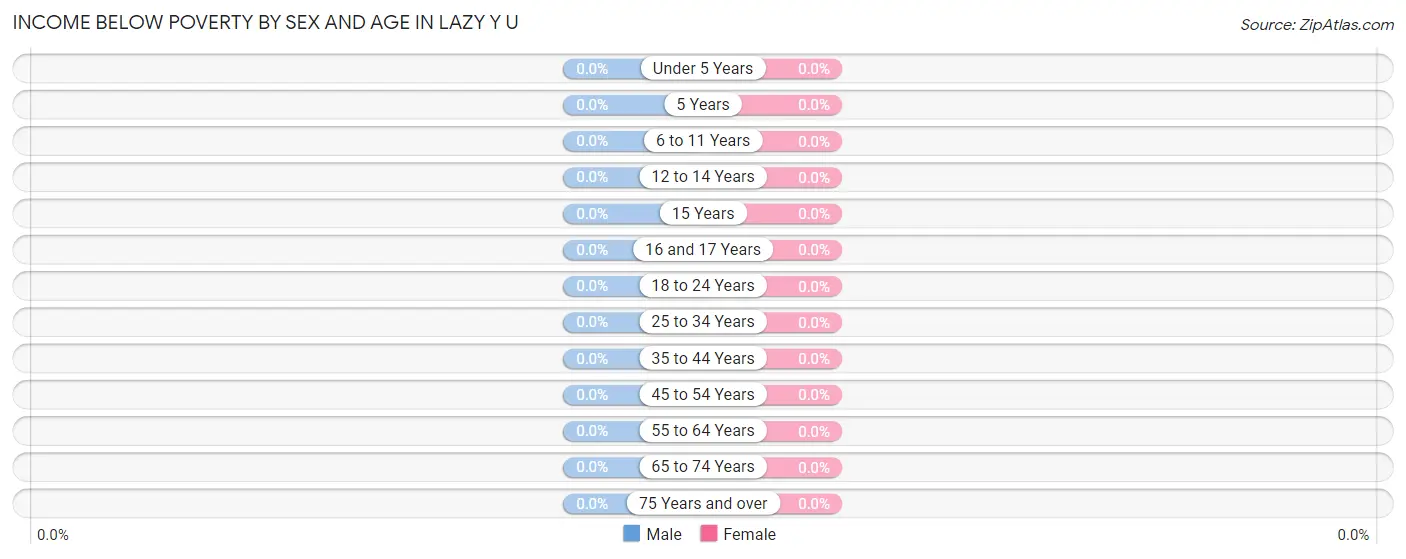
| Age Bracket | Male | Female |
| Under 5 Years | 0 (0.0%) | 0 (0.0%) |
| 5 Years | 0 (0.0%) | 0 (0.0%) |
| 6 to 11 Years | 0 (0.0%) | 0 (0.0%) |
| 12 to 14 Years | 0 (0.0%) | 0 (0.0%) |
| 15 Years | 0 (0.0%) | 0 (0.0%) |
| 16 and 17 Years | 0 (0.0%) | 0 (0.0%) |
| 18 to 24 Years | 0 (0.0%) | 0 (0.0%) |
| 25 to 34 Years | 0 (0.0%) | 0 (0.0%) |
| 35 to 44 Years | 0 (0.0%) | 0 (0.0%) |
| 45 to 54 Years | 0 (0.0%) | 0 (0.0%) |
| 55 to 64 Years | 0 (0.0%) | 0 (0.0%) |
| 65 to 74 Years | 0 (0.0%) | 0 (0.0%) |
| 75 Years and over | 0 (0.0%) | 0 (0.0%) |
| Total | 0 (0.0%) | 0 (0.0%) |
Income Above Poverty by Sex and Age in Lazy Y U
According to the poverty statistics in Lazy Y U, males aged 25 to 34 years and females aged 6 to 11 years are the age groups that are most secure financially, with 100.0% of males and 100.0% of females in these age groups living above the poverty line.
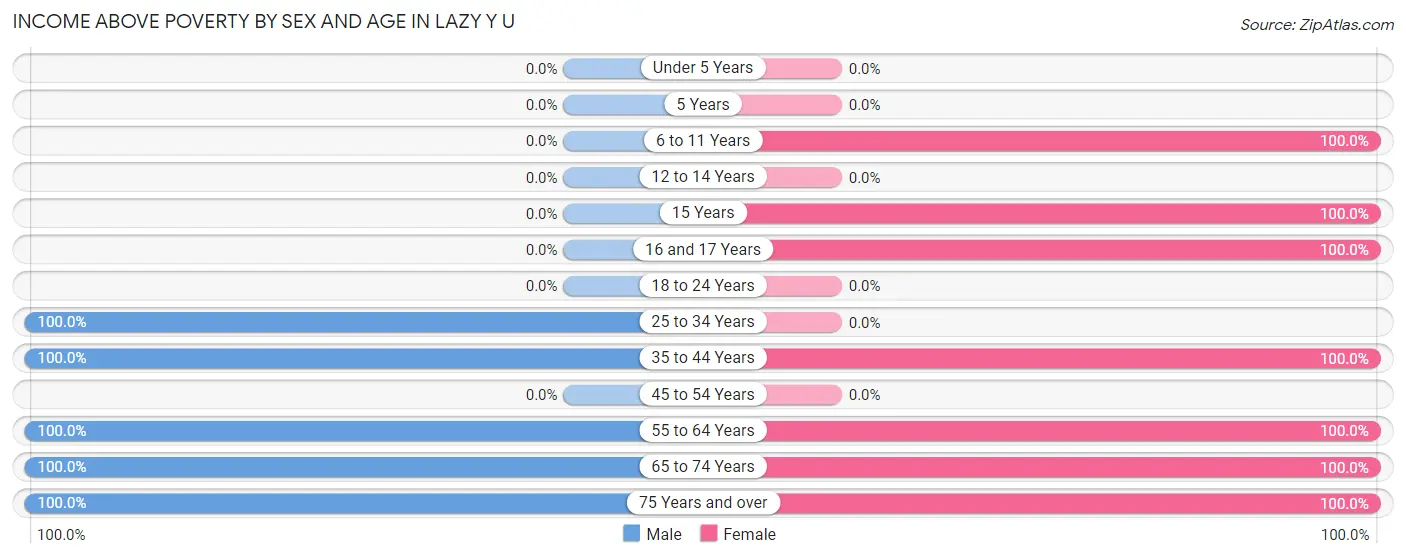
| Age Bracket | Male | Female |
| Under 5 Years | 0 (0.0%) | 0 (0.0%) |
| 5 Years | 0 (0.0%) | 0 (0.0%) |
| 6 to 11 Years | 0 (0.0%) | 24 (100.0%) |
| 12 to 14 Years | 0 (0.0%) | 0 (0.0%) |
| 15 Years | 0 (0.0%) | 23 (100.0%) |
| 16 and 17 Years | 0 (0.0%) | 42 (100.0%) |
| 18 to 24 Years | 0 (0.0%) | 0 (0.0%) |
| 25 to 34 Years | 28 (100.0%) | 0 (0.0%) |
| 35 to 44 Years | 24 (100.0%) | 24 (100.0%) |
| 45 to 54 Years | 0 (0.0%) | 0 (0.0%) |
| 55 to 64 Years | 33 (100.0%) | 67 (100.0%) |
| 65 to 74 Years | 53 (100.0%) | 10 (100.0%) |
| 75 Years and over | 21 (100.0%) | 19 (100.0%) |
| Total | 159 (100.0%) | 209 (100.0%) |
Income Below Poverty Among Married-Couple Families in Lazy Y U
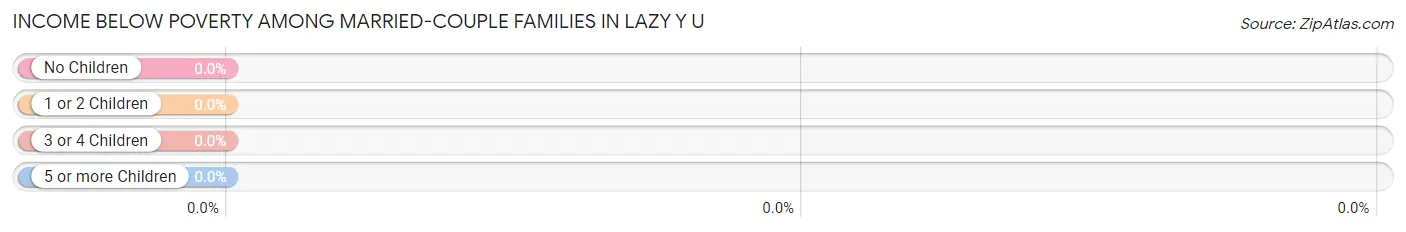
| Children | Above Poverty | Below Poverty |
| No Children | 70 (100.0%) | 0 (0.0%) |
| 1 or 2 Children | 24 (100.0%) | 0 (0.0%) |
| 3 or 4 Children | 0 (0.0%) | 0 (0.0%) |
| 5 or more Children | 0 (0.0%) | 0 (0.0%) |
| Total | 94 (100.0%) | 0 (0.0%) |
Income Below Poverty Among Single-Parent Households in Lazy Y U
| Children | Single Father | Single Mother |
| No Children | 0 (0.0%) | 0 (0.0%) |
| 1 or 2 Children | 0 (0.0%) | 0 (0.0%) |
| 3 or 4 Children | 0 (0.0%) | 0 (0.0%) |
| 5 or more Children | 0 (0.0%) | 0 (0.0%) |
| Total | 0 (0.0%) | 0 (0.0%) |
Income Below Poverty Among Married-Couple vs Single-Parent Households in Lazy Y U
| Children | Married-Couple Families | Single-Parent Households |
| No Children | 0 (0.0%) | 0 (0.0%) |
| 1 or 2 Children | 0 (0.0%) | 0 (0.0%) |
| 3 or 4 Children | 0 (0.0%) | 0 (0.0%) |
| 5 or more Children | 0 (0.0%) | 0 (0.0%) |
| Total | 0 (0.0%) | 0 (0.0%) |
Race in Lazy Y U
The most populous races in Lazy Y U are , and White / Caucasian (368 | 100.0%).
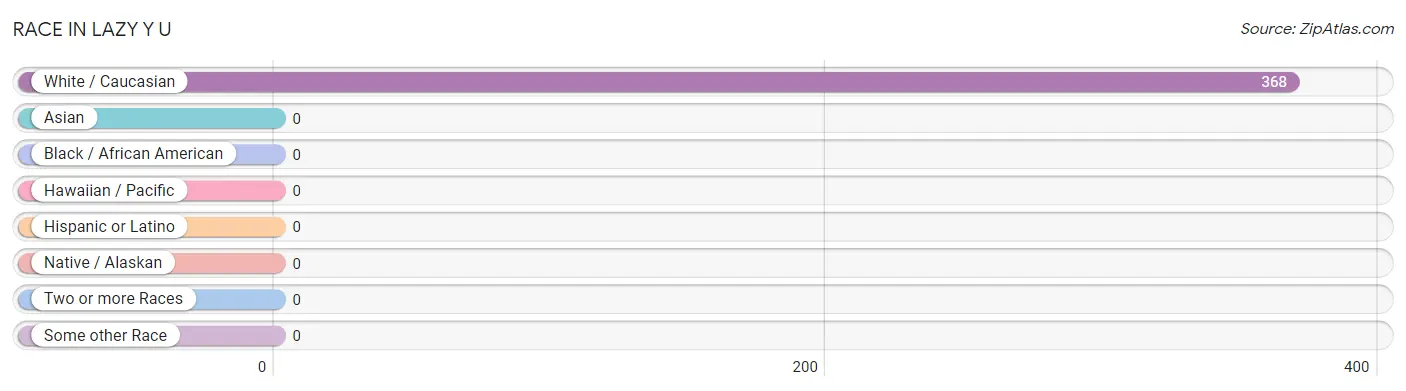
| Race | # Population | % Population |
| Asian | 0 | 0.0% |
| Black / African American | 0 | 0.0% |
| Hawaiian / Pacific | 0 | 0.0% |
| Hispanic or Latino | 0 | 0.0% |
| Native / Alaskan | 0 | 0.0% |
| White / Caucasian | 368 | 100.0% |
| Two or more Races | 0 | 0.0% |
| Some other Race | 0 | 0.0% |
| Total | 368 | 100.0% |
Ancestry in Lazy Y U
The most populous ancestries reported in Lazy Y U are English (116 | 31.5%), Scottish (48 | 13.0%), French (47 | 12.8%), European (42 | 11.4%), and German (33 | 9.0%), together accounting for 77.7% of all Lazy Y U residents.
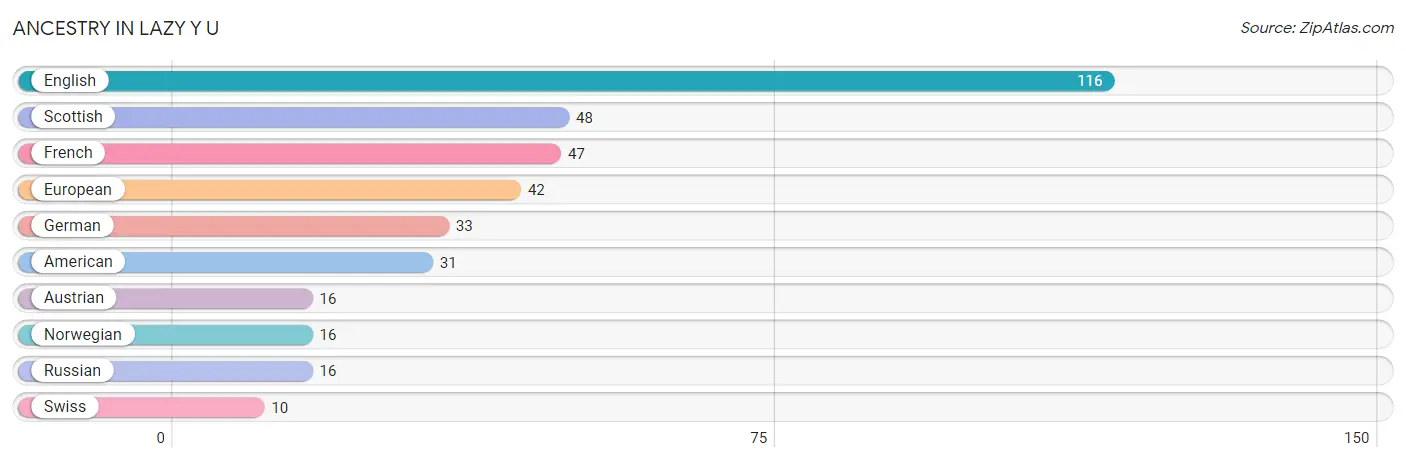
| Ancestry | # Population | % Population |
| American | 31 | 8.4% |
| Austrian | 16 | 4.3% |
| English | 116 | 31.5% |
| European | 42 | 11.4% |
| French | 47 | 12.8% |
| German | 33 | 9.0% |
| Norwegian | 16 | 4.3% |
| Russian | 16 | 4.3% |
| Scottish | 48 | 13.0% |
| Swiss | 10 | 2.7% | View All 10 Rows |
Immigrants in Lazy Y U
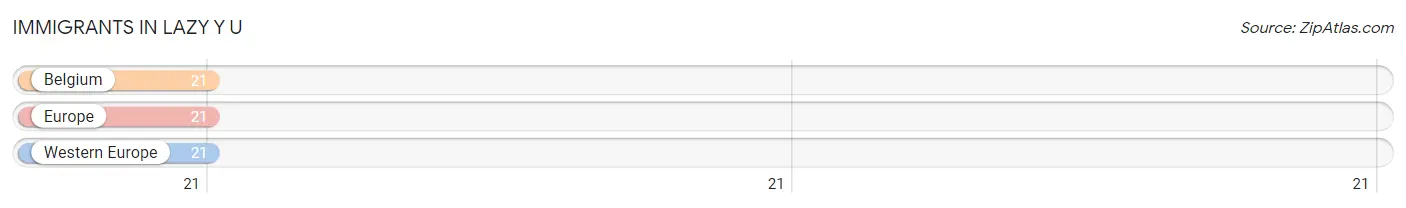
The most numerous immigrant groups reported in Lazy Y U came from Belgium (21 | 5.7%), Europe (21 | 5.7%), and Western Europe (21 | 5.7%), together accounting for 17.1% of all Lazy Y U residents.
| Immigration Origin | # Population | % Population |
| Belgium | 21 | 5.7% |
| Europe | 21 | 5.7% |
| Western Europe | 21 | 5.7% | View All 3 Rows |
Sex and Age in Lazy Y U
Sex and Age in Lazy Y U
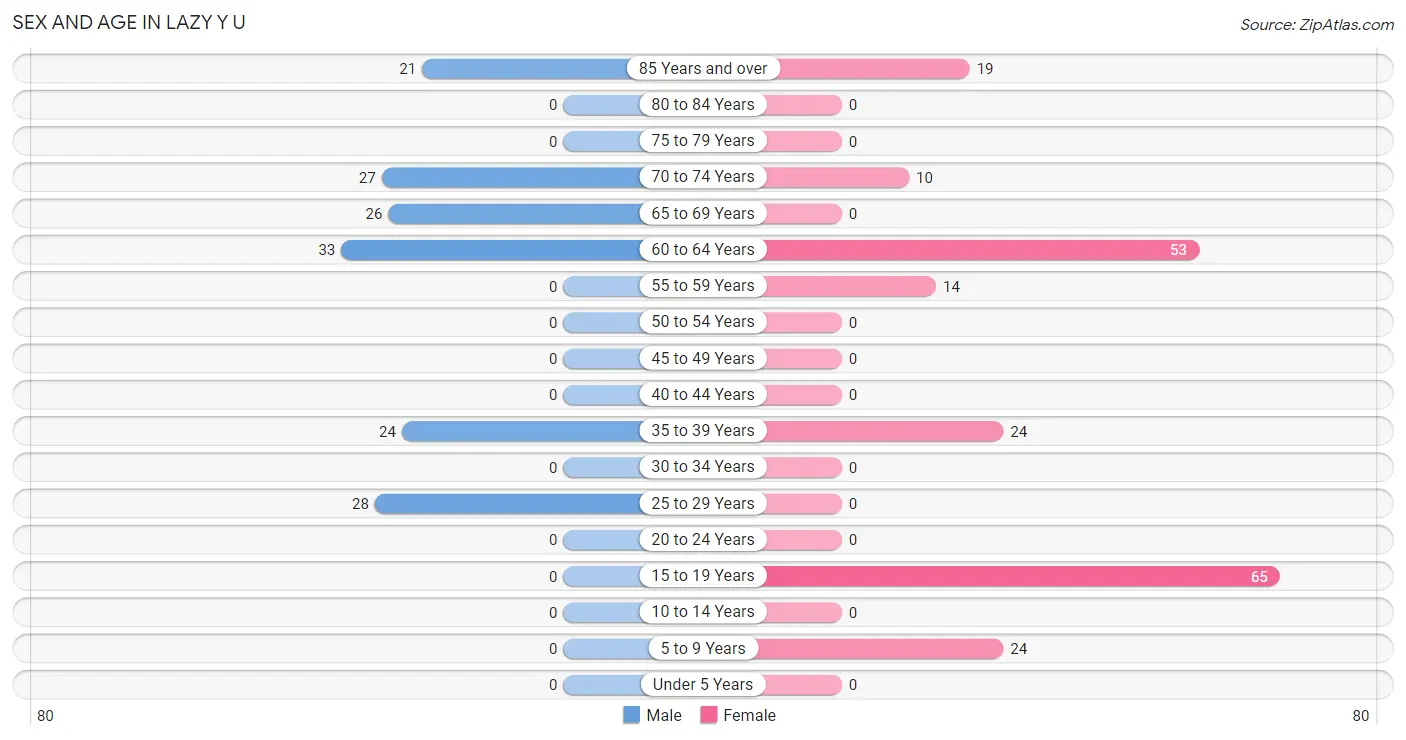
The most populous age groups in Lazy Y U are 60 to 64 Years (33 | 20.7%) for men and 15 to 19 Years (65 | 31.1%) for women.
| Age Bracket | Male | Female |
| Under 5 Years | 0 (0.0%) | 0 (0.0%) |
| 5 to 9 Years | 0 (0.0%) | 24 (11.5%) |
| 10 to 14 Years | 0 (0.0%) | 0 (0.0%) |
| 15 to 19 Years | 0 (0.0%) | 65 (31.1%) |
| 20 to 24 Years | 0 (0.0%) | 0 (0.0%) |
| 25 to 29 Years | 28 (17.6%) | 0 (0.0%) |
| 30 to 34 Years | 0 (0.0%) | 0 (0.0%) |
| 35 to 39 Years | 24 (15.1%) | 24 (11.5%) |
| 40 to 44 Years | 0 (0.0%) | 0 (0.0%) |
| 45 to 49 Years | 0 (0.0%) | 0 (0.0%) |
| 50 to 54 Years | 0 (0.0%) | 0 (0.0%) |
| 55 to 59 Years | 0 (0.0%) | 14 (6.7%) |
| 60 to 64 Years | 33 (20.7%) | 53 (25.4%) |
| 65 to 69 Years | 26 (16.4%) | 0 (0.0%) |
| 70 to 74 Years | 27 (17.0%) | 10 (4.8%) |
| 75 to 79 Years | 0 (0.0%) | 0 (0.0%) |
| 80 to 84 Years | 0 (0.0%) | 0 (0.0%) |
| 85 Years and over | 21 (13.2%) | 19 (9.1%) |
| Total | 159 (100.0%) | 209 (100.0%) |
Families and Households in Lazy Y U
Median Family Size in Lazy Y U
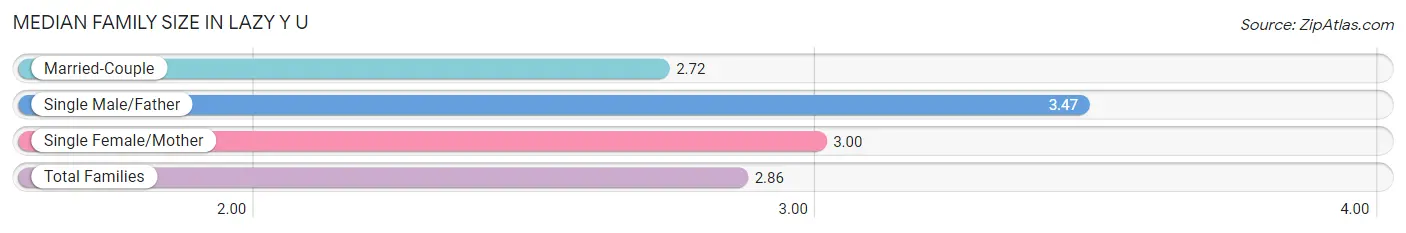
The median family size in Lazy Y U is 2.86 persons per family, with single male/father families (17 | 13.6%) accounting for the largest median family size of 3.47 persons per family. On the other hand, married-couple families (94 | 75.2%) represent the smallest median family size with 2.72 persons per family.
| Family Type | # Families | Family Size |
| Married-Couple | 94 (75.2%) | 2.72 |
| Single Male/Father | 17 (13.6%) | 3.47 |
| Single Female/Mother | 14 (11.2%) | 3.00 |
| Total Families | 125 (100.0%) | 2.86 |
Median Household Size in Lazy Y U
| Household Type | # Households | Household Size |
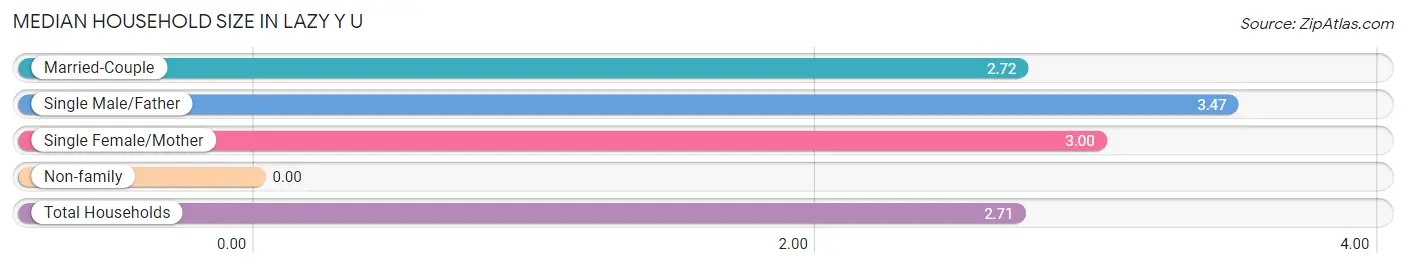
| Married-Couple | 94 (69.1%) | 2.72 |
| Single Male/Father | 17 (12.5%) | 3.47 |
| Single Female/Mother | 14 (10.3%) | 3.00 |
| Non-family | 11 (8.1%) | - |
| Total Households | 136 (100.0%) | 2.71 |
Household Size by Marriage Status in Lazy Y U
Out of a total of 136 households in Lazy Y U, 125 (91.9%) are family households, while 11 (8.1%) are nonfamily households. The most numerous type of family households are 2-person households, comprising 82, and the most common type of nonfamily households are 1-person households, comprising 11.
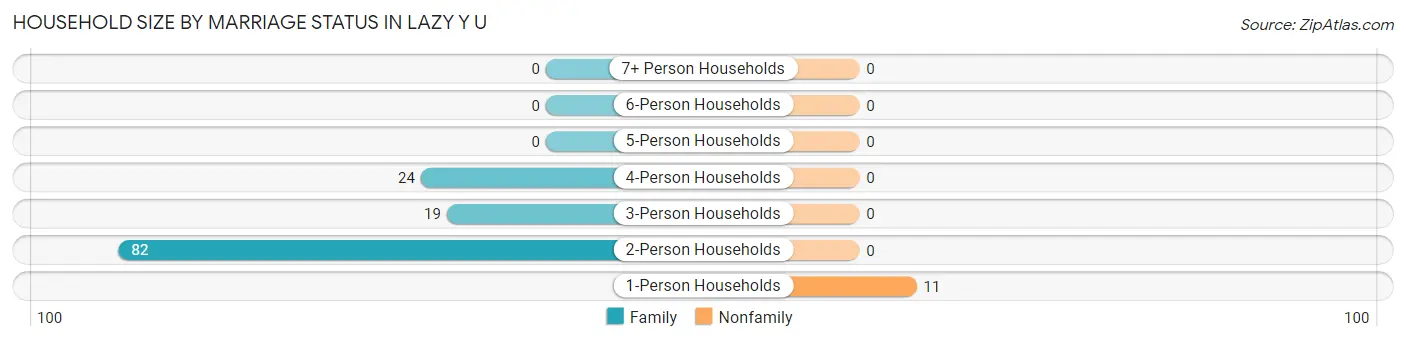
| Household Size | Family Households | Nonfamily Households |
| 1-Person Households | - | 11 (8.1%) |
| 2-Person Households | 82 (60.3%) | 0 (0.0%) |
| 3-Person Households | 19 (14.0%) | 0 (0.0%) |
| 4-Person Households | 24 (17.6%) | 0 (0.0%) |
| 5-Person Households | 0 (0.0%) | 0 (0.0%) |
| 6-Person Households | 0 (0.0%) | 0 (0.0%) |
| 7+ Person Households | 0 (0.0%) | 0 (0.0%) |
| Total | 125 (91.9%) | 11 (8.1%) |
Female Fertility in Lazy Y U
Fertility by Age in Lazy Y U
| Age Bracket | Women with Births | Births / 1,000 Women |
| 15 to 19 years | 0 (0.0%) | 0.0 |
| 20 to 34 years | 0 (0.0%) | 0.0 |
| 35 to 50 years | 0 (0.0%) | 0.0 |
| Total | 0 (0.0%) | 0.0 |
Fertility by Age by Marriage Status in Lazy Y U
| Age Bracket | Married | Unmarried |
| 15 to 19 years | 0 (0.0%) | 0 (0.0%) |
| 20 to 34 years | 0 (0.0%) | 0 (0.0%) |
| 35 to 50 years | 0 (0.0%) | 0 (0.0%) |
| Total | 0 (0.0%) | 0 (0.0%) |
Fertility by Education in Lazy Y U
| Educational Attainment | Women with Births | Births / 1,000 Women |
| Less than High School | 0 (0.0%) | 0.0 |
| High School Diploma | 0 (0.0%) | 0.0 |
| College or Associate's Degree | 0 (0.0%) | 0.0 |
| Bachelor's Degree | 0 (0.0%) | 0.0 |
| Graduate Degree | 0 (0.0%) | 0.0 |
| Total | 0 (0.0%) | 0.0 |
Fertility by Education by Marriage Status in Lazy Y U
| Educational Attainment | Married | Unmarried |
| Less than High School | 0 (0.0%) | 0 (0.0%) |
| High School Diploma | 0 (0.0%) | 0 (0.0%) |
| College or Associate's Degree | 0 (0.0%) | 0 (0.0%) |
| Bachelor's Degree | 0 (0.0%) | 0 (0.0%) |
| Graduate Degree | 0 (0.0%) | 0 (0.0%) |
| Total | 0 (0.0%) | 0 (0.0%) |
Employment Characteristics in Lazy Y U
Employment by Class of Employer in Lazy Y U
Among the 173 employed individuals in Lazy Y U, private company employees (104 | 60.1%), local government employees (39 | 22.5%), and not-for-profit organizations (16 | 9.2%) make up the most common classes of employment.
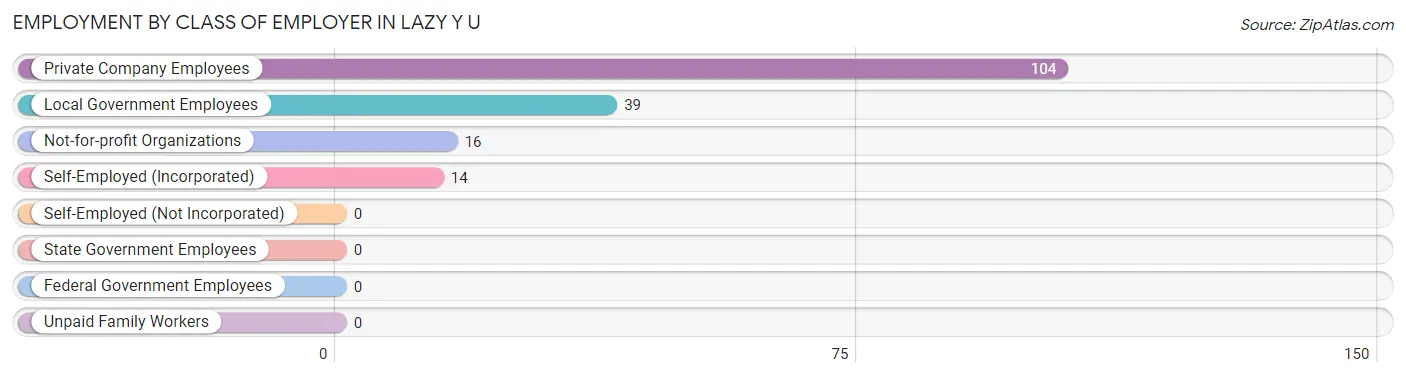
| Employer Class | # Employees | % Employees |
| Private Company Employees | 104 | 60.1% |
| Self-Employed (Incorporated) | 14 | 8.1% |
| Self-Employed (Not Incorporated) | 0 | 0.0% |
| Not-for-profit Organizations | 16 | 9.2% |
| Local Government Employees | 39 | 22.5% |
| State Government Employees | 0 | 0.0% |
| Federal Government Employees | 0 | 0.0% |
| Unpaid Family Workers | 0 | 0.0% |
| Total | 173 | 100.0% |
Employment Status by Age in Lazy Y U
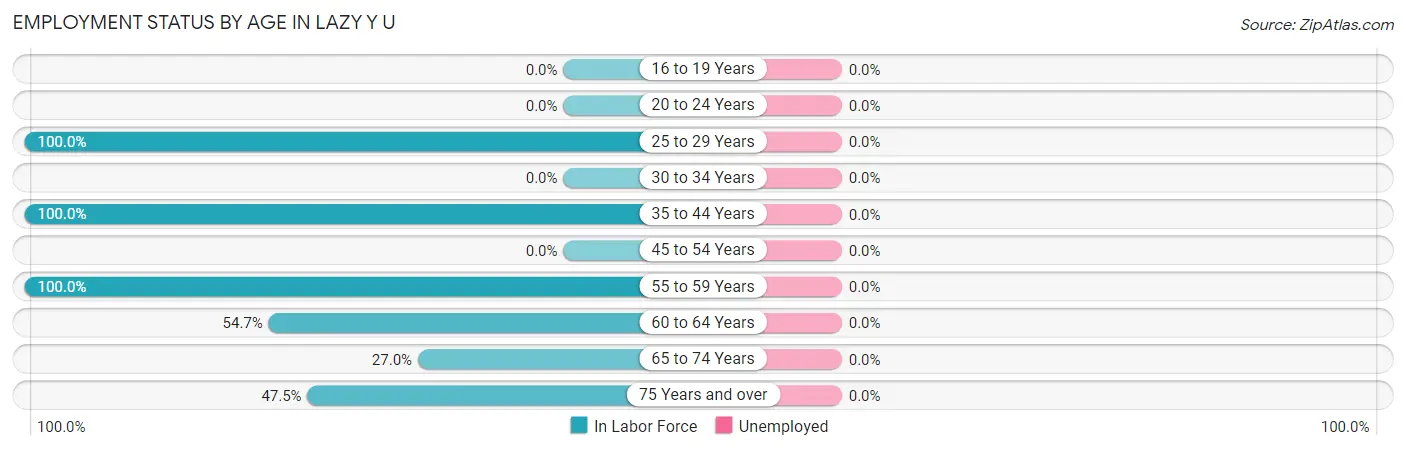
| Age Bracket | In Labor Force | Unemployed |
| 16 to 19 Years | 0 (0.0%) | 0 (0.0%) |
| 20 to 24 Years | 0 (0.0%) | 0 (0.0%) |
| 25 to 29 Years | 28 (100.0%) | 0 (0.0%) |
| 30 to 34 Years | 0 (0.0%) | 0 (0.0%) |
| 35 to 44 Years | 48 (100.0%) | 0 (0.0%) |
| 45 to 54 Years | 0 (0.0%) | 0 (0.0%) |
| 55 to 59 Years | 14 (100.0%) | 0 (0.0%) |
| 60 to 64 Years | 47 (54.7%) | 0 (0.0%) |
| 65 to 74 Years | 17 (27.0%) | 0 (0.0%) |
| 75 Years and over | 19 (47.5%) | 0 (0.0%) |
| Total | 173 (53.9%) | 0 (0.0%) |
Employment Status by Educational Attainment in Lazy Y U
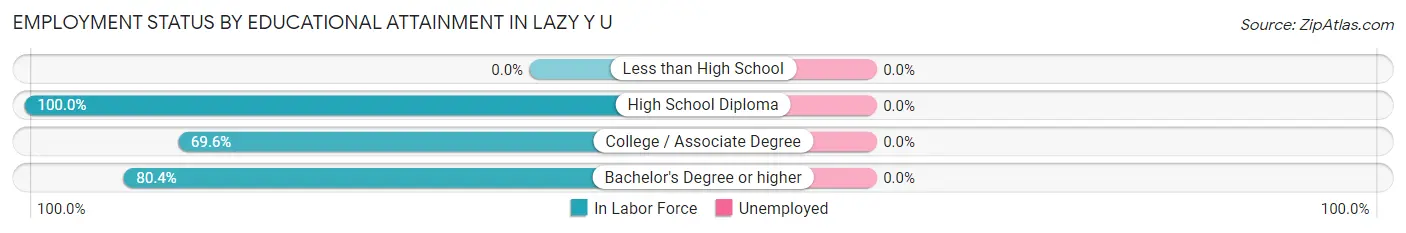
| Educational Attainment | In Labor Force | Unemployed |
| Less than High School | 0 (0.0%) | 0 (0.0%) |
| High School Diploma | 28 (100.0%) | 0 (0.0%) |
| College / Associate Degree | 64 (69.6%) | 0 (0.0%) |
| Bachelor's Degree or higher | 45 (80.4%) | 0 (0.0%) |
| Total | 137 (77.8%) | 0 (0.0%) |
Employment Occupations by Sex in Lazy Y U
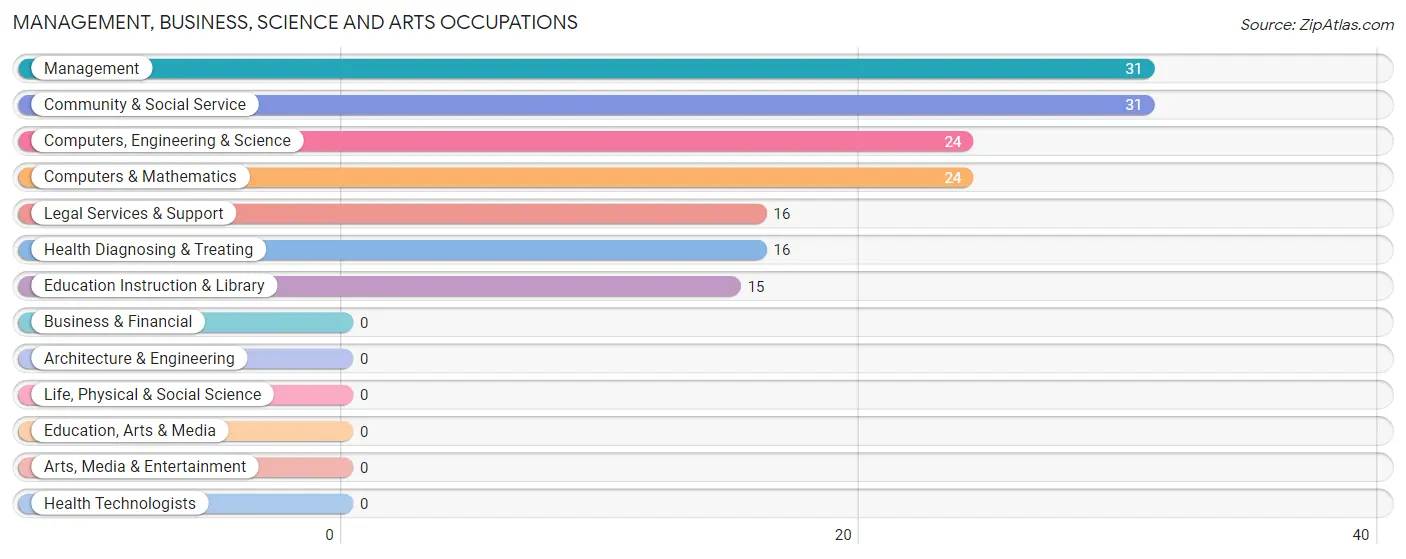
Management, Business, Science and Arts Occupations
The most common Management, Business, Science and Arts occupations in Lazy Y U are Management (31 | 17.9%), Community & Social Service (31 | 17.9%), Computers, Engineering & Science (24 | 13.9%), Computers & Mathematics (24 | 13.9%), and Legal Services & Support (16 | 9.2%).
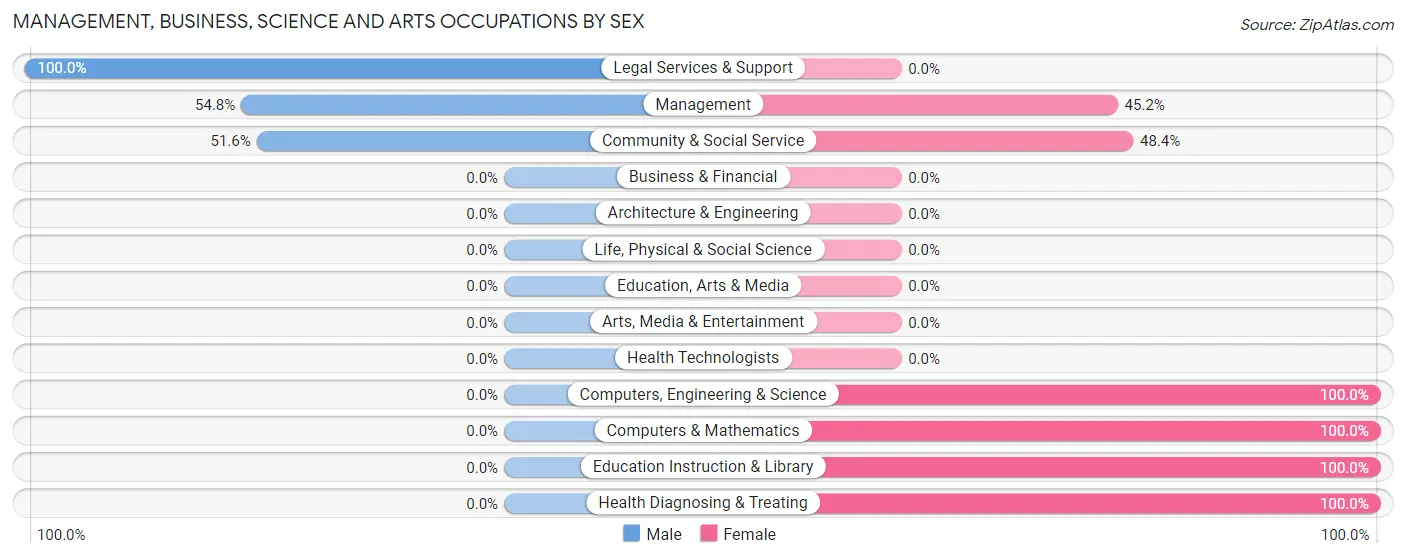
Management, Business, Science and Arts Occupations by Sex
Within the Management, Business, Science and Arts occupations in Lazy Y U, the most male-oriented occupations are Legal Services & Support (100.0%), Management (54.8%), and Community & Social Service (51.6%), while the most female-oriented occupations are Computers, Engineering & Science (100.0%), Computers & Mathematics (100.0%), and Education Instruction & Library (100.0%).
| Occupation | Male | Female |
| Management | 17 (54.8%) | 14 (45.2%) |
| Business & Financial | 0 (0.0%) | 0 (0.0%) |
| Computers, Engineering & Science | 0 (0.0%) | 24 (100.0%) |
| Computers & Mathematics | 0 (0.0%) | 24 (100.0%) |
| Architecture & Engineering | 0 (0.0%) | 0 (0.0%) |
| Life, Physical & Social Science | 0 (0.0%) | 0 (0.0%) |
| Community & Social Service | 16 (51.6%) | 15 (48.4%) |
| Education, Arts & Media | 0 (0.0%) | 0 (0.0%) |
| Legal Services & Support | 16 (100.0%) | 0 (0.0%) |
| Education Instruction & Library | 0 (0.0%) | 15 (100.0%) |
| Arts, Media & Entertainment | 0 (0.0%) | 0 (0.0%) |
| Health Diagnosing & Treating | 0 (0.0%) | 16 (100.0%) |
| Health Technologists | 0 (0.0%) | 0 (0.0%) |
| Total (Category) | 33 (32.4%) | 69 (67.6%) |
| Total (Overall) | 85 (49.1%) | 88 (50.9%) |
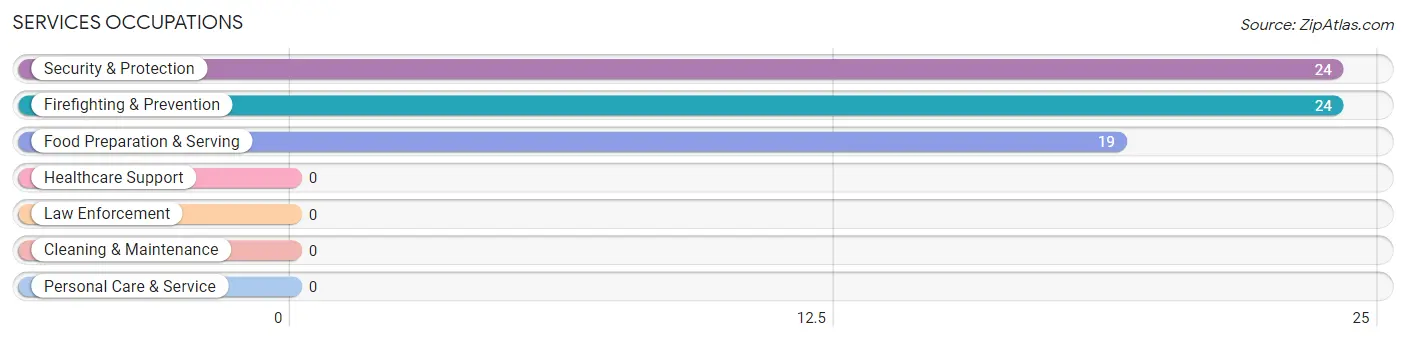
Services Occupations
The most common Services occupations in Lazy Y U are Security & Protection (24 | 13.9%), Firefighting & Prevention (24 | 13.9%), and Food Preparation & Serving (19 | 11.0%).
Services Occupations by Sex
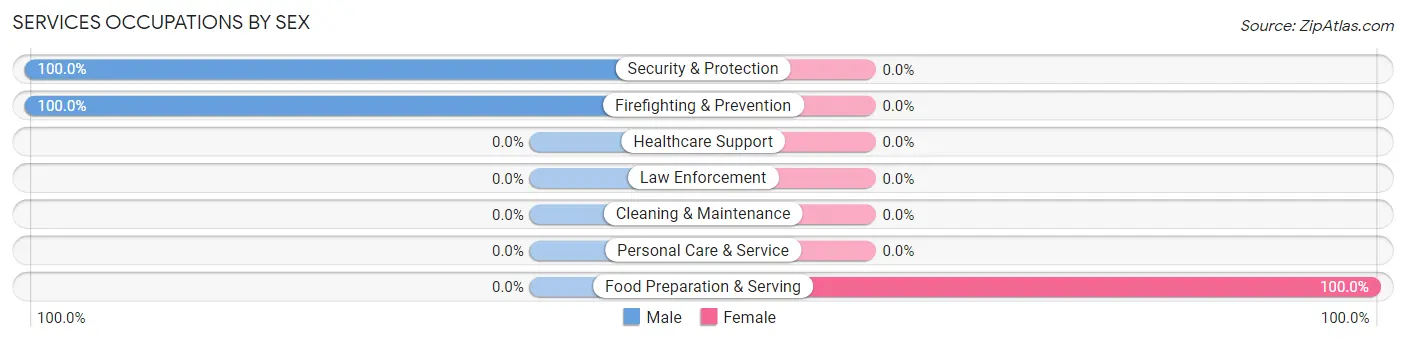
| Occupation | Male | Female |
| Healthcare Support | 0 (0.0%) | 0 (0.0%) |
| Security & Protection | 24 (100.0%) | 0 (0.0%) |
| Firefighting & Prevention | 24 (100.0%) | 0 (0.0%) |
| Law Enforcement | 0 (0.0%) | 0 (0.0%) |
| Food Preparation & Serving | 0 (0.0%) | 19 (100.0%) |
| Cleaning & Maintenance | 0 (0.0%) | 0 (0.0%) |
| Personal Care & Service | 0 (0.0%) | 0 (0.0%) |
| Total (Category) | 24 (55.8%) | 19 (44.2%) |
| Total (Overall) | 85 (49.1%) | 88 (50.9%) |
Sales and Office Occupations
The most common Sales and Office occupations in Lazy Y U are , and Office & Administration (28 | 16.2%).
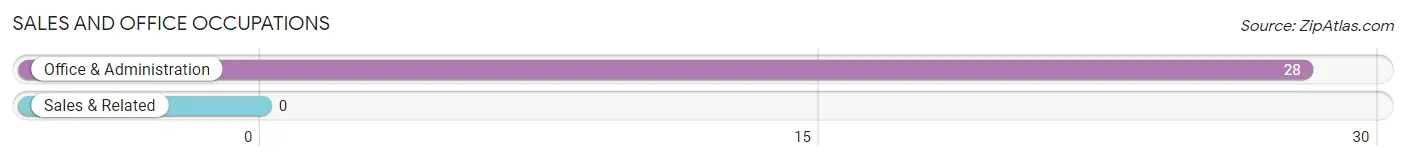
Sales and Office Occupations by Sex

| Occupation | Male | Female |
| Sales & Related | 0 (0.0%) | 0 (0.0%) |
| Office & Administration | 28 (100.0%) | 0 (0.0%) |
| Total (Category) | 28 (100.0%) | 0 (0.0%) |
| Total (Overall) | 85 (49.1%) | 88 (50.9%) |
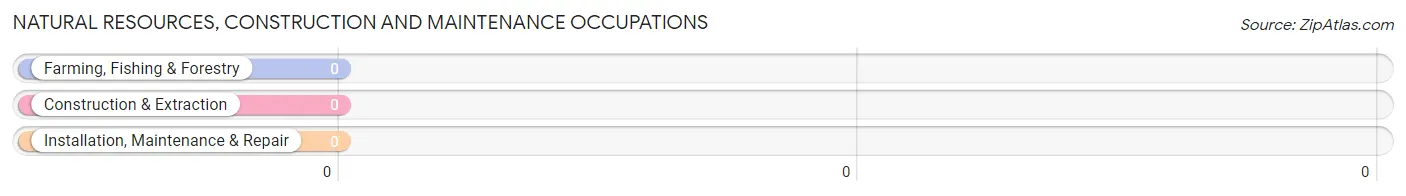
Natural Resources, Construction and Maintenance Occupations
Natural Resources, Construction and Maintenance Occupations by Sex
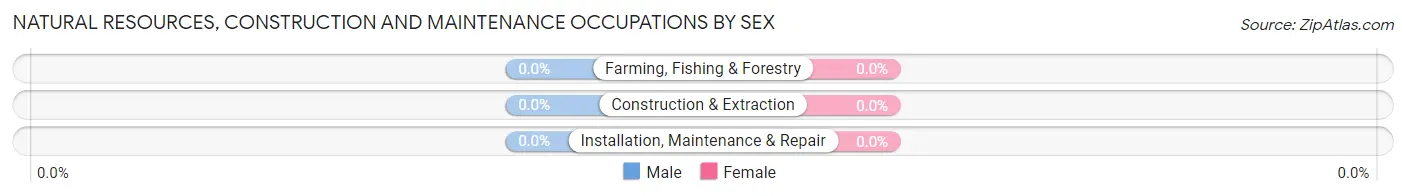
| Occupation | Male | Female |
| Farming, Fishing & Forestry | 0 (0.0%) | 0 (0.0%) |
| Construction & Extraction | 0 (0.0%) | 0 (0.0%) |
| Installation, Maintenance & Repair | 0 (0.0%) | 0 (0.0%) |
| Total (Category) | 0 (0.0%) | 0 (0.0%) |
| Total (Overall) | 85 (49.1%) | 88 (50.9%) |
Production, Transportation and Moving Occupations
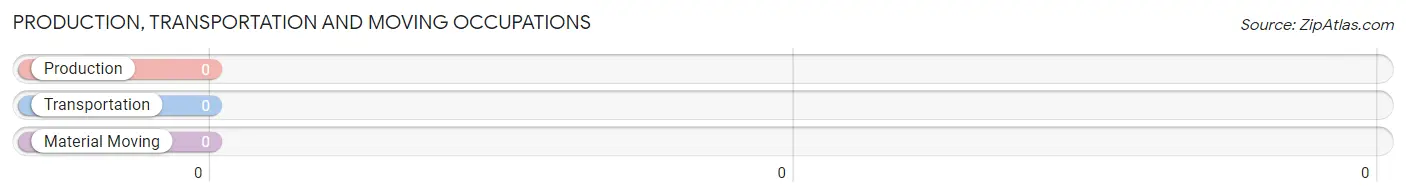
Production, Transportation and Moving Occupations by Sex
| Occupation | Male | Female |
| Production | 0 (0.0%) | 0 (0.0%) |
| Transportation | 0 (0.0%) | 0 (0.0%) |
| Material Moving | 0 (0.0%) | 0 (0.0%) |
| Total (Category) | 0 (0.0%) | 0 (0.0%) |
| Total (Overall) | 85 (49.1%) | 88 (50.9%) |
Employment Industries by Sex in Lazy Y U
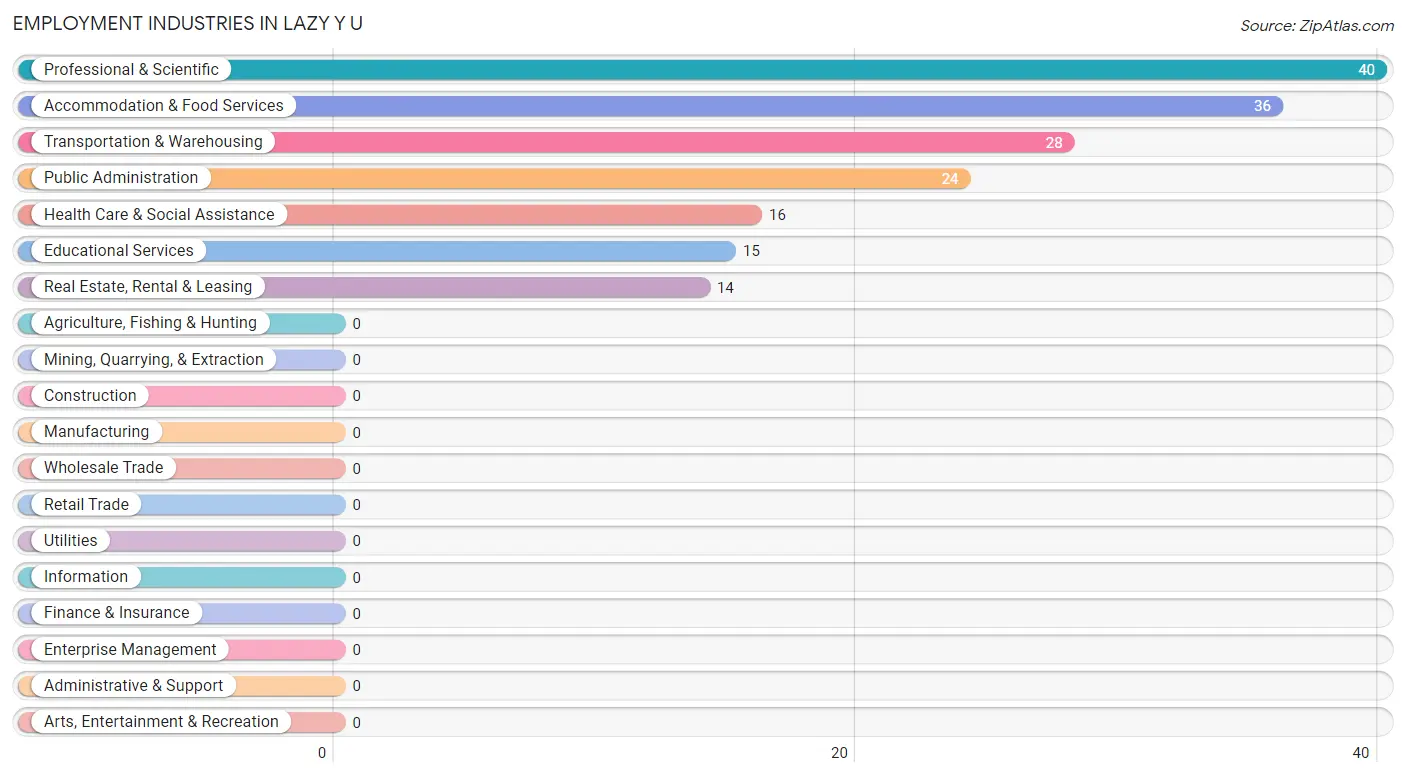
Employment Industries in Lazy Y U
The major employment industries in Lazy Y U include Professional & Scientific (40 | 23.1%), Accommodation & Food Services (36 | 20.8%), Transportation & Warehousing (28 | 16.2%), Public Administration (24 | 13.9%), and Health Care & Social Assistance (16 | 9.2%).
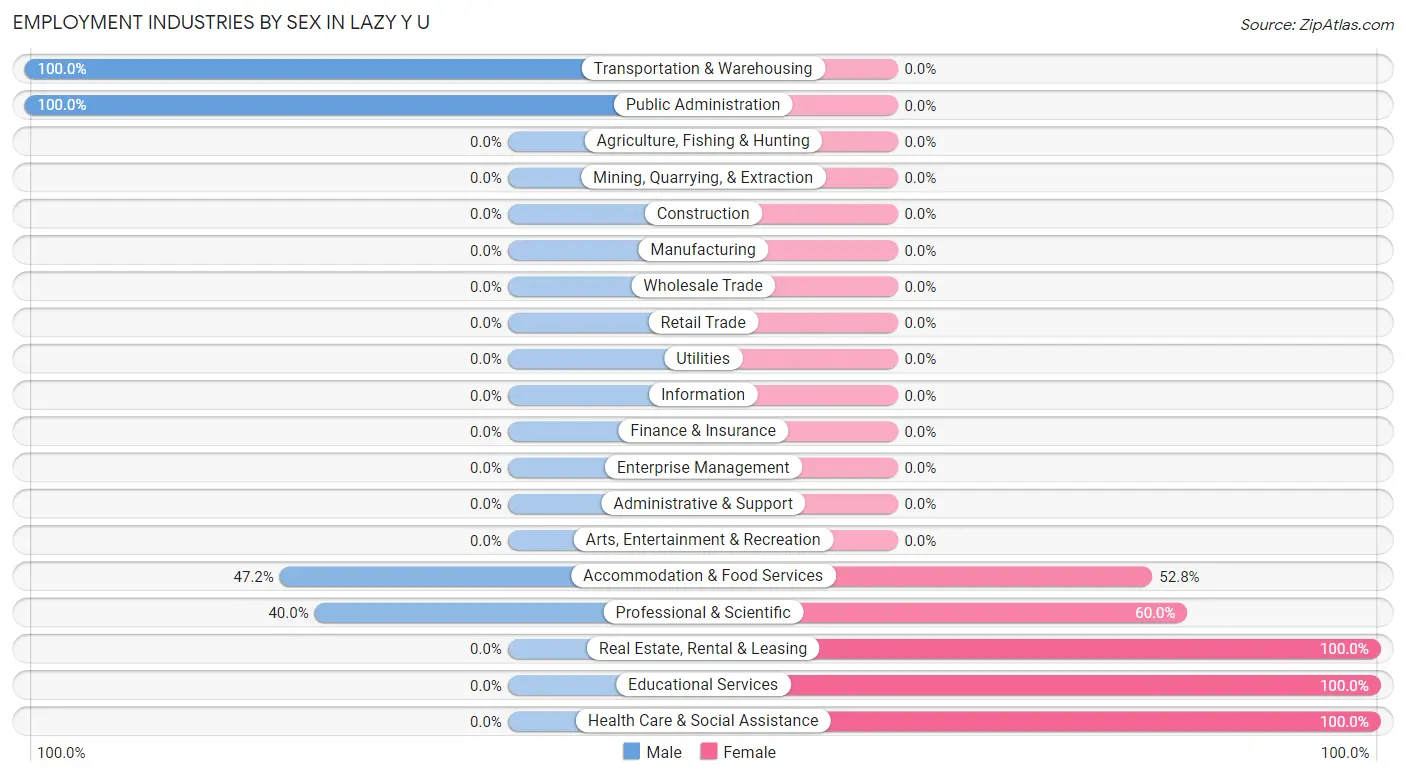
Employment Industries by Sex in Lazy Y U
The Lazy Y U industries that see more men than women are Transportation & Warehousing (100.0%), Public Administration (100.0%), and Accommodation & Food Services (47.2%), whereas the industries that tend to have a higher number of women are Real Estate, Rental & Leasing (100.0%), Educational Services (100.0%), and Health Care & Social Assistance (100.0%).
| Industry | Male | Female |
| Agriculture, Fishing & Hunting | 0 (0.0%) | 0 (0.0%) |
| Mining, Quarrying, & Extraction | 0 (0.0%) | 0 (0.0%) |
| Construction | 0 (0.0%) | 0 (0.0%) |
| Manufacturing | 0 (0.0%) | 0 (0.0%) |
| Wholesale Trade | 0 (0.0%) | 0 (0.0%) |
| Retail Trade | 0 (0.0%) | 0 (0.0%) |
| Transportation & Warehousing | 28 (100.0%) | 0 (0.0%) |
| Utilities | 0 (0.0%) | 0 (0.0%) |
| Information | 0 (0.0%) | 0 (0.0%) |
| Finance & Insurance | 0 (0.0%) | 0 (0.0%) |
| Real Estate, Rental & Leasing | 0 (0.0%) | 14 (100.0%) |
| Professional & Scientific | 16 (40.0%) | 24 (60.0%) |
| Enterprise Management | 0 (0.0%) | 0 (0.0%) |
| Administrative & Support | 0 (0.0%) | 0 (0.0%) |
| Educational Services | 0 (0.0%) | 15 (100.0%) |
| Health Care & Social Assistance | 0 (0.0%) | 16 (100.0%) |
| Arts, Entertainment & Recreation | 0 (0.0%) | 0 (0.0%) |
| Accommodation & Food Services | 17 (47.2%) | 19 (52.8%) |
| Public Administration | 24 (100.0%) | 0 (0.0%) |
| Total | 85 (49.1%) | 88 (50.9%) |
Education in Lazy Y U
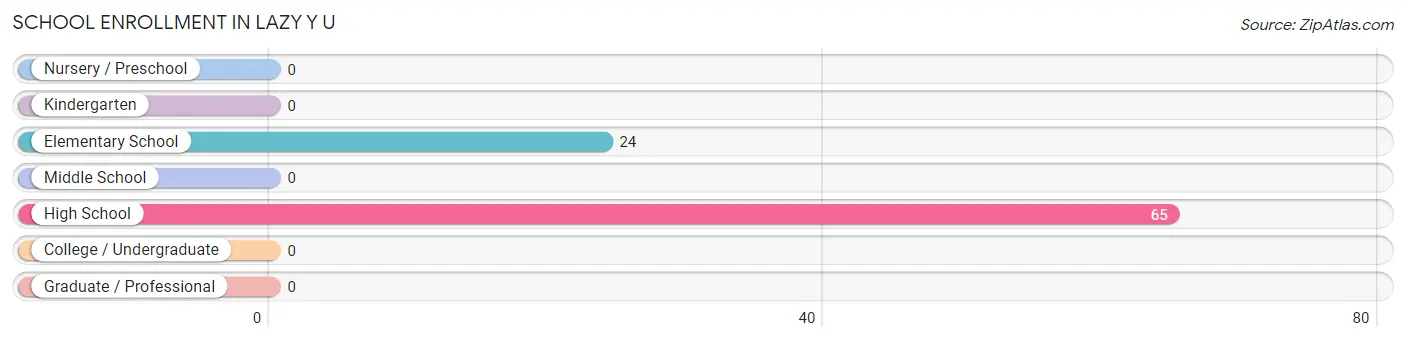
School Enrollment in Lazy Y U
The most common levels of schooling among the 89 students in Lazy Y U are high school (65 | 73.0%), and elementary school (24 | 27.0%).
| School Level | # Students | % Students |
| Nursery / Preschool | 0 | 0.0% |
| Kindergarten | 0 | 0.0% |
| Elementary School | 24 | 27.0% |
| Middle School | 0 | 0.0% |
| High School | 65 | 73.0% |
| College / Undergraduate | 0 | 0.0% |
| Graduate / Professional | 0 | 0.0% |
| Total | 89 | 100.0% |
School Enrollment by Age by Funding Source in Lazy Y U
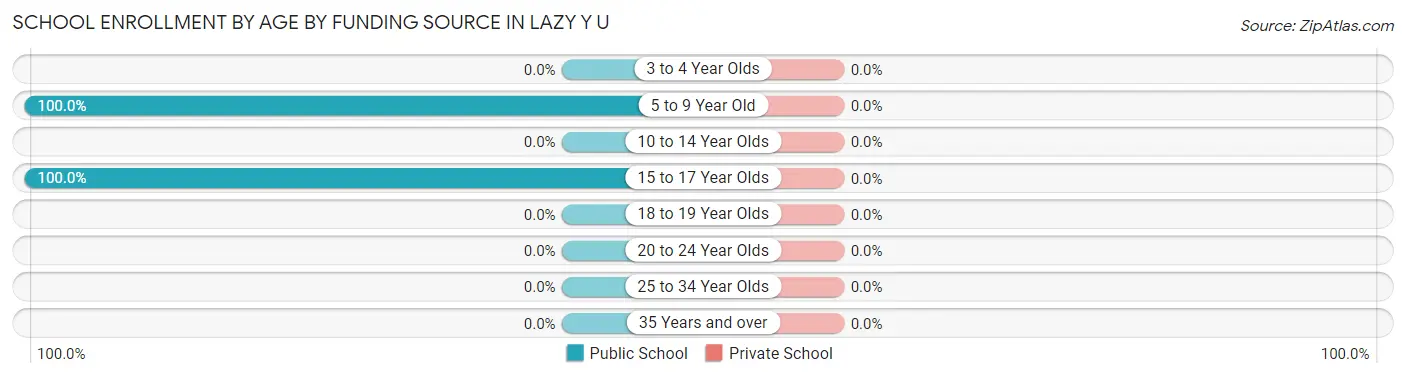
| Age Bracket | Public School | Private School |
| 3 to 4 Year Olds | 0 (0.0%) | 0 (0.0%) |
| 5 to 9 Year Old | 24 (100.0%) | 0 (0.0%) |
| 10 to 14 Year Olds | 0 (0.0%) | 0 (0.0%) |
| 15 to 17 Year Olds | 65 (100.0%) | 0 (0.0%) |
| 18 to 19 Year Olds | 0 (0.0%) | 0 (0.0%) |
| 20 to 24 Year Olds | 0 (0.0%) | 0 (0.0%) |
| 25 to 34 Year Olds | 0 (0.0%) | 0 (0.0%) |
| 35 Years and over | 0 (0.0%) | 0 (0.0%) |
| Total | 89 (100.0%) | 0 (0.0%) |
Educational Attainment by Field of Study in Lazy Y U
Bio, nature & agricultural (31 | 40.8%), arts & humanities (14 | 18.4%), science & technology (11 | 14.5%), liberal arts & history (10 | 13.2%), and visual & performing arts (10 | 13.2%) are the most common fields of study among 76 individuals in Lazy Y U who have obtained a bachelor's degree or higher.
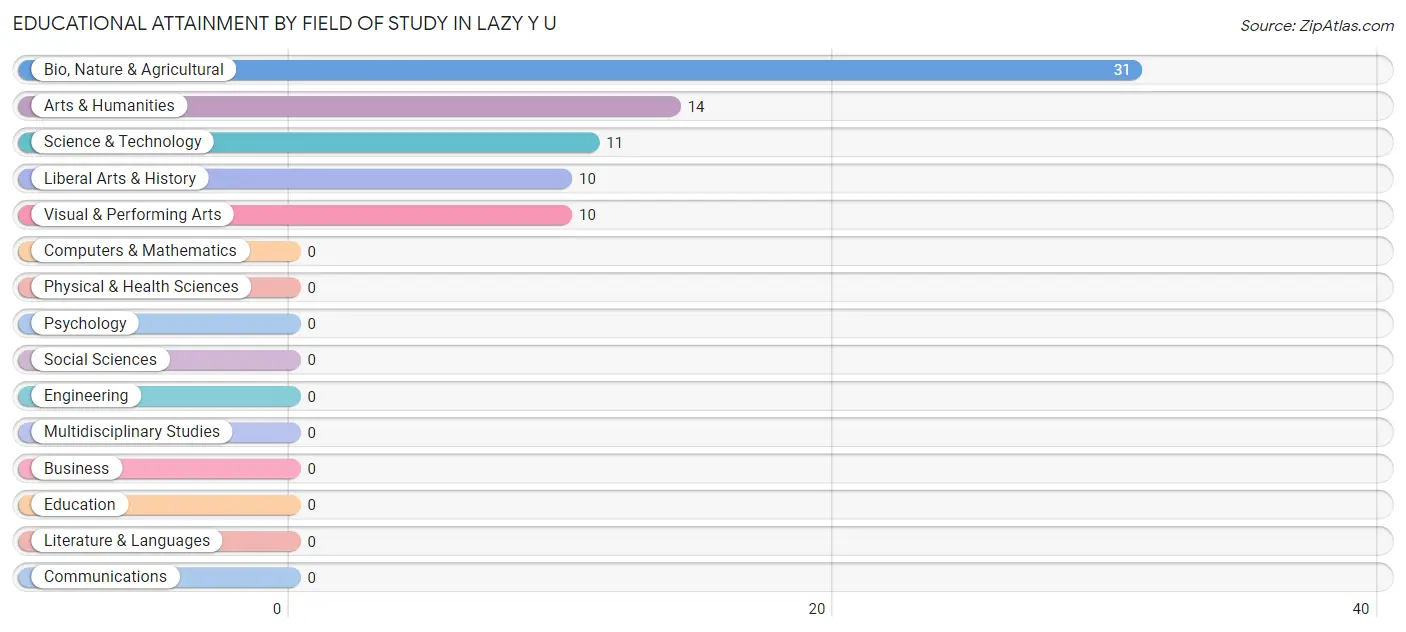
| Field of Study | # Graduates | % Graduates |
| Computers & Mathematics | 0 | 0.0% |
| Bio, Nature & Agricultural | 31 | 40.8% |
| Physical & Health Sciences | 0 | 0.0% |
| Psychology | 0 | 0.0% |
| Social Sciences | 0 | 0.0% |
| Engineering | 0 | 0.0% |
| Multidisciplinary Studies | 0 | 0.0% |
| Science & Technology | 11 | 14.5% |
| Business | 0 | 0.0% |
| Education | 0 | 0.0% |
| Literature & Languages | 0 | 0.0% |
| Liberal Arts & History | 10 | 13.2% |
| Visual & Performing Arts | 10 | 13.2% |
| Communications | 0 | 0.0% |
| Arts & Humanities | 14 | 18.4% |
| Total | 76 | 100.0% |
Transportation & Commute in Lazy Y U
Vehicle Availability by Sex in Lazy Y U
The most prevalent vehicle ownership categories in Lazy Y U are males with 3 vehicles (40, accounting for 47.1%) and females with 3 vehicles (39, making up 45.5%).
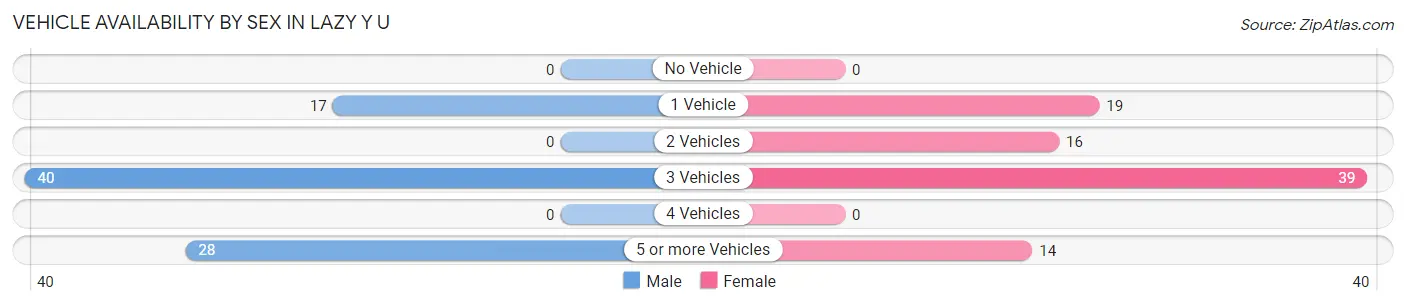
| Vehicles Available | Male | Female |
| No Vehicle | 0 (0.0%) | 0 (0.0%) |
| 1 Vehicle | 17 (20.0%) | 19 (21.6%) |
| 2 Vehicles | 0 (0.0%) | 16 (18.2%) |
| 3 Vehicles | 40 (47.1%) | 39 (44.3%) |
| 4 Vehicles | 0 (0.0%) | 0 (0.0%) |
| 5 or more Vehicles | 28 (32.9%) | 14 (15.9%) |
| Total | 85 (100.0%) | 88 (100.0%) |
Commute Time in Lazy Y U
The most frequently occuring commute durations in Lazy Y U are 45 to 59 minutes (52 commuters, 38.5%), 60 to 89 minutes (19 commuters, 14.1%), and 20 to 24 minutes (17 commuters, 12.6%).
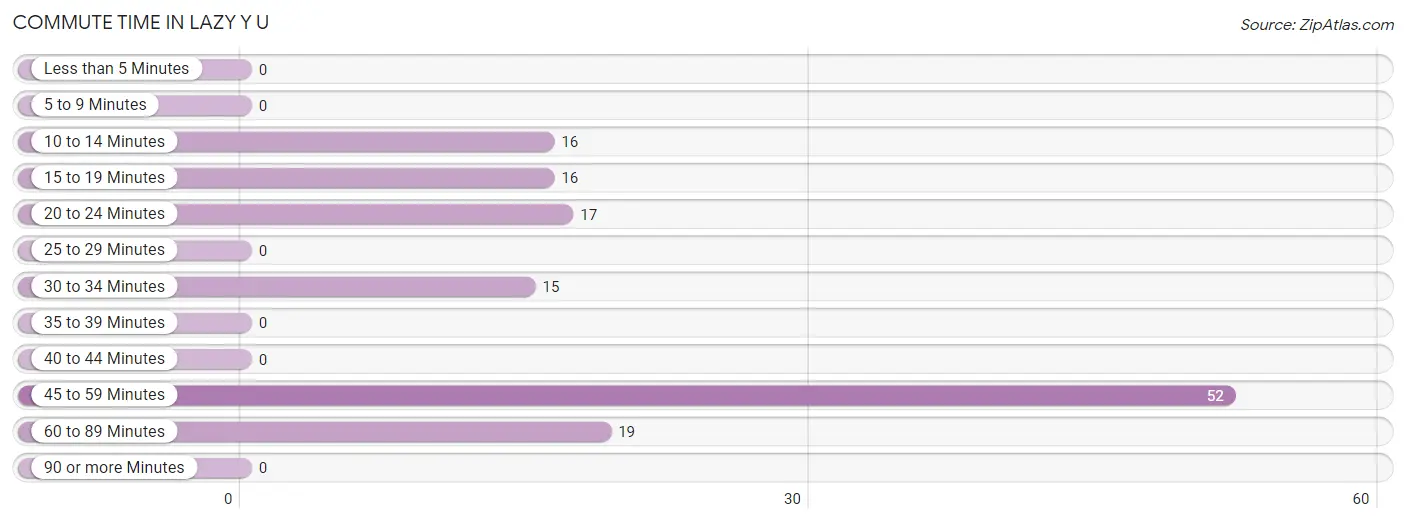
| Commute Time | # Commuters | % Commuters |
| Less than 5 Minutes | 0 | 0.0% |
| 5 to 9 Minutes | 0 | 0.0% |
| 10 to 14 Minutes | 16 | 11.8% |
| 15 to 19 Minutes | 16 | 11.8% |
| 20 to 24 Minutes | 17 | 12.6% |
| 25 to 29 Minutes | 0 | 0.0% |
| 30 to 34 Minutes | 15 | 11.1% |
| 35 to 39 Minutes | 0 | 0.0% |
| 40 to 44 Minutes | 0 | 0.0% |
| 45 to 59 Minutes | 52 | 38.5% |
| 60 to 89 Minutes | 19 | 14.1% |
| 90 or more Minutes | 0 | 0.0% |
Commute Time by Sex in Lazy Y U
The most common commute times in Lazy Y U are 45 to 59 minutes (52 commuters, 61.2%) for males and 60 to 89 minutes (19 commuters, 38.0%) for females.
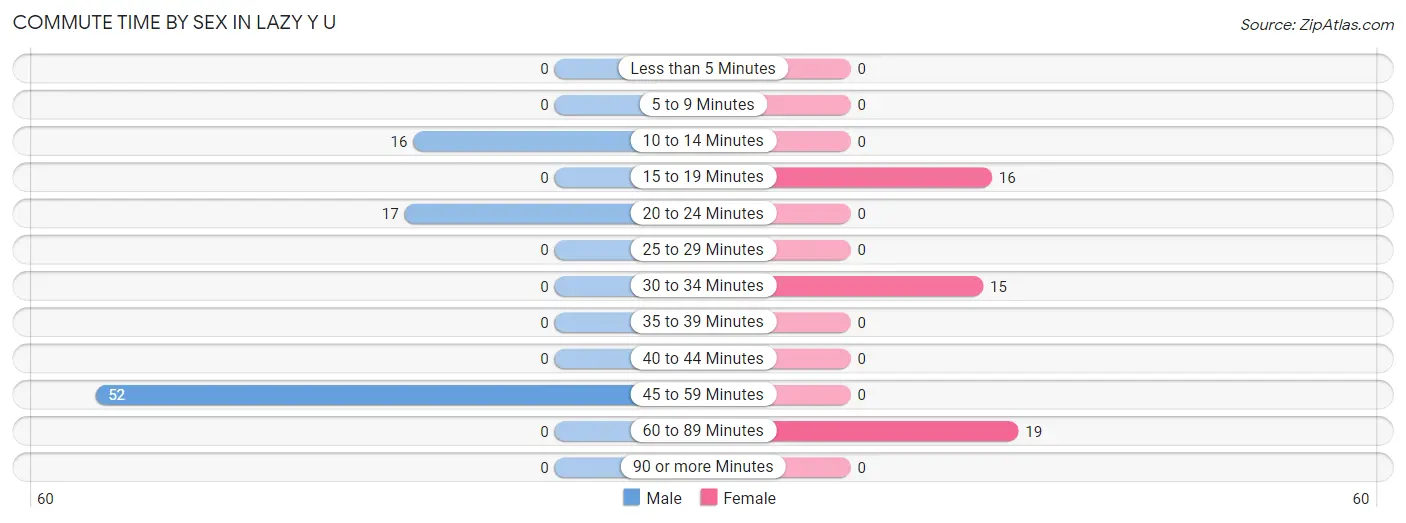
| Commute Time | Male | Female |
| Less than 5 Minutes | 0 (0.0%) | 0 (0.0%) |
| 5 to 9 Minutes | 0 (0.0%) | 0 (0.0%) |
| 10 to 14 Minutes | 16 (18.8%) | 0 (0.0%) |
| 15 to 19 Minutes | 0 (0.0%) | 16 (32.0%) |
| 20 to 24 Minutes | 17 (20.0%) | 0 (0.0%) |
| 25 to 29 Minutes | 0 (0.0%) | 0 (0.0%) |
| 30 to 34 Minutes | 0 (0.0%) | 15 (30.0%) |
| 35 to 39 Minutes | 0 (0.0%) | 0 (0.0%) |
| 40 to 44 Minutes | 0 (0.0%) | 0 (0.0%) |
| 45 to 59 Minutes | 52 (61.2%) | 0 (0.0%) |
| 60 to 89 Minutes | 0 (0.0%) | 19 (38.0%) |
| 90 or more Minutes | 0 (0.0%) | 0 (0.0%) |
Time of Departure to Work by Sex in Lazy Y U
The most frequent times of departure to work in Lazy Y U are 4:00 PM to 11:59 PM (28, 32.9%) for males and 4:00 PM to 11:59 PM (35, 70.0%) for females.
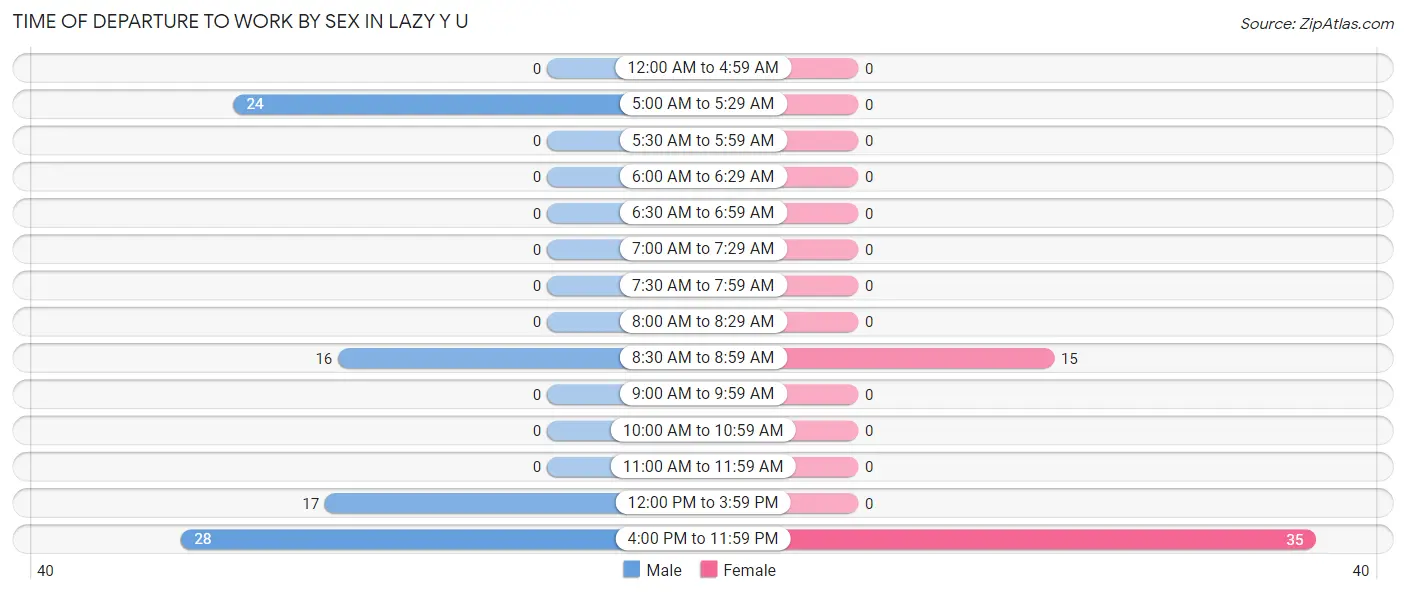
| Time of Departure | Male | Female |
| 12:00 AM to 4:59 AM | 0 (0.0%) | 0 (0.0%) |
| 5:00 AM to 5:29 AM | 24 (28.2%) | 0 (0.0%) |
| 5:30 AM to 5:59 AM | 0 (0.0%) | 0 (0.0%) |
| 6:00 AM to 6:29 AM | 0 (0.0%) | 0 (0.0%) |
| 6:30 AM to 6:59 AM | 0 (0.0%) | 0 (0.0%) |
| 7:00 AM to 7:29 AM | 0 (0.0%) | 0 (0.0%) |
| 7:30 AM to 7:59 AM | 0 (0.0%) | 0 (0.0%) |
| 8:00 AM to 8:29 AM | 0 (0.0%) | 0 (0.0%) |
| 8:30 AM to 8:59 AM | 16 (18.8%) | 15 (30.0%) |
| 9:00 AM to 9:59 AM | 0 (0.0%) | 0 (0.0%) |
| 10:00 AM to 10:59 AM | 0 (0.0%) | 0 (0.0%) |
| 11:00 AM to 11:59 AM | 0 (0.0%) | 0 (0.0%) |
| 12:00 PM to 3:59 PM | 17 (20.0%) | 0 (0.0%) |
| 4:00 PM to 11:59 PM | 28 (32.9%) | 35 (70.0%) |
| Total | 85 (100.0%) | 50 (100.0%) |
Housing Occupancy in Lazy Y U
Occupancy by Ownership in Lazy Y U
Of the total 136 dwellings in Lazy Y U, owner-occupied units account for 136 (100.0%), while renter-occupied units make up 0 (0.0%).
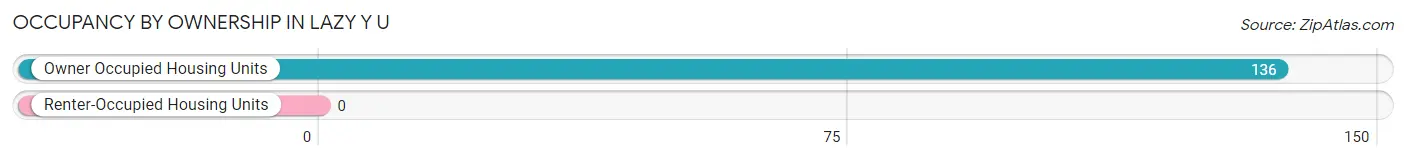
| Occupancy | # Housing Units | % Housing Units |
| Owner Occupied Housing Units | 136 | 100.0% |
| Renter-Occupied Housing Units | 0 | 0.0% |
| Total Occupied Housing Units | 136 | 100.0% |
Occupancy by Household Size in Lazy Y U
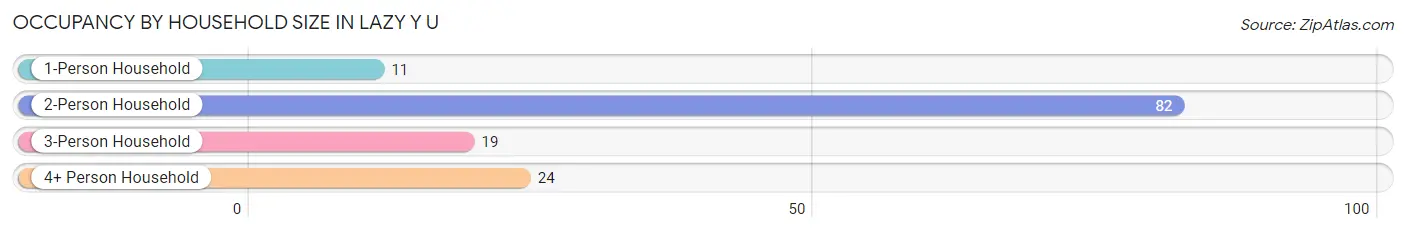
| Household Size | # Housing Units | % Housing Units |
| 1-Person Household | 11 | 8.1% |
| 2-Person Household | 82 | 60.3% |
| 3-Person Household | 19 | 14.0% |
| 4+ Person Household | 24 | 17.6% |
| Total Housing Units | 136 | 100.0% |
Occupancy by Ownership by Household Size in Lazy Y U
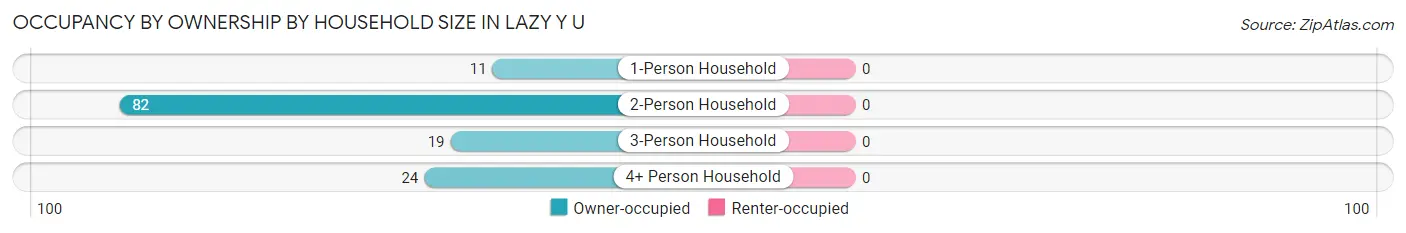
| Household Size | Owner-occupied | Renter-occupied |
| 1-Person Household | 11 (100.0%) | 0 (0.0%) |
| 2-Person Household | 82 (100.0%) | 0 (0.0%) |
| 3-Person Household | 19 (100.0%) | 0 (0.0%) |
| 4+ Person Household | 24 (100.0%) | 0 (0.0%) |
| Total Housing Units | 136 (100.0%) | 0 (0.0%) |
Occupancy by Educational Attainment in Lazy Y U
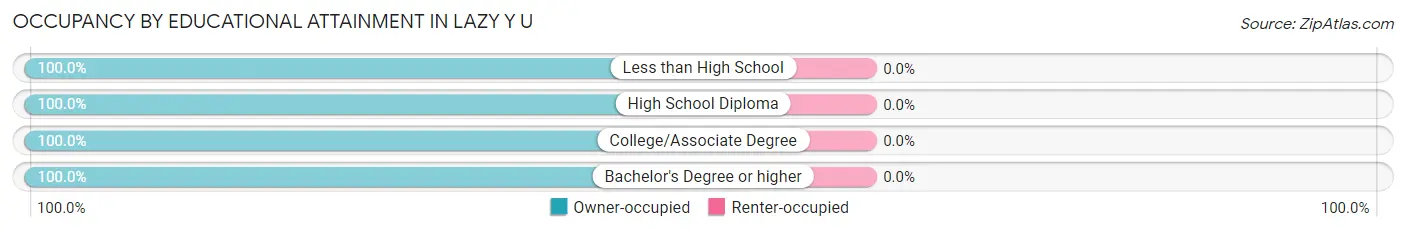
| Household Size | Owner-occupied | Renter-occupied |
| Less than High School | 19 (100.0%) | 0 (0.0%) |
| High School Diploma | 17 (100.0%) | 0 (0.0%) |
| College/Associate Degree | 40 (100.0%) | 0 (0.0%) |
| Bachelor's Degree or higher | 60 (100.0%) | 0 (0.0%) |
Occupancy by Age of Householder in Lazy Y U

| Age Bracket | # Households | % Households |
| Under 35 Years | 0 | 0.0% |
| 35 to 44 Years | 24 | 17.6% |
| 45 to 54 Years | 0 | 0.0% |
| 55 to 64 Years | 56 | 41.2% |
| 65 to 74 Years | 37 | 27.2% |
| 75 to 84 Years | 0 | 0.0% |
| 85 Years and Over | 19 | 14.0% |
| Total | 136 | 100.0% |
Housing Finances in Lazy Y U
Median Income by Occupancy in Lazy Y U
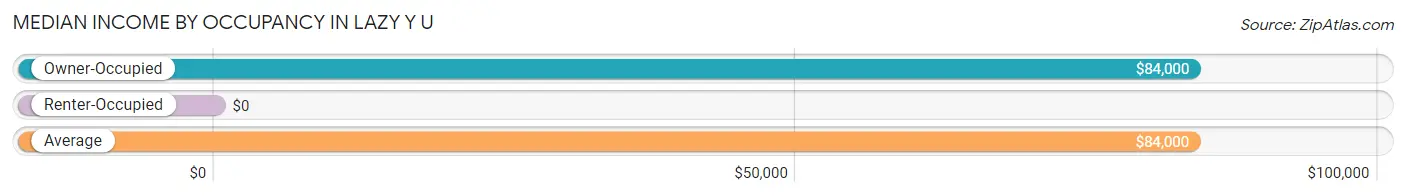
| Occupancy Type | # Households | Median Income |
| Owner-Occupied | 136 (100.0%) | $84,000 |
| Renter-Occupied | 0 (0.0%) | $0 |
| Average | 136 (100.0%) | $84,000 |
Occupancy by Householder Income Bracket in Lazy Y U
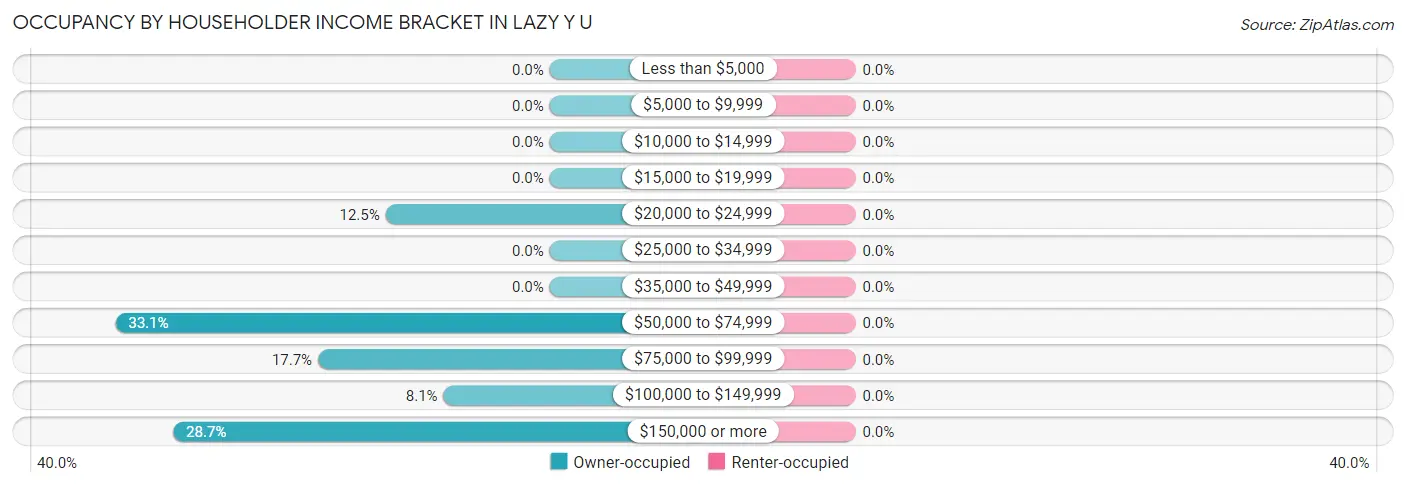
| Income Bracket | Owner-occupied | Renter-occupied |
| Less than $5,000 | 0 (0.0%) | 0 (0.0%) |
| $5,000 to $9,999 | 0 (0.0%) | 0 (0.0%) |
| $10,000 to $14,999 | 0 (0.0%) | 0 (0.0%) |
| $15,000 to $19,999 | 0 (0.0%) | 0 (0.0%) |
| $20,000 to $24,999 | 17 (12.5%) | 0 (0.0%) |
| $25,000 to $34,999 | 0 (0.0%) | 0 (0.0%) |
| $35,000 to $49,999 | 0 (0.0%) | 0 (0.0%) |
| $50,000 to $74,999 | 45 (33.1%) | 0 (0.0%) |
| $75,000 to $99,999 | 24 (17.6%) | 0 (0.0%) |
| $100,000 to $149,999 | 11 (8.1%) | 0 (0.0%) |
| $150,000 or more | 39 (28.7%) | 0 (0.0%) |
| Total | 136 (100.0%) | 0 (0.0%) |
Monthly Housing Cost Tiers in Lazy Y U
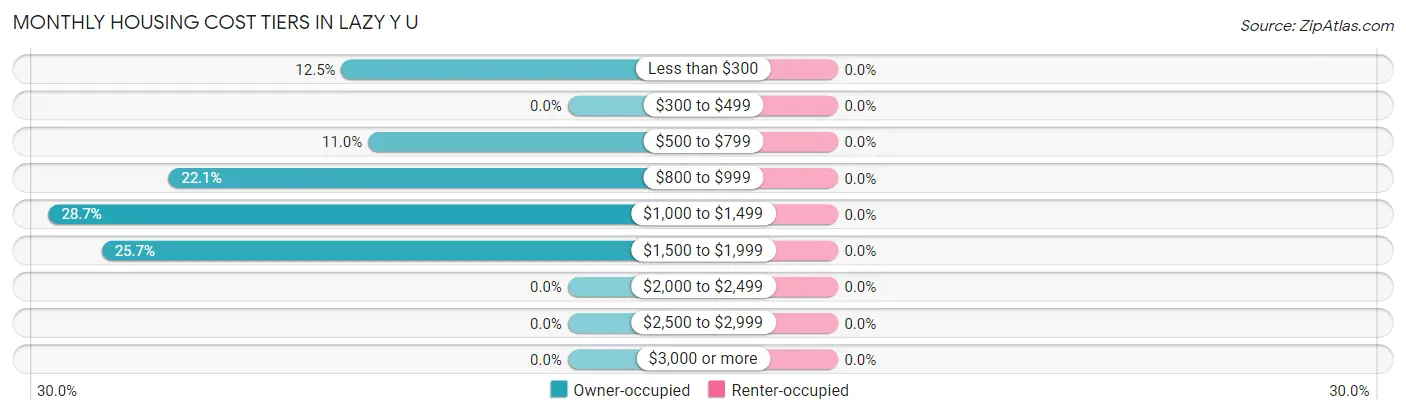
| Monthly Cost | Owner-occupied | Renter-occupied |
| Less than $300 | 17 (12.5%) | 0 (0.0%) |
| $300 to $499 | 0 (0.0%) | 0 (0.0%) |
| $500 to $799 | 15 (11.0%) | 0 (0.0%) |
| $800 to $999 | 30 (22.1%) | 0 (0.0%) |
| $1,000 to $1,499 | 39 (28.7%) | 0 (0.0%) |
| $1,500 to $1,999 | 35 (25.7%) | 0 (0.0%) |
| $2,000 to $2,499 | 0 (0.0%) | 0 (0.0%) |
| $2,500 to $2,999 | 0 (0.0%) | 0 (0.0%) |
| $3,000 or more | 0 (0.0%) | 0 (0.0%) |
| Total | 136 (100.0%) | 0 (0.0%) |
Physical Housing Characteristics in Lazy Y U
Housing Structures in Lazy Y U
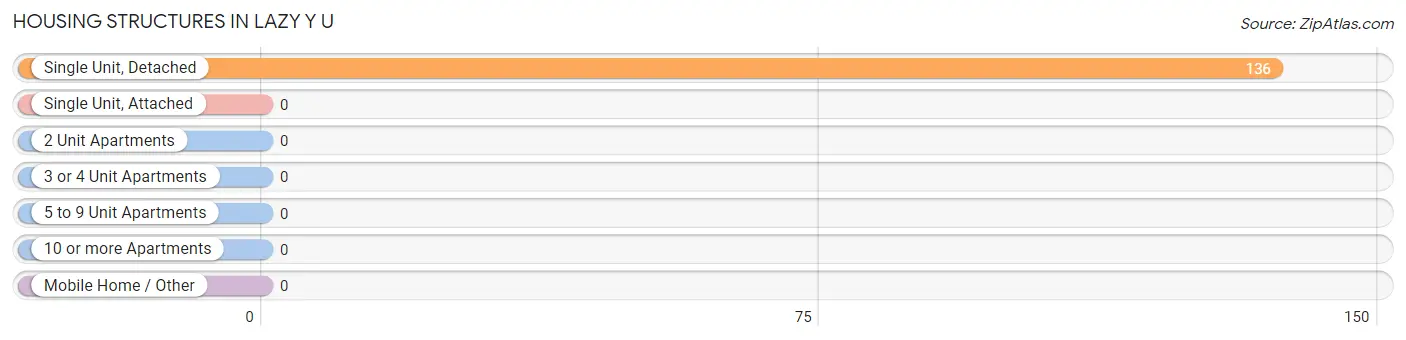
| Structure Type | # Housing Units | % Housing Units |
| Single Unit, Detached | 136 | 100.0% |
| Single Unit, Attached | 0 | 0.0% |
| 2 Unit Apartments | 0 | 0.0% |
| 3 or 4 Unit Apartments | 0 | 0.0% |
| 5 to 9 Unit Apartments | 0 | 0.0% |
| 10 or more Apartments | 0 | 0.0% |
| Mobile Home / Other | 0 | 0.0% |
| Total | 136 | 100.0% |
Housing Structures by Occupancy in Lazy Y U
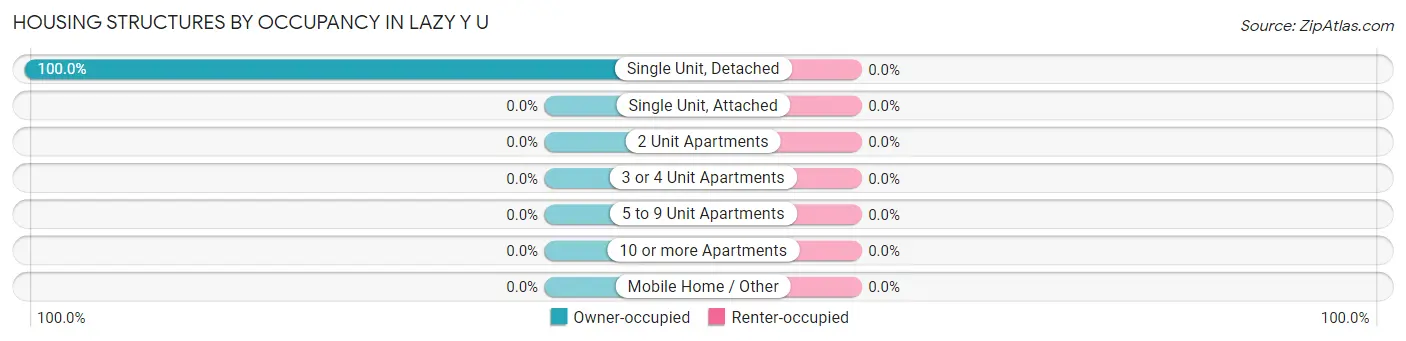
| Structure Type | Owner-occupied | Renter-occupied |
| Single Unit, Detached | 136 (100.0%) | 0 (0.0%) |
| Single Unit, Attached | 0 (0.0%) | 0 (0.0%) |
| 2 Unit Apartments | 0 (0.0%) | 0 (0.0%) |
| 3 or 4 Unit Apartments | 0 (0.0%) | 0 (0.0%) |
| 5 to 9 Unit Apartments | 0 (0.0%) | 0 (0.0%) |
| 10 or more Apartments | 0 (0.0%) | 0 (0.0%) |
| Mobile Home / Other | 0 (0.0%) | 0 (0.0%) |
| Total | 136 (100.0%) | 0 (0.0%) |
Housing Structures by Number of Rooms in Lazy Y U
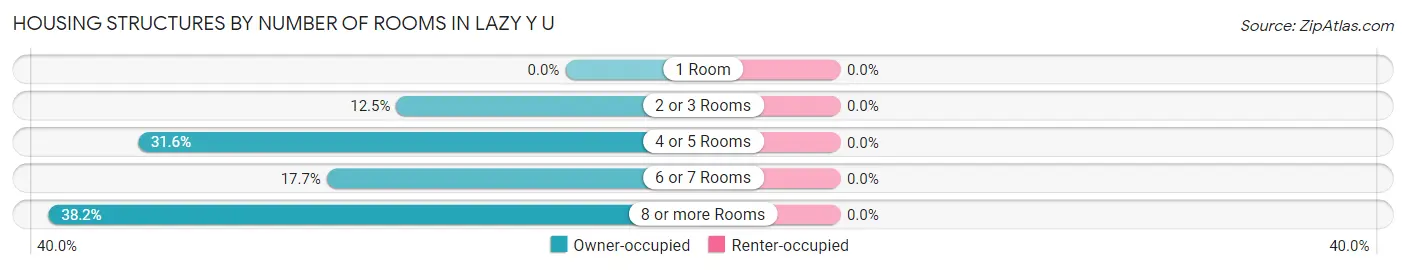
| Number of Rooms | Owner-occupied | Renter-occupied |
| 1 Room | 0 (0.0%) | 0 (0.0%) |
| 2 or 3 Rooms | 17 (12.5%) | 0 (0.0%) |
| 4 or 5 Rooms | 43 (31.6%) | 0 (0.0%) |
| 6 or 7 Rooms | 24 (17.6%) | 0 (0.0%) |
| 8 or more Rooms | 52 (38.2%) | 0 (0.0%) |
| Total | 136 (100.0%) | 0 (0.0%) |
Housing Structure by Heating Type in Lazy Y U
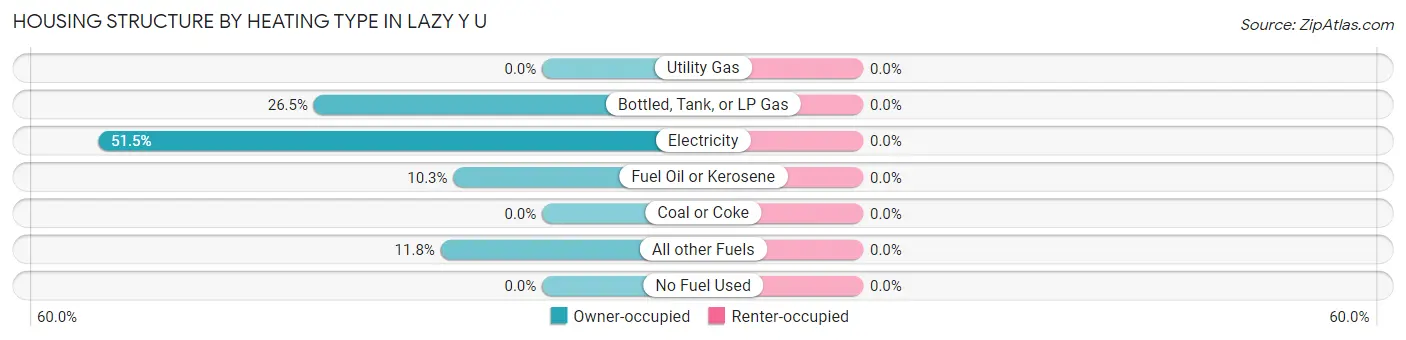
| Heating Type | Owner-occupied | Renter-occupied |
| Utility Gas | 0 (0.0%) | 0 (0.0%) |
| Bottled, Tank, or LP Gas | 36 (26.5%) | 0 (0.0%) |
| Electricity | 70 (51.5%) | 0 (0.0%) |
| Fuel Oil or Kerosene | 14 (10.3%) | 0 (0.0%) |
| Coal or Coke | 0 (0.0%) | 0 (0.0%) |
| All other Fuels | 16 (11.8%) | 0 (0.0%) |
| No Fuel Used | 0 (0.0%) | 0 (0.0%) |
| Total | 136 (100.0%) | 0 (0.0%) |
Household Vehicle Usage in Lazy Y U
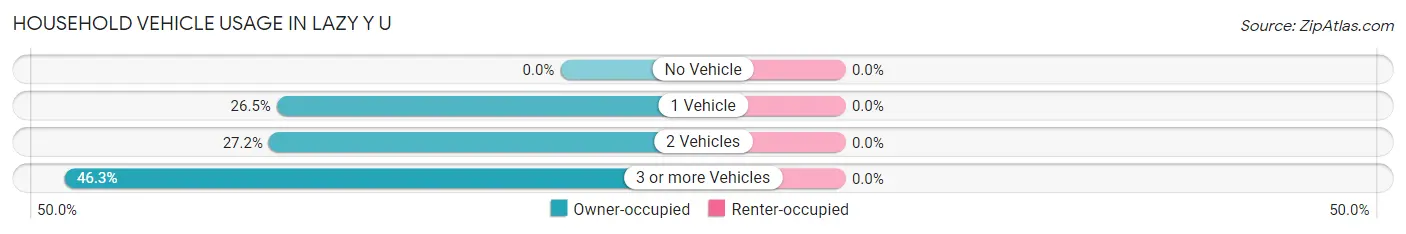
| Vehicles per Household | Owner-occupied | Renter-occupied |
| No Vehicle | 0 (0.0%) | 0 (0.0%) |
| 1 Vehicle | 36 (26.5%) | 0 (0.0%) |
| 2 Vehicles | 37 (27.2%) | 0 (0.0%) |
| 3 or more Vehicles | 63 (46.3%) | 0 (0.0%) |
| Total | 136 (100.0%) | 0 (0.0%) |
Real Estate & Mortgages in Lazy Y U
Real Estate and Mortgage Overview in Lazy Y U
| Characteristic | Without Mortgage | With Mortgage |
| Housing Units | 32 | 104 |
| Median Property Value | - | - |
| Median Household Income | - | - |
| Monthly Housing Costs | - | - |
| Real Estate Taxes | - | - |
Property Value by Mortgage Status in Lazy Y U
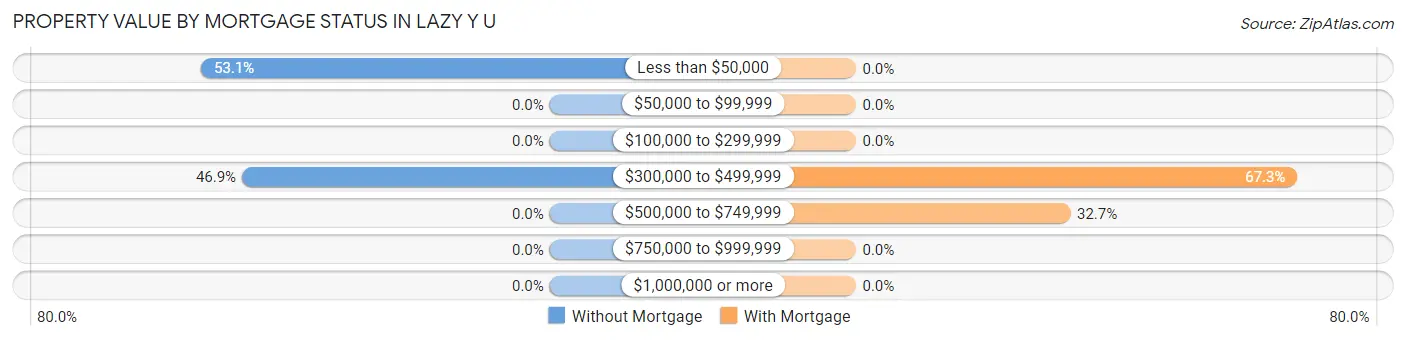
| Property Value | Without Mortgage | With Mortgage |
| Less than $50,000 | 17 (53.1%) | 0 (0.0%) |
| $50,000 to $99,999 | 0 (0.0%) | 0 (0.0%) |
| $100,000 to $299,999 | 0 (0.0%) | 0 (0.0%) |
| $300,000 to $499,999 | 15 (46.9%) | 70 (67.3%) |
| $500,000 to $749,999 | 0 (0.0%) | 34 (32.7%) |
| $750,000 to $999,999 | 0 (0.0%) | 0 (0.0%) |
| $1,000,000 or more | 0 (0.0%) | 0 (0.0%) |
| Total | 32 (100.0%) | 104 (100.0%) |
Household Income by Mortgage Status in Lazy Y U
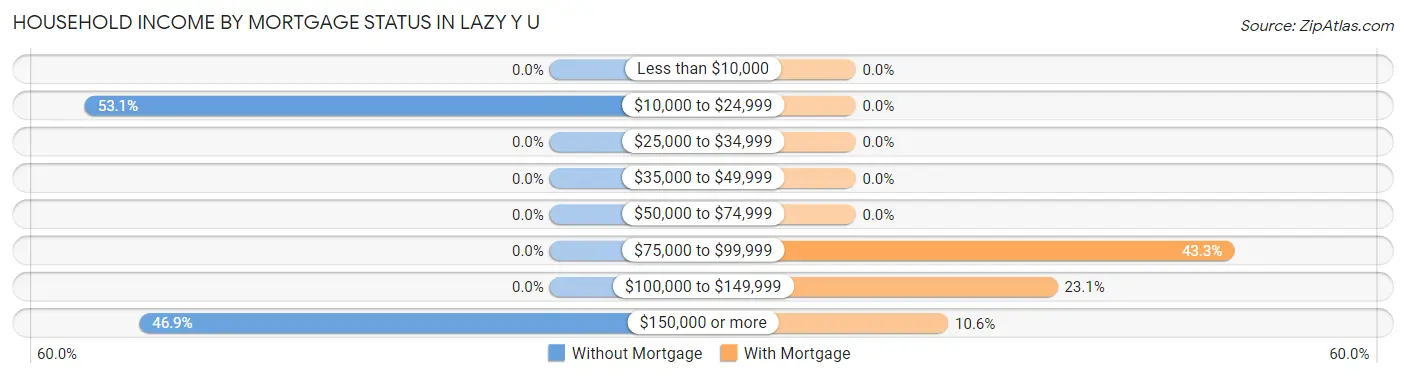
| Household Income | Without Mortgage | With Mortgage |
| Less than $10,000 | 0 (0.0%) | 0 (0.0%) |
| $10,000 to $24,999 | 17 (53.1%) | 0 (0.0%) |
| $25,000 to $34,999 | 0 (0.0%) | 0 (0.0%) |
| $35,000 to $49,999 | 0 (0.0%) | 0 (0.0%) |
| $50,000 to $74,999 | 0 (0.0%) | 0 (0.0%) |
| $75,000 to $99,999 | 0 (0.0%) | 45 (43.3%) |
| $100,000 to $149,999 | 0 (0.0%) | 24 (23.1%) |
| $150,000 or more | 15 (46.9%) | 11 (10.6%) |
| Total | 32 (100.0%) | 104 (100.0%) |
Property Value to Household Income Ratio in Lazy Y U
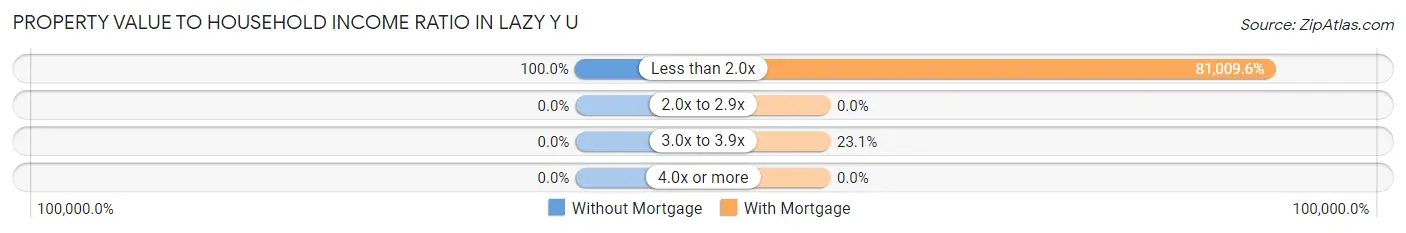
| Value-to-Income Ratio | Without Mortgage | With Mortgage |
| Less than 2.0x | 32 (100.0%) | 84,250 (81,009.6%) |
| 2.0x to 2.9x | 0 (0.0%) | 0 (0.0%) |
| 3.0x to 3.9x | 0 (0.0%) | 24 (23.1%) |
| 4.0x or more | 0 (0.0%) | 0 (0.0%) |
| Total | 32 (100.0%) | 104 (100.0%) |
Real Estate Taxes by Mortgage Status in Lazy Y U
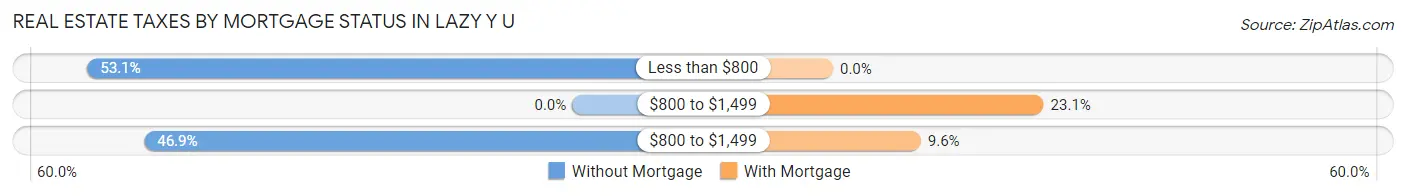
| Property Taxes | Without Mortgage | With Mortgage |
| Less than $800 | 17 (53.1%) | 0 (0.0%) |
| $800 to $1,499 | 0 (0.0%) | 24 (23.1%) |
| $800 to $1,499 | 15 (46.9%) | 10 (9.6%) |
| Total | 32 (100.0%) | 104 (100.0%) |
Health & Disability in Lazy Y U
Health Insurance Coverage by Age in Lazy Y U
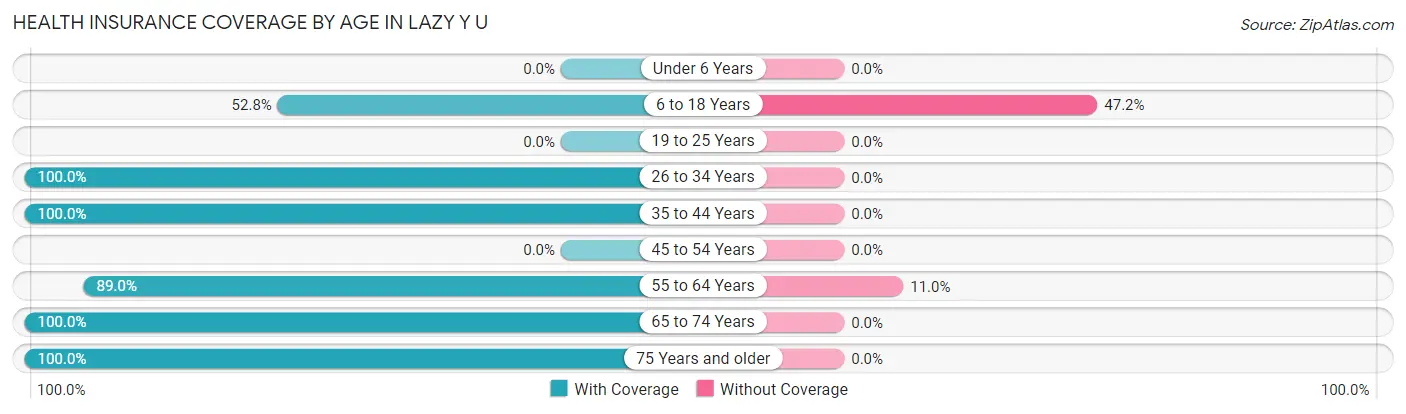
| Age Bracket | With Coverage | Without Coverage |
| Under 6 Years | 0 (0.0%) | 0 (0.0%) |
| 6 to 18 Years | 47 (52.8%) | 42 (47.2%) |
| 19 to 25 Years | 0 (0.0%) | 0 (0.0%) |
| 26 to 34 Years | 28 (100.0%) | 0 (0.0%) |
| 35 to 44 Years | 48 (100.0%) | 0 (0.0%) |
| 45 to 54 Years | 0 (0.0%) | 0 (0.0%) |
| 55 to 64 Years | 89 (89.0%) | 11 (11.0%) |
| 65 to 74 Years | 63 (100.0%) | 0 (0.0%) |
| 75 Years and older | 40 (100.0%) | 0 (0.0%) |
| Total | 315 (85.6%) | 53 (14.4%) |
Health Insurance Coverage by Citizenship Status in Lazy Y U
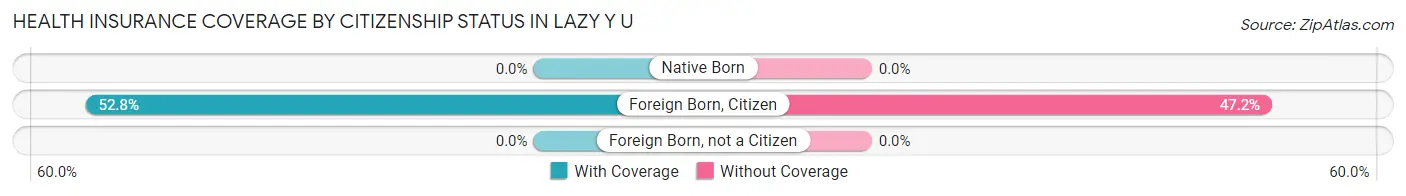
| Citizenship Status | With Coverage | Without Coverage |
| Native Born | 0 (0.0%) | 0 (0.0%) |
| Foreign Born, Citizen | 47 (52.8%) | 42 (47.2%) |
| Foreign Born, not a Citizen | 0 (0.0%) | 0 (0.0%) |
Health Insurance Coverage by Household Income in Lazy Y U
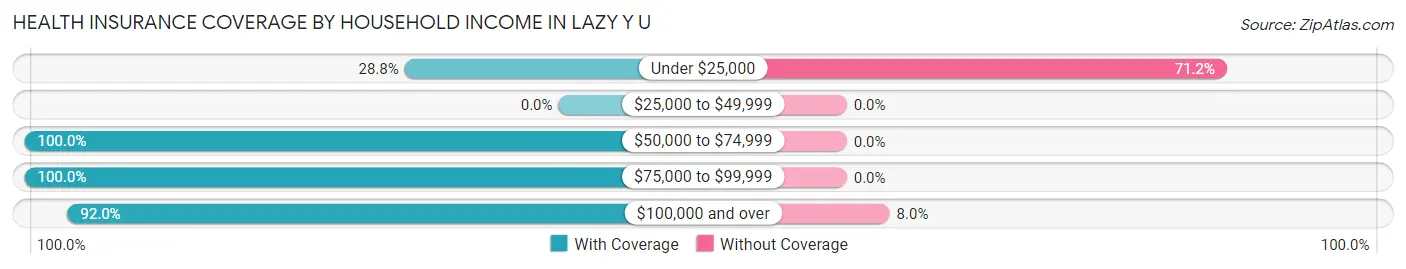
| Household Income | With Coverage | Without Coverage |
| Under $25,000 | 17 (28.8%) | 42 (71.2%) |
| $25,000 to $49,999 | 0 (0.0%) | 0 (0.0%) |
| $50,000 to $74,999 | 109 (100.0%) | 0 (0.0%) |
| $75,000 to $99,999 | 63 (100.0%) | 0 (0.0%) |
| $100,000 and over | 126 (92.0%) | 11 (8.0%) |
Public vs Private Health Insurance Coverage by Age in Lazy Y U
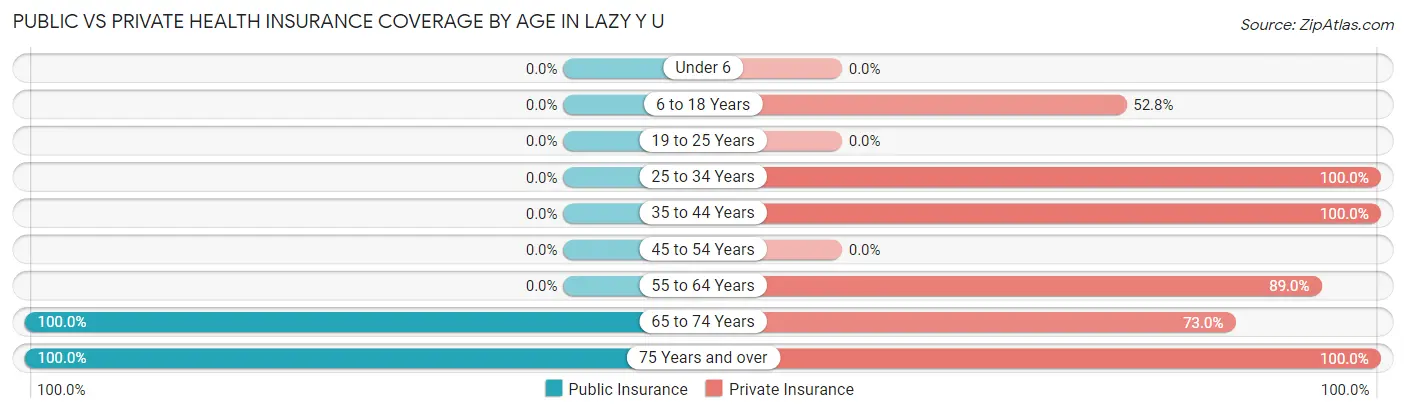
| Age Bracket | Public Insurance | Private Insurance |
| Under 6 | 0 (0.0%) | 0 (0.0%) |
| 6 to 18 Years | 0 (0.0%) | 47 (52.8%) |
| 19 to 25 Years | 0 (0.0%) | 0 (0.0%) |
| 25 to 34 Years | 0 (0.0%) | 28 (100.0%) |
| 35 to 44 Years | 0 (0.0%) | 48 (100.0%) |
| 45 to 54 Years | 0 (0.0%) | 0 (0.0%) |
| 55 to 64 Years | 0 (0.0%) | 89 (89.0%) |
| 65 to 74 Years | 63 (100.0%) | 46 (73.0%) |
| 75 Years and over | 40 (100.0%) | 40 (100.0%) |
| Total | 103 (28.0%) | 298 (81.0%) |
Disability Status by Sex by Age in Lazy Y U
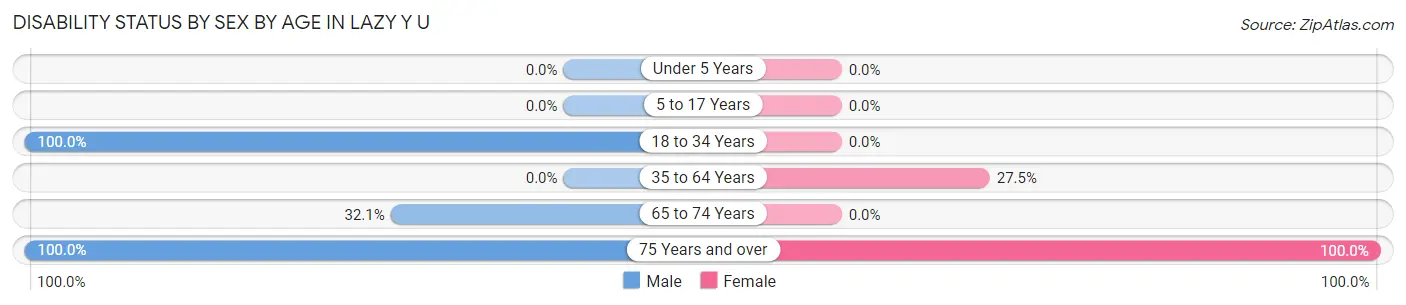
| Age Bracket | Male | Female |
| Under 5 Years | 0 (0.0%) | 0 (0.0%) |
| 5 to 17 Years | 0 (0.0%) | 0 (0.0%) |
| 18 to 34 Years | 28 (100.0%) | 0 (0.0%) |
| 35 to 64 Years | 0 (0.0%) | 25 (27.5%) |
| 65 to 74 Years | 17 (32.1%) | 0 (0.0%) |
| 75 Years and over | 21 (100.0%) | 19 (100.0%) |
Disability Class by Sex by Age in Lazy Y U
Disability Class: Hearing Difficulty
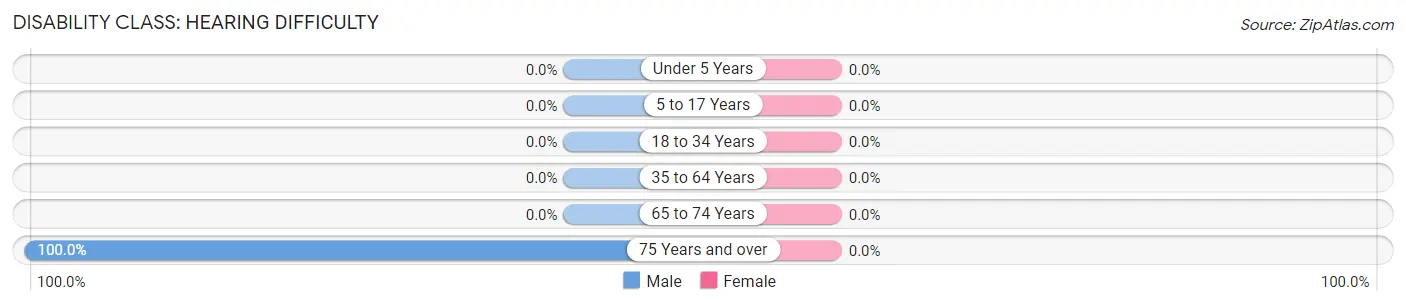
| Age Bracket | Male | Female |
| Under 5 Years | 0 (0.0%) | 0 (0.0%) |
| 5 to 17 Years | 0 (0.0%) | 0 (0.0%) |
| 18 to 34 Years | 0 (0.0%) | 0 (0.0%) |
| 35 to 64 Years | 0 (0.0%) | 0 (0.0%) |
| 65 to 74 Years | 0 (0.0%) | 0 (0.0%) |
| 75 Years and over | 21 (100.0%) | 0 (0.0%) |
Disability Class: Vision Difficulty
| Age Bracket | Male | Female |
| Under 5 Years | 0 (0.0%) | 0 (0.0%) |
| 5 to 17 Years | 0 (0.0%) | 0 (0.0%) |
| 18 to 34 Years | 0 (0.0%) | 0 (0.0%) |
| 35 to 64 Years | 0 (0.0%) | 0 (0.0%) |
| 65 to 74 Years | 0 (0.0%) | 0 (0.0%) |
| 75 Years and over | 0 (0.0%) | 0 (0.0%) |
Disability Class: Cognitive Difficulty
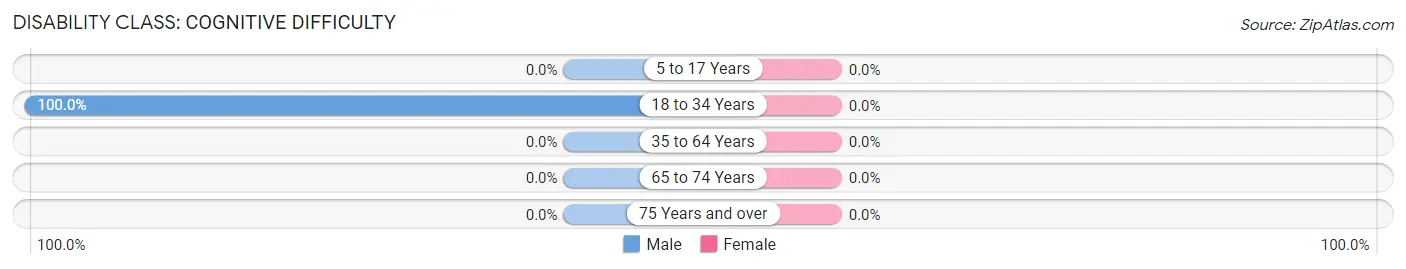
| Age Bracket | Male | Female |
| 5 to 17 Years | 0 (0.0%) | 0 (0.0%) |
| 18 to 34 Years | 28 (100.0%) | 0 (0.0%) |
| 35 to 64 Years | 0 (0.0%) | 0 (0.0%) |
| 65 to 74 Years | 0 (0.0%) | 0 (0.0%) |
| 75 Years and over | 0 (0.0%) | 0 (0.0%) |
Disability Class: Ambulatory Difficulty
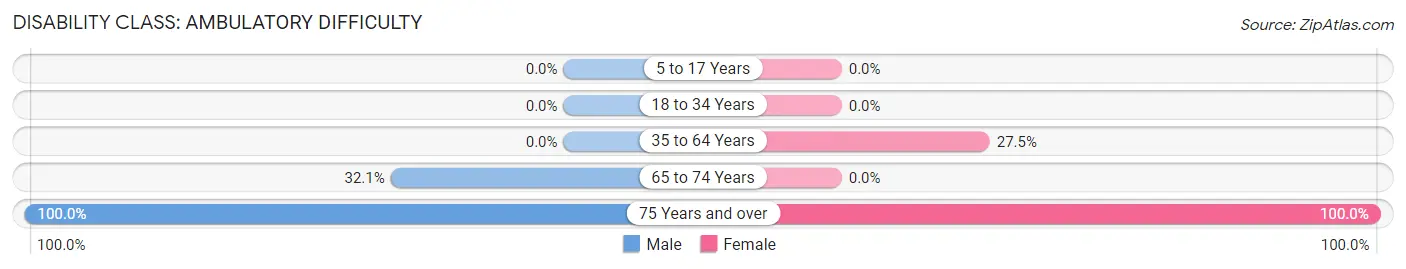
| Age Bracket | Male | Female |
| 5 to 17 Years | 0 (0.0%) | 0 (0.0%) |
| 18 to 34 Years | 0 (0.0%) | 0 (0.0%) |
| 35 to 64 Years | 0 (0.0%) | 25 (27.5%) |
| 65 to 74 Years | 17 (32.1%) | 0 (0.0%) |
| 75 Years and over | 21 (100.0%) | 19 (100.0%) |
Disability Class: Self-Care Difficulty
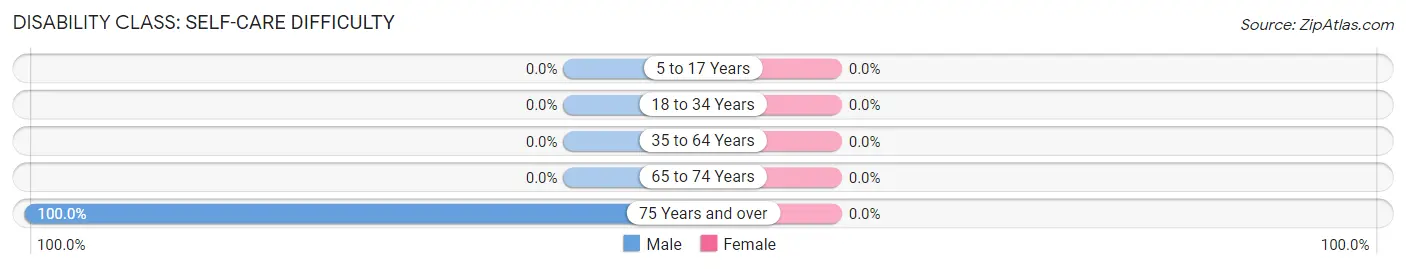
| Age Bracket | Male | Female |
| 5 to 17 Years | 0 (0.0%) | 0 (0.0%) |
| 18 to 34 Years | 0 (0.0%) | 0 (0.0%) |
| 35 to 64 Years | 0 (0.0%) | 0 (0.0%) |
| 65 to 74 Years | 0 (0.0%) | 0 (0.0%) |
| 75 Years and over | 21 (100.0%) | 0 (0.0%) |
Technology Access in Lazy Y U
Computing Device Access in Lazy Y U
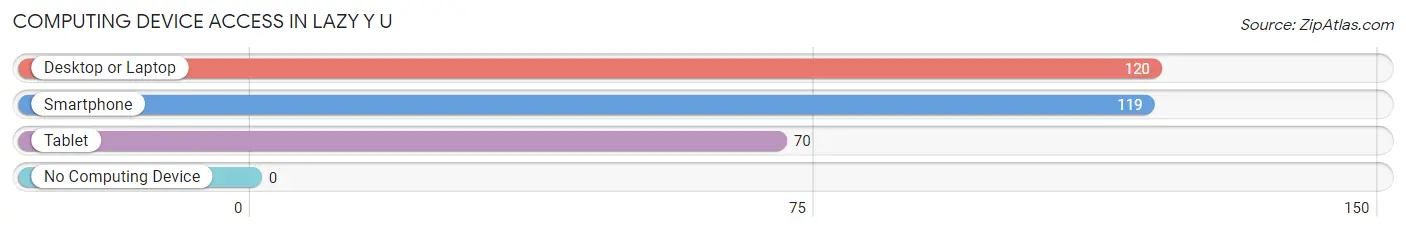
| Device Type | # Households | % Households |
| Desktop or Laptop | 120 | 88.2% |
| Smartphone | 119 | 87.5% |
| Tablet | 70 | 51.5% |
| No Computing Device | 0 | 0.0% |
| Total | 136 | 100.0% |
Internet Access in Lazy Y U
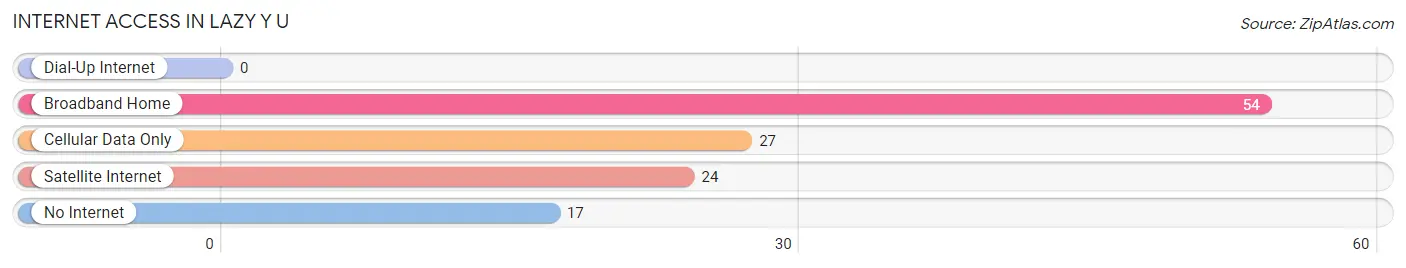
| Internet Type | # Households | % Households |
| Dial-Up Internet | 0 | 0.0% |
| Broadband Home | 54 | 39.7% |
| Cellular Data Only | 27 | 19.9% |
| Satellite Internet | 24 | 17.6% |
| No Internet | 17 | 12.5% |
| Total | 136 | 100.0% |
Lazy Y U Summary
Arizona History
Arizona has a long and varied history, beginning with its first inhabitants, the Hohokam, who lived in the area from around 300 BC to 1450 AD. The Hohokam were a complex society that built irrigation canals and constructed large villages. They were also skilled traders, exchanging goods with other Native American tribes and with the Spanish.
The first Europeans to explore Arizona were the Spanish, who arrived in the late 1500s. They established missions and forts in the area, and by the early 1700s, they had established a permanent settlement in Tucson.
In 1848, the United States acquired Arizona as part of the Treaty of Guadalupe Hidalgo, which ended the Mexican-American War. Arizona became a U.S. territory in 1863, and in 1912, it became the 48th state.
Arizona’s economy has been largely based on mining and agriculture. Copper mining was a major industry in the late 1800s and early 1900s, and the state is still a major producer of copper today. Agriculture has also been important, with cotton, citrus, and cattle being the main products.
In the late 20th century, Arizona’s economy shifted to focus more on services and technology. The state is now home to several major technology companies, including Intel and GoDaddy. Tourism is also a major industry, with millions of visitors coming to Arizona each year to enjoy its natural beauty and attractions.
Geography
Arizona is located in the southwestern United States, bordered by California, Nevada, Utah, New Mexico, and Mexico. It is the sixth largest state in the country, with an area of 113,998 square miles.
Arizona is known for its desert climate, with hot summers and mild winters. The state is home to a variety of landscapes, including mountains, canyons, forests, and deserts. The Grand Canyon, located in northern Arizona, is one of the most famous natural attractions in the world.
Economy
Arizona’s economy is largely based on services and technology. The state is home to several major technology companies, including Intel and GoDaddy. Tourism is also a major industry, with millions of visitors coming to Arizona each year to enjoy its natural beauty and attractions.
Agriculture is still an important part of the state’s economy, with cotton, citrus, and cattle being the main products. Mining is also a major industry, with copper being the most important mineral.
Demographics
As of 2020, Arizona had an estimated population of 7.3 million people. The state is home to a diverse population, with the largest ethnic groups being White (60.2%), Hispanic or Latino (30.2%), and Native American (5.3%).
The median household income in Arizona is $58,945, and the median home value is $253,400. The state’s unemployment rate is 6.2%.
Conclusion
Arizona has a long and varied history, beginning with its first inhabitants, the Hohokam. The state has a diverse population and a strong economy based on services and technology. Agriculture and mining are still important industries, and tourism is a major source of income. Arizona is a beautiful state with a variety of landscapes and attractions, making it a popular destination for visitors from around the world.
Common Questions
What is Per Capita Income in Lazy Y U?
Per Capita income in Lazy Y U is $45,479.
What is the Median Family Income in Lazy Y U?
Median Family Income in Lazy Y U is $82,625.
What is the Median Household income in Lazy Y U?
Median Household Income in Lazy Y U is $84,000.
What is Inequality or Gini Index in Lazy Y U?
Inequality or Gini Index in Lazy Y U is 0.41.
What is the Total Population of Lazy Y U?
Total Population of Lazy Y U is 368.
What is the Total Male Population of Lazy Y U?
Total Male Population of Lazy Y U is 159.
What is the Total Female Population of Lazy Y U?
Total Female Population of Lazy Y U is 209.
What is the Ratio of Males per 100 Females in Lazy Y U?
There are 76.08 Males per 100 Females in Lazy Y U.
What is the Ratio of Females per 100 Males in Lazy Y U?
There are 131.45 Females per 100 Males in Lazy Y U.
What is the Median Population Age in Lazy Y U?
Median Population Age in Lazy Y U is 62.1 Years.
What is the Average Family Size in Lazy Y U
Average Family Size in Lazy Y U is 2.9 People.
What is the Average Household Size in Lazy Y U
Average Household Size in Lazy Y U is 2.7 People.
How Large is the Labor Force in Lazy Y U?
There are 173 People in the Labor Forcein in Lazy Y U.
What is the Percentage of People in the Labor Force in Lazy Y U?
53.9% of People are in the Labor Force in Lazy Y U.