Rough Rock, AZ Map & Demographics
Rough Rock Map
Rough Rock Overview
$19,016
PER CAPITA INCOME
$41,500
AVG FAMILY INCOME
$40,347
AVG HOUSEHOLD INCOME
13.9%
WAGE / INCOME GAP [ % ]
86.1¢/ $1
WAGE / INCOME GAP [ $ ]
0.43
INEQUALITY / GINI INDEX
423
TOTAL POPULATION
232
MALE POPULATION
191
FEMALE POPULATION
121.47
MALES / 100 FEMALES
82.33
FEMALES / 100 MALES
43.9
MEDIAN AGE
3.9
AVG FAMILY SIZE
2.2
AVG HOUSEHOLD SIZE
142
LABOR FORCE [ PEOPLE ]
39.2%
PERCENT IN LABOR FORCE
2.8%
UNEMPLOYMENT RATE
Income in Rough Rock
Income Overview in Rough Rock
Per Capita Income in Rough Rock is $19,016, while median incomes of families and households are $41,500 and $40,347 respectively.
| Characteristic | Number | Measure |
| Per Capita Income | 423 | $19,016 |
| Median Family Income | 76 | $41,500 |
| Mean Family Income | 76 | $44,546 |
| Median Household Income | 195 | $40,347 |
| Mean Household Income | 195 | $39,093 |
| Income Deficit | 76 | $0 |
| Wage / Income Gap (%) | 423 | 13.90% |
| Wage / Income Gap ($) | 423 | 86.10¢ per $1 |
| Gini / Inequality Index | 423 | 0.43 |
Earnings by Sex in Rough Rock
Average Earnings in Rough Rock are $37,308, $40,859 for men and $35,179 for women, a difference of 13.9%.
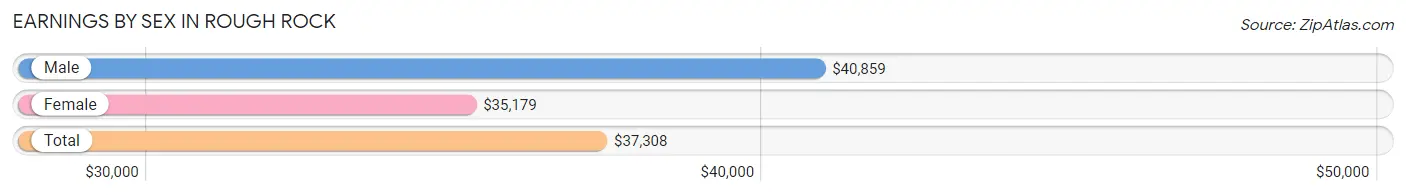
| Sex | Number | Average Earnings |
| Male | 75 (50.0%) | $40,859 |
| Female | 75 (50.0%) | $35,179 |
| Total | 150 (100.0%) | $37,308 |
Earnings by Sex by Income Bracket in Rough Rock
The most common earnings brackets in Rough Rock are $55,000 to $64,999 for men (17 | 22.7%) and $30,000 to $34,999 for women (12 | 16.0%).
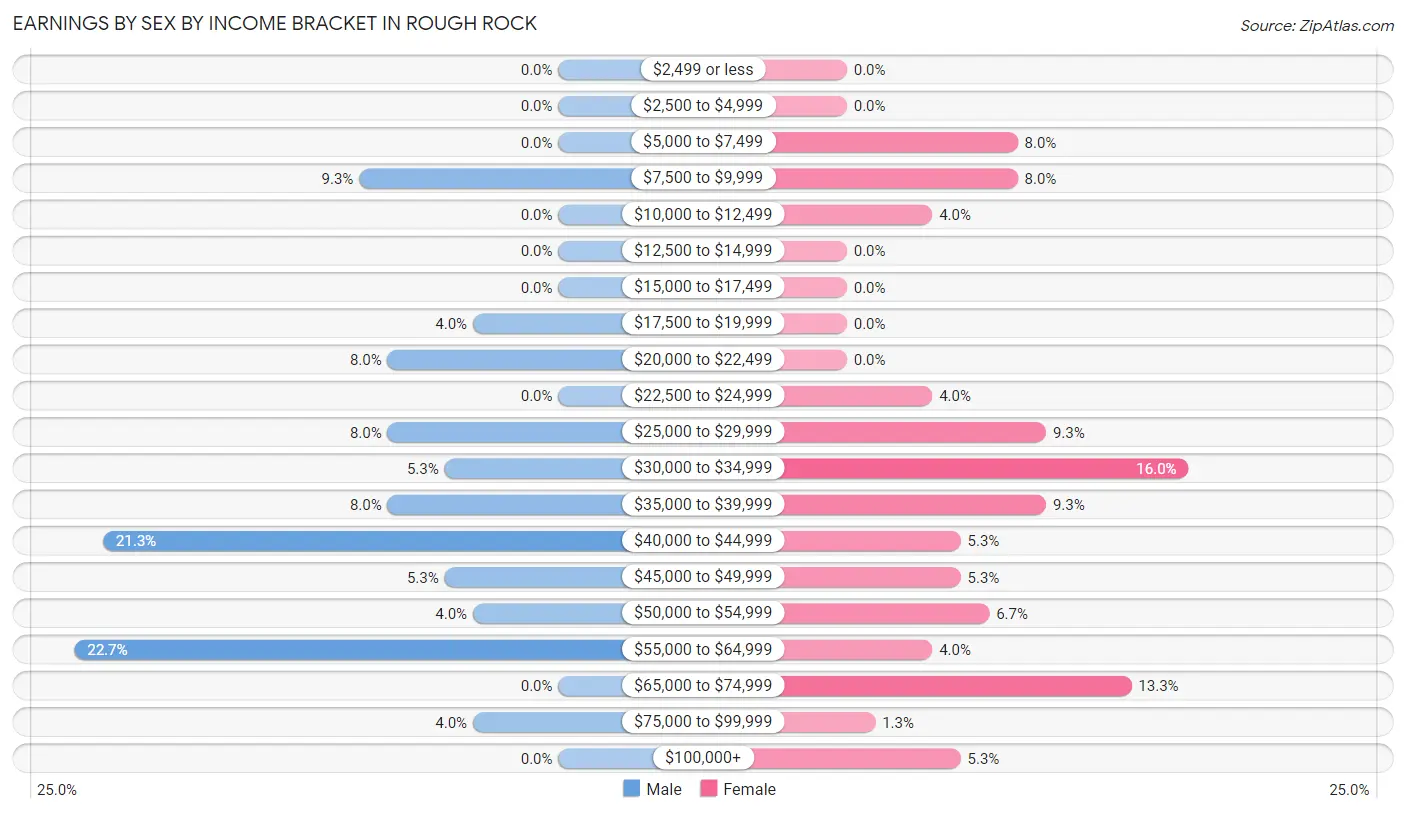
| Income | Male | Female |
| $2,499 or less | 0 (0.0%) | 0 (0.0%) |
| $2,500 to $4,999 | 0 (0.0%) | 0 (0.0%) |
| $5,000 to $7,499 | 0 (0.0%) | 6 (8.0%) |
| $7,500 to $9,999 | 7 (9.3%) | 6 (8.0%) |
| $10,000 to $12,499 | 0 (0.0%) | 3 (4.0%) |
| $12,500 to $14,999 | 0 (0.0%) | 0 (0.0%) |
| $15,000 to $17,499 | 0 (0.0%) | 0 (0.0%) |
| $17,500 to $19,999 | 3 (4.0%) | 0 (0.0%) |
| $20,000 to $22,499 | 6 (8.0%) | 0 (0.0%) |
| $22,500 to $24,999 | 0 (0.0%) | 3 (4.0%) |
| $25,000 to $29,999 | 6 (8.0%) | 7 (9.3%) |
| $30,000 to $34,999 | 4 (5.3%) | 12 (16.0%) |
| $35,000 to $39,999 | 6 (8.0%) | 7 (9.3%) |
| $40,000 to $44,999 | 16 (21.3%) | 4 (5.3%) |
| $45,000 to $49,999 | 4 (5.3%) | 4 (5.3%) |
| $50,000 to $54,999 | 3 (4.0%) | 5 (6.7%) |
| $55,000 to $64,999 | 17 (22.7%) | 3 (4.0%) |
| $65,000 to $74,999 | 0 (0.0%) | 10 (13.3%) |
| $75,000 to $99,999 | 3 (4.0%) | 1 (1.3%) |
| $100,000+ | 0 (0.0%) | 4 (5.3%) |
| Total | 75 (100.0%) | 75 (100.0%) |
Earnings by Sex by Educational Attainment in Rough Rock
Average earnings in Rough Rock are $40,859 for men and $36,250 for women, a difference of 11.3%. Men with an educational attainment of college or associate's degree enjoy the highest average annual earnings of $45,313, while those with high school diploma education earn the least with $21,042. Women with an educational attainment of graduate degree earn the most with the average annual earnings of $70,938, while those with college or associate's degree education have the smallest earnings of $33,393.
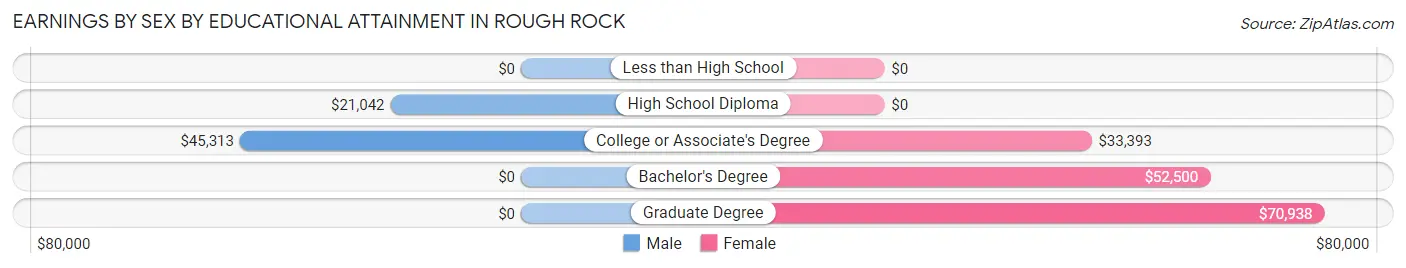
| Educational Attainment | Male Income | Female Income |
| Less than High School | - | - |
| High School Diploma | $21,042 | $0 |
| College or Associate's Degree | $45,313 | $33,393 |
| Bachelor's Degree | - | - |
| Graduate Degree | - | - |
| Total | $40,859 | $36,250 |
Family Income in Rough Rock
Family Income Brackets in Rough Rock
According to the Rough Rock family income data, there are 19 families falling into the $50,000 to $74,999 income range, which is the most common income bracket and makes up 25.0% of all families.
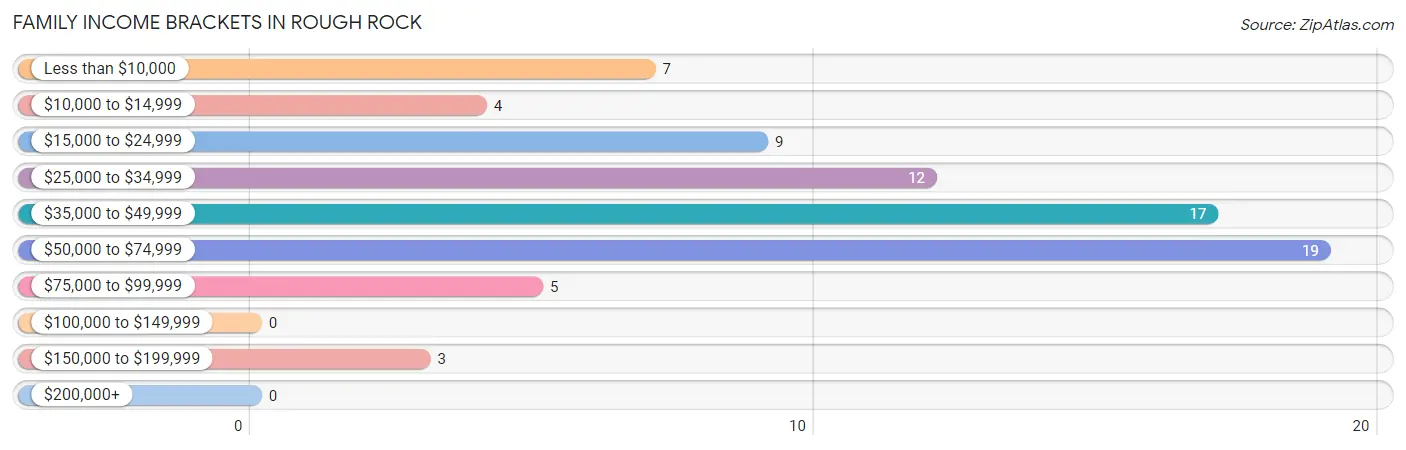
| Income Bracket | # Families | % Families |
| Less than $10,000 | 7 | 9.2% |
| $10,000 to $14,999 | 4 | 5.3% |
| $15,000 to $24,999 | 9 | 11.8% |
| $25,000 to $34,999 | 12 | 15.8% |
| $35,000 to $49,999 | 17 | 22.4% |
| $50,000 to $74,999 | 19 | 25.0% |
| $75,000 to $99,999 | 5 | 6.6% |
| $100,000 to $149,999 | 0 | 0.0% |
| $150,000 to $199,999 | 3 | 3.9% |
| $200,000+ | 0 | 0.0% |
Family Income by Famaliy Size in Rough Rock
4-person families (9 | 11.8%) account for the highest median family income in Rough Rock with $48,750 per family, while 2-person families (51 | 67.1%) have the highest median income of $16,771 per family member.
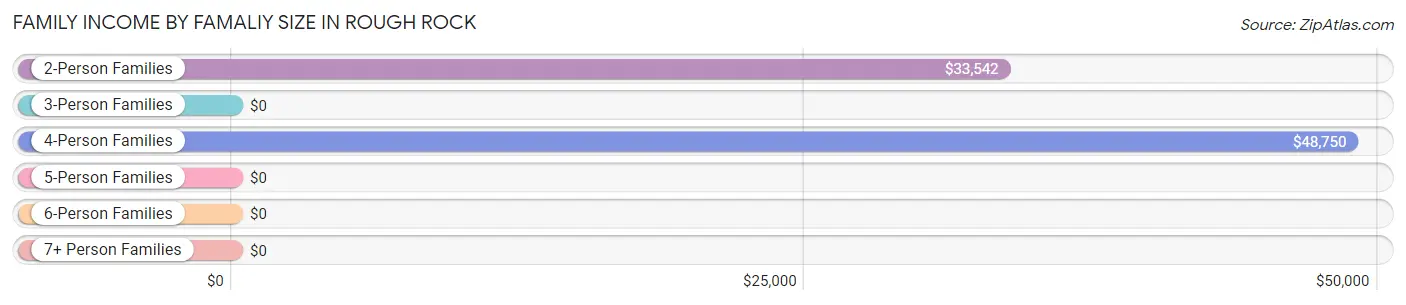
| Income Bracket | # Families | Median Income |
| 2-Person Families | 51 (67.1%) | $33,542 |
| 3-Person Families | 5 (6.6%) | $0 |
| 4-Person Families | 9 (11.8%) | $48,750 |
| 5-Person Families | 4 (5.3%) | $0 |
| 6-Person Families | 7 (9.2%) | $0 |
| 7+ Person Families | 0 (0.0%) | $0 |
| Total | 76 (100.0%) | $41,500 |
Family Income by Number of Earners in Rough Rock
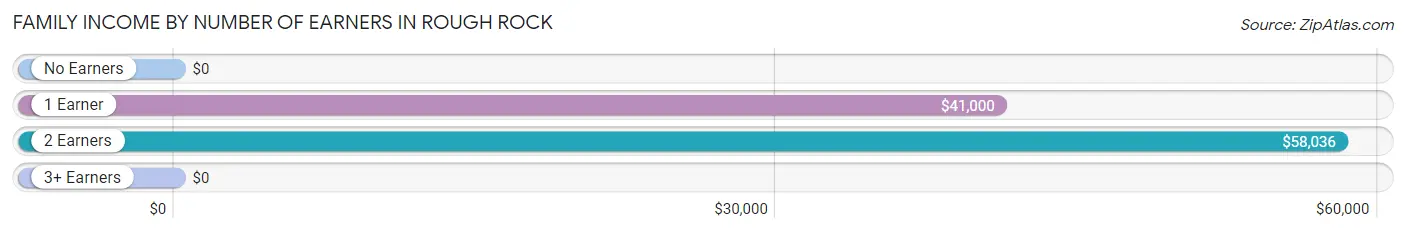
| Number of Earners | # Families | Median Income |
| No Earners | 31 (40.8%) | $0 |
| 1 Earner | 28 (36.8%) | $41,000 |
| 2 Earners | 17 (22.4%) | $58,036 |
| 3+ Earners | 0 (0.0%) | $0 |
| Total | 76 (100.0%) | $41,500 |
Household Income in Rough Rock
Household Income Brackets in Rough Rock
With 55 households falling in the category, the $50,000 to $74,999 income range is the most frequent in Rough Rock, accounting for 28.2% of all households.
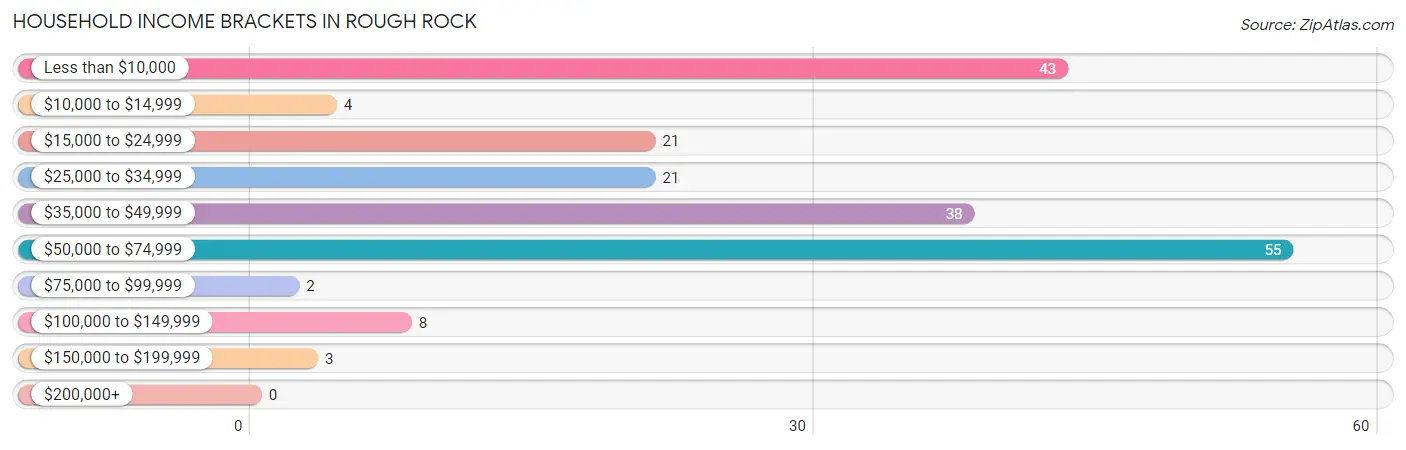
| Income Bracket | # Households | % Households |
| Less than $10,000 | 43 | 22.1% |
| $10,000 to $14,999 | 4 | 2.1% |
| $15,000 to $24,999 | 21 | 10.8% |
| $25,000 to $34,999 | 21 | 10.8% |
| $35,000 to $49,999 | 38 | 19.5% |
| $50,000 to $74,999 | 55 | 28.2% |
| $75,000 to $99,999 | 2 | 1.0% |
| $100,000 to $149,999 | 8 | 4.1% |
| $150,000 to $199,999 | 3 | 1.5% |
| $200,000+ | 0 | 0.0% |
Household Income by Householder Age in Rough Rock
The median household income in Rough Rock is $40,347, with the highest median household income of $47,813 found in the 25 to 44 years age bracket for the primary householder. A total of 69 households (35.4%) fall into this category.
| Income Bracket | # Households | Median Income |
| 15 to 24 Years | 0 (0.0%) | $0 |
| 25 to 44 Years | 69 (35.4%) | $47,813 |
| 45 to 64 Years | 71 (36.4%) | $0 |
| 65+ Years | 55 (28.2%) | $32,708 |
| Total | 195 (100.0%) | $40,347 |
Poverty in Rough Rock
Income Below Poverty by Sex and Age in Rough Rock
With 34.1% poverty level for males and 13.6% for females among the residents of Rough Rock, 55 to 64 year old males and 15 year old females are the most vulnerable to poverty, with 30 males (83.3%) and 6 females (100.0%) in their respective age groups living below the poverty level.
| Age Bracket | Male | Female |
| Under 5 Years | 0 (0.0%) | 0 (0.0%) |
| 5 Years | 0 (0.0%) | 0 (0.0%) |
| 6 to 11 Years | 0 (0.0%) | 0 (0.0%) |
| 12 to 14 Years | 0 (0.0%) | 0 (0.0%) |
| 15 Years | 0 (0.0%) | 6 (100.0%) |
| 16 and 17 Years | 0 (0.0%) | 0 (0.0%) |
| 18 to 24 Years | 7 (50.0%) | 0 (0.0%) |
| 25 to 34 Years | 0 (0.0%) | 0 (0.0%) |
| 35 to 44 Years | 8 (14.0%) | 0 (0.0%) |
| 45 to 54 Years | 34 (65.4%) | 0 (0.0%) |
| 55 to 64 Years | 30 (83.3%) | 7 (24.1%) |
| 65 to 74 Years | 0 (0.0%) | 6 (16.7%) |
| 75 Years and over | 0 (0.0%) | 7 (87.5%) |
| Total | 79 (34.1%) | 26 (13.6%) |
Income Above Poverty by Sex and Age in Rough Rock
According to the poverty statistics in Rough Rock, males aged under 5 years and females aged under 5 years are the age groups that are most secure financially, with 100.0% of males and 100.0% of females in these age groups living above the poverty line.
| Age Bracket | Male | Female |
| Under 5 Years | 8 (100.0%) | 5 (100.0%) |
| 5 Years | 0 (0.0%) | 6 (100.0%) |
| 6 to 11 Years | 0 (0.0%) | 11 (100.0%) |
| 12 to 14 Years | 5 (100.0%) | 16 (100.0%) |
| 15 Years | 4 (100.0%) | 0 (0.0%) |
| 16 and 17 Years | 7 (100.0%) | 10 (100.0%) |
| 18 to 24 Years | 7 (50.0%) | 6 (100.0%) |
| 25 to 34 Years | 22 (100.0%) | 17 (100.0%) |
| 35 to 44 Years | 49 (86.0%) | 31 (100.0%) |
| 45 to 54 Years | 18 (34.6%) | 10 (100.0%) |
| 55 to 64 Years | 6 (16.7%) | 22 (75.9%) |
| 65 to 74 Years | 24 (100.0%) | 30 (83.3%) |
| 75 Years and over | 3 (100.0%) | 1 (12.5%) |
| Total | 153 (65.9%) | 165 (86.4%) |
Income Below Poverty Among Married-Couple Families in Rough Rock
The poverty statistics for married-couple families in Rough Rock show that 9.1% or 4 of the total 44 families live below the poverty line. Families with no children have the highest poverty rate of 11.8%, comprising of 4 families. On the other hand, families with 1 or 2 children have the lowest poverty rate of 0.0%, which includes 0 families.
| Children | Above Poverty | Below Poverty |
| No Children | 30 (88.2%) | 4 (11.8%) |
| 1 or 2 Children | 6 (100.0%) | 0 (0.0%) |
| 3 or 4 Children | 4 (100.0%) | 0 (0.0%) |
| 5 or more Children | 0 (0.0%) | 0 (0.0%) |
| Total | 40 (90.9%) | 4 (9.1%) |
Income Below Poverty Among Single-Parent Households in Rough Rock
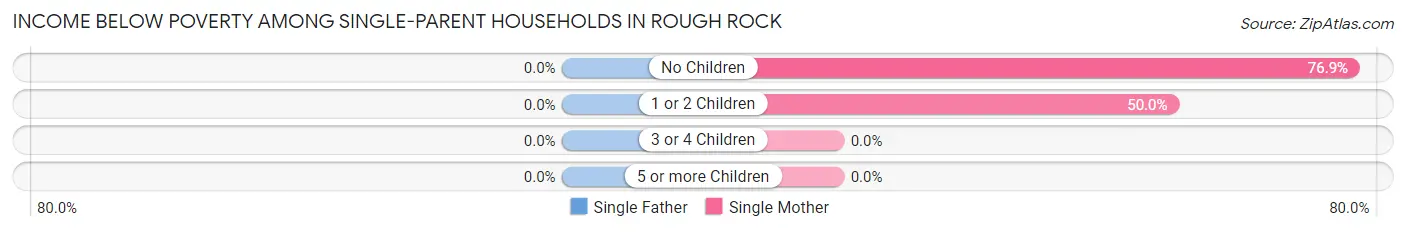
| Children | Single Father | Single Mother |
| No Children | 0 (0.0%) | 10 (76.9%) |
| 1 or 2 Children | 0 (0.0%) | 3 (50.0%) |
| 3 or 4 Children | 0 (0.0%) | 0 (0.0%) |
| 5 or more Children | 0 (0.0%) | 0 (0.0%) |
| Total | 0 (0.0%) | 13 (56.5%) |
Income Below Poverty Among Married-Couple vs Single-Parent Households in Rough Rock
The poverty data for Rough Rock shows that 4 of the married-couple family households (9.1%) and 13 of the single-parent households (40.6%) are living below the poverty level. Within the married-couple family households, those with no children have the highest poverty rate, with 4 households (11.8%) falling below the poverty line. Among the single-parent households, those with no children have the highest poverty rate, with 10 household (62.5%) living below poverty.
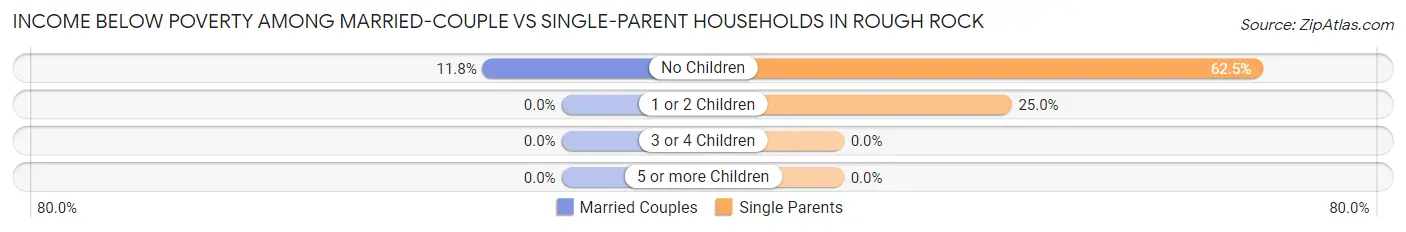
| Children | Married-Couple Families | Single-Parent Households |
| No Children | 4 (11.8%) | 10 (62.5%) |
| 1 or 2 Children | 0 (0.0%) | 3 (25.0%) |
| 3 or 4 Children | 0 (0.0%) | 0 (0.0%) |
| 5 or more Children | 0 (0.0%) | 0 (0.0%) |
| Total | 4 (9.1%) | 13 (40.6%) |
Race in Rough Rock
The most populous races in Rough Rock are Native / Alaskan (420 | 99.3%), and White / Caucasian (3 | 0.7%).
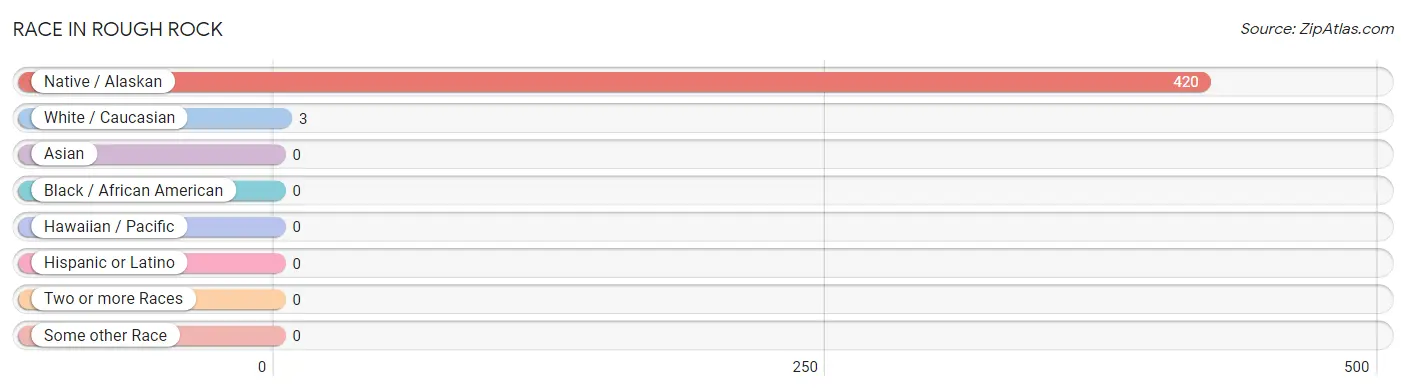
| Race | # Population | % Population |
| Asian | 0 | 0.0% |
| Black / African American | 0 | 0.0% |
| Hawaiian / Pacific | 0 | 0.0% |
| Hispanic or Latino | 0 | 0.0% |
| Native / Alaskan | 420 | 99.3% |
| White / Caucasian | 3 | 0.7% |
| Two or more Races | 0 | 0.0% |
| Some other Race | 0 | 0.0% |
| Total | 423 | 100.0% |
Ancestry in Rough Rock
The most populous ancestries reported in Rough Rock are , and Navajo (420 | 99.3%), together accounting for 99.3% of all Rough Rock residents.

| Ancestry | # Population | % Population |
| Navajo | 420 | 99.3% | View All 1 Rows |
Immigrants in Rough Rock

| Immigration Origin | # Population | % Population | View All 0 Rows |
Sex and Age in Rough Rock
Sex and Age in Rough Rock
The most populous age groups in Rough Rock are 40 to 44 Years (42 | 18.1%) for men and 65 to 69 Years (25 | 13.1%) for women.
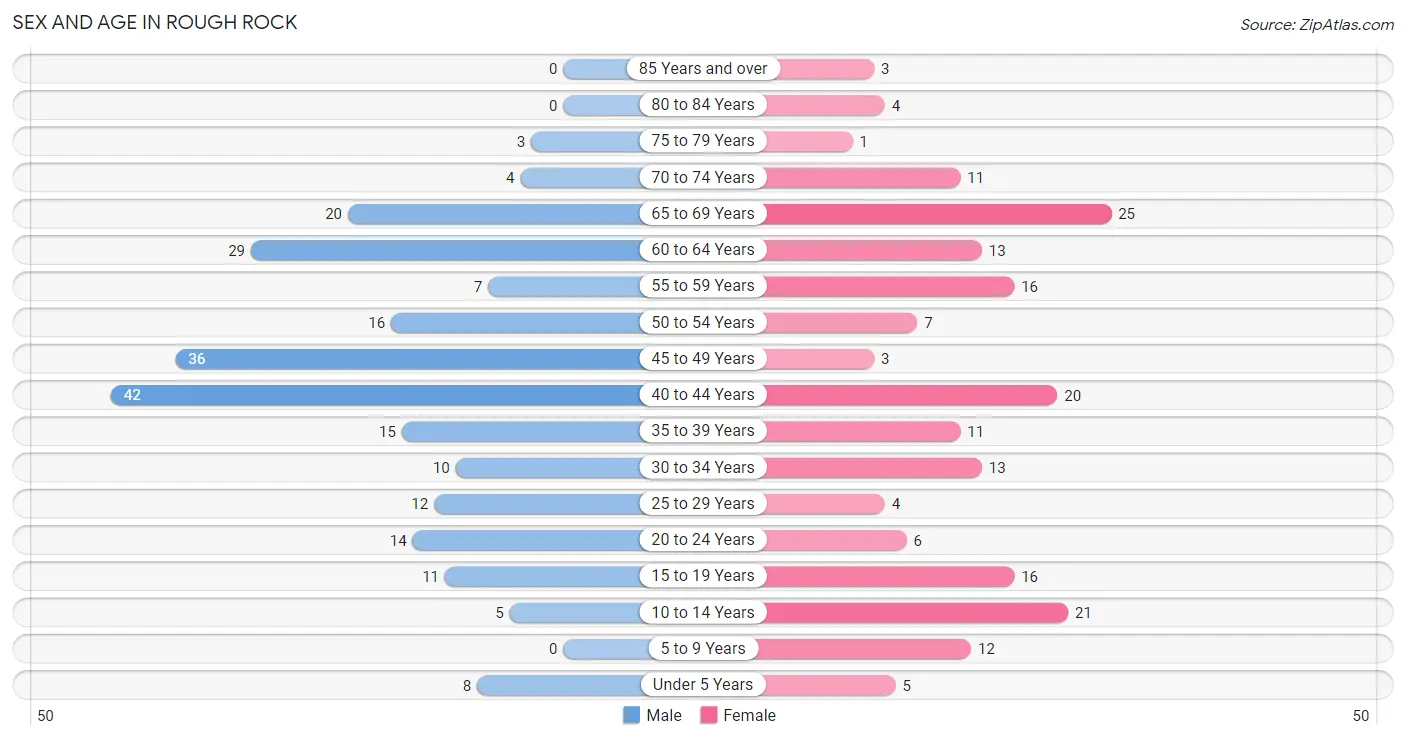
| Age Bracket | Male | Female |
| Under 5 Years | 8 (3.5%) | 5 (2.6%) |
| 5 to 9 Years | 0 (0.0%) | 12 (6.3%) |
| 10 to 14 Years | 5 (2.2%) | 21 (11.0%) |
| 15 to 19 Years | 11 (4.7%) | 16 (8.4%) |
| 20 to 24 Years | 14 (6.0%) | 6 (3.1%) |
| 25 to 29 Years | 12 (5.2%) | 4 (2.1%) |
| 30 to 34 Years | 10 (4.3%) | 13 (6.8%) |
| 35 to 39 Years | 15 (6.5%) | 11 (5.8%) |
| 40 to 44 Years | 42 (18.1%) | 20 (10.5%) |
| 45 to 49 Years | 36 (15.5%) | 3 (1.6%) |
| 50 to 54 Years | 16 (6.9%) | 7 (3.7%) |
| 55 to 59 Years | 7 (3.0%) | 16 (8.4%) |
| 60 to 64 Years | 29 (12.5%) | 13 (6.8%) |
| 65 to 69 Years | 20 (8.6%) | 25 (13.1%) |
| 70 to 74 Years | 4 (1.7%) | 11 (5.8%) |
| 75 to 79 Years | 3 (1.3%) | 1 (0.5%) |
| 80 to 84 Years | 0 (0.0%) | 4 (2.1%) |
| 85 Years and over | 0 (0.0%) | 3 (1.6%) |
| Total | 232 (100.0%) | 191 (100.0%) |
Families and Households in Rough Rock
Median Family Size in Rough Rock
The median family size in Rough Rock is 3.86 persons per family, with single male/father families (9 | 11.8%) accounting for the largest median family size of 5.33 persons per family. On the other hand, married-couple families (44 | 57.9%) represent the smallest median family size with 2.95 persons per family.
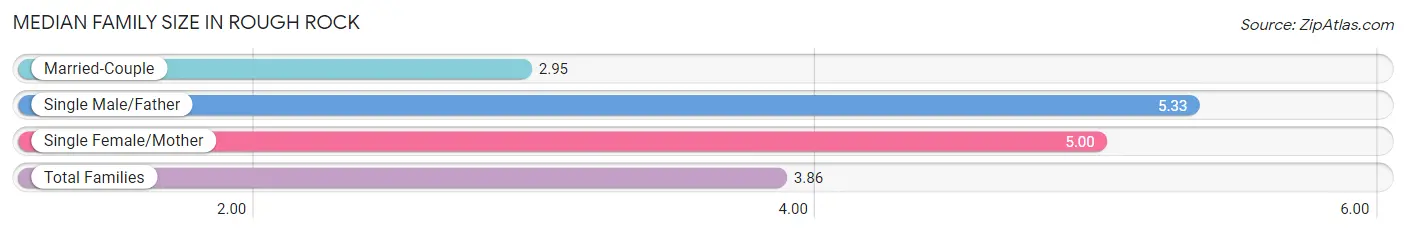
| Family Type | # Families | Family Size |
| Married-Couple | 44 (57.9%) | 2.95 |
| Single Male/Father | 9 (11.8%) | 5.33 |
| Single Female/Mother | 23 (30.3%) | 5.00 |
| Total Families | 76 (100.0%) | 3.86 |
Median Household Size in Rough Rock
The median household size in Rough Rock is 2.17 persons per household, with single male/father households (9 | 4.6%) accounting for the largest median household size of 5.78 persons per household. non-family households (119 | 61.0%) represent the smallest median household size with 1.03 persons per household.
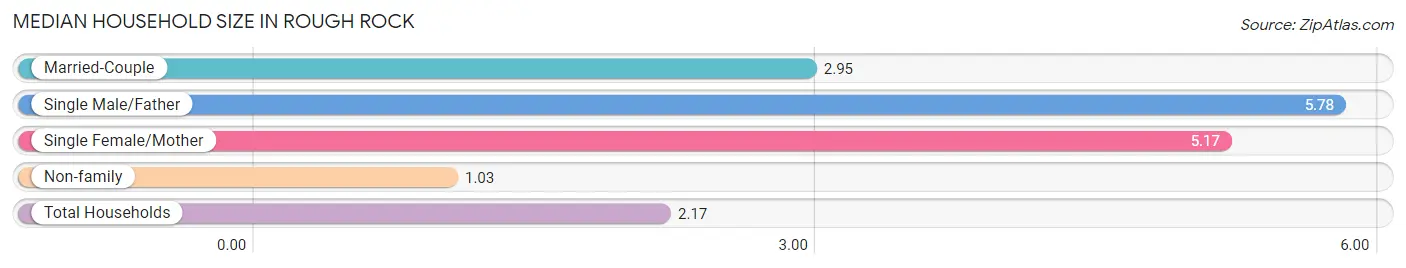
| Household Type | # Households | Household Size |
| Married-Couple | 44 (22.6%) | 2.95 |
| Single Male/Father | 9 (4.6%) | 5.78 |
| Single Female/Mother | 23 (11.8%) | 5.17 |
| Non-family | 119 (61.0%) | 1.03 |
| Total Households | 195 (100.0%) | 2.17 |
Household Size by Marriage Status in Rough Rock
Out of a total of 195 households in Rough Rock, 76 (39.0%) are family households, while 119 (61.0%) are nonfamily households. The most numerous type of family households are 2-person households, comprising 48, and the most common type of nonfamily households are 1-person households, comprising 115.
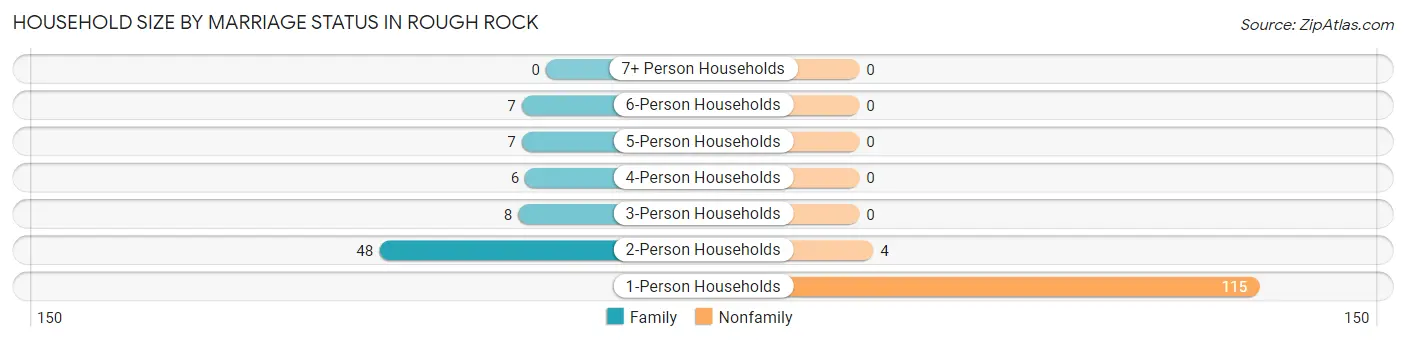
| Household Size | Family Households | Nonfamily Households |
| 1-Person Households | - | 115 (59.0%) |
| 2-Person Households | 48 (24.6%) | 4 (2.1%) |
| 3-Person Households | 8 (4.1%) | 0 (0.0%) |
| 4-Person Households | 6 (3.1%) | 0 (0.0%) |
| 5-Person Households | 7 (3.6%) | 0 (0.0%) |
| 6-Person Households | 7 (3.6%) | 0 (0.0%) |
| 7+ Person Households | 0 (0.0%) | 0 (0.0%) |
| Total | 76 (39.0%) | 119 (61.0%) |
Female Fertility in Rough Rock
Fertility by Age in Rough Rock
| Age Bracket | Women with Births | Births / 1,000 Women |
| 15 to 19 years | 0 (0.0%) | 0.0 |
| 20 to 34 years | 0 (0.0%) | 0.0 |
| 35 to 50 years | 0 (0.0%) | 0.0 |
| Total | 0 (0.0%) | 0.0 |
Fertility by Age by Marriage Status in Rough Rock
| Age Bracket | Married | Unmarried |
| 15 to 19 years | 0 (0.0%) | 0 (0.0%) |
| 20 to 34 years | 0 (0.0%) | 0 (0.0%) |
| 35 to 50 years | 0 (0.0%) | 0 (0.0%) |
| Total | 0 (0.0%) | 0 (0.0%) |
Fertility by Education in Rough Rock
| Educational Attainment | Women with Births | Births / 1,000 Women |
| Less than High School | 0 (0.0%) | 0.0 |
| High School Diploma | 0 (0.0%) | 0.0 |
| College or Associate's Degree | 0 (0.0%) | 0.0 |
| Bachelor's Degree | 0 (0.0%) | 0.0 |
| Graduate Degree | 0 (0.0%) | 0.0 |
| Total | 0 (0.0%) | 0.0 |
Fertility by Education by Marriage Status in Rough Rock
| Educational Attainment | Married | Unmarried |
| Less than High School | 0 (0.0%) | 0 (0.0%) |
| High School Diploma | 0 (0.0%) | 0 (0.0%) |
| College or Associate's Degree | 0 (0.0%) | 0 (0.0%) |
| Bachelor's Degree | 0 (0.0%) | 0 (0.0%) |
| Graduate Degree | 0 (0.0%) | 0 (0.0%) |
| Total | 0 (0.0%) | 0 (0.0%) |
Employment Characteristics in Rough Rock
Employment by Class of Employer in Rough Rock
Among the 132 employed individuals in Rough Rock, local government employees (87 | 65.9%), private company employees (16 | 12.1%), and federal government employees (14 | 10.6%) make up the most common classes of employment.
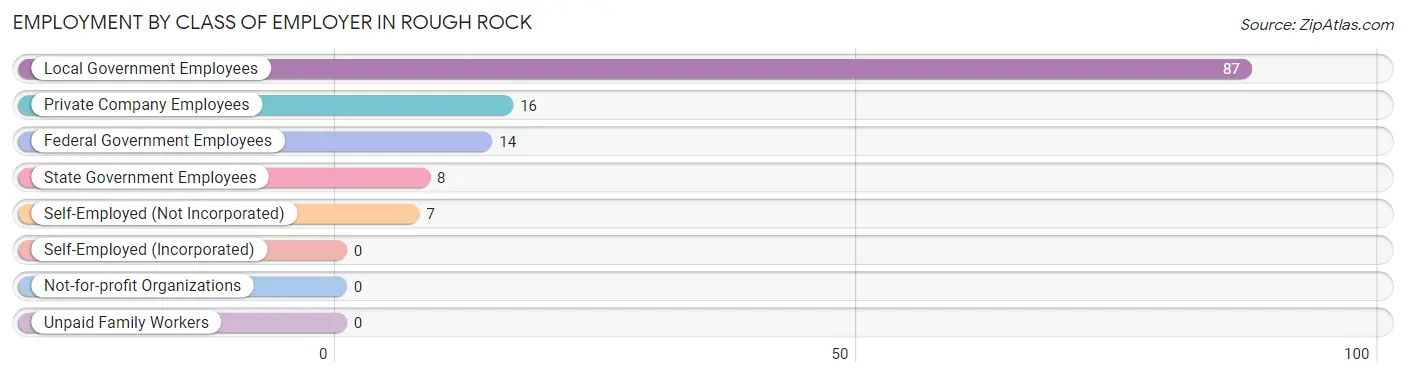
| Employer Class | # Employees | % Employees |
| Private Company Employees | 16 | 12.1% |
| Self-Employed (Incorporated) | 0 | 0.0% |
| Self-Employed (Not Incorporated) | 7 | 5.3% |
| Not-for-profit Organizations | 0 | 0.0% |
| Local Government Employees | 87 | 65.9% |
| State Government Employees | 8 | 6.1% |
| Federal Government Employees | 14 | 10.6% |
| Unpaid Family Workers | 0 | 0.0% |
| Total | 132 | 100.0% |
Employment Status by Age in Rough Rock
According to the labor force statistics for Rough Rock, out of the total population over 16 years of age (362), 39.2% or 142 individuals are in the labor force, with 2.8% or 4 of them unemployed. The age group with the highest labor force participation rate is 30 to 34 years, with 73.9% or 17 individuals in the labor force. Within the labor force, the 55 to 59 years age range has the highest percentage of unemployed individuals, with 40.0% or 4 of them being unemployed.
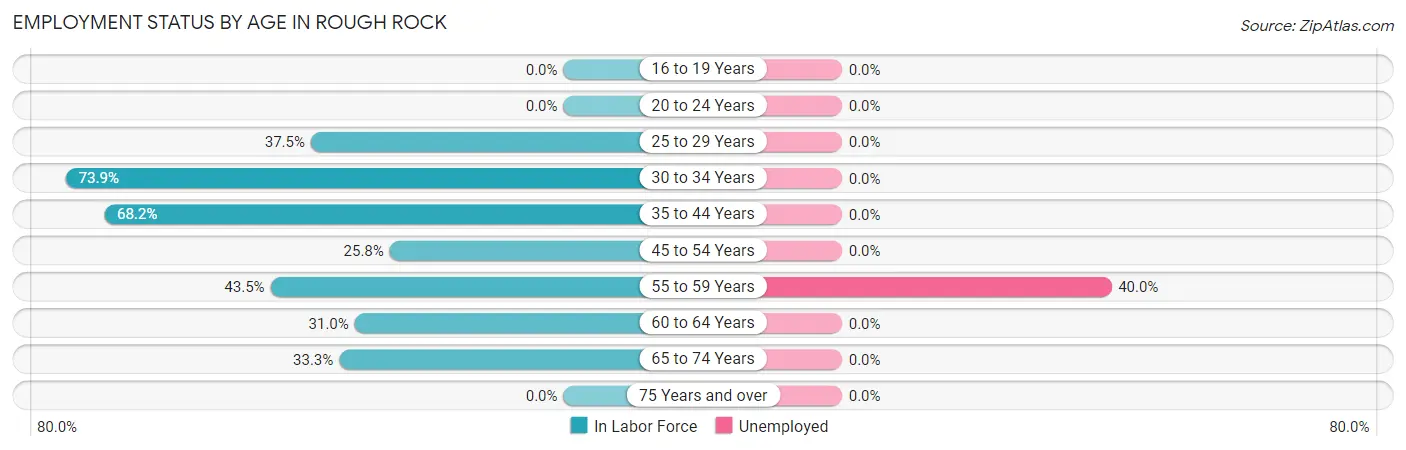
| Age Bracket | In Labor Force | Unemployed |
| 16 to 19 Years | 0 (0.0%) | 0 (0.0%) |
| 20 to 24 Years | 0 (0.0%) | 0 (0.0%) |
| 25 to 29 Years | 6 (37.5%) | 0 (0.0%) |
| 30 to 34 Years | 17 (73.9%) | 0 (0.0%) |
| 35 to 44 Years | 60 (68.2%) | 0 (0.0%) |
| 45 to 54 Years | 16 (25.8%) | 0 (0.0%) |
| 55 to 59 Years | 10 (43.5%) | 4 (40.0%) |
| 60 to 64 Years | 13 (31.0%) | 0 (0.0%) |
| 65 to 74 Years | 20 (33.3%) | 0 (0.0%) |
| 75 Years and over | 0 (0.0%) | 0 (0.0%) |
| Total | 142 (39.2%) | 4 (2.8%) |
Employment Status by Educational Attainment in Rough Rock
According to labor force statistics for Rough Rock, 48.0% of individuals (122) out of the total population between 25 and 64 years of age (254) are in the labor force, with 3.3% or 4 of them being unemployed. The group with the highest labor force participation rate are those with the educational attainment of bachelor's degree or higher, with 100.0% or 18 individuals in the labor force. Within the labor force, individuals with college / associate degree education have the highest percentage of unemployment, with 4.4% or 4 of them being unemployed.
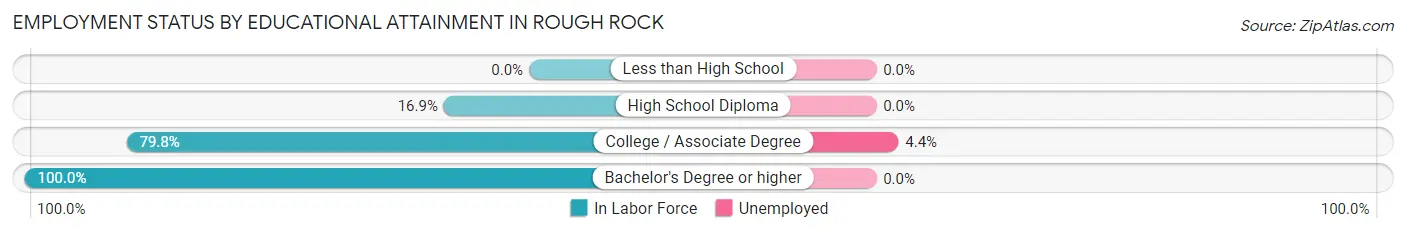
| Educational Attainment | In Labor Force | Unemployed |
| Less than High School | 0 (0.0%) | 0 (0.0%) |
| High School Diploma | 13 (16.9%) | 0 (0.0%) |
| College / Associate Degree | 91 (79.8%) | 5 (4.4%) |
| Bachelor's Degree or higher | 18 (100.0%) | 0 (0.0%) |
| Total | 122 (48.0%) | 8 (3.3%) |
Employment Occupations by Sex in Rough Rock
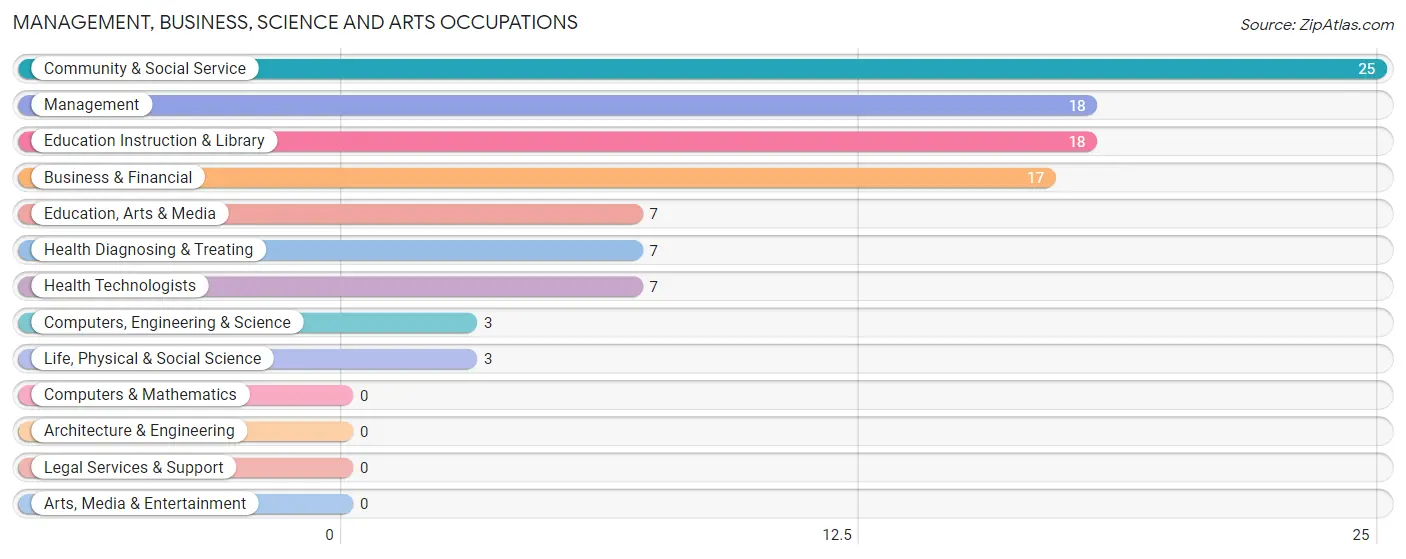
Management, Business, Science and Arts Occupations
The most common Management, Business, Science and Arts occupations in Rough Rock are Community & Social Service (25 | 18.1%), Management (18 | 13.0%), Education Instruction & Library (18 | 13.0%), Business & Financial (17 | 12.3%), and Education, Arts & Media (7 | 5.1%).
Management, Business, Science and Arts Occupations by Sex
Within the Management, Business, Science and Arts occupations in Rough Rock, the most male-oriented occupations are Business & Financial (100.0%), Computers, Engineering & Science (100.0%), and Life, Physical & Social Science (100.0%), while the most female-oriented occupations are Education, Arts & Media (100.0%), Health Diagnosing & Treating (100.0%), and Health Technologists (100.0%).
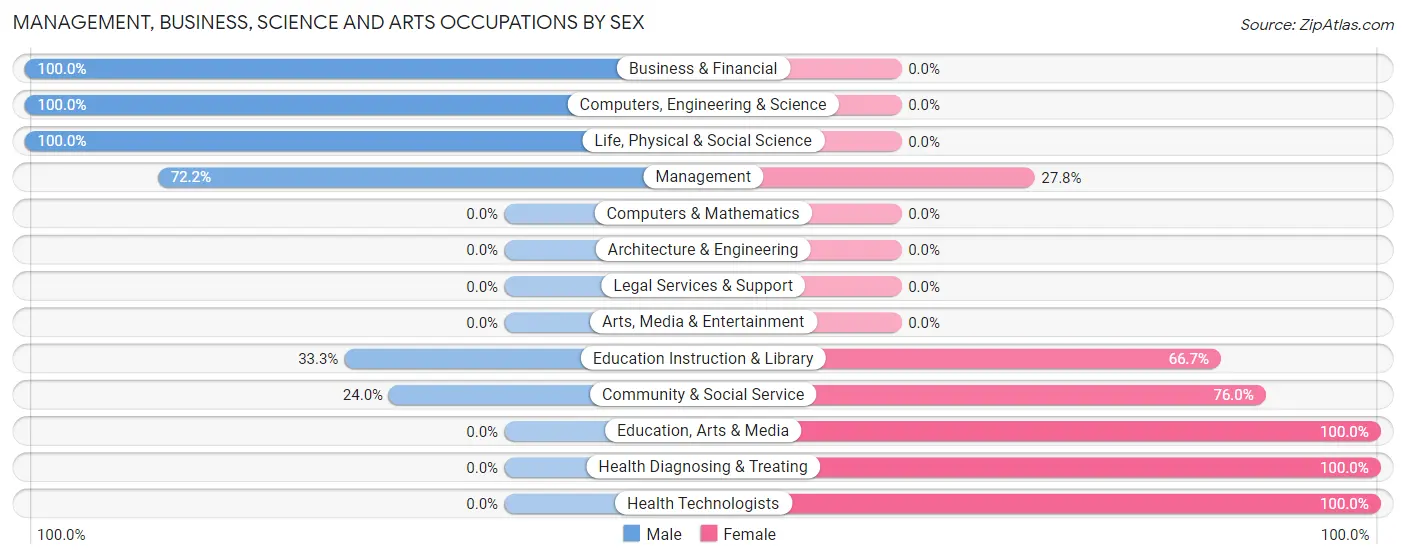
| Occupation | Male | Female |
| Management | 13 (72.2%) | 5 (27.8%) |
| Business & Financial | 17 (100.0%) | 0 (0.0%) |
| Computers, Engineering & Science | 3 (100.0%) | 0 (0.0%) |
| Computers & Mathematics | 0 (0.0%) | 0 (0.0%) |
| Architecture & Engineering | 0 (0.0%) | 0 (0.0%) |
| Life, Physical & Social Science | 3 (100.0%) | 0 (0.0%) |
| Community & Social Service | 6 (24.0%) | 19 (76.0%) |
| Education, Arts & Media | 0 (0.0%) | 7 (100.0%) |
| Legal Services & Support | 0 (0.0%) | 0 (0.0%) |
| Education Instruction & Library | 6 (33.3%) | 12 (66.7%) |
| Arts, Media & Entertainment | 0 (0.0%) | 0 (0.0%) |
| Health Diagnosing & Treating | 0 (0.0%) | 7 (100.0%) |
| Health Technologists | 0 (0.0%) | 7 (100.0%) |
| Total (Category) | 39 (55.7%) | 31 (44.3%) |
| Total (Overall) | 69 (50.0%) | 69 (50.0%) |
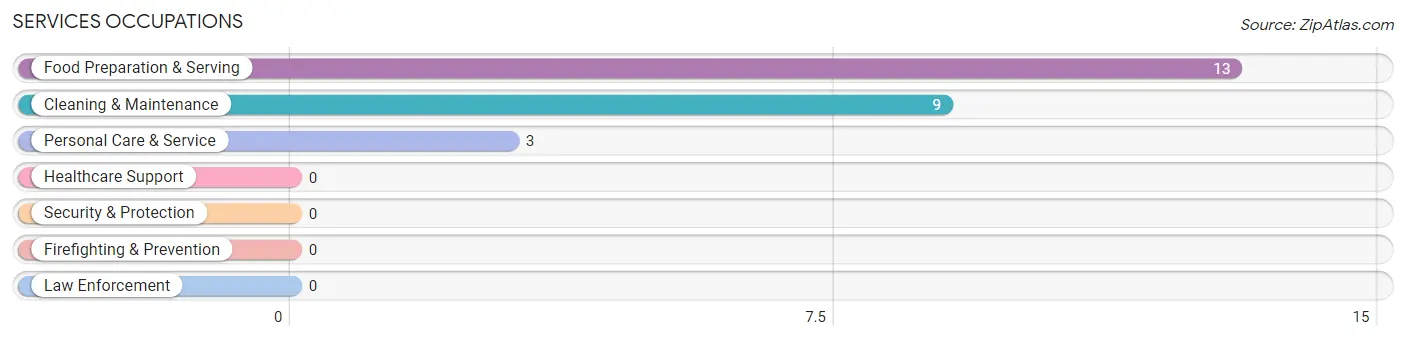
Services Occupations
The most common Services occupations in Rough Rock are Food Preparation & Serving (13 | 9.4%), Cleaning & Maintenance (9 | 6.5%), and Personal Care & Service (3 | 2.2%).
Services Occupations by Sex
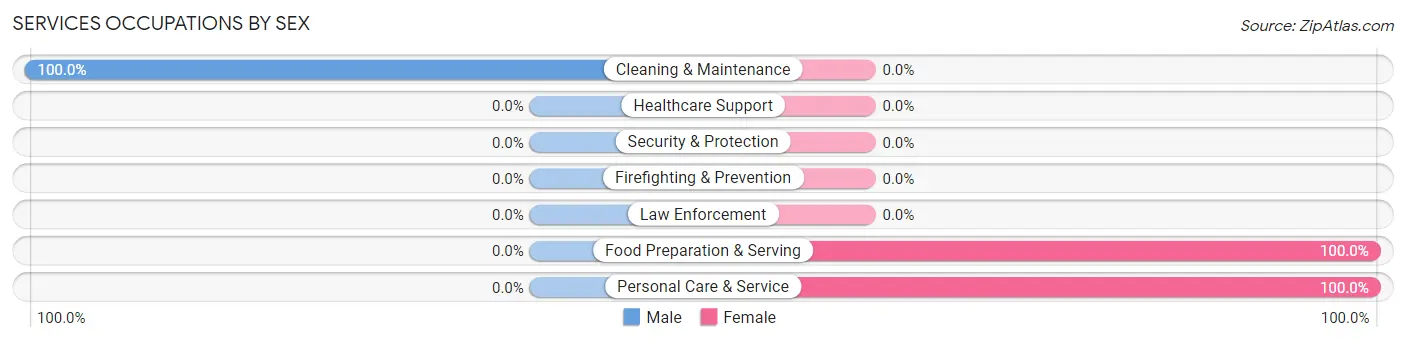
| Occupation | Male | Female |
| Healthcare Support | 0 (0.0%) | 0 (0.0%) |
| Security & Protection | 0 (0.0%) | 0 (0.0%) |
| Firefighting & Prevention | 0 (0.0%) | 0 (0.0%) |
| Law Enforcement | 0 (0.0%) | 0 (0.0%) |
| Food Preparation & Serving | 0 (0.0%) | 13 (100.0%) |
| Cleaning & Maintenance | 9 (100.0%) | 0 (0.0%) |
| Personal Care & Service | 0 (0.0%) | 3 (100.0%) |
| Total (Category) | 9 (36.0%) | 16 (64.0%) |
| Total (Overall) | 69 (50.0%) | 69 (50.0%) |
Sales and Office Occupations
The most common Sales and Office occupations in Rough Rock are , and Office & Administration (19 | 13.8%).
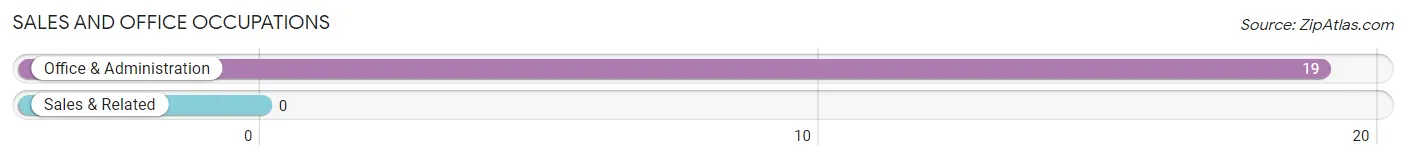
Sales and Office Occupations by Sex

| Occupation | Male | Female |
| Sales & Related | 0 (0.0%) | 0 (0.0%) |
| Office & Administration | 0 (0.0%) | 19 (100.0%) |
| Total (Category) | 0 (0.0%) | 19 (100.0%) |
| Total (Overall) | 69 (50.0%) | 69 (50.0%) |
Natural Resources, Construction and Maintenance Occupations
The most common Natural Resources, Construction and Maintenance occupations in Rough Rock are , and Construction & Extraction (4 | 2.9%).
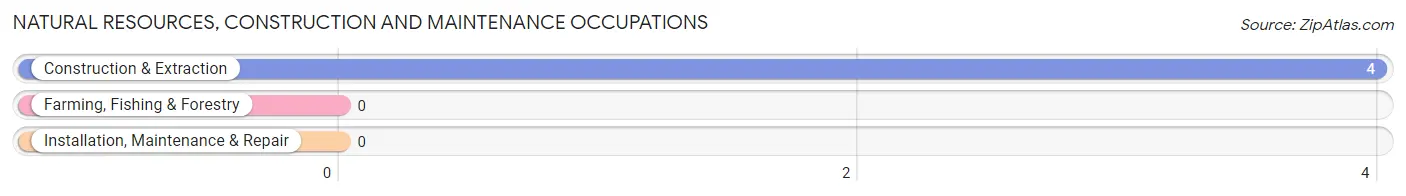
Natural Resources, Construction and Maintenance Occupations by Sex
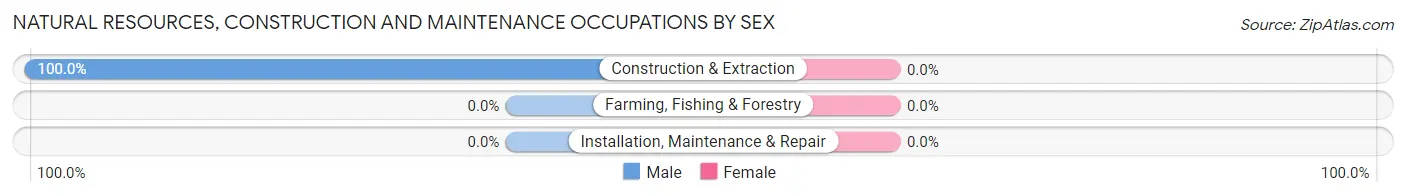
| Occupation | Male | Female |
| Farming, Fishing & Forestry | 0 (0.0%) | 0 (0.0%) |
| Construction & Extraction | 4 (100.0%) | 0 (0.0%) |
| Installation, Maintenance & Repair | 0 (0.0%) | 0 (0.0%) |
| Total (Category) | 4 (100.0%) | 0 (0.0%) |
| Total (Overall) | 69 (50.0%) | 69 (50.0%) |
Production, Transportation and Moving Occupations
The most common Production, Transportation and Moving occupations in Rough Rock are Material Moving (13 | 9.4%), Transportation (4 | 2.9%), and Production (3 | 2.2%).
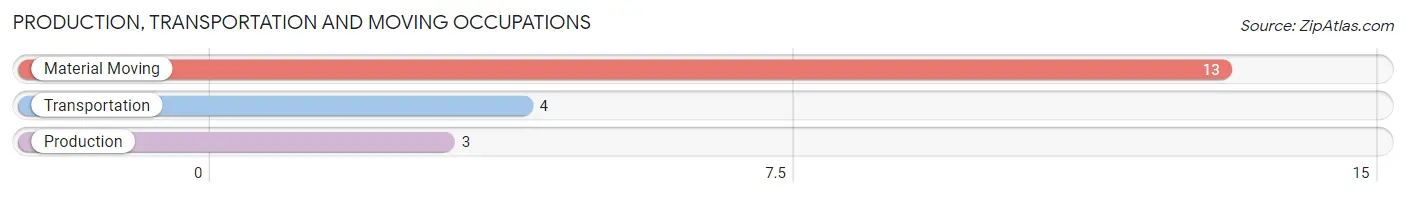
Production, Transportation and Moving Occupations by Sex
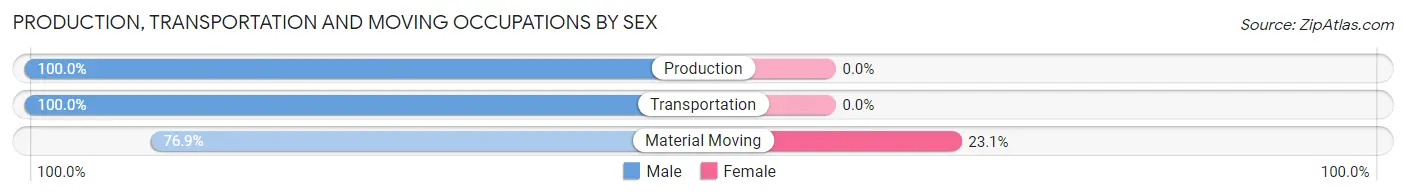
| Occupation | Male | Female |
| Production | 3 (100.0%) | 0 (0.0%) |
| Transportation | 4 (100.0%) | 0 (0.0%) |
| Material Moving | 10 (76.9%) | 3 (23.1%) |
| Total (Category) | 17 (85.0%) | 3 (15.0%) |
| Total (Overall) | 69 (50.0%) | 69 (50.0%) |
Employment Industries by Sex in Rough Rock
Employment Industries in Rough Rock
The major employment industries in Rough Rock include Educational Services (87 | 63.0%), Public Administration (17 | 12.3%), Accommodation & Food Services (13 | 9.4%), Health Care & Social Assistance (11 | 8.0%), and Manufacturing (10 | 7.2%).
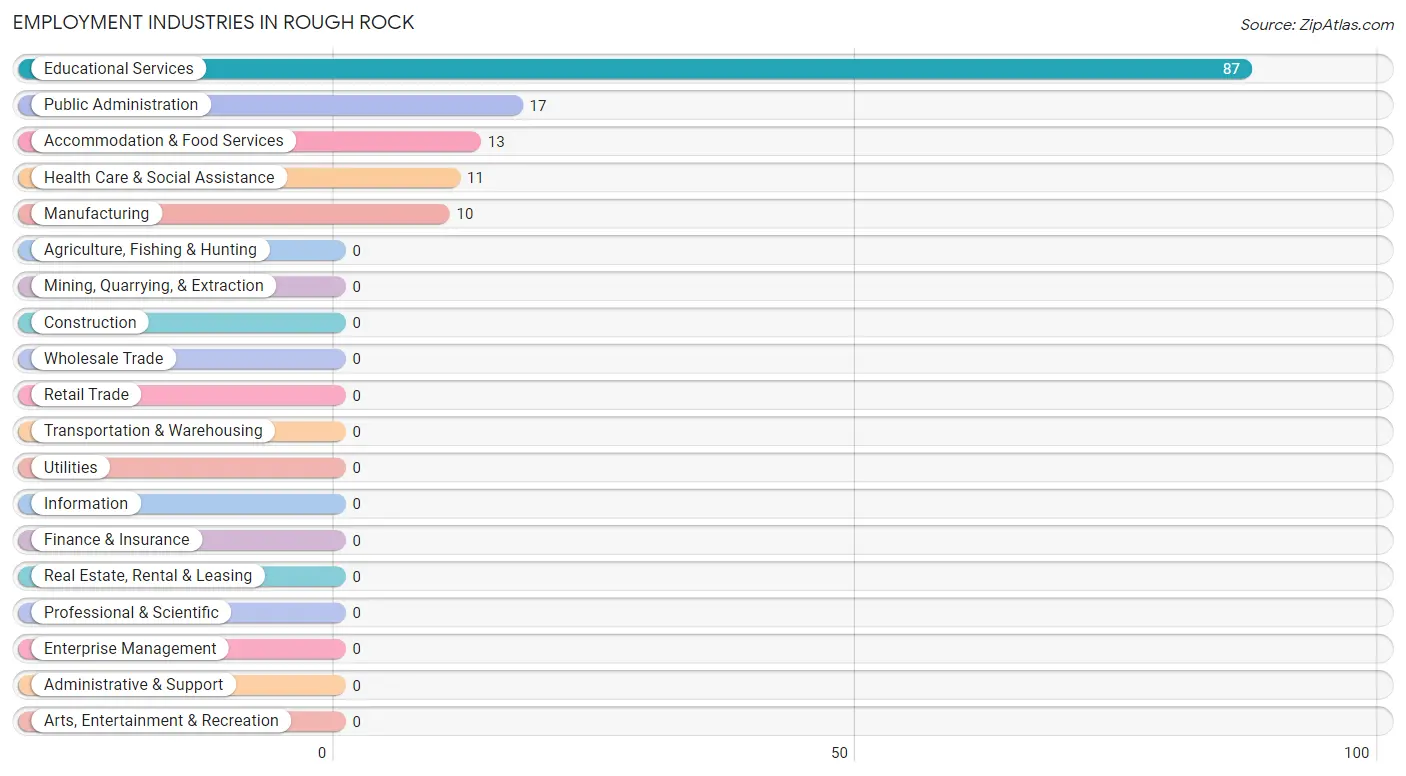
Employment Industries by Sex in Rough Rock
The Rough Rock industries that see more men than women are Manufacturing (100.0%), Accommodation & Food Services (100.0%), and Educational Services (49.4%), whereas the industries that tend to have a higher number of women are Health Care & Social Assistance (100.0%), Public Administration (82.4%), and Educational Services (50.6%).
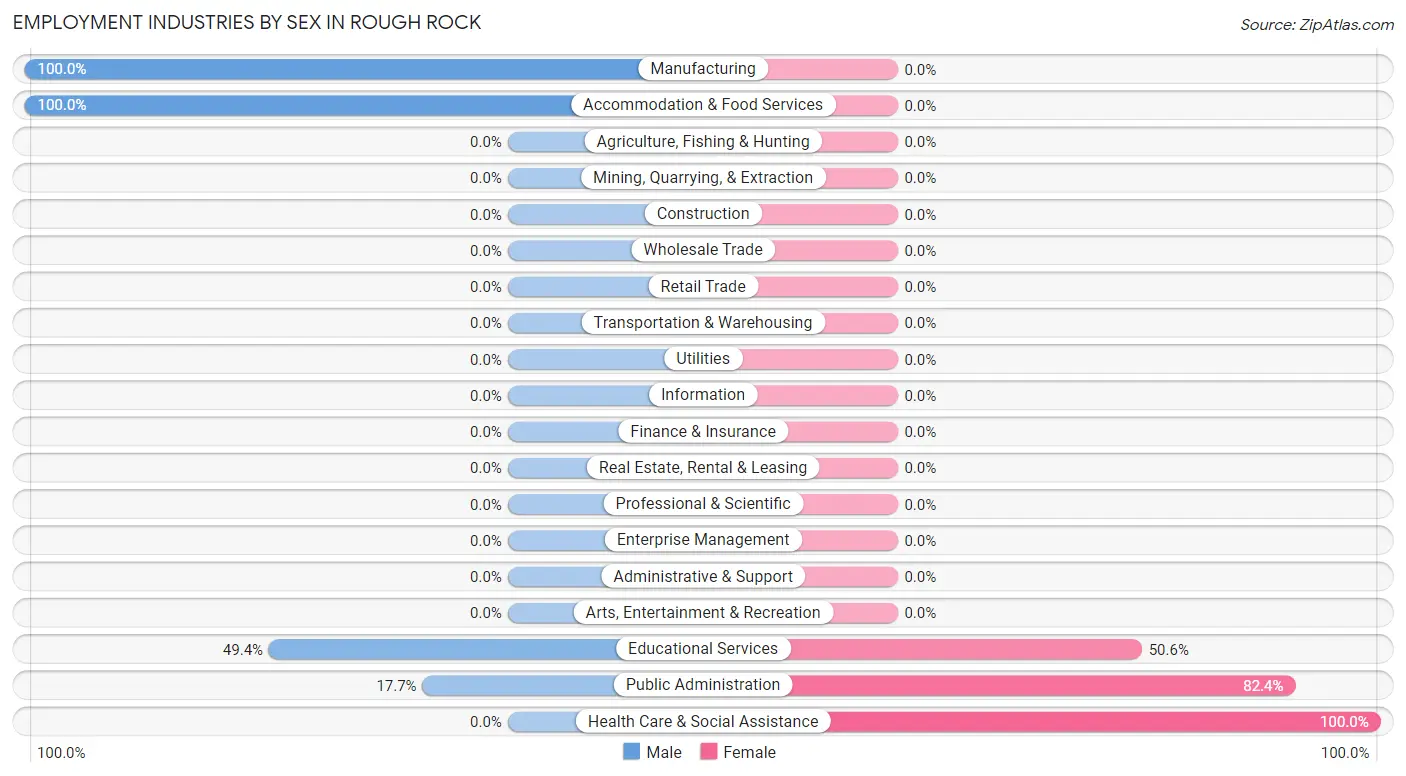
| Industry | Male | Female |
| Agriculture, Fishing & Hunting | 0 (0.0%) | 0 (0.0%) |
| Mining, Quarrying, & Extraction | 0 (0.0%) | 0 (0.0%) |
| Construction | 0 (0.0%) | 0 (0.0%) |
| Manufacturing | 10 (100.0%) | 0 (0.0%) |
| Wholesale Trade | 0 (0.0%) | 0 (0.0%) |
| Retail Trade | 0 (0.0%) | 0 (0.0%) |
| Transportation & Warehousing | 0 (0.0%) | 0 (0.0%) |
| Utilities | 0 (0.0%) | 0 (0.0%) |
| Information | 0 (0.0%) | 0 (0.0%) |
| Finance & Insurance | 0 (0.0%) | 0 (0.0%) |
| Real Estate, Rental & Leasing | 0 (0.0%) | 0 (0.0%) |
| Professional & Scientific | 0 (0.0%) | 0 (0.0%) |
| Enterprise Management | 0 (0.0%) | 0 (0.0%) |
| Administrative & Support | 0 (0.0%) | 0 (0.0%) |
| Educational Services | 43 (49.4%) | 44 (50.6%) |
| Health Care & Social Assistance | 0 (0.0%) | 11 (100.0%) |
| Arts, Entertainment & Recreation | 0 (0.0%) | 0 (0.0%) |
| Accommodation & Food Services | 13 (100.0%) | 0 (0.0%) |
| Public Administration | 3 (17.6%) | 14 (82.4%) |
| Total | 69 (50.0%) | 69 (50.0%) |
Education in Rough Rock
School Enrollment in Rough Rock
The most common levels of schooling among the 93 students in Rough Rock are high school (32 | 34.4%), college / undergraduate (24 | 25.8%), and middle school (21 | 22.6%).
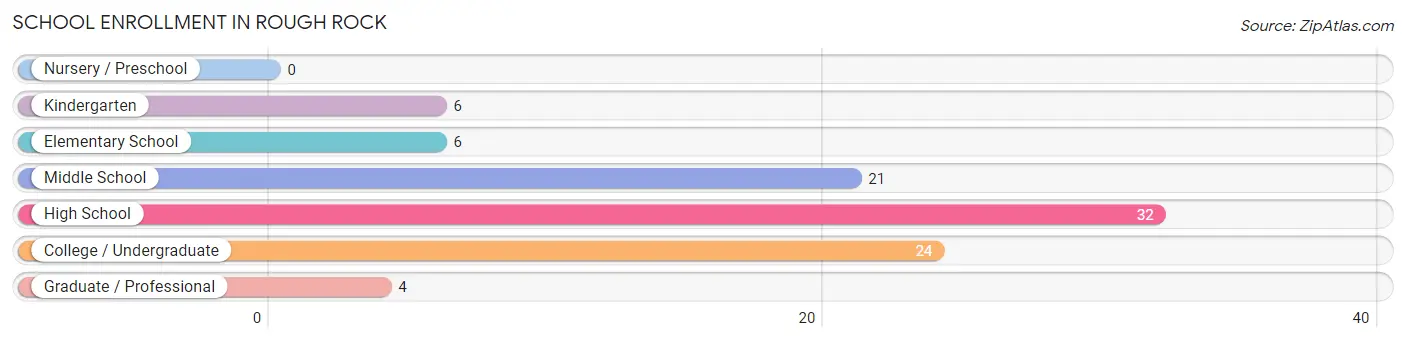
| School Level | # Students | % Students |
| Nursery / Preschool | 0 | 0.0% |
| Kindergarten | 6 | 6.5% |
| Elementary School | 6 | 6.5% |
| Middle School | 21 | 22.6% |
| High School | 32 | 34.4% |
| College / Undergraduate | 24 | 25.8% |
| Graduate / Professional | 4 | 4.3% |
| Total | 93 | 100.0% |
School Enrollment by Age by Funding Source in Rough Rock
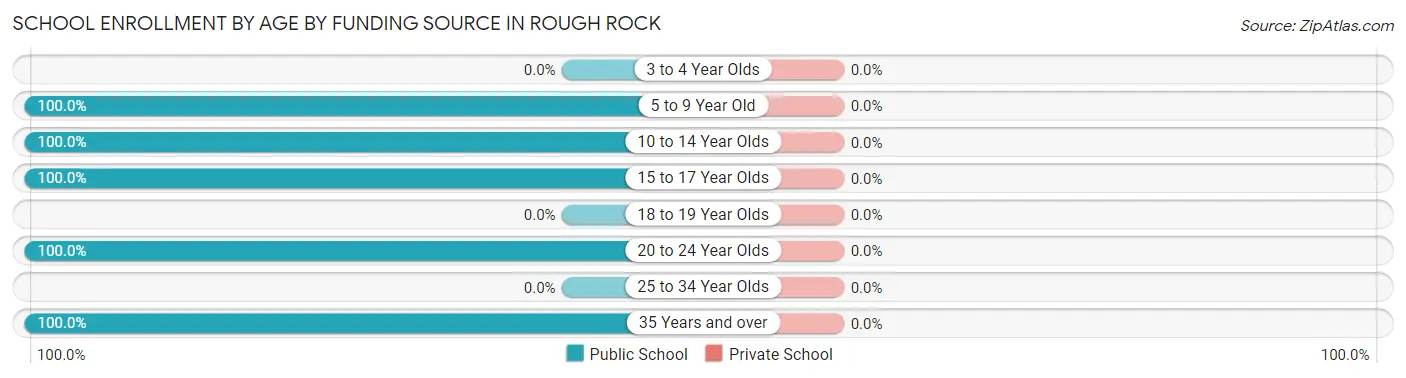
| Age Bracket | Public School | Private School |
| 3 to 4 Year Olds | 0 (0.0%) | 0 (0.0%) |
| 5 to 9 Year Old | 12 (100.0%) | 0 (0.0%) |
| 10 to 14 Year Olds | 26 (100.0%) | 0 (0.0%) |
| 15 to 17 Year Olds | 27 (100.0%) | 0 (0.0%) |
| 18 to 19 Year Olds | 0 (0.0%) | 0 (0.0%) |
| 20 to 24 Year Olds | 7 (100.0%) | 0 (0.0%) |
| 25 to 34 Year Olds | 0 (0.0%) | 0 (0.0%) |
| 35 Years and over | 21 (100.0%) | 0 (0.0%) |
| Total | 93 (100.0%) | 0 (0.0%) |
Educational Attainment by Field of Study in Rough Rock
Education (27 | 96.4%), and social sciences (1 | 3.6%) are the most common fields of study among 28 individuals in Rough Rock who have obtained a bachelor's degree or higher.
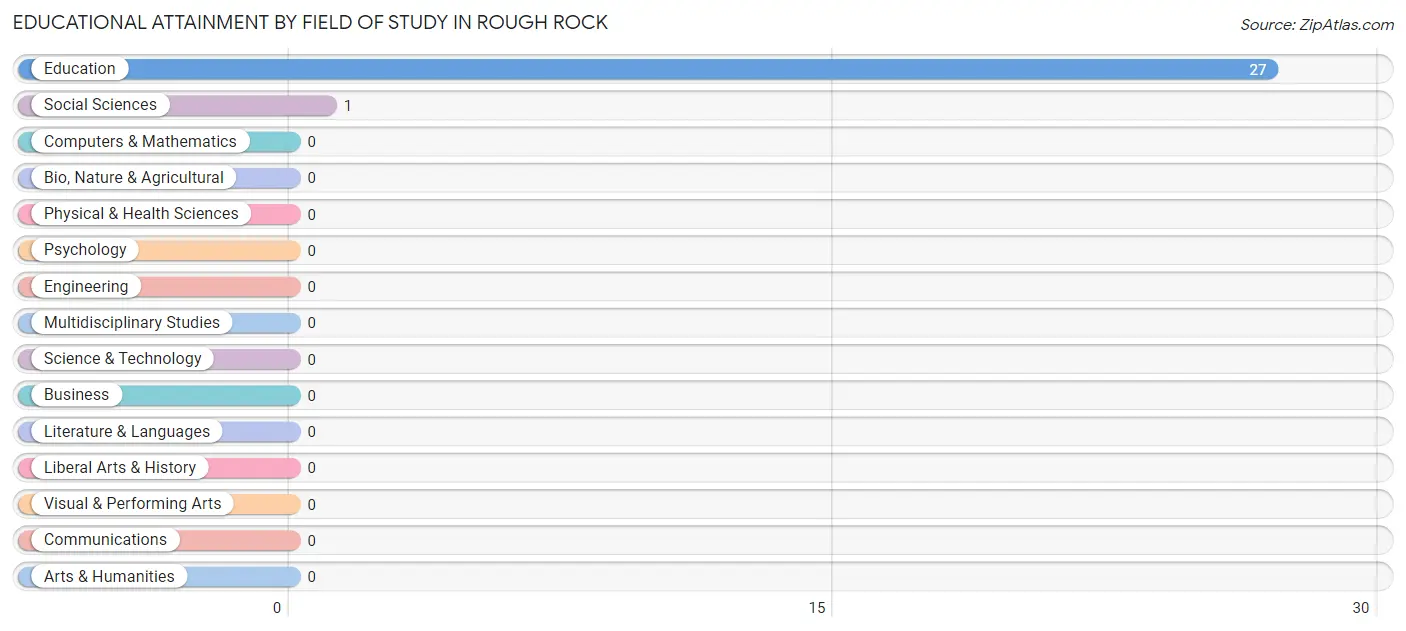
| Field of Study | # Graduates | % Graduates |
| Computers & Mathematics | 0 | 0.0% |
| Bio, Nature & Agricultural | 0 | 0.0% |
| Physical & Health Sciences | 0 | 0.0% |
| Psychology | 0 | 0.0% |
| Social Sciences | 1 | 3.6% |
| Engineering | 0 | 0.0% |
| Multidisciplinary Studies | 0 | 0.0% |
| Science & Technology | 0 | 0.0% |
| Business | 0 | 0.0% |
| Education | 27 | 96.4% |
| Literature & Languages | 0 | 0.0% |
| Liberal Arts & History | 0 | 0.0% |
| Visual & Performing Arts | 0 | 0.0% |
| Communications | 0 | 0.0% |
| Arts & Humanities | 0 | 0.0% |
| Total | 28 | 100.0% |
Transportation & Commute in Rough Rock
Vehicle Availability by Sex in Rough Rock
The most prevalent vehicle ownership categories in Rough Rock are males with 1 vehicle (35, accounting for 50.7%) and females with 1 vehicle (29, making up 55.6%).
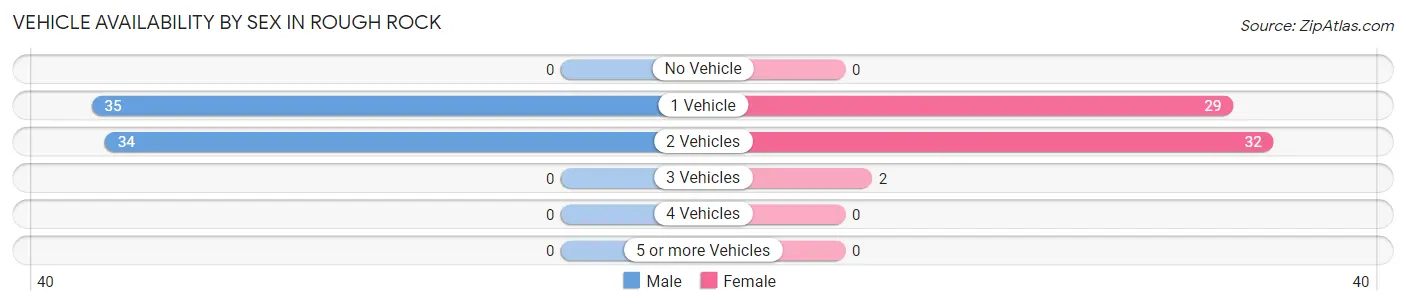
| Vehicles Available | Male | Female |
| No Vehicle | 0 (0.0%) | 0 (0.0%) |
| 1 Vehicle | 35 (50.7%) | 29 (46.0%) |
| 2 Vehicles | 34 (49.3%) | 32 (50.8%) |
| 3 Vehicles | 0 (0.0%) | 2 (3.2%) |
| 4 Vehicles | 0 (0.0%) | 0 (0.0%) |
| 5 or more Vehicles | 0 (0.0%) | 0 (0.0%) |
| Total | 69 (100.0%) | 63 (100.0%) |
Commute Time in Rough Rock
The most frequently occuring commute durations in Rough Rock are 5 to 9 minutes (76 commuters, 59.4%), 45 to 59 minutes (30 commuters, 23.4%), and 30 to 34 minutes (7 commuters, 5.5%).
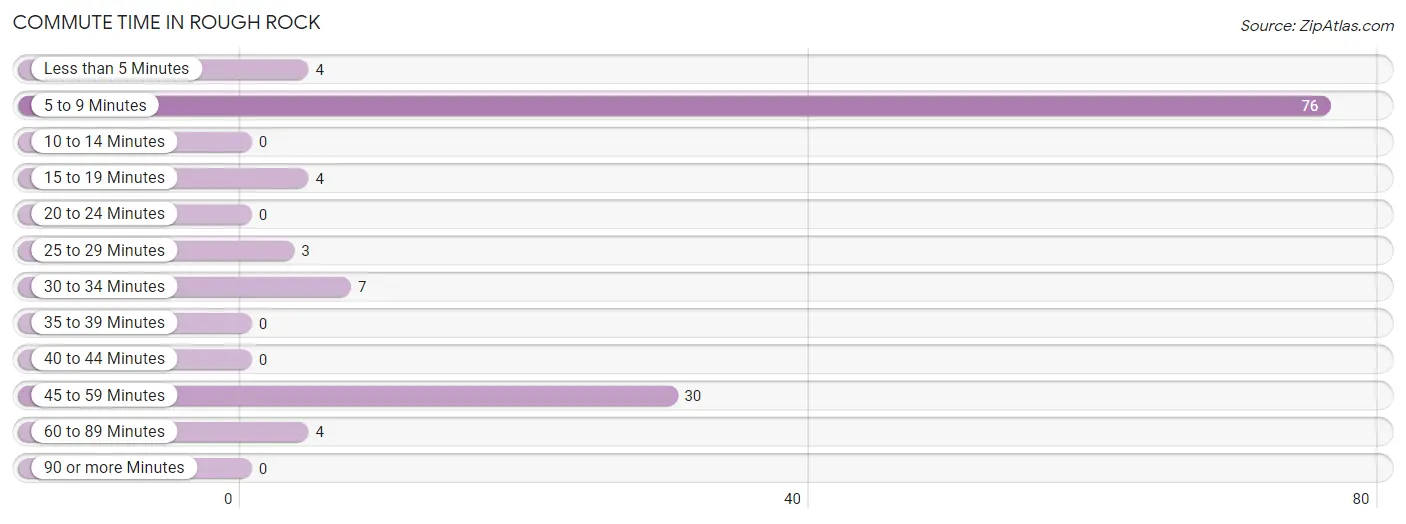
| Commute Time | # Commuters | % Commuters |
| Less than 5 Minutes | 4 | 3.1% |
| 5 to 9 Minutes | 76 | 59.4% |
| 10 to 14 Minutes | 0 | 0.0% |
| 15 to 19 Minutes | 4 | 3.1% |
| 20 to 24 Minutes | 0 | 0.0% |
| 25 to 29 Minutes | 3 | 2.3% |
| 30 to 34 Minutes | 7 | 5.5% |
| 35 to 39 Minutes | 0 | 0.0% |
| 40 to 44 Minutes | 0 | 0.0% |
| 45 to 59 Minutes | 30 | 23.4% |
| 60 to 89 Minutes | 4 | 3.1% |
| 90 or more Minutes | 0 | 0.0% |
Commute Time by Sex in Rough Rock
The most common commute times in Rough Rock are 5 to 9 minutes (39 commuters, 56.5%) for males and 5 to 9 minutes (37 commuters, 62.7%) for females.
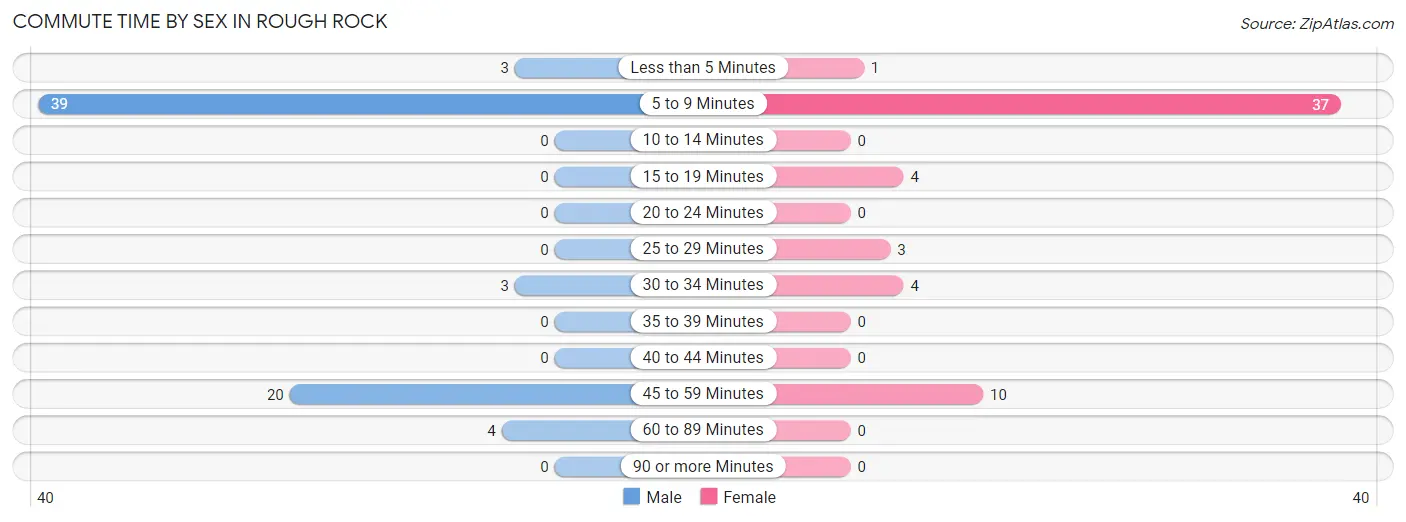
| Commute Time | Male | Female |
| Less than 5 Minutes | 3 (4.3%) | 1 (1.7%) |
| 5 to 9 Minutes | 39 (56.5%) | 37 (62.7%) |
| 10 to 14 Minutes | 0 (0.0%) | 0 (0.0%) |
| 15 to 19 Minutes | 0 (0.0%) | 4 (6.8%) |
| 20 to 24 Minutes | 0 (0.0%) | 0 (0.0%) |
| 25 to 29 Minutes | 0 (0.0%) | 3 (5.1%) |
| 30 to 34 Minutes | 3 (4.3%) | 4 (6.8%) |
| 35 to 39 Minutes | 0 (0.0%) | 0 (0.0%) |
| 40 to 44 Minutes | 0 (0.0%) | 0 (0.0%) |
| 45 to 59 Minutes | 20 (29.0%) | 10 (17.0%) |
| 60 to 89 Minutes | 4 (5.8%) | 0 (0.0%) |
| 90 or more Minutes | 0 (0.0%) | 0 (0.0%) |
Time of Departure to Work by Sex in Rough Rock
The most frequent times of departure to work in Rough Rock are 7:30 AM to 7:59 AM (42, 60.9%) for males and 7:30 AM to 7:59 AM (29, 49.1%) for females.
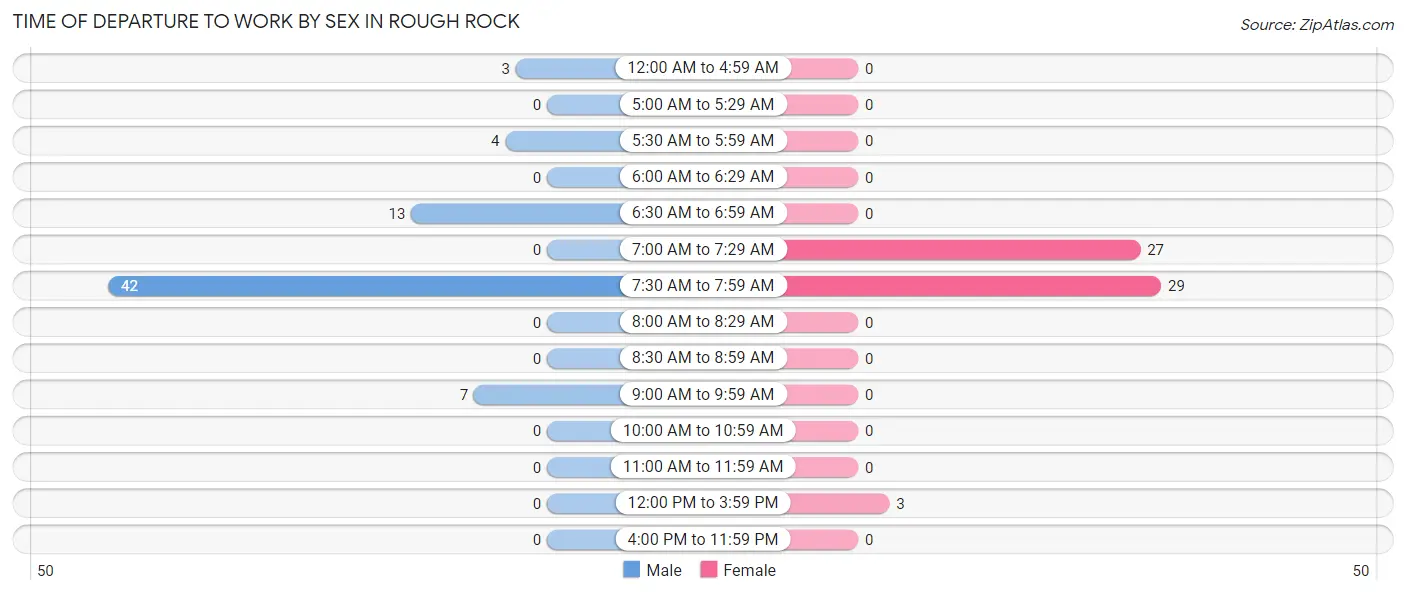
| Time of Departure | Male | Female |
| 12:00 AM to 4:59 AM | 3 (4.3%) | 0 (0.0%) |
| 5:00 AM to 5:29 AM | 0 (0.0%) | 0 (0.0%) |
| 5:30 AM to 5:59 AM | 4 (5.8%) | 0 (0.0%) |
| 6:00 AM to 6:29 AM | 0 (0.0%) | 0 (0.0%) |
| 6:30 AM to 6:59 AM | 13 (18.8%) | 0 (0.0%) |
| 7:00 AM to 7:29 AM | 0 (0.0%) | 27 (45.8%) |
| 7:30 AM to 7:59 AM | 42 (60.9%) | 29 (49.1%) |
| 8:00 AM to 8:29 AM | 0 (0.0%) | 0 (0.0%) |
| 8:30 AM to 8:59 AM | 0 (0.0%) | 0 (0.0%) |
| 9:00 AM to 9:59 AM | 7 (10.1%) | 0 (0.0%) |
| 10:00 AM to 10:59 AM | 0 (0.0%) | 0 (0.0%) |
| 11:00 AM to 11:59 AM | 0 (0.0%) | 0 (0.0%) |
| 12:00 PM to 3:59 PM | 0 (0.0%) | 3 (5.1%) |
| 4:00 PM to 11:59 PM | 0 (0.0%) | 0 (0.0%) |
| Total | 69 (100.0%) | 59 (100.0%) |
Housing Occupancy in Rough Rock
Occupancy by Ownership in Rough Rock
Of the total 195 dwellings in Rough Rock, owner-occupied units account for 130 (66.7%), while renter-occupied units make up 65 (33.3%).
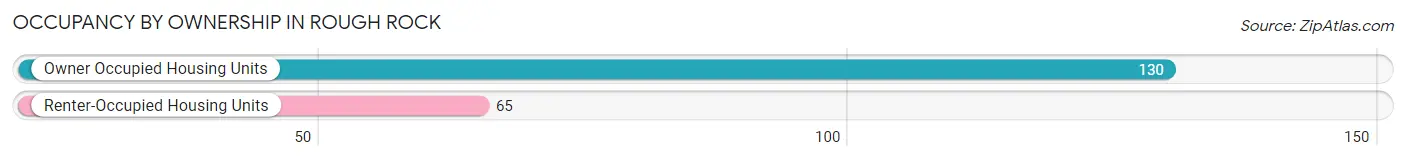
| Occupancy | # Housing Units | % Housing Units |
| Owner Occupied Housing Units | 130 | 66.7% |
| Renter-Occupied Housing Units | 65 | 33.3% |
| Total Occupied Housing Units | 195 | 100.0% |
Occupancy by Household Size in Rough Rock
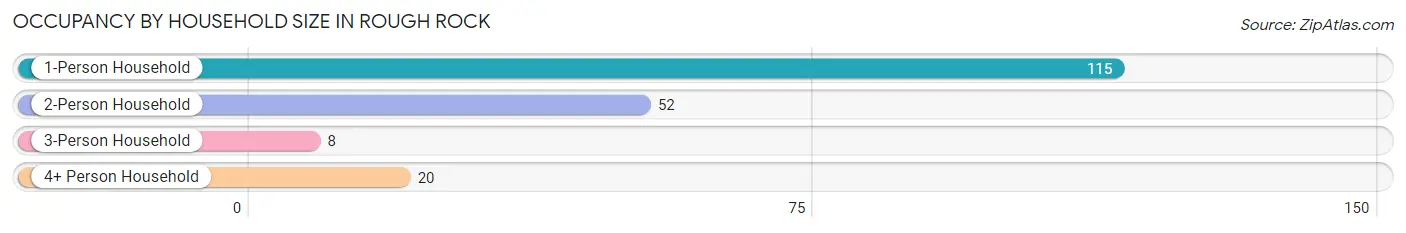
| Household Size | # Housing Units | % Housing Units |
| 1-Person Household | 115 | 59.0% |
| 2-Person Household | 52 | 26.7% |
| 3-Person Household | 8 | 4.1% |
| 4+ Person Household | 20 | 10.3% |
| Total Housing Units | 195 | 100.0% |
Occupancy by Ownership by Household Size in Rough Rock
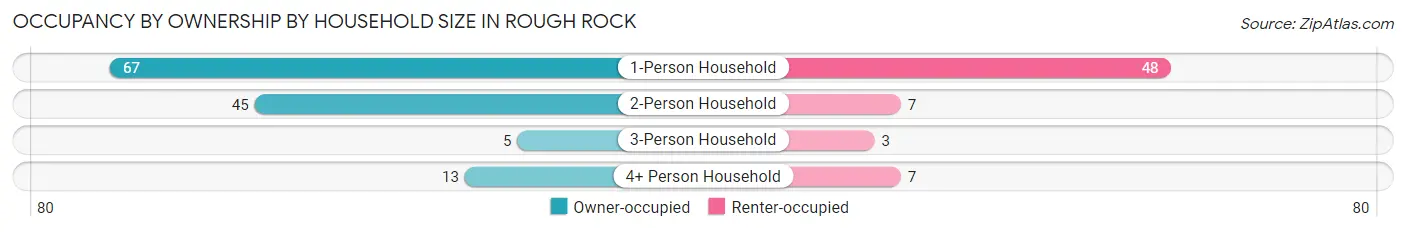
| Household Size | Owner-occupied | Renter-occupied |
| 1-Person Household | 67 (58.3%) | 48 (41.7%) |
| 2-Person Household | 45 (86.5%) | 7 (13.5%) |
| 3-Person Household | 5 (62.5%) | 3 (37.5%) |
| 4+ Person Household | 13 (65.0%) | 7 (35.0%) |
| Total Housing Units | 130 (66.7%) | 65 (33.3%) |
Occupancy by Educational Attainment in Rough Rock
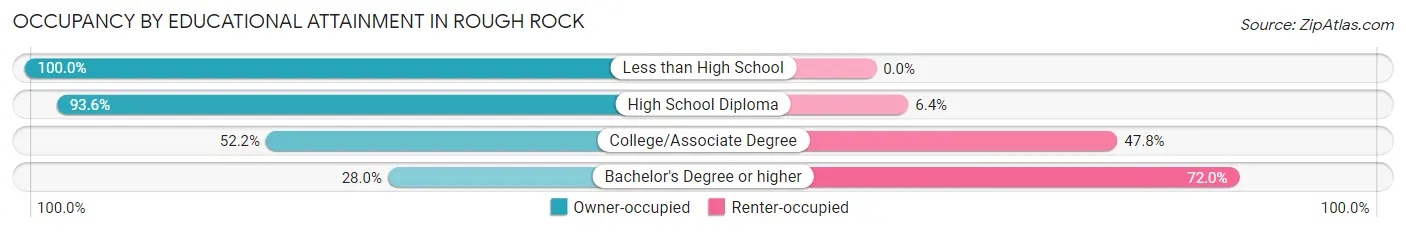
| Household Size | Owner-occupied | Renter-occupied |
| Less than High School | 31 (100.0%) | 0 (0.0%) |
| High School Diploma | 44 (93.6%) | 3 (6.4%) |
| College/Associate Degree | 48 (52.2%) | 44 (47.8%) |
| Bachelor's Degree or higher | 7 (28.0%) | 18 (72.0%) |
Occupancy by Age of Householder in Rough Rock
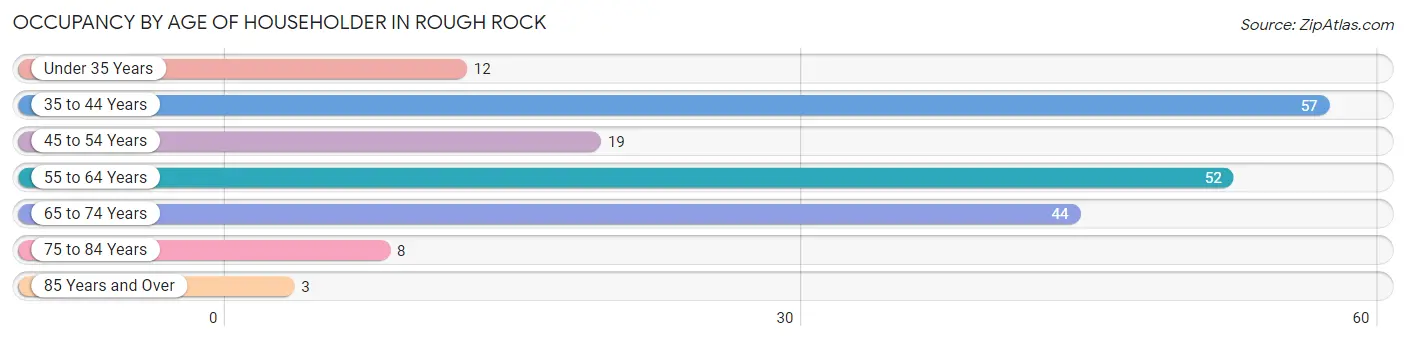
| Age Bracket | # Households | % Households |
| Under 35 Years | 12 | 6.1% |
| 35 to 44 Years | 57 | 29.2% |
| 45 to 54 Years | 19 | 9.7% |
| 55 to 64 Years | 52 | 26.7% |
| 65 to 74 Years | 44 | 22.6% |
| 75 to 84 Years | 8 | 4.1% |
| 85 Years and Over | 3 | 1.5% |
| Total | 195 | 100.0% |
Housing Finances in Rough Rock
Median Income by Occupancy in Rough Rock
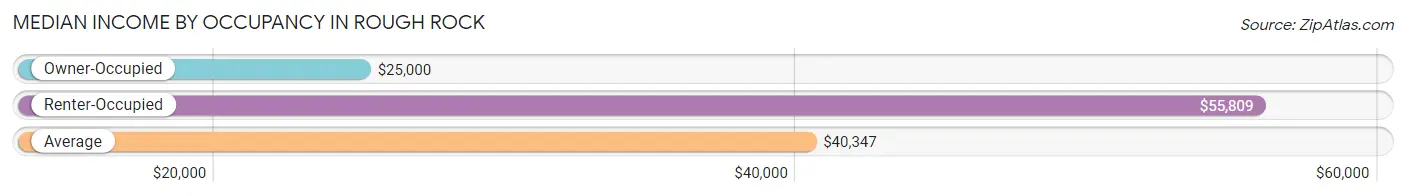
| Occupancy Type | # Households | Median Income |
| Owner-Occupied | 130 (66.7%) | $25,000 |
| Renter-Occupied | 65 (33.3%) | $55,809 |
| Average | 195 (100.0%) | $40,347 |
Occupancy by Householder Income Bracket in Rough Rock
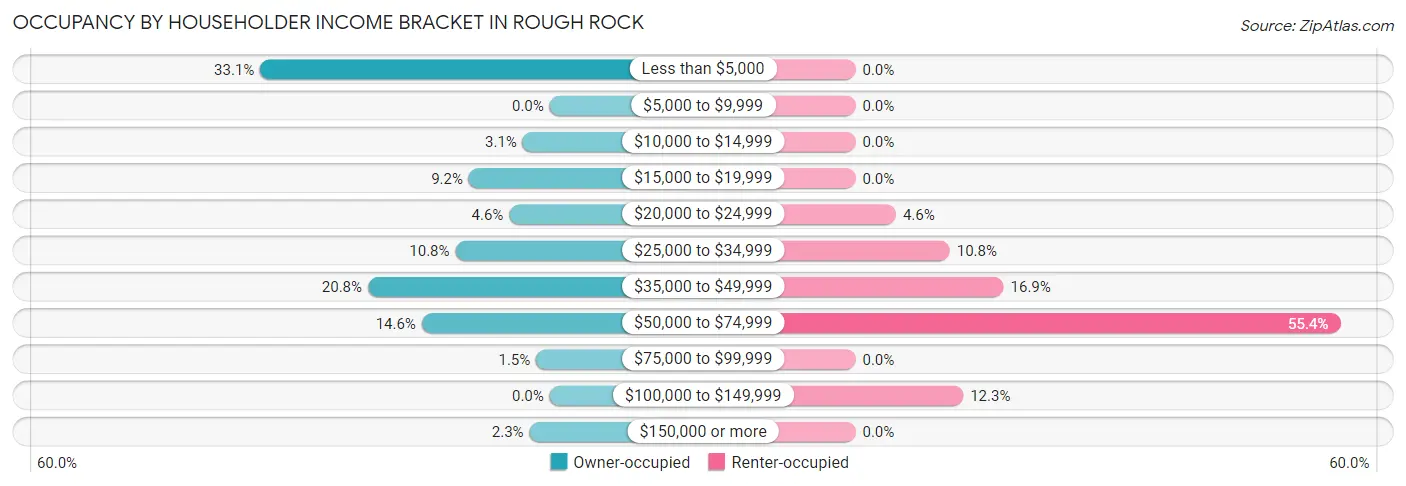
| Income Bracket | Owner-occupied | Renter-occupied |
| Less than $5,000 | 43 (33.1%) | 0 (0.0%) |
| $5,000 to $9,999 | 0 (0.0%) | 0 (0.0%) |
| $10,000 to $14,999 | 4 (3.1%) | 0 (0.0%) |
| $15,000 to $19,999 | 12 (9.2%) | 0 (0.0%) |
| $20,000 to $24,999 | 6 (4.6%) | 3 (4.6%) |
| $25,000 to $34,999 | 14 (10.8%) | 7 (10.8%) |
| $35,000 to $49,999 | 27 (20.8%) | 11 (16.9%) |
| $50,000 to $74,999 | 19 (14.6%) | 36 (55.4%) |
| $75,000 to $99,999 | 2 (1.5%) | 0 (0.0%) |
| $100,000 to $149,999 | 0 (0.0%) | 8 (12.3%) |
| $150,000 or more | 3 (2.3%) | 0 (0.0%) |
| Total | 130 (100.0%) | 65 (100.0%) |
Monthly Housing Cost Tiers in Rough Rock
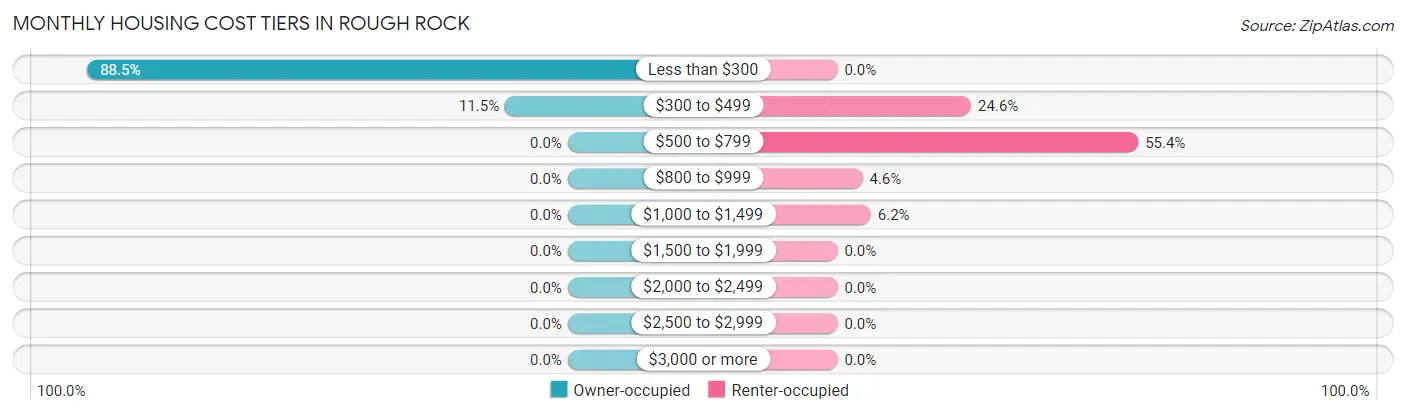
| Monthly Cost | Owner-occupied | Renter-occupied |
| Less than $300 | 115 (88.5%) | 0 (0.0%) |
| $300 to $499 | 15 (11.5%) | 16 (24.6%) |
| $500 to $799 | 0 (0.0%) | 36 (55.4%) |
| $800 to $999 | 0 (0.0%) | 3 (4.6%) |
| $1,000 to $1,499 | 0 (0.0%) | 4 (6.1%) |
| $1,500 to $1,999 | 0 (0.0%) | 0 (0.0%) |
| $2,000 to $2,499 | 0 (0.0%) | 0 (0.0%) |
| $2,500 to $2,999 | 0 (0.0%) | 0 (0.0%) |
| $3,000 or more | 0 (0.0%) | 0 (0.0%) |
| Total | 130 (100.0%) | 65 (100.0%) |
Physical Housing Characteristics in Rough Rock
Housing Structures in Rough Rock
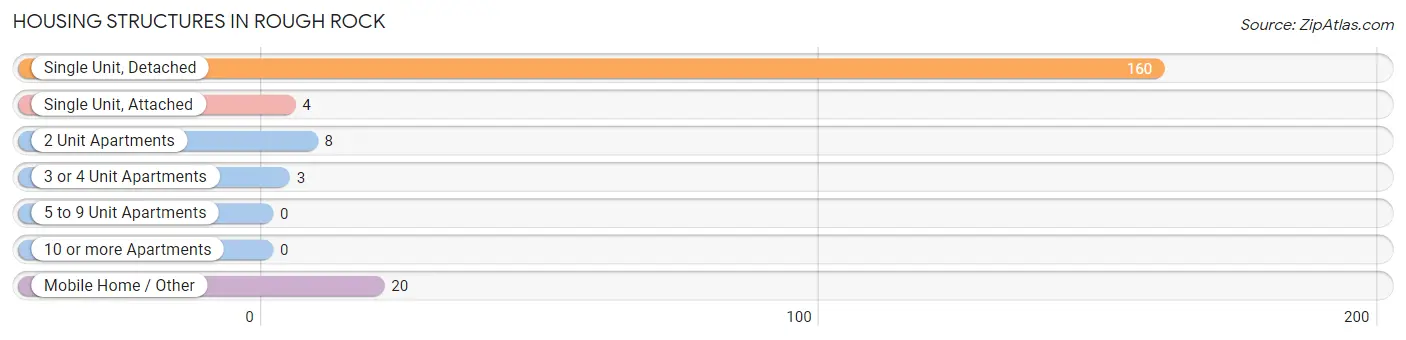
| Structure Type | # Housing Units | % Housing Units |
| Single Unit, Detached | 160 | 82.1% |
| Single Unit, Attached | 4 | 2.1% |
| 2 Unit Apartments | 8 | 4.1% |
| 3 or 4 Unit Apartments | 3 | 1.5% |
| 5 to 9 Unit Apartments | 0 | 0.0% |
| 10 or more Apartments | 0 | 0.0% |
| Mobile Home / Other | 20 | 10.3% |
| Total | 195 | 100.0% |
Housing Structures by Occupancy in Rough Rock
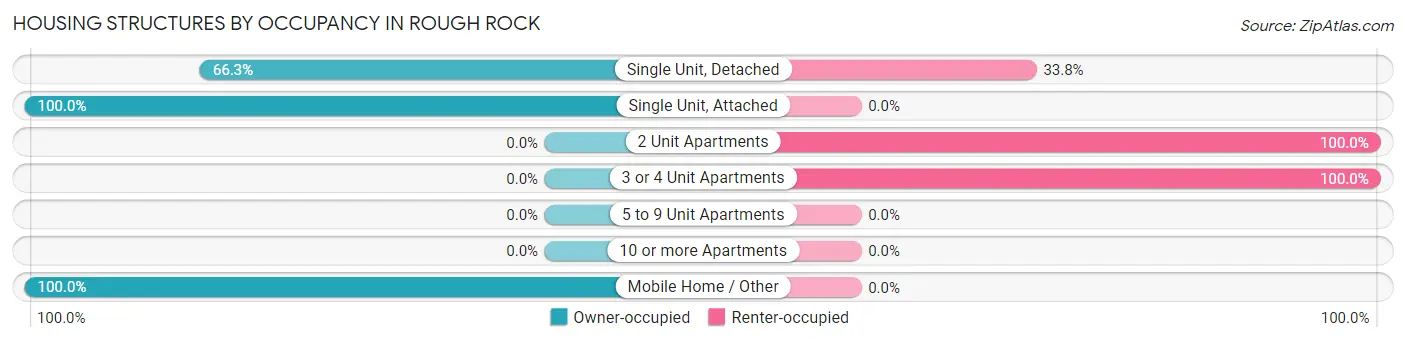
| Structure Type | Owner-occupied | Renter-occupied |
| Single Unit, Detached | 106 (66.2%) | 54 (33.8%) |
| Single Unit, Attached | 4 (100.0%) | 0 (0.0%) |
| 2 Unit Apartments | 0 (0.0%) | 8 (100.0%) |
| 3 or 4 Unit Apartments | 0 (0.0%) | 3 (100.0%) |
| 5 to 9 Unit Apartments | 0 (0.0%) | 0 (0.0%) |
| 10 or more Apartments | 0 (0.0%) | 0 (0.0%) |
| Mobile Home / Other | 20 (100.0%) | 0 (0.0%) |
| Total | 130 (66.7%) | 65 (33.3%) |
Housing Structures by Number of Rooms in Rough Rock
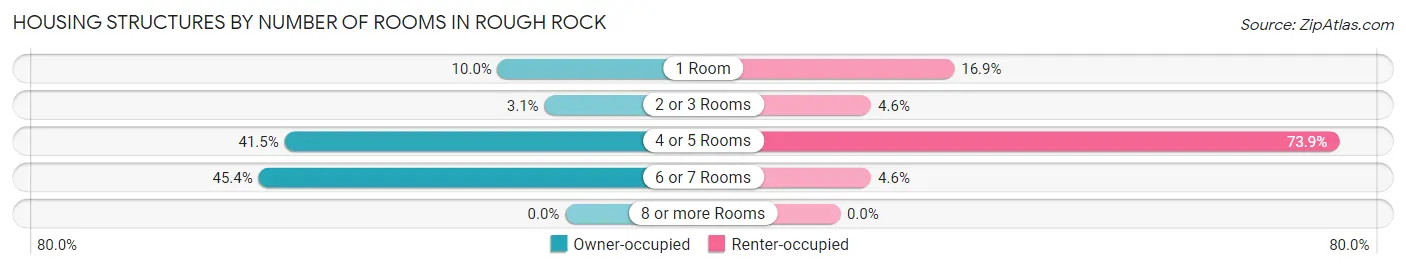
| Number of Rooms | Owner-occupied | Renter-occupied |
| 1 Room | 13 (10.0%) | 11 (16.9%) |
| 2 or 3 Rooms | 4 (3.1%) | 3 (4.6%) |
| 4 or 5 Rooms | 54 (41.5%) | 48 (73.9%) |
| 6 or 7 Rooms | 59 (45.4%) | 3 (4.6%) |
| 8 or more Rooms | 0 (0.0%) | 0 (0.0%) |
| Total | 130 (100.0%) | 65 (100.0%) |
Housing Structure by Heating Type in Rough Rock
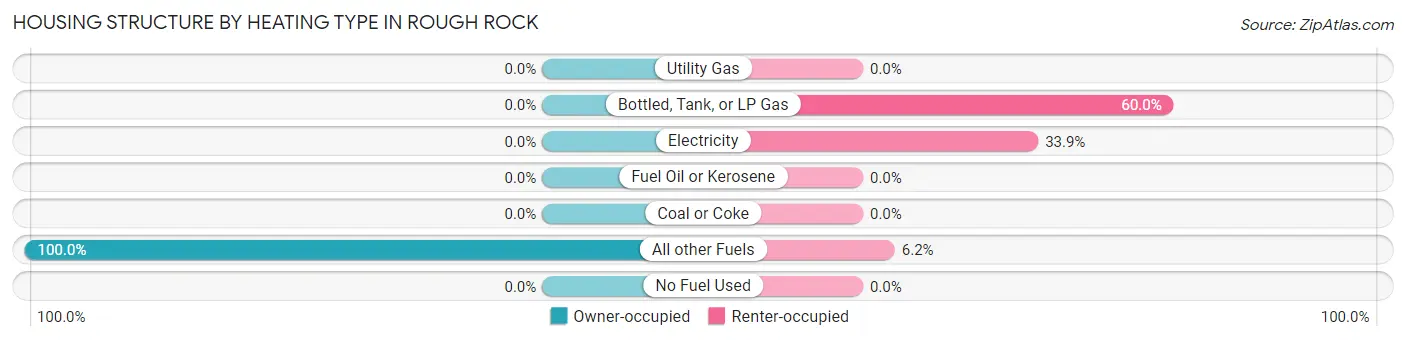
| Heating Type | Owner-occupied | Renter-occupied |
| Utility Gas | 0 (0.0%) | 0 (0.0%) |
| Bottled, Tank, or LP Gas | 0 (0.0%) | 39 (60.0%) |
| Electricity | 0 (0.0%) | 22 (33.9%) |
| Fuel Oil or Kerosene | 0 (0.0%) | 0 (0.0%) |
| Coal or Coke | 0 (0.0%) | 0 (0.0%) |
| All other Fuels | 130 (100.0%) | 4 (6.1%) |
| No Fuel Used | 0 (0.0%) | 0 (0.0%) |
| Total | 130 (100.0%) | 65 (100.0%) |
Household Vehicle Usage in Rough Rock
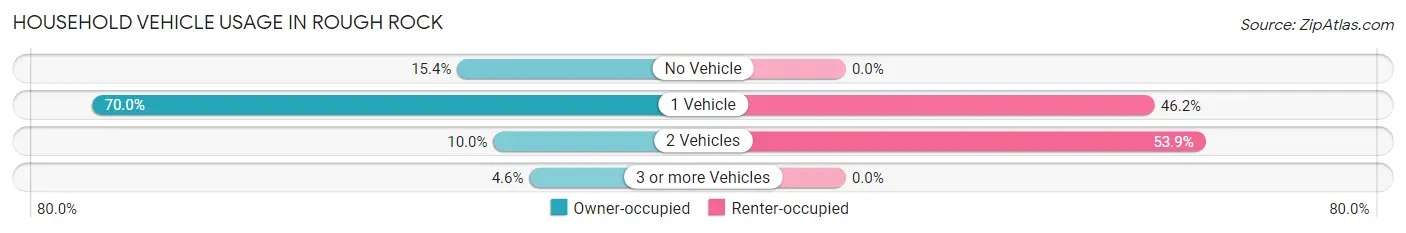
| Vehicles per Household | Owner-occupied | Renter-occupied |
| No Vehicle | 20 (15.4%) | 0 (0.0%) |
| 1 Vehicle | 91 (70.0%) | 30 (46.2%) |
| 2 Vehicles | 13 (10.0%) | 35 (53.8%) |
| 3 or more Vehicles | 6 (4.6%) | 0 (0.0%) |
| Total | 130 (100.0%) | 65 (100.0%) |
Real Estate & Mortgages in Rough Rock
Real Estate and Mortgage Overview in Rough Rock
| Characteristic | Without Mortgage | With Mortgage |
| Housing Units | 130 | 0 |
| Median Property Value | $43,300 | $0 |
| Median Household Income | $25,000 | $0 |
| Monthly Housing Costs | $199 | $0 |
| Real Estate Taxes | - | - |
Property Value by Mortgage Status in Rough Rock
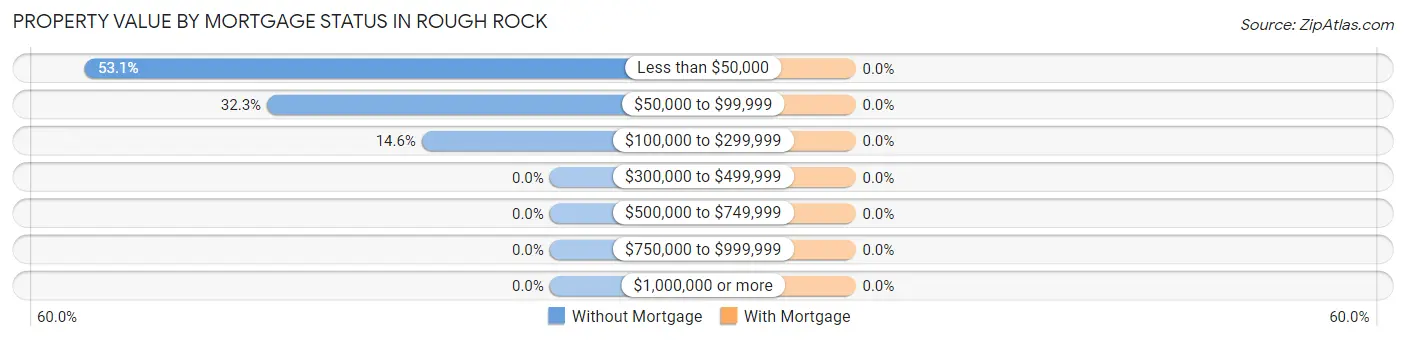
| Property Value | Without Mortgage | With Mortgage |
| Less than $50,000 | 69 (53.1%) | 0 (0.0%) |
| $50,000 to $99,999 | 42 (32.3%) | 0 (0.0%) |
| $100,000 to $299,999 | 19 (14.6%) | 0 (0.0%) |
| $300,000 to $499,999 | 0 (0.0%) | 0 (0.0%) |
| $500,000 to $749,999 | 0 (0.0%) | 0 (0.0%) |
| $750,000 to $999,999 | 0 (0.0%) | 0 (0.0%) |
| $1,000,000 or more | 0 (0.0%) | 0 (0.0%) |
| Total | 130 (100.0%) | 0 (0.0%) |
Household Income by Mortgage Status in Rough Rock
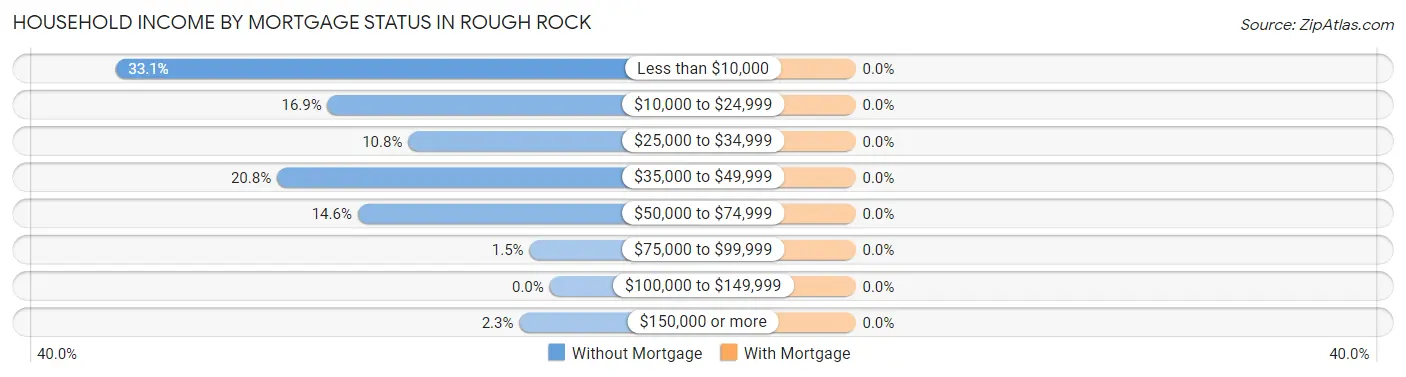
| Household Income | Without Mortgage | With Mortgage |
| Less than $10,000 | 43 (33.1%) | 0 (0.0%) |
| $10,000 to $24,999 | 22 (16.9%) | 0 (0.0%) |
| $25,000 to $34,999 | 14 (10.8%) | 0 (0.0%) |
| $35,000 to $49,999 | 27 (20.8%) | 0 (0.0%) |
| $50,000 to $74,999 | 19 (14.6%) | 0 (0.0%) |
| $75,000 to $99,999 | 2 (1.5%) | 0 (0.0%) |
| $100,000 to $149,999 | 0 (0.0%) | 0 (0.0%) |
| $150,000 or more | 3 (2.3%) | 0 (0.0%) |
| Total | 130 (100.0%) | 0 (0.0%) |
Property Value to Household Income Ratio in Rough Rock
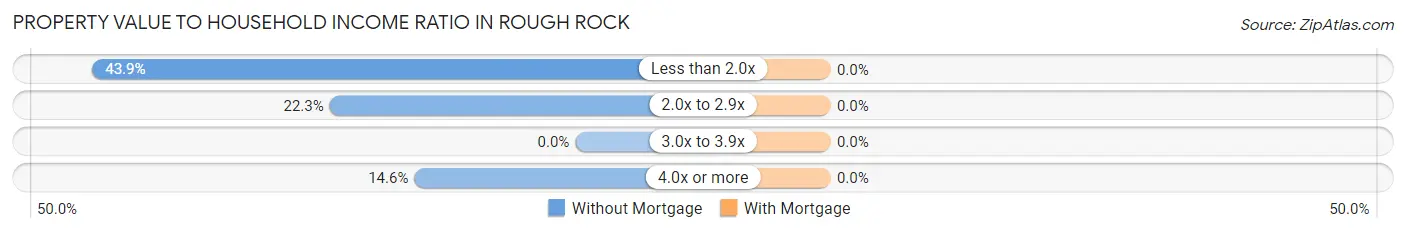
| Value-to-Income Ratio | Without Mortgage | With Mortgage |
| Less than 2.0x | 57 (43.9%) | 0 (0.0%) |
| 2.0x to 2.9x | 29 (22.3%) | 0 (0.0%) |
| 3.0x to 3.9x | 0 (0.0%) | 0 (0.0%) |
| 4.0x or more | 19 (14.6%) | 0 (0.0%) |
| Total | 130 (100.0%) | 0 (0.0%) |
Real Estate Taxes by Mortgage Status in Rough Rock
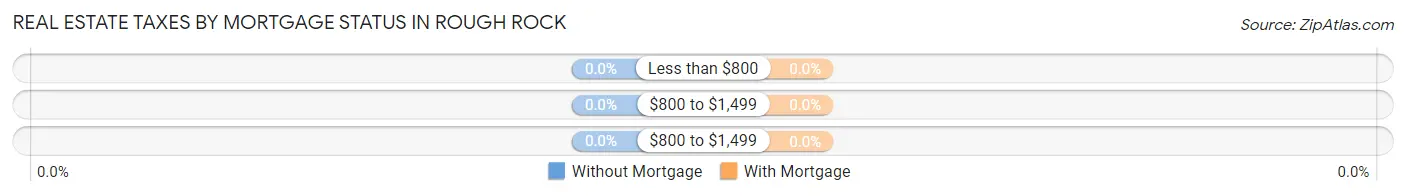
| Property Taxes | Without Mortgage | With Mortgage |
| Less than $800 | 0 (0.0%) | 0 (0.0%) |
| $800 to $1,499 | 0 (0.0%) | 0 (0.0%) |
| $800 to $1,499 | 0 (0.0%) | 0 (0.0%) |
| Total | 130 (100.0%) | 0 (0.0%) |
Health & Disability in Rough Rock
Health Insurance Coverage by Age in Rough Rock
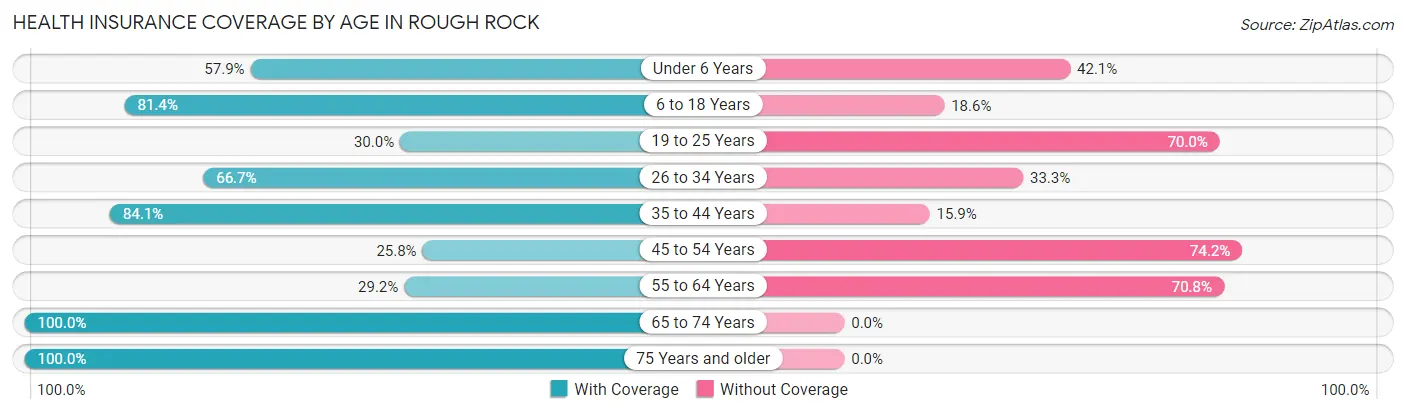
| Age Bracket | With Coverage | Without Coverage |
| Under 6 Years | 11 (57.9%) | 8 (42.1%) |
| 6 to 18 Years | 48 (81.4%) | 11 (18.6%) |
| 19 to 25 Years | 6 (30.0%) | 14 (70.0%) |
| 26 to 34 Years | 26 (66.7%) | 13 (33.3%) |
| 35 to 44 Years | 74 (84.1%) | 14 (15.9%) |
| 45 to 54 Years | 16 (25.8%) | 46 (74.2%) |
| 55 to 64 Years | 19 (29.2%) | 46 (70.8%) |
| 65 to 74 Years | 60 (100.0%) | 0 (0.0%) |
| 75 Years and older | 11 (100.0%) | 0 (0.0%) |
| Total | 271 (64.1%) | 152 (35.9%) |
Health Insurance Coverage by Citizenship Status in Rough Rock
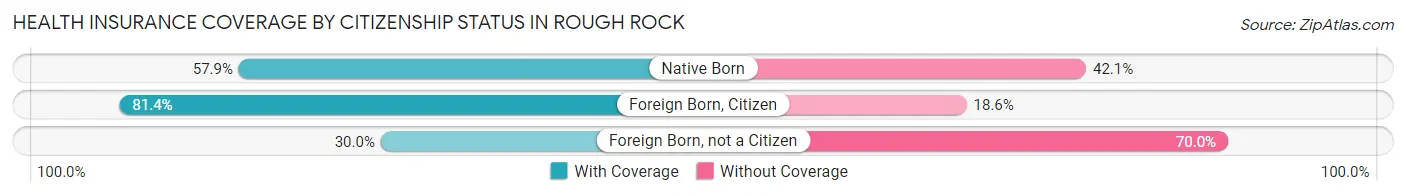
| Citizenship Status | With Coverage | Without Coverage |
| Native Born | 11 (57.9%) | 8 (42.1%) |
| Foreign Born, Citizen | 48 (81.4%) | 11 (18.6%) |
| Foreign Born, not a Citizen | 6 (30.0%) | 14 (70.0%) |
Health Insurance Coverage by Household Income in Rough Rock
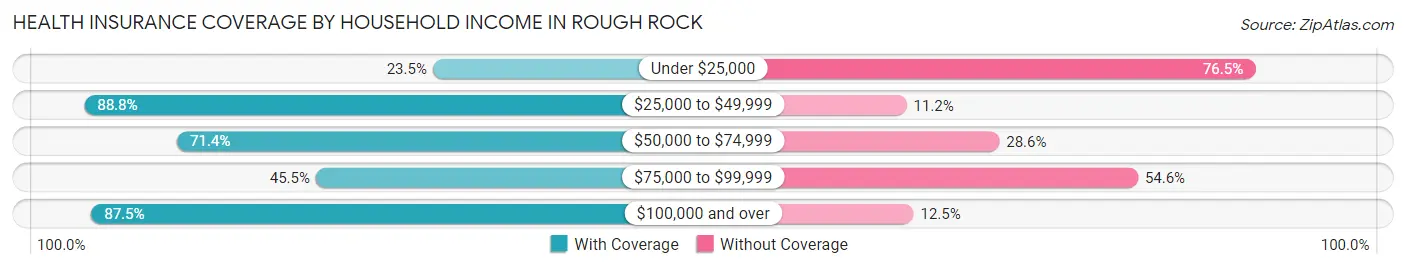
| Household Income | With Coverage | Without Coverage |
| Under $25,000 | 28 (23.5%) | 91 (76.5%) |
| $25,000 to $49,999 | 127 (88.8%) | 16 (11.2%) |
| $50,000 to $74,999 | 90 (71.4%) | 36 (28.6%) |
| $75,000 to $99,999 | 5 (45.5%) | 6 (54.5%) |
| $100,000 and over | 21 (87.5%) | 3 (12.5%) |
Public vs Private Health Insurance Coverage by Age in Rough Rock
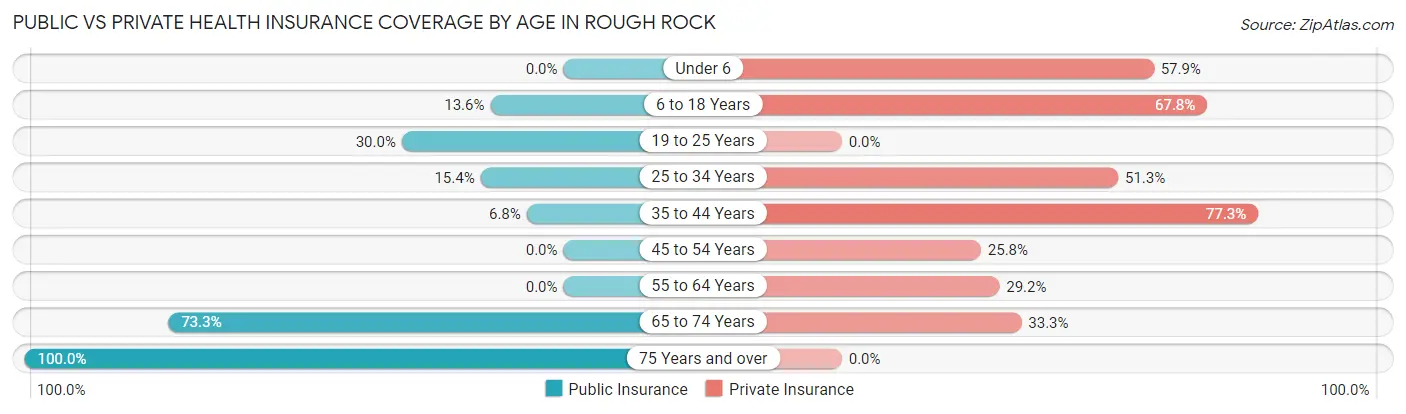
| Age Bracket | Public Insurance | Private Insurance |
| Under 6 | 0 (0.0%) | 11 (57.9%) |
| 6 to 18 Years | 8 (13.6%) | 40 (67.8%) |
| 19 to 25 Years | 6 (30.0%) | 0 (0.0%) |
| 25 to 34 Years | 6 (15.4%) | 20 (51.3%) |
| 35 to 44 Years | 6 (6.8%) | 68 (77.3%) |
| 45 to 54 Years | 0 (0.0%) | 16 (25.8%) |
| 55 to 64 Years | 0 (0.0%) | 19 (29.2%) |
| 65 to 74 Years | 44 (73.3%) | 20 (33.3%) |
| 75 Years and over | 11 (100.0%) | 0 (0.0%) |
| Total | 81 (19.2%) | 194 (45.9%) |
Disability Status by Sex by Age in Rough Rock
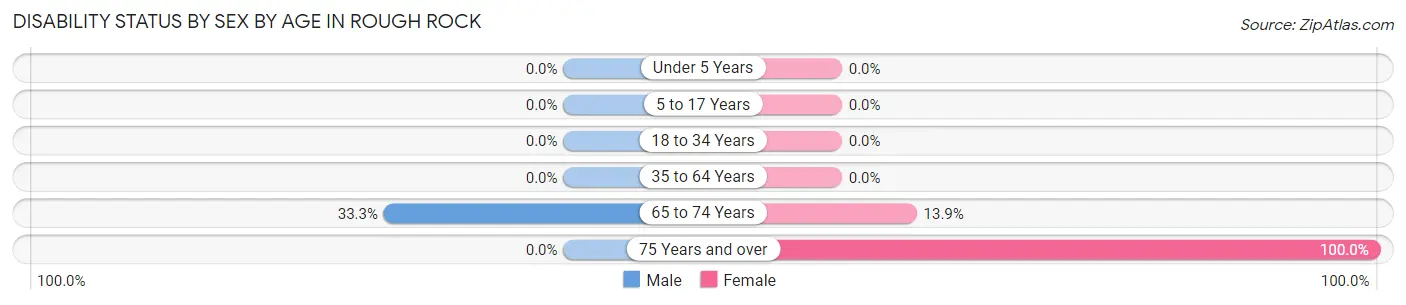
| Age Bracket | Male | Female |
| Under 5 Years | 0 (0.0%) | 0 (0.0%) |
| 5 to 17 Years | 0 (0.0%) | 0 (0.0%) |
| 18 to 34 Years | 0 (0.0%) | 0 (0.0%) |
| 35 to 64 Years | 0 (0.0%) | 0 (0.0%) |
| 65 to 74 Years | 8 (33.3%) | 5 (13.9%) |
| 75 Years and over | 0 (0.0%) | 8 (100.0%) |
Disability Class by Sex by Age in Rough Rock
Disability Class: Hearing Difficulty
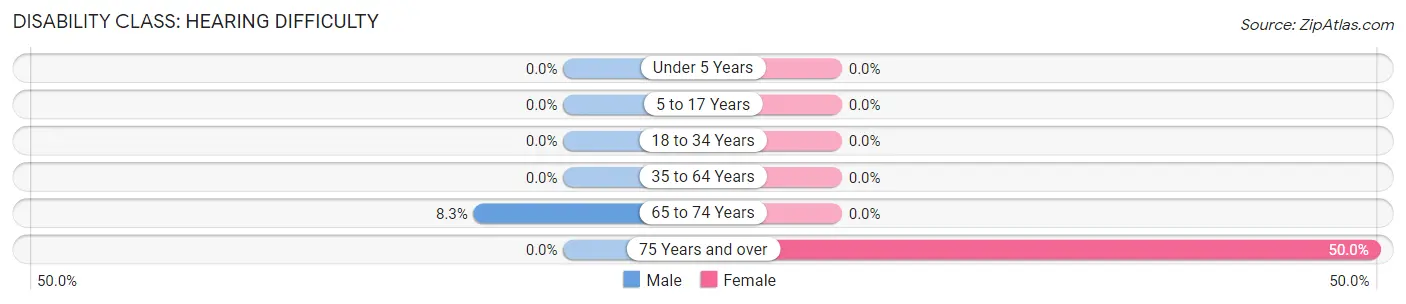
| Age Bracket | Male | Female |
| Under 5 Years | 0 (0.0%) | 0 (0.0%) |
| 5 to 17 Years | 0 (0.0%) | 0 (0.0%) |
| 18 to 34 Years | 0 (0.0%) | 0 (0.0%) |
| 35 to 64 Years | 0 (0.0%) | 0 (0.0%) |
| 65 to 74 Years | 2 (8.3%) | 0 (0.0%) |
| 75 Years and over | 0 (0.0%) | 4 (50.0%) |
Disability Class: Vision Difficulty
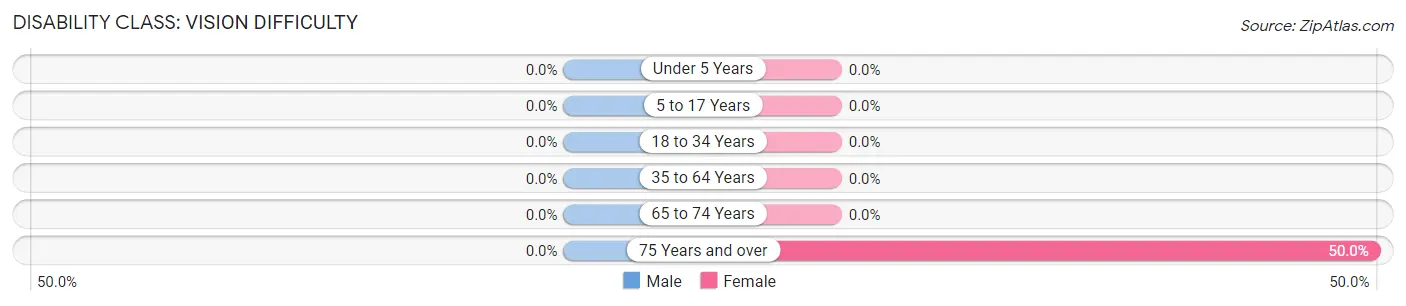
| Age Bracket | Male | Female |
| Under 5 Years | 0 (0.0%) | 0 (0.0%) |
| 5 to 17 Years | 0 (0.0%) | 0 (0.0%) |
| 18 to 34 Years | 0 (0.0%) | 0 (0.0%) |
| 35 to 64 Years | 0 (0.0%) | 0 (0.0%) |
| 65 to 74 Years | 0 (0.0%) | 0 (0.0%) |
| 75 Years and over | 0 (0.0%) | 4 (50.0%) |
Disability Class: Cognitive Difficulty
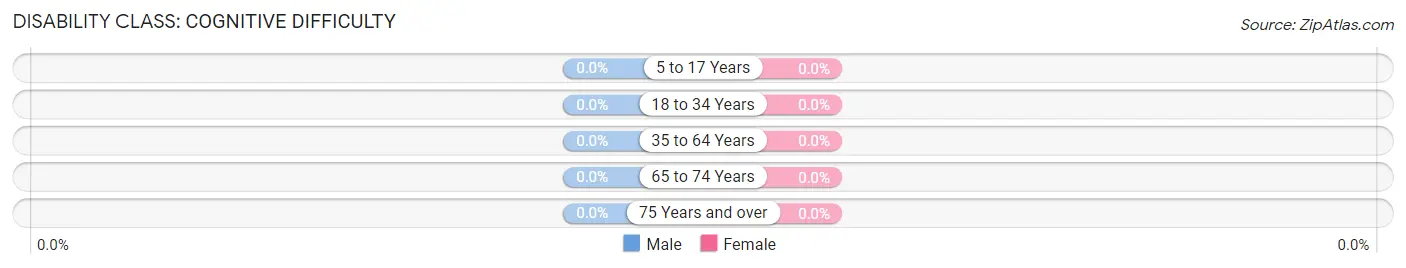
| Age Bracket | Male | Female |
| 5 to 17 Years | 0 (0.0%) | 0 (0.0%) |
| 18 to 34 Years | 0 (0.0%) | 0 (0.0%) |
| 35 to 64 Years | 0 (0.0%) | 0 (0.0%) |
| 65 to 74 Years | 0 (0.0%) | 0 (0.0%) |
| 75 Years and over | 0 (0.0%) | 0 (0.0%) |
Disability Class: Ambulatory Difficulty
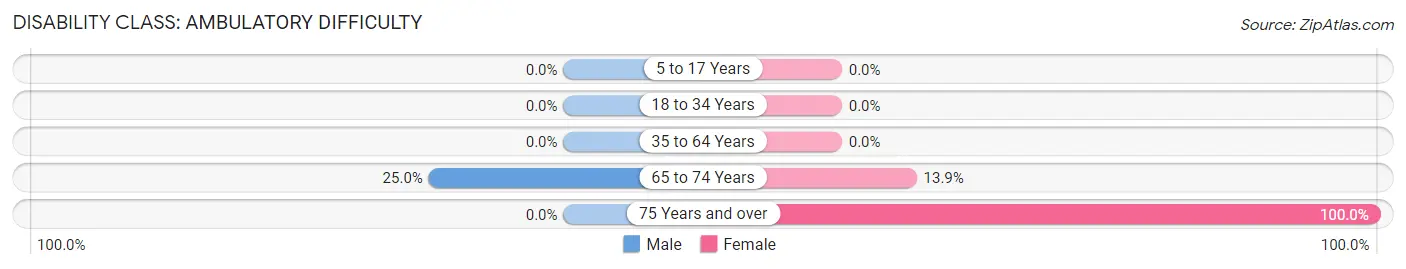
| Age Bracket | Male | Female |
| 5 to 17 Years | 0 (0.0%) | 0 (0.0%) |
| 18 to 34 Years | 0 (0.0%) | 0 (0.0%) |
| 35 to 64 Years | 0 (0.0%) | 0 (0.0%) |
| 65 to 74 Years | 6 (25.0%) | 5 (13.9%) |
| 75 Years and over | 0 (0.0%) | 8 (100.0%) |
Disability Class: Self-Care Difficulty
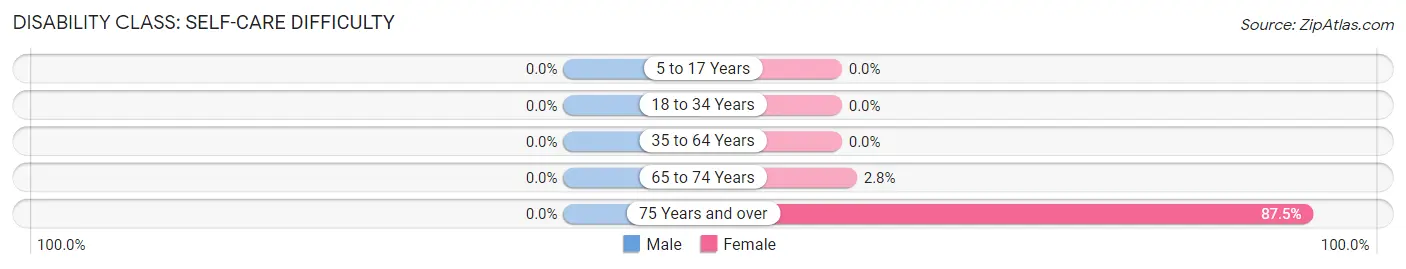
| Age Bracket | Male | Female |
| 5 to 17 Years | 0 (0.0%) | 0 (0.0%) |
| 18 to 34 Years | 0 (0.0%) | 0 (0.0%) |
| 35 to 64 Years | 0 (0.0%) | 0 (0.0%) |
| 65 to 74 Years | 0 (0.0%) | 1 (2.8%) |
| 75 Years and over | 0 (0.0%) | 7 (87.5%) |
Technology Access in Rough Rock
Computing Device Access in Rough Rock
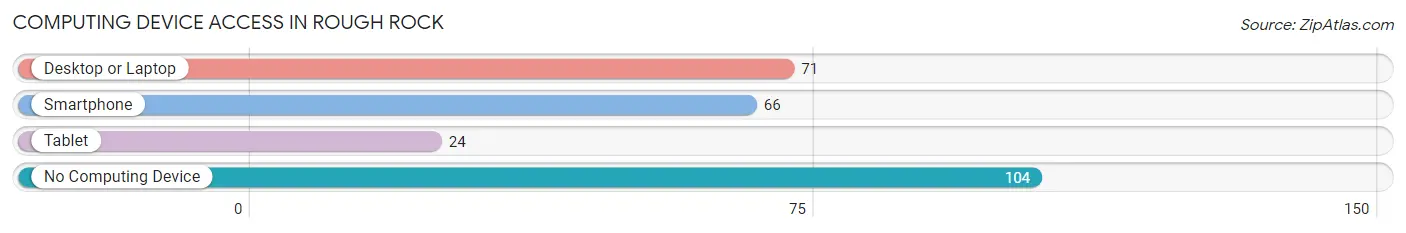
| Device Type | # Households | % Households |
| Desktop or Laptop | 71 | 36.4% |
| Smartphone | 66 | 33.9% |
| Tablet | 24 | 12.3% |
| No Computing Device | 104 | 53.3% |
| Total | 195 | 100.0% |
Internet Access in Rough Rock
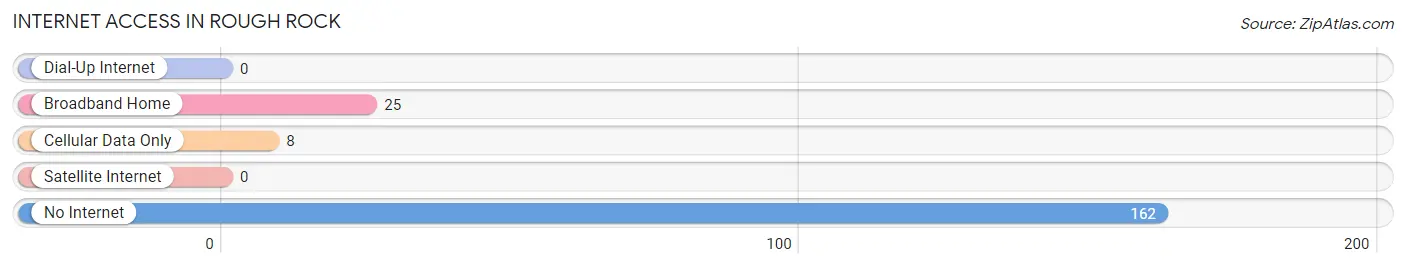
| Internet Type | # Households | % Households |
| Dial-Up Internet | 0 | 0.0% |
| Broadband Home | 25 | 12.8% |
| Cellular Data Only | 8 | 4.1% |
| Satellite Internet | 0 | 0.0% |
| No Internet | 162 | 83.1% |
| Total | 195 | 100.0% |
Rough Rock Summary
Rough Rock, Arizona is a small unincorporated community located in the Navajo Nation in Apache County, Arizona. It is located approximately 20 miles south of Chinle, Arizona, and is home to the Rough Rock Demonstration School, the first Navajo school to be established on the reservation. The community is also home to the Rough Rock Navajo Community Library, which is the first library to be established on the reservation.
Geography
Rough Rock is located in the Navajo Nation in Apache County, Arizona. It is situated in the Chuska Mountains, which are part of the Colorado Plateau. The area is characterized by high desert terrain, with elevations ranging from 5,000 to 8,000 feet. The climate is semi-arid, with hot summers and cold winters. The average annual precipitation is approximately 10 inches.
Economy
Rough Rock is a rural community with a largely subsistence economy. The primary sources of income are from farming, ranching, and tourism. The community is home to the Rough Rock Demonstration School, which provides educational opportunities for Navajo students. The school also serves as a cultural center for the community, hosting events such as the annual Navajo Nation Fair. The community is also home to the Rough Rock Navajo Community Library, which provides educational resources to the community.
Demographics
As of the 2010 census, the population of Rough Rock was 1,093. The median age was 33.7 years, and the median household income was $20,938. The majority of the population (90.3%) identified as Native American, and the majority of the population (94.2%) spoke Navajo as their primary language.
Conclusion
Rough Rock, Arizona is a small unincorporated community located in the Navajo Nation in Apache County, Arizona. It is home to the Rough Rock Demonstration School and the Rough Rock Navajo Community Library, both of which provide educational and cultural opportunities for the community. The economy of Rough Rock is largely subsistence-based, with farming, ranching, and tourism providing the primary sources of income. The population of Rough Rock is primarily Native American, with the majority speaking Navajo as their primary language.
Common Questions
What is Per Capita Income in Rough Rock?
Per Capita income in Rough Rock is $19,016.
What is the Median Family Income in Rough Rock?
Median Family Income in Rough Rock is $41,500.
What is the Median Household income in Rough Rock?
Median Household Income in Rough Rock is $40,347.
What is Income or Wage Gap in Rough Rock?
Income or Wage Gap in Rough Rock is 13.9%.
Women in Rough Rock earn 86.1 cents for every dollar earned by a man.
What is Inequality or Gini Index in Rough Rock?
Inequality or Gini Index in Rough Rock is 0.43.
What is the Total Population of Rough Rock?
Total Population of Rough Rock is 423.
What is the Total Male Population of Rough Rock?
Total Male Population of Rough Rock is 232.
What is the Total Female Population of Rough Rock?
Total Female Population of Rough Rock is 191.
What is the Ratio of Males per 100 Females in Rough Rock?
There are 121.47 Males per 100 Females in Rough Rock.
What is the Ratio of Females per 100 Males in Rough Rock?
There are 82.33 Females per 100 Males in Rough Rock.
What is the Median Population Age in Rough Rock?
Median Population Age in Rough Rock is 43.9 Years.
What is the Average Family Size in Rough Rock
Average Family Size in Rough Rock is 3.9 People.
What is the Average Household Size in Rough Rock
Average Household Size in Rough Rock is 2.2 People.
How Large is the Labor Force in Rough Rock?
There are 142 People in the Labor Forcein in Rough Rock.
What is the Percentage of People in the Labor Force in Rough Rock?
39.2% of People are in the Labor Force in Rough Rock.
What is the Unemployment Rate in Rough Rock?
Unemployment Rate in Rough Rock is 2.8%.