Casa Blanca, AZ Map & Demographics
Casa Blanca Map
Casa Blanca Overview
$15,481
PER CAPITA INCOME
$27,955
AVG FAMILY INCOME
$33,372
AVG HOUSEHOLD INCOME
0.53
INEQUALITY / GINI INDEX
1,137
TOTAL POPULATION
571
MALE POPULATION
566
FEMALE POPULATION
100.88
MALES / 100 FEMALES
99.12
FEMALES / 100 MALES
27.1
MEDIAN AGE
3.8
AVG FAMILY SIZE
3.2
AVG HOUSEHOLD SIZE
407
LABOR FORCE [ PEOPLE ]
45.4%
PERCENT IN LABOR FORCE
8.6%
UNEMPLOYMENT RATE
Income in Casa Blanca
Income Overview in Casa Blanca
Per Capita Income in Casa Blanca is $15,481, while median incomes of families and households are $27,955 and $33,372 respectively.
| Characteristic | Number | Measure |
| Per Capita Income | 1,137 | $15,481 |
| Median Family Income | 226 | $27,955 |
| Mean Family Income | 226 | $47,399 |
| Median Household Income | 352 | $33,372 |
| Mean Household Income | 352 | $47,442 |
| Income Deficit | 226 | $0 |
| Wage / Income Gap (%) | 1,137 | 0.00% |
| Wage / Income Gap ($) | 1,137 | 100.00¢ per $1 |
| Gini / Inequality Index | 1,137 | 0.53 |
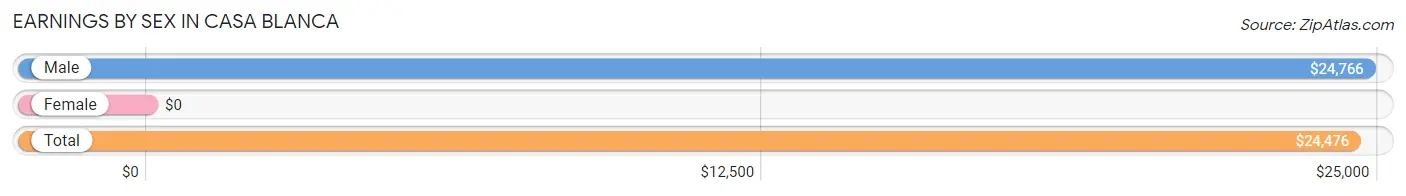
Earnings by Sex in Casa Blanca
| Sex | Number | Average Earnings |
| Male | 255 (61.6%) | $24,766 |
| Female | 159 (38.4%) | $0 |
| Total | 414 (100.0%) | $24,476 |
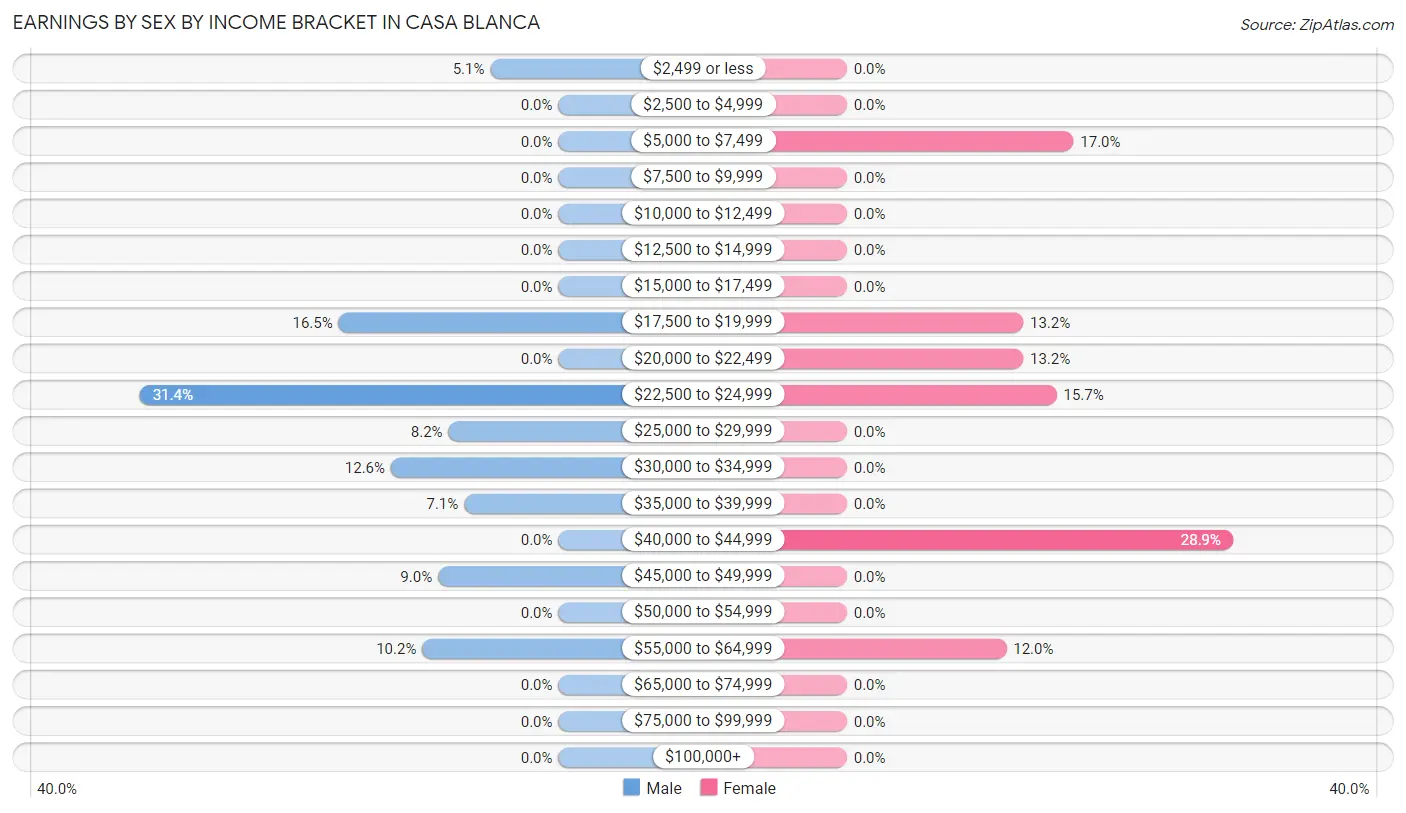
Earnings by Sex by Income Bracket in Casa Blanca
The most common earnings brackets in Casa Blanca are $22,500 to $24,999 for men (80 | 31.4%) and $40,000 to $44,999 for women (46 | 28.9%).
| Income | Male | Female |
| $2,499 or less | 13 (5.1%) | 0 (0.0%) |
| $2,500 to $4,999 | 0 (0.0%) | 0 (0.0%) |
| $5,000 to $7,499 | 0 (0.0%) | 27 (17.0%) |
| $7,500 to $9,999 | 0 (0.0%) | 0 (0.0%) |
| $10,000 to $12,499 | 0 (0.0%) | 0 (0.0%) |
| $12,500 to $14,999 | 0 (0.0%) | 0 (0.0%) |
| $15,000 to $17,499 | 0 (0.0%) | 0 (0.0%) |
| $17,500 to $19,999 | 42 (16.5%) | 21 (13.2%) |
| $20,000 to $22,499 | 0 (0.0%) | 21 (13.2%) |
| $22,500 to $24,999 | 80 (31.4%) | 25 (15.7%) |
| $25,000 to $29,999 | 21 (8.2%) | 0 (0.0%) |
| $30,000 to $34,999 | 32 (12.6%) | 0 (0.0%) |
| $35,000 to $39,999 | 18 (7.1%) | 0 (0.0%) |
| $40,000 to $44,999 | 0 (0.0%) | 46 (28.9%) |
| $45,000 to $49,999 | 23 (9.0%) | 0 (0.0%) |
| $50,000 to $54,999 | 0 (0.0%) | 0 (0.0%) |
| $55,000 to $64,999 | 26 (10.2%) | 19 (11.9%) |
| $65,000 to $74,999 | 0 (0.0%) | 0 (0.0%) |
| $75,000 to $99,999 | 0 (0.0%) | 0 (0.0%) |
| $100,000+ | 0 (0.0%) | 0 (0.0%) |
| Total | 255 (100.0%) | 159 (100.0%) |
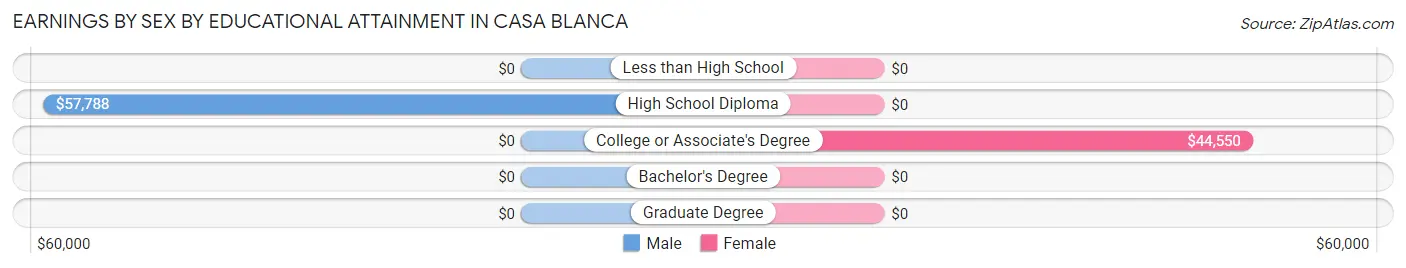
Earnings by Sex by Educational Attainment in Casa Blanca
Average earnings in Casa Blanca are $36,875 for men and $41,131 for women, a difference of 10.3%. Men with an educational attainment of high school diploma enjoy the highest average annual earnings of $57,788, while those with high school diploma education earn the least with $57,788. Women with an educational attainment of college or associate's degree earn the most with the average annual earnings of $44,550, while those with college or associate's degree education have the smallest earnings of $44,550.
| Educational Attainment | Male Income | Female Income |
| Less than High School | - | - |
| High School Diploma | $57,788 | $0 |
| College or Associate's Degree | - | - |
| Bachelor's Degree | - | - |
| Graduate Degree | - | - |
| Total | $36,875 | $41,131 |
Family Income in Casa Blanca
Family Income Brackets in Casa Blanca
According to the Casa Blanca family income data, there are 80 families falling into the $15,000 to $24,999 income range, which is the most common income bracket and makes up 35.4% of all families.
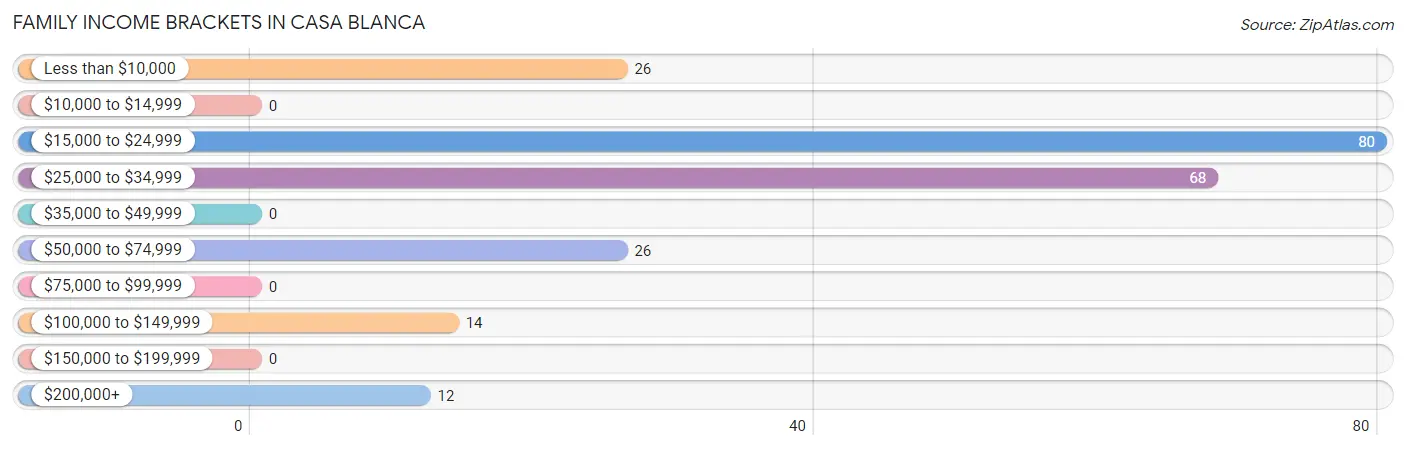
| Income Bracket | # Families | % Families |
| Less than $10,000 | 26 | 11.5% |
| $10,000 to $14,999 | 0 | 0.0% |
| $15,000 to $24,999 | 80 | 35.4% |
| $25,000 to $34,999 | 68 | 30.1% |
| $35,000 to $49,999 | 0 | 0.0% |
| $50,000 to $74,999 | 26 | 11.5% |
| $75,000 to $99,999 | 0 | 0.0% |
| $100,000 to $149,999 | 14 | 6.2% |
| $150,000 to $199,999 | 0 | 0.0% |
| $200,000+ | 12 | 5.3% |
Family Income by Famaliy Size in Casa Blanca
4-person families (146 | 64.6%) account for the highest median family income in Casa Blanca with $28,068 per family, while 4-person families (146 | 64.6%) have the highest median income of $7,017 per family member.
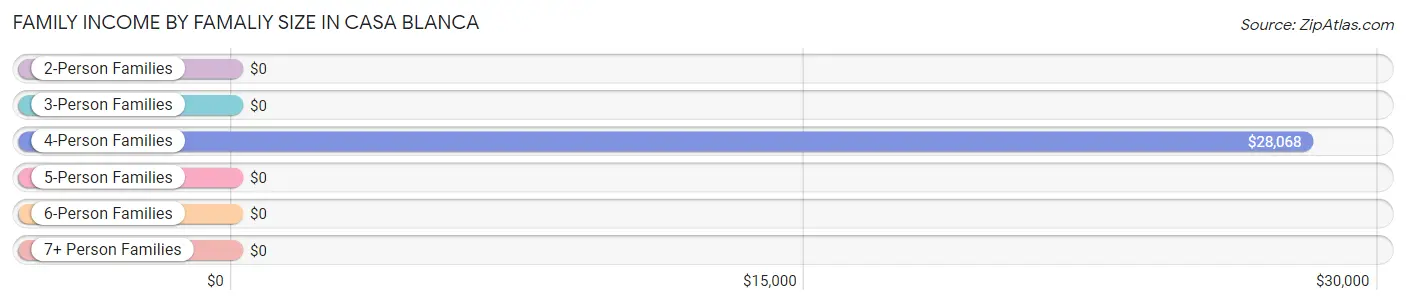
| Income Bracket | # Families | Median Income |
| 2-Person Families | 51 (22.6%) | $0 |
| 3-Person Families | 17 (7.5%) | $0 |
| 4-Person Families | 146 (64.6%) | $28,068 |
| 5-Person Families | 0 (0.0%) | $0 |
| 6-Person Families | 0 (0.0%) | $0 |
| 7+ Person Families | 12 (5.3%) | $0 |
| Total | 226 (100.0%) | $27,955 |
Family Income by Number of Earners in Casa Blanca
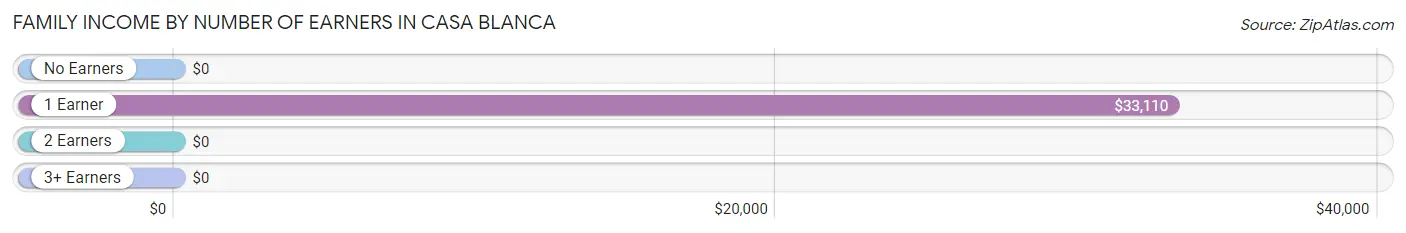
| Number of Earners | # Families | Median Income |
| No Earners | 46 (20.3%) | $0 |
| 1 Earner | 141 (62.4%) | $33,110 |
| 2 Earners | 39 (17.3%) | $0 |
| 3+ Earners | 0 (0.0%) | $0 |
| Total | 226 (100.0%) | $27,955 |
Household Income in Casa Blanca
Household Income Brackets in Casa Blanca
With 99 households falling in the category, the $50,000 to $74,999 income range is the most frequent in Casa Blanca, accounting for 28.1% of all households.
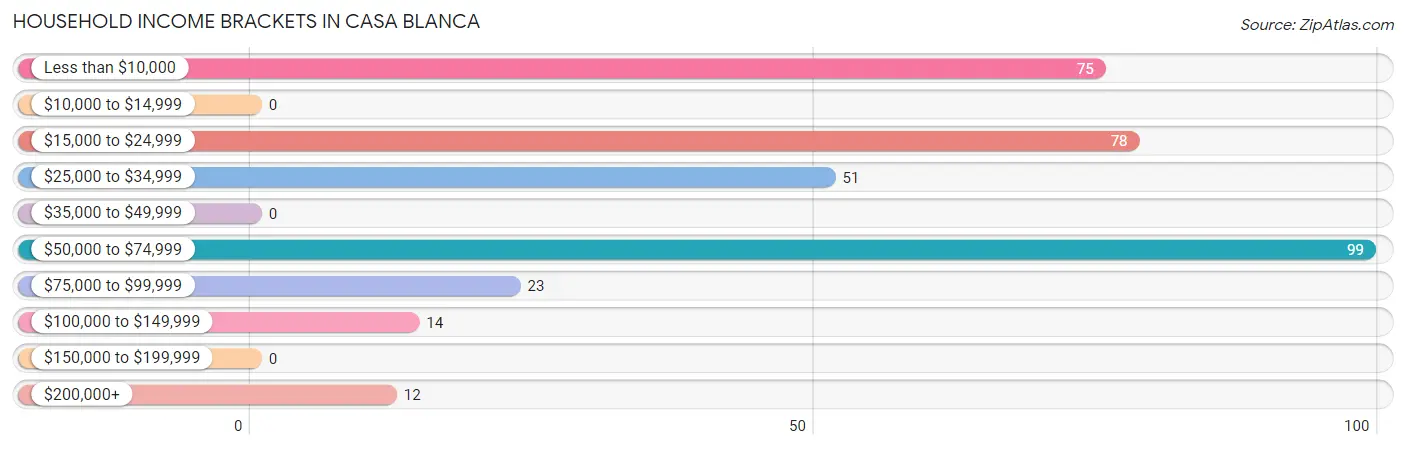
| Income Bracket | # Households | % Households |
| Less than $10,000 | 75 | 21.3% |
| $10,000 to $14,999 | 0 | 0.0% |
| $15,000 to $24,999 | 78 | 22.2% |
| $25,000 to $34,999 | 51 | 14.5% |
| $35,000 to $49,999 | 0 | 0.0% |
| $50,000 to $74,999 | 99 | 28.1% |
| $75,000 to $99,999 | 23 | 6.5% |
| $100,000 to $149,999 | 14 | 4.0% |
| $150,000 to $199,999 | 0 | 0.0% |
| $200,000+ | 12 | 3.4% |
Household Income by Householder Age in Casa Blanca
The median household income in Casa Blanca is $33,372, with the highest median household income of $32,616 found in the 65+ years age bracket for the primary householder. A total of 82 households (23.3%) fall into this category. Meanwhile, the 15 to 24 years age bracket for the primary householder has the lowest median household income of $0, with 32 households (9.1%) in this group.
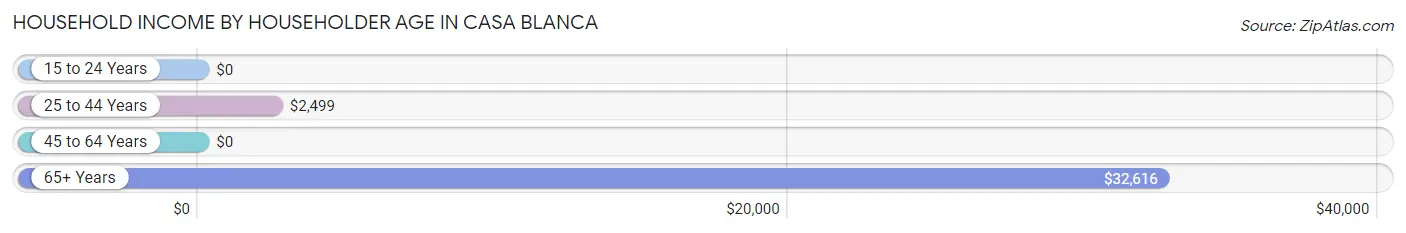
| Income Bracket | # Households | Median Income |
| 15 to 24 Years | 32 (9.1%) | $0 |
| 25 to 44 Years | 57 (16.2%) | $2,499 |
| 45 to 64 Years | 181 (51.4%) | $0 |
| 65+ Years | 82 (23.3%) | $32,616 |
| Total | 352 (100.0%) | $33,372 |
Poverty in Casa Blanca
Income Below Poverty by Sex and Age in Casa Blanca
With 36.1% poverty level for males and 54.9% for females among the residents of Casa Blanca, 6 to 11 year old males and under 5 year old females are the most vulnerable to poverty, with 60 males (100.0%) and 24 females (100.0%) in their respective age groups living below the poverty level.
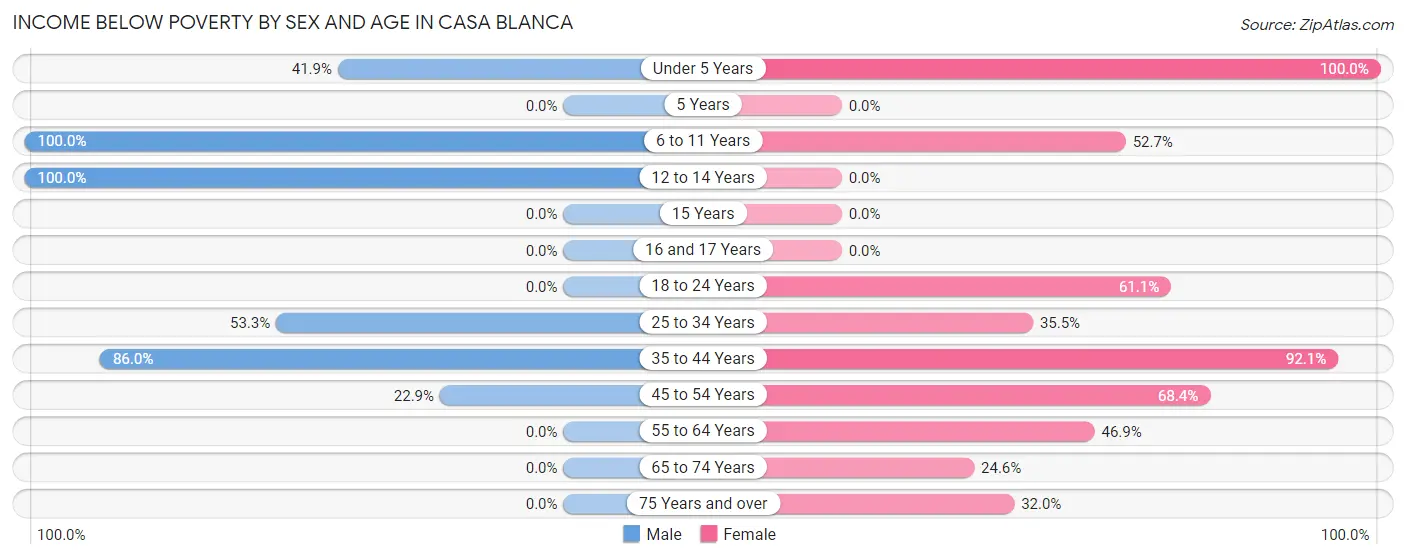
| Age Bracket | Male | Female |
| Under 5 Years | 18 (41.9%) | 24 (100.0%) |
| 5 Years | 0 (0.0%) | 0 (0.0%) |
| 6 to 11 Years | 60 (100.0%) | 39 (52.7%) |
| 12 to 14 Years | 39 (100.0%) | 0 (0.0%) |
| 15 Years | 0 (0.0%) | 0 (0.0%) |
| 16 and 17 Years | 0 (0.0%) | 0 (0.0%) |
| 18 to 24 Years | 0 (0.0%) | 77 (61.1%) |
| 25 to 34 Years | 24 (53.3%) | 22 (35.5%) |
| 35 to 44 Years | 43 (86.0%) | 35 (92.1%) |
| 45 to 54 Years | 22 (22.9%) | 54 (68.3%) |
| 55 to 64 Years | 0 (0.0%) | 38 (46.9%) |
| 65 to 74 Years | 0 (0.0%) | 14 (24.6%) |
| 75 Years and over | 0 (0.0%) | 8 (32.0%) |
| Total | 206 (36.1%) | 311 (54.9%) |
Income Above Poverty by Sex and Age in Casa Blanca
According to the poverty statistics in Casa Blanca, males aged 18 to 24 years and females aged 65 to 74 years are the age groups that are most secure financially, with 100.0% of males and 75.4% of females in these age groups living above the poverty line.
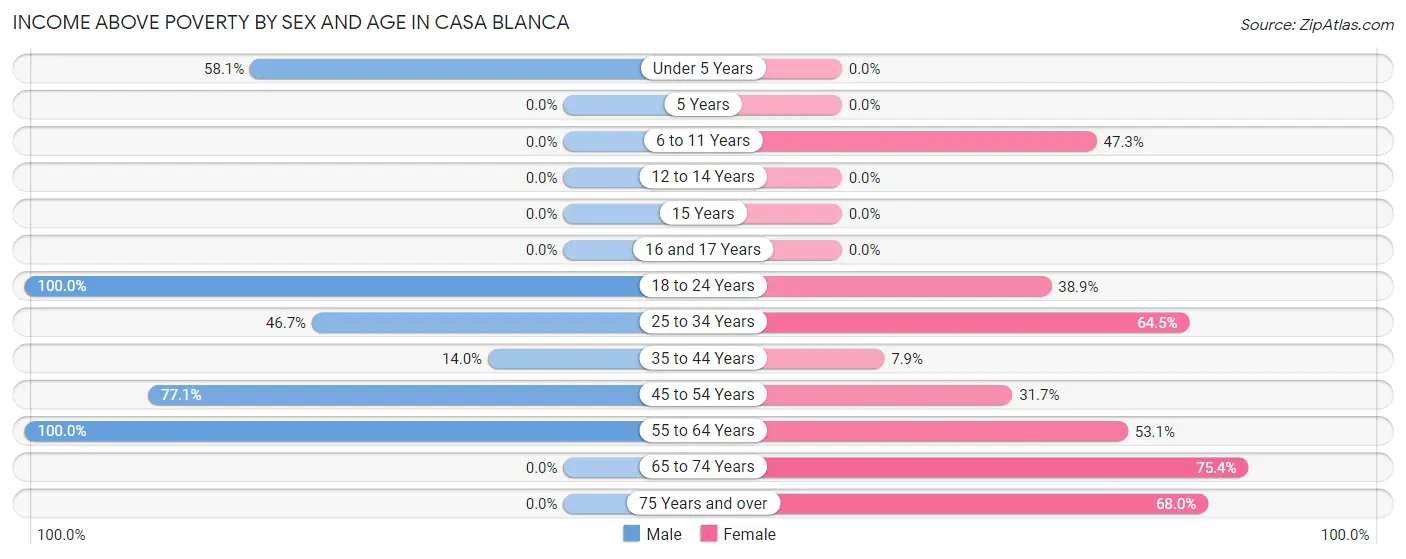
| Age Bracket | Male | Female |
| Under 5 Years | 25 (58.1%) | 0 (0.0%) |
| 5 Years | 0 (0.0%) | 0 (0.0%) |
| 6 to 11 Years | 0 (0.0%) | 35 (47.3%) |
| 12 to 14 Years | 0 (0.0%) | 0 (0.0%) |
| 15 Years | 0 (0.0%) | 0 (0.0%) |
| 16 and 17 Years | 0 (0.0%) | 0 (0.0%) |
| 18 to 24 Years | 199 (100.0%) | 49 (38.9%) |
| 25 to 34 Years | 21 (46.7%) | 40 (64.5%) |
| 35 to 44 Years | 7 (14.0%) | 3 (7.9%) |
| 45 to 54 Years | 74 (77.1%) | 25 (31.7%) |
| 55 to 64 Years | 39 (100.0%) | 43 (53.1%) |
| 65 to 74 Years | 0 (0.0%) | 43 (75.4%) |
| 75 Years and over | 0 (0.0%) | 17 (68.0%) |
| Total | 365 (63.9%) | 255 (45.1%) |
Income Below Poverty Among Married-Couple Families in Casa Blanca
The poverty statistics for married-couple families in Casa Blanca show that 54.5% or 18 of the total 33 families live below the poverty line. Families with no children have the highest poverty rate of 85.7%, comprising of 18 families. On the other hand, families with 3 or 4 children have the lowest poverty rate of 0.0%, which includes 0 families.
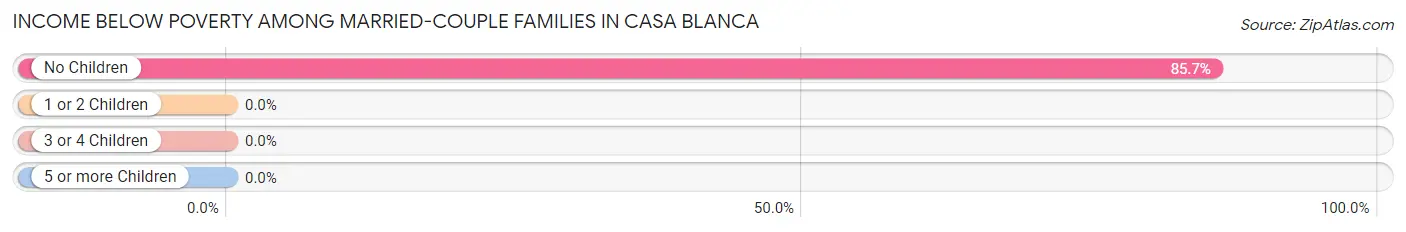
| Children | Above Poverty | Below Poverty |
| No Children | 3 (14.3%) | 18 (85.7%) |
| 1 or 2 Children | 0 (0.0%) | 0 (0.0%) |
| 3 or 4 Children | 12 (100.0%) | 0 (0.0%) |
| 5 or more Children | 0 (0.0%) | 0 (0.0%) |
| Total | 15 (45.5%) | 18 (54.5%) |
Income Below Poverty Among Single-Parent Households in Casa Blanca
According to the poverty data in Casa Blanca, 32.2% or 19 single-father households and 53.0% or 71 single-mother households are living below the poverty line. Among single-father households, those with 3 or 4 children have the highest poverty rate, with 19 households (100.0%) experiencing poverty. Likewise, among single-mother households, those with 1 or 2 children have the highest poverty rate, with 71 households (62.3%) falling below the poverty line.
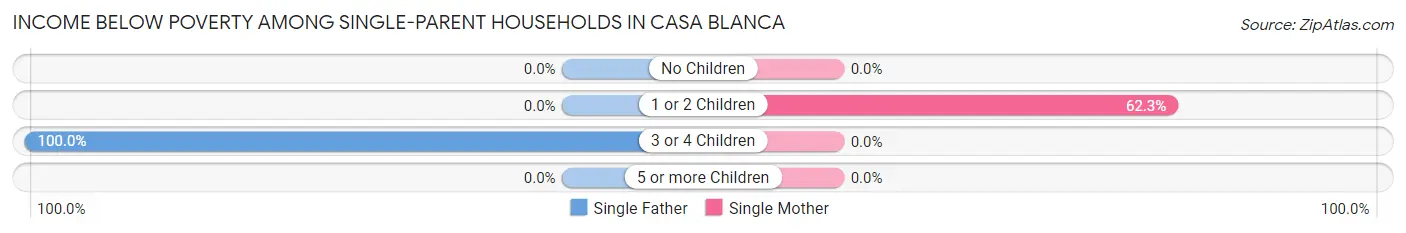
| Children | Single Father | Single Mother |
| No Children | 0 (0.0%) | 0 (0.0%) |
| 1 or 2 Children | 0 (0.0%) | 71 (62.3%) |
| 3 or 4 Children | 19 (100.0%) | 0 (0.0%) |
| 5 or more Children | 0 (0.0%) | 0 (0.0%) |
| Total | 19 (32.2%) | 71 (53.0%) |
Income Below Poverty Among Married-Couple vs Single-Parent Households in Casa Blanca
The poverty data for Casa Blanca shows that 18 of the married-couple family households (54.5%) and 90 of the single-parent households (46.6%) are living below the poverty level. Within the married-couple family households, those with no children have the highest poverty rate, with 18 households (85.7%) falling below the poverty line. Among the single-parent households, those with 3 or 4 children have the highest poverty rate, with 19 household (100.0%) living below poverty.
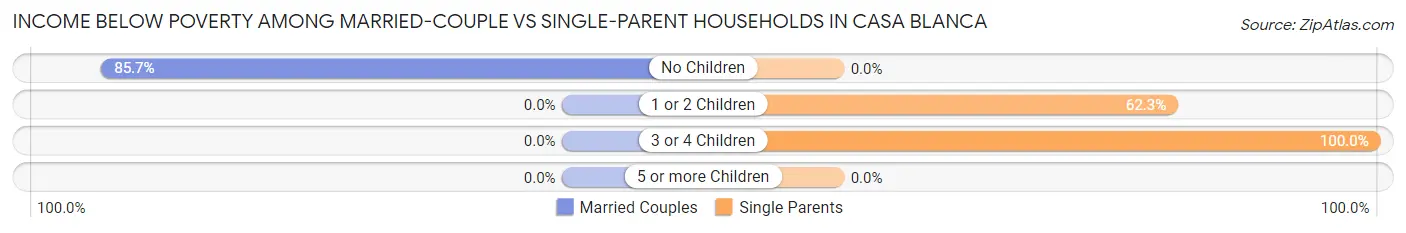
| Children | Married-Couple Families | Single-Parent Households |
| No Children | 18 (85.7%) | 0 (0.0%) |
| 1 or 2 Children | 0 (0.0%) | 71 (62.3%) |
| 3 or 4 Children | 0 (0.0%) | 19 (100.0%) |
| 5 or more Children | 0 (0.0%) | 0 (0.0%) |
| Total | 18 (54.5%) | 90 (46.6%) |
Race in Casa Blanca
The most populous races in Casa Blanca are Native / Alaskan (1,049 | 92.3%), Hispanic or Latino (73 | 6.4%), and White / Caucasian (43 | 3.8%).
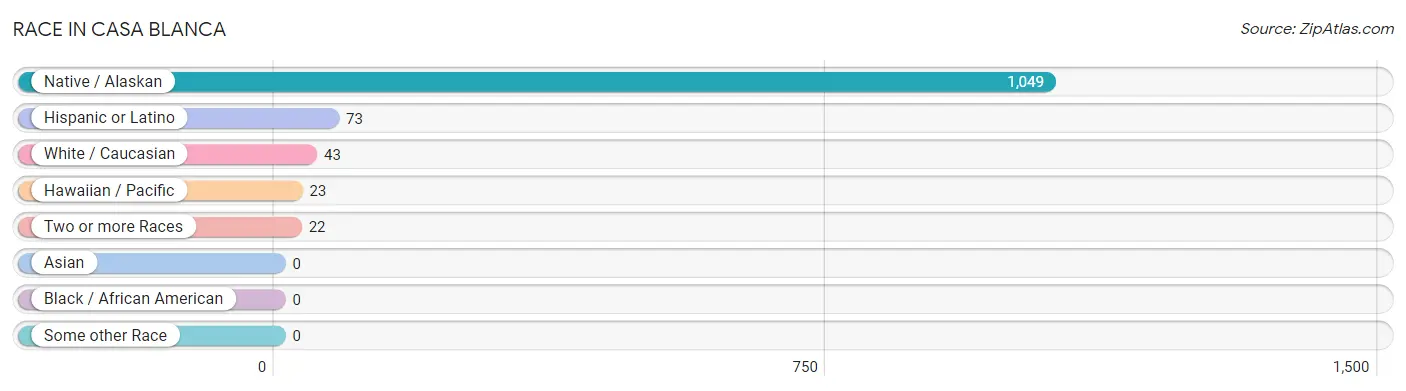
| Race | # Population | % Population |
| Asian | 0 | 0.0% |
| Black / African American | 0 | 0.0% |
| Hawaiian / Pacific | 23 | 2.0% |
| Hispanic or Latino | 73 | 6.4% |
| Native / Alaskan | 1,049 | 92.3% |
| White / Caucasian | 43 | 3.8% |
| Two or more Races | 22 | 1.9% |
| Some other Race | 0 | 0.0% |
| Total | 1,137 | 100.0% |
Ancestry in Casa Blanca
The most populous ancestries reported in Casa Blanca are Pima (989 | 87.0%), Mexican (73 | 6.4%), Navajo (29 | 2.5%), Samoan (23 | 2.0%), and German (21 | 1.8%), together accounting for 99.8% of all Casa Blanca residents.
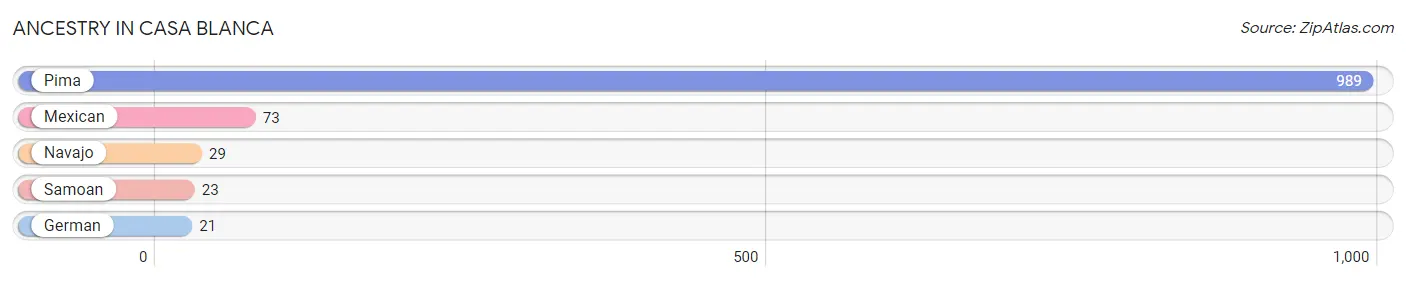
| Ancestry | # Population | % Population |
| German | 21 | 1.8% |
| Mexican | 73 | 6.4% |
| Navajo | 29 | 2.5% |
| Pima | 989 | 87.0% |
| Samoan | 23 | 2.0% | View All 5 Rows |
Immigrants in Casa Blanca

| Immigration Origin | # Population | % Population | View All 0 Rows |
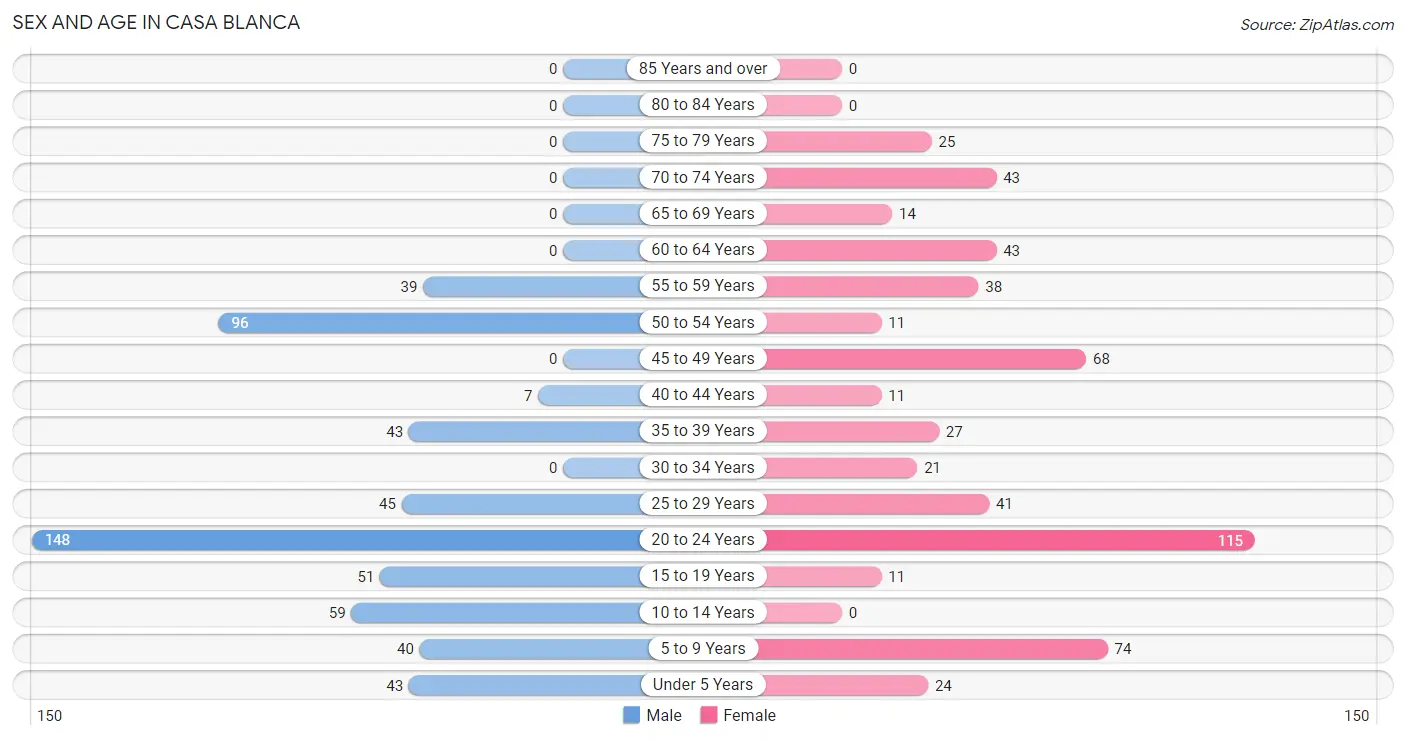
Sex and Age in Casa Blanca
Sex and Age in Casa Blanca
The most populous age groups in Casa Blanca are 20 to 24 Years (148 | 25.9%) for men and 20 to 24 Years (115 | 20.3%) for women.
| Age Bracket | Male | Female |
| Under 5 Years | 43 (7.5%) | 24 (4.2%) |
| 5 to 9 Years | 40 (7.0%) | 74 (13.1%) |
| 10 to 14 Years | 59 (10.3%) | 0 (0.0%) |
| 15 to 19 Years | 51 (8.9%) | 11 (1.9%) |
| 20 to 24 Years | 148 (25.9%) | 115 (20.3%) |
| 25 to 29 Years | 45 (7.9%) | 41 (7.2%) |
| 30 to 34 Years | 0 (0.0%) | 21 (3.7%) |
| 35 to 39 Years | 43 (7.5%) | 27 (4.8%) |
| 40 to 44 Years | 7 (1.2%) | 11 (1.9%) |
| 45 to 49 Years | 0 (0.0%) | 68 (12.0%) |
| 50 to 54 Years | 96 (16.8%) | 11 (1.9%) |
| 55 to 59 Years | 39 (6.8%) | 38 (6.7%) |
| 60 to 64 Years | 0 (0.0%) | 43 (7.6%) |
| 65 to 69 Years | 0 (0.0%) | 14 (2.5%) |
| 70 to 74 Years | 0 (0.0%) | 43 (7.6%) |
| 75 to 79 Years | 0 (0.0%) | 25 (4.4%) |
| 80 to 84 Years | 0 (0.0%) | 0 (0.0%) |
| 85 Years and over | 0 (0.0%) | 0 (0.0%) |
| Total | 571 (100.0%) | 566 (100.0%) |
Families and Households in Casa Blanca
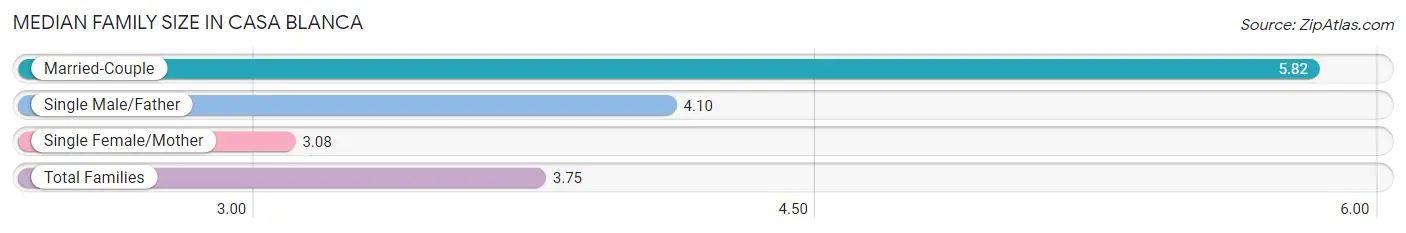
Median Family Size in Casa Blanca
The median family size in Casa Blanca is 3.75 persons per family, with married-couple families (33 | 14.6%) accounting for the largest median family size of 5.82 persons per family. On the other hand, single female/mother families (134 | 59.3%) represent the smallest median family size with 3.08 persons per family.
| Family Type | # Families | Family Size |
| Married-Couple | 33 (14.6%) | 5.82 |
| Single Male/Father | 59 (26.1%) | 4.10 |
| Single Female/Mother | 134 (59.3%) | 3.08 |
| Total Families | 226 (100.0%) | 3.75 |
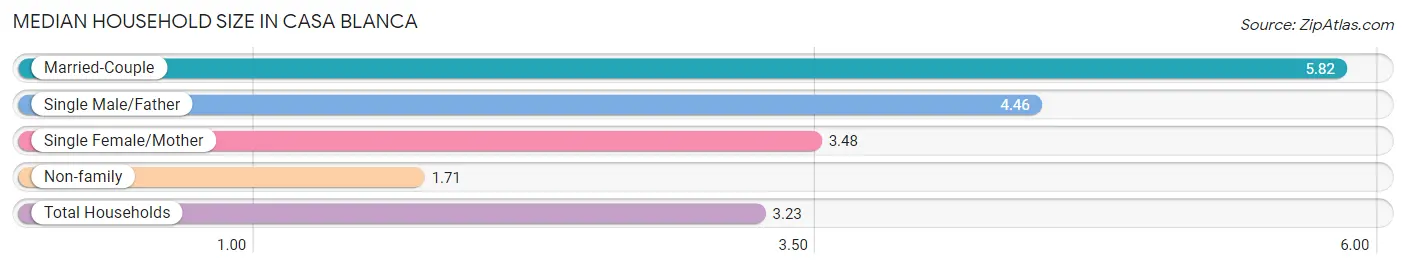
Median Household Size in Casa Blanca
The median household size in Casa Blanca is 3.23 persons per household, with married-couple households (33 | 9.4%) accounting for the largest median household size of 5.82 persons per household. non-family households (126 | 35.8%) represent the smallest median household size with 1.71 persons per household.
| Household Type | # Households | Household Size |
| Married-Couple | 33 (9.4%) | 5.82 |
| Single Male/Father | 59 (16.8%) | 4.46 |
| Single Female/Mother | 134 (38.1%) | 3.48 |
| Non-family | 126 (35.8%) | 1.71 |
| Total Households | 352 (100.0%) | 3.23 |
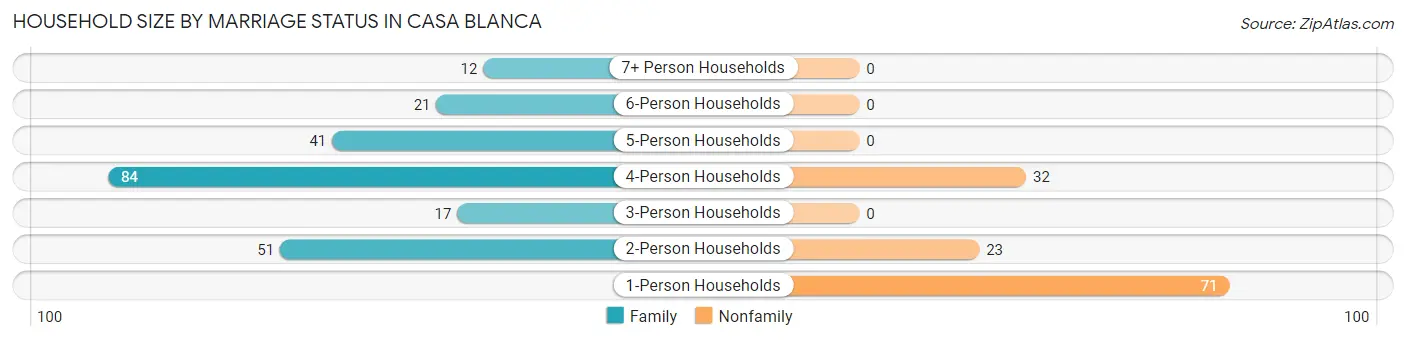
Household Size by Marriage Status in Casa Blanca
Out of a total of 352 households in Casa Blanca, 226 (64.2%) are family households, while 126 (35.8%) are nonfamily households. The most numerous type of family households are 4-person households, comprising 84, and the most common type of nonfamily households are 1-person households, comprising 71.
| Household Size | Family Households | Nonfamily Households |
| 1-Person Households | - | 71 (20.2%) |
| 2-Person Households | 51 (14.5%) | 23 (6.5%) |
| 3-Person Households | 17 (4.8%) | 0 (0.0%) |
| 4-Person Households | 84 (23.9%) | 32 (9.1%) |
| 5-Person Households | 41 (11.7%) | 0 (0.0%) |
| 6-Person Households | 21 (6.0%) | 0 (0.0%) |
| 7+ Person Households | 12 (3.4%) | 0 (0.0%) |
| Total | 226 (64.2%) | 126 (35.8%) |
Female Fertility in Casa Blanca
Fertility by Age in Casa Blanca
Average fertility rate in Casa Blanca is 105.0 births per 1,000 women. Women in the age bracket of 15 to 19 years have the highest fertility rate with 1,000.0 births per 1,000 women. Women in the age bracket of 20 to 34 years acount for 64.5% of all women with births.
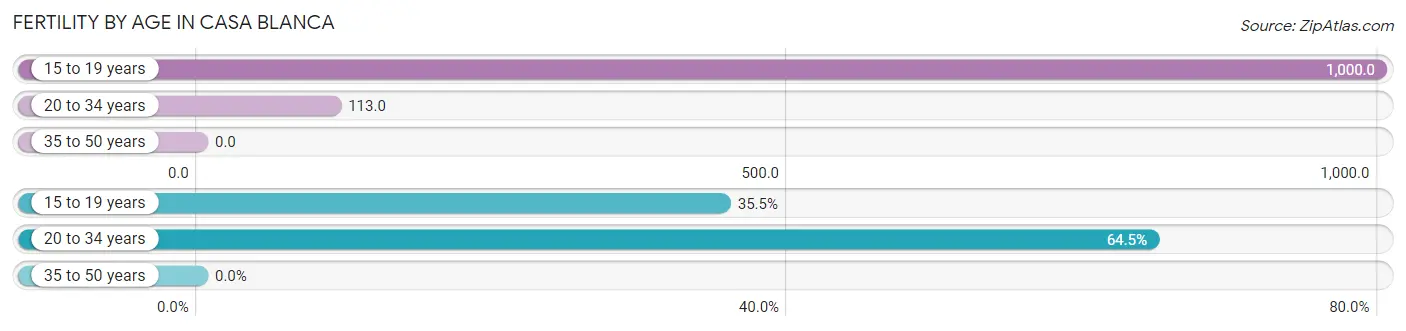
| Age Bracket | Women with Births | Births / 1,000 Women |
| 15 to 19 years | 11 (35.5%) | 1,000.0 |
| 20 to 34 years | 20 (64.5%) | 113.0 |
| 35 to 50 years | 0 (0.0%) | 0.0 |
| Total | 31 (100.0%) | 105.0 |
Fertility by Age by Marriage Status in Casa Blanca
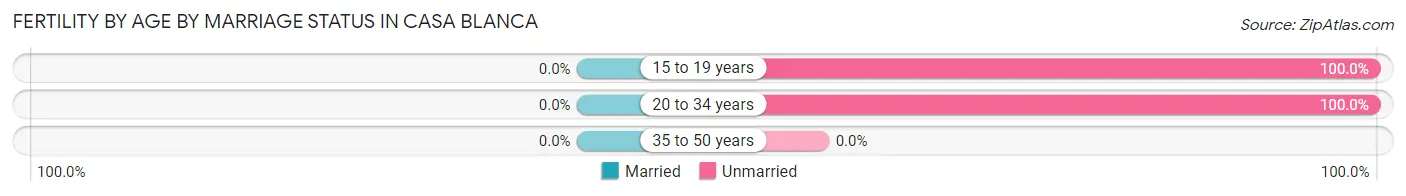
| Age Bracket | Married | Unmarried |
| 15 to 19 years | 0 (0.0%) | 11 (100.0%) |
| 20 to 34 years | 0 (0.0%) | 20 (100.0%) |
| 35 to 50 years | 0 (0.0%) | 0 (0.0%) |
| Total | 0 (0.0%) | 31 (100.0%) |
Fertility by Education in Casa Blanca
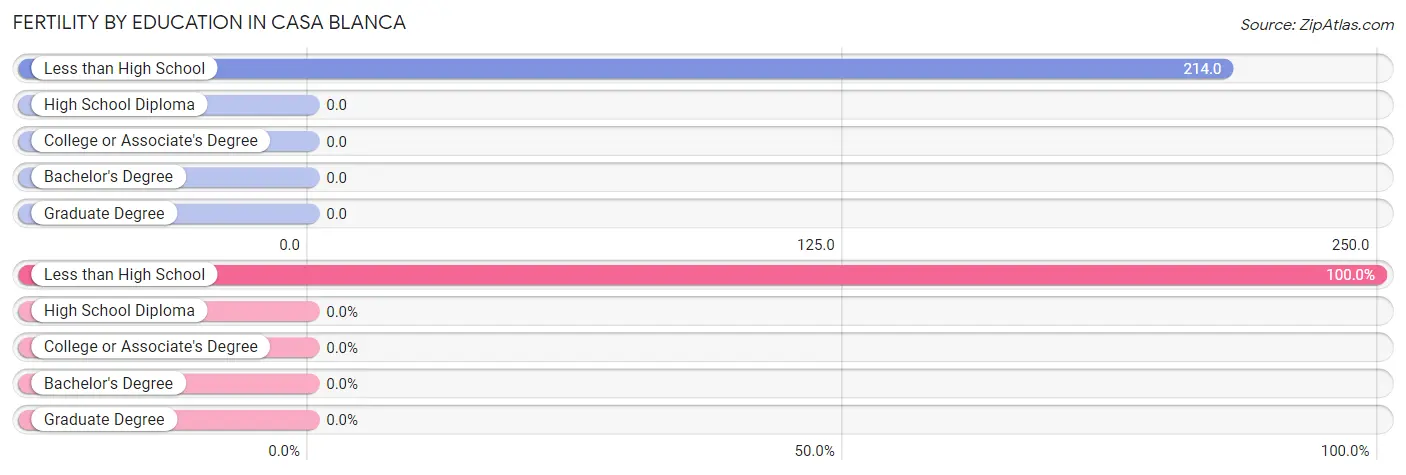
| Educational Attainment | Women with Births | Births / 1,000 Women |
| Less than High School | 31 (100.0%) | 214.0 |
| High School Diploma | 0 (0.0%) | 0.0 |
| College or Associate's Degree | 0 (0.0%) | 0.0 |
| Bachelor's Degree | 0 (0.0%) | 0.0 |
| Graduate Degree | 0 (0.0%) | 0.0 |
| Total | 31 (100.0%) | 105.0 |
Fertility by Education by Marriage Status in Casa Blanca
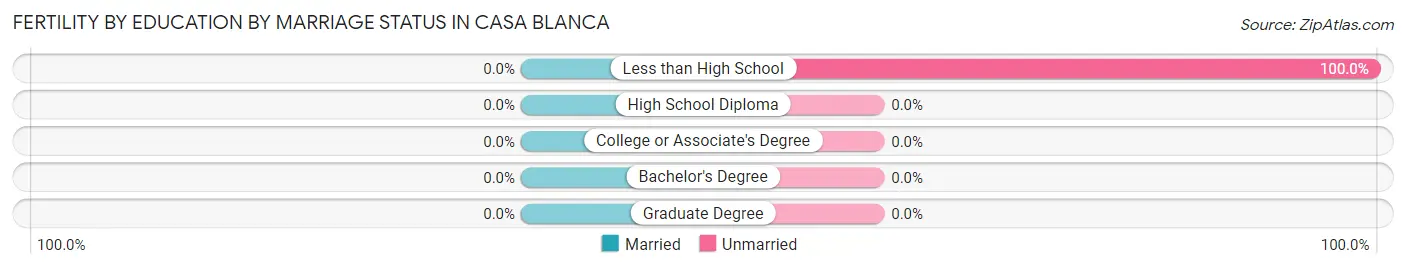
| Educational Attainment | Married | Unmarried |
| Less than High School | 0 (0.0%) | 31 (100.0%) |
| High School Diploma | 0 (0.0%) | 0 (0.0%) |
| College or Associate's Degree | 0 (0.0%) | 0 (0.0%) |
| Bachelor's Degree | 0 (0.0%) | 0 (0.0%) |
| Graduate Degree | 0 (0.0%) | 0 (0.0%) |
| Total | 0 (0.0%) | 31 (100.0%) |
Employment Characteristics in Casa Blanca
Employment by Class of Employer in Casa Blanca
Among the 372 employed individuals in Casa Blanca, private company employees (189 | 50.8%), local government employees (127 | 34.1%), and federal government employees (34 | 9.1%) make up the most common classes of employment.
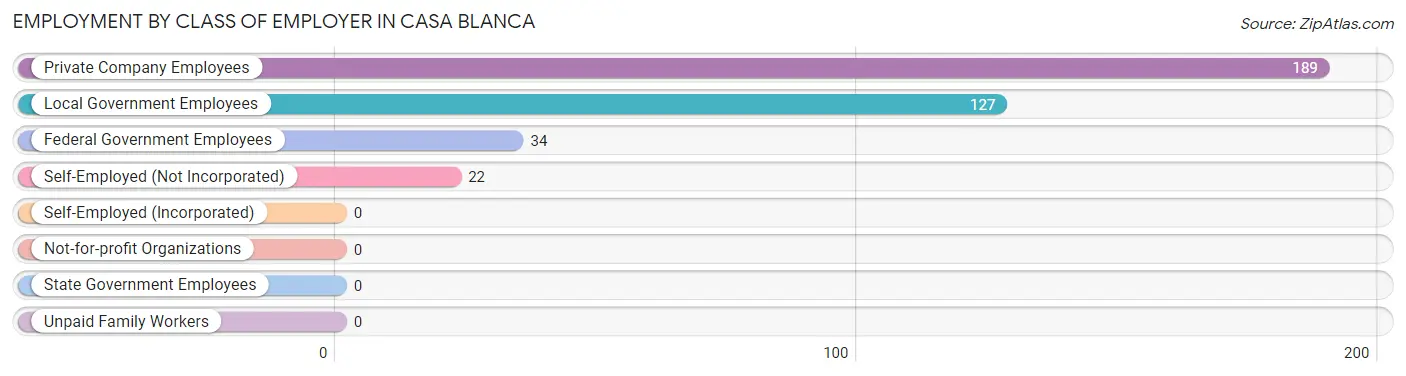
| Employer Class | # Employees | % Employees |
| Private Company Employees | 189 | 50.8% |
| Self-Employed (Incorporated) | 0 | 0.0% |
| Self-Employed (Not Incorporated) | 22 | 5.9% |
| Not-for-profit Organizations | 0 | 0.0% |
| Local Government Employees | 127 | 34.1% |
| State Government Employees | 0 | 0.0% |
| Federal Government Employees | 34 | 9.1% |
| Unpaid Family Workers | 0 | 0.0% |
| Total | 372 | 100.0% |
Employment Status by Age in Casa Blanca
According to the labor force statistics for Casa Blanca, out of the total population over 16 years of age (897), 45.4% or 407 individuals are in the labor force, with 8.6% or 35 of them unemployed. The age group with the highest labor force participation rate is 30 to 34 years, with 100.0% or 21 individuals in the labor force. Within the labor force, the 35 to 44 years age range has the highest percentage of unemployed individuals, with 61.4% or 35 of them being unemployed.
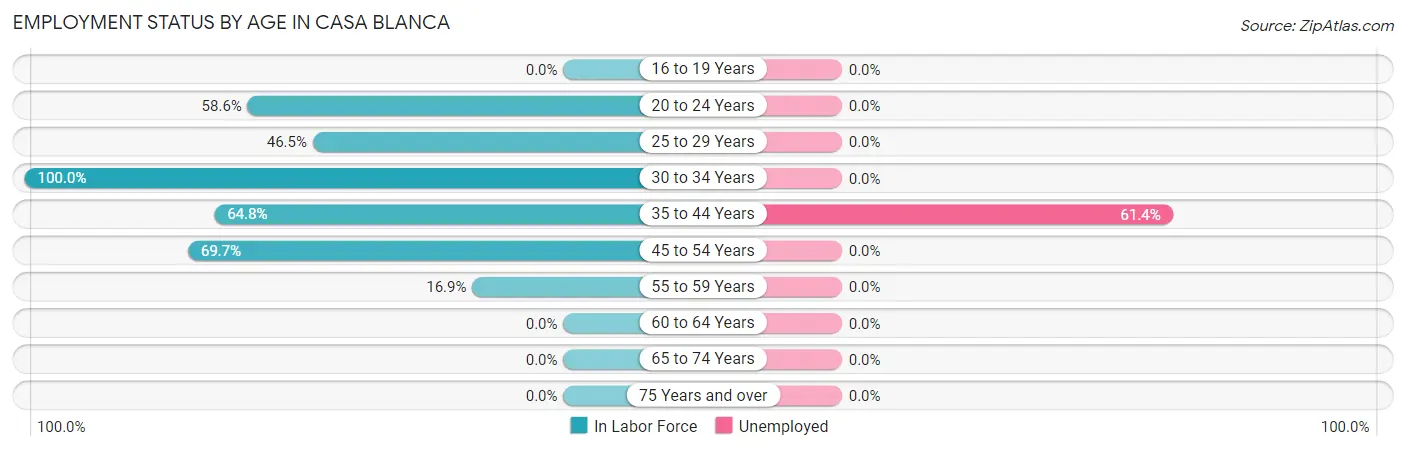
| Age Bracket | In Labor Force | Unemployed |
| 16 to 19 Years | 0 (0.0%) | 0 (0.0%) |
| 20 to 24 Years | 154 (58.6%) | 0 (0.0%) |
| 25 to 29 Years | 40 (46.5%) | 0 (0.0%) |
| 30 to 34 Years | 21 (100.0%) | 0 (0.0%) |
| 35 to 44 Years | 57 (64.8%) | 35 (61.4%) |
| 45 to 54 Years | 122 (69.7%) | 0 (0.0%) |
| 55 to 59 Years | 13 (16.9%) | 0 (0.0%) |
| 60 to 64 Years | 0 (0.0%) | 0 (0.0%) |
| 65 to 74 Years | 0 (0.0%) | 0 (0.0%) |
| 75 Years and over | 0 (0.0%) | 0 (0.0%) |
| Total | 407 (45.4%) | 35 (8.6%) |
Employment Status by Educational Attainment in Casa Blanca
According to labor force statistics for Casa Blanca, 51.6% of individuals (253) out of the total population between 25 and 64 years of age (490) are in the labor force, with 13.8% or 35 of them being unemployed. The group with the highest labor force participation rate are those with the educational attainment of bachelor's degree or higher, with 79.2% or 42 individuals in the labor force. Within the labor force, individuals with high school diploma education have the highest percentage of unemployment, with 32.9% or 24 of them being unemployed.
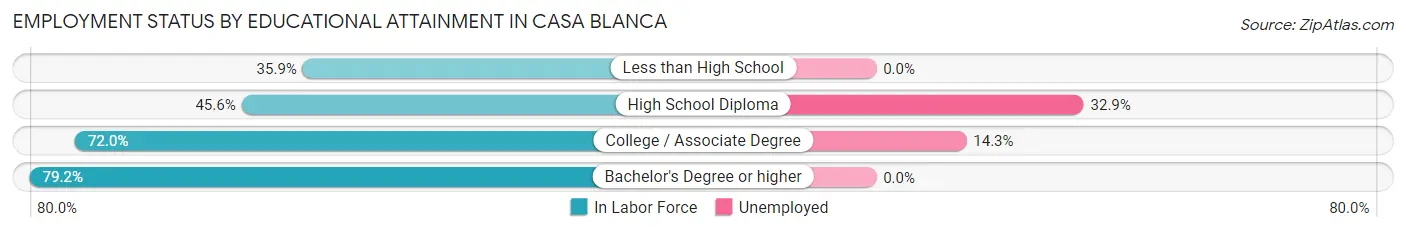
| Educational Attainment | In Labor Force | Unemployed |
| Less than High School | 61 (35.9%) | 0 (0.0%) |
| High School Diploma | 73 (45.6%) | 53 (32.9%) |
| College / Associate Degree | 77 (72.0%) | 15 (14.3%) |
| Bachelor's Degree or higher | 42 (79.2%) | 0 (0.0%) |
| Total | 253 (51.6%) | 68 (13.8%) |
Employment Occupations by Sex in Casa Blanca
Management, Business, Science and Arts Occupations
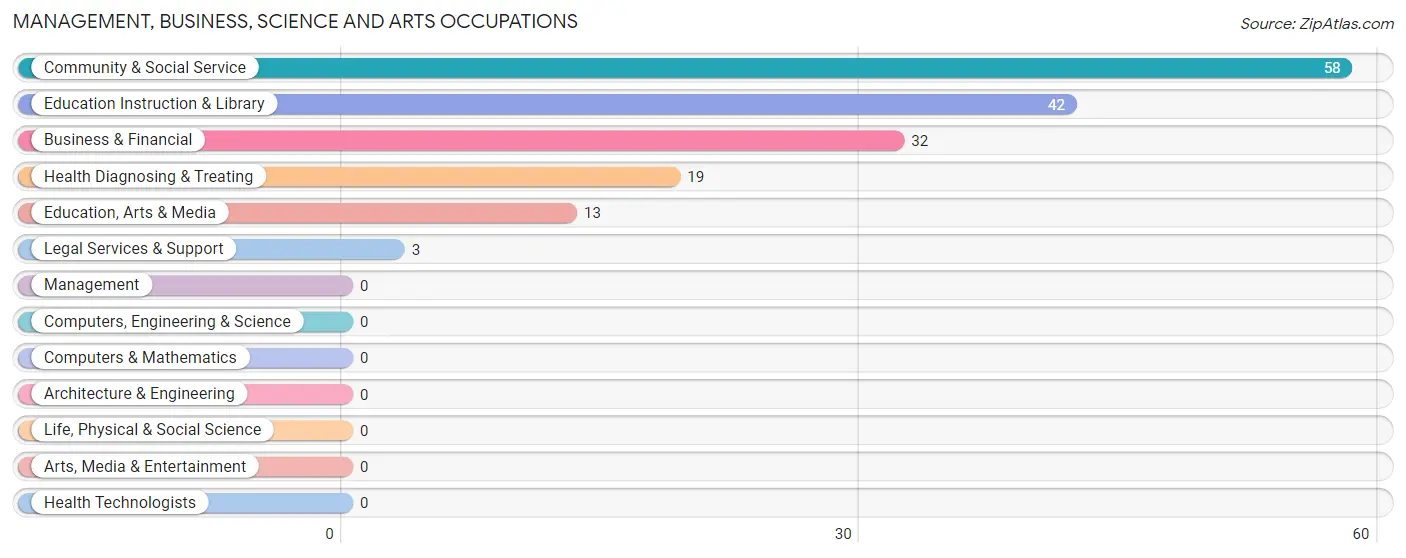
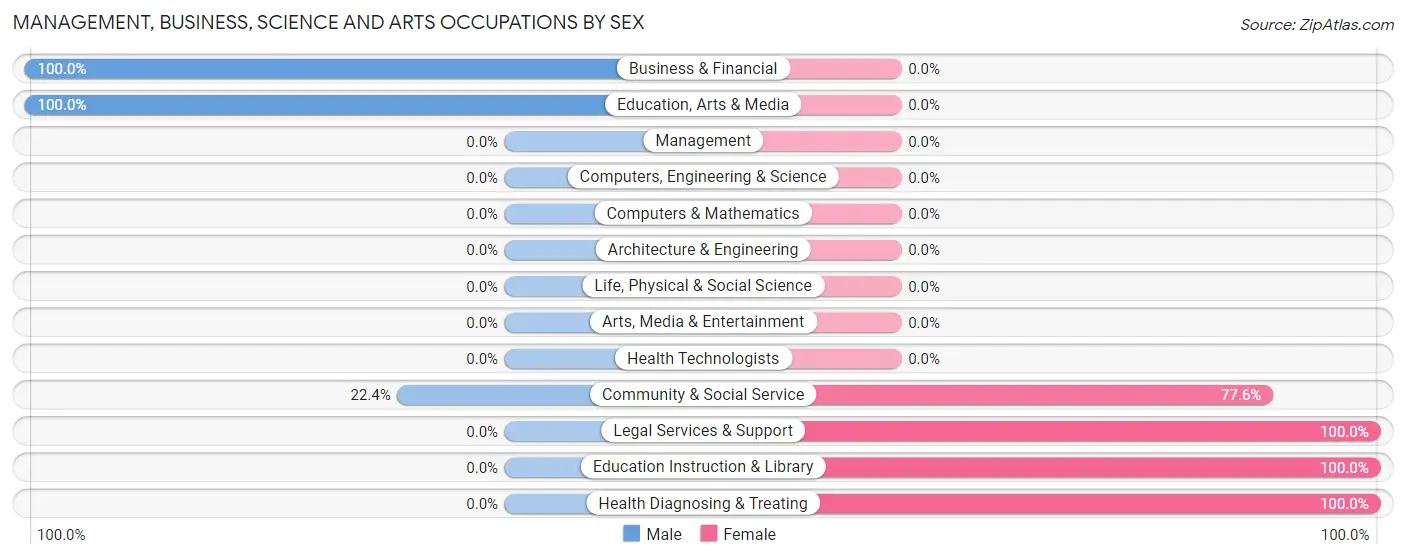
The most common Management, Business, Science and Arts occupations in Casa Blanca are Community & Social Service (58 | 15.6%), Education Instruction & Library (42 | 11.3%), Business & Financial (32 | 8.6%), Health Diagnosing & Treating (19 | 5.1%), and Education, Arts & Media (13 | 3.5%).
Management, Business, Science and Arts Occupations by Sex
Within the Management, Business, Science and Arts occupations in Casa Blanca, the most male-oriented occupations are Business & Financial (100.0%), Education, Arts & Media (100.0%), and Community & Social Service (22.4%), while the most female-oriented occupations are Legal Services & Support (100.0%), Education Instruction & Library (100.0%), and Health Diagnosing & Treating (100.0%).
| Occupation | Male | Female |
| Management | 0 (0.0%) | 0 (0.0%) |
| Business & Financial | 32 (100.0%) | 0 (0.0%) |
| Computers, Engineering & Science | 0 (0.0%) | 0 (0.0%) |
| Computers & Mathematics | 0 (0.0%) | 0 (0.0%) |
| Architecture & Engineering | 0 (0.0%) | 0 (0.0%) |
| Life, Physical & Social Science | 0 (0.0%) | 0 (0.0%) |
| Community & Social Service | 13 (22.4%) | 45 (77.6%) |
| Education, Arts & Media | 13 (100.0%) | 0 (0.0%) |
| Legal Services & Support | 0 (0.0%) | 3 (100.0%) |
| Education Instruction & Library | 0 (0.0%) | 42 (100.0%) |
| Arts, Media & Entertainment | 0 (0.0%) | 0 (0.0%) |
| Health Diagnosing & Treating | 0 (0.0%) | 19 (100.0%) |
| Health Technologists | 0 (0.0%) | 0 (0.0%) |
| Total (Category) | 45 (41.3%) | 64 (58.7%) |
| Total (Overall) | 213 (57.3%) | 159 (42.7%) |
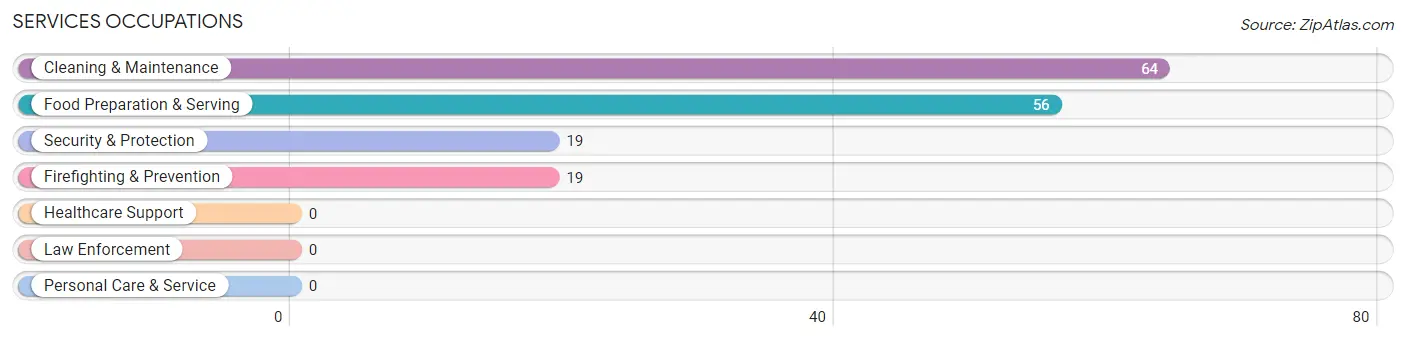
Services Occupations
The most common Services occupations in Casa Blanca are Cleaning & Maintenance (64 | 17.2%), Food Preparation & Serving (56 | 15.0%), Security & Protection (19 | 5.1%), and Firefighting & Prevention (19 | 5.1%).
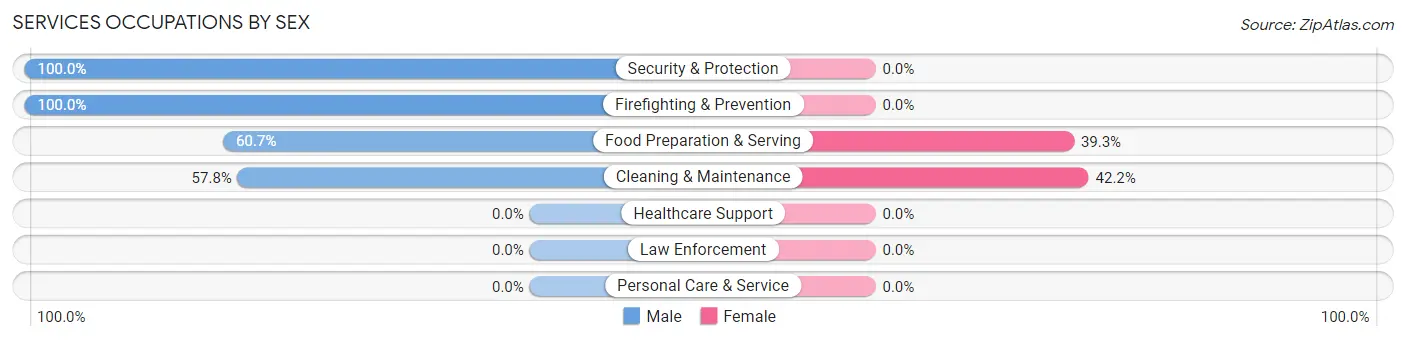
Services Occupations by Sex
Within the Services occupations in Casa Blanca, the most male-oriented occupations are Security & Protection (100.0%), Firefighting & Prevention (100.0%), and Food Preparation & Serving (60.7%), while the most female-oriented occupations are Cleaning & Maintenance (42.2%), and Food Preparation & Serving (39.3%).
| Occupation | Male | Female |
| Healthcare Support | 0 (0.0%) | 0 (0.0%) |
| Security & Protection | 19 (100.0%) | 0 (0.0%) |
| Firefighting & Prevention | 19 (100.0%) | 0 (0.0%) |
| Law Enforcement | 0 (0.0%) | 0 (0.0%) |
| Food Preparation & Serving | 34 (60.7%) | 22 (39.3%) |
| Cleaning & Maintenance | 37 (57.8%) | 27 (42.2%) |
| Personal Care & Service | 0 (0.0%) | 0 (0.0%) |
| Total (Category) | 90 (64.7%) | 49 (35.2%) |
| Total (Overall) | 213 (57.3%) | 159 (42.7%) |
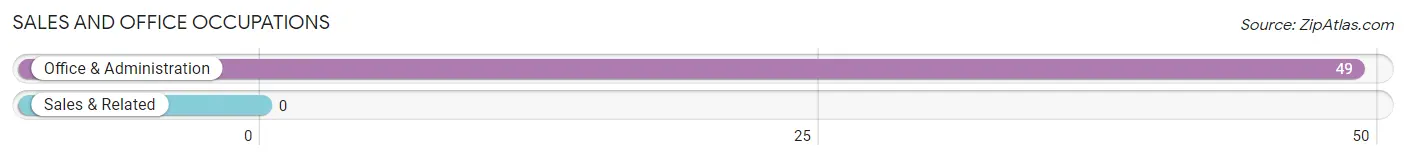
Sales and Office Occupations
The most common Sales and Office occupations in Casa Blanca are , and Office & Administration (49 | 13.2%).
Sales and Office Occupations by Sex

| Occupation | Male | Female |
| Sales & Related | 0 (0.0%) | 0 (0.0%) |
| Office & Administration | 24 (49.0%) | 25 (51.0%) |
| Total (Category) | 24 (49.0%) | 25 (51.0%) |
| Total (Overall) | 213 (57.3%) | 159 (42.7%) |
Natural Resources, Construction and Maintenance Occupations
The most common Natural Resources, Construction and Maintenance occupations in Casa Blanca are , and Construction & Extraction (54 | 14.5%).
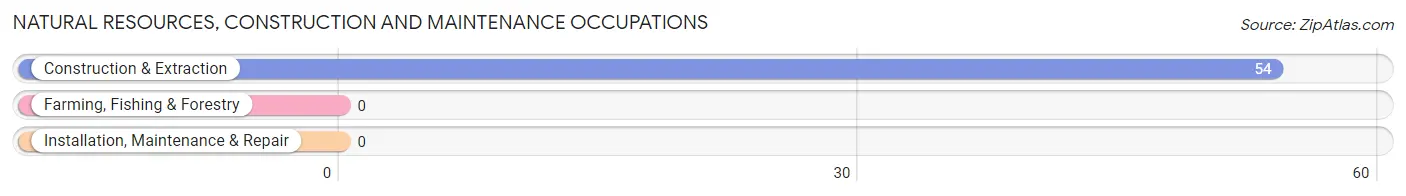
Natural Resources, Construction and Maintenance Occupations by Sex
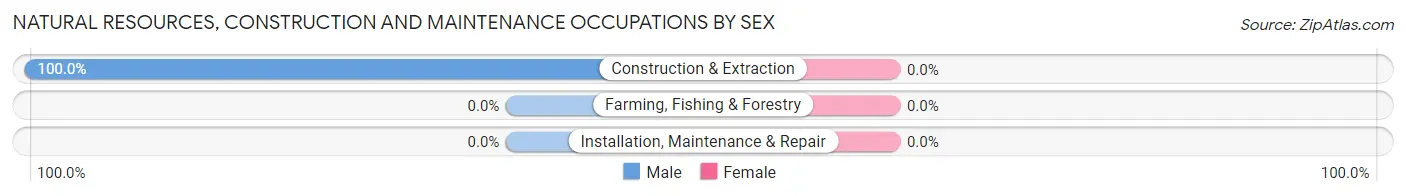
| Occupation | Male | Female |
| Farming, Fishing & Forestry | 0 (0.0%) | 0 (0.0%) |
| Construction & Extraction | 54 (100.0%) | 0 (0.0%) |
| Installation, Maintenance & Repair | 0 (0.0%) | 0 (0.0%) |
| Total (Category) | 54 (100.0%) | 0 (0.0%) |
| Total (Overall) | 213 (57.3%) | 159 (42.7%) |
Production, Transportation and Moving Occupations
The most common Production, Transportation and Moving occupations in Casa Blanca are , and Transportation (21 | 5.7%).
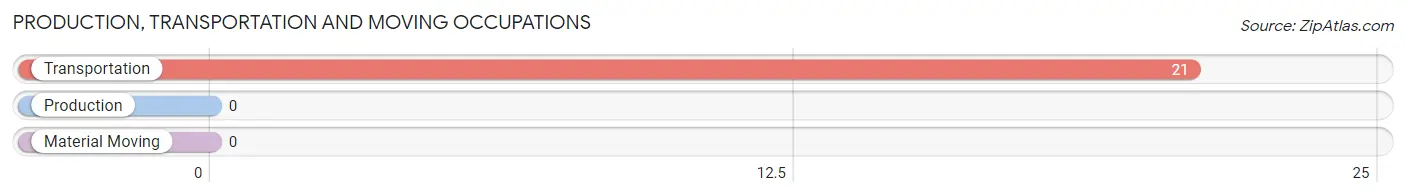
Production, Transportation and Moving Occupations by Sex
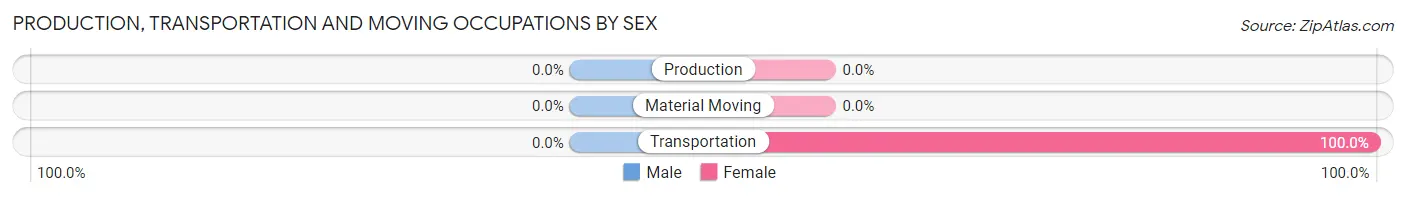
| Occupation | Male | Female |
| Production | 0 (0.0%) | 0 (0.0%) |
| Transportation | 0 (0.0%) | 21 (100.0%) |
| Material Moving | 0 (0.0%) | 0 (0.0%) |
| Total (Category) | 0 (0.0%) | 21 (100.0%) |
| Total (Overall) | 213 (57.3%) | 159 (42.7%) |
Employment Industries by Sex in Casa Blanca
Employment Industries in Casa Blanca
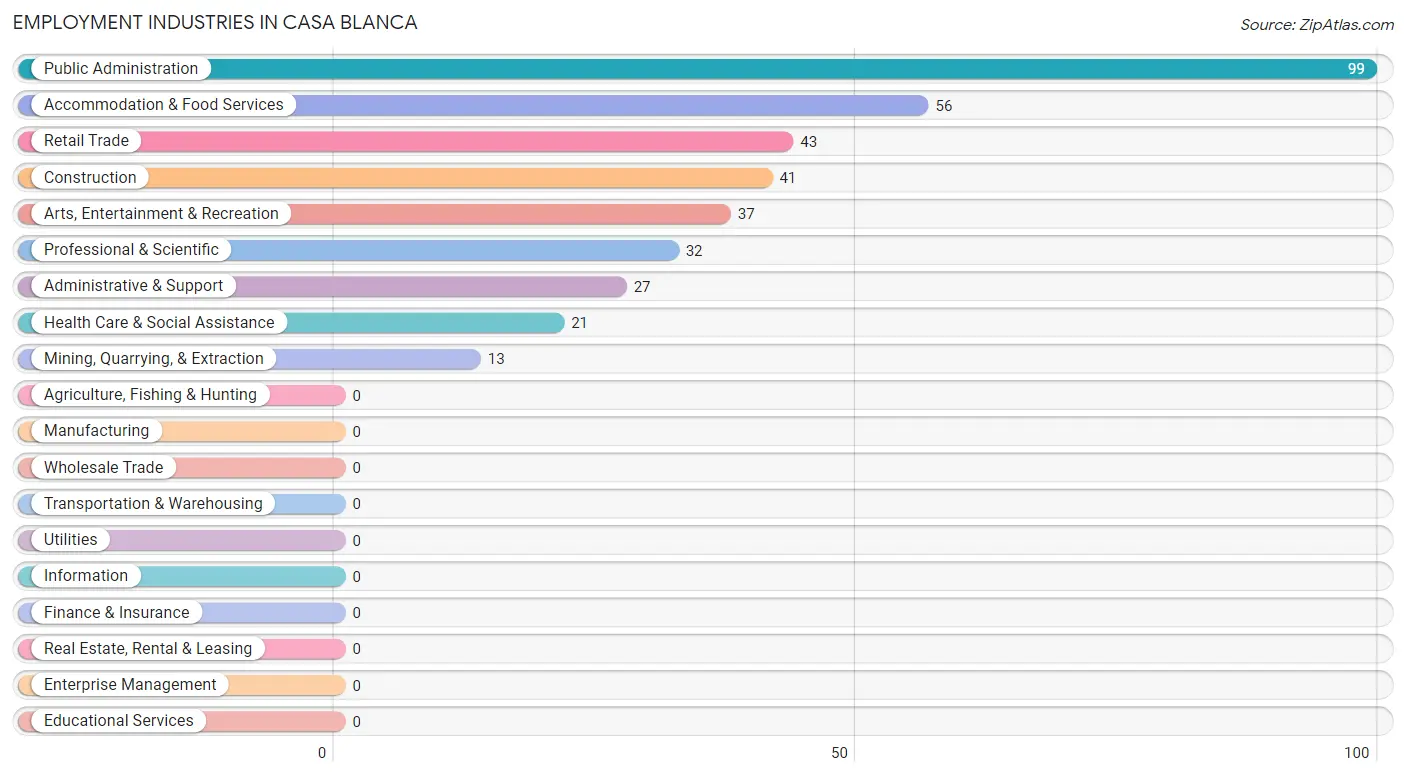
The major employment industries in Casa Blanca include Public Administration (99 | 26.6%), Accommodation & Food Services (56 | 15.0%), Retail Trade (43 | 11.6%), Construction (41 | 11.0%), and Arts, Entertainment & Recreation (37 | 10.0%).
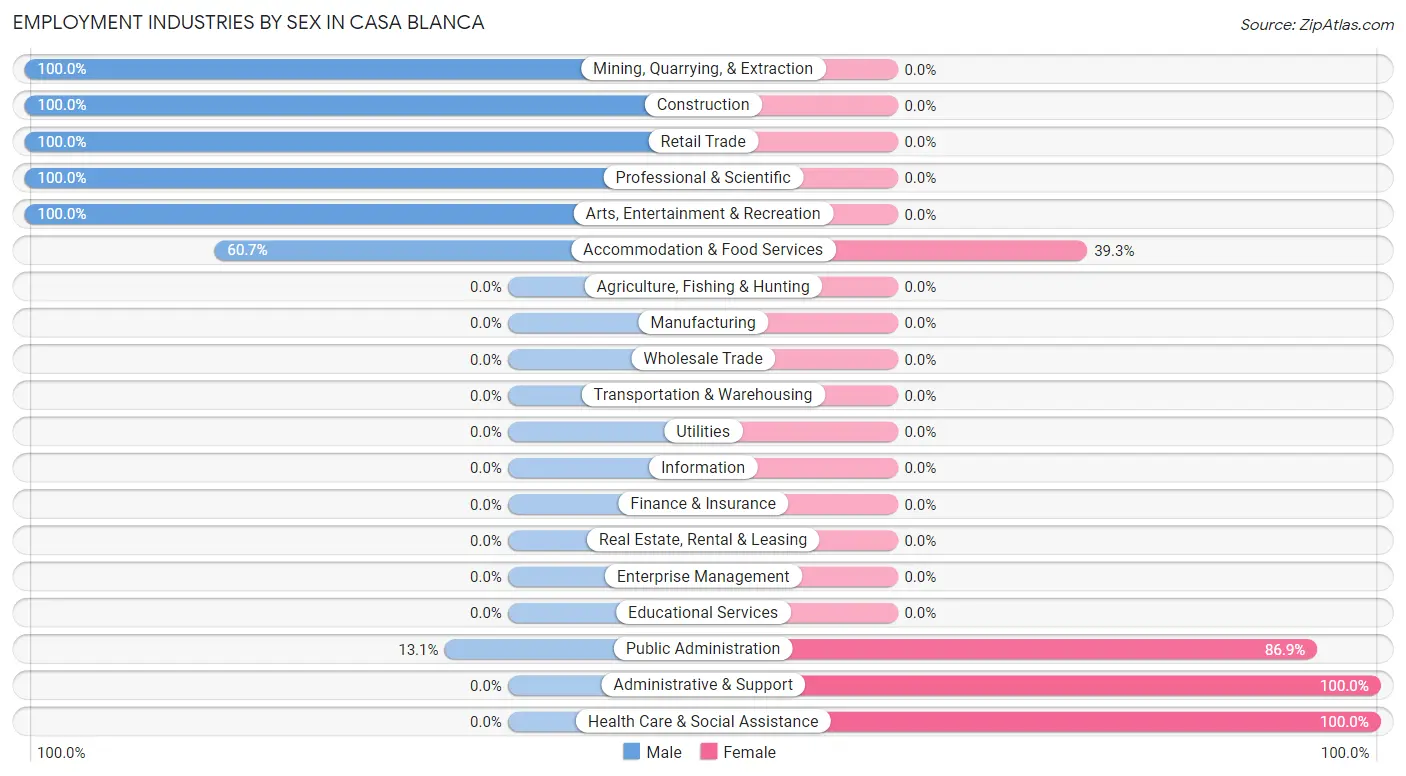
Employment Industries by Sex in Casa Blanca
The Casa Blanca industries that see more men than women are Mining, Quarrying, & Extraction (100.0%), Construction (100.0%), and Retail Trade (100.0%), whereas the industries that tend to have a higher number of women are Administrative & Support (100.0%), Health Care & Social Assistance (100.0%), and Public Administration (86.9%).
| Industry | Male | Female |
| Agriculture, Fishing & Hunting | 0 (0.0%) | 0 (0.0%) |
| Mining, Quarrying, & Extraction | 13 (100.0%) | 0 (0.0%) |
| Construction | 41 (100.0%) | 0 (0.0%) |
| Manufacturing | 0 (0.0%) | 0 (0.0%) |
| Wholesale Trade | 0 (0.0%) | 0 (0.0%) |
| Retail Trade | 43 (100.0%) | 0 (0.0%) |
| Transportation & Warehousing | 0 (0.0%) | 0 (0.0%) |
| Utilities | 0 (0.0%) | 0 (0.0%) |
| Information | 0 (0.0%) | 0 (0.0%) |
| Finance & Insurance | 0 (0.0%) | 0 (0.0%) |
| Real Estate, Rental & Leasing | 0 (0.0%) | 0 (0.0%) |
| Professional & Scientific | 32 (100.0%) | 0 (0.0%) |
| Enterprise Management | 0 (0.0%) | 0 (0.0%) |
| Administrative & Support | 0 (0.0%) | 27 (100.0%) |
| Educational Services | 0 (0.0%) | 0 (0.0%) |
| Health Care & Social Assistance | 0 (0.0%) | 21 (100.0%) |
| Arts, Entertainment & Recreation | 37 (100.0%) | 0 (0.0%) |
| Accommodation & Food Services | 34 (60.7%) | 22 (39.3%) |
| Public Administration | 13 (13.1%) | 86 (86.9%) |
| Total | 213 (57.3%) | 159 (42.7%) |
Education in Casa Blanca
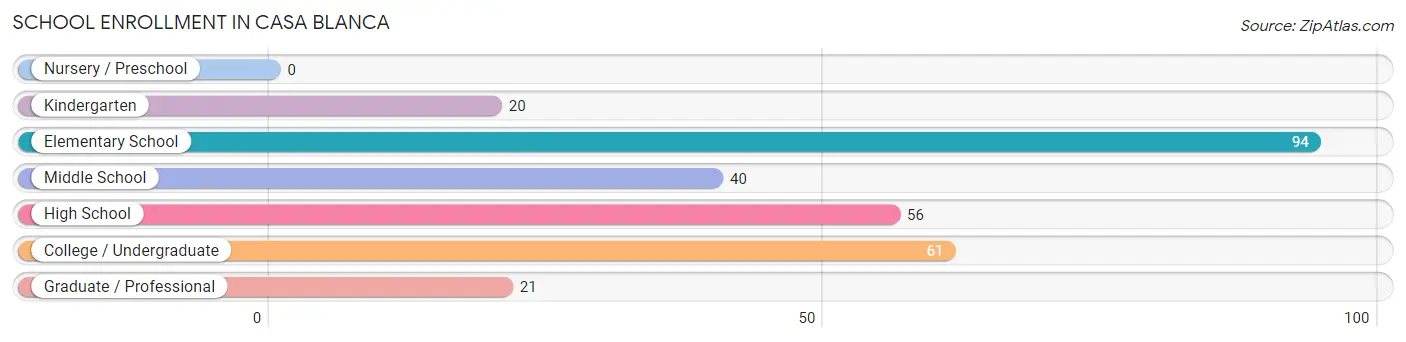
School Enrollment in Casa Blanca
The most common levels of schooling among the 292 students in Casa Blanca are elementary school (94 | 32.2%), college / undergraduate (61 | 20.9%), and high school (56 | 19.2%).
| School Level | # Students | % Students |
| Nursery / Preschool | 0 | 0.0% |
| Kindergarten | 20 | 6.9% |
| Elementary School | 94 | 32.2% |
| Middle School | 40 | 13.7% |
| High School | 56 | 19.2% |
| College / Undergraduate | 61 | 20.9% |
| Graduate / Professional | 21 | 7.2% |
| Total | 292 | 100.0% |
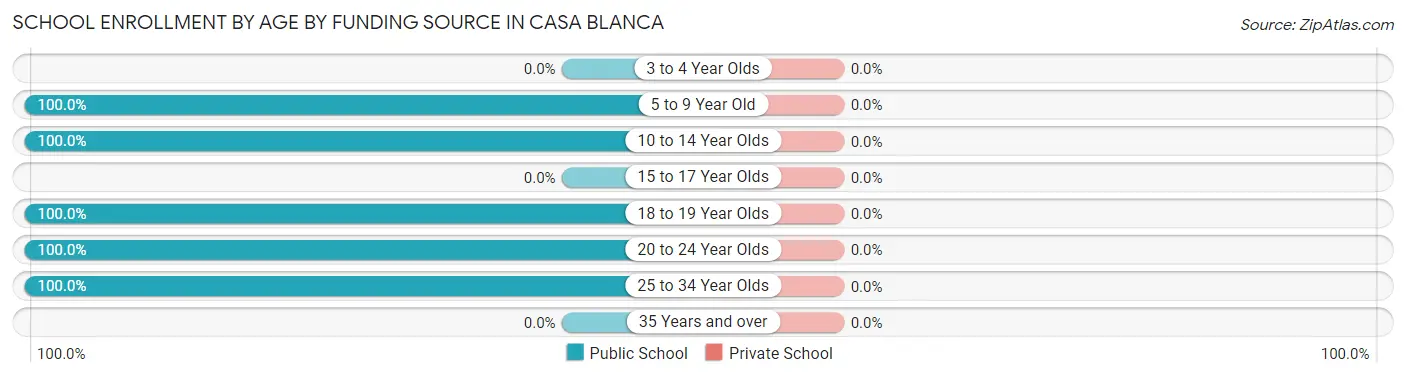
School Enrollment by Age by Funding Source in Casa Blanca
| Age Bracket | Public School | Private School |
| 3 to 4 Year Olds | 0 (0.0%) | 0 (0.0%) |
| 5 to 9 Year Old | 114 (100.0%) | 0 (0.0%) |
| 10 to 14 Year Olds | 59 (100.0%) | 0 (0.0%) |
| 15 to 17 Year Olds | 0 (0.0%) | 0 (0.0%) |
| 18 to 19 Year Olds | 51 (100.0%) | 0 (0.0%) |
| 20 to 24 Year Olds | 47 (100.0%) | 0 (0.0%) |
| 25 to 34 Year Olds | 21 (100.0%) | 0 (0.0%) |
| 35 Years and over | 0 (0.0%) | 0 (0.0%) |
| Total | 292 (100.0%) | 0 (0.0%) |
Educational Attainment by Field of Study in Casa Blanca
Education (21 | 39.6%), arts & humanities (21 | 39.6%), and visual & performing arts (11 | 20.7%) are the most common fields of study among 53 individuals in Casa Blanca who have obtained a bachelor's degree or higher.
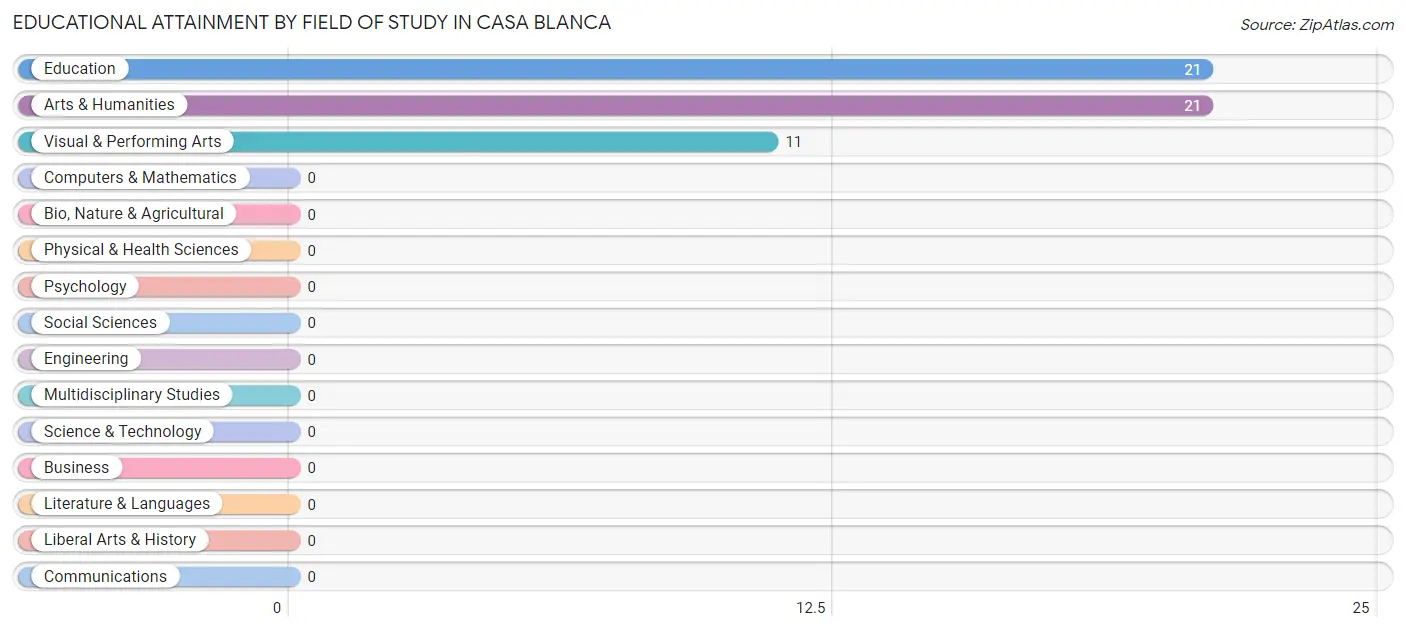
| Field of Study | # Graduates | % Graduates |
| Computers & Mathematics | 0 | 0.0% |
| Bio, Nature & Agricultural | 0 | 0.0% |
| Physical & Health Sciences | 0 | 0.0% |
| Psychology | 0 | 0.0% |
| Social Sciences | 0 | 0.0% |
| Engineering | 0 | 0.0% |
| Multidisciplinary Studies | 0 | 0.0% |
| Science & Technology | 0 | 0.0% |
| Business | 0 | 0.0% |
| Education | 21 | 39.6% |
| Literature & Languages | 0 | 0.0% |
| Liberal Arts & History | 0 | 0.0% |
| Visual & Performing Arts | 11 | 20.7% |
| Communications | 0 | 0.0% |
| Arts & Humanities | 21 | 39.6% |
| Total | 53 | 100.0% |
Transportation & Commute in Casa Blanca
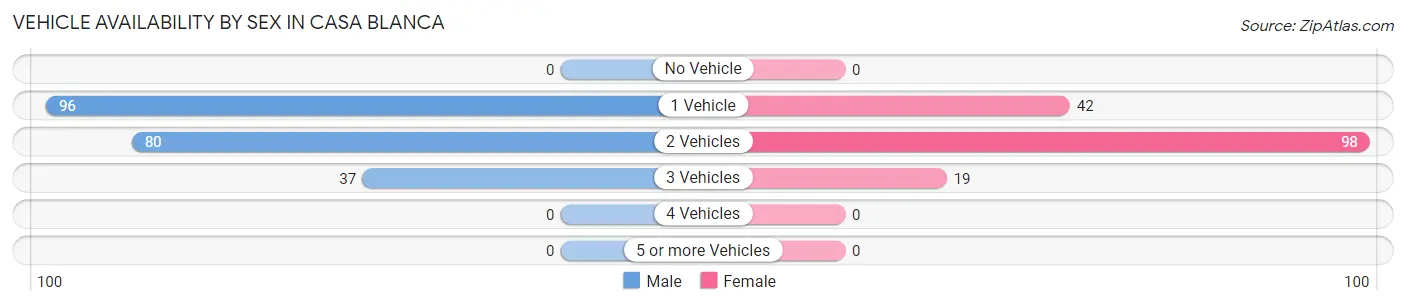
Vehicle Availability by Sex in Casa Blanca
The most prevalent vehicle ownership categories in Casa Blanca are males with 1 vehicle (96, accounting for 45.1%) and females with 1 vehicle (42, making up 60.4%).
| Vehicles Available | Male | Female |
| No Vehicle | 0 (0.0%) | 0 (0.0%) |
| 1 Vehicle | 96 (45.1%) | 42 (26.4%) |
| 2 Vehicles | 80 (37.6%) | 98 (61.6%) |
| 3 Vehicles | 37 (17.4%) | 19 (11.9%) |
| 4 Vehicles | 0 (0.0%) | 0 (0.0%) |
| 5 or more Vehicles | 0 (0.0%) | 0 (0.0%) |
| Total | 213 (100.0%) | 159 (100.0%) |
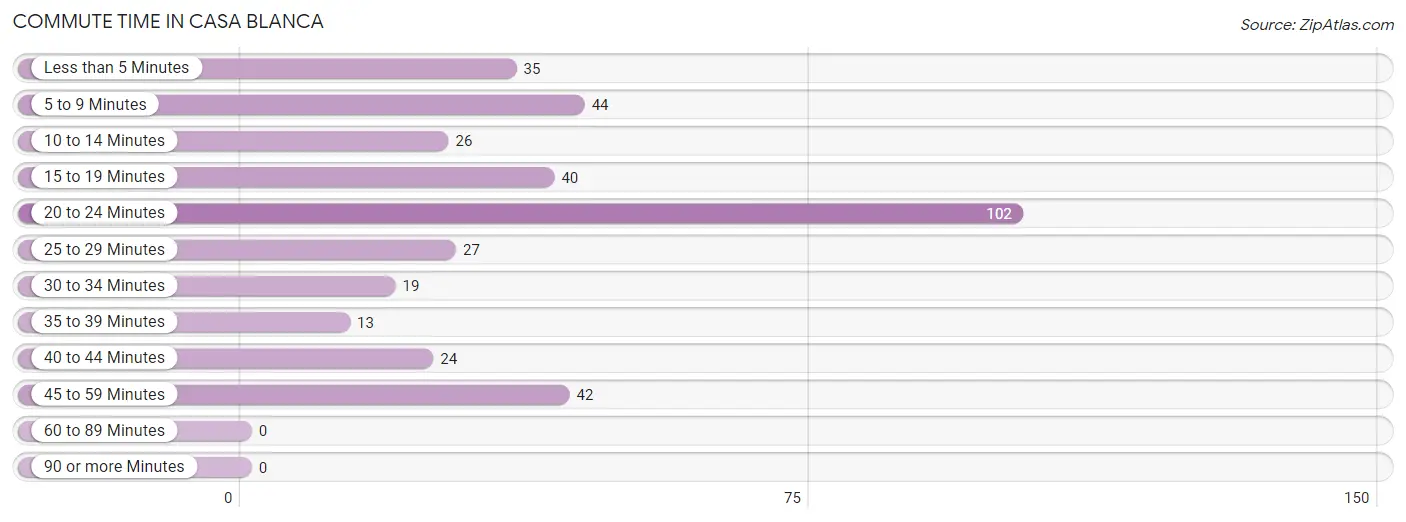
Commute Time in Casa Blanca
The most frequently occuring commute durations in Casa Blanca are 20 to 24 minutes (102 commuters, 27.4%), 5 to 9 minutes (44 commuters, 11.8%), and 45 to 59 minutes (42 commuters, 11.3%).
| Commute Time | # Commuters | % Commuters |
| Less than 5 Minutes | 35 | 9.4% |
| 5 to 9 Minutes | 44 | 11.8% |
| 10 to 14 Minutes | 26 | 7.0% |
| 15 to 19 Minutes | 40 | 10.7% |
| 20 to 24 Minutes | 102 | 27.4% |
| 25 to 29 Minutes | 27 | 7.3% |
| 30 to 34 Minutes | 19 | 5.1% |
| 35 to 39 Minutes | 13 | 3.5% |
| 40 to 44 Minutes | 24 | 6.5% |
| 45 to 59 Minutes | 42 | 11.3% |
| 60 to 89 Minutes | 0 | 0.0% |
| 90 or more Minutes | 0 | 0.0% |
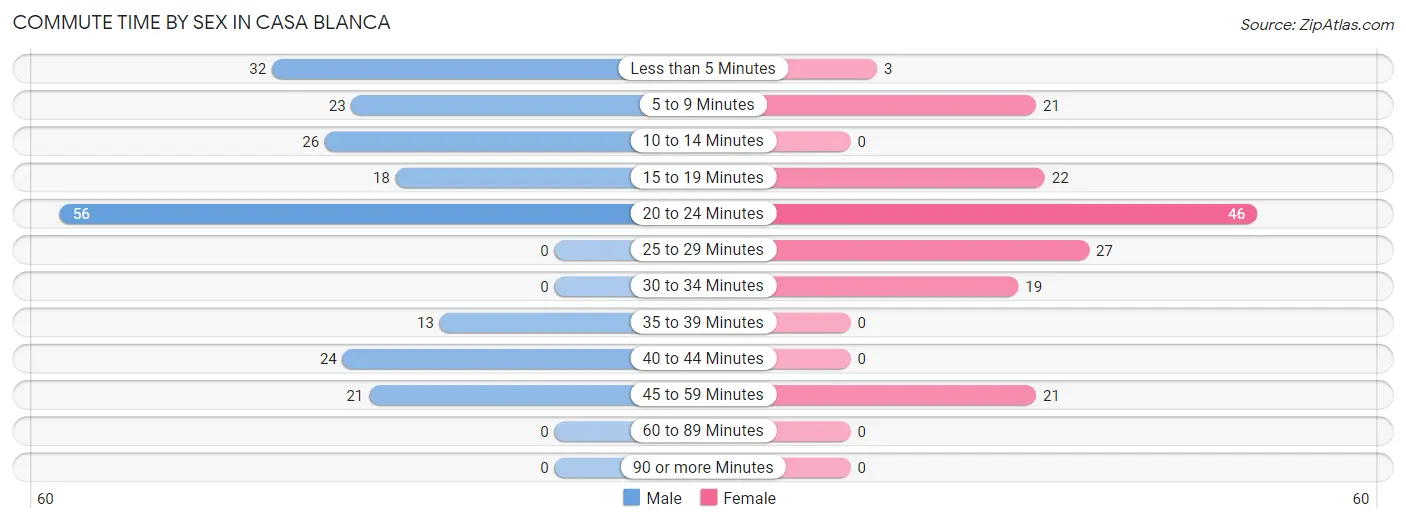
Commute Time by Sex in Casa Blanca
The most common commute times in Casa Blanca are 20 to 24 minutes (56 commuters, 26.3%) for males and 20 to 24 minutes (46 commuters, 28.9%) for females.
| Commute Time | Male | Female |
| Less than 5 Minutes | 32 (15.0%) | 3 (1.9%) |
| 5 to 9 Minutes | 23 (10.8%) | 21 (13.2%) |
| 10 to 14 Minutes | 26 (12.2%) | 0 (0.0%) |
| 15 to 19 Minutes | 18 (8.5%) | 22 (13.8%) |
| 20 to 24 Minutes | 56 (26.3%) | 46 (28.9%) |
| 25 to 29 Minutes | 0 (0.0%) | 27 (17.0%) |
| 30 to 34 Minutes | 0 (0.0%) | 19 (11.9%) |
| 35 to 39 Minutes | 13 (6.1%) | 0 (0.0%) |
| 40 to 44 Minutes | 24 (11.3%) | 0 (0.0%) |
| 45 to 59 Minutes | 21 (9.9%) | 21 (13.2%) |
| 60 to 89 Minutes | 0 (0.0%) | 0 (0.0%) |
| 90 or more Minutes | 0 (0.0%) | 0 (0.0%) |
Time of Departure to Work by Sex in Casa Blanca
The most frequent times of departure to work in Casa Blanca are 6:00 AM to 6:29 AM (54, 25.4%) for males and 7:30 AM to 7:59 AM (49, 30.8%) for females.
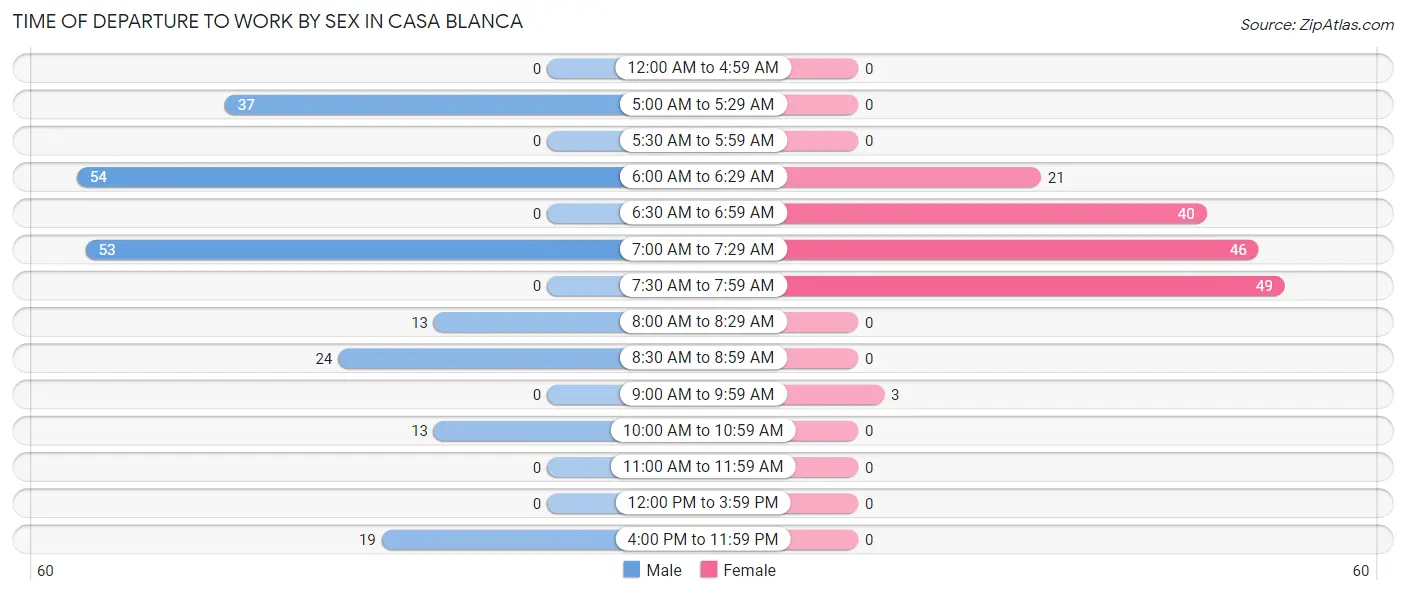
| Time of Departure | Male | Female |
| 12:00 AM to 4:59 AM | 0 (0.0%) | 0 (0.0%) |
| 5:00 AM to 5:29 AM | 37 (17.4%) | 0 (0.0%) |
| 5:30 AM to 5:59 AM | 0 (0.0%) | 0 (0.0%) |
| 6:00 AM to 6:29 AM | 54 (25.4%) | 21 (13.2%) |
| 6:30 AM to 6:59 AM | 0 (0.0%) | 40 (25.2%) |
| 7:00 AM to 7:29 AM | 53 (24.9%) | 46 (28.9%) |
| 7:30 AM to 7:59 AM | 0 (0.0%) | 49 (30.8%) |
| 8:00 AM to 8:29 AM | 13 (6.1%) | 0 (0.0%) |
| 8:30 AM to 8:59 AM | 24 (11.3%) | 0 (0.0%) |
| 9:00 AM to 9:59 AM | 0 (0.0%) | 3 (1.9%) |
| 10:00 AM to 10:59 AM | 13 (6.1%) | 0 (0.0%) |
| 11:00 AM to 11:59 AM | 0 (0.0%) | 0 (0.0%) |
| 12:00 PM to 3:59 PM | 0 (0.0%) | 0 (0.0%) |
| 4:00 PM to 11:59 PM | 19 (8.9%) | 0 (0.0%) |
| Total | 213 (100.0%) | 159 (100.0%) |
Housing Occupancy in Casa Blanca
Occupancy by Ownership in Casa Blanca
Of the total 352 dwellings in Casa Blanca, owner-occupied units account for 178 (50.6%), while renter-occupied units make up 174 (49.4%).
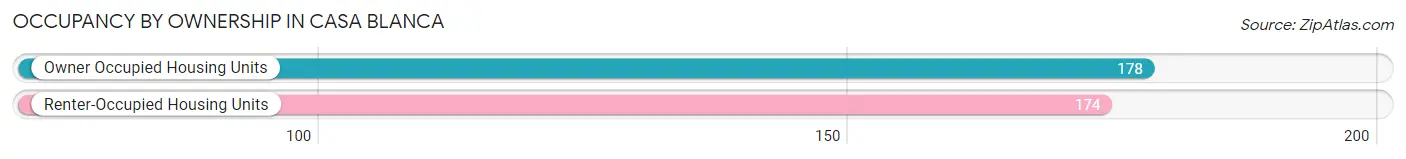
| Occupancy | # Housing Units | % Housing Units |
| Owner Occupied Housing Units | 178 | 50.6% |
| Renter-Occupied Housing Units | 174 | 49.4% |
| Total Occupied Housing Units | 352 | 100.0% |
Occupancy by Household Size in Casa Blanca
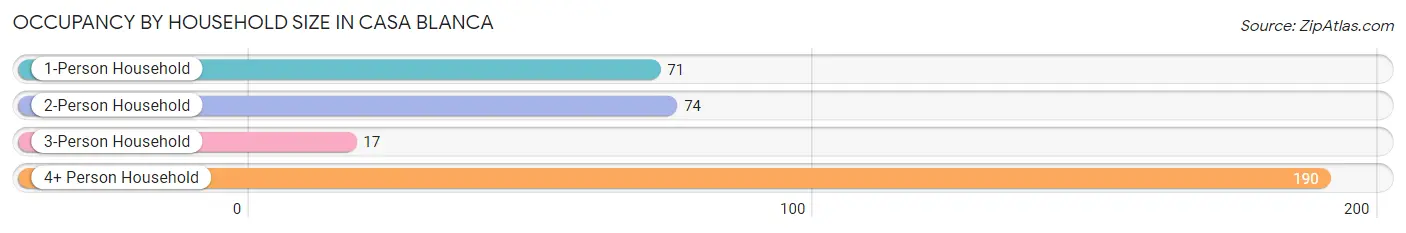
| Household Size | # Housing Units | % Housing Units |
| 1-Person Household | 71 | 20.2% |
| 2-Person Household | 74 | 21.0% |
| 3-Person Household | 17 | 4.8% |
| 4+ Person Household | 190 | 54.0% |
| Total Housing Units | 352 | 100.0% |
Occupancy by Ownership by Household Size in Casa Blanca
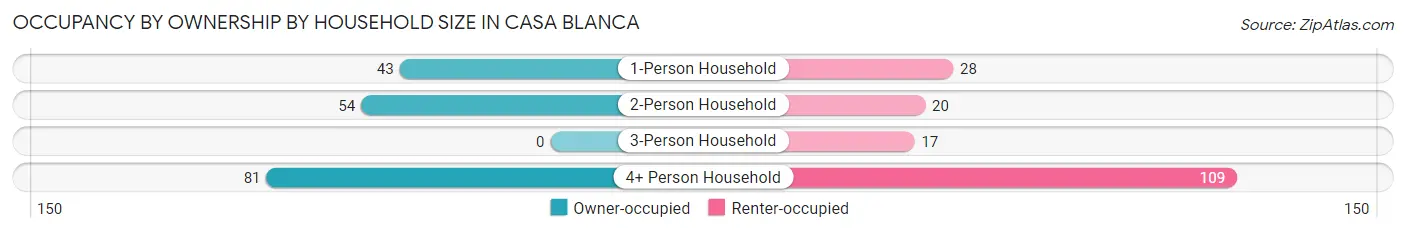
| Household Size | Owner-occupied | Renter-occupied |
| 1-Person Household | 43 (60.6%) | 28 (39.4%) |
| 2-Person Household | 54 (73.0%) | 20 (27.0%) |
| 3-Person Household | 0 (0.0%) | 17 (100.0%) |
| 4+ Person Household | 81 (42.6%) | 109 (57.4%) |
| Total Housing Units | 178 (50.6%) | 174 (49.4%) |
Occupancy by Educational Attainment in Casa Blanca
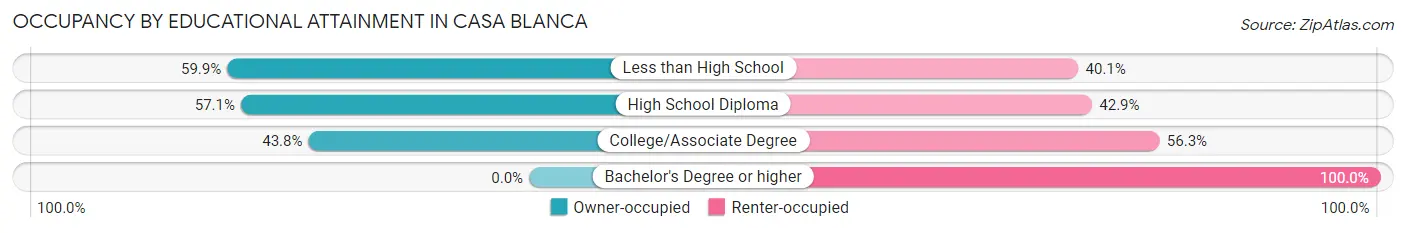
| Household Size | Owner-occupied | Renter-occupied |
| Less than High School | 85 (59.9%) | 57 (40.1%) |
| High School Diploma | 44 (57.1%) | 33 (42.9%) |
| College/Associate Degree | 49 (43.8%) | 63 (56.2%) |
| Bachelor's Degree or higher | 0 (0.0%) | 21 (100.0%) |
Occupancy by Age of Householder in Casa Blanca
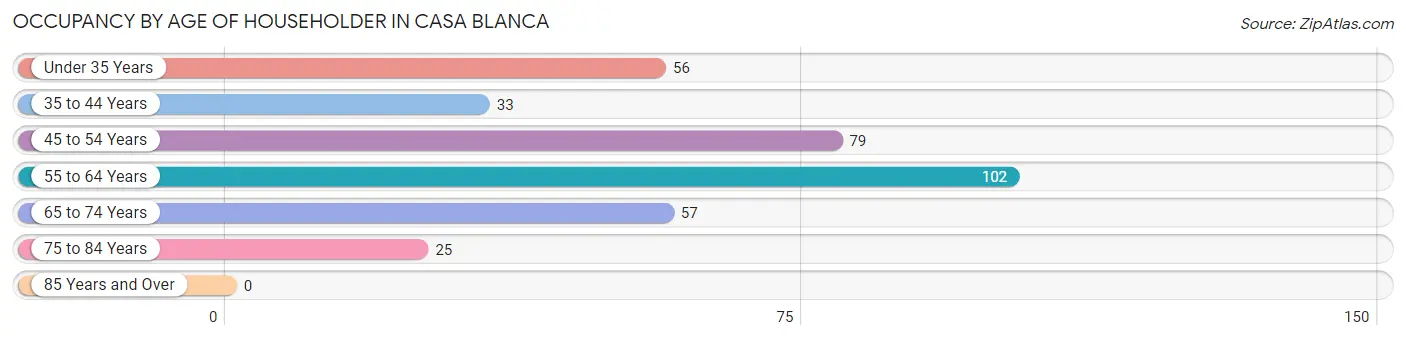
| Age Bracket | # Households | % Households |
| Under 35 Years | 56 | 15.9% |
| 35 to 44 Years | 33 | 9.4% |
| 45 to 54 Years | 79 | 22.4% |
| 55 to 64 Years | 102 | 29.0% |
| 65 to 74 Years | 57 | 16.2% |
| 75 to 84 Years | 25 | 7.1% |
| 85 Years and Over | 0 | 0.0% |
| Total | 352 | 100.0% |
Housing Finances in Casa Blanca
Median Income by Occupancy in Casa Blanca
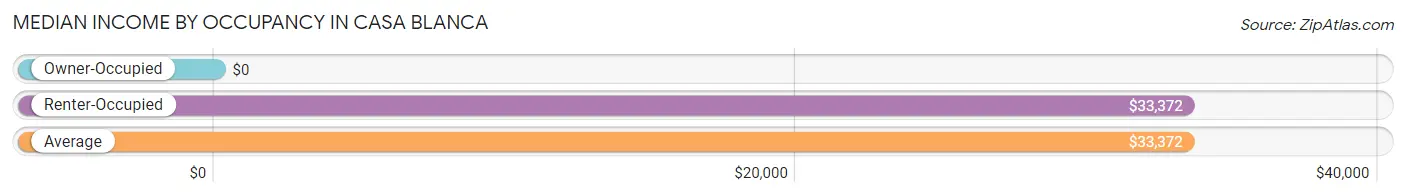
| Occupancy Type | # Households | Median Income |
| Owner-Occupied | 178 (50.6%) | $0 |
| Renter-Occupied | 174 (49.4%) | $33,372 |
| Average | 352 (100.0%) | $33,372 |
Occupancy by Householder Income Bracket in Casa Blanca
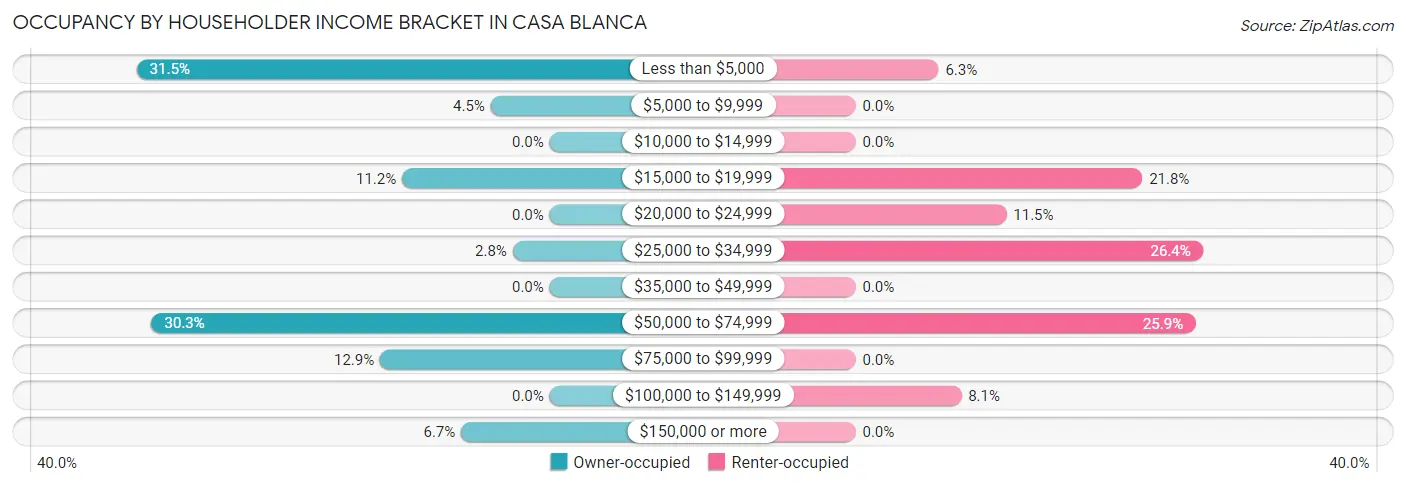
| Income Bracket | Owner-occupied | Renter-occupied |
| Less than $5,000 | 56 (31.5%) | 11 (6.3%) |
| $5,000 to $9,999 | 8 (4.5%) | 0 (0.0%) |
| $10,000 to $14,999 | 0 (0.0%) | 0 (0.0%) |
| $15,000 to $19,999 | 20 (11.2%) | 38 (21.8%) |
| $20,000 to $24,999 | 0 (0.0%) | 20 (11.5%) |
| $25,000 to $34,999 | 5 (2.8%) | 46 (26.4%) |
| $35,000 to $49,999 | 0 (0.0%) | 0 (0.0%) |
| $50,000 to $74,999 | 54 (30.3%) | 45 (25.9%) |
| $75,000 to $99,999 | 23 (12.9%) | 0 (0.0%) |
| $100,000 to $149,999 | 0 (0.0%) | 14 (8.1%) |
| $150,000 or more | 12 (6.7%) | 0 (0.0%) |
| Total | 178 (100.0%) | 174 (100.0%) |
Monthly Housing Cost Tiers in Casa Blanca
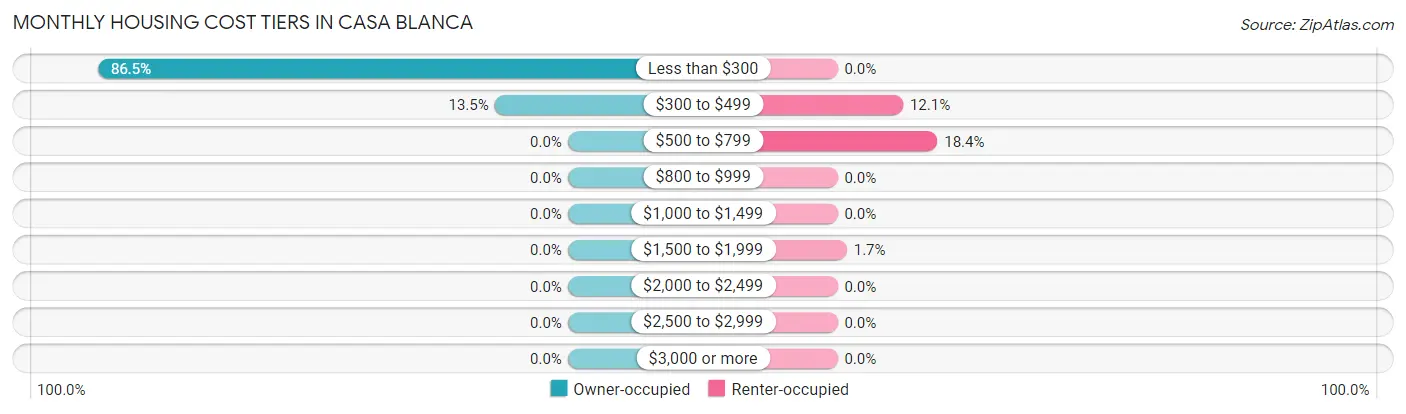
| Monthly Cost | Owner-occupied | Renter-occupied |
| Less than $300 | 154 (86.5%) | 0 (0.0%) |
| $300 to $499 | 24 (13.5%) | 21 (12.1%) |
| $500 to $799 | 0 (0.0%) | 32 (18.4%) |
| $800 to $999 | 0 (0.0%) | 0 (0.0%) |
| $1,000 to $1,499 | 0 (0.0%) | 0 (0.0%) |
| $1,500 to $1,999 | 0 (0.0%) | 3 (1.7%) |
| $2,000 to $2,499 | 0 (0.0%) | 0 (0.0%) |
| $2,500 to $2,999 | 0 (0.0%) | 0 (0.0%) |
| $3,000 or more | 0 (0.0%) | 0 (0.0%) |
| Total | 178 (100.0%) | 174 (100.0%) |
Physical Housing Characteristics in Casa Blanca
Housing Structures in Casa Blanca
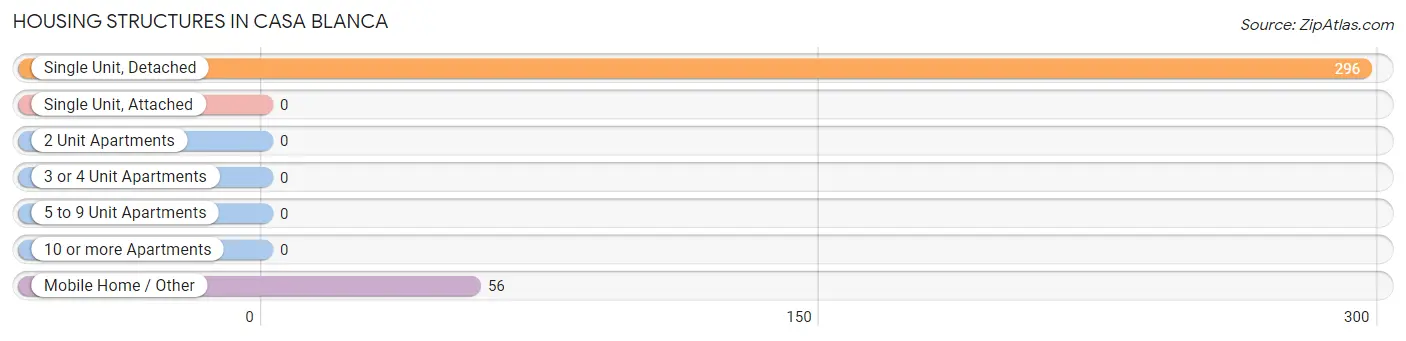
| Structure Type | # Housing Units | % Housing Units |
| Single Unit, Detached | 296 | 84.1% |
| Single Unit, Attached | 0 | 0.0% |
| 2 Unit Apartments | 0 | 0.0% |
| 3 or 4 Unit Apartments | 0 | 0.0% |
| 5 to 9 Unit Apartments | 0 | 0.0% |
| 10 or more Apartments | 0 | 0.0% |
| Mobile Home / Other | 56 | 15.9% |
| Total | 352 | 100.0% |
Housing Structures by Occupancy in Casa Blanca
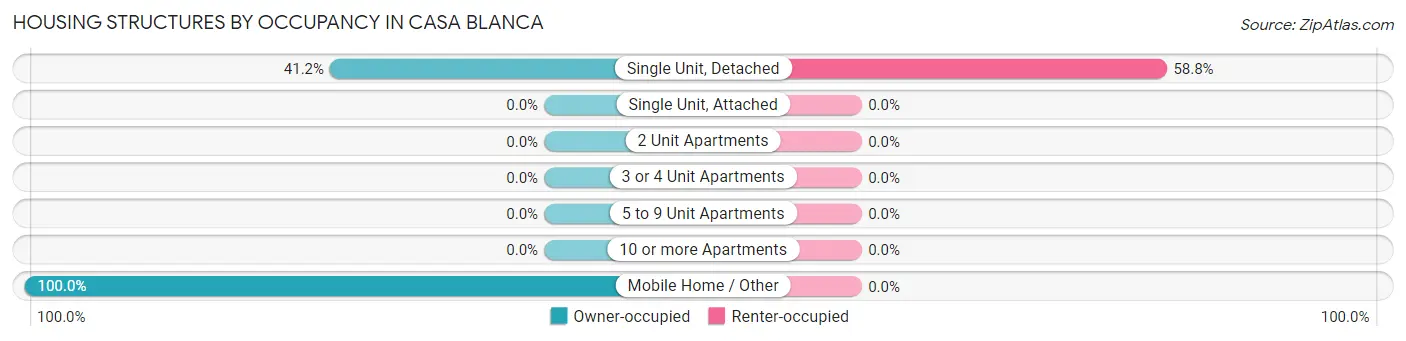
| Structure Type | Owner-occupied | Renter-occupied |
| Single Unit, Detached | 122 (41.2%) | 174 (58.8%) |
| Single Unit, Attached | 0 (0.0%) | 0 (0.0%) |
| 2 Unit Apartments | 0 (0.0%) | 0 (0.0%) |
| 3 or 4 Unit Apartments | 0 (0.0%) | 0 (0.0%) |
| 5 to 9 Unit Apartments | 0 (0.0%) | 0 (0.0%) |
| 10 or more Apartments | 0 (0.0%) | 0 (0.0%) |
| Mobile Home / Other | 56 (100.0%) | 0 (0.0%) |
| Total | 178 (50.6%) | 174 (49.4%) |
Housing Structures by Number of Rooms in Casa Blanca
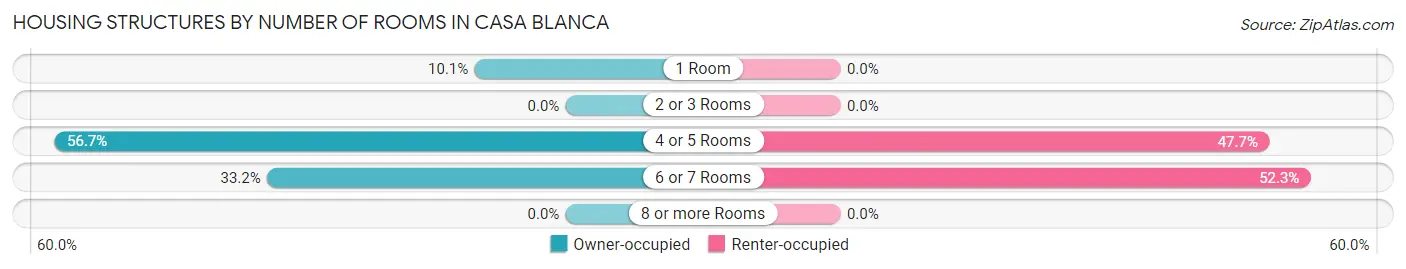
| Number of Rooms | Owner-occupied | Renter-occupied |
| 1 Room | 18 (10.1%) | 0 (0.0%) |
| 2 or 3 Rooms | 0 (0.0%) | 0 (0.0%) |
| 4 or 5 Rooms | 101 (56.7%) | 83 (47.7%) |
| 6 or 7 Rooms | 59 (33.2%) | 91 (52.3%) |
| 8 or more Rooms | 0 (0.0%) | 0 (0.0%) |
| Total | 178 (100.0%) | 174 (100.0%) |
Housing Structure by Heating Type in Casa Blanca
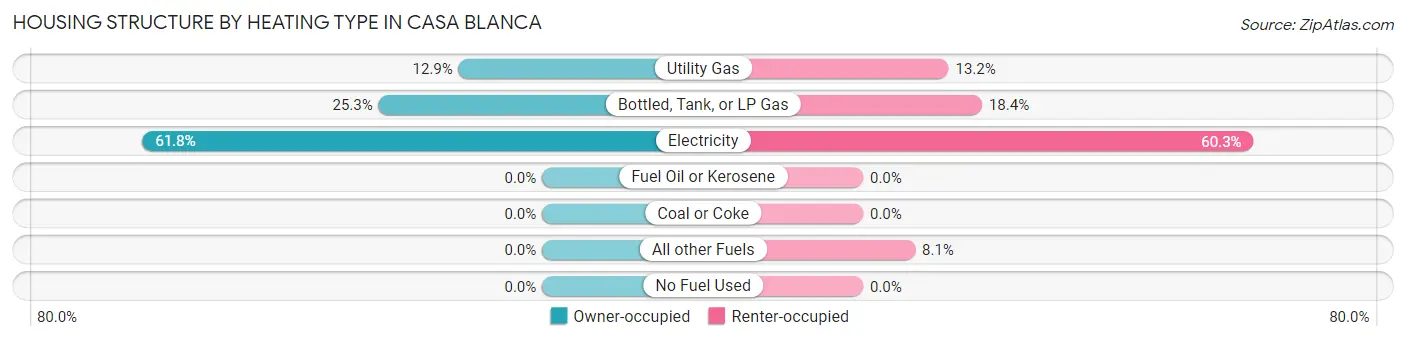
| Heating Type | Owner-occupied | Renter-occupied |
| Utility Gas | 23 (12.9%) | 23 (13.2%) |
| Bottled, Tank, or LP Gas | 45 (25.3%) | 32 (18.4%) |
| Electricity | 110 (61.8%) | 105 (60.3%) |
| Fuel Oil or Kerosene | 0 (0.0%) | 0 (0.0%) |
| Coal or Coke | 0 (0.0%) | 0 (0.0%) |
| All other Fuels | 0 (0.0%) | 14 (8.1%) |
| No Fuel Used | 0 (0.0%) | 0 (0.0%) |
| Total | 178 (100.0%) | 174 (100.0%) |
Household Vehicle Usage in Casa Blanca
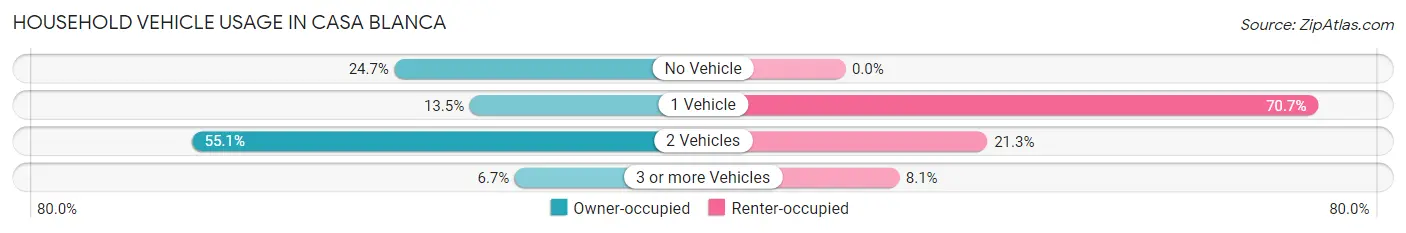
| Vehicles per Household | Owner-occupied | Renter-occupied |
| No Vehicle | 44 (24.7%) | 0 (0.0%) |
| 1 Vehicle | 24 (13.5%) | 123 (70.7%) |
| 2 Vehicles | 98 (55.1%) | 37 (21.3%) |
| 3 or more Vehicles | 12 (6.7%) | 14 (8.1%) |
| Total | 178 (100.0%) | 174 (100.0%) |
Real Estate & Mortgages in Casa Blanca
Real Estate and Mortgage Overview in Casa Blanca
| Characteristic | Without Mortgage | With Mortgage |
| Housing Units | 178 | 0 |
| Median Property Value | $66,800 | $0 |
| Median Household Income | - | - |
| Monthly Housing Costs | $179 | $0 |
| Real Estate Taxes | - | - |
Property Value by Mortgage Status in Casa Blanca
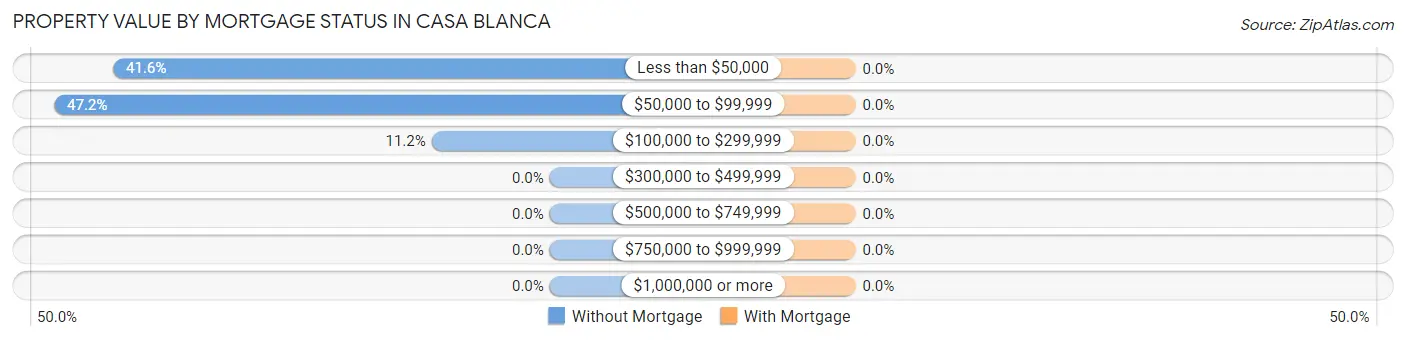
| Property Value | Without Mortgage | With Mortgage |
| Less than $50,000 | 74 (41.6%) | 0 (0.0%) |
| $50,000 to $99,999 | 84 (47.2%) | 0 (0.0%) |
| $100,000 to $299,999 | 20 (11.2%) | 0 (0.0%) |
| $300,000 to $499,999 | 0 (0.0%) | 0 (0.0%) |
| $500,000 to $749,999 | 0 (0.0%) | 0 (0.0%) |
| $750,000 to $999,999 | 0 (0.0%) | 0 (0.0%) |
| $1,000,000 or more | 0 (0.0%) | 0 (0.0%) |
| Total | 178 (100.0%) | 0 (0.0%) |
Household Income by Mortgage Status in Casa Blanca
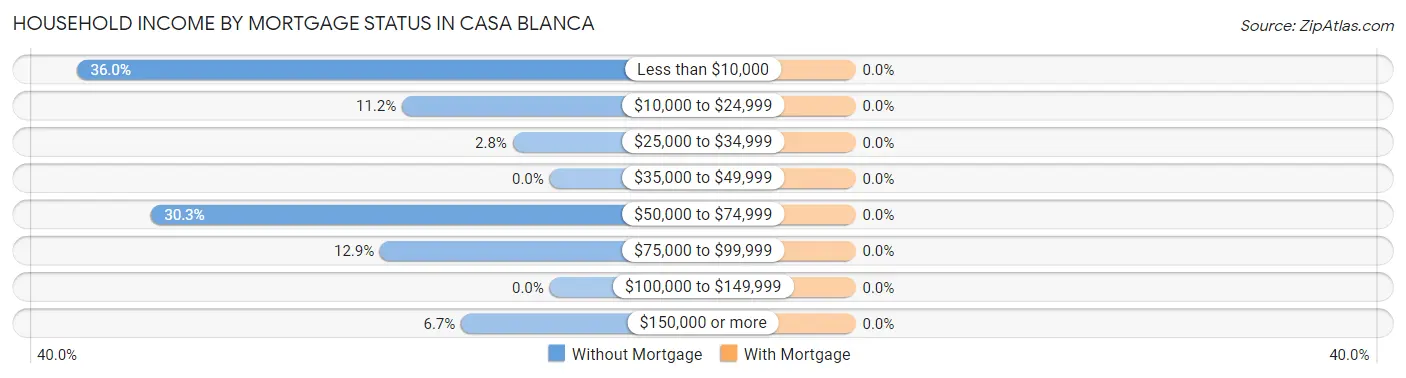
| Household Income | Without Mortgage | With Mortgage |
| Less than $10,000 | 64 (36.0%) | 0 (0.0%) |
| $10,000 to $24,999 | 20 (11.2%) | 0 (0.0%) |
| $25,000 to $34,999 | 5 (2.8%) | 0 (0.0%) |
| $35,000 to $49,999 | 0 (0.0%) | 0 (0.0%) |
| $50,000 to $74,999 | 54 (30.3%) | 0 (0.0%) |
| $75,000 to $99,999 | 23 (12.9%) | 0 (0.0%) |
| $100,000 to $149,999 | 0 (0.0%) | 0 (0.0%) |
| $150,000 or more | 12 (6.7%) | 0 (0.0%) |
| Total | 178 (100.0%) | 0 (0.0%) |
Property Value to Household Income Ratio in Casa Blanca
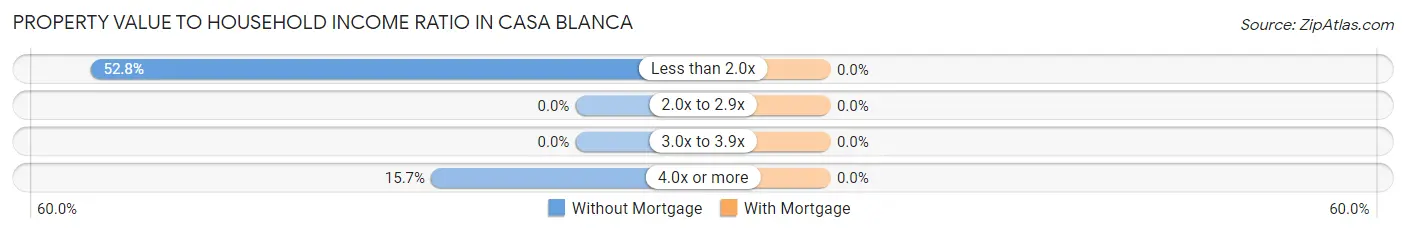
| Value-to-Income Ratio | Without Mortgage | With Mortgage |
| Less than 2.0x | 94 (52.8%) | 0 (0.0%) |
| 2.0x to 2.9x | 0 (0.0%) | 0 (0.0%) |
| 3.0x to 3.9x | 0 (0.0%) | 0 (0.0%) |
| 4.0x or more | 28 (15.7%) | 0 (0.0%) |
| Total | 178 (100.0%) | 0 (0.0%) |
Real Estate Taxes by Mortgage Status in Casa Blanca
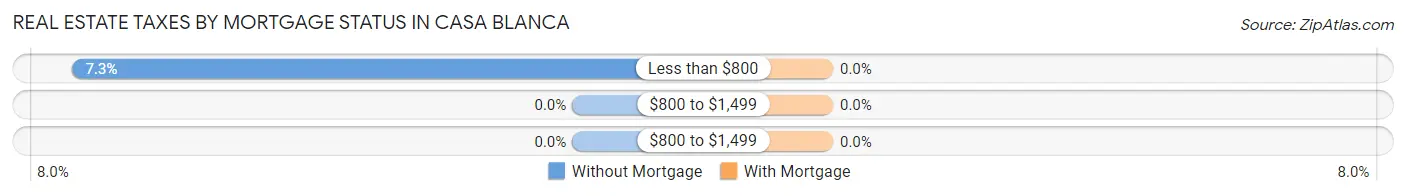
| Property Taxes | Without Mortgage | With Mortgage |
| Less than $800 | 13 (7.3%) | 0 (0.0%) |
| $800 to $1,499 | 0 (0.0%) | 0 (0.0%) |
| $800 to $1,499 | 0 (0.0%) | 0 (0.0%) |
| Total | 178 (100.0%) | 0 (0.0%) |
Health & Disability in Casa Blanca
Health Insurance Coverage by Age in Casa Blanca
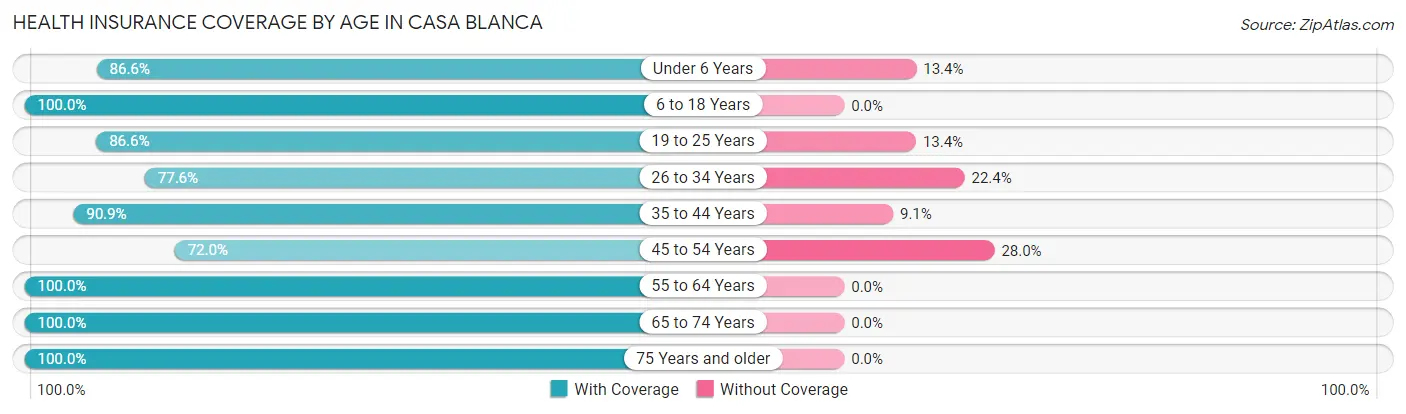
| Age Bracket | With Coverage | Without Coverage |
| Under 6 Years | 58 (86.6%) | 9 (13.4%) |
| 6 to 18 Years | 221 (100.0%) | 0 (0.0%) |
| 19 to 25 Years | 240 (86.6%) | 37 (13.4%) |
| 26 to 34 Years | 83 (77.6%) | 24 (22.4%) |
| 35 to 44 Years | 80 (90.9%) | 8 (9.1%) |
| 45 to 54 Years | 126 (72.0%) | 49 (28.0%) |
| 55 to 64 Years | 120 (100.0%) | 0 (0.0%) |
| 65 to 74 Years | 57 (100.0%) | 0 (0.0%) |
| 75 Years and older | 25 (100.0%) | 0 (0.0%) |
| Total | 1,010 (88.8%) | 127 (11.2%) |
Health Insurance Coverage by Citizenship Status in Casa Blanca
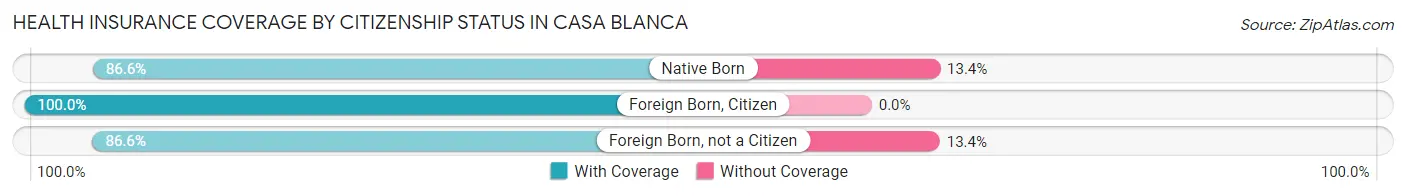
| Citizenship Status | With Coverage | Without Coverage |
| Native Born | 58 (86.6%) | 9 (13.4%) |
| Foreign Born, Citizen | 221 (100.0%) | 0 (0.0%) |
| Foreign Born, not a Citizen | 240 (86.6%) | 37 (13.4%) |
Health Insurance Coverage by Household Income in Casa Blanca
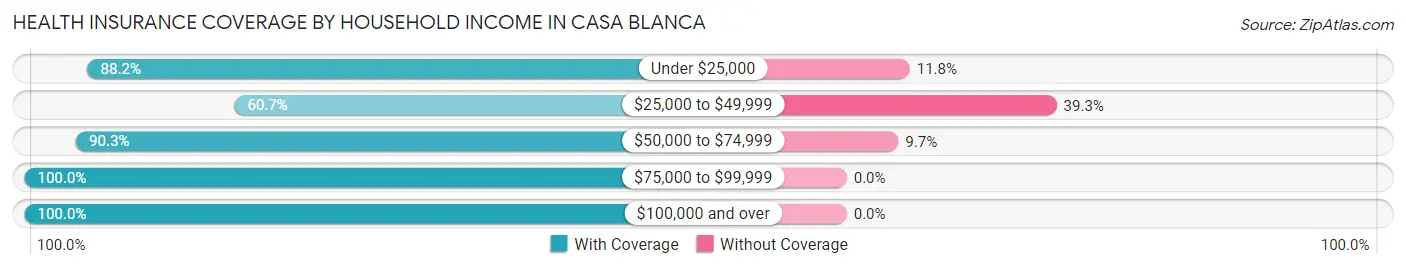
| Household Income | With Coverage | Without Coverage |
| Under $25,000 | 321 (88.2%) | 43 (11.8%) |
| $25,000 to $49,999 | 71 (60.7%) | 46 (39.3%) |
| $50,000 to $74,999 | 355 (90.3%) | 38 (9.7%) |
| $75,000 to $99,999 | 48 (100.0%) | 0 (0.0%) |
| $100,000 and over | 215 (100.0%) | 0 (0.0%) |
Public vs Private Health Insurance Coverage by Age in Casa Blanca
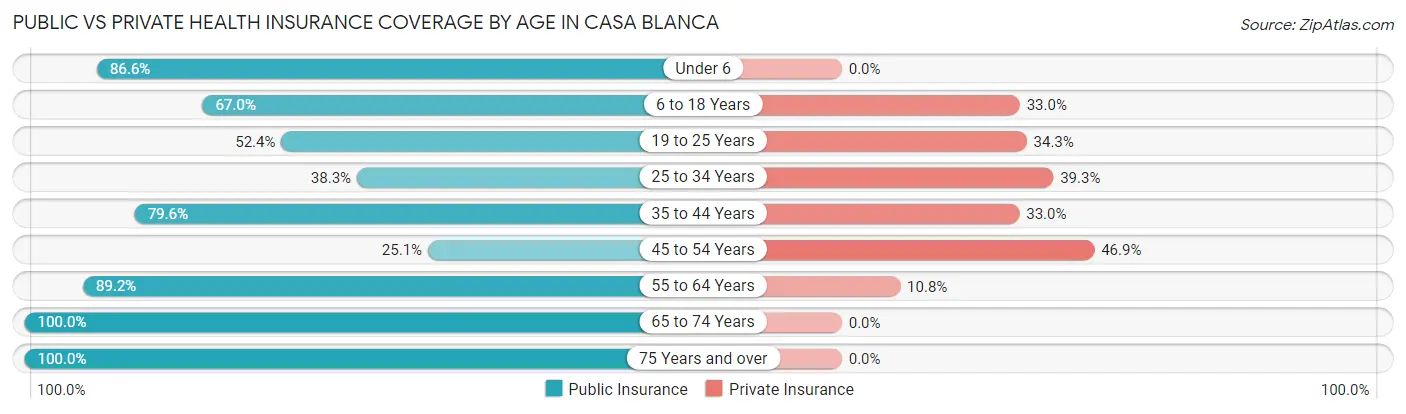
| Age Bracket | Public Insurance | Private Insurance |
| Under 6 | 58 (86.6%) | 0 (0.0%) |
| 6 to 18 Years | 148 (67.0%) | 73 (33.0%) |
| 19 to 25 Years | 145 (52.3%) | 95 (34.3%) |
| 25 to 34 Years | 41 (38.3%) | 42 (39.3%) |
| 35 to 44 Years | 70 (79.5%) | 29 (33.0%) |
| 45 to 54 Years | 44 (25.1%) | 82 (46.9%) |
| 55 to 64 Years | 107 (89.2%) | 13 (10.8%) |
| 65 to 74 Years | 57 (100.0%) | 0 (0.0%) |
| 75 Years and over | 25 (100.0%) | 0 (0.0%) |
| Total | 695 (61.1%) | 334 (29.4%) |
Disability Status by Sex by Age in Casa Blanca
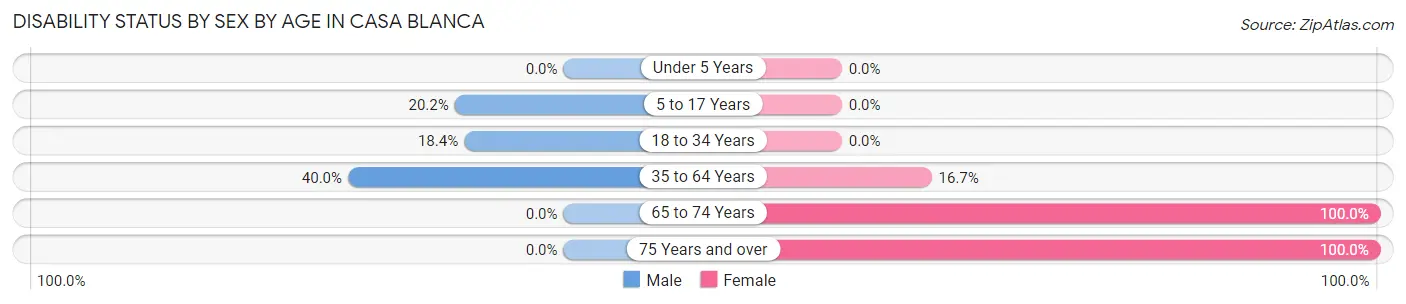
| Age Bracket | Male | Female |
| Under 5 Years | 0 (0.0%) | 0 (0.0%) |
| 5 to 17 Years | 20 (20.2%) | 0 (0.0%) |
| 18 to 34 Years | 45 (18.4%) | 0 (0.0%) |
| 35 to 64 Years | 74 (40.0%) | 33 (16.7%) |
| 65 to 74 Years | 0 (0.0%) | 57 (100.0%) |
| 75 Years and over | 0 (0.0%) | 25 (100.0%) |
Disability Class by Sex by Age in Casa Blanca
Disability Class: Hearing Difficulty
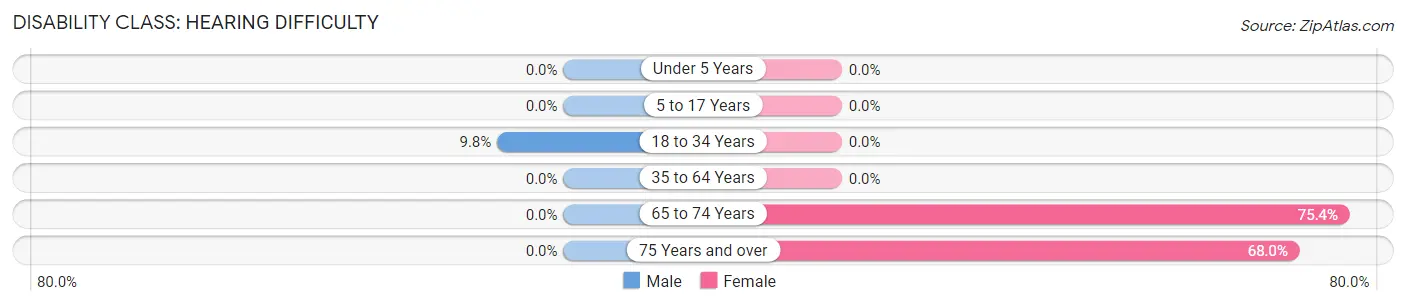
| Age Bracket | Male | Female |
| Under 5 Years | 0 (0.0%) | 0 (0.0%) |
| 5 to 17 Years | 0 (0.0%) | 0 (0.0%) |
| 18 to 34 Years | 24 (9.8%) | 0 (0.0%) |
| 35 to 64 Years | 0 (0.0%) | 0 (0.0%) |
| 65 to 74 Years | 0 (0.0%) | 43 (75.4%) |
| 75 Years and over | 0 (0.0%) | 17 (68.0%) |
Disability Class: Vision Difficulty
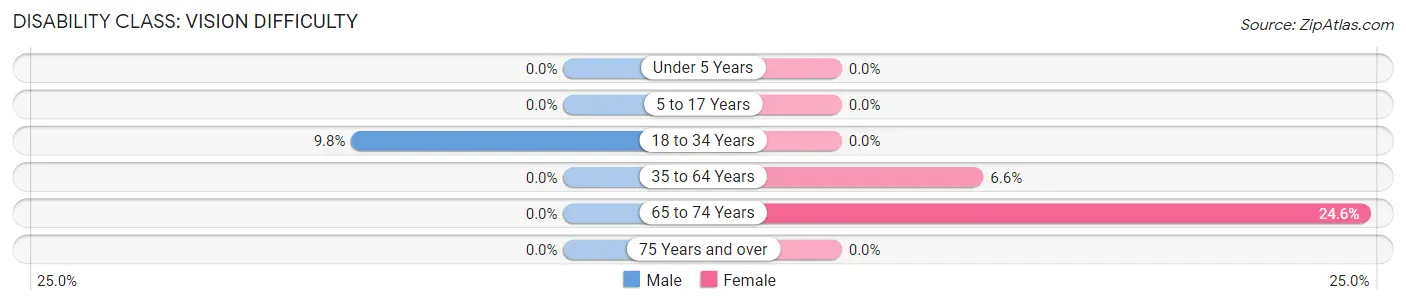
| Age Bracket | Male | Female |
| Under 5 Years | 0 (0.0%) | 0 (0.0%) |
| 5 to 17 Years | 0 (0.0%) | 0 (0.0%) |
| 18 to 34 Years | 24 (9.8%) | 0 (0.0%) |
| 35 to 64 Years | 0 (0.0%) | 13 (6.6%) |
| 65 to 74 Years | 0 (0.0%) | 14 (24.6%) |
| 75 Years and over | 0 (0.0%) | 0 (0.0%) |
Disability Class: Cognitive Difficulty
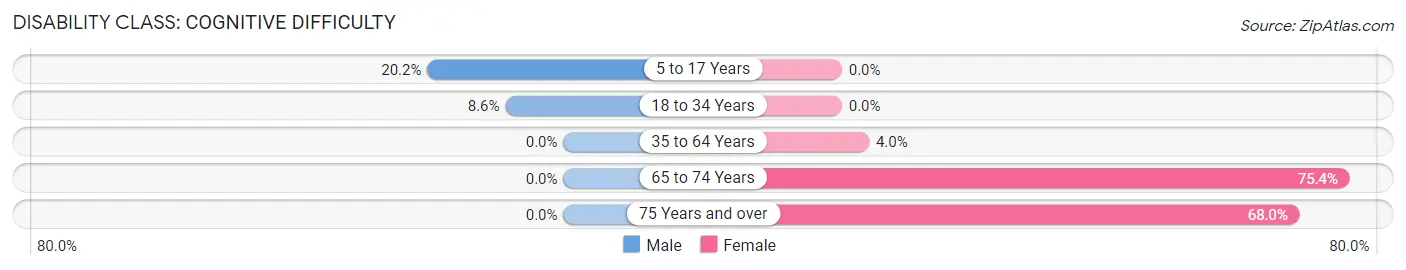
| Age Bracket | Male | Female |
| 5 to 17 Years | 20 (20.2%) | 0 (0.0%) |
| 18 to 34 Years | 21 (8.6%) | 0 (0.0%) |
| 35 to 64 Years | 0 (0.0%) | 8 (4.0%) |
| 65 to 74 Years | 0 (0.0%) | 43 (75.4%) |
| 75 Years and over | 0 (0.0%) | 17 (68.0%) |
Disability Class: Ambulatory Difficulty
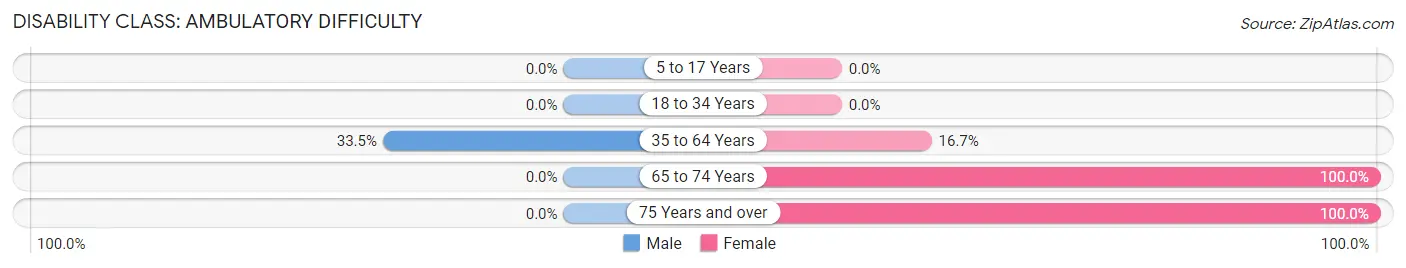
| Age Bracket | Male | Female |
| 5 to 17 Years | 0 (0.0%) | 0 (0.0%) |
| 18 to 34 Years | 0 (0.0%) | 0 (0.0%) |
| 35 to 64 Years | 62 (33.5%) | 33 (16.7%) |
| 65 to 74 Years | 0 (0.0%) | 57 (100.0%) |
| 75 Years and over | 0 (0.0%) | 25 (100.0%) |
Disability Class: Self-Care Difficulty
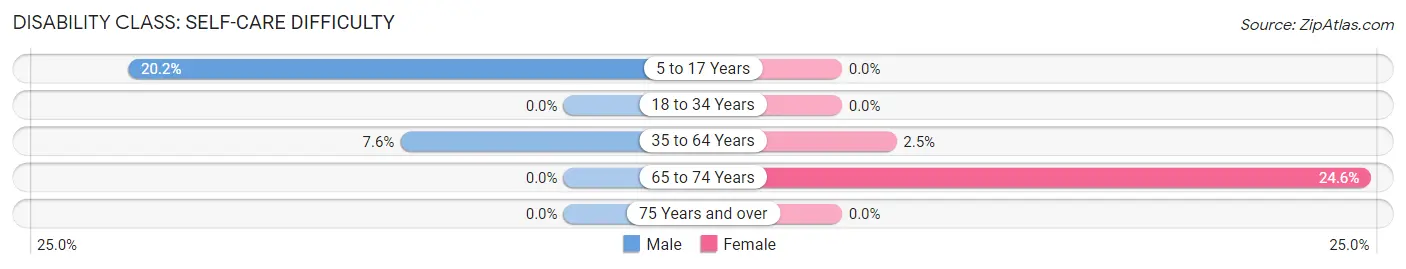
| Age Bracket | Male | Female |
| 5 to 17 Years | 20 (20.2%) | 0 (0.0%) |
| 18 to 34 Years | 0 (0.0%) | 0 (0.0%) |
| 35 to 64 Years | 14 (7.6%) | 5 (2.5%) |
| 65 to 74 Years | 0 (0.0%) | 14 (24.6%) |
| 75 Years and over | 0 (0.0%) | 0 (0.0%) |
Technology Access in Casa Blanca
Computing Device Access in Casa Blanca
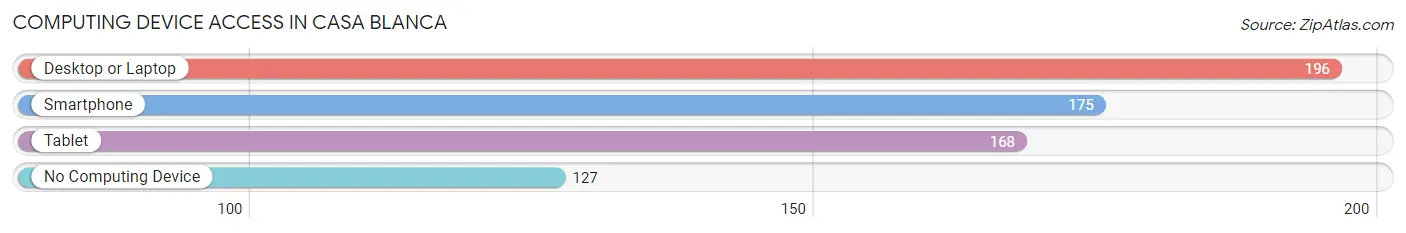
| Device Type | # Households | % Households |
| Desktop or Laptop | 196 | 55.7% |
| Smartphone | 175 | 49.7% |
| Tablet | 168 | 47.7% |
| No Computing Device | 127 | 36.1% |
| Total | 352 | 100.0% |
Internet Access in Casa Blanca
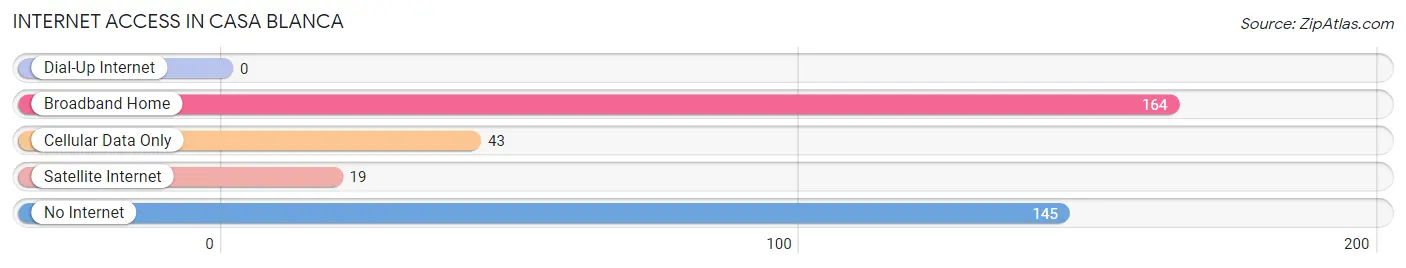
| Internet Type | # Households | % Households |
| Dial-Up Internet | 0 | 0.0% |
| Broadband Home | 164 | 46.6% |
| Cellular Data Only | 43 | 12.2% |
| Satellite Internet | 19 | 5.4% |
| No Internet | 145 | 41.2% |
| Total | 352 | 100.0% |
Casa Blanca Summary
Casa Blanca is a census-designated place (CDP) located in Pinal County, Arizona, United States. It is located about 40 miles south of Phoenix and is part of the Phoenix metropolitan area. As of the 2010 census, the population of Casa Blanca was 1,841.
Geography
Casa Blanca is located at 33°14'25"N 111°37'17"W (33.240278, -111.621389). It is situated at an elevation of 1,717 feet (523 m).
The CDP has a total area of 1 3 square miles 3 4 km2 all of it land
History
Casa Blanca was founded in the late 19th century by Mexican settlers. The name Casa Blanca is Spanish for "White House" and was given to the area by the settlers.
The area was originally part of the San Carlos Apache Indian Reservation, but was opened up to homesteaders in the early 1900s. The first post office was established in Casa Blanca in 1910.
Economy
Casa Blanca is a rural community with a primarily agricultural economy. The main crops grown in the area are cotton, alfalfa, and wheat.
The area also has a small tourism industry, with visitors coming to the area to enjoy the nearby San Carlos Apache Indian Reservation and the nearby Casa Blanca Lake.
Demographics
As of the 2010 census, there were 1,841 people, 590 households, and 463 families residing in the CDP. The population density was 1,417.3 people per square mile (546.7/km2). There were 645 housing units at an average density of 495.4 per square mile (191.3/km2).
The racial makeup of the CDP was 68.2% White, 0.2% African American, 0.9% Native American, 0.2% Asian, 0.1% Pacific Islander, 28.2% from other races, and 2.3% from two or more races. Hispanic or Latino of any race were 57.2% of the population.
There were 590 households, out of which 41.7% had children under the age of 18 living with them, 57.6% were married couples living together, 12.7% had a female householder with no husband present, and 22.7% were non-families. 17.6% of all households were made up of individuals, and 6.1% had someone living alone who was 65 years of age or older. The average household size was 3.11 and the average family size was 3.51.
In the CDP, the population was spread out, with 32.2% under the age of 18, 9.2% from 18 to 24, 25.2% from 25 to 44, 22.7% from 45 to 64, and 10.7% who were 65 years of age or older. The median age was 32 years. For every 100 females, there were 97.2 males. For every 100 females age 18 and over, there were 94.2 males.
The median income for a household in the CDP was $30,938, and the median income for a family was $32,917. Males had a median income of $25,000 versus $20,000 for females. The per capita income for the CDP was $11,845. About 17.2% of families and 20.2% of the population were below the poverty line, including 28.2% of those under age 18 and 10.3% of those age 65 or over.
Common Questions
What is Per Capita Income in Casa Blanca?
Per Capita income in Casa Blanca is $15,481.
What is the Median Family Income in Casa Blanca?
Median Family Income in Casa Blanca is $27,955.
What is the Median Household income in Casa Blanca?
Median Household Income in Casa Blanca is $33,372.
What is Inequality or Gini Index in Casa Blanca?
Inequality or Gini Index in Casa Blanca is 0.53.
What is the Total Population of Casa Blanca?
Total Population of Casa Blanca is 1,137.
What is the Total Male Population of Casa Blanca?
Total Male Population of Casa Blanca is 571.
What is the Total Female Population of Casa Blanca?
Total Female Population of Casa Blanca is 566.
What is the Ratio of Males per 100 Females in Casa Blanca?
There are 100.88 Males per 100 Females in Casa Blanca.
What is the Ratio of Females per 100 Males in Casa Blanca?
There are 99.12 Females per 100 Males in Casa Blanca.
What is the Median Population Age in Casa Blanca?
Median Population Age in Casa Blanca is 27.1 Years.
What is the Average Family Size in Casa Blanca
Average Family Size in Casa Blanca is 3.8 People.
What is the Average Household Size in Casa Blanca
Average Household Size in Casa Blanca is 3.2 People.
How Large is the Labor Force in Casa Blanca?
There are 407 People in the Labor Forcein in Casa Blanca.
What is the Percentage of People in the Labor Force in Casa Blanca?
45.4% of People are in the Labor Force in Casa Blanca.
What is the Unemployment Rate in Casa Blanca?
Unemployment Rate in Casa Blanca is 8.6%.