Zip Codes with the Highest Percentage of Population Employed in Food Preparation & Serving in Phoenix, AZ
RELATED REPORTS & OPTIONS
Food Preparation & Serving
Phoenix
Compare Zip Codes
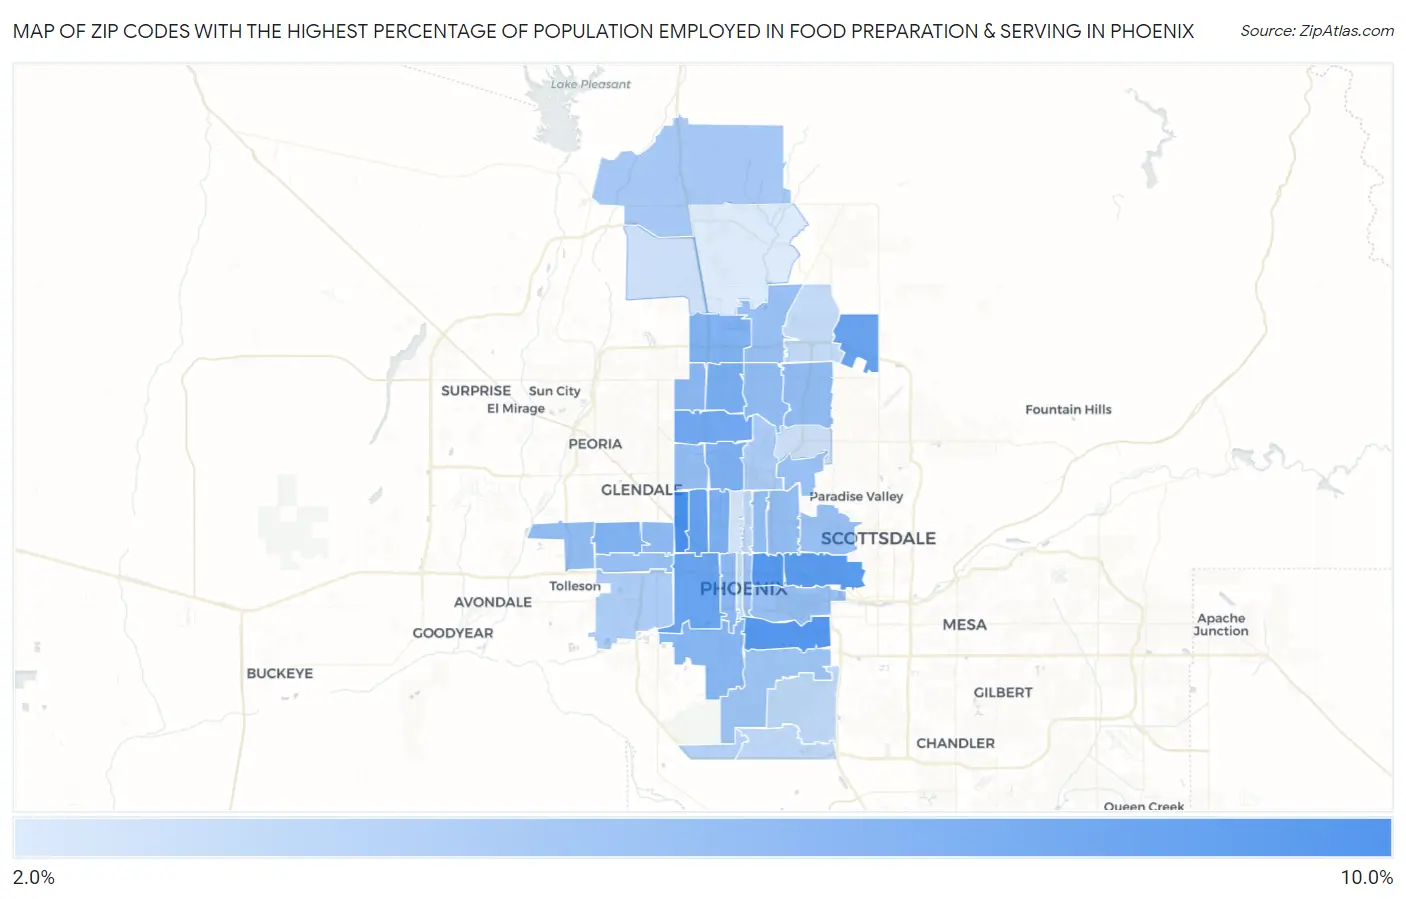
Map of Zip Codes with the Highest Percentage of Population Employed in Food Preparation & Serving in Phoenix
2.2%
9.8%
Zip Codes with the Highest Percentage of Population Employed in Food Preparation & Serving in Phoenix, AZ
| Zip Code | % Employed | vs State | vs National | |
| 1. | 85019 | 9.8% | 5.7%(+4.08)#53 | 5.3%(+4.46)#2,844 |
| 2. | 85040 | 9.1% | 5.7%(+3.41)#64 | 5.3%(+3.79)#3,447 |
| 3. | 85006 | 9.0% | 5.7%(+3.31)#66 | 5.3%(+3.69)#3,551 |
| 4. | 85008 | 8.9% | 5.7%(+3.20)#69 | 5.3%(+3.58)#3,650 |
| 5. | 85017 | 8.2% | 5.7%(+2.54)#78 | 5.3%(+2.92)#4,427 |
| 6. | 85054 | 8.0% | 5.7%(+2.38)#81 | 5.3%(+2.76)#4,658 |
| 7. | 85009 | 7.9% | 5.7%(+2.27)#83 | 5.3%(+2.65)#4,838 |
| 8. | 85029 | 7.5% | 5.7%(+1.87)#86 | 5.3%(+2.25)#5,485 |
| 9. | 85023 | 7.2% | 5.7%(+1.58)#93 | 5.3%(+1.96)#6,043 |
| 10. | 85015 | 7.0% | 5.7%(+1.36)#104 | 5.3%(+1.74)#6,494 |
| 11. | 85021 | 6.9% | 5.7%(+1.25)#108 | 5.3%(+1.63)#6,770 |
| 12. | 85027 | 6.8% | 5.7%(+1.10)#113 | 5.3%(+1.49)#7,132 |
| 13. | 85033 | 6.7% | 5.7%(+1.07)#114 | 5.3%(+1.45)#7,241 |
| 14. | 85041 | 6.4% | 5.7%(+0.769)#129 | 5.3%(+1.15)#8,044 |
| 15. | 85053 | 6.4% | 5.7%(+0.683)#132 | 5.3%(+1.06)#8,278 |
| 16. | 85007 | 6.3% | 5.7%(+0.648)#135 | 5.3%(+1.03)#8,388 |
| 17. | 85031 | 6.0% | 5.7%(+0.359)#152 | 5.3%(+0.740)#9,252 |
| 18. | 85037 | 5.9% | 5.7%(+0.276)#155 | 5.3%(+0.658)#9,529 |
| 19. | 85032 | 5.9% | 5.7%(+0.272)#157 | 5.3%(+0.653)#9,544 |
| 20. | 85022 | 5.9% | 5.7%(+0.239)#158 | 5.3%(+0.621)#9,657 |
| 21. | 85051 | 5.9% | 5.7%(+0.214)#160 | 5.3%(+0.595)#9,753 |
| 22. | 85016 | 5.9% | 5.7%(+0.188)#162 | 5.3%(+0.569)#9,845 |
| 23. | 85014 | 5.8% | 5.7%(+0.155)#164 | 5.3%(+0.537)#9,958 |
| 24. | 85024 | 5.6% | 5.7%(-0.026)#173 | 5.3%(+0.355)#10,554 |
| 25. | 85035 | 5.6% | 5.7%(-0.034)#174 | 5.3%(+0.348)#10,581 |
| 26. | 85018 | 5.6% | 5.7%(-0.116)#177 | 5.3%(+0.265)#10,888 |
| 27. | 85034 | 5.5% | 5.7%(-0.121)#178 | 5.3%(+0.261)#10,908 |
| 28. | 85004 | 5.5% | 5.7%(-0.182)#181 | 5.3%(+0.199)#11,114 |
| 29. | 85042 | 5.3% | 5.7%(-0.404)#187 | 5.3%(-0.022)#11,883 |
| 30. | 85086 | 4.9% | 5.7%(-0.774)#201 | 5.3%(-0.393)#13,387 |
| 31. | 85020 | 4.7% | 5.7%(-1.01)#214 | 5.3%(-0.625)#14,324 |
| 32. | 85043 | 4.6% | 5.7%(-1.07)#219 | 5.3%(-0.688)#14,608 |
| 33. | 85045 | 4.1% | 5.7%(-1.58)#243 | 5.3%(-1.20)#16,755 |
| 34. | 85012 | 3.8% | 5.7%(-1.87)#255 | 5.3%(-1.49)#17,947 |
| 35. | 85044 | 3.7% | 5.7%(-2.00)#259 | 5.3%(-1.62)#18,492 |
| 36. | 85048 | 3.6% | 5.7%(-2.03)#261 | 5.3%(-1.65)#18,614 |
| 37. | 85050 | 3.4% | 5.7%(-2.25)#278 | 5.3%(-1.87)#19,549 |
| 38. | 85003 | 3.4% | 5.7%(-2.29)#282 | 5.3%(-1.91)#19,703 |
| 39. | 85028 | 3.0% | 5.7%(-2.67)#295 | 5.3%(-2.29)#21,270 |
| 40. | 85083 | 3.0% | 5.7%(-2.69)#296 | 5.3%(-2.31)#21,334 |
| 41. | 85013 | 2.5% | 5.7%(-3.21)#319 | 5.3%(-2.83)#23,279 |
| 42. | 85085 | 2.2% | 5.7%(-3.50)#325 | 5.3%(-3.12)#24,219 |
1
Common Questions
What are the Top 10 Zip Codes with the Highest Percentage of Population Employed in Food Preparation & Serving in Phoenix, AZ?
Top 10 Zip Codes with the Highest Percentage of Population Employed in Food Preparation & Serving in Phoenix, AZ are:
What zip code has the Highest Percentage of Population Employed in Food Preparation & Serving in Phoenix, AZ?
85019 has the Highest Percentage of Population Employed in Food Preparation & Serving in Phoenix, AZ with 9.8%.
What is the Percentage of Population Employed in Food Preparation & Serving in Phoenix, AZ?
Percentage of Population Employed in Food Preparation & Serving in Phoenix is 5.8%.
What is the Percentage of Population Employed in Food Preparation & Serving in Arizona?
Percentage of Population Employed in Food Preparation & Serving in Arizona is 5.7%.
What is the Percentage of Population Employed in Food Preparation & Serving in the United States?
Percentage of Population Employed in Food Preparation & Serving in the United States is 5.3%.